Embed Size (px)
Citation preview
Defining Catastrophic Costs and Comparing TheirImportance for Adverse Tuberculosis Outcome withMulti-Drug Resistance: A Prospective Cohort Study, PeruTom Wingfield1,2,3,4*, Delia Boccia2,5, Marco Tovar1,2, Arquımedes Gavino2, Karine Zevallos1,2,6,
Rosario Montoya1,2, Knut Lonnroth7, Carlton A. Evans2,3,6
1 Innovacion Por la Salud Y Desarrollo (IPSYD), Asociacion Benefica PRISMA, Lima, Peru, 2 Innovation For Health And Development (IFHAD), London, United Kingdom,
3 Infectious Diseases & Immunity, Imperial College London, and Wellcome Trust Imperial College Centre for Global Health Research, London, United Kingdom, 4 The
Monsall Infectious Diseases Unit, North Manchester General Hospital, Manchester, United Kingdom, 5 Department of Infectious Disease Epidemiology, London School of
Hygiene & Tropical Medicine, London, United Kingdom, 6 Laboratorio de Investigacion y Desarrollo, Universidad Peruana Cayetano Heredia, Lima, Peru, 7 Policy Strategy
and Innovations, Stop TB Department, World Health Organization, Geneva, Switzerland
Abstract
Background: Even when tuberculosis (TB) treatment is free, hidden costs incurred by patients and their households (TB-affected households) may worsen poverty and health. Extreme TB-associated costs have been termed ‘‘catastrophic’’ but arepoorly defined. We studied TB-affected households’ hidden costs and their association with adverse TB outcome to create aclinically relevant definition of catastrophic costs.
Methods and Findings: From 26 October 2002 to 30 November 2009, TB patients (n = 876, 11% with multi-drug-resistant[MDR] TB) and healthy controls (n = 487) were recruited to a prospective cohort study in shantytowns in Lima, Peru. Patientswere interviewed prior to and every 2–4 wk throughout treatment, recording direct (household expenses) and indirect (lostincome) TB-related costs. Costs were expressed as a proportion of the household’s annual income. In poorer households,costs were lower but constituted a higher proportion of the household’s annual income: 27% (95% CI = 20%–43%) in theleast-poor houses versus 48% (95% CI = 36%–50%) in the poorest. Adverse TB outcome was defined as death, treatmentabandonment or treatment failure during therapy, or recurrence within 2 y. 23% (166/725) of patients with a definedtreatment outcome had an adverse outcome. Total costs $20% of household annual income was defined as catastrophicbecause this threshold was most strongly associated with adverse TB outcome. Catastrophic costs were incurred by 345households (39%). Having MDR TB was associated with a higher likelihood of incurring catastrophic costs (54% [95%CI = 43%–61%] versus 38% [95% CI = 34%–41%], p,0.003). Adverse outcome was independently associated with MDR TB(odds ratio [OR] = 8.4 [95% CI = 4.7–15], p,0.001), previous TB (OR = 2.1 [95% CI = 1.3–3.5], p = 0.005), days too unwell towork pre-treatment (OR = 1.01 [95% CI = 1.00–1.01], p = 0.02), and catastrophic costs (OR = 1.7 [95% CI = 1.1–2.6], p = 0.01).The adjusted population attributable fraction of adverse outcomes explained by catastrophic costs was 18% (95%CI = 6.9%–28%), similar to that of MDR TB (20% [95% CI = 14%–25%]). Sensitivity analyses demonstrated that existingcatastrophic costs thresholds ($10% or $15% of household annual income) were not associated with adverse outcome inour setting. Study limitations included not measuring certain ‘‘dis-saving’’ variables (including selling household items) andgathering only 6 mo of costs-specific follow-up data for MDR TB patients.
Conclusions: Despite free TB care, having TB disease was expensive for impoverished TB patients in Peru. Incurring higherrelative costs was associated with adverse TB outcome. The population attributable fraction indicated that catastrophiccosts and MDR TB were associated with similar proportions of adverse outcomes. Thus TB is a socioeconomic as well asinfectious problem, and TB control interventions should address both the economic and clinical aspects of this disease.
Please see later in the article for the Editors’ Summary.
Citation: Wingfield T, Boccia D, Tovar M, Gavino A, Zevallos K, et al. (2014) Defining Catastrophic Costs and Comparing Their Importance for Adverse TuberculosisOutcome with Multi-Drug Resistance: A Prospective Cohort Study, Peru. PLoS Med 11(7): e1001675. doi:10.1371/journal.pmed.1001675
Academic Editor: Jennifer Prah Ruger, Perelman School of Medicine at the University of Pennsylvania, United States of America
Received October 2, 2013; Accepted June 5, 2014; Published July 15, 2014
Copyright: � 2014 Wingfield et al. This is an open-access article distributed under the terms of the Creative Commons Attribution License, which permitsunrestricted use, distribution, and reproduction in any medium, provided the original author and source are credited.
Funding: The Wellcome Trust, IFHAD, and the Joint Global Health Trials Consortium. TW was also supported by the British Infection Association with a researchproject primer grant. The funders had no role in study design, data collection and analysis, decision to publish, or preparation of the manuscript.
Competing Interests: CAE is a member of the Editorial Board of PLOS Medicine. All other authors have declared that no competing interests exist.
Abbreviations: BMI, body mass index; MDR, multi-drug-resistant; OR, odds ratio; PEN, Peruvian Soles; TB, tuberculosis.
* Email: [email protected]
PLOS Medicine | www.plosmedicine.org 1 July 2014 | Volume 11 | Issue 7 | e1001675
Introduction
Tuberculosis (TB) disease kills 1.4 million per year and remains
a major global health problem [1]. Many low- and middle-income
countries are unlikely to meet the Millennium Development Goals
for reduction of TB disease prevalence and mortality [1]. This is
due in part to poorer people experiencing inequitable healthcare
provision and access [2] and suffering a disproportionate burden
of morbidity and mortality from TB disease [3,4].
Poverty increases TB risk [5], and TB exacerbates poverty,
affecting the most economically productive age group [6–8].
Whilst many countries aim to offer ‘‘free’’ TB treatment to their
patients, this free treatment may cover only some diagnostic tests
and anti-mycobacterial medications. Patients and their households
may incur hidden costs, be they direct ‘‘out of pocket’’ expenses
such as for transport, symptom-relieving medicines, or additional
food, or indirect expenses associated with lost income [8–12].
In its post-2015 Global Strategy and Targets for Tuberculosis
Prevention, Care, and Control at the 67th World Health Assembly
in May 2014, the World Health Organization adopted a target of
eradicating catastrophic costs for TB-affected families by 2035
[13]. However, hidden TB-related costs remain understudied, and
consensus about defining catastrophic costs is awaited [5,13–16].
Some catastrophic costs definitions have incorporated symptoms
of financial shock and coping mechanisms [17,18]. Others have
used operational thresholds of total costs of 10%–25% of a
household’s annual income [16,19,20] or 40% or more of a
household’s ‘‘capacity to pay’’ [21,22]. Recently, concerns have
been raised that the current approach of measuring catastrophic
costs using out-of-pocket payments is too narrow because it
overlooks lost income and consequently risks misinforming policy-
makers [23,24]. Thus, there is an urgent need to improve
indicators of financial risk to better inform health policy guidance
[23–25]. However, although there is broad agreement that some
vulnerable TB-affected households will require social protection
(such as socioeconomic support) to avoid catastrophic costs, more
evidence is needed to define such costs and characterise their
importance [9,14,21–28].
We prospectively quantified changes in income and hidden
costs prior to and throughout treatment of patients with multi-
drug-resistant (MDR) and non-MDR TB in impoverished
shantytowns surrounding Lima, Peru. The aims of the study were
to better characterise TB-related costs and their association with
adverse TB outcome, and to contribute to an evidence-based
definition of catastrophic costs that is both clinically and financially
relevant. The study hypothesis was that catastrophic costs of TB-
affected households are independently associated with adverse TB
outcome in TB patients.
Methods
Ethical ApprovalThe internationally accredited ethical committee of the
Universidad Peruana Cayetano Heredia approved the project.
All interviewed participants gave written informed consent.
Study Design and ParticipantsWe conducted a prospective cohort study of TB patients and a
baseline case-control study comparing them with healthy controls.
From 26 October 2002 to 30 November 2009, in collaboration
with the Peruvian National Tuberculosis Control Program, all
consecutive patients with laboratory-proven pulmonary TB were
invited to participate in the study. All interactions between the
research team and the participants occurred during household
visits. Until 30 November 2012, patients were followed-up for
recurrent TB by monitoring TB treatment records and revisiting
each household approximately every 3 y to enquire about TB
diagnoses. From 21 December 2006 to 9 December 2007, control
households were selected from an up-to-date satellite map using
random number tables and were invited to participate during a
household visit. In the case that all potential control participants in
the household were unavailable or declined then the nearest
neighbouring household was instead invited to participate.
Controls were not matched to cases because the study aimed to
characterise the effect of relevant exposures including sex, age, and
socioeconomic position on the outcome variables of catastrophic
costs and adverse TB outcome. The inclusion criterion in both
cases and controls was age more than 15 y. Exclusion criteria
included declining or being unable to give informed written
consent. Both for the cohort and the baseline case-control study,
the sample size was opportunistic, and consequently no power
calculations were performed.
Study SettingThe study was conducted in Ventanilla, 16 peri-urban
contiguous shantytowns in north Lima, Peru, with an estimated
population of 277,895 people and frequent poverty (32% of
inhabitants live on #US$1 per day). During the study period, the
annual TB notification rate in Ventanilla was 162 new cases per
100,000 people per year, higher than the rest of the country, at
106 per 100,000 people annually [29].
TB was treated by the National Tuberculosis Control Program
in community health posts where sputum smear was offered free of
charge to all patients, and chest radiographs to selected patients.
TB patients received their anti-TB directly observed therapy
(DOT) free of charge at their local health post, administered by the
national TB program.
VariablesOperational definitions of the key study variables (TB disease,
TB treatment phases, TB adverse outcome, and TB costs) are
summarised in Box 1.
Patients were defined as having MDR TB if they were initially
prescribed an MDR TB treatment regimen or sputum testing was
positive for MDR TB by the microscopic-observation drug-
susceptibility (MODS) assay or the proportions assay. All other
patients recruited to the study were defined as having non-MDR
TB.
For both patients with MDR and patients with non-MDR TB,
stages of treatment were operationally defined as follows: ‘‘pre-
treatment’’ was from self-reported onset of TB-related symptoms
until treatment initiation; ‘‘intensive treatment phase’’ was the first
2 mo of TB treatment; ‘‘continuation treatment phase’’ was the
4 mo immediately following the ‘‘intensive treatment phase’’;
‘‘during treatment’’ was the period of time from the start of the
‘‘intensive treatment phase’’ to the end of the ‘‘continuation
treatment phase’’; and ‘‘entire illness’’ was the period of time from
TB-related symptom onset to the end of the ‘‘continuation
treatment phase’’.
Early TB treatment outcome for each patient was assessed by
the national TB program at the time of treatment cessation and
was not influenced by this research. These early TB treatment
outcome assessments were based on sputum microscopy results
that are insensitive to treatment failure [30–32]. Therefore, we
also collaborated with the national TB program in continuous
surveillance of national TB program treatment records and
Catastrophic TB Costs Are Associated with Adverse TB Outcome in Peru
PLOS Medicine | www.plosmedicine.org 2 July 2014 | Volume 11 | Issue 7 | e1001675
revisited each patient in their home to check for TB recurrence,
which we defined as TB retreatment within 30 mo from the date
that treatment started (in most cases 2 y from treatment cessation).
We defined good TB outcome as cure without recurrence. We
defined adverse TB outcome as death during treatment, treatment
abandonment, treatment failure, or recurrence. Patients who were
transferred by the national TB program to another health post
outside of the study site or were lost to follow-up were considered
to have undefined outcome.
Data Source and MeasurementA questionnaire was developed locally, piloted, refined, and then
used to interview patients and collect socio-demographic data
concerning household income and expenses throughout TB illness
(Questionnaire S1). Interviews were conducted at baseline with both
TB patients and controls. For patients, this baseline interview
occurred prior to or at the time that treatment commenced. The
baseline interview (but not subsequent interviews) included detailed
assessment of household assets ownership, access to basic services,
and education level. Patients were subsequently interviewed after 2,
4, 6, 8, 12, 16, 20, and 24 wk of treatment. At the baseline and all
subsequent interviews, questions characterised earnings, income,
expenses, employment (paid or unpaid), number of days unable to
work due to illness, additional household food expenditure due to
TB illness, and crowding. Household debts were assessed at
recruitment and subsequently at 24 wk of treatment.
As in previous research, TB-related costs were categorised as
‘‘direct expenses’’ [6,9,30,33] and ‘‘lost income’’ [6,33,34] incurred
since the previous interview. All costs and incomes were quantified in
cash amounts in Peruvian Soles (PEN) (US$1 on average equivalent
to 2.9 PEN during the study period). Inflation and especially
exchange rates varied considerably during the study period, so actual
costs were reported without adjustments in order to be more
informative to users including policy-makers. Table S6 shows annual
inflation in Peru and average annual exchange rates for 2002–2009.
To further facilitate interpretation internationally, costs were also
expressed as the proportion of the average monthly income of all
patient households in the cohort (termed ‘‘monthly incomes’’). Also,
to assess impact on the patient households, costs were calculated as
the proportion of the same household’s annual income.
‘‘Direct (out-of-pocket) expenses’’ included direct medical
expenses (medical examinations and prescribed medicines) and
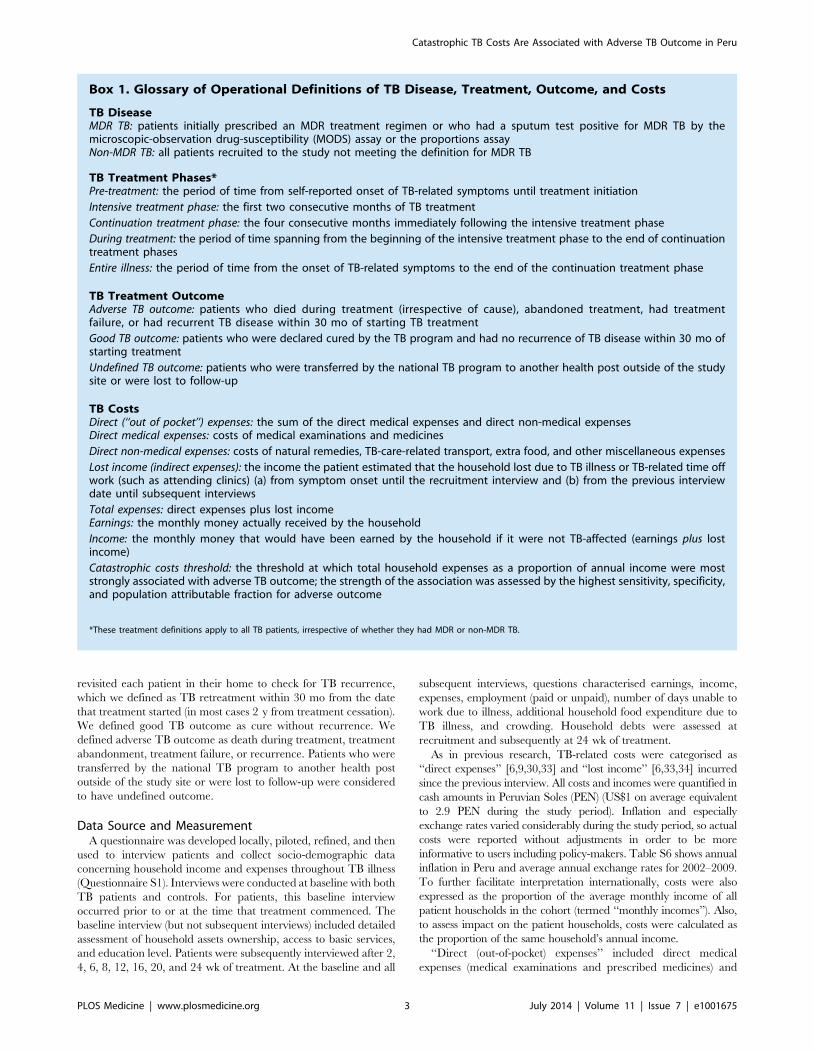
Box 1. Glossary of Operational Definitions of TB Disease, Treatment, Outcome, and Costs
TB DiseaseMDR TB: patients initially prescribed an MDR treatment regimen or who had a sputum test positive for MDR TB by themicroscopic-observation drug-susceptibility (MODS) assay or the proportions assayNon-MDR TB: all patients recruited to the study not meeting the definition for MDR TB
TB Treatment Phases*Pre-treatment: the period of time from self-reported onset of TB-related symptoms until treatment initiation
Intensive treatment phase: the first two consecutive months of TB treatment
Continuation treatment phase: the four consecutive months immediately following the intensive treatment phase
During treatment: the period of time spanning from the beginning of the intensive treatment phase to the end of continuationtreatment phases
Entire illness: the period of time from the onset of TB-related symptoms to the end of the continuation treatment phase
TB Treatment OutcomeAdverse TB outcome: patients who died during treatment (irrespective of cause), abandoned treatment, had treatmentfailure, or had recurrent TB disease within 30 mo of starting TB treatment
Good TB outcome: patients who were declared cured by the TB program and had no recurrence of TB disease within 30 mo ofstarting treatment
Undefined TB outcome: patients who were transferred by the national TB program to another health post outside of the studysite or were lost to follow-up
TB CostsDirect (‘‘out of pocket’’) expenses: the sum of the direct medical expenses and direct non-medical expensesDirect medical expenses: costs of medical examinations and medicines
Direct non-medical expenses: costs of natural remedies, TB-care-related transport, extra food, and other miscellaneous expenses
Lost income (indirect expenses): the income the patient estimated that the household lost due to TB illness or TB-related time offwork (such as attending clinics) (a) from symptom onset until the recruitment interview and (b) from the previous interviewdate until subsequent interviews
Total expenses: direct expenses plus lost incomeEarnings: the monthly money actually received by the household
Income: the monthly money that would have been earned by the household if it were not TB-affected (earnings plus lostincome)
Catastrophic costs threshold: the threshold at which total household expenses as a proportion of annual income were moststrongly associated with adverse TB outcome; the strength of the association was assessed by the highest sensitivity, specificity,and population attributable fraction for adverse outcome
*These treatment definitions apply to all TB patients, irrespective of whether they had MDR or non-MDR TB.
Catastrophic TB Costs Are Associated with Adverse TB Outcome in Peru
PLOS Medicine | www.plosmedicine.org 3 July 2014 | Volume 11 | Issue 7 | e1001675

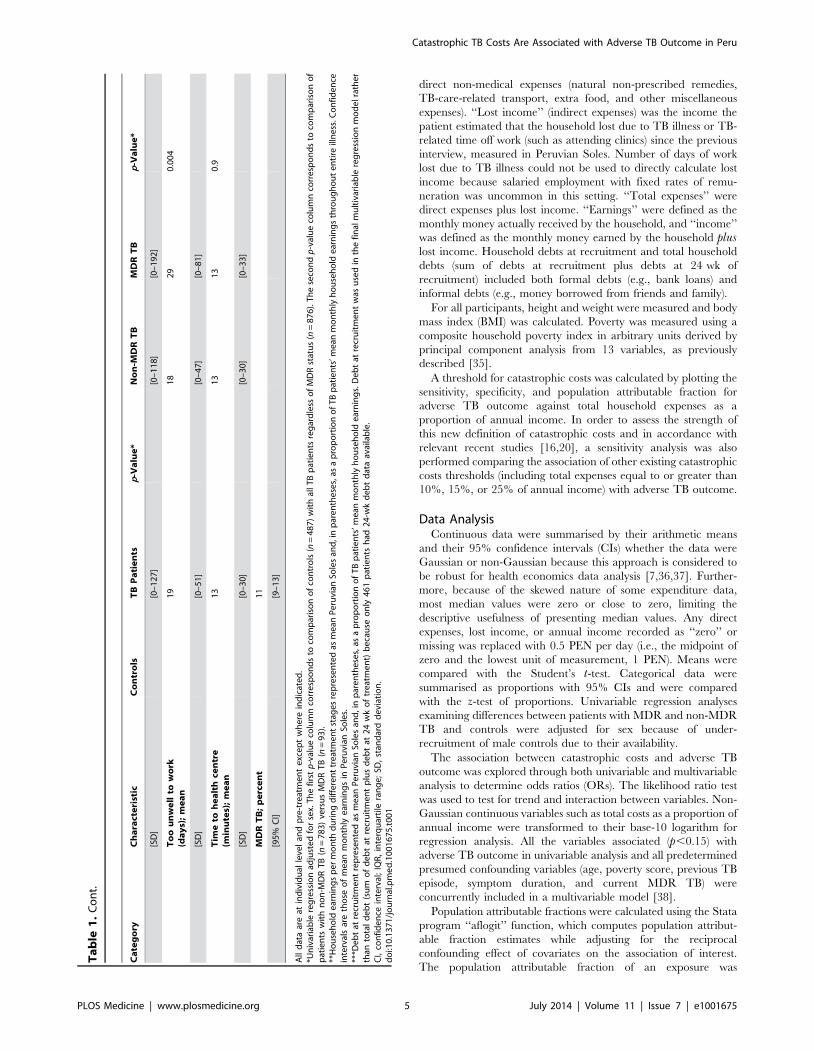
Ta
ble
1.
Stu
dy
po
pu
lati
on
bas
elin
ed
ata.
Ca
teg
ory
Ch
ara
cte
rist
icC
on
tro
lsT
BP
ati
en
tsp
-Va
lue
*N
on
-MD
RT
BM
DR
TB
p-V
alu
e*
To
tal
pa
rtic
ipa
nts
48
78
76
78
39
3
De
mo
gra
ph
ics
Ag
e(y
ea
rs);
me
an
34
31
0.0
01
31
31
0.8
[SD
][3
0–
48
][1
8–
44
][3
0–
32
][1
7–
45
]
Ma
le;
pe
rce
nt
37
59
,0
.00
15
95
90
.9
[95
%C
I][3
3–
41
][5
5–
62
][5
5–
62
][4
9–
69
]
He
alt
ha
nd
fin
an
ces
Co
mp
lete
dse
con
da
rysc
ho
ol;
pe
rce
nt
46
44
0.3
45
36
0.1
[95
%C
I][4
1–
50
][4
1–
47
][4
2–
49
][2
6–
46
]
Ho
use
ho
ldcr
ow
din
ga
bo
ve
me
an
;p
erc
en
t6
65
70
.07
57
61
0.5
[95
%C
I][5
9–
72
][5
4–
61
][5
3–
60
][5
1–
71
]
Pe
op
lep
er
ho
use
;m
ea
n5
.14
.90
.84
.94
.90
.9
[IQ
R]
[4.6
–5
.6]
[4.8
–5
.0]
[4.7
–5
.0]
[4.5
–5
.4]
BM
I(k
g/m
2);
me
an
26
21
,0
.00
12
12
10
.3
[95
%C
I][2
5–
26
][2
1–
22
][2
1–
22
][2
0–
21
]
Pre
vio
us
TB
;p
erc
en
t5
.41
8,
0.0
01
15
40
,0
.00
1
[95
%C
I][3
.3–
7.4
][1
5–
20
][1
3–
18
][3
0–
50
]
Mo
nth
lye
arn
ing
s**
pre
-tre
atm
en
t;m
ea
n6
51
(1.4
0)
51
0(1
.09
),
0.0
01
51
1(1
.09
)4
97
(1.0
7)
0.8
[95
%C
I][5
95
–7
07
][4
81
–5
39
][4
82
–5
40
][3
81
–6
13
]
Mo
nth
lye
arn
ing
s**
du
rin
gtr
ea
tme
nt;
me
an
43
4(0
.93
)4
36
(0.9
4)
41
8(0
.90
)0
.6
[95
%C
I][4
15
–4
53
][4
16
–4
56
][3
41
–4
95
]
Mo
nth
lye
arn
ing
s**
inin
ten
siv
ep
ha
se;
me
an
37
9(0
.81
)3
79
(0.8
1)
37
6(0
.81
)0
.9
[95
%C
I][3
58
–4
00
][3
57
–4
01
][2
95
–4
57
]
Mo
nth
lye
arn
ing
s**
inco
nti
nu
ati
on
ph
ase
;m
ea
n4
54
(0.9
7)
45
7(0
.98
)4
24
(0.9
1)
0.4
[95
%C
I][4
31
–4
77
][4
34
–4
80
][3
39
–5
09
]
De
bt*
**;
me
an
81
2(1
.7)
38
3(0
.82
)0
.00
43
77
(0.8
1)
43
5(0
.93
)0
.7
[95
%C
I][5
07
–1
11
7]
[29
2–
47
4]
[28
3–
47
1]
[87
–8
72
]
No
tin
pa
idw
ork
;p
erc
en
t6
38
1,
0.0
01
80
90
,0
.03
[95
%C
I][5
6–
69
][7
9–
84
][7
7–
83
][8
4–
96
]
Po
ve
rty
sco
rea
bo
ve
con
tro
lm
ea
n;
pe
rce
nt
51
58
,0
.02
58
60
0.8
[95
%C
I][4
7–
56
][5
5–
61
][5
4–
61
][5
0–
70
]
Cu
rre
nt
TB
Sy
mp
tom
du
rati
on
(da
ys)
;m
ea
n5
55
28
3,
0.0
01
Catastrophic TB Costs Are Associated with Adverse TB Outcome in Peru
PLOS Medicine | www.plosmedicine.org 4 July 2014 | Volume 11 | Issue 7 | e1001675
direct non-medical expenses (natural non-prescribed remedies,
TB-care-related transport, extra food, and other miscellaneous
expenses). ‘‘Lost income’’ (indirect expenses) was the income the
patient estimated that the household lost due to TB illness or TB-
related time off work (such as attending clinics) since the previous
interview, measured in Peruvian Soles. Number of days of work
lost due to TB illness could not be used to directly calculate lost
income because salaried employment with fixed rates of remu-
neration was uncommon in this setting. ‘‘Total expenses’’ were
direct expenses plus lost income. ‘‘Earnings’’ were defined as the
monthly money actually received by the household, and ‘‘income’’
was defined as the monthly money earned by the household pluslost income. Household debts at recruitment and total household
debts (sum of debts at recruitment plus debts at 24 wk of
recruitment) included both formal debts (e.g., bank loans) and
informal debts (e.g., money borrowed from friends and family).
For all participants, height and weight were measured and body
mass index (BMI) was calculated. Poverty was measured using a
composite household poverty index in arbitrary units derived by
principal component analysis from 13 variables, as previously
described [35].
A threshold for catastrophic costs was calculated by plotting the
sensitivity, specificity, and population attributable fraction for
adverse TB outcome against total household expenses as a
proportion of annual income. In order to assess the strength of
this new definition of catastrophic costs and in accordance with
relevant recent studies [16,20], a sensitivity analysis was also
performed comparing the association of other existing catastrophic
costs thresholds (including total expenses equal to or greater than
10%, 15%, or 25% of annual income) with adverse TB outcome.
Data AnalysisContinuous data were summarised by their arithmetic means
and their 95% confidence intervals (CIs) whether the data were
Gaussian or non-Gaussian because this approach is considered to
be robust for health economics data analysis [7,36,37]. Further-
more, because of the skewed nature of some expenditure data,
most median values were zero or close to zero, limiting the
descriptive usefulness of presenting median values. Any direct
expenses, lost income, or annual income recorded as ‘‘zero’’ or
missing was replaced with 0.5 PEN per day (i.e., the midpoint of
zero and the lowest unit of measurement, 1 PEN). Means were
compared with the Student’s t-test. Categorical data were
summarised as proportions with 95% CIs and were compared
with the z-test of proportions. Univariable regression analyses
examining differences between patients with MDR and non-MDR
TB and controls were adjusted for sex because of under-
recruitment of male controls due to their availability.
The association between catastrophic costs and adverse TB
outcome was explored through both univariable and multivariable
analysis to determine odds ratios (ORs). The likelihood ratio test
was used to test for trend and interaction between variables. Non-
Gaussian continuous variables such as total costs as a proportion of
annual income were transformed to their base-10 logarithm for
regression analysis. All the variables associated (p,0.15) with
adverse TB outcome in univariable analysis and all predetermined
presumed confounding variables (age, poverty score, previous TB
episode, symptom duration, and current MDR TB) were
concurrently included in a multivariable model [38].
Population attributable fractions were calculated using the Stata
program ‘‘aflogit’’ function, which computes population attribut-
able fraction estimates while adjusting for the reciprocal
confounding effect of covariates on the association of interest.
The population attributable fraction of an exposure was
Ta
ble
1.
Co
nt.
Ca
teg
ory
Ch
ara
cte
rist
icC
on
tro
lsT
BP
ati
en
tsp
-Va
lue
*N
on
-MD
RT
BM
DR
TB
p-V
alu
e*
[SD
][0
–1
27
][0
–1
18
][0
–1
92
]
To
ou
nw
ell
tow
ork
(da
ys)
;m
ea
n1
91
82
90
.00
4
[SD
][0
–5
1]
[0–
47
][0
–8
1]
Tim
eto
he
alt
hce
ntr
e(m
inu
tes)
;m
ea
n1
31
31
30
.9
[SD
][0
–3
0]
[0–
30
][0
–3
3]
MD
RT
B;
pe
rce
nt
11
[95
%C
I][9
–1
3]
All
dat
aar
eat
ind
ivid
ual
leve
lan
dp
re-t
reat
me
nt
exc
ep
tw
he
rein
dic
ate
d.
*Un
ivar
iab
lere
gre
ssio
nad
just
ed
for
sex.
Th
efi
rst
p-v
alu
eco
lum
nco
rre
spo
nd
sto
com
par
iso
no
fco
ntr
ols
(n=
48
7)
wit
hal
lT
Bp
atie
nts
reg
ard
less
of
MD
Rst
atu
s(n
=8
76
).T
he
seco
nd
p-v
alu
eco
lum
nco
rre
spo
nd
sto
com
par
iso
no
fp
atie
nts
wit
hn
on
-MD
RT
B(n
=7
83
)ve
rsu
sM
DR
TB
(n=
93
).**
Ho
use
ho
lde
arn
ing
sp
er
mo
nth
du
rin
gd
iffe
ren
ttr
eat
me
nt
stag
es
rep
rese
nte
das
me
anP
eru
vian
Sole
san
d,i
np
are
nth
ese
s,as
ap
rop
ort
ion
of
TB
pat
ien
ts’m
ean
mo
nth
lyh
ou
seh
old
ear
nin
gs
thro
ug
ho
ut
en
tire
illn
ess
.Co
nfi
de
nce
inte
rval
sar
eth
ose
of
me
anm
on
thly
ear
nin
gs
inP
eru
vian
Sole
s.**
*De
bt
atre
cru
itm
en
tre
pre
sen
ted
asm
ean
Pe
ruvi
anSo
les
and
,in
par
en
the
ses,
asa
pro
po
rtio
no
fT
Bp
atie
nts
’me
anm
on
thly
ho
use
ho
lde
arn
ing
s.D
eb
tat
recr
uit
me
nt
was
use
din
the
fin
alm
ult
ivar
iab
lere
gre
ssio
nm
od
el
rath
er
than
tota
ld
eb
t(s
um
of
de
bt
atre
cru
itm
en
tp
lus
de
bt
at2
4w
ko
ftr
eat
me
nt)
be
cau
seo
nly
46
1p
atie
nts
had
24
-wk
de
bt
dat
aav
aila
ble
.C
I,co
nfi
de
nce
inte
rval
;IQ
R,
inte
rqu
arti
lera
ng
e;
SD,
stan
dar
dd
evi
atio
n.
do
i:10
.13
71
/jo
urn
al.p
me
d.1
00
16
75
.t0
01
Catastrophic TB Costs Are Associated with Adverse TB Outcome in Peru
PLOS Medicine | www.plosmedicine.org 5 July 2014 | Volume 11 | Issue 7 | e1001675
interpreted as the proportion of adverse TB outcomes that would
be averted by eliminating that exposure, both unadjusted and
adjusted for known confounding factors. All p-values were two-
sided, and statistical analyses were performed using the Stata
program (version 10, StataCorp).
Results
ParticipantsDuring the study period, the Peruvian national TB program
within the study site of Ventanilla registered 1,014 patients. We
located 99% of these registered TB patients, of whom 95%
(n = 966) met the inclusion criterion. Of these eligible patients, 1%
(n = 10) declined, and 8% (n = 80) were excluded because they
completed fewer than half of our planned research interviews; data
are presented for the remaining 91% (n = 876). 11% (n = 93) of
patients recruited had MDR TB. 487 controls were also recruited
and had only a baseline interview. The characteristics of the study
population are summarised in Table 1.
Descriptive DataTB patients were more likely than controls to be younger (mean
age 31 [95% CI = 18–44] versus 34 [95% CI = 30–48] y old,
p = 0.001), to be male (59% [95% CI = 5%5–62%] versus 37%
[95% CI = 33%–41%] male, p,0.001), to have a lower BMI (21
[95% CI = 21–22] versus 26 [95% CI = 25–26] kg/m2, p,0.001),
to have lower earnings (510 [95% CI = 481–539] versus 651 [95%
CI = 595–707] PEN, p,0.001), to not be in paid work at
recruitment (81% [95% CI = 79%–84%] versus 63% [95%
CI = 56%–69%], p,0.001), and to have had a previous TB
episode (18% [95% CI = 15%–20%] versus 5.4% [95%
CI = 3.3%–7.4%] of individuals, p,0.001). Patients with MDR
TB were more likely than patients with non-MDR TB to have had
a previous TB episode (40% [95% CI = 30%–50%] versus 15%
[95% CI = 13%–18%] of individuals, p,0.001), to have longer
pre-treatment symptom duration (83 [95% CI = 0–192] versus 52
[95% CI = 0–118] d, p,0.001), to not be in paid work (90% [95%
CI = 84%–96%] versus 80% [95% CI = 77%–83%] of individuals,
p,0.03), and to have had more days not working pre-treatment
due to TB-related illness (29 [95% CI = 0–81] versus 18 [95%
CI = 0–47] d, p = 0.004).
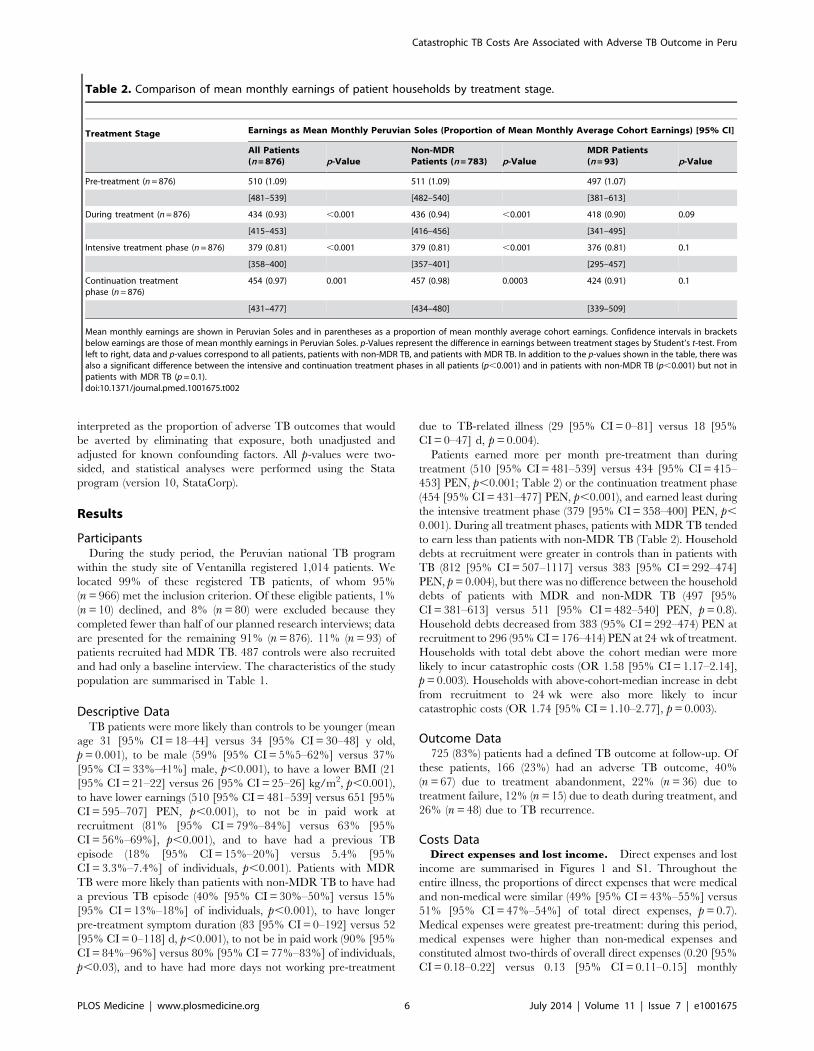
Patients earned more per month pre-treatment than during
treatment (510 [95% CI = 481–539] versus 434 [95% CI = 415–
453] PEN, p,0.001; Table 2) or the continuation treatment phase
(454 [95% CI = 431–477] PEN, p,0.001), and earned least during
the intensive treatment phase (379 [95% CI = 358–400] PEN, p,
0.001). During all treatment phases, patients with MDR TB tended
to earn less than patients with non-MDR TB (Table 2). Household
debts at recruitment were greater in controls than in patients with
TB (812 [95% CI = 507–1117] versus 383 [95% CI = 292–474]
PEN, p = 0.004), but there was no difference between the household
debts of patients with MDR and non-MDR TB (497 [95%
CI = 381–613] versus 511 [95% CI = 482–540] PEN, p = 0.8).
Household debts decreased from 383 (95% CI = 292–474) PEN at
recruitment to 296 (95% CI = 176–414) PEN at 24 wk of treatment.
Households with total debt above the cohort median were more
likely to incur catastrophic costs (OR 1.58 [95% CI = 1.17–2.14],
p = 0.003). Households with above-cohort-median increase in debt
from recruitment to 24 wk were also more likely to incur
catastrophic costs (OR 1.74 [95% CI = 1.10–2.77], p = 0.003).
Outcome Data725 (83%) patients had a defined TB outcome at follow-up. Of
these patients, 166 (23%) had an adverse TB outcome, 40%
(n = 67) due to treatment abandonment, 22% (n = 36) due to
treatment failure, 12% (n = 15) due to death during treatment, and
26% (n = 48) due to TB recurrence.
Costs DataDirect expenses and lost income. Direct expenses and lost
income are summarised in Figures 1 and S1. Throughout the
entire illness, the proportions of direct expenses that were medical
and non-medical were similar (49% [95% CI = 43%–55%] versus
51% [95% CI = 47%–54%] of total direct expenses, p = 0.7).
Medical expenses were greatest pre-treatment: during this period,
medical expenses were higher than non-medical expenses and
constituted almost two-thirds of overall direct expenses (0.20 [95%
CI = 0.18–0.22] versus 0.13 [95% CI = 0.11–0.15] monthly
Table 2. Comparison of mean monthly earnings of patient households by treatment stage.
Treatment Stage Earnings as Mean Monthly Peruvian Soles (Proportion of Mean Monthly Average Cohort Earnings) [95% CI]
All Patients(n = 876) p-Value
Non-MDRPatients (n = 783) p-Value
MDR Patients(n = 93) p-Value
Pre-treatment (n = 876) 510 (1.09) 511 (1.09) 497 (1.07)
[481–539] [482–540] [381–613]
During treatment (n = 876) 434 (0.93) ,0.001 436 (0.94) ,0.001 418 (0.90) 0.09
[415–453] [416–456] [341–495]
Intensive treatment phase (n = 876) 379 (0.81) ,0.001 379 (0.81) ,0.001 376 (0.81) 0.1
[358–400] [357–401] [295–457]
Continuation treatmentphase (n = 876)
454 (0.97) 0.001 457 (0.98) 0.0003 424 (0.91) 0.1
[431–477] [434–480] [339–509]
Mean monthly earnings are shown in Peruvian Soles and in parentheses as a proportion of mean monthly average cohort earnings. Confidence intervals in bracketsbelow earnings are those of mean monthly earnings in Peruvian Soles. p-Values represent the difference in earnings between treatment stages by Student’s t-test. Fromleft to right, data and p-values correspond to all patients, patients with non-MDR TB, and patients with MDR TB. In addition to the p-values shown in the table, there wasalso a significant difference between the intensive and continuation treatment phases in all patients (p,0.001) and in patients with non-MDR TB (p,0.001) but not inpatients with MDR TB (p = 0.1).doi:10.1371/journal.pmed.1001675.t002
Catastrophic TB Costs Are Associated with Adverse TB Outcome in Peru
PLOS Medicine | www.plosmedicine.org 6 July 2014 | Volume 11 | Issue 7 | e1001675
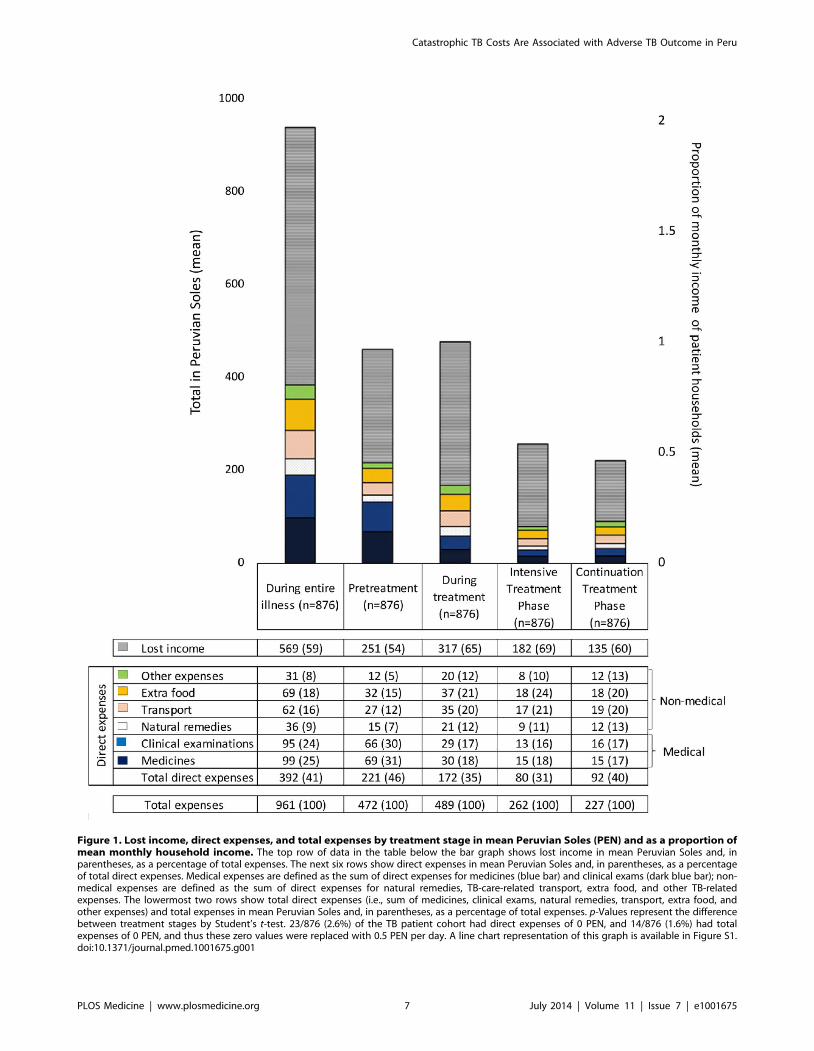
Figure 1. Lost income, direct expenses, and total expenses by treatment stage in mean Peruvian Soles (PEN) and as a proportion ofmean monthly household income. The top row of data in the table below the bar graph shows lost income in mean Peruvian Soles and, inparentheses, as a percentage of total expenses. The next six rows show direct expenses in mean Peruvian Soles and, in parentheses, as a percentageof total direct expenses. Medical expenses are defined as the sum of direct expenses for medicines (blue bar) and clinical exams (dark blue bar); non-medical expenses are defined as the sum of direct expenses for natural remedies, TB-care-related transport, extra food, and other TB-relatedexpenses. The lowermost two rows show total direct expenses (i.e., sum of medicines, clinical exams, natural remedies, transport, extra food, andother expenses) and total expenses in mean Peruvian Soles and, in parentheses, as a percentage of total expenses. p-Values represent the differencebetween treatment stages by Student’s t-test. 23/876 (2.6%) of the TB patient cohort had direct expenses of 0 PEN, and 14/876 (1.6%) had totalexpenses of 0 PEN, and thus these zero values were replaced with 0.5 PEN per day. A line chart representation of this graph is available in Figure S1.doi:10.1371/journal.pmed.1001675.g001
Catastrophic TB Costs Are Associated with Adverse TB Outcome in Peru
PLOS Medicine | www.plosmedicine.org 7 July 2014 | Volume 11 | Issue 7 | e1001675
incomes, p,0.001). Conversely, during treatment, non-medical
expenses were higher than medical expenses and constituted
approximately two-thirds of overall direct expenses (0.22 [95%
CI = 0.20–0.24] versus 0.14 [95% CI = 0.12–0.16] monthly
incomes, p,0.001). Direct expenses were higher pre-treatment
than during treatment (0.52 [95% CI = 0.46–0.59] versus 0.41
[95% CI = 0.37–0.44] monthly incomes, p,0.001), whereas lost
household income was lower pre-treatment than during treatment
(0.60 [95% CI = 0.50–0.69] versus 0.75 [95% CI = 0.68–0.82]
monthly incomes, p,0.005). Lost household income was higher
than direct expenses throughout all treatment phases, with the
greatest difference during the intensive treatment phase (69% lost
income [95% CI = 61%–77%]; Figures 1 and S1).
Total expenses. In addition to direct expenses and lost
income, total expenses are summarised in Figures 1 and S1. Total
expenses were similar pre-treatment and during treatment (1.1
[95% CI = 1.0–1.2] versus 1.2 [95% CI = 1.1–1.2] monthly
incomes, p = 0.6). Total expenses (1.12 [95% CI = 0.99–1.25]
versus 0.62 [95% CI = 0.56–0.68] monthly incomes, p,0.001),
direct expenses (0.52 [95% CI = 0.46–0.59] versus 0.19 [95%
CI = 0.16–0.22] monthly incomes, p,0.001), and lost income (0.6
[95% CI = 0.50–0.69] versus 0.43 [95% CI = 0.38–0.48] monthly
incomes, p = 0.001) were significantly higher pre-treatment than
during the intensive treatment phase. Total expenses (0.62 [95%
CI = 0.56–0.68] versus 0.54 [95% CI = 0.49–0.59] monthly
incomes, p = 0.01) and lost income (0.43 [95% CI = 0.38–0.48
versus 0.32 [95% CI = 0.28–0.36] monthly incomes, p,0.001)
were higher in the intensive than the continuation treatment
phase, but there was no difference in direct expenses between
these treatment phases (0.19 [95% CI = 0.16–0.22] versus 0.22
[95% CI = 0.20–0.23] monthly incomes, p = 0.07). When total
expenses were examined per month, monthly total expenses for
the intensive treatment phase were approximately double those of
the continuation treatment phase.
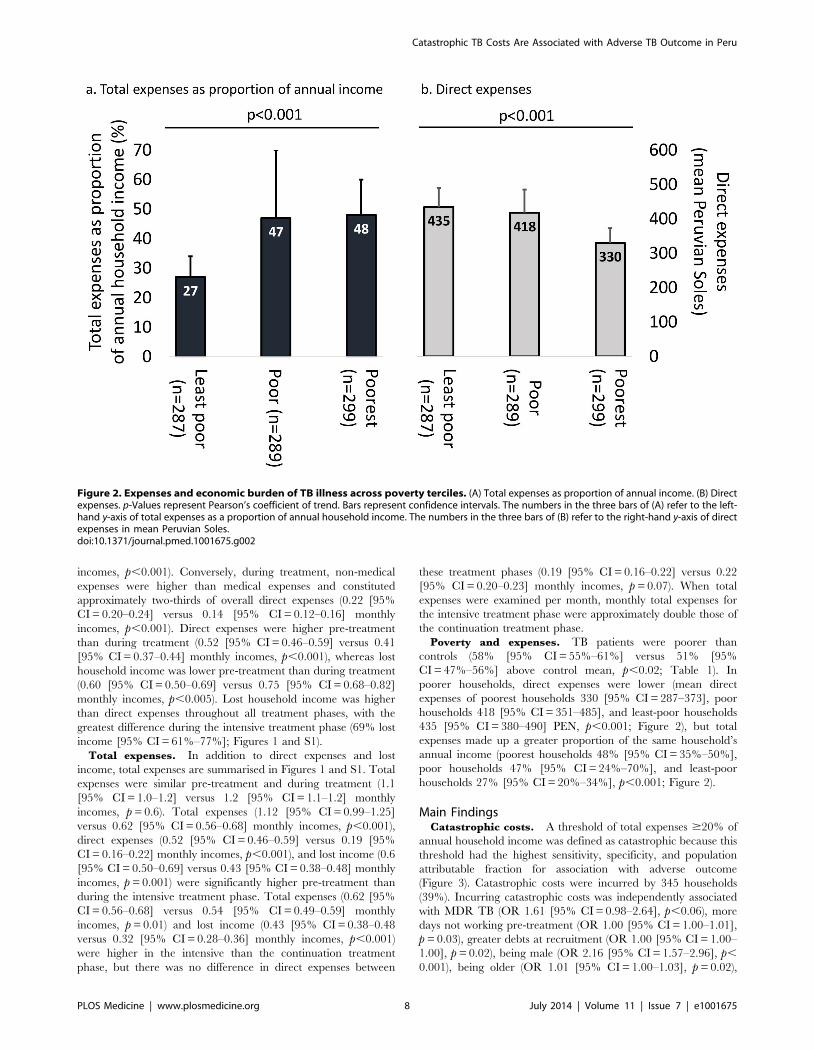
Poverty and expenses. TB patients were poorer than
controls (58% [95% CI = 55%–61%] versus 51% [95%
CI = 47%–56%] above control mean, p,0.02; Table 1). In
poorer households, direct expenses were lower (mean direct
expenses of poorest households 330 [95% CI = 287–373], poor
households 418 [95% CI = 351–485], and least-poor households
435 [95% CI = 380–490] PEN, p,0.001; Figure 2), but total
expenses made up a greater proportion of the same household’s
annual income (poorest households 48% [95% CI = 35%–50%],
poor households 47% [95% CI = 24%–70%], and least-poor
households 27% [95% CI = 20%–34%], p,0.001; Figure 2).
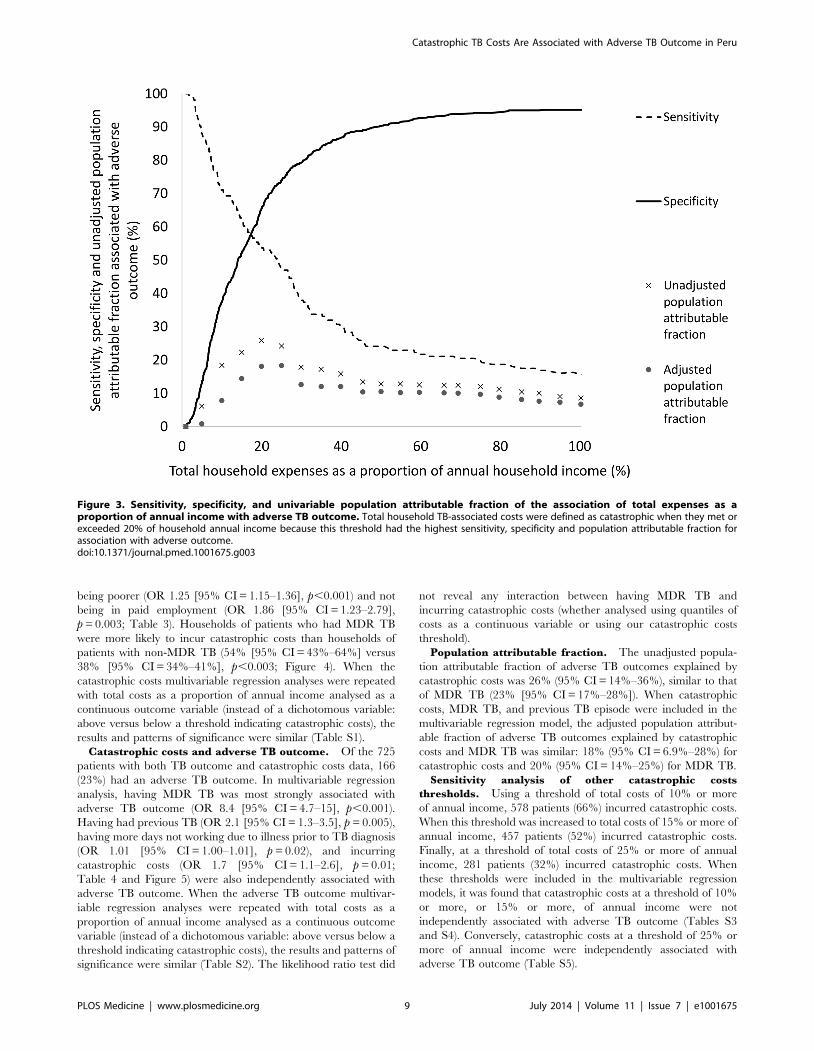
Main FindingsCatastrophic costs. A threshold of total expenses $20% of
annual household income was defined as catastrophic because this
threshold had the highest sensitivity, specificity, and population
attributable fraction for association with adverse outcome
(Figure 3). Catastrophic costs were incurred by 345 households
(39%). Incurring catastrophic costs was independently associated
with MDR TB (OR 1.61 [95% CI = 0.98–2.64], p,0.06), more
days not working pre-treatment (OR 1.00 [95% CI = 1.00–1.01],
p = 0.03), greater debts at recruitment (OR 1.00 [95% CI = 1.00–
1.00], p = 0.02), being male (OR 2.16 [95% CI = 1.57–2.96], p,
0.001), being older (OR 1.01 [95% CI = 1.00–1.03], p = 0.02),
Figure 2. Expenses and economic burden of TB illness across poverty terciles. (A) Total expenses as proportion of annual income. (B) Directexpenses. p-Values represent Pearson’s coefficient of trend. Bars represent confidence intervals. The numbers in the three bars of (A) refer to the left-hand y-axis of total expenses as a proportion of annual household income. The numbers in the three bars of (B) refer to the right-hand y-axis of directexpenses in mean Peruvian Soles.doi:10.1371/journal.pmed.1001675.g002
Catastrophic TB Costs Are Associated with Adverse TB Outcome in Peru
PLOS Medicine | www.plosmedicine.org 8 July 2014 | Volume 11 | Issue 7 | e1001675
being poorer (OR 1.25 [95% CI = 1.15–1.36], p,0.001) and not
being in paid employment (OR 1.86 [95% CI = 1.23–2.79],
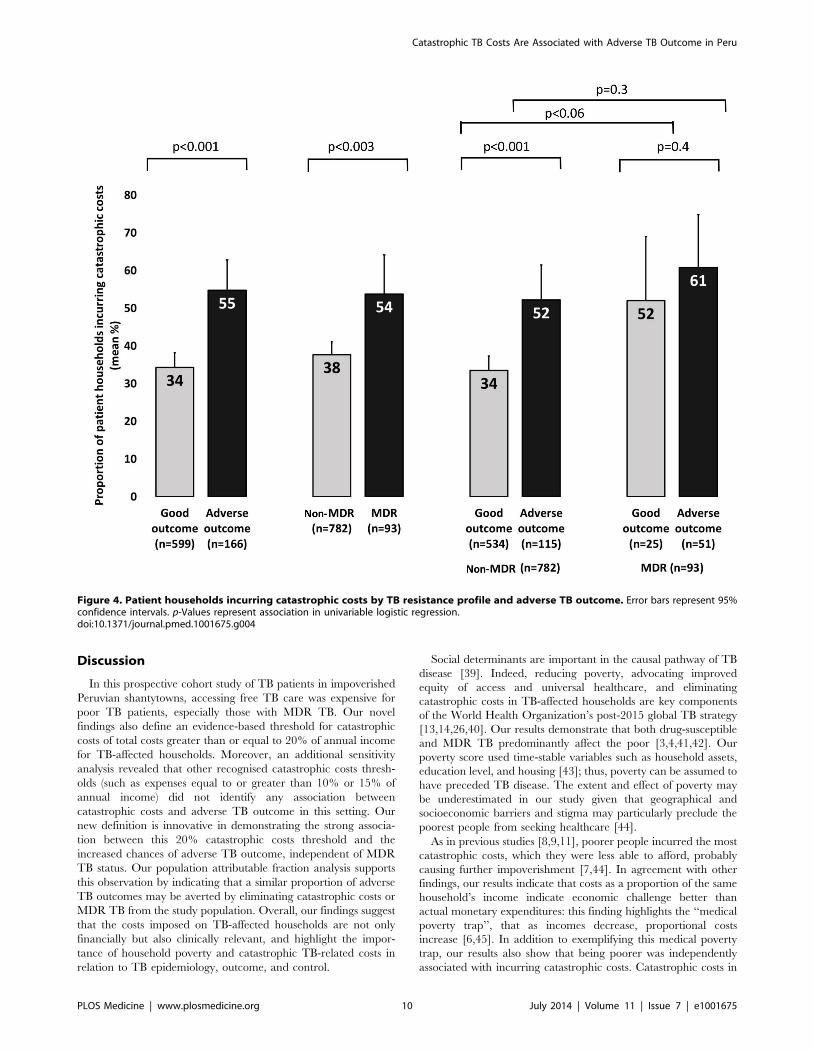
p = 0.003; Table 3). Households of patients who had MDR TB
were more likely to incur catastrophic costs than households of
patients with non-MDR TB (54% [95% CI = 43%–64%] versus
38% [95% CI = 34%–41%], p,0.003; Figure 4). When the
catastrophic costs multivariable regression analyses were repeated
with total costs as a proportion of annual income analysed as a
continuous outcome variable (instead of a dichotomous variable:
above versus below a threshold indicating catastrophic costs), the
results and patterns of significance were similar (Table S1).
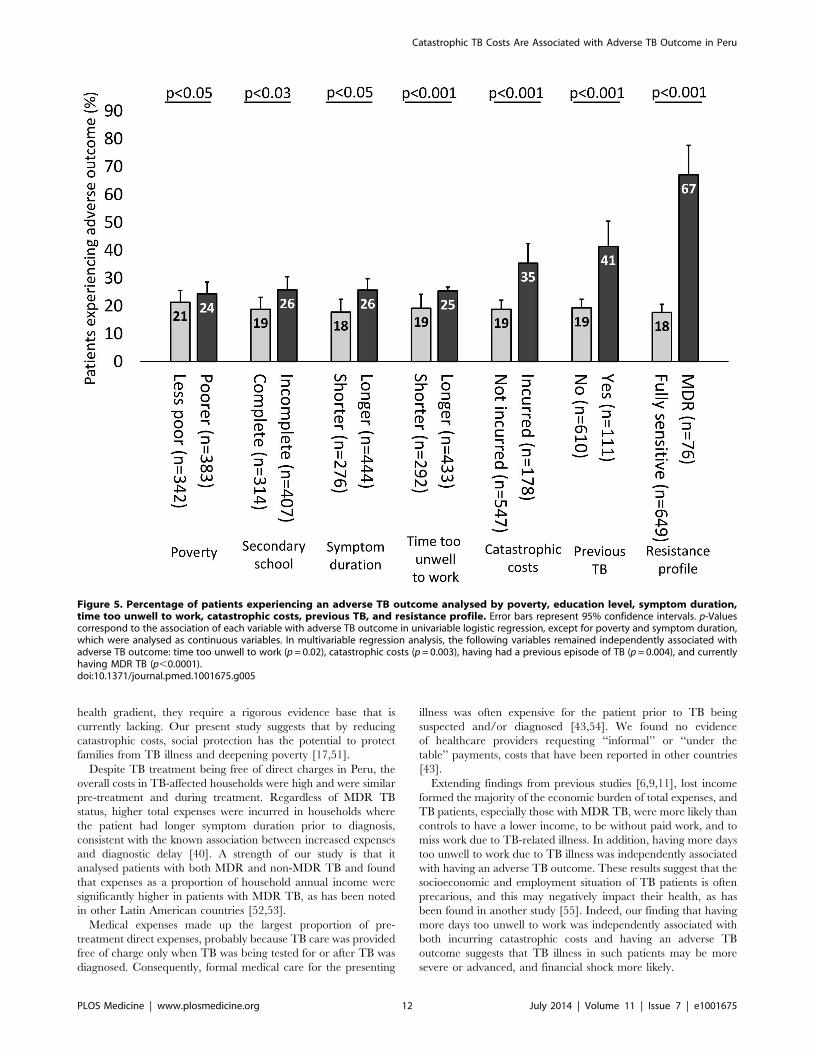
Catastrophic costs and adverse TB outcome. Of the 725
patients with both TB outcome and catastrophic costs data, 166
(23%) had an adverse TB outcome. In multivariable regression
analysis, having MDR TB was most strongly associated with
adverse TB outcome (OR 8.4 [95% CI = 4.7–15], p,0.001).
Having had previous TB (OR 2.1 [95% CI = 1.3–3.5], p = 0.005),
having more days not working due to illness prior to TB diagnosis
(OR 1.01 [95% CI = 1.00–1.01], p = 0.02), and incurring
catastrophic costs (OR 1.7 [95% CI = 1.1–2.6], p = 0.01;
Table 4 and Figure 5) were also independently associated with
adverse TB outcome. When the adverse TB outcome multivar-
iable regression analyses were repeated with total costs as a
proportion of annual income analysed as a continuous outcome
variable (instead of a dichotomous variable: above versus below a
threshold indicating catastrophic costs), the results and patterns of
significance were similar (Table S2). The likelihood ratio test did
not reveal any interaction between having MDR TB and
incurring catastrophic costs (whether analysed using quantiles of
costs as a continuous variable or using our catastrophic costs
threshold).
Population attributable fraction. The unadjusted popula-
tion attributable fraction of adverse TB outcomes explained by
catastrophic costs was 26% (95% CI = 14%–36%), similar to that
of MDR TB (23% [95% CI = 17%–28%]). When catastrophic
costs, MDR TB, and previous TB episode were included in the
multivariable regression model, the adjusted population attribut-
able fraction of adverse TB outcomes explained by catastrophic
costs and MDR TB was similar: 18% (95% CI = 6.9%–28%) for
catastrophic costs and 20% (95% CI = 14%–25%) for MDR TB.
Sensitivity analysis of other catastrophic costs
thresholds. Using a threshold of total costs of 10% or more
of annual income, 578 patients (66%) incurred catastrophic costs.
When this threshold was increased to total costs of 15% or more of
annual income, 457 patients (52%) incurred catastrophic costs.
Finally, at a threshold of total costs of 25% or more of annual
income, 281 patients (32%) incurred catastrophic costs. When
these thresholds were included in the multivariable regression
models, it was found that catastrophic costs at a threshold of 10%
or more, or 15% or more, of annual income were not
independently associated with adverse TB outcome (Tables S3
and S4). Conversely, catastrophic costs at a threshold of 25% or
more of annual income were independently associated with
adverse TB outcome (Table S5).
Figure 3. Sensitivity, specificity, and univariable population attributable fraction of the association of total expenses as aproportion of annual income with adverse TB outcome. Total household TB-associated costs were defined as catastrophic when they met orexceeded 20% of household annual income because this threshold had the highest sensitivity, specificity and population attributable fraction forassociation with adverse outcome.doi:10.1371/journal.pmed.1001675.g003
Catastrophic TB Costs Are Associated with Adverse TB Outcome in Peru
PLOS Medicine | www.plosmedicine.org 9 July 2014 | Volume 11 | Issue 7 | e1001675
Discussion
In this prospective cohort study of TB patients in impoverished
Peruvian shantytowns, accessing free TB care was expensive for
poor TB patients, especially those with MDR TB. Our novel
findings also define an evidence-based threshold for catastrophic
costs of total costs greater than or equal to 20% of annual income
for TB-affected households. Moreover, an additional sensitivity
analysis revealed that other recognised catastrophic costs thresh-
olds (such as expenses equal to or greater than 10% or 15% of
annual income) did not identify any association between
catastrophic costs and adverse TB outcome in this setting. Our
new definition is innovative in demonstrating the strong associa-
tion between this 20% catastrophic costs threshold and the
increased chances of adverse TB outcome, independent of MDR
TB status. Our population attributable fraction analysis supports
this observation by indicating that a similar proportion of adverse
TB outcomes may be averted by eliminating catastrophic costs or
MDR TB from the study population. Overall, our findings suggest
that the costs imposed on TB-affected households are not only
financially but also clinically relevant, and highlight the impor-
tance of household poverty and catastrophic TB-related costs in
relation to TB epidemiology, outcome, and control.
Social determinants are important in the causal pathway of TB
disease [39]. Indeed, reducing poverty, advocating improved
equity of access and universal healthcare, and eliminating
catastrophic costs in TB-affected households are key components
of the World Health Organization’s post-2015 global TB strategy
[13,14,26,40]. Our results demonstrate that both drug-susceptible
and MDR TB predominantly affect the poor [3,4,41,42]. Our
poverty score used time-stable variables such as household assets,
education level, and housing [43]; thus, poverty can be assumed to
have preceded TB disease. The extent and effect of poverty may
be underestimated in our study given that geographical and
socioeconomic barriers and stigma may particularly preclude the
poorest people from seeking healthcare [44].
As in previous studies [8,9,11], poorer people incurred the most
catastrophic costs, which they were less able to afford, probably
causing further impoverishment [7,44]. In agreement with other
findings, our results indicate that costs as a proportion of the same
household’s income indicate economic challenge better than
actual monetary expenditures: this finding highlights the ‘‘medical
poverty trap’’, that as incomes decrease, proportional costs
increase [6,45]. In addition to exemplifying this medical poverty
trap, our results also show that being poorer was independently
associated with incurring catastrophic costs. Catastrophic costs in
Figure 4. Patient households incurring catastrophic costs by TB resistance profile and adverse TB outcome. Error bars represent 95%confidence intervals. p-Values represent association in univariable logistic regression.doi:10.1371/journal.pmed.1001675.g004
Catastrophic TB Costs Are Associated with Adverse TB Outcome in Peru
PLOS Medicine | www.plosmedicine.org 10 July 2014 | Volume 11 | Issue 7 | e1001675
poor households can lead to financial shock: families reducing
consumption below minimum needs, selling assets, and taking
children out of education. These actions may in turn increase
stigmatisation [17,18,46,47]. Moreover, TB principally affects the
most economically productive age group, and patient and
household income decreases post-diagnosis [6] and may not
return to pre-diagnosis levels. Our study adds a new dimension to
the social protection TB literature by showing how catastrophic
costs can also have significant clinical implications: loss of income
and higher hidden costs have previously been associated with poor
treatment adherence and high dropout rates in TB patients
[9,44,48], but their independent effects on long-term TB outcome
have not been previously characterised. We hypothesize that the
relationship we found between catastrophic costs and adverse TB
outcome may relate to a number of factors along the causal
pathway from TB susceptibility to illness to recurrence, including
inadequate nutrition due to lower food spending, more severe
disease (both MDR and non-MDR TB), and barriers to cure due
to the disproportionate hidden costs associated with adherence to
and completion of treatment. These adverse TB outcomes
associated with catastrophic costs may increase TB and MDR-
TB transmission, especially in poorer households. Thus, cata-
strophic costs may worsen TB control.
Regardless of the mechanisms mediating the association
between catastrophic costs and adverse TB outcome, the policy
implications of our findings are clear: future TB prevention
strategies should incorporate social protection to mitigate
decreased economic production, loss of employment, and TB-
associated poverty, and to reduce the clinical vulnerability of TB
patients. These findings highlight the potential role of social
protection not just as a poverty-reduction strategy, but also as a
tool to improve disease control and, ultimately, health [23,24].
Our previous social protection intervention project, Innovative
Socioeconomic Interventions Against Tuberculosis (ISIAT), pro-
vided evidence that in Peru multidisciplinary social protection
intervention can improve adherence and completion of TB
treatment and prophylaxis [35]. Social protection interventions
targeting disadvantaged and vulnerable populations have shown
much promise in Latin America [49], for example, conditional
cash transfer projects such as the Programa de Educacion, Salud y
Alimentacion (Progresa) in Mexico [50]. In order for these
programs to be adopted on a larger scale and reduce the social
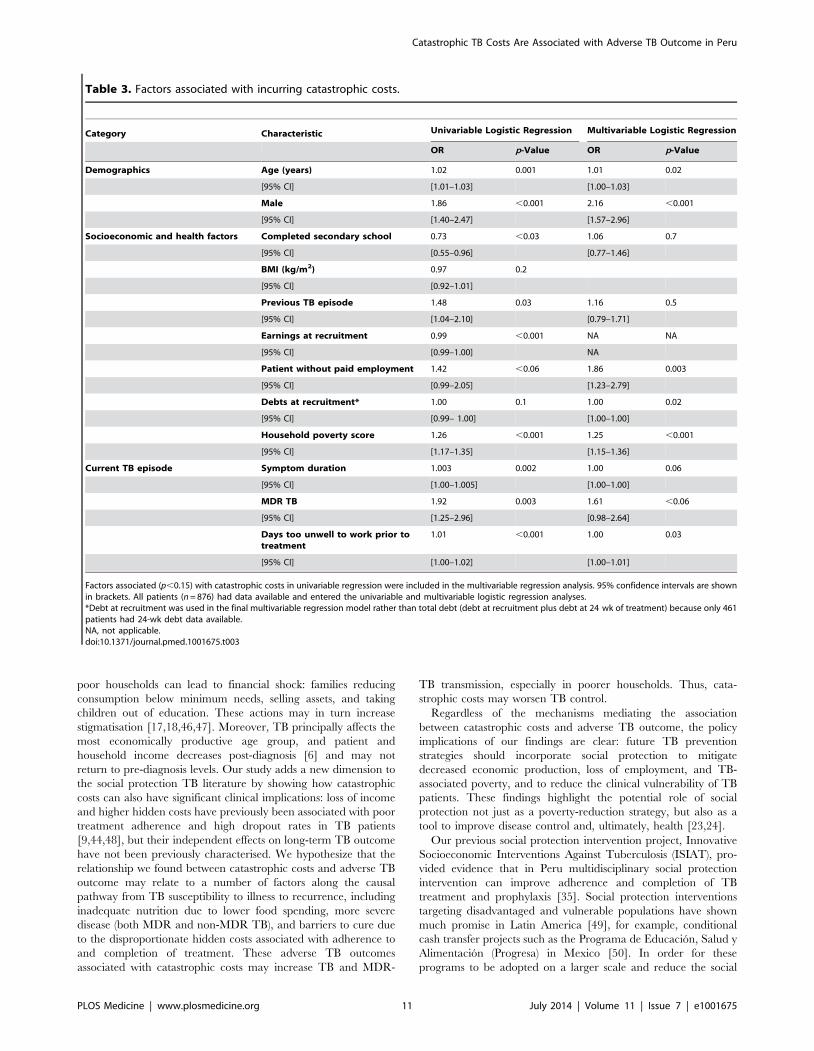
Table 3. Factors associated with incurring catastrophic costs.
Category Characteristic Univariable Logistic Regression Multivariable Logistic Regression
OR p-Value OR p-Value
Demographics Age (years) 1.02 0.001 1.01 0.02
[95% CI] [1.01–1.03] [1.00–1.03]
Male 1.86 ,0.001 2.16 ,0.001
[95% CI] [1.40–2.47] [1.57–2.96]
Socioeconomic and health factors Completed secondary school 0.73 ,0.03 1.06 0.7
[95% CI] [0.55–0.96] [0.77–1.46]
BMI (kg/m2) 0.97 0.2
[95% CI] [0.92–1.01]
Previous TB episode 1.48 0.03 1.16 0.5
[95% CI] [1.04–2.10] [0.79–1.71]
Earnings at recruitment 0.99 ,0.001 NA NA
[95% CI] [0.99–1.00] NA
Patient without paid employment 1.42 ,0.06 1.86 0.003
[95% CI] [0.99–2.05] [1.23–2.79]
Debts at recruitment* 1.00 0.1 1.00 0.02
[95% CI] [0.99– 1.00] [1.00–1.00]
Household poverty score 1.26 ,0.001 1.25 ,0.001
[95% CI] [1.17–1.35] [1.15–1.36]
Current TB episode Symptom duration 1.003 0.002 1.00 0.06
[95% CI] [1.00–1.005] [1.00–1.00]
MDR TB 1.92 0.003 1.61 ,0.06
[95% CI] [1.25–2.96] [0.98–2.64]
Days too unwell to work prior totreatment
1.01 ,0.001 1.00 0.03
[95% CI] [1.00–1.02] [1.00–1.01]
Factors associated (p,0.15) with catastrophic costs in univariable regression were included in the multivariable regression analysis. 95% confidence intervals are shownin brackets. All patients (n = 876) had data available and entered the univariable and multivariable logistic regression analyses.*Debt at recruitment was used in the final multivariable regression model rather than total debt (debt at recruitment plus debt at 24 wk of treatment) because only 461patients had 24-wk debt data available.NA, not applicable.doi:10.1371/journal.pmed.1001675.t003
Catastrophic TB Costs Are Associated with Adverse TB Outcome in Peru
PLOS Medicine | www.plosmedicine.org 11 July 2014 | Volume 11 | Issue 7 | e1001675
health gradient, they require a rigorous evidence base that is
currently lacking. Our present study suggests that by reducing
catastrophic costs, social protection has the potential to protect
families from TB illness and deepening poverty [17,51].
Despite TB treatment being free of direct charges in Peru, the
overall costs in TB-affected households were high and were similar
pre-treatment and during treatment. Regardless of MDR TB
status, higher total expenses were incurred in households where
the patient had longer symptom duration prior to diagnosis,
consistent with the known association between increased expenses
and diagnostic delay [40]. A strength of our study is that it
analysed patients with both MDR and non-MDR TB and found
that expenses as a proportion of household annual income were
significantly higher in patients with MDR TB, as has been noted
in other Latin American countries [52,53].
Medical expenses made up the largest proportion of pre-
treatment direct expenses, probably because TB care was provided
free of charge only when TB was being tested for or after TB was
diagnosed. Consequently, formal medical care for the presenting
illness was often expensive for the patient prior to TB being
suspected and/or diagnosed [43,54]. We found no evidence
of healthcare providers requesting ‘‘informal’’ or ‘‘under the
table’’ payments, costs that have been reported in other countries
[43].
Extending findings from previous studies [6,9,11], lost income
formed the majority of the economic burden of total expenses, and
TB patients, especially those with MDR TB, were more likely than
controls to have a lower income, to be without paid work, and to
miss work due to TB-related illness. In addition, having more days
too unwell to work due to TB illness was independently associated
with having an adverse TB outcome. These results suggest that the
socioeconomic and employment situation of TB patients is often
precarious, and this may negatively impact their health, as has
been found in another study [55]. Indeed, our finding that having
more days too unwell to work was independently associated with
both incurring catastrophic costs and having an adverse TB
outcome suggests that TB illness in such patients may be more
severe or advanced, and financial shock more likely.
Figure 5. Percentage of patients experiencing an adverse TB outcome analysed by poverty, education level, symptom duration,time too unwell to work, catastrophic costs, previous TB, and resistance profile. Error bars represent 95% confidence intervals. p-Valuescorrespond to the association of each variable with adverse TB outcome in univariable logistic regression, except for poverty and symptom duration,which were analysed as continuous variables. In multivariable regression analysis, the following variables remained independently associated withadverse TB outcome: time too unwell to work (p = 0.02), catastrophic costs (p = 0.003), having had a previous episode of TB (p = 0.004), and currentlyhaving MDR TB (p,0.0001).doi:10.1371/journal.pmed.1001675.g005
Catastrophic TB Costs Are Associated with Adverse TB Outcome in Peru
PLOS Medicine | www.plosmedicine.org 12 July 2014 | Volume 11 | Issue 7 | e1001675
Some definitions of catastrophic costs incorporate signs of
financial shock, when a household is forced to employ coping
mechanisms such as sacrificing basic needs, selling assets, selling
household items, removing children from education, and incurring
formal or informal debt [17,18,46,47,56,57]. Others have defined
costs as catastrophic when they exceed 10%–40% of annual
household or individual income [7,15,56,58] or 40% or more of a
household’s ‘‘capacity to pay’’ (the effective income for non-food
spending [21,22,46,59–61]), but this approach may be too narrow
and potentially misleading to policy-makers because it overlooks
lost income [23,24]. A strength of the threshold of catastrophic
costs that our results defined is that it includes not only out-of-
pocket direct expenses but also lost income and that it is proven to
be clinically relevant. Specifically, our definition was calculated
from serial, prospective data [15,18] of household expenses, actual
household income [7,58], and long-term TB outcome of a cohort
of TB patients in impoverished Peruvian shantytowns. It has been
estimated that 4% of households in Peru incur catastrophic health
expenditure when aiming to meet overall health needs [62]. Rates
of catastrophic health expenditure in our cohort were much higher
than those of the general population. This may be due to TB-
affected households being poorer or the TB treatment model in
Peru having greater hidden costs for TB patients, or that we
included lost income to calculate catastrophic costs, whereas only
direct expenses were used in some other studies [62].
The sensitivity analysis we performed showed that the
proportion of patient households incurring catastrophic costs was
similar to the proportion found in other studies that used different
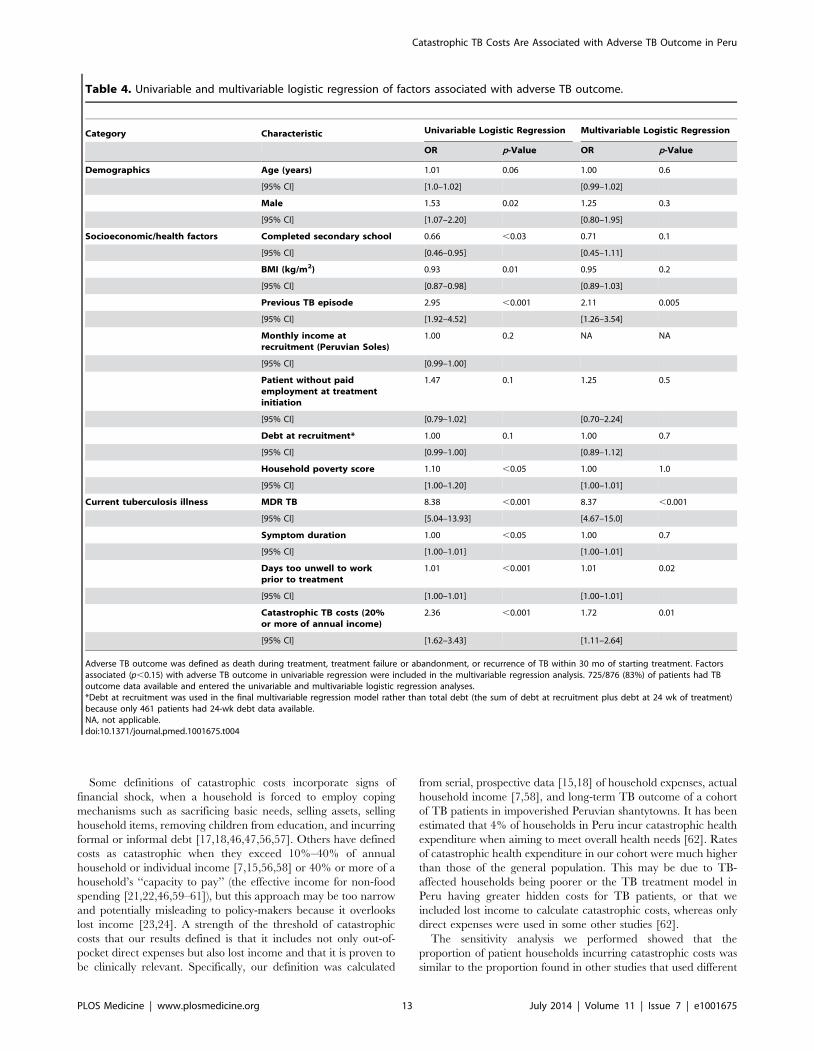
Table 4. Univariable and multivariable logistic regression of factors associated with adverse TB outcome.
Category Characteristic Univariable Logistic Regression Multivariable Logistic Regression
OR p-Value OR p-Value
Demographics Age (years) 1.01 0.06 1.00 0.6
[95% CI] [1.0–1.02] [0.99–1.02]
Male 1.53 0.02 1.25 0.3
[95% CI] [1.07–2.20] [0.80–1.95]
Socioeconomic/health factors Completed secondary school 0.66 ,0.03 0.71 0.1
[95% CI] [0.46–0.95] [0.45–1.11]
BMI (kg/m2) 0.93 0.01 0.95 0.2
[95% CI] [0.87–0.98] [0.89–1.03]
Previous TB episode 2.95 ,0.001 2.11 0.005
[95% CI] [1.92–4.52] [1.26–3.54]
Monthly income atrecruitment (Peruvian Soles)
1.00 0.2 NA NA
[95% CI] [0.99–1.00]
Patient without paidemployment at treatmentinitiation
1.47 0.1 1.25 0.5
[95% CI] [0.79–1.02] [0.70–2.24]
Debt at recruitment* 1.00 0.1 1.00 0.7
[95% CI] [0.99–1.00] [0.89–1.12]
Household poverty score 1.10 ,0.05 1.00 1.0
[95% CI] [1.00–1.20] [1.00–1.01]
Current tuberculosis illness MDR TB 8.38 ,0.001 8.37 ,0.001
[95% CI] [5.04–13.93] [4.67–15.0]
Symptom duration 1.00 ,0.05 1.00 0.7
[95% CI] [1.00–1.01] [1.00–1.01]
Days too unwell to workprior to treatment
1.01 ,0.001 1.01 0.02
[95% CI] [1.00–1.01] [1.00–1.01]
Catastrophic TB costs (20%or more of annual income)
2.36 ,0.001 1.72 0.01
[95% CI] [1.62–3.43] [1.11–2.64]
Adverse TB outcome was defined as death during treatment, treatment failure or abandonment, or recurrence of TB within 30 mo of starting treatment. Factorsassociated (p,0.15) with adverse TB outcome in univariable regression were included in the multivariable regression analysis. 725/876 (83%) of patients had TBoutcome data available and entered the univariable and multivariable logistic regression analyses.*Debt at recruitment was used in the final multivariable regression model rather than total debt (the sum of debt at recruitment plus debt at 24 wk of treatment)because only 461 patients had 24-wk debt data available.NA, not applicable.doi:10.1371/journal.pmed.1001675.t004
Catastrophic TB Costs Are Associated with Adverse TB Outcome in Peru
PLOS Medicine | www.plosmedicine.org 13 July 2014 | Volume 11 | Issue 7 | e1001675
thresholds: at a threshold of total costs of 10% or more of annual
income, 65% of our cohort incurred catastrophic costs, compared
to 66%–75% in related studies from sub-Saharan Africa [12,16];
at thresholds of total costs of 15% and 25% or more of annual
income, 52% and 32% of our cohort, respectively, had
catastrophic costs, compared to 68% and 48%, respectively, in a
cohort from sub-Saharan Africa [12]. More importantly, the
sensitivity analysis also showed that thresholds of total costs of 10%
and 15% or more of annual income were not independently
associated with adverse TB outcome in this Peruvian shantytown
setting. Our results demonstrate that these previously published
arbitrary thresholds for catastrophic costs that were defined
without patient follow-up were not associated with adverse TB
outcome for TB patients in our setting. Thus, our findings provide,
to our knowledge, the first evidence-based threshold for clinically
relevant catastrophic costs, and demonstrate a methodology to
assess the generalizability of this threshold in other settings.
This study has several limitations. First, cases and controls were
not matched in this study because controls were specifically
included to provide an estimate of typical income and expendi-
ture in this community, to be compared with TB patients at
baseline. Matching would have impaired this comparison. A
baseline difference was noted in debts at recruitment, a proxy for
‘‘dis-saving’’. Poorer households have diminished access to
establishments that offer formal loans (e.g., banks) because of
their uncertain repayment capacity and/or lack of requisites such
as a national identity card [35]. However, even if controls had
been matched to cases, controls may still have had higher debt
than patients because some patient households were not eligible
for some loans due to serious ill health or if they were extremely
poor [35]. Apart from debt, no other data were collected on
specific ‘‘dis-saving’’ coping mechanisms. However, although
selling household items may have been overlooked, taking
children out of education and selling livestock are unlikely to
occur in the peri-urban non-agrarian communities that made up
our study cohort. Second, the data available did not allow
assessment of an existing WHO definition of catastrophic costs
(40% or more of a household’s capacity to pay [63]) against
which other studies have compared their findings [12]. Third, we
may have underestimated the financial effects of MDR TB
because our questionnaires quantifying costs continued for only
6 mo, whereas patients with MDR TB are usually treated for
18 mo or more. We decided a priori to analyse the catastrophic
costs of both MDR and non-MDR patients together, given their
equal follow-up and the small number of MDR TB patients.
Finally, our research demonstrates a new methodology that
should be repeated in other settings to assess the external validity
of our findings.
Despite free TB care, having TB disease was expensive for TB
patients living in a shantytown in Peru. Higher relative costs were
associated with greater likelihood of adverse TB outcome. Having
MDR TB and incurring catastrophic costs were independently
associated with adverse TB outcome, with a similar adjusted
population attributable fraction for adverse TB outcome. Thus,
catastrophic costs were an indicator of both financial and clinical
vulnerability, and households affected by TB would benefit from
assessment to identify those at highest risk of incurring
catastrophic costs. Mitigating catastrophic costs through targeted
social protection interventions as well as prompt diagnosis and
appropriate treatment of MDR TB deserve attention in TB
control programs. In conclusion, control interventions must
consider TB as an infectious and socioeconomic problem and
address both the clinical and financial aspects of this public health
challenge.
Supporting Information
Figure S1 Lost income, direct expenses, and totalexpenses by treatment stage in mean Peruvian Solesand as a proportion of mean monthly household income.A line chart representation of the data presented in Figure 1.
(TIF)
Table S1 Factors associated with total costs as aproportion of annual income. Total costs as a proportion of
annual income had a non-Gaussian distribution, so this variable
was transformed to its base-10 logarithm for regression analysis.
Factors associated (p,0.15) with increasing costs in univariable
linear regression were included in the multivariable analysis. 95%
confidence intervals are shown in parentheses. All patients
(n = 876) had data available and were included in the univariable
and multivariable linear regression analyses.
(DOC)
Table S2 Univariable and multivariable logistic regres-sion of factors (including costs as a continuous variable)associated with adverse outcome. Adverse outcome is
defined as death during treatment, treatment failure or abandon-
ment, or recurrence of TB within 30 mo of starting treatment. Total
costs as a proportion of annual income had a non-Gaussian
distribution so this variable was transformed to its base-10 logarithm
for regression analysis. Factors associated (p,0.15) with adverse
outcome in univariable logistic regression were included in the
multivariable logistic regression analysis. 725/876 (83%) of patients
had outcome data available and were included in the univariable
and multivariable logistic regression analyses. This table differs from
Table 4 in that total costs as a proportion of annual income is
analysed as a continuous variable instead of as a dichotomous
variable (catastrophic versus non-catastrophic costs).
(DOC)
Table S3 Univariable and multivariable logistic regres-sion of factors (including 10% threshold for catastrophiccosts) associated with adverse outcome. Adverse outcome
is defined as death during treatment, treatment failure or
abandonment, or recurrence of TB within 30 mo of starting
treatment. Factors associated (p,0.15) with adverse outcome in
univariable logistic regression were included in the multivariable
logistic regression analysis. 725/876 (83%) of patients had
outcome data available and entered the univariable and
multivariable logistic regression analyses. In contrast to Table 4,
in this table total costs $10% of annual income was used as the
threshold for catastrophic costs.
(DOC)
Table S4 Univariable and multivariable logistic regres-sion of factors (including 15% threshold for catastrophiccosts) associated with adverse outcome. Adverse outcome
is defined as death during treatment, treatment failure or
abandonment, or recurrence of TB within 30 mo of starting
treatment. Factors associated (p,0.15) with adverse outcome in
univariable logistic regression were included in the multivariable
logistic regression analysis. 725/876 (83%) of patients had
outcome data available and entered the univariable and
multivariable logistic regression analyses. In contrast to Table 4,
in this table total costs $15% of annual income was used as the
threshold for catastrophic costs.
(DOC)
Table S5 Univariable and multivariable logistic regres-sion of factors (including 25% threshold for catastrophiccosts) associated with adverse outcome. Adverse outcome
Catastrophic TB Costs Are Associated with Adverse TB Outcome in Peru
PLOS Medicine | www.plosmedicine.org 14 July 2014 | Volume 11 | Issue 7 | e1001675
is defined as death during treatment, treatment failure or
abandonment, or recurrence of TB within 30 mo of starting
treatment. Factors associated (p,0.15) with adverse outcome in
univariable logistic regression were included in the multivariable
logistic regression analysis. 725/876 (83%) of patients had
outcome data available and were included in the univariable
and multivariable logistic regression analyses. In contrast to
Table 4, in this table total costs $25% of annual income was used
as the threshold for catastrophic costs.
(DOC)
Table S6 Annual inflation rate of the Peruvian Sol andexchange rate of the Peruvian Sol. Source: l PEN to the US
dollar, 2002–2009 [64].
(DOC)
Questionnaire S1 Socioeconomic section of initial andfollow-up questionnaires.
(DOC)
Author Contributions
Conceived and designed the experiments: CAE AG KZ RM. Performed
the experiments: CAE AG KZ MT RM. Analyzed the data: TW AG CAE
KZ MT DB. Contributed reagents/materials/analysis tools: CAE RM.
Wrote the first draft of the manuscript: TW CAE AG DB. Contributed to
the writing of the manuscript: TW CAE KZ AG MT DB KL. ICMJE
criteria for authorship read and met: TW AG KZ MT DB KL CAE RM.
Agree with manuscript results and conclusions: TW AG KZ MT DB KL
CAE RM. Enrolled patients: CAE MT KZ RM.
References
1. World Health Organization (2012) Global tuberculosis report 2012. Available:
http://apps.who.int/iris/bitstream/10665/75938/1/9789241564502_eng.pdf.
Accessed 20 September 2013.
2. Xu K, Evans DB, Carrin G, Aguilar-Rivera AM (2005) Designing health
financing systems to reduce catastrophic health expenditure. Technical brief for
policy-makers, Number 2/2005. Geneva: World Health Organization. Avail-
able: http://www.who.int/health_financing/documents/cov-pb_e_05_2-cata_
sys/en/. Accessed 12 June 2014.
3. Lonnroth K, Jaramillo E, Williams BG, Dye C, Raviglione M (2009) Drivers of
tuberculosis epidemics: the role of risk factors and social determinantes. Soc Sci
Med 68: 2240–2246.
4. Spence DP, Hotchkiss J, Williams CS, Davies PD (2003) Tuberculosis and
poverty. BMJ 307: 759–761.
5. Solar O, Irwin A (2010) A conceptual framework for action on the social
determinants of health. Social Determinants of Health Discussion, Paper 2
(Policy and Practice). Geneva: World Health Organization.
6. Mauch V, Woods N, Kirubi B, Kipruto H, Sitienei J, et al. (2011) Assessing
access barriers to tuberculosis care with the tool to estimate patients’ costs: pilot
results from two districts in Kenya. BMC Public Health 11: 43. doi:10.1186/
1471-2458-11-43.
7. Barter DM, Agboola SO, Murray MB, Barnighausen T (2012) Tuberculosis and
poverty: the contribution of patient costs in sub-Saharan Africa—a systematic
review. BMC Public Health 12: 980. doi:10.1186/1471-2458-12-980.
8. Wyszewianski L (1986) Families with catastrophic health care expenditures.
Health Serv Res 21: 617–634.
9. Rajeswari R, Balasubramanian R, Muniyandi M, Geetharamani S, Thresa X, et
al. (1999) Socio-economic impact of tuberculosis on patients and family in India.
Int J Tuberc Lung Dis 3: 869–887.
10. Mauch V, Bonsu F, Gyapong M, Awini E, Suarez P, et al. (2013) Free
tuberculosis diagnosis and treatment are not enough: patient cost evidence from
three continents. Int J Tuberc Lung Dis 17: 381–387.
11. Tanimura T, Jaramillo E, Weil D, Raviglione M, Lonnroth K (2014) Financial
burden for tuberculosis patients in low- and middle-income countries—a
systematic review. Eur Respir J 43: 1763–1775. doi:10.1183/09031936.
00193413.
12. Ukwaja KN, Modebe O, Igwenyi C, Alobu I (2012) The economic burden of
tuberculosis care for patients and households in Africa: a systematic review.
Int J Tuberc Lung Dis 16: 733–739.
13. World Health Organization (2014) 67th World Health Assembly: agenda.
Documents A67/11 and EB134/2014/REC/1, resolution EB134.R4. Avail-
able: http://apps.who.int/gb/ebwha/pdf_files/WHA67/A67_1Rev1-en.pdf.
Accessed 29 May 2013.
14. Raviglione MC, Ditiu L (2013) Setting new targets in the fight against
tuberculosis. Nat Med 19: 263.
15. Russell S (2004) The economic burden of illness for households in developing
countries: a review of studies focusing on malaria, tuberculosis, and human
immunodeficiency virus/acquired immunodeficiency syndrome. Am J Trop
Med Hyg 7: 147–155.
16. Laokri S, Weil O, Maxime Drabo K, Dembele SM, Kafando B, et al. (2013)
Removal of user fees no guarantee of universal health coverage: observations
from Burkina Faso. Bull World Health Organ 91: 277–282.
17. Berki SE (1986) A look at catastrophic medical expenses and the poor. Health
Aff (Millwood) 5: 138–145.
18. Leive A, Xu K (2008) Coping with out-of-pocket health payments: empirical
evidence from 15 African countries. Bull World Health Organ 86: 849–856.
19. Ahmed S, Khan J (2013) Catastrophic health expenditure associated with
tuberculosis in Bangladesh [abstract]. 44th World Conference on Lung Health
of the International Union Against Tuberculosis and Lung Disease (The Union);
30 Oct–3 Nov 2013; Paris, France. Int J Tuberc Lung Dis 17 (12 Suppl 2): 50–
51.
20. Ukwaja KN, Alobu I, Abimbola S, Hopewell PC (2013) Household catastrophic
payments for tuberculosis care in Nigeria: incidence, determinants, and policyimplications for universal health coverage. Infect Dis Poverty 2: 21.
21. Xu K, Evans DB, Kawabata K, Zeramdini R, Klavus J, et al. (2003) Householdcatastrophic health expenditure: a multicountry analysis. Lancet 362: 111–117.
22. Xu K, Klavus J, Kawabata K, Evans DB, Hanvoravongchai P, et al. (2006)Household health system contributions and capacity to pay: definitional,
empirical, and technical challenges. In: Murray CJ, Evans DB, editors. Healthsystem performance assessment: debates methods and empiricism. pp. 532–542.
23. Moreno-Serra R, Millett C, Smith PC (2011) Towards improved measurementof financial protection in health. PLoS Med 8: e1001087. doi:10.1371/
journal.pmed.1001087.
24. Ruger JP (2012) An alternative framework for analyzing financial protection in
health. PLoS Med 9: e1001294. doi:10.1371/journal.pmed.1001294.
25. World Health Organization (2011) Sixty-fourth World Health Assembly.Agenda item 13.4. Sustainable health financing structures and universal
coverage. WHA64.9. Available: http://apps.who.int/gb/ebwha/pdf_files/
WHA64/A64_R9-en.pdf. Accessed 1 March 2014.
26. United Nations (2013) A new global partnership: eradicate poverty andtransform economies through sustainable development. The report of the
High-Level Panel of Eminent Persons on the Post-2015 Development Agenda.
New York: United Nations.
27. Floyd K (2003) Costs and effectiveness—the impact of economic studies on TBcontrol. Tuberculosis 83: 187–200.
28. Baltussen R, Floyd K, Dye C (2005) Achieving the Millennium DevelopmentGoals for health—cost effectiveness analysis of strategies for tuberculosis control
in developing countries. BMJ 331: 1364.
29. World Health Organization (2012) World health statistics 2012. Available:
http://www.who.int/gho/publications/world_health_statistics/EN_WHS2012_Full.pdf. Accessed 3 March 2014.
30. Jackson S, Sleigh AC, Wang GJ, Liu XL (2006) Poverty and the economic effectsof TB in rural China. Int J Tuberc Lung Dis 10: 1104–1110.
31. Migliori GB, Espinal M, Danilova ID, Punga VV, Grzemska M, et al. (2002)
Frequency of recurrence among MDR-TB cases ‘successfully’ treated with
standardised short-course chemotherapy. Int J Tuberc Lung Dis 6: 858–864.
32. Datiko DG, Lindtjorn B (2009) Tuberculosis recurrence in smear-positivepatients cured under DOTS in southern Ethiopia: retrospective cohort study.
BMC Public Health 9: 348.
33. Kemp JR, Mann G, Simwaka BN, Salaniponi FML, Squire SB (2007) Can
Malawi’s poor afford free tuberculosis services? Patient and household costsassociated with a tuberculosis diagnosis in Lilongwe. Bull World Health Organ
85: 580–585.
34. Pizzi LT, Lofland JH (2006) Economic evaluation in U.S. health care: principles
and applications. Sudbury (Canada): Jones and Bartlett Publishers.
35. Rocha C, Montoya R, Zevallos K, Curatola A, Ynga W, et al. (2011) The
Innovative Socio-economic Interventions Against Tuberculosis (ISIAT) project:an operational assessment. Int J Tuberc Lung Dis 15 (Suppl 2): S50–S57.
doi:10.5588/ijtld.10.0447.
36. Barber J, Thompson S (1998) Analysis and interpretation of cost data in
randomized controlled trials: review of published studies. BMJ 317: 1195–1200.
37. Barber JA, Thompson SG (2000) Analysis of cost data in randomized trials: an
application of the non-parametric bootstrap. Stat Med 19: 3219–3236.
38. Harrell FE (2001) Regression modelling strategies: with applications to linearmodels, logistic regression and survival analysis. Springer Series in Statistics.
New York: Springer-Verlag New York. 571 p.
39. Boccia D, Hargreaves J, De Stavola BL, Fielding K, Schaap A, et al. (2011) The
association between household socioeconomic position and prevalent tubercu-losis in Zambia: a case-control study. PLoS ONE 6: e20824. doi:10.1371/
journal.pone.0020824.
40. Laokri S, Drabo MK, Weil O, Kafando B, Dembele SM, et al. (2013) Patients
are paying too much for tuberculosis: a direct cost-burden evaluation in Burkina
Faso. PLoS ONE 8: e56752.
Catastrophic TB Costs Are Associated with Adverse TB Outcome in Peru
PLOS Medicine | www.plosmedicine.org 15 July 2014 | Volume 11 | Issue 7 | e1001675
41. Holtgrave DR, Crosby RA (2004) Social determinants of tuberculosis case rates
in the United States. Am J Prev Med 26: 159–162.42. Gwatkin DR, Guillot M, Heuveline P (1999) The burden of disease among the
global poor. Lancet 354: 586–589.
43. Long Q, Smith H, Zhang T, Tang S, Garner P (2011) Patient medical costs fortuberculosis treatment and impact on adherence in China: a systematic review.
BMC Public Health 11: 393.44. Sauerborn R, Adams A, Hien M (1996) Household strategies to cope with the
economic cost of illness. Soc Sci Med 43: 281–290.
45. Dahlgren G, Whitehead M (2006) Concepts and principles for tackling socialinequities in health. Copenhagen: World Health Organization Regional Office
for Europe.46. Kamolratanakul P, Sawert H, Kongsin S, Lertmaharit S, Sriwongsa J, et al.
(1999) Economic impact of tuberculosis at the household level. Int J TubercLung Dis 3: 596–602.
47. Wagstaff A, van Doorslaer E (2003) Catastrophe and impoverishment in paying
for health care: with applications to Vietnam 1993–1998. Health Econ 12: 921–934.
48. Peabody JW, Shimkhada R, Tan C Jr, Luck J (2005) The burden of disease,economic costs and clinical consequences of tuberculosis in the Philippines.
Health Policy Plan 20: 347–353.
49. Tajer D (2003) Latin American social medicine: roots, development during the1990s, and current challenges. Am J Public Health 93: 2023–2027.
50. Skoufias E (2005) Progresa and its impacts on the welfare of rural households inMexico. Washington (District of Columbia): International Food Policy Research
Institute.51. Knaul FM, Wong R, Arreola-Ornelas H, Mendez O, Network on Health
Financing and Social Protection in Latin America and the Caribbean (LANET)
(2011) Household catastrophic health expenditures: a comparative analysis oftwelve Latin American and Caribbean Countries. Salud Publica Mex 53 (Suppl
2): s85–s95.52. Costa JG, Santos AC, Rodrigues LC, Barreto ML, Roberts JA (2005)
Tuberculosis in Salvador, Brazil: costs to health system and families. Rev Saude
Publica 39: 1–7.53. Rouzier VA, Oxlade O, Verduga R, Gresely L, Menzies D (2010) Patient and
family costs associated with tuberculosis, including multidrug-resistant tubercu-losis, in Ecuador. Int J Tuberc Lung Dis 14: 1316–1322.
54. Liu X, Thomson R, Gong Y, Zhao F, Squire SB, et al. (2007) How affordable
are tuberculosis diagnosis and treatment in rural China? An analysis from
community and tuberculosis patient perspectives. Trop Med Int Health 12:
1464–1471.
55. Kik SV, Olthof SP, de Vries JT, Menzies D, Kincler N, et al. (2009) Direct and
indirect costs of tuberculosis among immigrant patients in the Netherlands.
BMC Public Health 9: 283. doi:10.1186/1471-2458-9-283.
56. McIntyre D, Thiede M, Dahlgren G, Whitehead M (2006) What are the
economic consequences for households of illness and of paying for health care in
low- and middle-income country contexts? Soc Sci Med 62: 858–865.
57. Russell S (1996) Ability to pay for health care: concepts and evidence. Health
Policy Plan 11: 219–237.
58. Ranson MK (2002) Reduction of catastrophic health care expenditures by a
community-based health insurance scheme in Gujarat, India: current experi-
ences and challenges. Bull World Health Organ 80: 613–621.
59. Rahman MM, Gilmour S, Saito E, Sultana P, Shibuya K (2013) Health-related
financial catastrophe, inequality and chronic illness in Bangladesh. PLoS ONE
8: e56873.
60. Boutayeb A, Boutayeb S (2005) The burden of non-communicable diseases in
developing countries. Int J Equity Health 4: 2.
61. Xu K, Evans DB, Carrin G, Aguilar-Rivera AM, Musgrove P, et al. (2007)
Protecting households from catastrophic health spending. Health Aff (Millwood)
26: 972–983.
62. Murray C, Xu K, Klavus J, Kawabata K, Hanvoravongchai P, et al. (2006)
Assessing the distribution of household financial contributions to the health
system: concepts and empirical application. In: CJ. Murray, Evans DB, editors.
Health system performance assessment: debates, methods, and empiricism. pp.
512–531.
63. O’Donnell O, van Doorslaer E, Wagstaff A, Linelow M (2008) Analyzing health
equity using household survey data. a guide to techniques and their
implementation. Washington (District of Columbia): World Bank. Available:
http://elibrary.worldbank.org/doi/book/10.1596/978-0-8213-6933-3. Ac-
cessed 12 June 2014.
64. International Monetary Fund (2011) World economic outlook: September
2011—slowing growth, rising risks. Available: http://www.imf.org/external/
pubs/ft/weo/2011/02/pdf/text.pdf. Accessed 12 June 2014.
Catastrophic TB Costs Are Associated with Adverse TB Outcome in Peru
PLOS Medicine | www.plosmedicine.org 16 July 2014 | Volume 11 | Issue 7 | e1001675
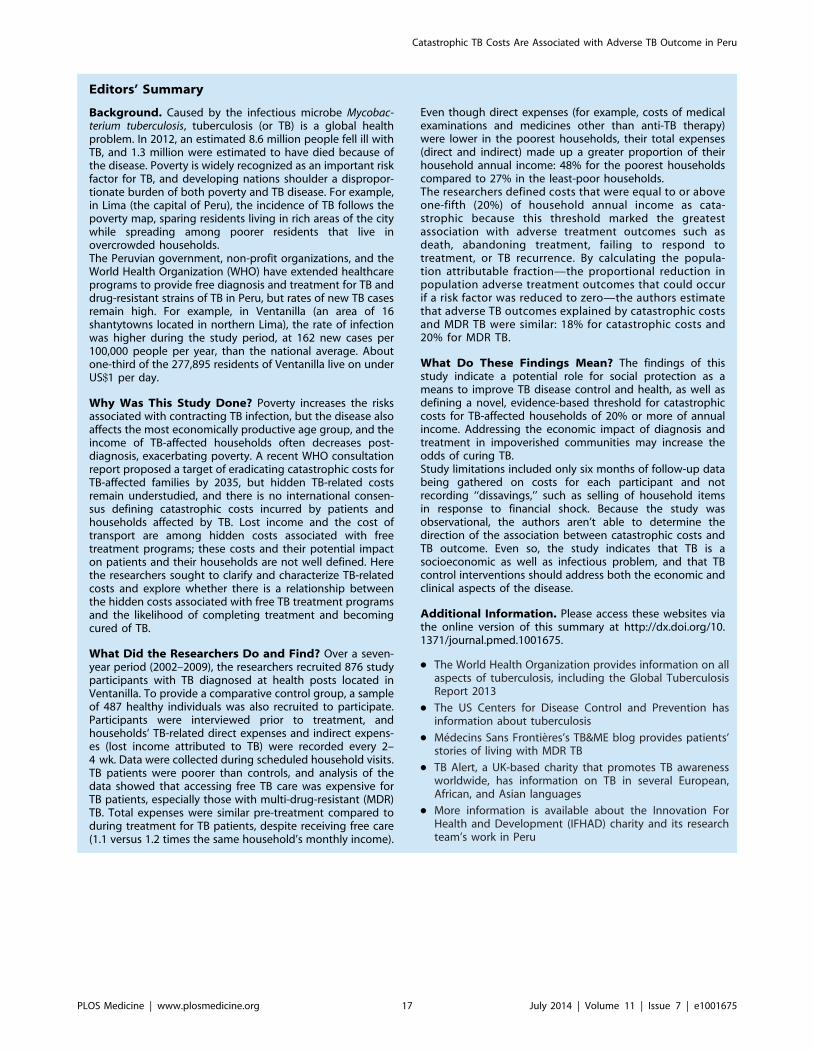
Editors’ Summary
Background. Caused by the infectious microbe Mycobac-terium tuberculosis, tuberculosis (or TB) is a global healthproblem. In 2012, an estimated 8.6 million people fell ill withTB, and 1.3 million were estimated to have died because ofthe disease. Poverty is widely recognized as an important riskfactor for TB, and developing nations shoulder a dispropor-tionate burden of both poverty and TB disease. For example,in Lima (the capital of Peru), the incidence of TB follows thepoverty map, sparing residents living in rich areas of the citywhile spreading among poorer residents that live inovercrowded households.The Peruvian government, non-profit organizations, and theWorld Health Organization (WHO) have extended healthcareprograms to provide free diagnosis and treatment for TB anddrug-resistant strains of TB in Peru, but rates of new TB casesremain high. For example, in Ventanilla (an area of 16shantytowns located in northern Lima), the rate of infectionwas higher during the study period, at 162 new cases per100,000 people per year, than the national average. Aboutone-third of the 277,895 residents of Ventanilla live on underUS$1 per day.
Why Was This Study Done? Poverty increases the risksassociated with contracting TB infection, but the disease alsoaffects the most economically productive age group, and theincome of TB-affected households often decreases post-diagnosis, exacerbating poverty. A recent WHO consultationreport proposed a target of eradicating catastrophic costs forTB-affected families by 2035, but hidden TB-related costsremain understudied, and there is no international consen-sus defining catastrophic costs incurred by patients andhouseholds affected by TB. Lost income and the cost oftransport are among hidden costs associated with freetreatment programs; these costs and their potential impacton patients and their households are not well defined. Herethe researchers sought to clarify and characterize TB-relatedcosts and explore whether there is a relationship betweenthe hidden costs associated with free TB treatment programsand the likelihood of completing treatment and becomingcured of TB.
What Did the Researchers Do and Find? Over a seven-year period (2002–2009), the researchers recruited 876 studyparticipants with TB diagnosed at health posts located inVentanilla. To provide a comparative control group, a sampleof 487 healthy individuals was also recruited to participate.Participants were interviewed prior to treatment, andhouseholds’ TB-related direct expenses and indirect expens-es (lost income attributed to TB) were recorded every 2–4 wk. Data were collected during scheduled household visits.TB patients were poorer than controls, and analysis of thedata showed that accessing free TB care was expensive forTB patients, especially those with multi-drug-resistant (MDR)TB. Total expenses were similar pre-treatment compared toduring treatment for TB patients, despite receiving free care(1.1 versus 1.2 times the same household’s monthly income).
Even though direct expenses (for example, costs of medicalexaminations and medicines other than anti-TB therapy)were lower in the poorest households, their total expenses(direct and indirect) made up a greater proportion of theirhousehold annual income: 48% for the poorest householdscompared to 27% in the least-poor households.The researchers defined costs that were equal to or aboveone-fifth (20%) of household annual income as cata-strophic because this threshold marked the greatestassociation with adverse treatment outcomes such asdeath, abandoning treatment, failing to respond totreatment, or TB recurrence. By calculating the popula-tion attributable fraction—the proportional reduction inpopulation adverse treatment outcomes that could occurif a risk factor was reduced to zero—the authors estimatethat adverse TB outcomes explained by catastrophic costsand MDR TB were similar: 18% for catastrophic costs and20% for MDR TB.
What Do These Findings Mean? The findings of thisstudy indicate a potential role for social protection as ameans to improve TB disease control and health, as well asdefining a novel, evidence-based threshold for catastrophiccosts for TB-affected households of 20% or more of annualincome. Addressing the economic impact of diagnosis andtreatment in impoverished communities may increase theodds of curing TB.Study limitations included only six months of follow-up databeing gathered on costs for each participant and notrecording ‘‘dissavings,’’ such as selling of household itemsin response to financial shock. Because the study wasobservational, the authors aren’t able to determine thedirection of the association between catastrophic costs andTB outcome. Even so, the study indicates that TB is asocioeconomic as well as infectious problem, and that TBcontrol interventions should address both the economic andclinical aspects of the disease.
Additional Information. Please access these websites viathe online version of this summary at http://dx.doi.org/10.1371/journal.pmed.1001675.
N The World Health Organization provides information on allaspects of tuberculosis, including the Global TuberculosisReport 2013
N The US Centers for Disease Control and Prevention hasinformation about tuberculosis
N Medecins Sans Frontieres’s TB&ME blog provides patients’stories of living with MDR TB
N TB Alert, a UK-based charity that promotes TB awarenessworldwide, has information on TB in several European,African, and Asian languages
N More information is available about the Innovation ForHealth and Development (IFHAD) charity and its researchteam’s work in Peru
Catastrophic TB Costs Are Associated with Adverse TB Outcome in Peru
PLOS Medicine | www.plosmedicine.org 17 July 2014 | Volume 11 | Issue 7 | e1001675