Embed Size (px)
Citation preview


14 North Carolina Agricultural Statistics
DEFINITIONS & METHODOLOGY
Cash receipts for agricultural commodities are defined as the gross income from sales of crops, livestock, and livestock products during a calendar year. The USDA, Economic Research Service (ERS) uses USDA, National Agricultural Statistics Service (NASS) estimates to develop state level cash receipts. The county level cash receipts in this publication are based on the ERS state level cash receipts and various county data. To ensure respondent confidentiality, estimates at any level, including county estimates, are not published if those estimates would disclose any information about individual operations. More information about ERS and NASS data can be found at the following websites:
http://www.ers.usda.gov/data-products/farm-income-and-wealth-statisticshttp://www.nass.usda.gov/Data_and_Statistics/

North Carolina Agricultural Statistics 15
SOURCE OF FARM CASH RECEIPTS, NORTH CAROLINA, 2017$11,432,976,000
Tobacco, 6.0%
All Other Livestock, 1.3%
Dairy Products, 1.6%
Cattle & Calves, 2.6%
Hogs, 20.5%
All Other Poultry, 0.1%Chicken Eggs, 4.0%
Turkeys, 6.5%
Broilers, 31.2%
Vegetables,Fruits, Nuts &Berries, 6.3%
Cotton, 1.8%
Corn, 4.3%
Wheat, 0.8%Peanuts, 0.7%
Soybeans, 5.3%
All Other Crops, Christmas Trees, Nursery,
7.1%
Livestock,Dairy
& Poultry,67.7%
Crops,32.3%
1 All Other Crops includes hay, greenhouse, floriculture, nursery, cut Christmas trees, mushrooms and other miscellaneous crops.
COUNTY CASH RECEIPTS FROM FARM MARKETINGS, 2017Includes Crops, Livestock & Government Payments
Under 20.0
20.0 to 49.9
50.0 to 99.9
100.0 to 149.9
150.0 to 199.9
200.0 and up
Million Dollars
16 North Carolina Agricultural Statistics
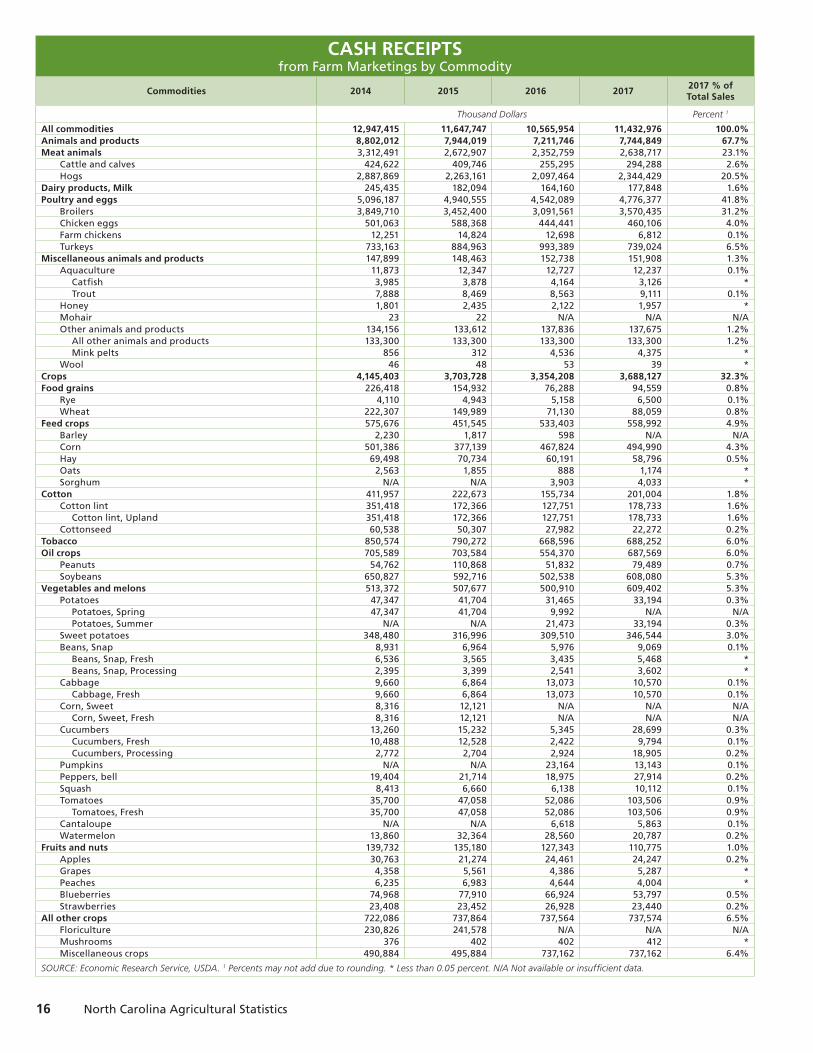
CASH RECEIPTSfrom Farm Marketings by Commodity
Commodities 2014 2015 2016 20172017 % ofTotal Sales
Thousand Dollars Percent 1
All commodities 12,947,415 11,647,747 10,565,954 11,432,976 100.0%Animals and products 8,802,012 7,944,019 7,211,746 7,744,849 67.7%Meat animals 3,312,491 2,672,907 2,352,759 2,638,717 23.1%
Cattle and calves 424,622 409,746 255,295 294,288 2.6%Hogs 2,887,869 2,263,161 2,097,464 2,344,429 20.5%
Dairy products, Milk 245,435 182,094 164,160 177,848 1.6%Poultry and eggs 5,096,187 4,940,555 4,542,089 4,776,377 41.8%
Broilers 3,849,710 3,452,400 3,091,561 3,570,435 31.2%Chicken eggs 501,063 588,368 444,441 460,106 4.0%Farm chickens 12,251 14,824 12,698 6,812 0.1%Turkeys 733,163 884,963 993,389 739,024 6.5%
Miscellaneous animals and products 147,899 148,463 152,738 151,908 1.3%Aquaculture 11,873 12,347 12,727 12,237 0.1%
Catfish 3,985 3,878 4,164 3,126 *Trout 7,888 8,469 8,563 9,111 0.1%
Honey 1,801 2,435 2,122 1,957 *Mohair 23 22 N/A N/A N/AOther animals and products 134,156 133,612 137,836 137,675 1.2%
All other animals and products 133,300 133,300 133,300 133,300 1.2%Mink pelts 856 312 4,536 4,375 *
Wool 46 48 53 39 *Crops 4,145,403 3,703,728 3,354,208 3,688,127 32.3%Food grains 226,418 154,932 76,288 94,559 0.8%
Rye 4,110 4,943 5,158 6,500 0.1%Wheat 222,307 149,989 71,130 88,059 0.8%
Feed crops 575,676 451,545 533,403 558,992 4.9%Barley 2,230 1,817 598 N/A N/ACorn 501,386 377,139 467,824 494,990 4.3%Hay 69,498 70,734 60,191 58,796 0.5%Oats 2,563 1,855 888 1,174 *Sorghum N/A N/A 3,903 4,033 *
Cotton 411,957 222,673 155,734 201,004 1.8%Cotton lint 351,418 172,366 127,751 178,733 1.6%
Cotton lint, Upland 351,418 172,366 127,751 178,733 1.6%Cottonseed 60,538 50,307 27,982 22,272 0.2%
Tobacco 850,574 790,272 668,596 688,252 6.0%Oil crops 705,589 703,584 554,370 687,569 6.0%
Peanuts 54,762 110,868 51,832 79,489 0.7%Soybeans 650,827 592,716 502,538 608,080 5.3%
Vegetables and melons 513,372 507,677 500,910 609,402 5.3%Potatoes 47,347 41,704 31,465 33,194 0.3%
Potatoes, Spring 47,347 41,704 9,992 N/A N/APotatoes, Summer N/A N/A 21,473 33,194 0.3%
Sweet potatoes 348,480 316,996 309,510 346,544 3.0%Beans, Snap 8,931 6,964 5,976 9,069 0.1%
Beans, Snap, Fresh 6,536 3,565 3,435 5,468 *Beans, Snap, Processing 2,395 3,399 2,541 3,602 *
Cabbage 9,660 6,864 13,073 10,570 0.1%Cabbage, Fresh 9,660 6,864 13,073 10,570 0.1%
Corn, Sweet 8,316 12,121 N/A N/A N/ACorn, Sweet, Fresh 8,316 12,121 N/A N/A N/A
Cucumbers 13,260 15,232 5,345 28,699 0.3%Cucumbers, Fresh 10,488 12,528 2,422 9,794 0.1%Cucumbers, Processing 2,772 2,704 2,924 18,905 0.2%
Pumpkins N/A N/A 23,164 13,143 0.1%Peppers, bell 19,404 21,714 18,975 27,914 0.2%Squash 8,413 6,660 6,138 10,112 0.1%Tomatoes 35,700 47,058 52,086 103,506 0.9%
Tomatoes, Fresh 35,700 47,058 52,086 103,506 0.9%Cantaloupe N/A N/A 6,618 5,863 0.1%Watermelon 13,860 32,364 28,560 20,787 0.2%
Fruits and nuts 139,732 135,180 127,343 110,775 1.0%Apples 30,763 21,274 24,461 24,247 0.2%Grapes 4,358 5,561 4,386 5,287 *Peaches 6,235 6,983 4,644 4,004 *Blueberries 74,968 77,910 66,924 53,797 0.5%Strawberries 23,408 23,452 26,928 23,440 0.2%
All other crops 722,086 737,864 737,564 737,574 6.5%Floriculture 230,826 241,578 N/A N/A N/AMushrooms 376 402 402 412 *Miscellaneous crops 490,884 495,884 737,162 737,162 6.4%
SOURCE: Economic Research Service, USDA. 1 Percents may not add due to rounding. * Less than 0.05 percent. N/A Not available or insufficient data.

North Carolina Agricultural Statistics 17
FARM INCOME 1 Cash Receipts from Farm Marketings and Government Payments, 2017
State
Livestock, Dairyand Poultry
Crops TotalGovernmentPayments 2 Total Cash Receipts
Receipts Rank Receipts Rank Receipts Rank Receipts Rank Receipts Rank
Receipts in Million Dollars
Alabama 4,393.3 14 1,106.2 33 5,499.5 26 204.9 20 5,704.4 26Alaska 7.4 50 29.8 50 37.2 50 6.6 47 43.8 50Arizona 1,750.7 29 3,089.8 20 4,840.6 28 34.7 38 4,875.2 29Arkansas 5,316.6 10 3,708.6 16 9,025.1 14 650.2 4 9,675.3 13California 11,187.1 4 38,945.0 1 50,132.0 1 178.7 22 50,310.7 1Colorado 4,612.4 12 2,168.8 26 6,781.1 22 268.7 18 7,049.8 21Connecticut 175.4 44 357.0 41 532.4 46 5.0 49 537.4 46Delaware 1,072.8 39 281.5 43 1,354.4 39 22.1 39 1,376.5 39Florida 1,760.6 28 5,706.8 11 7,467.4 18 91.8 30 7,559.2 19Georgia 5,836.7 9 3,013.5 21 8,850.2 15 391.7 11 9,241.9 15Hawaii 161.8 45 505.3 38 667.0 44 11.5 43 678.6 44Idaho 4,380.5 15 2,962.5 22 7,343.0 20 162.4 24 7,505.3 20Illinois 2,579.0 24 14,031.4 2 16,610.4 6 609.0 6 17,219.4 6Indiana 3,728.3 18 6,907.7 8 10,636.0 10 373.2 13 11,009.2 10Iowa 13,409.7 2 13,570.2 3 26,979.8 2 691.4 3 27,671.2 2Kansas 9,529.5 5 6,314.4 10 15,843.9 7 621.9 5 16,465.8 7Kentucky 3,199.3 23 2,486.4 23 5,685.7 25 169.4 23 5,855.1 25Louisiana 1,096.2 37 1,997.6 28 3,093.8 33 293.4 16 3,387.1 33Maine 312.5 43 392.8 40 705.2 43 13.4 41 718.6 43Maryland 1,337.5 34 869.2 36 2,206.7 36 58.0 35 2,264.8 36Massachusetts 114.0 48 267.5 44 381.5 47 6.8 46 388.3 47Michigan 3,226.9 22 4,156.6 15 7,383.5 19 200.6 21 7,584.1 18Minnesota 7,582.8 8 9,704.1 4 17,286.9 5 460.9 9 17,747.8 5Mississippi 3,332.4 21 2,399.9 25 5,732.3 24 311.9 15 6,044.3 24Missouri 4,536.3 13 5,472.1 12 10,008.4 12 423.2 10 10,431.6 12Montana 1,709.8 30 1,804.7 30 3,514.5 31 374.6 12 3,889.0 30Nebraska 12,463.8 3 8,993.0 5 21,456.8 4 803.4 2 22,260.3 4Nevada 476.2 42 170.9 46 647.1 45 9.3 45 656.4 45New Hampshire 114.2 47 94.1 48 208.3 48 6.3 48 214.7 48New Jersey 133.6 46 948.9 34 1,082.5 40 12.3 42 1,094.8 40New Mexico 2,218.7 27 732.2 37 2,950.9 34 96.1 29 3,047.0 34New York 3,340.3 20 1,877.1 29 5,217.5 27 76.1 33 5,293.6 27North Carolina 7,744.8 7 3,688.1 17 11,433.0 8 156.3 25 11,589.3 8North Dakota 1,240.9 36 6,836.4 9 8,077.2 17 588.4 7 8,665.6 17Ohio 3,389.7 19 5,248.8 13 8,638.6 16 358.5 14 8,997.0 16Oklahoma 5,215.2 11 1,467.9 31 6,683.1 23 289.1 17 6,972.3 22Oregon 1,558.5 31 3,202.3 19 4,760.8 29 123.6 28 4,884.4 28Pennsylvania 4,316.7 16 2,482.8 24 6,799.5 21 88.4 31 6,887.9 23Rhode Island 22.7 49 48.9 49 71.6 49 2.8 50 74.4 49South Carolina 1,367.5 33 935.3 35 2,302.8 35 85.0 32 2,387.8 35South Dakota 3,907.0 17 5,132.9 14 9,040.0 13 566.3 8 9,606.2 14Tennessee 1,405.4 32 2,128.1 27 3,533.6 30 150.0 26 3,683.6 31Texas 14,337.4 1 8,564.1 6 22,901.5 3 936.6 1 23,838.1 3Utah 1,324.4 35 414.3 39 1,738.8 37 47.0 37 1,785.8 37Vermont 617.0 40 198.7 45 815.7 41 10.7 44 826.4 41Virginia 2,326.0 26 1,157.7 32 3,483.8 32 75.9 34 3,559.7 32Washington 2,536.5 25 7,799.4 7 10,335.9 11 212.9 19 10,548.8 11West Virginia 560.5 41 148.2 47 708.7 42 17.8 40 726.5 42Wisconsin 7,972.0 6 3,439.3 18 11,411.4 9 134.4 27 11,545.8 9Wyoming 1,095.7 38 347.9 42 1,443.5 38 48.3 36 1,491.9 38United States 176,034.3 - 198,306.8 - 374,341.1 - 11,531.6 - 385,872.7 -
SOURCE: Economic Research Service, USDA. Note: Farm Forest Products are not included in cash receipts but are included in other farm-related income. 1 Totals may not equal sum of states due to rounding. 2 Amounts include cash payments made directly to farmers, not including Farmer-owned Reserve Payments as these data are not available by State. Amounts also include certificate exchange gains and marketing loan gains.

18 North Carolina Agricultural Statistics
CASH RECEIPTS AND GOVERNMENT PAYMENTSYear
All Commodities
Livestock, Dairy & Poultry
CropsGovernment
PaymentsYear
All Commodities
Livestock, Dairy & Poultry
CropsGovernment
Payments
Million Dollars Million Dollars
1938 216.2 35.0 181.2 16.5 1978 3,156.8 1,274.1 1,882.7 34.81939 219.5 34.6 184.9 19.9 1979 3,229.4 1,389.4 1,840.0 8.31940 201.2 33.9 167.3 14.9 1980 3,427.5 1,447.1 1,980.4 13.21941 238.1 44.3 238.8 14.5 1981 3,953.7 1,604.2 2,349.5 15.51942 424.2 64.9 359.3 22.4 1982 3,914.3 1,620.6 2,293.7 16.5
1943 482.5 99.6 383.0 14.3 1983 3,633.7 1,683.4 1,950.3 67.11944 611.4 107.4 504.0 16.4 1984 4,187.8 1,928.3 2,259.5 71.91945 629.1 120.9 508.2 9.3 1985 3,931.2 1,957.7 1,973.4 42.61946 745.4 119.9 625.5 9.7 1986 3,764.9 2,171.1 1,593.8 90.31947 759.5 135.2 624.3 8.1 1987 3,767.4 2,115.2 1,652.2 190.2
1948 783.1 153.0 630.1 7.9 1988 4,150.3 2,182.0 1,968.4 146.01949 739.3 156.5 582.8 7.6 1989 4,630.9 2,517.5 2,113.4 93.91950 829.7 164.7 665.0 8.8 1990 5,230.9 2,645.7 2,585.2 73.31951 967.6 197.7 769.9 8.0 1991 5,263.0 2,622.9 2,640.1 52.81952 942.1 203.2 738.9 6.8 1992 5,561.6 2,784.2 2,777.4 74.8
1953 922.0 222.3 699.7 3.9 1993 6,017.6 3,168.5 2,849.1 132.41954 934.4 224.5 709.9 6.1 1994 6,427.7 3,327.7 3,100.0 77.61955 938.4 222.2 716.2 7.3 1995 6,897.8 3,731.0 3,166.8 41.51956 976.7 235.9 740.8 10.5 1996 7,869.4 4,441.5 3,427.9 78.41957 840.1 260.9 579.2 26.4 1997 8,227.1 4,723.3 3,503.7 87.7
1958 971.8 299.6 672.2 37.5 1998 7,185.1 3,956.4 3,228.8 129.41959 946.2 283.4 662.7 10.6 1999 6,695.4 3,839.6 2,855.8 290.51960 1,047.5 312.4 735.0 12.8 2000 7,308.6 4,299.9 3,008.7 449.11961 1,117.3 325.2 792.1 32.0 2001 7,581.3 4,654.5 2,926.7 410.61962 1,144.6 346.5 798.0 39.5 2002 6,590.1 3,939.7 2,650.4 339.9
1963 1,161.8 351.0 810.8 31.8 2003 6,932.9 4,183.7 2,749.3 363.91964 1,221.3 364.9 856.5 35.2 2004 8,203.6 5,355.6 2,848.0 209.51965 1,164.8 398.0 766.9 43.4 2005 8,147.4 5,620.8 2,526.6 1,194.21966 1,278.5 475.8 802.7 62.8 2006 7,901.8 5,175.7 2,726.1 738.41967 1,292.7 460.7 832.0 61.7 2007 8,805.2 5,900.8 2,904.5 569.8
1968 1,247.0 504.9 742.1 61.6 2008 9,472.1 6,293.9 3,178.2 518.61969 1,408.7 596.2 812.5 69.8 2009 9,108.0 5,668.2 3,439.8 456.11970 1,500.6 600.6 900.0 59.7 2010 9,777.0 6,333.6 3,443.4 438.41971 1,481.7 580.8 900.9 41.0 2011 10,333.0 6,802.1 3,530.9 401.11972 1,632.5 635.7 996.8 57.5 2012 11,549.4 7,344.2 4,205.2 430.4
1973 2,326.2 964.3 1,361.9 35.9 2013 12,672.2 8,305.6 4,366.6 411.31974 2,582.5 919.0 1,663.5 8.1 2014 12,947.4 8,802.0 4,145.4 346.11975 2,626.1 989.1 1,637.0 8.9 2015 11,647.7 7,944.0 3,703.7 91.11976 2,833.7 1,076.9 1,756.8 7.8 2016 10,566.0 7,211.7 3,354.2 180.11977 2,630.3 1,062.3 1,568.0 21.6 2017 11,433.0 7,744.8 3,688.1 156.3
SOURCE: Economic Research Service, USDA
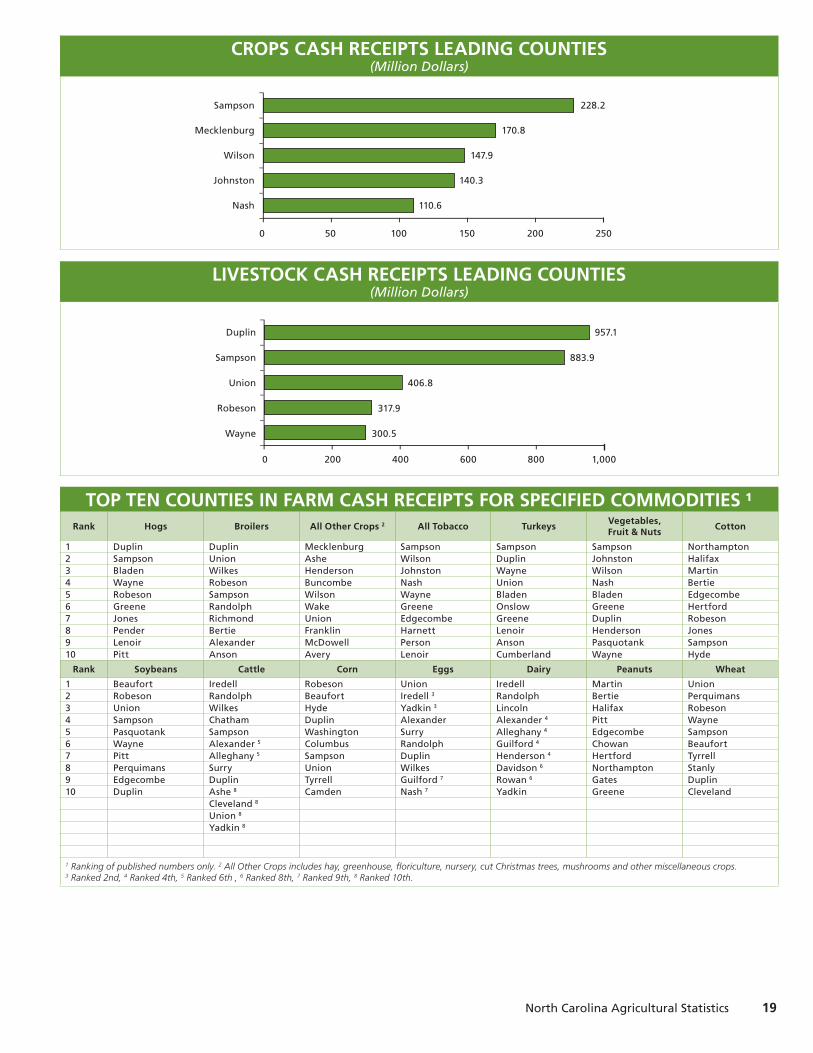
TOP TEN COUNTIES IN FARM CASH RECEIPTSLivestock Crops Total 1
County Thousand Dollars County Thousand Dollars County Thousand Dollars
Duplin 957,082 Sampson 228,167 Sampson 1,117,985Sampson 883,867 Mecklenburg 170,762 Duplin 1,063,120Union 406,785 Johnston 147,888 Union 492,755Wayne 317,881 Wilson 140,312 Wayne 415,798Robeson 300,526 Nash 110,629 Robeson 414,170Bladen 286,662 Wayne 108,898 Bladen 364,634Wilkes 267,860 Duplin 99,989 Wilkes 282,548Randolph 217,884 Edgecombe 91,532 Johnston 251,581Anson 181,494 Robeson 91,483 Greene 239,617Alexander 179,523 Greene 90,737 Randolph 235,5121 Includes government payments.
North Carolina Agricultural Statistics 19
CROPS CASH RECEIPTS LEADING COUNTIES(Million Dollars)
0 50 100 150 200 250
Nash
Wilson
Johnston
Mecklenburg
Sampson
110.6
140.3
147.9
170.8
228.2
LIVESTOCK CASH RECEIPTS LEADING COUNTIES(Million Dollars)
0 200 400 600 800 1,000
Robeson
Wayne
Union
Sampson
Duplin
300.5
317.9
406.8
883.9
957.1
TOP TEN COUNTIES IN FARM CASH RECEIPTS FOR SPECIFIED COMMODITIES 1Rank Hogs Broilers All Other Crops 2 All Tobacco Turkeys
Vegetables,Fruit & Nuts
Cotton
1 Duplin Duplin Mecklenburg Sampson Sampson Sampson Northampton2 Sampson Union Ashe Wilson Duplin Johnston Halifax3 Bladen Wilkes Henderson Johnston Wayne Wilson Martin4 Wayne Robeson Buncombe Nash Union Nash Bertie5 Robeson Sampson Wilson Wayne Bladen Bladen Edgecombe6 Greene Randolph Wake Greene Onslow Greene Hertford7 Jones Richmond Union Edgecombe Greene Duplin Robeson8 Pender Bertie Franklin Harnett Lenoir Henderson Jones9 Lenoir Alexander McDowell Person Anson Pasquotank Sampson10 Pitt Anson Avery Lenoir Cumberland Wayne Hyde
Rank Soybeans Cattle Corn Eggs Dairy Peanuts Wheat
1 Beaufort Iredell Robeson Union Iredell Martin Union2 Robeson Randolph Beaufort Iredell 3 Randolph Bertie Perquimans3 Union Wilkes Hyde Yadkin 3 Lincoln Halifax Robeson4 Sampson Chatham Duplin Alexander Alexander 4 Pitt Wayne5 Pasquotank Sampson Washington Surry Alleghany 4 Edgecombe Sampson6 Wayne Alexander 5 Columbus Randolph Guilford 4 Chowan Beaufort7 Pitt Alleghany 5 Sampson Duplin Henderson 4 Hertford Tyrrell8 Perquimans Surry Union Wilkes Davidson 6 Northampton Stanly9 Edgecombe Duplin Tyrrell Guilford 7 Rowan 6 Gates Duplin10 Duplin Ashe 8 Camden Nash 7 Yadkin Greene Cleveland
Cleveland 8
Union 8
Yadkin 8
1 Ranking of published numbers only. 2 All Other Crops includes hay, greenhouse, floriculture, nursery, cut Christmas trees, mushrooms and other miscellaneous crops. 3 Ranked 2nd, 4 Ranked 4th, 5 Ranked 6th , 6 Ranked 8th, 7 Ranked 9th, 8 Ranked 10th.
20 North Carolina Agricultural Statistics
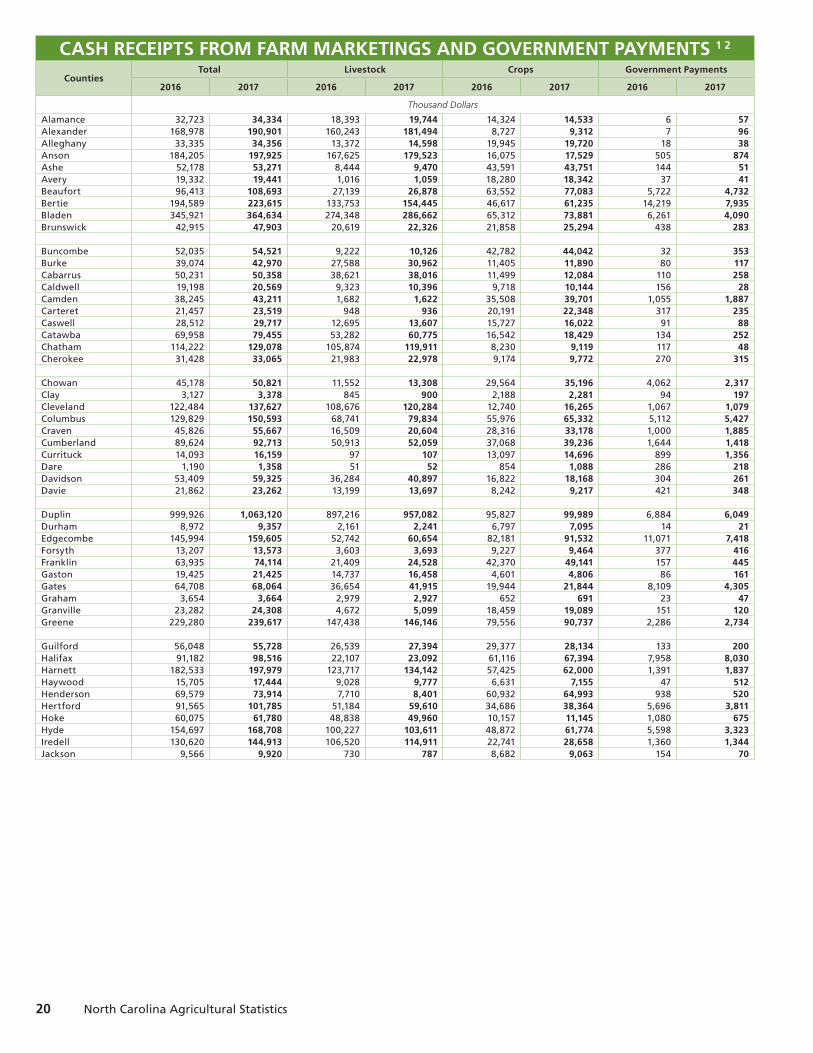
CASH RECEIPTS FROM FARM MARKETINGS AND GOVERNMENT PAYMENTS 1 2
CountiesTotal Livestock Crops Government Payments
2016 2017 2016 2017 2016 2017 2016 2017
Thousand Dollars
Alamance 32,723 34,334 18,393 19,744 14,324 14,533 6 57Alexander 168,978 190,901 160,243 181,494 8,727 9,312 7 96Alleghany 33,335 34,356 13,372 14,598 19,945 19,720 18 38Anson 184,205 197,925 167,625 179,523 16,075 17,529 505 874Ashe 52,178 53,271 8,444 9,470 43,591 43,751 144 51Avery 19,332 19,441 1,016 1,059 18,280 18,342 37 41Beaufort 96,413 108,693 27,139 26,878 63,552 77,083 5,722 4,732Bertie 194,589 223,615 133,753 154,445 46,617 61,235 14,219 7,935Bladen 345,921 364,634 274,348 286,662 65,312 73,881 6,261 4,090Brunswick 42,915 47,903 20,619 22,326 21,858 25,294 438 283
Buncombe 52,035 54,521 9,222 10,126 42,782 44,042 32 353Burke 39,074 42,970 27,588 30,962 11,405 11,890 80 117Cabarrus 50,231 50,358 38,621 38,016 11,499 12,084 110 258Caldwell 19,198 20,569 9,323 10,396 9,718 10,144 156 28Camden 38,245 43,211 1,682 1,622 35,508 39,701 1,055 1,887Carteret 21,457 23,519 948 936 20,191 22,348 317 235Caswell 28,512 29,717 12,695 13,607 15,727 16,022 91 88Catawba 69,958 79,455 53,282 60,775 16,542 18,429 134 252Chatham 114,222 129,078 105,874 119,911 8,230 9,119 117 48Cherokee 31,428 33,065 21,983 22,978 9,174 9,772 270 315
Chowan 45,178 50,821 11,552 13,308 29,564 35,196 4,062 2,317Clay 3,127 3,378 845 900 2,188 2,281 94 197Cleveland 122,484 137,627 108,676 120,284 12,740 16,265 1,067 1,079Columbus 129,829 150,593 68,741 79,834 55,976 65,332 5,112 5,427Craven 45,826 55,667 16,509 20,604 28,316 33,178 1,000 1,885Cumberland 89,624 92,713 50,913 52,059 37,068 39,236 1,644 1,418Currituck 14,093 16,159 97 107 13,097 14,696 899 1,356Dare 1,190 1,358 51 52 854 1,088 286 218Davidson 53,409 59,325 36,284 40,897 16,822 18,168 304 261Davie 21,862 23,262 13,199 13,697 8,242 9,217 421 348
Duplin 999,926 1,063,120 897,216 957,082 95,827 99,989 6,884 6,049Durham 8,972 9,357 2,161 2,241 6,797 7,095 14 21Edgecombe 145,994 159,605 52,742 60,654 82,181 91,532 11,071 7,418Forsyth 13,207 13,573 3,603 3,693 9,227 9,464 377 416Franklin 63,935 74,114 21,409 24,528 42,370 49,141 157 445Gaston 19,425 21,425 14,737 16,458 4,601 4,806 86 161Gates 64,708 68,064 36,654 41,915 19,944 21,844 8,109 4,305Graham 3,654 3,664 2,979 2,927 652 691 23 47Granville 23,282 24,308 4,672 5,099 18,459 19,089 151 120Greene 229,280 239,617 147,438 146,146 79,556 90,737 2,286 2,734
Guilford 56,048 55,728 26,539 27,394 29,377 28,134 133 200Halifax 91,182 98,516 22,107 23,092 61,116 67,394 7,958 8,030Harnett 182,533 197,979 123,717 134,142 57,425 62,000 1,391 1,837Haywood 15,705 17,444 9,028 9,777 6,631 7,155 47 512Henderson 69,579 73,914 7,710 8,401 60,932 64,993 938 520Hertford 91,565 101,785 51,184 59,610 34,686 38,364 5,696 3,811Hoke 60,075 61,780 48,838 49,960 10,157 11,145 1,080 675Hyde 154,697 168,708 100,227 103,611 48,872 61,774 5,598 3,323Iredell 130,620 144,913 106,520 114,911 22,741 28,658 1,360 1,344Jackson 9,566 9,920 730 787 8,682 9,063 154 70

North Carolina Agricultural Statistics 21
CASH RECEIPTS FROM FARM MARKETINGS AND GOVERNMENT PAYMENTS 1 2
CountiesTotal Livestock Crops Government Payments
2016 2017 2016 2017 2016 2017 2016 2017
Thousand Dollars
Johnston 233,121 251,581 97,766 107,586 133,552 140,312 1,803 3,683Jones 113,064 132,334 85,526 96,719 25,475 33,385 2,062 2,231Lee 35,082 36,832 19,796 22,318 15,223 14,345 63 169Lenoir 190,819 191,170 125,368 120,871 64,142 68,419 1,310 1,880Lincoln 52,416 59,326 45,483 51,858 6,832 7,219 101 249McDowell 26,953 27,737 8,429 9,155 18,491 18,526 33 56Macon 11,079 10,968 8,689 8,502 2,255 2,283 135 182Madison 6,439 7,116 2,320 2,624 4,106 4,259 13 233Martin 79,778 85,078 15,981 17,888 47,877 59,693 15,920 7,497Mecklenburg 174,545 174,660 3,912 3,874 170,633 170,762 * 25
Mitchell 2,664 2,764 567 620 2,090 2,142 6 1Montgomery 107,669 123,047 99,582 114,728 7,834 8,291 253 28Moore 136,030 155,417 119,211 138,632 16,732 16,721 86 65Nash 169,452 190,101 67,183 76,460 98,684 110,629 3,585 3,012New Hanover 6,186 6,083 227 229 5,949 5,816 10 39Northampton 113,148 126,376 61,052 70,543 44,048 49,738 8,048 6,095Onslow 151,731 143,801 126,551 117,081 24,927 25,744 252 976Orange 36,018 36,529 18,296 19,119 17,504 17,328 219 81Pamlico 22,821 27,241 719 698 20,013 24,818 2,090 1,725Pasquotank 57,974 66,187 402 398 56,874 64,273 698 1,516
Pender 153,556 172,689 117,142 132,543 36,093 38,828 321 1,318Perquimans 81,420 92,793 44,440 50,232 34,226 39,721 2,754 2,840Person 34,644 36,333 4,725 5,176 29,869 30,951 51 206Pitt 189,041 209,195 110,031 121,292 70,283 81,995 8,727 5,908Polk 10,279 10,490 4,555 4,673 5,574 5,696 150 121Randolph 209,448 235,512 192,309 217,884 16,918 17,449 221 178Richmond 160,566 183,742 154,044 176,694 6,180 6,866 343 183Robeson 360,852 415,798 275,173 317,881 82,174 91,483 3,504 6,433Rockingham 28,919 29,642 6,570 7,550 22,237 21,868 111 225Rowan 70,146 76,447 33,231 37,339 36,307 38,340 608 767
Rutherford 24,935 28,711 21,927 25,033 2,772 3,270 236 409Sampson 1,095,368 1,117,985 880,606 883,867 209,059 228,167 5,703 5,951Scotland 84,393 95,002 72,183 82,066 11,137 12,101 1,073 835Stanly 88,493 85,280 59,136 60,359 27,608 23,498 1,749 1,423Stokes 27,316 28,080 14,275 15,238 12,980 12,821 61 21Surry 174,177 194,107 137,562 156,354 35,998 37,211 618 541Swain 1,198 1,215 859 835 322 345 18 35Transylvania 25,346 25,677 7,541 7,374 17,801 18,249 4 54Tyrrell 46,572 57,591 6,009 7,194 37,053 47,823 3,510 2,574Union 466,088 492,755 391,173 406,785 73,892 82,451 1,023 3,520
Vance 13,315 13,123 719 768 12,480 12,180 116 174Wake 57,130 56,719 7,891 7,959 48,574 48,300 665 460Warren 23,807 25,637 12,177 13,330 11,444 12,079 185 228Washington 71,955 80,974 18,722 18,231 48,117 58,539 5,117 4,204Watauga 13,013 13,803 6,451 7,062 6,498 6,551 64 190Wayne 417,094 414,170 314,247 300,526 99,133 108,898 3,714 4,745Wilkes 247,297 282,548 233,949 267,860 12,938 14,508 409 180Wilson 141,929 163,293 9,834 12,599 129,081 147,888 3,015 2,806Yadkin 100,080 109,129 72,228 78,602 25,734 29,024 2,118 1,503Yancey 6,070 6,517 1,732 1,943 4,330 4,369 9 205
Published Counties 10,746,963 11,589,276 7,211,746 7,744,849 3,354,208 3,688,127 181,008 156,298Other Counties * * * * * * * *
State Total 10,746,963 11,589,276 7,211,746 7,744,849 3,354,208 3,688,127 181,008 156,2981 Cash receipts from farm marketings represent gross returns from the actual sales of crops and livestock products during the calendar year. 2 Totals may not equal sum of counties due to rounding. *Cash receipts are not published for some counties to avoid disclosure of individual farming operations. USDA NASS County Estimating Program Policies and Standards apply.

22 North Carolina Agricultural Statistics
CASH RECEIPTS FROM FARM MARKETINGS AND GOVERNMENT PAYMENTS 1 2
CountiesBroilers Cattle & Calves Dairy Eggs
2016 2017 2016 2017 2016 2017 2016 2017
Thousand Dollars
Alamance 2,492 2,965 5,383 6,176 4,378 4,347 4,843 5,007Alexander 120,083 138,812 7,382 8,538 5,472 5,928 27,002 27,918Alleghany * * 7,382 8,538 5,837 5,928 * *Anson 110,265 127,209 3,445 3,997 * * 9,245 9,559Ashe * * 5,998 7,085 365 395 85 88Avery * * 461 509 * * * *Beaufort * * 400 436 * * * *Bertie 124,236 143,539 246 291 * * * *Bladen 42,671 49,422 954 1,090 * * * *Brunswick * * 584 654 * * 44 46
Buncombe 24 28 4,552 5,268 2,918 3,162 273 282Burke 20,580 23,637 1,292 1,490 * * 4,696 4,855Cabarrus 11,895 13,752 3,845 4,360 4,378 4,743 * *Caldwell 4,909 5,587 1,661 1,926 * * * *Camden * * 31 36 * * * *Carteret * * 92 109 * * 41 42Caswell * * 2,707 3,125 * * 8,218 8,649Catawba 42,671 49,422 4,091 4,723 1,459 1,581 2,348 2,428Chatham 75,146 86,811 11,842 13,624 4,013 4,743 9,098 9,407Cherokee * * 1,415 1,635 * * * *
Chowan 10,007 11,603 400 436 * * * *Clay * * 523 581 * * * *Cleveland 85,342 98,844 6,152 7,085 2,189 2,371 * *Columbus 11,517 13,323 2,707 3,125 * * 73 76Craven * * 308 363 * * * *Cumberland 8,119 9,455 892 1,017 * * * *Currituck * * 62 73 * * * *Dare * * * * * * * *Davidson 23,035 26,645 3,845 4,360 5,107 5,533 3,228 3,338Davie * * 3,199 3,633 1,824 1,976 3,228 3,338
Duplin 259,801 299,972 6,921 7,993 365 395 13,501 13,959Durham * * 677 763 365 395 73 76Edgecombe 25,867 29,868 646 727 * * * *Forsyth * * 1,169 1,344 * * 82 85Franklin 6,608 7,521 4,921 5,631 * * * *Gaston 8,496 9,670 2,338 2,689 2,554 2,767 572 592Gates 30,587 35,240 246 291 * * * *Graham * * 277 327 * * * *Granville * * 2,245 2,580 1,824 1,976 41 42Greene 12,273 14,182 461 509 * * * *
Guilford * * 4,460 5,086 5,107 5,928 10,419 10,773Halifax * * 3,076 3,633 * * * *Harnett 95,160 110,018 2,184 2,543 * * 47 49Haywood * * 3,137 3,633 4,013 4,347 47 49Henderson 5 6 1,599 1,853 5,472 5,928 56 58Hertford 40,783 46,844 92 109 * * * *Hoke 20,391 23,637 400 436 * * * *Hyde * * * * * * * *Iredell 7,175 8,380 15,225 17,439 47,424 51,378 33,752 34,898Jackson 12 13 523 581 * * 38 39

North Carolina Agricultural Statistics 23
CASH RECEIPTS FROM FARM MARKETINGS AND GOVERNMENT PAYMENTS 1 2
CountiesBroilers Cattle & Calves Dairy Eggs
2016 2017 2016 2017 2016 2017 2016 2017
Thousand Dollars
Johnston 35,119 40,612 3,999 4,541 * * 880 910Jones 11,140 12,893 338 400 * * * *Lee 15,105 17,405 1,169 1,381 * * * *Lenoir 7,741 9,025 707 799 * * 3,522 3,642Lincoln 29,643 34,381 4,460 5,268 10,214 11,066 100 103McDowell 3,776 4,298 769 872 * * 2,377 2,458Macon * * 861 981 * * 35 36Madison * * 1,846 2,144 * * 117 121Martin 10,007 11,603 246 291 * * * *Mecklenburg * * 646 727 * * * *
Mitchell * * 461 509 * * * *Montgomery 91,761 105,721 1,599 1,853 * * * *Moore 100,446 116,035 3,568 4,178 * * 939 971Nash 41,916 48,563 2,368 2,725 * * 10,419 10,773New Hanover * * * * * * * *Northampton 35,874 41,472 277 327 * * * *Onslow 20,014 22,992 584 654 * * * *Orange 54 62 3,076 3,633 2,554 2,767 4,843 5,007Pamlico * * 31 36 * * * *Pasquotank * * 92 109 * * * *
Pender 36,440 42,116 677 763 * * 4,549 4,704Perquimans 41,160 47,273 215 254 * * * *Person * * 2,399 2,761 * * * *Pitt 40,028 45,984 861 981 * * * *Polk * * 1,015 1,163 * * 38 39Randolph 138,208 159,440 13,995 16,168 16,416 17,785 15,849 16,387Richmond 135,187 156,432 584 654 * * 3,375 3,490Robeson 188,054 217,458 2,491 2,907 * * 59 61Rockingham * * 3,076 3,633 * * * *Rowan 16,993 19,554 5,690 6,721 5,107 5,533 1,761 1,821
Rutherford 18,314 21,058 2,338 2,689 * * 68 70Sampson 154,446 178,350 8,459 9,810 * * 8,805 9,104Scotland 47,958 55,439 400 436 * * * *Stanly 33,986 39,108 3,999 4,541 * * * *Stokes * * 3,999 4,541 * * 8,805 9,256Surry 104,600 120,762 7,074 8,175 * * 19,811 20,484Swain * * 123 145 * * * *Transylvania 9 11 738 836 * * 56 58Tyrrell * * 92 109 * * * *Union 243,186 280,632 6,152 7,085 * * 41,089 42,484
Vance * * 492 545 * * * *Wake 23 26 1,077 1,235 * * 100 103Warren * * 2,307 2,652 * * * *Washington * * 431 472 * * * *Watauga * * 4,460 5,086 * * 50 52Wayne 55,888 64,464 2,645 3,088 * * 2,818 2,913Wilkes 203,914 235,508 12,150 13,988 4,378 4,347 12,033 12,594Wilson * * 369 400 * * * *Yadkin 24,923 28,794 6,152 7,085 4,742 5,138 33,752 34,898Yancey * * 1,200 1,381 365 395 35 36
Published Counties 3,086,061 3,563,877 255,203 294,179 148,838 160,854 307,337 318,226Other Counties 5,500 6,558 92 109 15,322 16,994 137,104 141,880
State Total 3,091,561 3,570,435 255,295 294,288 164,160 177,848 444,441 460,1061 Cash receipts from farm marketings represent gross returns from the actual sales of crops and livestock products during the calendar year. 2 Totals may not equal sum of counties due to rounding. *Cash receipts are not published for some counties to avoid disclosure of individual farming operations. USDA NASS County Estimating Program Policies and Standards apply.

24 North Carolina Agricultural Statistics
CASH RECEIPTS FROM FARM MARKETINGS AND GOVERNMENT PAYMENTS 1 2
CountiesHogs Turkeys Other Livestock & Poultry
2016 2017 2016 2017 2016 2017
Thousand Dollars
Alamance * * * * 1,269 1,218Alexander * * * * 283 271Alleghany * * * * 85 81Anson 10,375 13,546 34,101 25,013 85 81Ashe * * * * 1,927 1,849Avery * * * * 409 392Beaufort 10,600 10,680 * * 15,171 14,555Bertie * * * * 472 453Bladen 166,895 187,554 60,789 45,478 361 347Brunswick 19,170 20,839 * * 821 787
Buncombe * * * * 1,223 1,173Burke * * * * 1,011 970Cabarrus * * * * 1,664 1,597Caldwell * * * * 1,249 1,198Camden * * * * 1,634 1,568Carteret * * * * 801 768Caswell * * * * 539 518Catawba * * * * 2,623 2,517Chatham 1,579 1,302 * * 4,182 4,012Cherokee * * * * 814 781
Chowan 1,128 1,250 * * 3 3Clay * * * * 264 254Cleveland 45 52 11,713 8,755 2,267 2,175Columbus 51,873 61,216 * * 643 617Craven 14,660 18,755 * * 1,488 1,427Cumberland 21,426 26,049 18,978 14,098 1,472 1,412Currituck * * * * 29 28Dare * * * * 35 34Davidson * * * * 954 915Davie * * * * 4,931 4,731
Duplin 462,344 520,984 154,198 113,696 86 83Durham * * * * 1,029 987Edgecombe 24,809 28,654 * * 889 853Forsyth * * * * 2,301 2,208Franklin 6,089 7,554 * * 1,866 1,790Gaston 113 104 * * 663 636Gates 5,413 5,991 * * 394 378Graham * * * * 2,662 2,554Granville 316 260 * * 240 230Greene 77,809 88,567 54,859 40,931 1,996 1,915
Guilford 1,804 1,042 * * 4,649 4,460Halifax 13,532 13,546 * * 746 715Harnett 22,553 18,234 * * 1,772 1,701Haywood * * * * 1,740 1,670Henderson * * * * 566 543Hertford * * * * 159 153Hoke 20,073 19,537 6,227 4,662 1,668 1,600Hyde * * * * 374 359Iredell * * * * 2,850 2,734Jackson * * * * 123 118
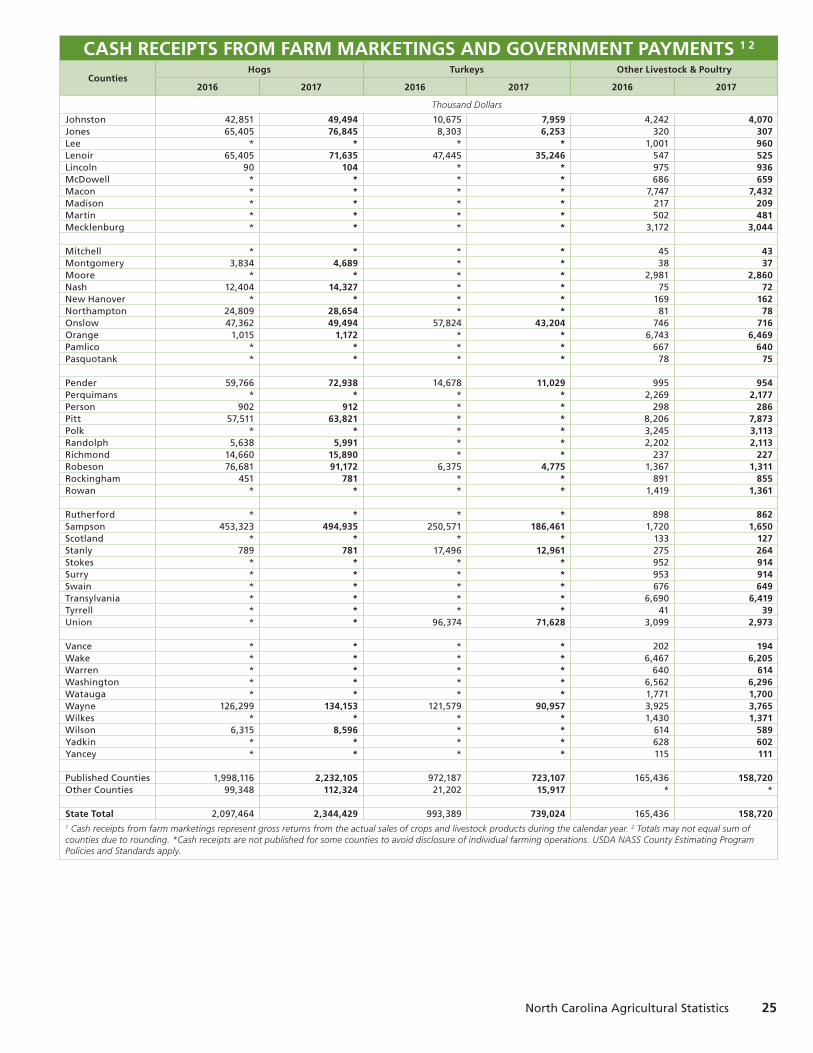
North Carolina Agricultural Statistics 25
CASH RECEIPTS FROM FARM MARKETINGS AND GOVERNMENT PAYMENTS 1 2
CountiesHogs Turkeys Other Livestock & Poultry
2016 2017 2016 2017 2016 2017
Thousand Dollars
Johnston 42,851 49,494 10,675 7,959 4,242 4,070Jones 65,405 76,845 8,303 6,253 320 307Lee * * * * 1,001 960Lenoir 65,405 71,635 47,445 35,246 547 525Lincoln 90 104 * * 975 936McDowell * * * * 686 659Macon * * * * 7,747 7,432Madison * * * * 217 209Martin * * * * 502 481Mecklenburg * * * * 3,172 3,044
Mitchell * * * * 45 43Montgomery 3,834 4,689 * * 38 37Moore * * * * 2,981 2,860Nash 12,404 14,327 * * 75 72New Hanover * * * * 169 162Northampton 24,809 28,654 * * 81 78Onslow 47,362 49,494 57,824 43,204 746 716Orange 1,015 1,172 * * 6,743 6,469Pamlico * * * * 667 640Pasquotank * * * * 78 75
Pender 59,766 72,938 14,678 11,029 995 954Perquimans * * * * 2,269 2,177Person 902 912 * * 298 286Pitt 57,511 63,821 * * 8,206 7,873Polk * * * * 3,245 3,113Randolph 5,638 5,991 * * 2,202 2,113Richmond 14,660 15,890 * * 237 227Robeson 76,681 91,172 6,375 4,775 1,367 1,311Rockingham 451 781 * * 891 855Rowan * * * * 1,419 1,361
Rutherford * * * * 898 862Sampson 453,323 494,935 250,571 186,461 1,720 1,650Scotland * * * * 133 127Stanly 789 781 17,496 12,961 275 264Stokes * * * * 952 914Surry * * * * 953 914Swain * * * * 676 649Transylvania * * * * 6,690 6,419Tyrrell * * * * 41 39Union * * 96,374 71,628 3,099 2,973
Vance * * * * 202 194Wake * * * * 6,467 6,205Warren * * * * 640 614Washington * * * * 6,562 6,296Watauga * * * * 1,771 1,700Wayne 126,299 134,153 121,579 90,957 3,925 3,765Wilkes * * * * 1,430 1,371Wilson 6,315 8,596 * * 614 589Yadkin * * * * 628 602Yancey * * * * 115 111
Published Counties 1,998,116 2,232,105 972,187 723,107 165,436 158,720Other Counties 99,348 112,324 21,202 15,917 * *
State Total 2,097,464 2,344,429 993,389 739,024 165,436 158,7201 Cash receipts from farm marketings represent gross returns from the actual sales of crops and livestock products during the calendar year. 2 Totals may not equal sum of counties due to rounding. *Cash receipts are not published for some counties to avoid disclosure of individual farming operations. USDA NASS County Estimating Program Policies and Standards apply.

26 North Carolina Agricultural Statistics
CASH RECEIPTS FROM FARM MARKETINGS AND GOVERNMENT PAYMENTS 1 2
CountiesCorn Cotton Peanuts Soybean
2016 2017 2016 2017 2016 2017 2016 2017
Thousand Dollars
Alamance 1,794 1,224 * * * * 1,237 1,781Alexander 399 361 * * * * * 738Alleghany * * * * * * * *Anson * 4,166 * * * * * *Ashe * * * * * * * *Avery * * * * * * * *Beaufort 26,262 29,094 5,448 5,588 * * 21,278 29,397Bertie 5,432 5,656 7,900 11,122 3,839 6,343 9,350 14,042Bladen 10,648 12,034 * * * * 3,892 5,199Brunswick 3,623 4,357 * * * * * 2,312
Buncombe 51 86 * * * * * *Burke 497 581 * * * * 250 *Cabarrus 2,188 2,457 * * * * 1,920 *Caldwell * * * * * * * *Camden 12,114 14,682 * * * * 10,950 11,316Carteret * * * * * * * *Caswell 482 * * * * * 642 1,088Catawba 1,323 2,054 * * * * 2,396 3,148Chatham * 1,075 * * * * * 998Cherokee 528 * * * * * * *
Chowan 2,392 2,814 2,906 5,588 2,367 3,977 5,908 5,901Clay * * * * * * * *Cleveland 1,381 1,946 * * * * 3,806 5,901Columbus 17,323 19,446 * * * * 12,749 15,589Craven 10,752 11,350 * * * * 7,136 8,186Cumberland 4,556 5,270 * 2,289 * * 4,982 5,649Currituck 6,840 6,905 * * * * * 6,144Dare * * * * * * * *Davidson 1,948 2,668 * * * * 2,777 3,553Davie 3,005 2,934 * * * * 2,361 3,445
Duplin 23,688 21,990 * 2,957 * * 16,849 16,974Durham * * * * * * * *Edgecombe 10,251 7,291 3,269 8,843 2,498 5,018 14,453 17,244Forsyth * * * * * * * *Franklin 461 * * * * * 3,347 5,163Gaston * * * * * * 1,271 1,349Gates 3,083 2,822 6,356 4,774 1,768 2,867 7,439 9,679Graham * * * * * * * *Granville 739 560 * * * * 1,081 1,025Greene 7,076 * * 3,282 * 2,610 11,962 11,415
Guilford 1,887 1,473 * * * * 2,690 3,607Halifax 4,032 3,299 21,930 22,270 3,419 5,755 11,616 13,349Harnett * 2,610 2,860 2,194 * * 7,724 8,240Haywood * * * * * * * *Henderson 1,273 * * * * * * *Hertford * 5,411 4,813 7,107 2,625 3,950 * *Hoke * * * * * * * *Hyde 18,789 23,500 3,460 6,022 * * 13,580 16,623Iredell 4,726 * * * * * 5,492 *Jackson * * * * * * * *

North Carolina Agricultural Statistics 27
CASH RECEIPTS FROM FARM MARKETINGS AND GOVERNMENT PAYMENTS 1 2
CountiesCorn Cotton Peanuts Soybean
2016 2017 2016 2017 2016 2017 2016 2017
Thousand Dollars
Johnston * 4,673 2,270 2,414 724 1,152 13,623 16,749Jones 8,816 9,549 3,678 6,592 * * * *Lee * * * * * * 1,081 *Lenoir 12,531 12,914 1,589 3,798 * * 12,568 13,457Lincoln * 620 * * * * 1,972 2,285McDowell * * * * * * * *Macon * * * * * * * *Madison * * * * * * * *Martin 3,619 3,071 8,627 15,516 4,527 6,885 7,240 8,204Mecklenburg * * * * * * * *
Mitchell * * * * * * * *Montgomery * * * * * * * *Moore 523 * * * * * * 1,034Nash 1,948 * * * * * 7,093 9,886New Hanover * * * * * * * *Northampton 6,481 5,644 18,752 23,356 2,861 3,750 10,985 12,404Onslow 5,498 6,229 * * * * * *Orange 1,420 1,286 * * * * 1,081 1,295Pamlico 7,620 10,790 * * * * 6,747 7,592Pasquotank * 12,196 * * * * * 22,794
Pender 7,855 * * * * * 5,268 *Perquimans 9,182 * 4,268 5,371 * * 14,929 17,991Person 1,431 1,021 * * * * 3,200 3,472Pitt 13,580 13,234 1,589 4,937 3,612 5,518 16,348 21,157Polk * * * * * * * *Randolph 2,623 1,926 * * * * 2,508 2,968Richmond * * * * * * 709 *Robeson 34,491 33,033 4,359 7,080 * * 22,065 27,903Rockingham 764 591 * * * * 1,375 1,916Rowan 3,445 4,955 * * * * 5,795 6,288
Rutherford 151 * * * * * 419 *Sampson 19,441 17,089 5,585 6,402 * * 20,067 24,026Scotland 4,190 * * * * * 2,993 3,544Stanly 5,891 6,158 9,989 * * * 6,375 6,189Stokes 599 548 * * * * 684 765Surry 6,505 5,943 * * * * 3,598 4,435Swain * * * * * * * *Transylvania * 838 * * * * * *Tyrrell 13,819 15,894 * * * * 8,425 13,763Union 13,410 17,018 * * * * 23,163 25,160
Vance * * * * * * 1,574 1,655Wake 208 103 * * * * 2,655 2,878Warren * * * * * * 1,730 2,168Washington 16,975 21,828 4,041 5,805 653 868 14,704 16,362Watauga * * * * * * * *Wayne 11,917 12,462 1,090 * 1,569 2,270 15,690 21,787Wilkes 2,496 3,291 * * * * * 600Wilson 7,245 5,478 1,907 3,879 1,290 * 10,466 13,232Yadkin 5,378 5,851 * * * * 5,181 6,351Yancey * * * * * * * *
Published Counties 419,596 434,352 126,685 167,186 31,752 50,963 441,452 549,365Other Counties 48,228 60,638 29,049 33,818 20,080 28,526 61,086 58,715
State Total 467,824 494,990 155,734 201,004 51,832 79,489 502,538 608,0801 Cash receipts from farm marketings represent gross returns from the actual sales of crops and livestock products during the calendar year. 2 Totals may not equal sum of counties due to rounding. *Cash receipts are not published for some counties to avoid disclosure of individual farming operations. USDA NASS County Estimating Program Policies and Standards apply.

28 North Carolina Agricultural Statistics
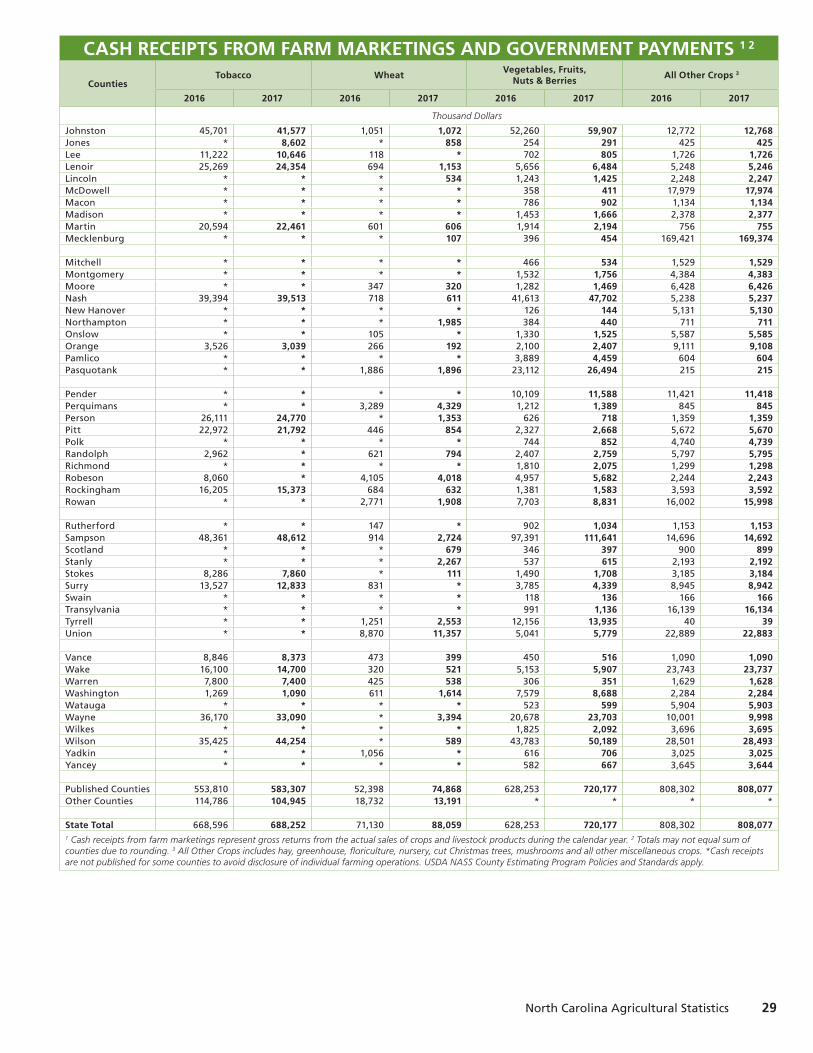
CASH RECEIPTS FROM FARM MARKETINGS AND GOVERNMENT PAYMENTS 1 2
CountiesTobacco Wheat
Vegetables, Fruits,Nuts & Berries
All Other Crops 3
2016 2017 2016 2017 2016 2017 2016 2017
Thousand Dollars
Alamance 3,728 4,072 440 211 826 947 6,300 6,298Alexander * * * * 2,209 2,532 2,971 2,970Alleghany * * * * 1,558 1,786 17,421 17,416Anson * * * * 287 329 4,573 4,572Ashe * * * * 928 1,064 42,445 42,433Avery * * * * 505 579 17,675 17,670Beaufort 7,194 * 704 2,720 776 889 1,648 1,648Bertie 16,120 * 2,009 2,007 1,893 2,170 72 72Bladen * * 464 * 34,240 39,250 4,654 4,652Brunswick * * * * 12,969 14,866 2,759 2,758
Buncombe * * * * 8,761 10,043 33,855 33,846Burke * * * * 1,009 1,157 9,585 9,583Cabarrus * * 670 704 605 693 5,940 5,939Caldwell * * * * 373 427 8,410 8,408Camden * * 1,701 * 10,626 12,181 49 49Carteret * * * * 1,381 1,583 1,303 1,303Caswell 11,401 10,816 306 166 1,223 1,402 2,176 2,176Catawba * * 1,080 1,008 3,265 3,742 8,478 8,476Chatham * * 128 211 1,335 1,531 4,268 4,267Cherokee * * * * 4,073 4,669 4,393 4,392
Chowan * * 801 914 5,419 6,212 9,545 9,542Clay * * * * 1,456 1,669 282 282Cleveland * * 1,681 2,105 3,017 3,458 2,855 2,855Columbus * * * * 10,611 12,164 3,047 3,046Craven 5,179 * 171 * 528 605 2,673 2,672Cumberland * 13,343 * * 6,326 7,252 4,470 4,469Currituck * * 826 939 467 535 172 172Dare * * * * * * 148 148Davidson * 1,462 374 316 2,042 2,341 7,697 7,695Davie * * 586 632 603 692 1,419 1,419
Duplin 9,672 8,717 919 2,195 26,780 30,699 13,148 13,144Durham * * * * 436 500 5,339 5,338Edgecombe 32,594 30,920 753 2,024 9,475 10,861 11,907 11,904Forsyth * * 166 * 1,188 1,362 3,356 3,355Franklin 16,120 20,397 850 991 1,946 2,231 19,590 19,584Gaston * * * 343 571 654 2,201 2,200Gates * * 1,134 * 120 137 45 45Graham * * * * 203 233 414 414Granville 14,690 13,936 630 717 2,259 2,590 1,645 1,644Greene 27,103 32,535 523 1,055 28,521 32,694 901 901
Guilford 12,207 11,580 865 598 1,756 2,013 13,421 13,418Halifax * 15,178 1,095 666 4,415 5,061 1,714 1,713Harnett * 30,012 * 1,417 6,477 7,424 9,801 9,799Haywood * * * * 3,729 4,275 2,576 2,575Henderson * * * * 24,601 28,201 34,685 34,675Hertford * * * * 2,562 2,937 388 388Hoke * * 332 * 47 53 692 692Hyde * * 591 1,405 12,103 13,874 350 350Iredell * * * 1,558 1,141 1,307 8,624 8,621Jackson * * * * 2,223 2,549 6,398 6,396
North Carolina Agricultural Statistics 29
CASH RECEIPTS FROM FARM MARKETINGS AND GOVERNMENT PAYMENTS 1 2
CountiesTobacco Wheat
Vegetables, Fruits,Nuts & Berries
All Other Crops 3
2016 2017 2016 2017 2016 2017 2016 2017
Thousand Dollars
Johnston 45,701 41,577 1,051 1,072 52,260 59,907 12,772 12,768Jones * 8,602 * 858 254 291 425 425Lee 11,222 10,646 118 * 702 805 1,726 1,726Lenoir 25,269 24,354 694 1,153 5,656 6,484 5,248 5,246Lincoln * * * 534 1,243 1,425 2,248 2,247McDowell * * * * 358 411 17,979 17,974Macon * * * * 786 902 1,134 1,134Madison * * * * 1,453 1,666 2,378 2,377Martin 20,594 22,461 601 606 1,914 2,194 756 755Mecklenburg * * * 107 396 454 169,421 169,374
Mitchell * * * * 466 534 1,529 1,529Montgomery * * * * 1,532 1,756 4,384 4,383Moore * * 347 320 1,282 1,469 6,428 6,426Nash 39,394 39,513 718 611 41,613 47,702 5,238 5,237New Hanover * * * * 126 144 5,131 5,130Northampton * * * 1,985 384 440 711 711Onslow * * 105 * 1,330 1,525 5,587 5,585Orange 3,526 3,039 266 192 2,100 2,407 9,111 9,108Pamlico * * * * 3,889 4,459 604 604Pasquotank * * 1,886 1,896 23,112 26,494 215 215
Pender * * * * 10,109 11,588 11,421 11,418Perquimans * * 3,289 4,329 1,212 1,389 845 845Person 26,111 24,770 * 1,353 626 718 1,359 1,359Pitt 22,972 21,792 446 854 2,327 2,668 5,672 5,670Polk * * * * 744 852 4,740 4,739Randolph 2,962 * 621 794 2,407 2,759 5,797 5,795Richmond * * * * 1,810 2,075 1,299 1,298Robeson 8,060 * 4,105 4,018 4,957 5,682 2,244 2,243Rockingham 16,205 15,373 684 632 1,381 1,583 3,593 3,592Rowan * * 2,771 1,908 7,703 8,831 16,002 15,998
Rutherford * * 147 * 902 1,034 1,153 1,153Sampson 48,361 48,612 914 2,724 97,391 111,641 14,696 14,692Scotland * * * 679 346 397 900 899Stanly * * * 2,267 537 615 2,193 2,192Stokes 8,286 7,860 * 111 1,490 1,708 3,185 3,184Surry 13,527 12,833 831 * 3,785 4,339 8,945 8,942Swain * * * * 118 136 166 166Transylvania * * * * 991 1,136 16,139 16,134Tyrrell * * 1,251 2,553 12,156 13,935 40 39Union * * 8,870 11,357 5,041 5,779 22,889 22,883
Vance 8,846 8,373 473 399 450 516 1,090 1,090Wake 16,100 14,700 320 521 5,153 5,907 23,743 23,737Warren 7,800 7,400 425 538 306 351 1,629 1,628Washington 1,269 1,090 611 1,614 7,579 8,688 2,284 2,284Watauga * * * * 523 599 5,904 5,903Wayne 36,170 33,090 * 3,394 20,678 23,703 10,001 9,998Wilkes * * * * 1,825 2,092 3,696 3,695Wilson 35,425 44,254 * 589 43,783 50,189 28,501 28,493Yadkin * * 1,056 * 616 706 3,025 3,025Yancey * * * * 582 667 3,645 3,644
Published Counties 553,810 583,307 52,398 74,868 628,253 720,177 808,302 808,077Other Counties 114,786 104,945 18,732 13,191 * * * *
State Total 668,596 688,252 71,130 88,059 628,253 720,177 808,302 808,0771 Cash receipts from farm marketings represent gross returns from the actual sales of crops and livestock products during the calendar year. 2 Totals may not equal sum of counties due to rounding. 3 All Other Crops includes hay, greenhouse, floriculture, nursery, cut Christmas trees, mushrooms and all other miscellaneous crops. *Cash receipts are not published for some counties to avoid disclosure of individual farming operations. USDA NASS County Estimating Program Policies and Standards apply.

30 North Carolina Agricultural Statistics
VALUE ADDED TO THE NORTH CAROLINA ECONOMYBY THE AGRICULTURAL SECTOR
2013 2014 2015 2016 2017
Thousand Dollars
Value of crop production 4,194,587 4,152,570 3,346,973 3,305,892 3,729,045Crop cash receipts 4,366,506 4,145,403 3,703,728 3,354,208 3,688,127
Cotton 417,685 411,957 222,673 155,734 201,004Feed crops 634,040 575,676 451,545 533,403 558,992Food grains 330,183 226,418 154,932 76,288 94,559Fruits and nuts 124,020 139,732 135,180 127,343 110,775Oil crops 950,991 705,589 703,584 554,370 687,569Tobacco 760,644 850,574 790,272 668,596 688,252Vegetables and melons 455,549 513,372 507,677 500,910 609,402All other crops 693,393 722,086 737,864 737,564 737,574
Home consumption 1,175 1,084 879 1,376 1,906Inventory adjustment -173,094 6,083 -357,634 -49,692 39,012
Value of animals and products production 8,271,873 8,835,647 7,967,571 7,279,224 7,703,598Animals and products cash receipts 8,305,629 8,802,012 7,944,019 7,211,746 7,744,849
Dairy products, Milk 198,806 245,435 182,094 164,160 177,848Meat animals 3,177,702 3,312,491 2,672,907 2,352,759 2,638,717Miscellaneous livestock 148,456 147,899 148,463 152,738 151,908Poultry and eggs 4,780,665 5,096,187 4,940,555 4,542,089 4,776,377
Home consumption 4,203 3,832 4,502 2,551 2,213Inventory adjustment -37,959 29,804 19,050 64,927 -43,464
Farm-related income 1,526,952 1,581,163 1,426,950 1,818,722 1,978,014Forest products sold 20,244 17,107 14,850 47,874 62,158Gross imputed rental value of farm dwellings 394,143 352,878 297,909 295,015 375,610Machine hire and customwork 59,241 31,482 22,211 34,136 43,282Other farm income 1,053,324 1,179,696 1,091,980 1,441,697 1,496,964
Total commodity insurance indemnities 141,428 120,210 145,202 386,925 234,162Federal commodity insurance indemnities 136,756 116,733 139,643 309,972 204,618Net cash rent received by operator landlords 2 12,772 12,107 15,602 13,620 15,088
Value of agricultural sector production 13,993,412 14,569,381 12,741,494 12,403,838 13,410,657
Intermediate product expenses 1 8,854,147 8,758,302 7,780,662 7,823,326 8,089,548Farm origin 5,457,160 5,108,137 4,476,707 4,427,106 4,659,232
Feed purchases 4,410,000 4,050,000 3,470,000 3,440,000 3,520,000Livestock and poultry purchases 677,160 678,137 626,707 617,106 699,232Seed purchases 370,000 380,000 380,000 370,000 440,000
Manufactured inputs 1,448,211 1,426,201 1,296,238 1,147,456 1,238,838Electricity 151,027 144,744 147,653 128,152 141,273Fertilizer, lime, and soil conditioners 530,000 520,000 470,000 420,000 440,000Pesticides 310,000 330,000 320,000 300,000 310,000Petroleum fuel and oils 457,184 431,457 358,585 299,304 347,565
Other intermediate expenses 1 1,948,776 2,223,964 2,007,717 2,248,764 2,191,478Machine hire and custom work 37,320 34,308 55,297 44,219 28,843Marketing, storage, and transportation 216,740 305,794 204,566 246,619 250,863Repair and maintenance 1 349,691 379,722 306,659 337,768 340,806Miscellaneous expenses 1 1,345,025 1,504,140 1,441,195 1,620,158 1,570,966Total insurance premiums 4 179,272 198,225 167,840 181,546 188,495
Federal commodity insurance premiums 67,076 65,455 57,973 62,534 68,347Irrigation 619 897 881 576 568
Contract labor 178,212 122,469 152,646 82,533 103,468
Net government transactions 192,730 64,788 -139,736 -48,192 -95,860Direct government payments 411,331 346,093 91,137 181,008 156,298Property taxes and fees 1 218,601 281,306 230,874 229,201 252,158
Motor vehicle registration and licensing fees 18,601 21,306 20,874 19,201 22,158
Gross value added 5,153,783 5,753,397 4,668,449 4,449,786 5,121,781Capital consumption 1 674,040 881,535 745,770 808,860 686,631Net value added 4,479,743 4,871,862 3,922,679 3,640,927 4,435,150
Factor payments to stakeholders 3 1,051,905 1,017,781 1,014,667 1,182,156 1,248,709Hired labor and non-cash empolyee compensation 651,788 617,531 597,354 757,467 786,532Net rent paid to operator landlords 17,254 15,606 16,378 15,285 16,925Net rent paid to nonoperator landlords 134,172 121,676 127,695 119,169 131,954Total interest expenses 1 248,691 262,968 273,240 290,235 313,298
Net farm income 3,427,837 3,854,081 2,908,012 2,458,770 3,186,441
SOURCE: Economic Research Service, USDA. Data as of August 30, 2017. Values are rounded to the nearest thousand. 1 Including expenses associated with operator dwellings. 2 Share rent income is included in cash receipts. 3 Prior to 2008, factor payments to stakeholders only includes net rent paid to nonoperator landlords. 4 Includes federal and private crop and livestock insurance premiums as well as casualty, hail, motor vehicle and all other insurance premiums.

North Carolina Agricultural Statistics 31
MONTHLY PRICE RECEIVED FOR CORN(Dollars per Bushel)
3.00
3.50
4.00
4.50
5.00
5.50
Aug Sep Oct Nov Dec Jan Feb Mar Apr May Jun Jul
2015-16 2016-17 2017-18 US 2017-18
MONTHLY PRICE RECEIVED FOR WINTER WHEAT(Dollars per Bushel)
4.00
4.50
5.00
5.50
6.00
Aug Sep Oct Nov Dec Jan Feb Mar Apr May Jun Jul
2015-16 2016-17 2017-18 US 2017-18
MONTHLY PRICE RECEIVED FOR SOYBEANS(Dollars per Bushel)
2015-16 2016-17 2017-18 US 2017-18
7.50
8.50
9.50
10.50
11.50
Sep Oct Nov Dec Jan Feb Mar Apr May Jun JulAug

32 North Carolina Agricultural Statistics
PRICES RECEIVEDMarketing Year Average Prices for Specified Crops
YearFlue-Cured
Tobaccoper Lb.
Burley Tobaccoper Lb.
Cottonper Lb. 1
Soybeansper Bu.
Cornper Bu.
Peanutsper Lb.
Winter Wheatper Bu.
All Hayper Ton
Sweet Potatoesper Cwt.
Potatoesper Cwt.
Applesper Lb. 2
Dollars
2013 2.11 2.04 0.82 13.10 4.96 0.28 6.28 110.00 24.90 (D) 0.222014 2.01 1.85 0.67 10.20 4.19 0.26 5.16 114.00 22.00 (D) 0.252015 1.85 1.95 0.62 8.68 4.32 0.22 4.90 126.00 19.40 (D) 0.212016 1.94 1.89 0.66 9.80 4.07 0.21 4.61 116.00 18.10 10.90 0.242017 2.00 1.94 0.68 9.45 4.20 0.24 4.65 115.00 15.30 11.40 0.251 Based on Marketings and monthly prices received from August 1–December 31. 2 Utilized Production. (D) Not published to avoid disclosure of individual farming operations.