Embed Size (px)
Citation preview
Summary Report
DRIVERS OF
DEFORESTATION AND
FOREST DEGRADATION
IN SRI LANKA:
IDENTIFICATION OF KEY
POLICIES AND MEASURES
Sri Lanka UN-REDD Programme
April 2015
Colombo, Sri Lanka
Photo
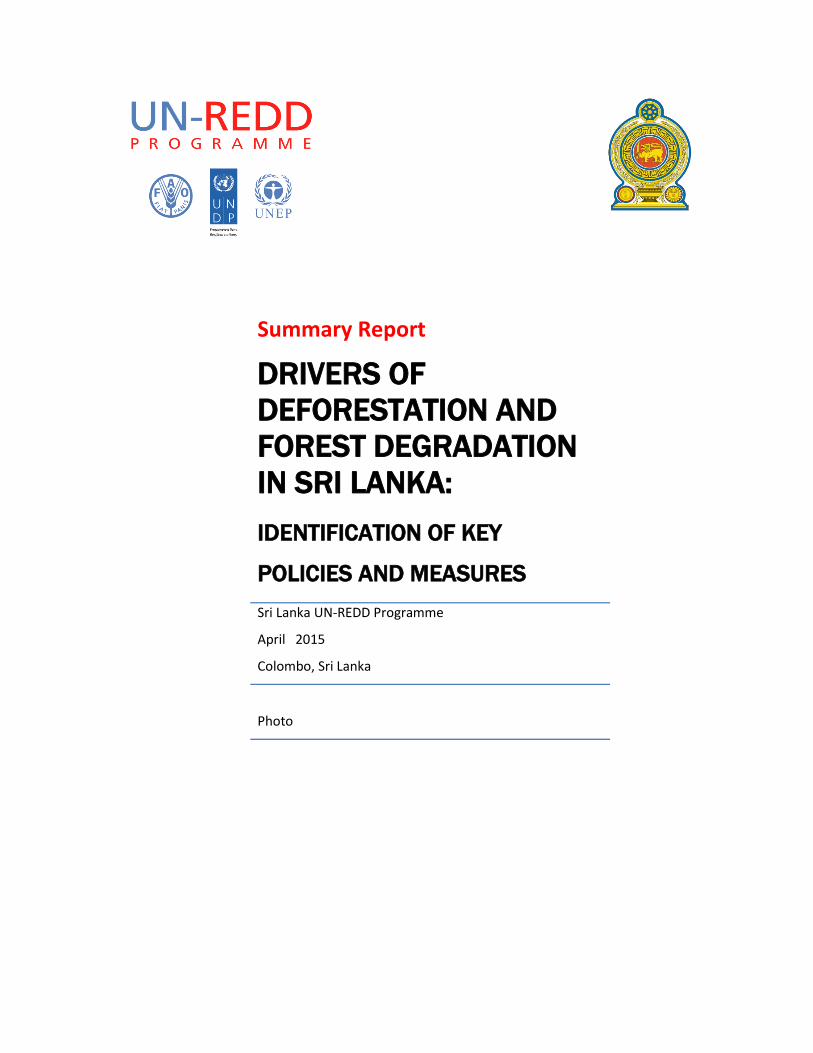
Background Deforestation and degradation of forests jointly contribute to climate change, leading to Global Greenhouse Gas (GHG) emissions. To address this climate challenge, the UN has initiated an international mechanism for Reducing Emissions from Deforestation and Degradation of forests (REDD+) which focuses on five activities:
a. Reducing emissions from deforestation; (RED)
b. Reducing emissions from forest degradation; (the second ‘D’)
c. Conservation of forest carbon stocks; (included in the ‘+’)
d. Sustainable management of forests; (included in the ‘+’)
e. Enhancement of forest carbon stocks; (included in the ‘+’)
To prepare a National REDD+ strategy for Sri Lanka, one of the earliest steps is to identify the major drivers of deforestation and forest degradation in the country. Such a study will also identify key policies and measures to control the major drivers and to further conserve, sustainably manage and increase forest carbon stocks. Definitions: Deforestation is the conversion of forest to another land use type which is mainly a result of human activities. In contrast, forest degradation leads to deterioration of the standing vegetation in density, structure and species composition due to human activities and natural causes. It may involve opening of the canopy, modification of the vertical structure, habitat parameters or change of other attributes. Forest degradation does not necessarily involve a reduction of the forest area, instead leads to the decline of the quality of forests. Together, deforestation and forest degradation reduce the area, quality and quantity of vegetation cover and alter the spatial structure of landscape through the process of fragmentation. Questions: This study was structured around finding answers to the following key questions:
1. What are the major drivers of deforestation and forest degradation? 2. What are the underlying socioeconomic and political factors that create and catalyze the
drivers? 3. Which drivers are more destructive compared to others? 4. How the drivers are spatially distributed around the country? 5. How effective are the current laws and policies in controlling the drivers and the
underlying factors? 6. Which drivers can we control and what are the policies and measures we could
implement in the context of REDD+, to reduce emissions by (1) preserving forests to act as carbon sinks and (2) to avoid emissions produced by deforestation?
Conceptual model of the study: The study views deforestation and degradation as a result of a continuous process (deforestation/degradation process) that has driving forces (drivers and catalysts) and restraining forces (inhibitors). Drivers include underlying drivers and major (proximate) drivers. Catalysts are factors that accelerate impacts of drivers whereas preventive forces
(inhibitors) decelerate the impacts of drivers. Deforestation and degradation of forests are outcomes result from interaction of these forces.
The findings are described below.
Three main historical drivers (1800 -1985) Pre-independence era 1800 - 1945: In the early 1800s, there was 70% forest cover in the country a two dominant drivers have been identified for this period.
1. Growth of export plantation economy: During the British colonial period the major
driver was plantation agricultural crops, coffee, tea and rubber that cleared forests in the wet, intermediate, montane and sub-montane zone forests. Large swathes of land were acquired by British rulers through the Crown Lands Encroachment Ordinance (1840) denying the local populations’ traditional customary rights. This created heavy pressure of landlessness among upcountry peasant population.
2. Commercial timber extraction policy: Colonial rulers practiced selective felling of valuable timber species especially in the lowland dry zone that led to degradation of forests throughout the country.
Post-independence era 1948 -1985: 3. Land settlement and irrigation development in the dry zone: Increased landlessness
among peasant population in the wet zone and negligence of food crops production by colonial rulers led to policies for providing lands to the growing peasant population and for achieving the goal of self-sufficiency in food production. This resulted in large-scale conversion of forested state lands in the dry zone under several land settlement and irrigation development schemes. The wave of deforestation associated with this process lasted the second half of the twentieth century. During the five decades period of 1935-1985, the process started with the restoration of ancient tank system by the Irrigation Department. Large-scale river diversion schemes such as Gal Oya, Uda Walawe and Mahaweli which had dual goals of irrigation and hydro-power generation were implemented later on. From 1970s onwards the government directed its attention primarily to the Mahaweli Development Master Plan—a mega project, subsequent accelerated Mahaweli development project (AMDP) where the original 30 year plan was collapsed into a six years. The plan envisaged providing irrigation facilities to 364,230 ha (including new lands) and installation of 507 MW of hydropower.
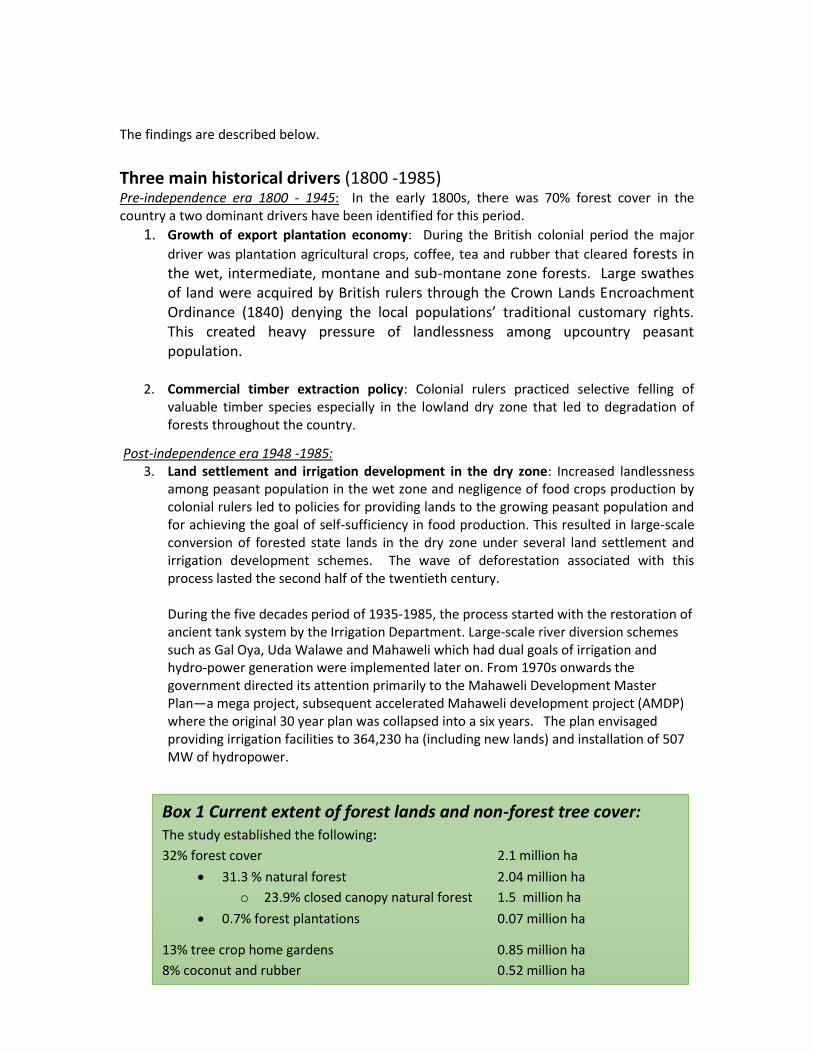
Box 1 Current extent of forest lands and non-forest tree cover: The study established the following:
32% forest cover 2.1 million ha
31.3 % natural forest 2.04 million ha
o 23.9% closed canopy natural forest 1.5 million ha
0.7% forest plantations 0.07 million ha
13% tree crop home gardens 0.85 million ha
8% coconut and rubber 0.52 million ha
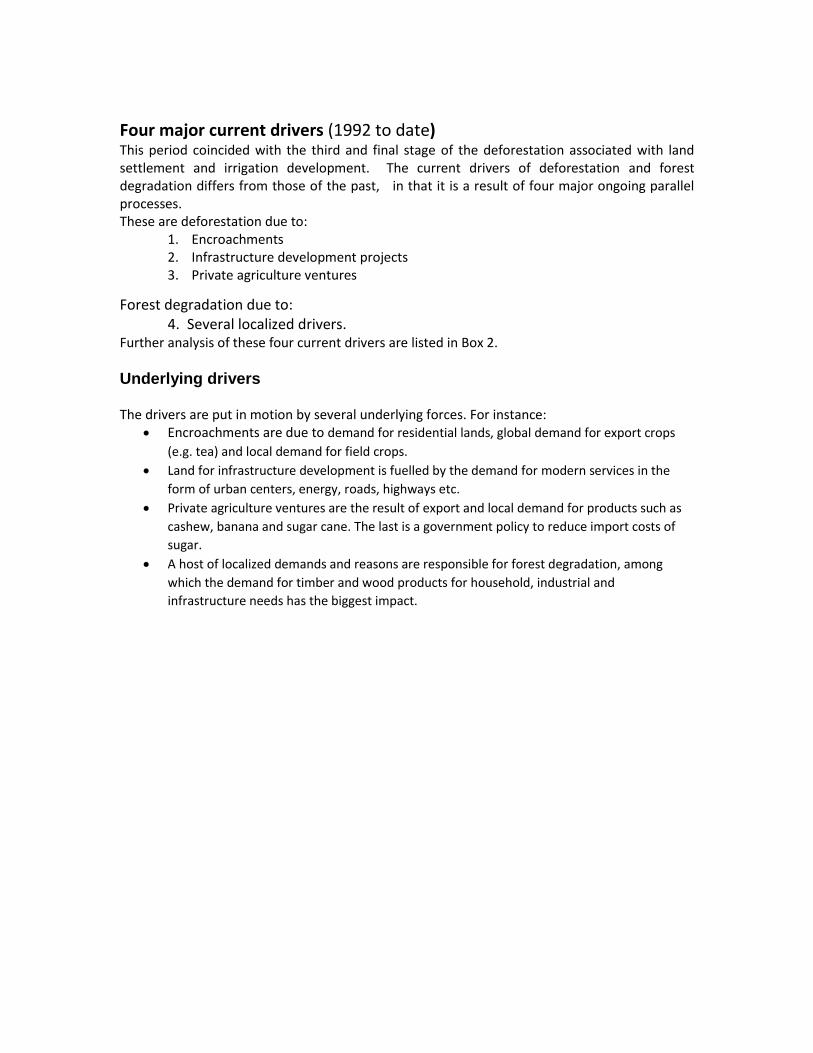
Four major current drivers (1992 to date) This period coincided with the third and final stage of the deforestation associated with land settlement and irrigation development. The current drivers of deforestation and forest degradation differs from those of the past, in that it is a result of four major ongoing parallel processes. These are deforestation due to:
1. Encroachments 2. Infrastructure development projects 3. Private agriculture ventures
Forest degradation due to: 4. Several localized drivers.
Further analysis of these four current drivers are listed in Box 2.
Underlying drivers The drivers are put in motion by several underlying forces. For instance:
Encroachments are due to demand for residential lands, global demand for export crops
(e.g. tea) and local demand for field crops.
Land for infrastructure development is fuelled by the demand for modern services in the
form of urban centers, energy, roads, highways etc.
Private agriculture ventures are the result of export and local demand for products such as
cashew, banana and sugar cane. The last is a government policy to reduce import costs of
sugar.
A host of localized demands and reasons are responsible for forest degradation, among
which the demand for timber and wood products for household, industrial and
infrastructure needs has the biggest impact.
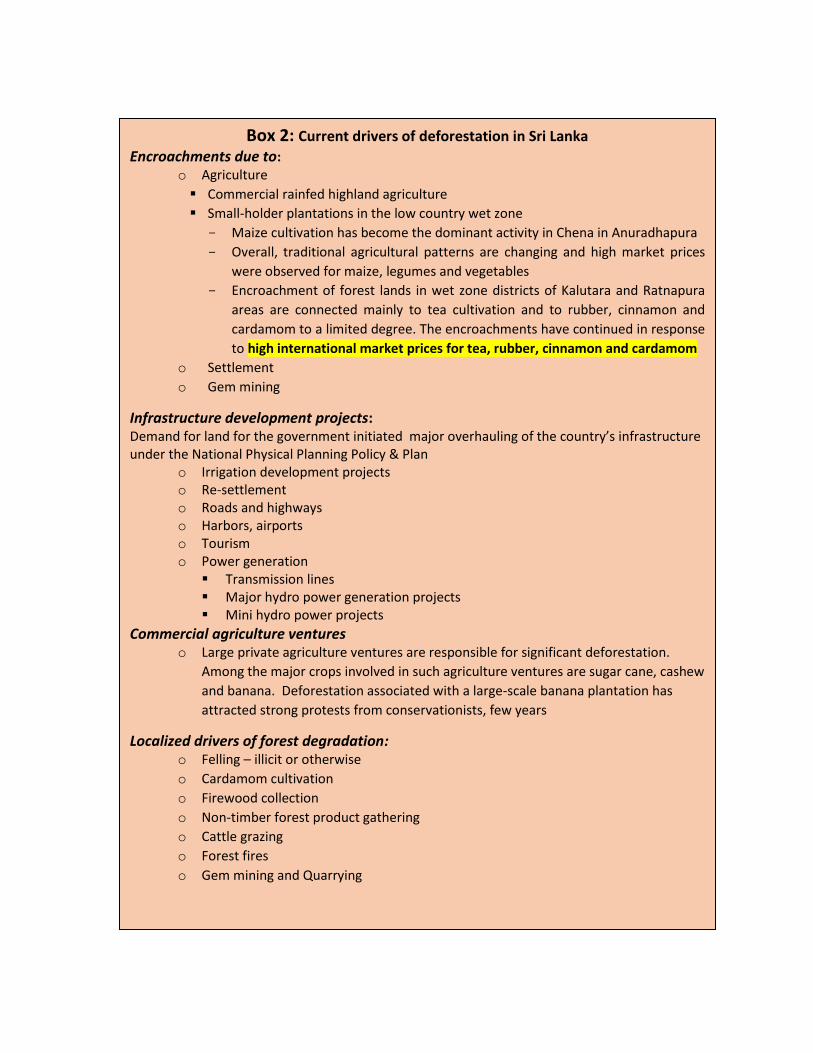
Box 2: Current drivers of deforestation in Sri Lanka Encroachments due to:
o Agriculture
Commercial rainfed highland agriculture
Small-holder plantations in the low country wet zone
Maize cultivation has become the dominant activity in Chena in Anuradhapura
Overall, traditional agricultural patterns are changing and high market prices
were observed for maize, legumes and vegetables
Encroachment of forest lands in wet zone districts of Kalutara and Ratnapura
areas are connected mainly to tea cultivation and to rubber, cinnamon and
cardamom to a limited degree. The encroachments have continued in response
to high international market prices for tea, rubber, cinnamon and cardamom
o Settlement
o Gem mining
Infrastructure development projects: Demand for land for the government initiated major overhauling of the country’s infrastructure under the National Physical Planning Policy & Plan
o Irrigation development projects o Re-settlement o Roads and highways o Harbors, airports o Tourism o Power generation
Transmission lines Major hydro power generation projects Mini hydro power projects
Commercial agriculture ventures o Large private agriculture ventures are responsible for significant deforestation.
Among the major crops involved in such agriculture ventures are sugar cane, cashew
and banana. Deforestation associated with a large-scale banana plantation has
attracted strong protests from conservationists, few years
Localized drivers of forest degradation: o Felling – illicit or otherwise
o Cardamom cultivation
o Firewood collection
o Non-timber forest product gathering
o Cattle grazing
o Forest fires
o Gem mining and Quarrying
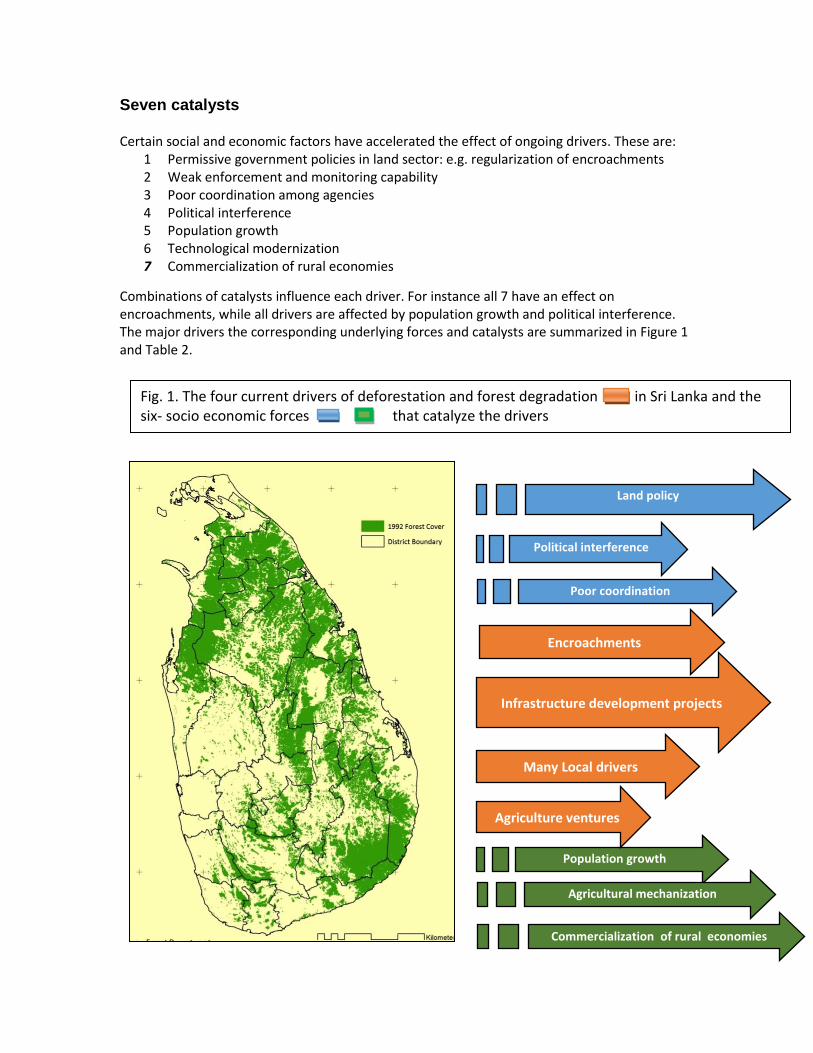
Seven catalysts Certain social and economic factors have accelerated the effect of ongoing drivers. These are:
1 Permissive government policies in land sector: e.g. regularization of encroachments 2 Weak enforcement and monitoring capability 3 Poor coordination among agencies 4 Political interference 5 Population growth 6 Technological modernization 7 Commercialization of rural economies
Combinations of catalysts influence each driver. For instance all 7 have an effect on encroachments, while all drivers are affected by population growth and political interference. The major drivers the corresponding underlying forces and catalysts are summarized in Figure 1 and Table 2.
Encroachments
Infrastructure development projects
Many Local drivers
Population growth
Agricultural mechanization
Commercialization of rural economies
Agriculture ventures
Poor coordination
Land policy
Political interference
Fig. 1. The four current drivers of deforestation and forest degradation in Sri Lanka and the six- socio economic forces that catalyze the drivers
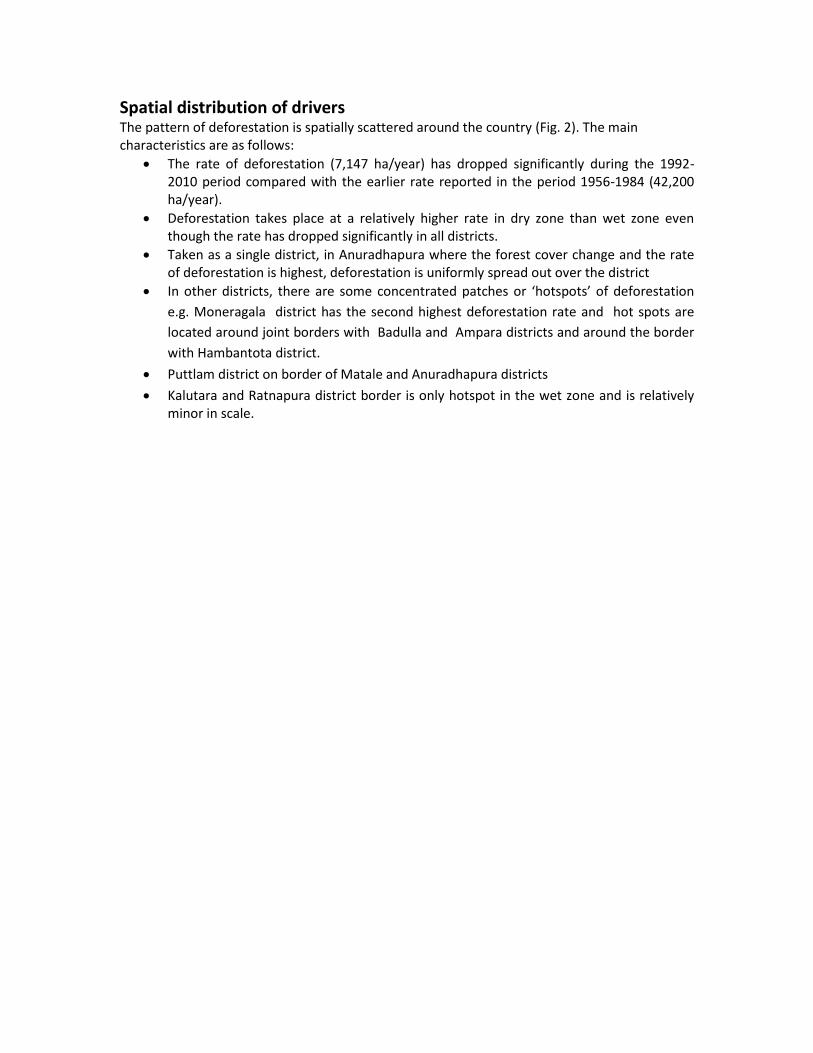
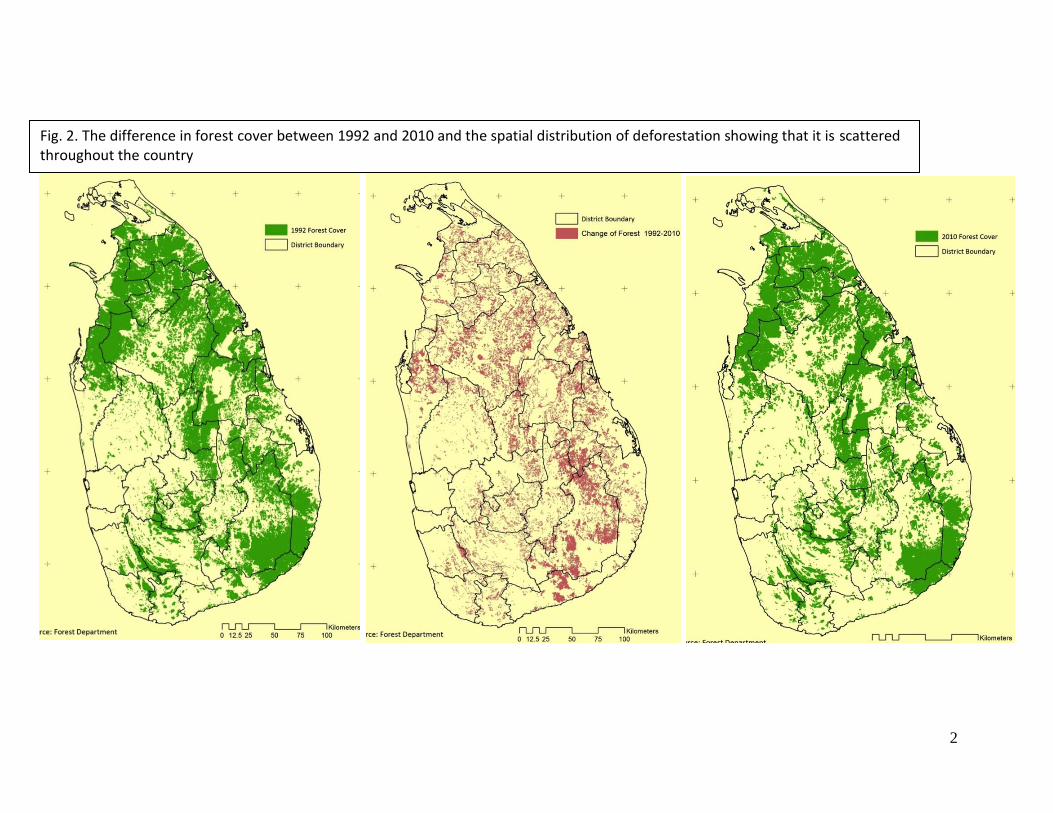
Spatial distribution of drivers The pattern of deforestation is spatially scattered around the country (Fig. 2). The main characteristics are as follows:
The rate of deforestation (7,147 ha/year) has dropped significantly during the 1992-2010 period compared with the earlier rate reported in the period 1956-1984 (42,200 ha/year).
Deforestation takes place at a relatively higher rate in dry zone than wet zone even though the rate has dropped significantly in all districts.
Taken as a single district, in Anuradhapura where the forest cover change and the rate of deforestation is highest, deforestation is uniformly spread out over the district
In other districts, there are some concentrated patches or ‘hotspots’ of deforestation
e.g. Moneragala district has the second highest deforestation rate and hot spots are
located around joint borders with Badulla and Ampara districts and around the border
with Hambantota district.
Puttlam district on border of Matale and Anuradhapura districts
Kalutara and Ratnapura district border is only hotspot in the wet zone and is relatively minor in scale.
2
Fig. 2. The difference in forest cover between 1992 and 2010 and the spatial distribution of deforestation showing that it is scattered throughout the country
3
Seven preventive forces (Inhibitors)
While the factors that drive deforestation and forest degradation in Sri Lanka were described above, there are also factors that helped to reduce the rate of deforestation/degradation to some degree by acting as inhibitors. Among the factors that act as key inhibitors are:
1. Forest policy and protected area management
Forest related regulations and the network of protected areas under the purview of the
Forest Department and the Department of Wildlife Conservation are the most potent
inhibitors of deforestation/degradation of forests. The Sri Lanka’s protected areas
system is around 11.6% of the land area and is one of the most extensive in tropical
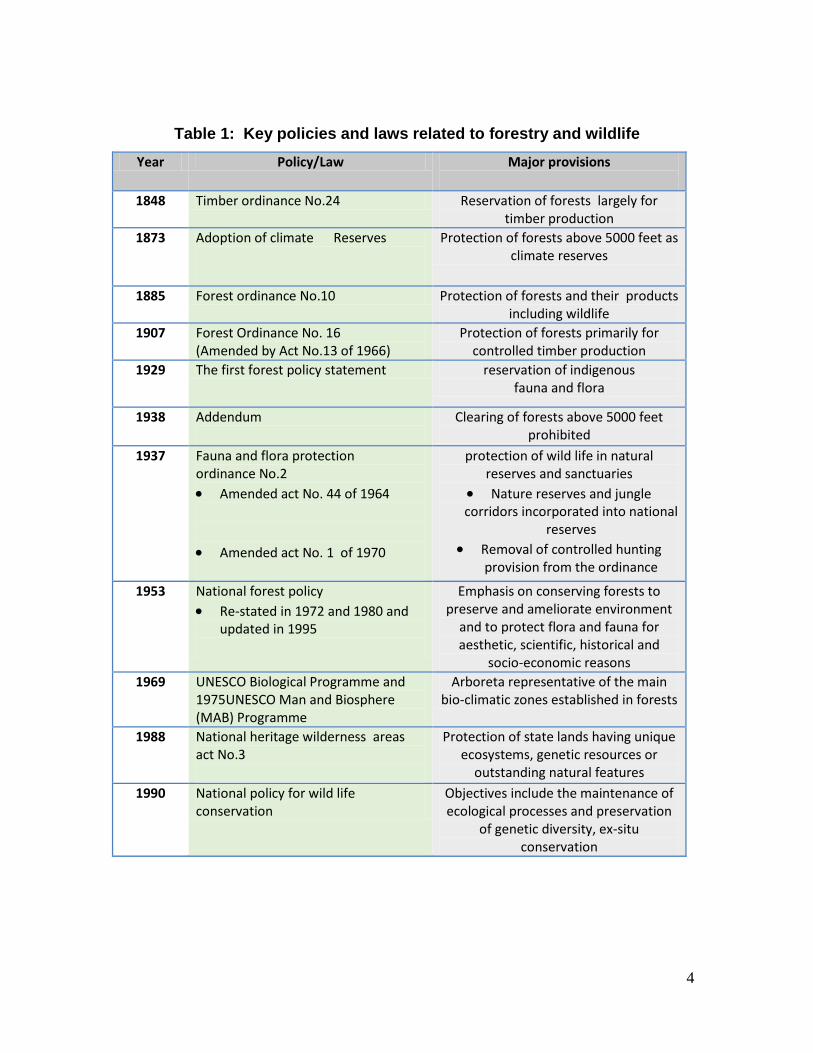
Asian countries. Table 1 shows a summary of the key policies and laws.
2. Environmental laws and regulations
The National Environment Act of 1980 is the core legislation exists for environmental protection in the country. It provides for the enactment of various regulations against development activities that are deemed to pose threats to the environment The EIA process deserves a special mention in its role as an inhibitor of deforestation and degradation
3. Home gardens
Home gardens are multiple use systems and fulfill a variety of household needs
including timber and wood requirements. According to FSMP, around 70 % of total
supply of construction and industrial wood come from non-forest sources and home
gardens play the major role here Due to their forest like structure they have been
valued for their ecosystem services. As far as deforestation and degradation of forests
are concerned they seem to act as a buffer zone located around the household—a
substitute forest—that reduce the dependency on natural forests.
4. Community dependence and customary rights
In Sri Lanka historical and recent evidence suggests that communities play a significant role as inhibitors when they depend on forest resources for their livelihoods.
5. Public pressure and awareness about environment and forests
Rising public awareness about environment and forests has definite inhibitory effect on deforestation and degradation of forests. Environmental activism and advocacy is on the rise and this aided by more accessible modern communication.
6. Migration for employment Migration for employment, especially for foreign
employment, has become a major driving force of the economy during the last 2-3 decades
7. Off-farm employment Expansion of commercial activities in rural areas increases off-
farm employment opportunities for rural youth. Both these factors (5&6) reduce pressures on encroachments and localized drivers of degradation.
4
Table 1: Key policies and laws related to forestry and wildlife
Year Policy/Law Major provisions
1848 Timber ordinance No.24 Reservation of forests largely for timber production
1873 Adoption of climate Reserves
Protection of forests above 5000 feet as climate reserves
1885 Forest ordinance No.10 Protection of forests and their products including wildlife
1907 Forest Ordinance No. 16 (Amended by Act No.13 of 1966)
Protection of forests primarily for controlled timber production
1929 The first forest policy statement reservation of indigenous fauna and flora
1938 Addendum
Clearing of forests above 5000 feet prohibited
1937 Fauna and flora protection ordinance No.2
Amended act No. 44 of 1964
Amended act No. 1 of 1970
protection of wild life in natural reserves and sanctuaries
Nature reserves and jungle corridors incorporated into national
reserves Removal of controlled hunting
provision from the ordinance
1953 National forest policy
Re-stated in 1972 and 1980 and updated in 1995
Emphasis on conserving forests to preserve and ameliorate environment
and to protect flora and fauna for aesthetic, scientific, historical and
socio-economic reasons 1969 UNESCO Biological Programme and
1975UNESCO Man and Biosphere (MAB) Programme
Arboreta representative of the main bio-climatic zones established in forests
1988 National heritage wilderness areas act No.3
Protection of state lands having unique ecosystems, genetic resources or
outstanding natural features
1990 National policy for wild life conservation
Objectives include the maintenance of ecological processes and preservation
of genetic diversity, ex-situ conservation
5
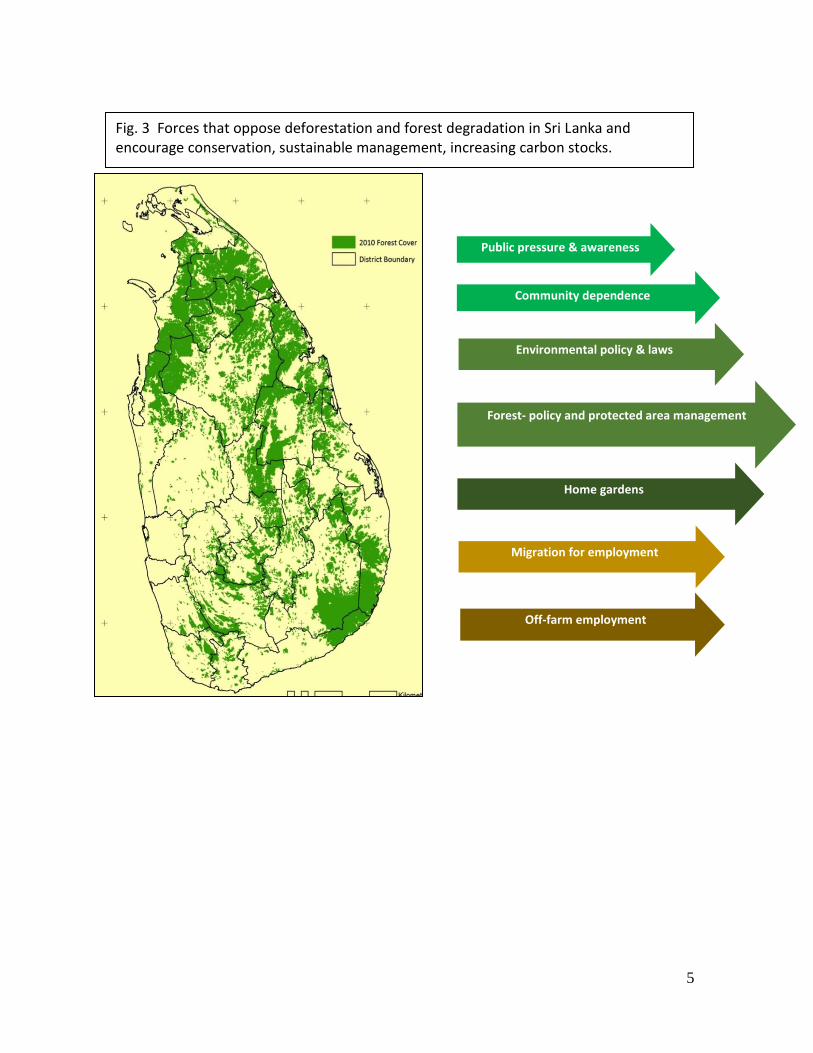
Public pressure & awareness
Environmental policy & laws
Community dependence
Forest- policy and protected area management
Home gardens
Migration for employment
Off-farm employment
Fig. 3 Forces that oppose deforestation and forest degradation in Sri Lanka and encourage conservation, sustainable management, increasing carbon stocks.
6
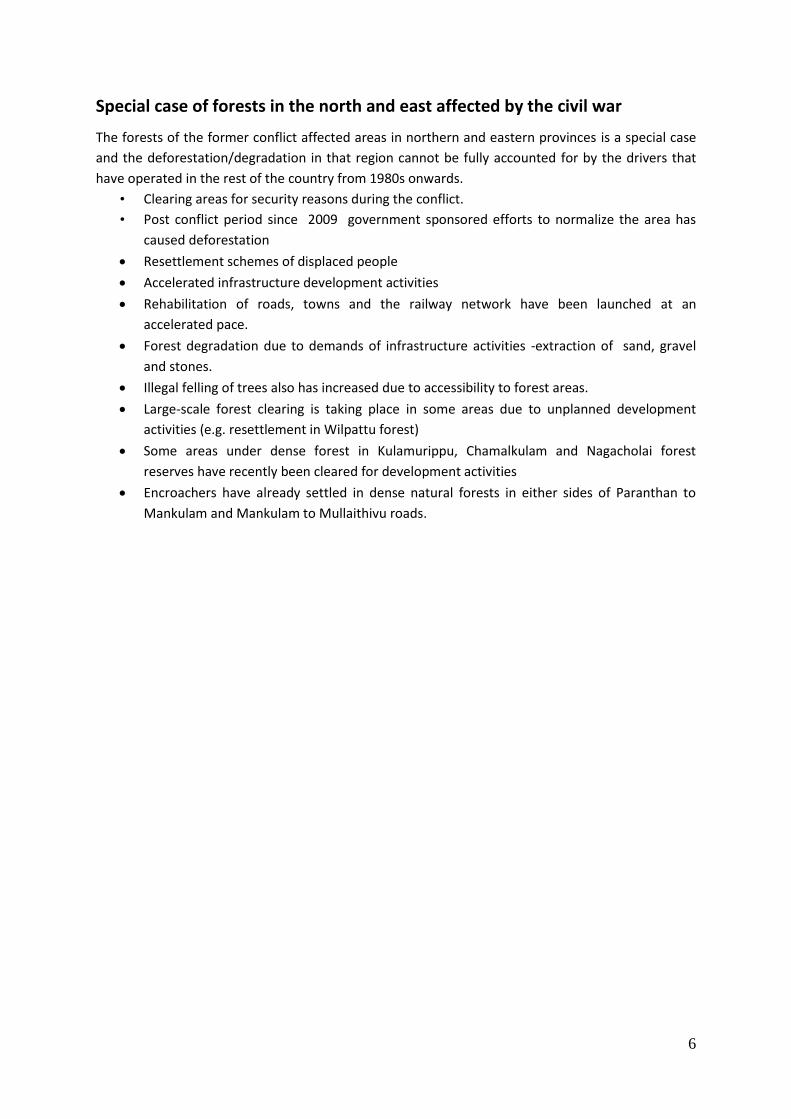
Special case of forests in the north and east affected by the civil war
The forests of the former conflict affected areas in northern and eastern provinces is a special case
and the deforestation/degradation in that region cannot be fully accounted for by the drivers that
have operated in the rest of the country from 1980s onwards.
• Clearing areas for security reasons during the conflict.
• Post conflict period since 2009 government sponsored efforts to normalize the area has
caused deforestation
Resettlement schemes of displaced people
Accelerated infrastructure development activities
Rehabilitation of roads, towns and the railway network have been launched at an
accelerated pace.
Forest degradation due to demands of infrastructure activities -extraction of sand, gravel
and stones.
Illegal felling of trees also has increased due to accessibility to forest areas.
Large-scale forest clearing is taking place in some areas due to unplanned development
activities (e.g. resettlement in Wilpattu forest)
Some areas under dense forest in Kulamurippu, Chamalkulam and Nagacholai forest
reserves have recently been cleared for development activities
Encroachers have already settled in dense natural forests in either sides of Paranthan to
Mankulam and Mankulam to Mullaithivu roads.
7
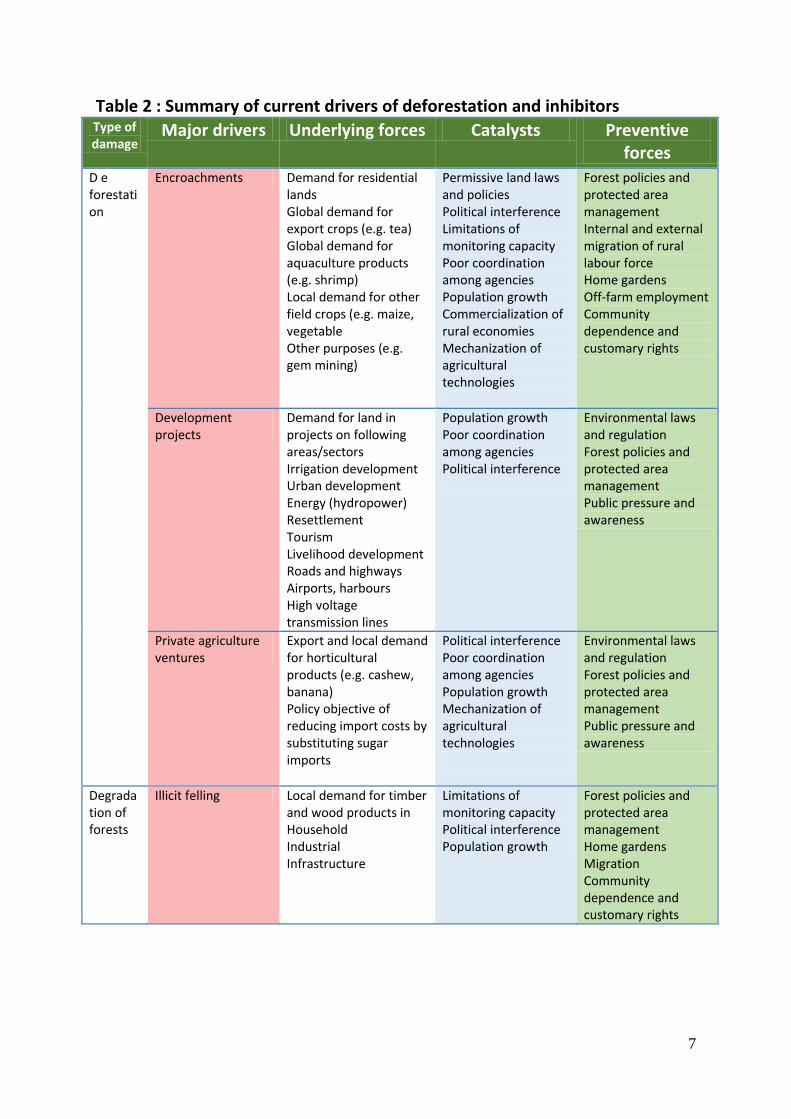
Table 2 : Summary of current drivers of deforestation and inhibitors Type of damage
Major drivers Underlying forces Catalysts Preventive forces
D e forestation
Encroachments Demand for residential lands Global demand for export crops (e.g. tea) Global demand for aquaculture products (e.g. shrimp) Local demand for other field crops (e.g. maize, vegetable Other purposes (e.g. gem mining)
Permissive land laws and policies Political interference Limitations of monitoring capacity Poor coordination among agencies Population growth Commercialization of rural economies Mechanization of agricultural technologies
Forest policies and protected area management Internal and external migration of rural labour force Home gardens Off-farm employment Community dependence and customary rights
Development projects
Demand for land in projects on following areas/sectors Irrigation development Urban development Energy (hydropower) Resettlement Tourism Livelihood development Roads and highways Airports, harbours High voltage transmission lines
Population growth Poor coordination among agencies Political interference
Environmental laws and regulation Forest policies and protected area management Public pressure and awareness
Private agriculture ventures
Export and local demand for horticultural products (e.g. cashew, banana) Policy objective of reducing import costs by substituting sugar imports
Political interference Poor coordination among agencies Population growth Mechanization of agricultural technologies
Environmental laws and regulation Forest policies and protected area management Public pressure and awareness
Degradation of forests
Illicit felling Local demand for timber and wood products in Household Industrial Infrastructure
Limitations of monitoring capacity Political interference Population growth
Forest policies and protected area management Home gardens Migration Community dependence and customary rights
8
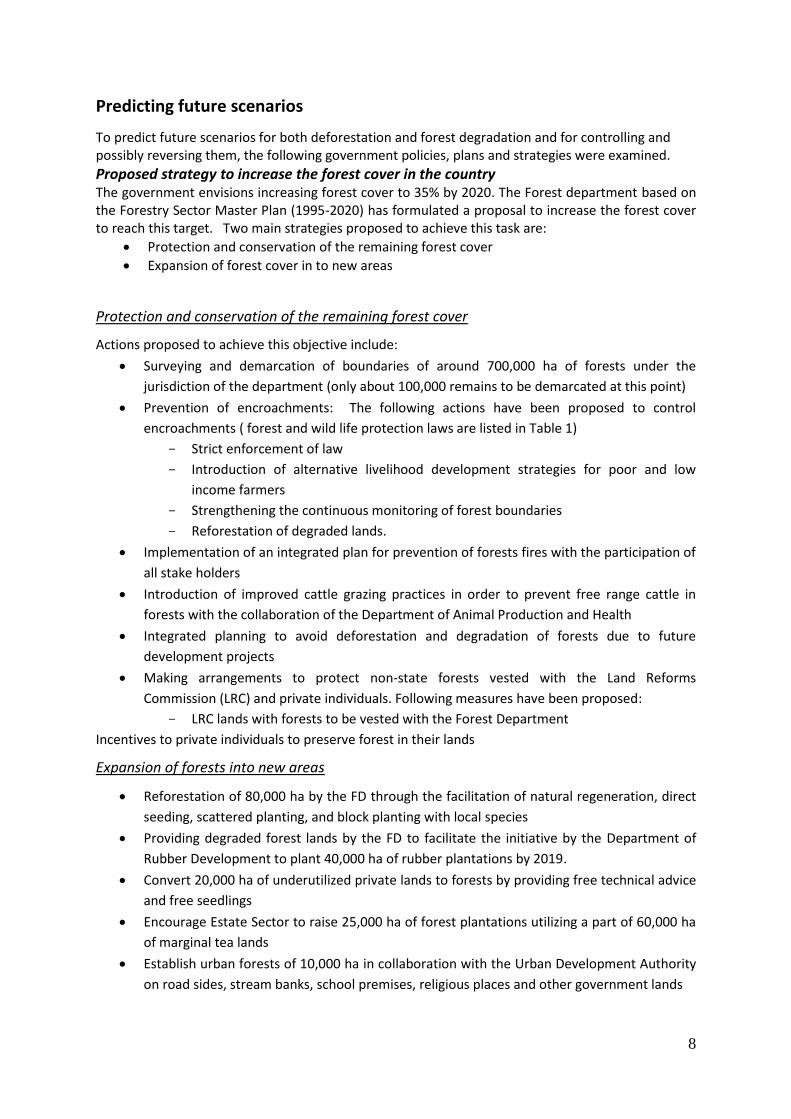
Predicting future scenarios
To predict future scenarios for both deforestation and forest degradation and for controlling and possibly reversing them, the following government policies, plans and strategies were examined.
Proposed strategy to increase the forest cover in the country The government envisions increasing forest cover to 35% by 2020. The Forest department based on the Forestry Sector Master Plan (1995-2020) has formulated a proposal to increase the forest cover to reach this target. Two main strategies proposed to achieve this task are:
Protection and conservation of the remaining forest cover
Expansion of forest cover in to new areas
Protection and conservation of the remaining forest cover
Actions proposed to achieve this objective include:
Surveying and demarcation of boundaries of around 700,000 ha of forests under the
jurisdiction of the department (only about 100,000 remains to be demarcated at this point)
Prevention of encroachments: The following actions have been proposed to control
encroachments ( forest and wild life protection laws are listed in Table 1)
Strict enforcement of law
Introduction of alternative livelihood development strategies for poor and low
income farmers
Strengthening the continuous monitoring of forest boundaries
Reforestation of degraded lands.
Implementation of an integrated plan for prevention of forests fires with the participation of
all stake holders
Introduction of improved cattle grazing practices in order to prevent free range cattle in
forests with the collaboration of the Department of Animal Production and Health
Integrated planning to avoid deforestation and degradation of forests due to future
development projects
Making arrangements to protect non-state forests vested with the Land Reforms
Commission (LRC) and private individuals. Following measures have been proposed:
LRC lands with forests to be vested with the Forest Department
Incentives to private individuals to preserve forest in their lands
Expansion of forests into new areas
Reforestation of 80,000 ha by the FD through the facilitation of natural regeneration, direct
seeding, scattered planting, and block planting with local species
Providing degraded forest lands by the FD to facilitate the initiative by the Department of
Rubber Development to plant 40,000 ha of rubber plantations by 2019.
Convert 20,000 ha of underutilized private lands to forests by providing free technical advice
and free seedlings
Encourage Estate Sector to raise 25,000 ha of forest plantations utilizing a part of 60,000 ha
of marginal tea lands
Establish urban forests of 10,000 ha in collaboration with the Urban Development Authority
on road sides, stream banks, school premises, religious places and other government lands
9
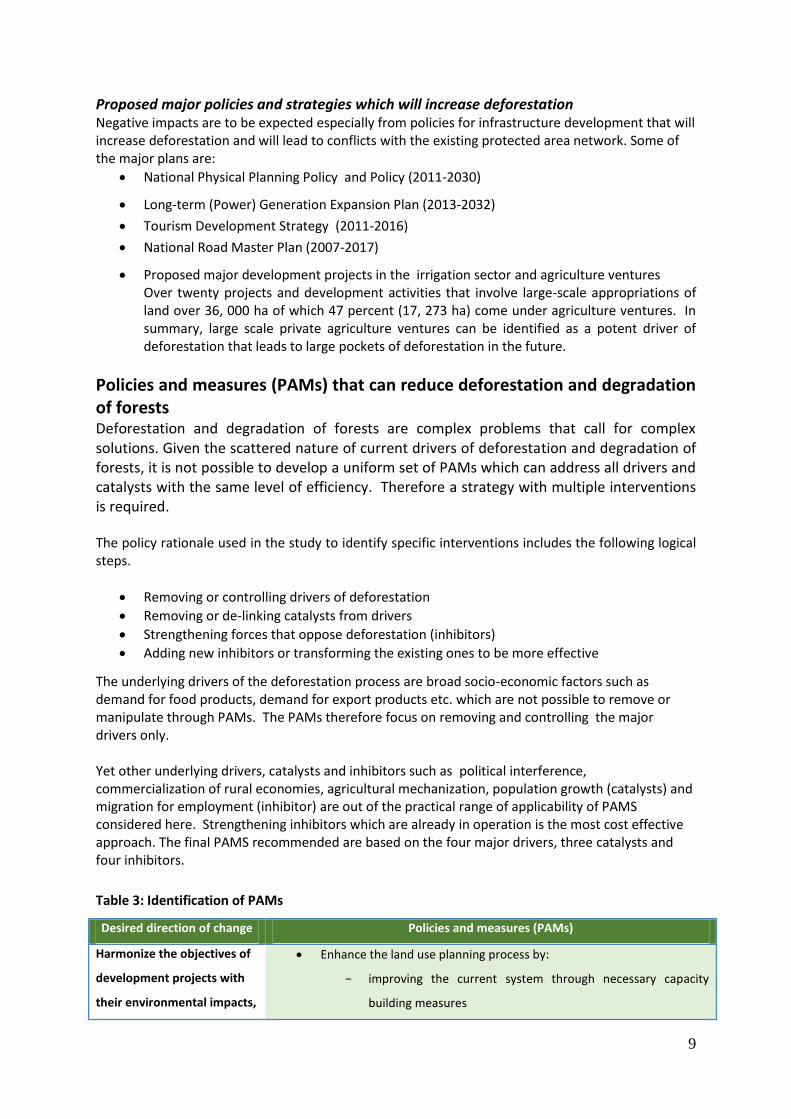
Proposed major policies and strategies which will increase deforestation Negative impacts are to be expected especially from policies for infrastructure development that will increase deforestation and will lead to conflicts with the existing protected area network. Some of the major plans are:
National Physical Planning Policy and Policy (2011-2030)
Long-term (Power) Generation Expansion Plan (2013-2032)
Tourism Development Strategy (2011-2016)
National Road Master Plan (2007-2017)
Proposed major development projects in the irrigation sector and agriculture ventures Over twenty projects and development activities that involve large-scale appropriations of land over 36, 000 ha of which 47 percent (17, 273 ha) come under agriculture ventures. In summary, large scale private agriculture ventures can be identified as a potent driver of deforestation that leads to large pockets of deforestation in the future.
Policies and measures (PAMs) that can reduce deforestation and degradation of forests
Deforestation and degradation of forests are complex problems that call for complex solutions. Given the scattered nature of current drivers of deforestation and degradation of forests, it is not possible to develop a uniform set of PAMs which can address all drivers and catalysts with the same level of efficiency. Therefore a strategy with multiple interventions is required. The policy rationale used in the study to identify specific interventions includes the following logical steps.
Removing or controlling drivers of deforestation
Removing or de-linking catalysts from drivers
Strengthening forces that oppose deforestation (inhibitors)
Adding new inhibitors or transforming the existing ones to be more effective
The underlying drivers of the deforestation process are broad socio-economic factors such as demand for food products, demand for export products etc. which are not possible to remove or manipulate through PAMs. The PAMs therefore focus on removing and controlling the major drivers only. Yet other underlying drivers, catalysts and inhibitors such as political interference, commercialization of rural economies, agricultural mechanization, population growth (catalysts) and migration for employment (inhibitor) are out of the practical range of applicability of PAMS considered here. Strengthening inhibitors which are already in operation is the most cost effective approach. The final PAMS recommended are based on the four major drivers, three catalysts and four inhibitors.
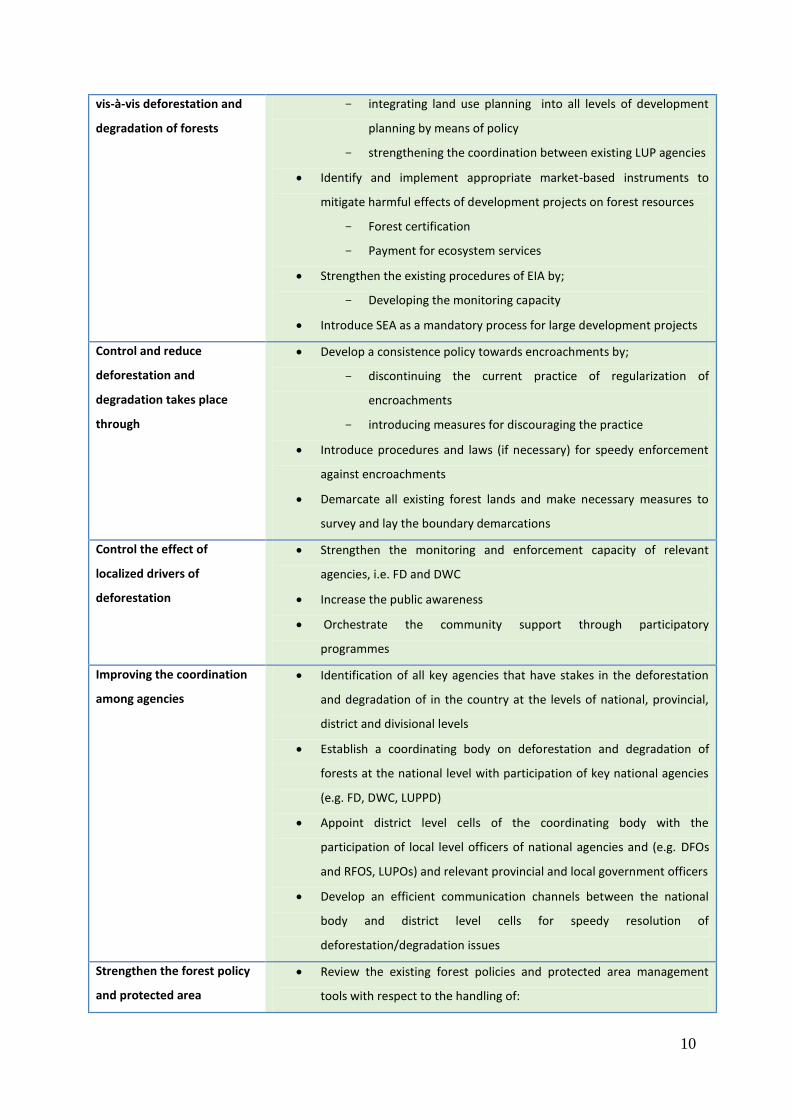
Table 3: Identification of PAMs
Desired direction of change Policies and measures (PAMs)
Harmonize the objectives of
development projects with
their environmental impacts,
Enhance the land use planning process by:
improving the current system through necessary capacity
building measures
10
vis-à-vis deforestation and
degradation of forests
integrating land use planning into all levels of development
planning by means of policy
strengthening the coordination between existing LUP agencies
Identify and implement appropriate market-based instruments to
mitigate harmful effects of development projects on forest resources
Forest certification
Payment for ecosystem services
Strengthen the existing procedures of EIA by;
Developing the monitoring capacity
Introduce SEA as a mandatory process for large development projects
Control and reduce
deforestation and
degradation takes place
through
Develop a consistence policy towards encroachments by;
discontinuing the current practice of regularization of
encroachments
introducing measures for discouraging the practice
Introduce procedures and laws (if necessary) for speedy enforcement
against encroachments
Demarcate all existing forest lands and make necessary measures to
survey and lay the boundary demarcations
Control the effect of
localized drivers of
deforestation
Strengthen the monitoring and enforcement capacity of relevant
agencies, i.e. FD and DWC
Increase the public awareness
Orchestrate the community support through participatory
programmes
Improving the coordination
among agencies
Identification of all key agencies that have stakes in the deforestation
and degradation of in the country at the levels of national, provincial,
district and divisional levels
Establish a coordinating body on deforestation and degradation of
forests at the national level with participation of key national agencies
(e.g. FD, DWC, LUPPD)
Appoint district level cells of the coordinating body with the
participation of local level officers of national agencies and (e.g. DFOs
and RFOS, LUPOs) and relevant provincial and local government officers
Develop an efficient communication channels between the national
body and district level cells for speedy resolution of
deforestation/degradation issues
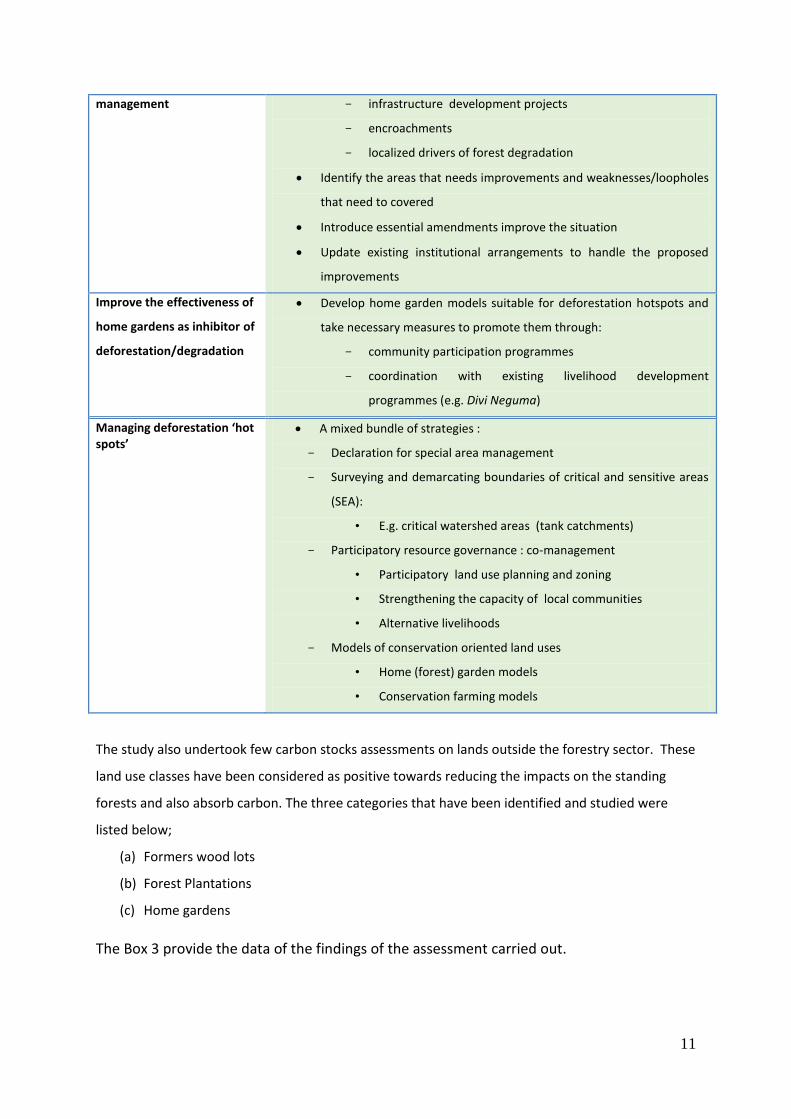
Strengthen the forest policy
and protected area
Review the existing forest policies and protected area management
tools with respect to the handling of:
11
management infrastructure development projects
encroachments
localized drivers of forest degradation
Identify the areas that needs improvements and weaknesses/loopholes
that need to covered
Introduce essential amendments improve the situation
Update existing institutional arrangements to handle the proposed
improvements
Improve the effectiveness of
home gardens as inhibitor of
deforestation/degradation
Develop home garden models suitable for deforestation hotspots and
take necessary measures to promote them through:
community participation programmes
coordination with existing livelihood development
programmes (e.g. Divi Neguma)
Managing deforestation ‘hot spots’
A mixed bundle of strategies :
Declaration for special area management
Surveying and demarcating boundaries of critical and sensitive areas
(SEA):
• E.g. critical watershed areas (tank catchments)
Participatory resource governance : co-management
• Participatory land use planning and zoning
• Strengthening the capacity of local communities
• Alternative livelihoods
Models of conservation oriented land uses
• Home (forest) garden models
• Conservation farming models
The study also undertook few carbon stocks assessments on lands outside the forestry sector. These
land use classes have been considered as positive towards reducing the impacts on the standing
forests and also absorb carbon. The three categories that have been identified and studied were
listed below;
(a) Formers wood lots
(b) Forest Plantations
(c) Home gardens
The Box 3 provide the data of the findings of the assessment carried out.
12
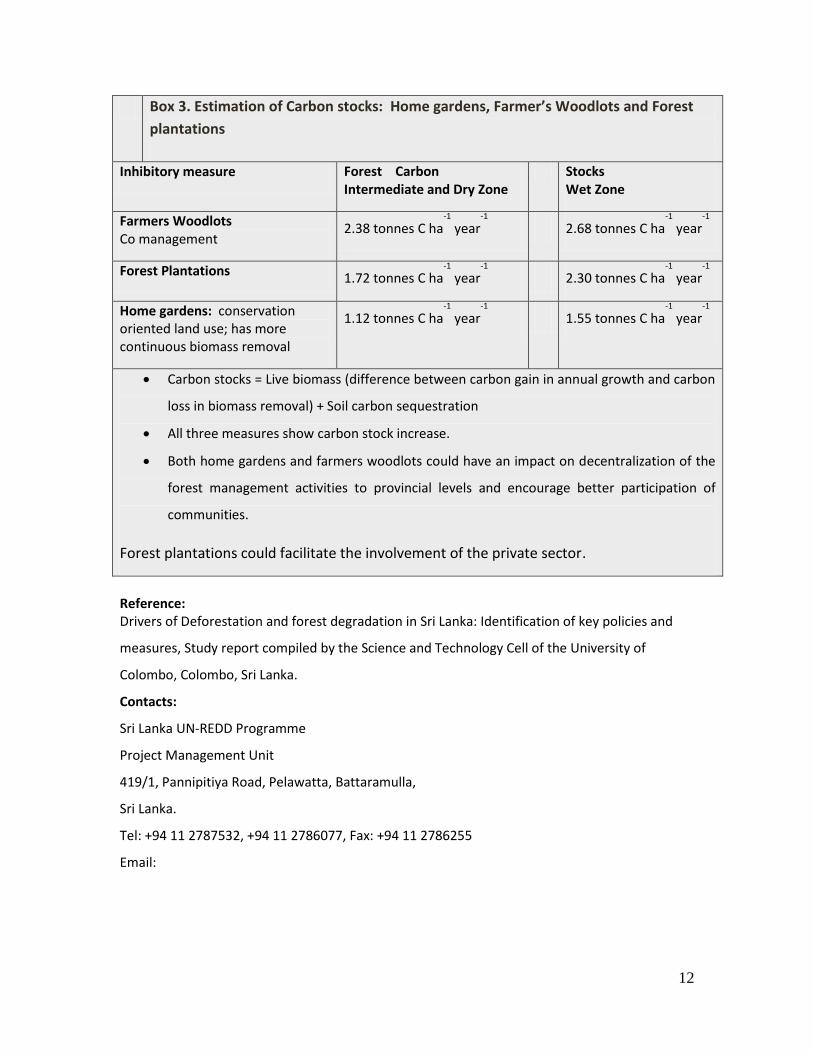
Box 3. Estimation of Carbon stocks: Home gardens, Farmer’s Woodlots and Forest
plantations
Inhibitory measure Forest Carbon Intermediate and Dry Zone
Stocks Wet Zone
Farmers Woodlots Co management
2.38 tonnes C ha-1
year-1
2.68 tonnes C ha-1
year-1
Forest Plantations 1.72 tonnes C ha
-1
year-1
2.30 tonnes C ha-1
year-1
Home gardens: conservation oriented land use; has more continuous biomass removal
1.12 tonnes C ha-1
year-1
1.55 tonnes C ha-1
year-1
Carbon stocks = Live biomass (difference between carbon gain in annual growth and carbon
loss in biomass removal) + Soil carbon sequestration
All three measures show carbon stock increase.
Both home gardens and farmers woodlots could have an impact on decentralization of the
forest management activities to provincial levels and encourage better participation of
communities.
Forest plantations could facilitate the involvement of the private sector.
Reference: Drivers of Deforestation and forest degradation in Sri Lanka: Identification of key policies and
measures, Study report compiled by the Science and Technology Cell of the University of
Colombo, Colombo, Sri Lanka.
Contacts:
Sri Lanka UN-REDD Programme
Project Management Unit
419/1, Pannipitiya Road, Pelawatta, Battaramulla,
Sri Lanka.
Tel: +94 11 2787532, +94 11 2786077, Fax: +94 11 2786255
Email: