Embed Size (px)
Citation preview

Pam Blanchard Last Updated on 8/19/2017
DEFORESTATION page 1
Deforestation By Pam Blanchard.
Focus on Inquiry The student will collect data through a simulation game on deforestation and be able to describe how humans have impacted a simulated forest.
Lesson Content Overview Students will learn about subsistence farming and its role in rain forest (primary) forest deforestation.
Duration 60 minutes
Setting classroom
Grouping 2 to 4 students
PTI Inquiry Subskills
Lesson Components
Estimated Time
Inquiry Subskills
Used
Technology Used
Level of Student
Engagement Brief Description
Engage 15 min 3.6 Internet 3
Students quiz each other on facts about deforestation to generate curiosity and interest. Students then view a NASA visualization of rainforest deforestation and make observations. Another Internet mapping tool is used to zoom into the area.
Explore 30 min 3.7, 4.2 None 3 Students perform a simulation of deforestation due to subsistence farming. They record data for analysis.
Explain 15 min 5.7, 5.9,
7.3 None 2
Students share graphed data in a gallery walk. They discuss how their forest plots changed due to human activity. They also discuss how this simulation has both strengths and weaknesses in representing reality.
Expand (optional)
15 min 3.6 Internet 2
Students use the Global Forest Watch mapping tool to investigate an area of the Earth they are personally interested in. They describe in writing how this area has changed over the last 10-20 years.
Evaluate 5 min None 1
Level of Student Engagement 1 Low Listen to lecture, observe the teacher, individual reading, teacher demonstration, teacher-centered instruction
2 Moderate Raise questions, lecture with discussion, record data, make predictions, technology interaction with assistance
3 High Hands-on activity or inquiry; critique others, draw conclusions, make connections, problem-solve, student-centered
Next Generation Science Standards – Inquiry NGSS Practice 2: Developing and Using Models NGSS Practice 4: Analyzing and Interpreting Data NGSS Practice 8: Obtaining, Evaluating and Communicating Information
Next Generation Science Standards – Earth Science (Disciplinary Core Idea) ESS3.A: Natural Resources. Humans depend on Earth’s land, ocean, atmosphere, and biosphere for many
different resources. Minerals, fresh water, and biosphere resources are limited, and many are not renewable or replaceable over human lifetimes. These resources are distributed unevenly around the planet as a result of past geologic processes.
Florida Science Standards - Inquiry SC.7.N.3.2 Identify the benefits and limitations of the use of a scientific model.
Florida Science Standards – Earth Science SC.7.E.6.6 Identify the impact that humans have had on Earth, such as deforestation, urbanization,
desertification, erosion, air and water quality, changing the flow of water.

Pam Blanchard Last Updated on 8/19/2017
DEFORESTATION page 2
Materials and Advance Preparation Materials List
Class set:
Internet
SmartBoard or other projector
Student materials (groups of 2 or 4):
1 deforestation simulation board
112 dried beans (NOTE: 1 2-lb bag of dried beans is sufficient for a set of 16 sets)
16 forest plot cards
16 subsistence farming squares
16 secondary forest growth squares
3 small envelopes
1 plastic baggie or larger envelope (for the beans)
Blackline Masters 1. Blackline Master #1: Deforestation Quiz Quiz Trade Cards (eight pages) – one set per class…
you need one card for each student 2. Blackline Master #2: Deforestation Simulation Directions and Student Lab Sheets (6 pages) –
one per student 3. Blackline Master #3: Deforestation Simulation Board – one per group 4. Blackline Master #4: Chips: Forest Plot, Secondary Forest, Subsistence Farming (2 pages) –
one set per group 5. Blackline Master #5: Checking for Understanding: Deforestation (one page) – one per student
Advance Preparation 1. Run off Blackline Masters (see Blackline Master list above) 2. Cut out Quiz Quiz Trade cards (Blackline Master 1) on the dotted lines. Fold cards over on the
solid line in the middle so that the question is on one side and the answer is on the other side. Secure the two sides of the card together with a staple or tape.
3. Cut chips (three sets) and place in envelopes (Blackline Master 4) 4. Count out beans (~120/baggie) 5. Make sure the two Internet sites work: http://svs.gsfc.nasa.gov/cgi-bin/details.cgi?aid=2116 and
http://www.globalforestwatch.org 6. Consider laminating Simulation Board (Blackline Master #3).
Lesson Information Learning Objectives
1. The student will be able to use the data collected in this lesson (condition) to correctly (standard) describe how their forest changed over 7 years (task).
2. The student will be able to correctly (standard) describe in detail, based on their data (condition), how humans impacted the forest (task).
3. The student will be able to correctly (standard) describe in detail, based on their experience with this simulation (condition), at least one benefit and weakness with the simulation (task).
Prior Knowledge Needed by the Students
Need to know how to record and graph data (bar and line graphs). Background Information Deforestation occurs when trees are removed from a forest. This initially occurred in primary (virgin) forests when local groups cleared land for subsistence farming. Tree roots help hold soil in place so, as trees were removed, erosion often occurred. Flooding from rainwater collected in the lowest part of the topography. Animals that once considered this portion of the forest to be their homes, sought refuge

Pam Blanchard Last Updated on 8/19/2017
DEFORESTATION page 3
elsewhere. Subsistence farmers did not understand that the soil that supported these old forests was not rich in nutrients. The lack of nutrients in the soil decreased crop size in many places and the farmland began to provide smaller crops in as little as three years. When this occurred, farmers moved to a nearby strip of forest and began the process all over. Over time, urbanization and globalization have greatly accelerated the loss of primary forests as wood from these forests are prized as building and furniture materials. Urbanization happens when cities are expanded, often-involving people moving into previously unsettled areas adjacent to the city. Globalization is the interconnection of countries and industries around the world, driven by international trade and investment and encourages consumption while opening new markets for hard to find forest products: increases trade, and leads to more logging worldwide. Roads into primary forests made access easier. Large earth moving equipment pushed off these initial roads into areas never accessed before, leaving a large fish-bone shaped scar in the forest as the large trees are harvested and bare ground left in their wake. These barren areas are left to their own devices in terms of healing. A secondary forest will eventually grow, but will take 50 or more years to reach maturity. The types of tree and other plant species will often be very different from the native primary forest that once grew here. This means that very likely a different suite of animals will take up residence here based on the new composition of the forest ecosystem. References Kukreja, R. (no date). Deforestation facts. Accessed at http://www.conserve-energy-future.com/various-deforestation-
facts.php ____ (no date). Deforestation facts for kids. Accessed at http://www.theworldcounts.com/stories/Deforestation-Facts-
for-Kids
Lesson Procedure Engage
1. Today’s lesson is going to be on the topic of deforestation. Ask students, “what do you know about deforestation?” Strategy: Think-Pair-Share. Link to strategy directions: http://www.readingrockets.org/strategies/think-pair-share
Report out from the groups. Make a list on the board. 2. To allow students to explore some facts about deforestation, students will each receive one of the
cards from Deforestation Quiz Quiz Trade Cards (Blackline Master 1). They will use the Kagan Quiz, Quiz, Trade strategy to quiz one another. Link to strategy directions: http://www.theteachertoolkit.com/index.php/tool/quiz-quiz-trade
(NOTE: There are 32 cards in the Blackline Master. Make extra copies if you have more than 32 students.)
3. So students can get an idea of the scale of deforestation, review a NASA visualization made with four Landsat images of the area of Rondonia, Brazil, from 1975 to 2001: http://svs.gsfc.nasa.gov/cgi-bin/details.cgi?aid=2116
4. Take a look at the Rondonia area using the Global Forest Watch mapping application at http://www.globalforestwatch.org
Explore
Part 1. 1. Everyone should have the following materials: plastic baggie with beans, deforestation simulation
board, and 3 envelopes (plot cards, sustenance farming cards, secondary farming cards), and a lab packet (Blackline Master 2).
2. Set up your forest by placing 7 dried beans on each of the 16 squares on Blackline Master 3: Deforestation Simulation Board. Each square represents a plot of healthy primary forest. Each bean represents a portion of the healthy forest that lives on that plot of land.
Part 2. 1. You will begin by simulating what might happen if there is a group of four subsistence farmers
living in your forest for 7 years. Follow steps 2 through 6 to do this.

Pam Blanchard Last Updated on 8/19/2017
DEFORESTATION page 4
2. Mix the forest plot cards around in the envelope. Select a plot card and remove two beans from the corresponding numbered forest plot on Blackline Master 3. Record the plot number on your data sheet. Your Subsistence Farmer Co-Op has just begun to cut and clear land for their farms. You will pull a total of 8 forest plot cards to simulate the amount of trees they have removed from your forest during one year’s time.
3. Return the plot card to the envelope. Repeat Step 2 seven more times to show how the Farmer’s Co-Op expands their operation over time. Remember to remove two beans each time you select a plot card. If there is only one bean in the plot of land corresponding to the card you draw, remove that bean and randomly remove a bean from a nearby plot of land. This represents the fact that your farmer co-op group has moved to a neighboring plot to expand their farm. If no beans remain in the plot of land corresponding to the card you draw, randomly remove two beans from another adjoining plot of land. Make sure you put the plot card back in the envelope after each draw. (NOTE: If you have laminated the simulation board, you can have students keep track of how many years each of your subsistence farming plots have been farmed. This will make it easier to know when to replace this label with secondary forest growth).
4. At the end of 8 draws, observe the condition of your forest. Are there any areas that are completely clear of forest? For plots that have zero beans remaining, place a Subsistence Farming square on each of these plots. These plots represent cleared land under subsistence cultivation by the Farmer’s Co-Op.
5. In a data table, record the number of beans in each of the 16 forest plots. Count and record the number of plots that are: - healthy old-growth primary forest (plots with seven beans), - impacted primary forest (plots with four, five or six beans), - endangered primary forest (plots with one, two or three beans), - subsistence farming plots (plots that have zero beans after Step 3; since this is the first year a
plot is in subsistence farming, mark a 0-x), and - barren soil/secondary forest begins to grow plot (subsistence farming fails after three years,
plot converts to barren soil 6. Repeat steps 2 through 5 a total of 6 more times to simulate a seven years of data on your forest
plot. Make sure you record the remaining trees (beans) left at the end of the year and condition of your forest in the data table. On the data chart, mark a 0-x,x for subsistence plots that are now in their second year, and 0-x,x,x for those in their last year of subsistence farming. These plots will convert to secondary forest growth the next year – and so they will be marked 0-2nd forest until the end of the simulation.
7. Use the data you have collected to make a line graph that shows how the number of plots in all five categories has changed over the course of the seven years that you ran this simulation. Label the scale on the x-axis with the number of years that have gone by. Label the y-axis from 1 to 16 for the number of plots. Create a key to show what category of forest health each line represents.
. Explain
1. Share your group results with your class and compare your graphs with other student groups’ graphs. You can use a gallery walk strategy to accomplish this sharing.
2. Summarize what happened to your forest plot over a span of seven years. Did everyone have the same result?
3. In addition to the loss of the primary growth forest, what effect to you think this activity had on the soil? Animals? Humans?
4. This simulation showed the effects on a primary growth forest by subsistence farmers. These farmers generally do not have bulldozers or other heavy equipment. How would a forest production company that had money to spend on heavy equipment change the scenario? How might you change this simulation to show the effects of a different type of production?
5. What are the strengths and weaknesses of this simulation (model)?

Pam Blanchard Last Updated on 8/19/2017
DEFORESTATION page 5
Expand 1. Ask students to use the Global Forest Watch mapping application
(http://www.globalforestwatch.org) to investigate an area of the Earth that they are personally interested in. Have them identify the area, and using the time-lapse tool at the bottom of the interactive map, describe in detail how the area’s forest has changed.
Evaluate
FORMAL EVALUTION See Blackline Master 5.
INFORMAL or OPTIONAL EVALUTIONS 1. The students’ data sheets from the simulation can be picked up and assessed for completeness
and accuracy.
Supplementary Resources
Teachers Global Forest Watch. (no date). GFW Interactive Map. Accessed at http://www.globalforestwatch.org/.
An interactive map that allows the user to zoom in to an point on Earth to see the gain/loss in forests, changes in land use, conservation and many more attributes.
Riebeek, H. (February 1, 2008). Ancient forest to modern city: Mapping landscape change in the United States. NASA Earth Observatory website. Accessed at http://earthobservatory.nasa.gov/Features/AncientForest/ancient_forest7.php A series of stories about how a specific site’s landscape was mapped from the mid-1600’s to today.
Thomson, J. (April 19, 2001). Deforestation of Rondonia, Brazil, from 1975 to 2001. NASA Scientific Visualization Studio. Accessed at http://svs.gsfc.nasa.gov/cgi-bin/details.cgi?aid=2116. NASA visualizations using four Landsat images of the Rondonia area in Brazil, taken in 1975, 1986, 1992, 2001.
Jones, T. (February 11, 2010). Urbanization, Deforestation, Reforestation. State of the Planet: Earth Institute, Columbia University Website. Accessed at http://blogs.ei.columbia.edu/2010/02/11/urbanization-deforestation-reforestation/ Interesting article about the three areas, plus ‘rewildling.’ Additional links to related articles.
CITATION OF SOURCES.
____ (no date). Deforestation facts for kids. Accessed at http://www.theworldcounts.com/stories/Deforestation-Facts-for-Kids.
____ (no date). Jason Activity 2.3: How Many Nutria Are Too Many Nutria? Jason Digital Learning Resources website. Accessed at http://gated.jason.org/digital_library/26427.aspx
EarthLabs. (no date). Forests: Changes in the Land. Accessed at http://serc.carleton.edu/eslabs/carbon/4a.html and http://serc.carleton.edu/eslabs/carbon/4b.html.
Kukreja, R. (no date). Deforestation facts. Accessed at http://www.conserve-energy-future.com/various-deforestation-facts.php.
Tree clipart –royalty free use. Accessed at http://www.clipartbest.com/clipart-jRcG7EeTL Urquhart, G., Chomentowski, W., Skole, D., & Barber, C. (no date). Tropical deforestation. Earth
Observatory Website. Accessed at http://earthobservatory.nasa.gov/Features/Deforestation/tropical_deforestation_2001.pdf.
____ Yes, I cited all materials and resources used in this lesson. Pam Blanchard
Lesson author signature

Pam Blanchard Last Updated on 8/19/2017
DEFORESTATION page 6
Deforestation Quiz Quiz Trade Card 1
Forests help reduce a warming
climate by absorbing the
greenhouse gas
A. carbon dioxide
B. water vapor
C. ozone
D. oxygen
Answer: A
Card 2
When deforestation occurs, land is
converted from forests to
A. green space or parks
B. non-forest uses
C. non-farm uses
D. non-city uses
Answer: B
Card 3
Forests help cool the atmosphere
through the process of
A. photosynthesis
B. water absorption
C. evapotranspiration
D. oxygen release
Answer: C
Card 4
One of the main causes of
deforestation is
A. agriculture
B. growing cities
C. firewood collection
D. road building
Answer: A
Blackline Master #1

Pam Blanchard Last Updated on 8/19/2017
DEFORESTATION page 7
Card 5
Which of the following is NOT a
major rainforest?
A. Madagascar
B. Congo
C. Amazon
D. Smokey Mountains
Answer: D
Card 6
Every minute, forests the size of ___
football fields are cut down.
A. 10
B. 20
C. 30
D. 60
Answer: B
Card 7
Forests cover ____ of the Earth’s
surface?
A. 10%
B. 20%
C. 30%
D. 60%
Answer: C
Card 8
One and a half acres of forest is cut
down every _____.
A. second
B. minute
C. hour
D. day
Answer: A

Pam Blanchard Last Updated on 8/19/2017
DEFORESTATION page 8
Card 9
If the current rate of deforestation
continues, rainforests will be gone
from the Earth in
A. 10 years
B. 100 years
C. 1000 years
D. never, because we keep
replanting the forests
Answer: B
Card 10
Scientists estimate that ____ of the
world’s oxygen is produced by the
Amazon rainforest.
A. 10%
B. 20%
C. 30%
D. 60%
Answer: B
Card 11
____ of the world’s tropical
rainforests have already been
cleared.
A. one-fourth
B. one-third
C. one-half
D. three-fourths
Answer: C
Card 12
Trees play an important role in our
ecosystem by absorbing ____.
A. carbon
B. oxygen
C. floods
D. minerals
Answer: A

Pam Blanchard Last Updated on 8/19/2017
DEFORESTATION page 9
Card 13
One reason deforestation occurs is to
make room to enlarge farms.
Another big reason, is to make room
for
A. public parks
B. modern roads
C. electrical lines
D. cattle pastures & ranches
Answer: D
Card 14
Commercial _____ means the trees
are being cut down for sale as timber
and pulp.
A. pasteurization
B. climate change
C. transpiration
D. logging
Answer: D
Card 15
A “secondary forest" means
A. trees have started to regrow in a
clear-cut area.
B. a primary forest has transitioned
into a newer, secondary forest.
C. trees in this area have not yet
been disturbed by deforestation.
D. this forest is an exact duplicate of
the primary forest.
Answer: A
Card 16
A “primary” forest means
A. this forest has not been disturbed
by deforestation.
B. this forest has only been disturbed
once in its history.
C. this forest contains the youngest
trees in the region
D. the same thing as “deforested.”
Answer: A

Pam Blanchard Last Updated on 8/19/2017
DEFORESTATION page 10
Card 17
In the 1980’s an area slightly smaller
than __ was estimated to have been
deforested annually in South
America.
A. Florida
B. Texas
C. Alaska
D. Connecticut
Answer: A
Card 18
When a forest is cut and burned, the
carbon stored in the wood joins with
oxygen and is released as
A. water vapor gas
B. carbon monoxide gas
C. carbon dioxide gas
D. sulfur dioxide gas
Answer: C
Card 19
Releasing CO2 into the atmosphere
enhances the
A. ozone layer in the stratosphere.
B. water absorption of clouds.
C. greenhouse effect.
D. probability of precipitation
Answer: C
Card 20
After the trees are cut down in a
tropical rain forest they are burned to
A. release nutrients back to the soil.
B. decrease the richness of the soil.
C. prevent firewood collection.
D. take up nutrients from the soil.
Answer: A

Pam Blanchard Last Updated on 8/19/2017
DEFORESTATION page 11
Card 21
Farmers planting on newly cleared
rainforest soil found they can only
grow crops for ___ years before the
ground can no longer support crops
A. 20 years
B. 15 years
C. 8 years
D. 3 years
Answer: D
Card 22
A secondary forest may take as long
as ___ years to grow back..
A. 10
B. 20
C. 30
D. 50
Answer: D
Card 23
Shade farming, which leaves some
of the original rain forest trees, is
used for shade-loving crops like
A. bananas
B. pineapples
C. coffee and chocolate
D. palm and dates
Answer: C
Card 24
In clear-cutting, all the trees are
removed, including the ___.
A. stumps
B. natural water drainages
C. roads
D. electrical lines
Answer: A

Pam Blanchard Last Updated on 8/19/2017
DEFORESTATION page 12
Card 25
Forests help reduce a warming
climate by absorbing the greenhouse
gas
A. carbon dioxide
B. water vapor
C. ozone
D. oxygen
Answer: A
Card 26
When deforestation occurs, land is
converted from forests to
A. green space or parks
B. non-forest uses
C. non-farm uses
D. non-city uses
Answer: B
Card 27
Forests help cool the atmosphere
through the process of
A. photosynthesis.
B. water absorption.
C. evapotranspiration.
D. oxygen release.
Answer: C
Card 28
One of the main causes of
deforestation is
A. agriculture.
B. growing cities.
C. firewood collection.
D. road building.
Answer: A
Pam Blanchard Last Updated on 8/19/2017
DEFORESTATION page 13
Card 29
Farmers working clear-cut areas in
the rainforest found their crops
A. prospered after 3-5 years.
B. began to fail after 3-5 years.
C. relocated to other areas.
D. used more fertilizer.
Answer: D
Card 30
Every minute, forests the size of ___
football fields are cut down.
A. 10
B. 20
C. 30
D. 60
Answer: B
Card 31
Forests cover ____ of the Earth’s
surface?
A. 10%
B. 20%
C. 30%
D. 60%
Answer: C
Card 32
One and a half acres of forest is cut
down every _____.
A. second
B. minute
C. hour
D. day
Answer: A

Pam Blanchard Last Updated on 8/19/2017
DEFORESTATION page 14
Name _____________________________________________ Date _______________
Deforestation Simulation Directions & Student Lab Sheets
Directions: Part 1: Prepare Your Forest 1. Set up your forest by placing 7 dried beans on each of the 16 squares of your Deforestation
Simulation Board. Each square represents a plot of healthy primary forest. Each bean represents a portion of the healthy forest that lives on that plot of land.
Part 2: Run the Simulation 1. You will begin by simulating what might happen if there is a group of four subsistence farmers
living in your forest for 7 years. Follow steps 2 through 6 to do this. 2. Mix the forest plot cards around in the envelope. Select a plot card and remove two beans from
the corresponding numbered forest plot on your Deforestation Simulation Board. Record the plot number on your data sheet. Your Subsistence Farmer Co-Op has just begun to cut and clear land for their farms. You will pull a total of 8 forest plot cards to simulate the amount of trees they have removed from your forest during one year’s time.
3. Return the plot card to the envelope. Repeat Step 2 seven more times to show how the Farmer’s Co-Op expands their operation over time. Remember to remove two beans each time you select a plot card. If there is only one bean in the plot of land corresponding to the card you draw, remove that bean and randomly remove a bean from a nearby plot of land. This represents the fact that your farmer group has moved to a neighboring plot to expand their farm. If no beans remain in the plot of land corresponding to the card you draw, randomly remove two beans from another adjoining plot of land. Make sure you put the plot card back in the envelope after each draw.
4. At the end of 8 draws, observe the condition of your forest. Are there any areas that are completely clear of forest? For plots that have zero beans remaining, place a Subsistence Farming square on each of these plots and remove their plot cards from your envelope. These plots represent cleared land under subsistence cultivation by the Farmer’s Co-Op.
5. In the data table, record the number of beans in each of the 16 forest plots. Count and record the number of plots that are:
- healthy old-growth primary forest (plots with seven beans), - impacted primary forest (plots with four, five or six beans), - endangered primary forest (plots with one, two or three beans), and - subsistence farming plots (plots that have zero beans after Step 3). - barren soil/secondary forest begins to grow plot (subsistence farming fails after
three years, plot converts to barren soil 6. Repeat steps 2 through 5 a total of 6 more times to simulate a seven years of data on your forest
plot. Make sure you record the remaining trees (beans) left at the end of the year and condition of your forest in the data table.
7. On the data chart, mark a 0-x,x for subsistence plots that are now in their second year, and 0-x,x,x for those in their last year of subsistence farming. These plots will convert to secondary forest growth the next year – and so they will be marked 0-2nd forest until the end of the simulation.
Part 3: Analyze Your Data 1. Use the data you have collected to make a line graph that shows how the number of plots in all
five categories has changed over the course of the seven years that you ran this simulation. Label the scale on the x-axis with the number of years that have gone by. Label the y-axis from 1 to 16 for the number of plots. Create a key to show what category of forest health each line represents.
Blackline Master #2

Pam Blanchard Last Updated on 8/19/2017
DEFORESTATION page 15
Forest End Year 1
Record each plot card pull below. Record the number of trees (beans) that remain in each forest plot at the end of this year.
___ ___ ___ ___ ___ ___ ___ ___
Healthy primary forest = _____ plots (seven beans remain in each plot)
Impacted primary forest = _____ plots (four, five or six beans remain in each plot)
Endangered primary forest = _____ plots (one, two or three beans remain in each plot)
Subsistence farming = _____ plots (zero beans remain in each plot)
Barren, beginning of secondary forest growth = _____ plots (After a plot has been in subsistence farming for three years, the soil becomes barren and the plot is abandoned. A secondary forest begins to grow.)
Forest End Year 2
Record each plot card pull below. Record the number of trees (beans) that remain in each forest plot at the end of this year.
___ ___ ___ ___ ___ ___ ___ ___
Healthy primary forest = _____ plots (seven beans remain in each plot)
Impacted primary forest = _____ plots (four, five or six beans remain in each plot)
Endangered primary forest = _____ plots (one, two or three beans remain in each plot)
Subsistence farming = _____ plots (zero beans remain in each plot)
Barren, beginning of secondary forest growth = _____ plots (After a plot has been in subsistence farming for three years, the soil becomes barren and the plot is abandoned. A secondary forest begins to grow.)
Forest End Year 3
Record each plot card pull below. Record the number of trees (beans) that remain in each forest plot at the end of this year.
___ ___ ___ ___ ___ ___ ___ ___
Healthy primary forest = _____ plots (seven beans remain in each plot)
Impacted primary forest = _____ plots (four, five or six beans remain in each plot)
Endangered primary forest = _____ plots (one, two or three beans remain in each plot)
Subsistence farming = _____ plots (zero beans remain in each plot)
Barren, beginning of secondary forest growth = _____ plots (After a plot has been in subsistence farming for three years, the soil becomes barren and the plot is abandoned. A secondary forest begins to grow.)

Pam Blanchard Last Updated on 8/19/2017
DEFORESTATION page 16
Forest End Year 4
Record each plot card pull below. Record the number of trees (beans) that remain in each forest plot at the end of this year.
___ ___ ___ ___ ___ ___ ___ ___
Healthy primary forest = _____ plots (seven beans remain in each plot)
Impacted primary forest = _____ plots (four, five or six beans remain in each plot)
Endangered primary forest = _____ plots (one, two or three beans remain in each plot)
Subsistence farming = _____ plots (zero beans remain in each plot)
Barren, beginning of secondary forest growth = _____ plots (After a plot has been in subsistence farming for three years, the soil becomes barren and the plot is abandoned. A secondary forest begins to grow.)
Forest End Year 5
Record each plot card pull below. Record the number of trees (beans) that remain in each forest plot at the end of this year.
___ ___ ___ ___ ___ ___ ___ ___
Healthy primary forest = _____ plots (seven beans remain in each plot)
Impacted primary forest = _____ plots (four, five or six beans remain in each plot)
Endangered primary forest = _____ plots (one, two or three beans remain in each plot)
Subsistence farming = _____ plots (zero beans remain in each plot)
Barren, beginning of secondary forest growth = _____ plots (After a plot has been in subsistence farming for three years, the soil becomes barren and the plot is abandoned. A secondary forest begins to grow.)
Forest End Year 6
Record each plot card pull below. Record the number of trees (beans) that remain in each forest plot at the end of this year.
___ ___ ___ ___ ___ ___ ___ ___
Healthy primary forest = _____ plots (seven beans remain in each plot)
Impacted primary forest = _____ plots (four, five or six beans remain in each plot)
Endangered primary forest = _____ plots (one, two or three beans remain in each plot)
Subsistence farming = _____ plots (zero beans remain in each plot)
Barren, beginning of secondary forest growth = _____ plots (After a plot has been in subsistence farming for three years, the soil becomes barren and the plot is abandoned. A secondary forest begins to grow.)

Pam Blanchard Last Updated on 8/19/2017
DEFORESTATION page 17
Forest End Year 7
Record each plot card pull below. Record the number of trees (beans) that remain in each forest plot at the end of this year.
___ ___ ___ ___ ___ ___ ___ ___
Healthy primary forest = _____ plots (seven beans remain in each plot)
Impacted primary forest = _____ plots (four, five or six beans remain in each plot)
Endangered primary forest = _____ plots (one, two or three beans remain in each plot)
Subsistence farming = _____ plots (zero beans remain in each plot)
Barren, beginning of secondary forest growth = _____ plots (After a plot has been in subsistence farming for three years, the soil becomes barren and the plot is abandoned. A secondary forest begins to grow.)
Forest End Year 8
Record each plot card pull below. Record the number of trees (beans) that remain in each forest plot at the end of this year.
___ ___ ___ ___ ___ ___ ___ ___
Healthy primary forest = _____ plots (seven beans remain in each plot)
Impacted primary forest = _____ plots (four, five or six beans remain in each plot)
Endangered primary forest = _____ plots (one, two or three beans remain in each plot)
Subsistence farming = _____ plots (zero beans remain in each plot)
Barren, beginning of secondary forest growth = _____ plots (After a plot has been in subsistence farming for three years, the soil becomes barren and the plot is abandoned. A secondary forest begins to grow.)
Conclusions & Analysis
1. In what year did your subsistence Farmer’s Co-op first clear a forest plot? __________________________________________________________________
__________________________________________________________________
2. Summarize what happened to your forest plot over a span of seven years. Did
everyone in the class have the same result? __________________________________________________________________
__________________________________________________________________
__________________________________________________________________
__________________________________________________________________

Pam Blanchard Last Updated on 8/19/2017
DEFORESTATION page 18
3. In addition to the loss of the primary growth forest, what effect to you think this activity had on the soil? Animals? Humans?
__________________________________________________________________
__________________________________________________________________
__________________________________________________________________
__________________________________________________________________
4. This simulation showed the effects on a primary growth forest by subsistence farmers. Subsistence farmers generally do not have bulldozers or other heavy equipment. How would a forest production company that has money to spend on heavy equipment change the scenario? How might you change this simulation to show the effects of a different type of production?
__________________________________________________________________
__________________________________________________________________
__________________________________________________________________
__________________________________________________________________
5. Urbanization happens when cities are expanded, often-involving people moving into previously unsettled areas adjacent to the city. Where would urbanization potentially fit into this simulation?
__________________________________________________________________
__________________________________________________________________
__________________________________________________________________
__________________________________________________________________
6. Globalization is the interconnection of countries and industries around the world, driven by international trade and investment and encourages consumption while opening new markets for hard to find forest products. Where would globalization potentially fit into this simulation?
__________________________________________________________________
__________________________________________________________________
__________________________________________________________________
__________________________________________________________________
7. What are the strengths and weaknesses of this simulation (model)? __________________________________________________________________
__________________________________________________________________
__________________________________________________________________
__________________________________________________________________
Pam Blanchard Last Updated on 8/19/2017
DEFORESTATION page 19
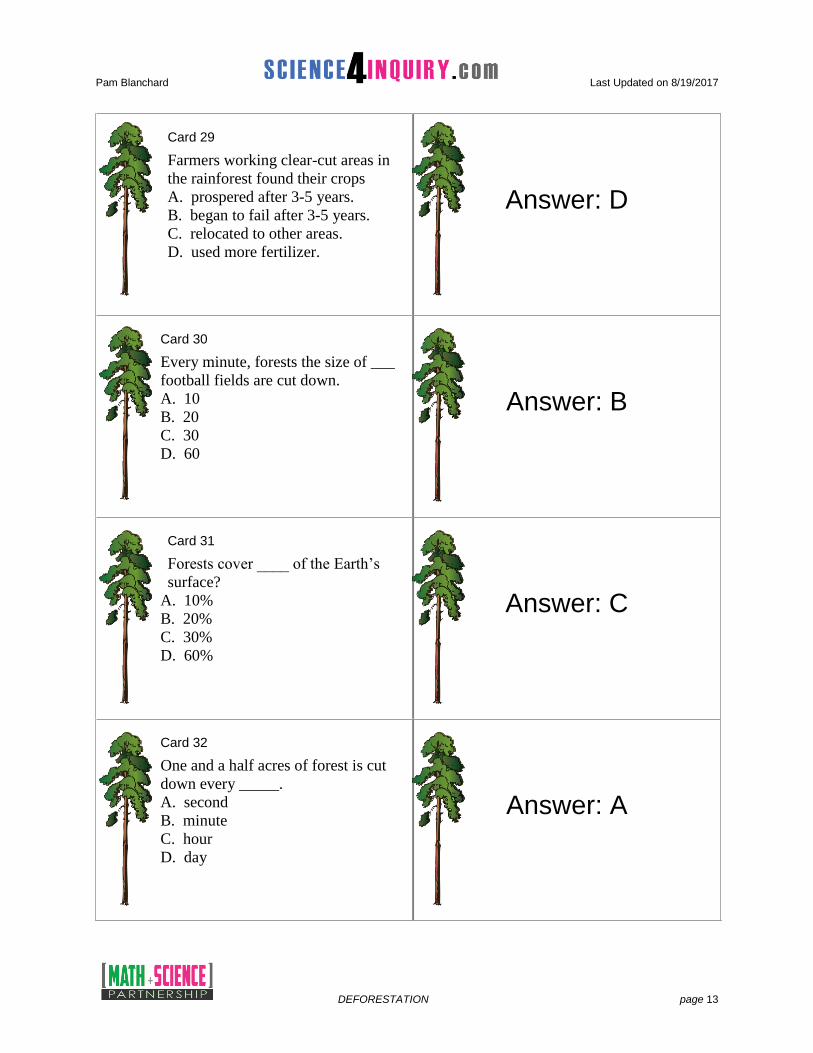
6. Graph your data for forest changed over time. You will have five colored lines to represent each of the five categories.
Title: ____________________________________________
Y1 Y2 Y3 Y4 Y5 Y6 Y7 Y8 Year data was collected
16
14
12
10
8
6
4
2
0
KEY
healthy primary
forest (7 beans)
impacted
primary forest (4, 5, or
6 beans)
endangered
primary forest (1, 2, or
3 beans)
subsistence
farming (yrs 1-3)
barren, start of
secondary forest (yrs
1-3)
Nu
mb
er
of
fore
st
plo
ts

Pam Blanchard Last Updated on 8/19/2017
DEFORESTATION page 20
Deforestation Simulation Board
Plot 1
primary forest
Plot 2
primary forest
Plot 3
primary forest
Plot 4
primary forest
Plot 5
primary forest
Plot 6
primary forest
Plot 7
primary forest
Plot 8
primary forest
Plot 9
primary forest
Plot 10
primary forest
Plot 11
primary forest
Plot 12
primary forest
Plot 13
primary forest
Plot 14
primary forest
Plot 15
primary forest
Plot 16
primary forest
Blackline Master #3

Pam Blanchard Last Updated on 8/19/2017
DEFORESTATION page 21
Forest plot chips (cut one set per group; place in an envelope)
1 2 3 4
5 6 7 8
9 10 11 12
13 14 15 16
Secondary forest chips (cut one set per group; place in an envelope)
secondary
forest (years 4-50)
secondary
forest (years 4-50)
secondary
forest (years 4-50)
secondary
forest (years 4-50)
secondary
forest (years 4-50)
secondary
forest (years 4-50)
secondary
forest (years 4-50)
secondary
forest (years 4-50)
secondary
forest (years 4-50)
secondary
forest (years 4-50)
secondary
forest (years 4-50)
secondary
forest (years 4-50)
secondary
forest (years 4-50)
secondary
forest (years 4-50)
secondary
forest (years 4-50)
secondary
forest (years 4-50)
Blackline Master #4

Pam Blanchard Last Updated on 8/19/2017
DEFORESTATION page 22
Subsistence Farming Chips (cut one set per group; place in an envelope)
subsistence
farming (years 1-3)
subsistence
farming (years 1-3)
subsistence
farming (years 1-3)
subsistence
farming (years 1-3)
subsistence
farming (years 1-3)
subsistence
farming (years 1-3)
subsistence
farming (years 1-3)
subsistence
farming (years 1-3)
subsistence
farming (years 1-3)
subsistence
farming (years 1-3)
subsistence
farming (years 1-3)
subsistence
farming (years 1-3)
subsistence
farming (years 1-3)
subsistence
farming (years 1-3)
subsistence
farming (years 1-3)
subsistence
farming (years 1-3)
Blackline Master #4, p. 2

Pam Blanchard Last Updated on 8/19/2017
DEFORESTATION page 23
Name ___________________________________________ Date _________________ Student No. ___________
Checking for Understanding: Deforestation ___ 1. One of the main causes of deforestation is (SC.7.E.6.6)
A. agriculture B. diseased trees C. firewood collection D. road building
___ 2. A “secondary forest" means (SC.7.E.6.6)
A. this forest is an exact duplicate of the primary forest. B. a primary forest has transitioned into a newer, secondary forest. C. trees in this area have not yet been disturbed by deforestation. D. trees have started to regrow in a clear-cut area.
___ 2. When people move into new areas that were previously uninhabited, establishing cities and
buildings in the areas, this is called: (SC.7.E.6.6) A. urbanization B. globalization C. deforestation D. desertification
3. Briefly describe at least one strength of this simulation. (SC.7.N.3.2) 4. Briefly describe at least one limitation of this simulation. (SC.7.N.3.2) 5. How could you improve this simulation to better reflect what really happens with deforestation?
(SC.7.N.3.2) 5. How could you modify this simulation to reflect the role that urbanization and globalization play in
deforestation? (SC.7.N.3.2)
Blackline Master #5

Pam Blanchard Last Updated on 8/19/2017
DEFORESTATION page 24
Name ___________________________________________ Date _________________ Student No. ___________
Checking for Understanding: Deforestation – ANSWER KEY ___ 1. One of the main causes of deforestation is (SC.7.E.6.6)
A. agriculture B. diseased trees C. firewood collection D. road building
___ 2. A “secondary forest" means (SC.7.E.6.6)
A. this forest is an exact duplicate of the primary forest. B. a primary forest has transitioned into a newer, secondary forest. C. trees in this area have not yet been disturbed by deforestation. D. trees have started to regrow in a clear-cut area.
___ 2. When people move into new areas that were previously uninhabited, establishing cities and
buildings in the areas, this is called: (SC.7.E.6.6) A. deforestation B. globalization C. urbanization D. desertification
3. Briefly describe at least one strength of this simulation. (SC.7.N.3.2) Answers may vary but could include that the simulation shows the effects of clear cutting land for agriculture on deforestation. 4. Briefly describe at least one limitation of this simulation. (SC.7.N.3.2) Answers may vary but could include that in this simulation we are not able to simulate any natural phenomenon with the forests like natural regrowth, natural die off, or the potential that the farmers would replant trees that they cut down in future generations. 5. How could you improve this simulation to better reflect what really happens with deforestation?
(SC.7.N.3.2) Answers may vary but could include that special cards could be drawn to represent timber companies that are harvesting the lumber that DO have machines and equipment to make the deforestation speed up. We could also add urbanization and globalization factors into the simulation to show other factors that impact deforestation. 5. How could you modify this simulation to reflect the role that urbanization and globalization play in
deforestation? (SC.7.N.3.2) Answers may vary buy could include that when a plot of land is cleared, a building is put in that plot to prevent secondary forest from growing (urbanization). We could have special cards that are drawn that identify that a special product or type of lumber is found in a plot of land and that the entire plot gets cleared out (globalization).
Blackline Master #5 – Answer Key