Embed Size (px)
Citation preview
Hindawi Publishing CorporationBioMed Research InternationalVolume 2013, Article ID 123847, 8 pageshttp://dx.doi.org/10.1155/2013/123847
Clinical StudyDegenerative Spondylolisthesis Is Associated with Low SpinalBone Density: A Comparative Study between Spinal Stenosis andDegenerative Spondylolisthesis
Thomas Andersen,1 Finn B. Christensen,1 Bente L. Langdahl,2 Carsten Ernst,3
Søren Fruensgaard,4 Jørgen Østergaard,5 Jens Langer Andersen,3 Sten Rasmussen,6
Bent Niedermann,1 Kristian Høy,1 Peter Helmig,1 Randi Holm,1
Niels Egund,7 and Cody Bünger1
1 Orthopaedic Department, Spine Section, Aarhus University Hospital, Nørrebrogade 44, 8000 Aarhus C, Denmark2Department of Endocrinology and Metabolism, Aarhus University Hospital, Denmark3Orthopaedic Department, Esbjerg County Hospital, Denmark4Orthopaedic Department, Holstebro County Hospital, Denmark5 Orthopaedic Department, Viborg County Hospital, Denmark6Orthopaedic Department, Vejle County Hospital, Denmark7Department of Radiology, Aarhus University Hospital, Denmark
Correspondence should be addressed toThomas Andersen; [email protected]
Received 22 April 2013; Accepted 16 July 2013
Academic Editor: Morio Matsumoto
Copyright © 2013 Thomas Andersen et al. This is an open access article distributed under the Creative Commons AttributionLicense, which permits unrestricted use, distribution, and reproduction in any medium, provided the original work is properlycited.
Spinal stenosis and degenerative spondylolisthesis share many symptoms and the same treatment, but their causes remain unclear.Bone mineral density has been suggested to play a role. The aim of this study was to investigate differences in spinal bone densitybetween spinal stenosis and degenerative spondylolisthesis patients. 81 patients older than 60 years, who underwent DXA-scanningof their lumbar spine one year after a lumbar spinal fusion procedure, were included. Radiographs were assessed for disc height,vertebral wedging, and osteophytosis. Pain was assessed using the Low Back Pain Rating Scale pain index. T-score of the lumbarspine was significantly lower among degenerative spondylolisthesis patients compared with spinal stenosis patients (−1.52 versus−0.52, 𝑃 = 0.04). Thirty-nine percent of degenerative spondylolisthesis patients were classified as osteoporotic and further 30%osteopenic compared to only 9% of spinal stenosis patients being osteoporotic and 30% osteopenic (𝑃 = 0.01). Pain levels tended toincrease with poorer bone status (𝑃 = 0.06). Patients treated surgically for symptomatic degenerative spondylolisthesis have muchlower bone mass than patients of similar age treated surgically for spinal stenosis. Low BMDmight play a role in the developmentof the degenerative spondylolisthesis, further studies are needed to clarify this.
1. Introduction
Spinal stenosis and degenerative lumbar spondylolisthesisare common conditions in the aging spine. The degenerativespondylolisthesis can subsequently lead to severe spinalstenosis due to the progressive slip. Surgery for these twoconditions, decompression and in many cases fusion, hasshown increasing rates during the last decade [1]. But,although these two conditions share many symptoms and the
same treatment, the causes of the two different disease entitiesremain unclear. Recent work focuses on the genetic compo-nent of degenerative disc disease in its widest sense, whichseems large [2], but so far genetic differences between thesetwo groups of patients have not been reported. Degenerativespondylolisthesis has been reported to be 4-5 times morecommon in women than in men, although a recent reportstates that the presence in men might be underestimated[3]. Hormonal influences, pregnancy, pelvicmorphology, and
2 BioMed Research International
Table 1: Patient demographics.
DDD Spinal stenosis Degenerative spondylolisthesis 𝑃 valueGender (m/f) 2 (29%)/5 (71%) 23 (41%)/33 (59%) 4 (22%)/14 (78%) 0.321
Age at DEXA 66 (4) 72 (6) 73 (6) 0.0342
Pain history 0.15<1 year 0 (0%) 10 (18%) 1 (6%)1-2 years 1 (14%) 9 (16%) 7 (39%)>2 years 6 (86%) 37 (66%) 10 (56%)
Preoperative smoking 0.19Nonsmoker 4 (57%) 34 (61%) 15 (83%)Smoker 3 (43%) 22 (39%) 3 (17%)
Number of fused levels 0.0023
1 5 (71%) 10 (18%) 9 (50%)2 1 (14%) 30 (54%) 8 (44%)3 0 (0%) 15 (27%) 1 (6%)4 1 (14%) 1 (2%) 0 (0%)
Additional neural decompression <0.0014
None 6 (86%) 0 (0%) 0 (0%)Laminotomy 1 (14%) 11 (20%) 4 (22%)Laminectomy 0 (0%) 45 (80%) 14 (78%)
Preoperative walking distance (median/iqr) 500 (400) 200 (500) 200 (400) 0.815
Follow-up walking distance (median/iqr) 350 (4900) 2000 (8999) 1500 (1000) 0.246
Demographic parameters in the three diagnostic groups. DDD: degenerative disc disease.When performing two-group comparison (spinal stenosis versus degenerative spondylolisthesis): 1𝑃 = 0.15, 2𝑃 = 0.82, 3𝑃 = 0.03, 4𝑃 = 0.81, 5𝑃 = 0.63,6𝑃 = 0.26.Values are mean (sd) or 𝑛 (%).
facet joint orientation have been suggested as causes [4–8].Very few of the studies have looked beyond morphologyof the spine when looking for differences between degen-erative spondylolisthesis and spinal stenosis. One study hasshown different amounts of matrix metalloproteinases inligamentum flavum in these two patient groups, suggestinga biochemical pathway for increased collagen laxity, whichsubsequently could lead to the slip [9]. Bone mineral densityhas been shown to be independently associatedwith degener-ative disc disease [10], and one study, on bonemineral densityof the lumbar spine in elderly women, with degenerativespondylolisthesis, has suggested different pathomechanismson different levels. But in general the role of bone mineraldensity in lumbar degenerative disease is not very wellunderstood.
We utilized data from a surgical cohort of elderly patientsundergoing fusion surgery for degenerative disc disease,spinal stenosis, or degenerative spondylolisthesis in order toinvestigate differences in spinal bone mass between thesediagnostic groups.
2. Materials and Methods
2.1. Patients. The patient cohort in this study is taken from amulticenter randomized trial on the effect of direct current(DC) electrical stimulation in adjunct to uninstrumentedspinal fusion [11, 12]. All patients underwent uninstrumentedposterolateral spinal fusion using fresh frozen allograft and
were braced postoperatively for 3-4 months. This studyincludes 81 patients with a preoperative diagnosis of eitherdegenerative disc disease (DDD), spinal stenosis, or degen-erative spondylolisthesis (DS), who underwent spinal bonedensitometry at 1 year postoperatively. Patient demographicsare seen in Table 1. Five patients had a history of a priordecompressive procedure and 9 patients had previously hadlumbar discectomy, the remaining patients had not beenoperated on in their lumbar spine.
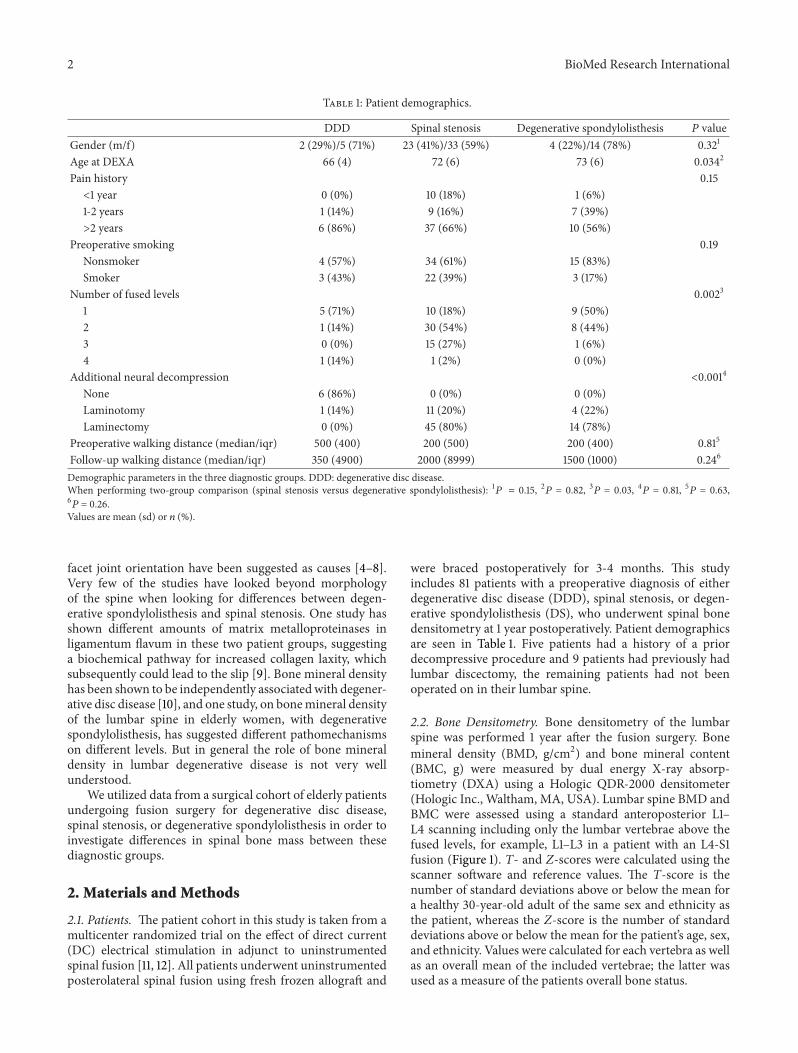
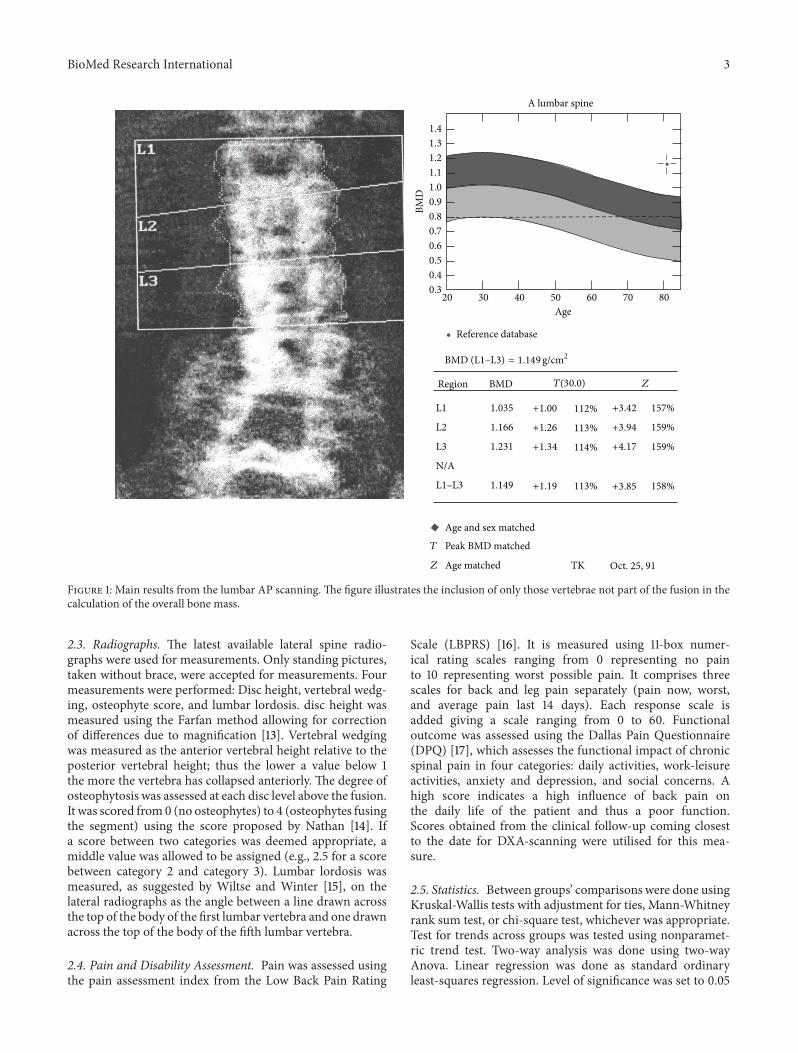
2.2. Bone Densitometry. Bone densitometry of the lumbarspine was performed 1 year after the fusion surgery. Bonemineral density (BMD, g/cm2) and bone mineral content(BMC, g) were measured by dual energy X-ray absorp-tiometry (DXA) using a Hologic QDR-2000 densitometer(Hologic Inc., Waltham, MA, USA). Lumbar spine BMD andBMC were assessed using a standard anteroposterior L1–L4 scanning including only the lumbar vertebrae above thefused levels, for example, L1–L3 in a patient with an L4-S1fusion (Figure 1). T- and Z-scores were calculated using thescanner software and reference values. The T-score is thenumber of standard deviations above or below the mean fora healthy 30-year-old adult of the same sex and ethnicity asthe patient, whereas the Z-score is the number of standarddeviations above or below the mean for the patient’s age, sex,and ethnicity. Values were calculated for each vertebra as wellas an overall mean of the included vertebrae; the latter wasused as a measure of the patients overall bone status.
BioMed Research International 3
1.41.31.21.11.00.90.80.70.60.50.40.3
BMD
20 30 40 50 60 70 80Age
Reference database
A lumbar spine
BMD (L1–L3) = 1.149g/cm2
Region
L1
L2
L3
N/A
L1–L3
BMD
1.035
1.166
1.231
1.149
T(30.0)
+1.00
+1.26
+1.34
+1.19
112%
113%
113%
114%
+3.42
+3.94
+4.17
+3.85
157%
159%
159%
158%
Age and sex matched
T Peak BMD matched
Z
Z
Age matched TK Oct. 25, 91
Figure 1: Main results from the lumbar AP scanning. The figure illustrates the inclusion of only those vertebrae not part of the fusion in thecalculation of the overall bone mass.
2.3. Radiographs. The latest available lateral spine radio-graphs were used for measurements. Only standing pictures,taken without brace, were accepted for measurements. Fourmeasurements were performed: Disc height, vertebral wedg-ing, osteophyte score, and lumbar lordosis. disc height wasmeasured using the Farfan method allowing for correctionof differences due to magnification [13]. Vertebral wedgingwas measured as the anterior vertebral height relative to theposterior vertebral height; thus the lower a value below 1the more the vertebra has collapsed anteriorly. The degree ofosteophytosis was assessed at each disc level above the fusion.It was scored from0 (no osteophytes) to 4 (osteophytes fusingthe segment) using the score proposed by Nathan [14]. Ifa score between two categories was deemed appropriate, amiddle value was allowed to be assigned (e.g., 2.5 for a scorebetween category 2 and category 3). Lumbar lordosis wasmeasured, as suggested by Wiltse and Winter [15], on thelateral radiographs as the angle between a line drawn acrossthe top of the body of the first lumbar vertebra and one drawnacross the top of the body of the fifth lumbar vertebra.
2.4. Pain and Disability Assessment. Pain was assessed usingthe pain assessment index from the Low Back Pain Rating
Scale (LBPRS) [16]. It is measured using 11-box numer-ical rating scales ranging from 0 representing no painto 10 representing worst possible pain. It comprises threescales for back and leg pain separately (pain now, worst,and average pain last 14 days). Each response scale isadded giving a scale ranging from 0 to 60. Functionaloutcome was assessed using the Dallas Pain Questionnaire(DPQ) [17], which assesses the functional impact of chronicspinal pain in four categories: daily activities, work-leisureactivities, anxiety and depression, and social concerns. Ahigh score indicates a high influence of back pain onthe daily life of the patient and thus a poor function.Scores obtained from the clinical follow-up coming closestto the date for DXA-scanning were utilised for this mea-sure.
2.5. Statistics. Between groups’ comparisons were done usingKruskal-Wallis tests with adjustment for ties, Mann-Whitneyrank sum test, or chi-square test, whichever was appropriate.Test for trends across groups was tested using nonparamet-ric trend test. Two-way analysis was done using two-wayAnova. Linear regression was done as standard ordinaryleast-squares regression. Level of significance was set to 0.05
4 BioMed Research International
(two-tailed testing). Intercooled Stata version 12 forWindowswas the software used for all analysis.
3. Results
Seventeen percent (14/81) of the patients were classified asosteoporotic, with a further 26% (21/81) being osteopenic.Stratifying for gender, the numbers were 6/29 (21%) osteo-porotic and 6/29 (21%) osteopenic among the males and 8/52(15%) osteoporotic and 15/52 (29%) osteopenic among thefemales (𝑃 = 0.67). On the average, however, the patientshad a higher bone mass as compared to their age- andsex-matched groups, as illustrated by the overall Z-score(Table 2). Bone status was associated with pain history as86% (12) of the osteoporotic patients had a preoperative painhistory of more than two years compared to 67% (14) of theosteopenic patients and only 59% (27) of those patients withnormal bone status. In general, bone status declined fromthe lower lumbar vertebrae to the upper lumbar vertebrae(Table 2).
Lower BMD and T-scores at all vertebrae were seen inpatients diagnosed with degenerative spondylolisthesis ordegenerative disc disease compared to patients with spinalstenosis, and this resulted in a significantly higher proportionof osteoporotic patients in the former categories (Table 2).There was no difference in disc height and vertebral wedgingbetween the diagnostic groups, but a tendency towardsa lower osteophyte score in degenerative spondylolisthesispatients was seen (Table 2). The difference in bone densityparameters was not due to the larger proportion of womenamong the degenerative spondylolisthesis patients as BMD;T-score and Z-score were lower in these patients in bothsexes (data not shown). Linear regression confirmed that adiagnosis of degenerative spondylolisthesis was associatedwith lower BMD after controlling for other contributoryfactors, although it did not reach statistical significance(Table 3).
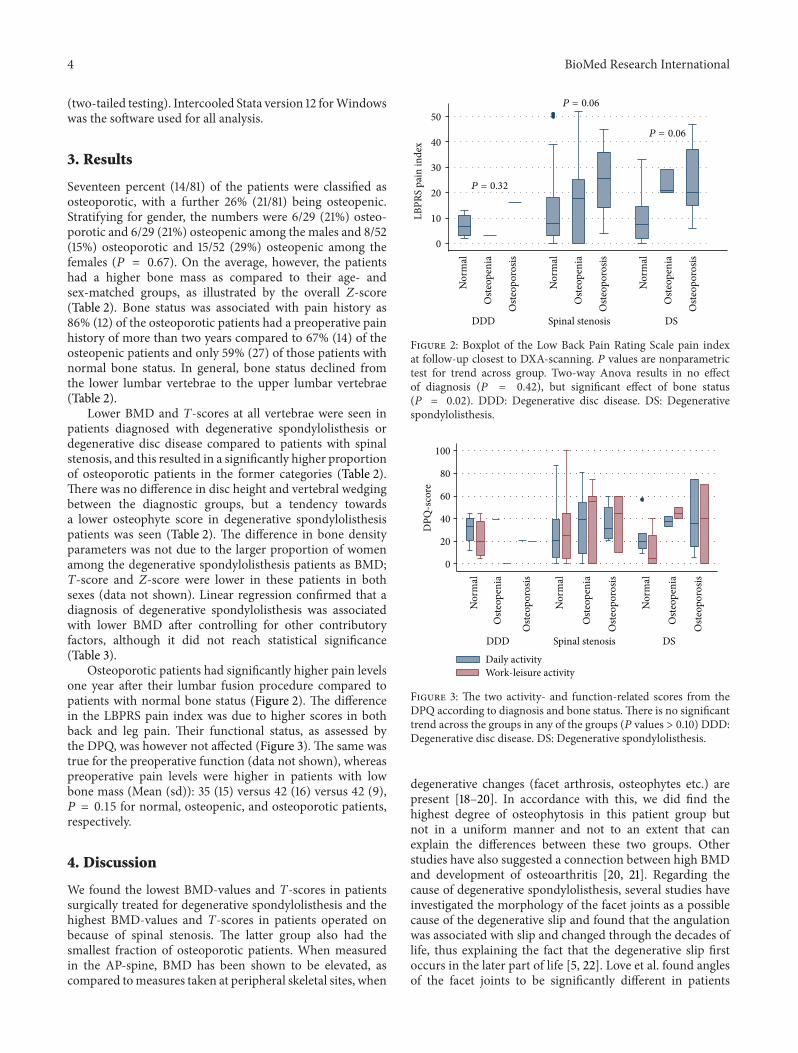
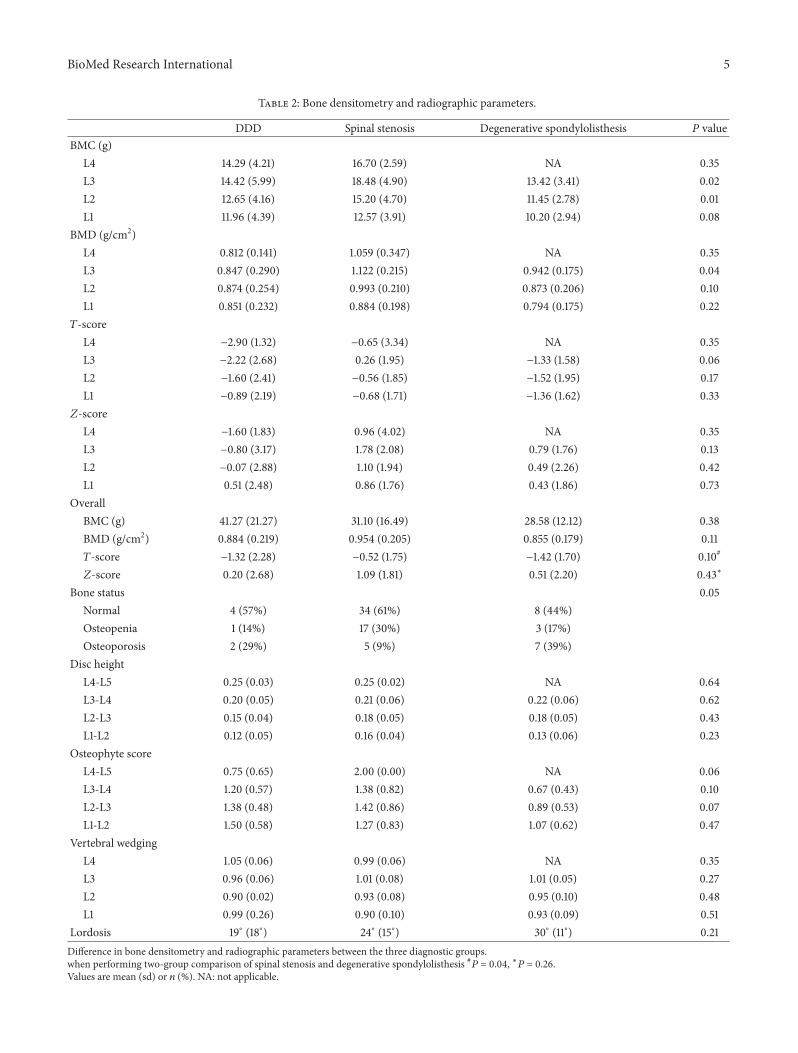
Osteoporotic patients had significantly higher pain levelsone year after their lumbar fusion procedure compared topatients with normal bone status (Figure 2). The differencein the LBPRS pain index was due to higher scores in bothback and leg pain. Their functional status, as assessed bythe DPQ, was however not affected (Figure 3). The same wastrue for the preoperative function (data not shown), whereaspreoperative pain levels were higher in patients with lowbone mass (Mean (sd)): 35 (15) versus 42 (16) versus 42 (9),𝑃 = 0.15 for normal, osteopenic, and osteoporotic patients,respectively.
4. Discussion
We found the lowest BMD-values and T-scores in patientssurgically treated for degenerative spondylolisthesis and thehighest BMD-values and T-scores in patients operated onbecause of spinal stenosis. The latter group also had thesmallest fraction of osteoporotic patients. When measuredin the AP-spine, BMD has been shown to be elevated, ascompared tomeasures taken at peripheral skeletal sites, when
0
10
20
30
40
50
LBPR
S pa
in in
dex
DDD Spinal stenosis DS
P = 0.32
P = 0.06
P = 0.06
Nor
mal
Oste
open
ia
Oste
opor
osis
Nor
mal
Oste
open
ia
Oste
opor
osis
Nor
mal
Oste
open
ia
Oste
opor
osis
Figure 2: Boxplot of the Low Back Pain Rating Scale pain indexat follow-up closest to DXA-scanning. 𝑃 values are nonparametrictest for trend across group. Two-way Anova results in no effectof diagnosis (𝑃 = 0.42), but significant effect of bone status(𝑃 = 0.02). DDD: Degenerative disc disease. DS: Degenerativespondylolisthesis.
0
20
40
60
80
100
Daily activityWork-leisure activity
DPQ
-sco
re
DDD Spinal stenosis DSN
orm
al
Oste
open
ia
Oste
opor
osis
Nor
mal
Oste
open
ia
Oste
opor
osis
Nor
mal
Oste
open
ia
Oste
opor
osis
Figure 3: The two activity- and function-related scores from theDPQ according to diagnosis and bone status. There is no significanttrend across the groups in any of the groups (𝑃 values > 0.10) DDD:Degenerative disc disease. DS: Degenerative spondylolisthesis.
degenerative changes (facet arthrosis, osteophytes etc.) arepresent [18–20]. In accordance with this, we did find thehighest degree of osteophytosis in this patient group butnot in a uniform manner and not to an extent that canexplain the differences between these two groups. Otherstudies have also suggested a connection between high BMDand development of osteoarthritis [20, 21]. Regarding thecause of degenerative spondylolisthesis, several studies haveinvestigated the morphology of the facet joints as a possiblecause of the degenerative slip and found that the angulationwas associated with slip and changed through the decades oflife, thus explaining the fact that the degenerative slip firstoccurs in the later part of life [5, 22]. Love et al. found anglesof the facet joints to be significantly different in patients
BioMed Research International 5
Table 2: Bone densitometry and radiographic parameters.
DDD Spinal stenosis Degenerative spondylolisthesis 𝑃 valueBMC (g)
L4 14.29 (4.21) 16.70 (2.59) NA 0.35L3 14.42 (5.99) 18.48 (4.90) 13.42 (3.41) 0.02L2 12.65 (4.16) 15.20 (4.70) 11.45 (2.78) 0.01L1 11.96 (4.39) 12.57 (3.91) 10.20 (2.94) 0.08
BMD (g/cm2)L4 0.812 (0.141) 1.059 (0.347) NA 0.35L3 0.847 (0.290) 1.122 (0.215) 0.942 (0.175) 0.04L2 0.874 (0.254) 0.993 (0.210) 0.873 (0.206) 0.10L1 0.851 (0.232) 0.884 (0.198) 0.794 (0.175) 0.22𝑇-score
L4 −2.90 (1.32) −0.65 (3.34) NA 0.35L3 −2.22 (2.68) 0.26 (1.95) −1.33 (1.58) 0.06L2 −1.60 (2.41) −0.56 (1.85) −1.52 (1.95) 0.17L1 −0.89 (2.19) −0.68 (1.71) −1.36 (1.62) 0.33𝑍-score
L4 −1.60 (1.83) 0.96 (4.02) NA 0.35L3 −0.80 (3.17) 1.78 (2.08) 0.79 (1.76) 0.13L2 −0.07 (2.88) 1.10 (1.94) 0.49 (2.26) 0.42L1 0.51 (2.48) 0.86 (1.76) 0.43 (1.86) 0.73
OverallBMC (g) 41.27 (21.27) 31.10 (16.49) 28.58 (12.12) 0.38BMD (g/cm2) 0.884 (0.219) 0.954 (0.205) 0.855 (0.179) 0.11𝑇-score −1.32 (2.28) −0.52 (1.75) −1.42 (1.70) 0.10#
𝑍-score 0.20 (2.68) 1.09 (1.81) 0.51 (2.20) 0.43∗
Bone status 0.05Normal 4 (57%) 34 (61%) 8 (44%)Osteopenia 1 (14%) 17 (30%) 3 (17%)Osteoporosis 2 (29%) 5 (9%) 7 (39%)
Disc heightL4-L5 0.25 (0.03) 0.25 (0.02) NA 0.64L3-L4 0.20 (0.05) 0.21 (0.06) 0.22 (0.06) 0.62L2-L3 0.15 (0.04) 0.18 (0.05) 0.18 (0.05) 0.43L1-L2 0.12 (0.05) 0.16 (0.04) 0.13 (0.06) 0.23
Osteophyte scoreL4-L5 0.75 (0.65) 2.00 (0.00) NA 0.06L3-L4 1.20 (0.57) 1.38 (0.82) 0.67 (0.43) 0.10L2-L3 1.38 (0.48) 1.42 (0.86) 0.89 (0.53) 0.07L1-L2 1.50 (0.58) 1.27 (0.83) 1.07 (0.62) 0.47
Vertebral wedgingL4 1.05 (0.06) 0.99 (0.06) NA 0.35L3 0.96 (0.06) 1.01 (0.08) 1.01 (0.05) 0.27L2 0.90 (0.02) 0.93 (0.08) 0.95 (0.10) 0.48L1 0.99 (0.26) 0.90 (0.10) 0.93 (0.09) 0.51
Lordosis 19∘ (18∘) 24∘ (15∘) 30∘ (11∘) 0.21Difference in bone densitometry and radiographic parameters between the three diagnostic groups.when performing two-group comparison of spinal stenosis and degenerative spondylolisthesis #𝑃 = 0.04, ∗𝑃 = 0.26.Values are mean (sd) or 𝑛 (%). NA: not applicable.
6 BioMed Research International
Table 3: Linear regression with BMD of the unfused spine as dependent variable.
Factor Coefficient SE 95% CI 𝑃 valueAge −0.001 0.004 −0.009–0.007 0.769Degenerative spondylolisthesis −0.093 0.055 −0.164–0.057 0.340Smoking −0.084 0.051 −0.196–0.009 0.074Walking distance (km) 0.022 0.010 0.000–0.043 0.035Female gender −0.107 0.049 −0.205–0.008 0.034Osteophyte score (average) 0.035 0.031 −0.027–0.098 0.259Constant 1.260 0.327 0.606–1.913 0.000Analysis performed excluding patients with degenerative disc disease. Adjusted marginal mean BMD for spinal stenosis patients was 0.943 compared to 0.889in degenerative spondylolisthesis patients (𝑃 = 0.336).Adjusted 𝑅2 = 0.147, SE: Standard error. CI: Confidence interval.
(both male and female) with degenerative spondylolisthesiscompared to those without. They speculated that the causecould be a generalized osteoarthritic condition, which couldexplain the occurrence of degenerative spondylolisthesis dueto arthritic remodelling [4]. One study has investigated therelation between BMD, both spinal and hip, and facet jointorientation and found no difference in facet joint orientationbetween osteoporotic, osteopenic, and normal patients [23].That study however excluded patients with spondylolisthesis,so whether the findings hold true for degenerative spondy-lolisthesis patients remains unknown. Our study did notallow for facet joint evaluation, as only lateral radiographswere utilized. And, although the cross-sectional design ofthe present study does not allow for conclusions regardingcausality, it might be speculated that sagittally orientedfacet joints is a prerequisite for development of degenerativespondylolisthesis, but that this development only occurs inpatients with low BMD, perhaps because they are unable togenerate a remodelling response that will cause the formationof osteophytes which subsequently will stabilize the olisthesisand prevent it developing into a clinical significant slip.Contradictory to this, Vogt et al. reported higher BMD inpatients with anterolisthesis compared to patients withoutolisthesis at some levels [24]. This was however not the casefor the L4-L5 level, where significant differences could notbe observed. Furthermore, their population was taken from astudy investigating osteoporotic fractures and included onlywomen. As our population included both genders and ischaracterised by the fact that they elicit spinal degenerativechanges significant enough to undergo surgery, for themajority due to stenosis symptoms, this makes it difficult tocompare the two populations. In a surgical patient popula-tion, the SPORT trial showed significant differences betweendegenerative spondylolisthesis and spinal stenosis patients,with a much larger proportion of the latter having multilevelinvolvement [25]. Another factor not investigated in thecurrent study is the influence of sagittal balance. Recently,differences between patients with or without degenerativespondylolisthesis have been shown [26], but unfortunatelythe radiographs available for the present study did not allowfor measurements of the fundamental pelvic parameters asthey did not include the hips. To our knowledge, no study hasyet investigated associations between bonemineral density ofthe spine and sagittal balance parameters.
In general, BMD of the single vertebrae has been shownto vary within the lumbar spine, but with a decline goingfromL5 to L1 being themost occurring phenomenon [27].Weobserved similar trends in this study.This is however unlikelyto be the explanation to the difference observed betweenpatients with spinal stenosis and those with degenerativespondylolisthesis. As there were more multilevel fusions inthe latter group, this would mean that fewer of their overallBMDmeasurements would include lower vertebra andwouldlead to a falsely low BMD, thus reducing the differenceobserved between the two groups.
Also the group of stenosis patients had the largest pro-portion of smokers. Smoking has been associated with lowBMD [28] and this would therefore also tend to reduce thedifference observed between the two populations. Anothervariable associated with a slower decline in BMD in olderage is activity [28]. This might play a role as we couldshow that osteopenia and osteoporosis were associated withhigher pain levels; thus, osteoporotic patients might have alower activity level and therefore more rapid decline in bonemass and, hence, there were more osteoporotic patients inthe degenerative spondylolisthesis group; this could be oneexplanation to our finding.The capacity to do activity, in formof self-reportedwalking distance, was however equal betweenthe two groups, both preoperatively and at follow-up. Thesamewas true for the scores assessing functional impairment.
Studies have shown BMD of vertebrae above a fusionto elicit an initial decline after lumbar spine surgery, with asubsequent return to values above baseline as early as afterone year [29–32]. Chin et al. reported somewhat poorer val-ues obtained from a preoperative DXA scanning of patientsabove 50 years undergoing spine surgery but in an Asianpopulation [33]. Thus, it cannot be completely ruled out thatthe BMD-measurements in this study slightly overestimatesthe preoperative status, but it seems unlikely that any effect ofthe surgery, on bone status of the adjacent vertebrae, shouldvary between the different diagnostic entities.
We found low bonemass to be associated withmore pain.In a cross-sectional study, Manabe et al. could demonstratethat a high BMD increased the risk of low back pain inwomen aged 45 to 64 years with an OR of 1.40. Thisassociation was, however, not present in the women aged 65and above [34]. Investigating chronic low back pain patientsundergoing rehabilitation, Gaber et al. failed to demonstrate
BioMed Research International 7
any correlation between BMD and pain or disability, asassessed with the Oswestry Disability Questionnaire [35].Likewise, Nicholson et al. could not demonstrate any asso-ciation between history of back pain and BMD or Z-score[36]. One explanation to our finding could be a higherdegree of inactivity in the patients with more severe pain,leading to a larger bone loss or a reduced increase in BMDafter the operation. Another possibility could be a higherproportion of nonunion patients among the osteoporoticpatients, resulting in higher pain levels, but against this speaksthe fact that also the preoperative pain levels were higheramong the osteoporotic/osteopenic patients.
In conclusion, patients treated surgically for symptomaticdegenerative spondylolisthesis have much lower bone massthan patients of similar age treated surgically for spinalstenosis. Low BMD might play a role in the development ofthe degenerative spondylolisthesis, further studies are neededto clarify this.
Disclosure
The original trial from which the patients in the presentstudy were recruited received unrestricted support from EBI/BiometSpine.
References
[1] R. A. Deyo, D. T. Gray, W. Kreuter, S. Mirza, and B. I. Martin,“United States trends in lumbar fusion surgery for degenerativeconditions,” Spine, vol. 30, no. 12, pp. 1441–1445, 2005.
[2] M. C. Battie and T. Videman, “Lumbar disc degeneration:epidemiology and genetics,” Journal of Bone and Joint SurgeryA, vol. 88, supplement 2, pp. 3–9, 2006.
[3] P. J. Denard, K. F. Holton, J. Miller et al., “Lumbar spondylolis-thesis among elderly men: prevalence, correlates, and progres-sion,” Spine, vol. 35, no. 10, pp. 1072–1078, 2010.
[4] T. W. Love, A. B. Fagan, and R. D. Fraser, “Degenerativespondylolisthesis. Developmental or acquired?” Journal of Boneand Joint Surgery B, vol. 81, no. 4, pp. 670–674, 1999.
[5] T. Toyone, T.Ozawa, K. Kamikawa et al., “Facet joint orientationdifference between cephalad and caudad portions: a possiblecause of degenerative spondylolisthesis,” Spine, vol. 34, no. 21,pp. 2259–2262, 2009.
[6] S. Matsunaga, T. Sakou, Y. Morizono, A. Masuda, and A. M.Demirtas, “Natural history of degenerative spondylolisthesis:pathogenesis and natural course of the slippage,” Spine, vol. 15,no. 11, pp. 1204–1210, 1990.
[7] K. Aono, T. Kobayashi, S. Jimbo, Y. Atsuta, and T. Mat-suno, “Radiographic analysis of newly developed degenerativespondylolisthesis in a mean twelve-year prospective study,”Spine, vol. 35, no. 8, pp. 887–891, 2010.
[8] C. Barrey, J. Jund, G. Perrin, and P. Roussouly, “Spinopelvicalignment of patients with degenerative spondylolisthesis,”Neurosurgery, vol. 61, no. 5, pp. 981–986, 2007.
[9] I.-S. Oh and K.-Y. Ha, “Matrix metalloproteinase-3 on ligamen-tum flavum in degenerative lumbar spondylolisthesis,” Spine,vol. 34, no. 16, pp. E552–E557, 2009.
[10] G. Livshits, S. Ermakov, M. Popham et al., “Evidence that bonemineral density plays a role in degenerative disc disease: the UK
twin spine study,” Annals of the Rheumatic Diseases, vol. 69, no.12, pp. 2102–2106, 2010.
[11] T. Andersen, F. B. Christensen, C. Ernst et al., “The effect ofelectrical stimulation on lumbar spinal fusion in older patients:a randomized, controlled, multi-center trial: part 1: functionaloutcome,” Spine, vol. 34, no. 21, pp. 2241–2247, 2009.
[12] T. Andersen, F. B. Christensen, N. Egund et al., “The effect ofelectrical stimulation on lumbar spinal fusion in older patients:a randomized, controlled, multi-center trial: part 2: fusionrates,” Spine, vol. 34, no. 21, pp. 2248–2253, 2009.
[13] M. H. Pope, E. N. Hanley, R. E. Matteri, D. G. Wilder, and J. W.Frymoyer, “Measurement of intervertebral disc space height,”Spine, vol. 2, pp. 282–286, 1977.
[14] H. Nathan, “Osteophytes of the vertebral column—an anatom-ical study of their development according to age, race, andsex with considerations as to their etiology and significance,”Journal of Bone and Joint Surgery, vol. 44, pp. 243–268, 1962.
[15] L. L. Wiltse and R. B. Winter, “Terminology and measurementof spondylolisthesis,” Journal of Bone and Joint Surgery A, vol.65, no. 6, pp. 768–772, 1983.
[16] C. Manniche, K. Asmussen, B. Lauritsen, H. Vinterberg, S.Kreiner, and A. Jordan, “Low Back Pain Rating scale: validationof a tool for assessment of low back pain,” Pain, vol. 57, no. 3, pp.317–326, 1994.
[17] G. F. Lawlis, R. Cuencas, D. Selby, and C. E. McCoy, “Thedevelopment of the Dallas Pain Questionnaire. An assessmentof the impact of spinal pain on behavior,” Spine, vol. 14, no. 5,pp. 511–516, 1989.
[18] G. Liu, M. Peacock, O. Eilam, G. Dorulla, E. Braunstein, and C.C. Johnston, “Effect of osteoarthritis in the lumbar spine andhip on bone mineral density and diagnosis of osteoporosis inelderly men and women,” Osteoporosis International, vol. 7, no.6, pp. 564–569, 1997.
[19] P. Von Der Recke, M. A. Hansen, K. Overgaard, and C.Christiansen, “The impact of degenerative conditions in thespine on bone mineral density and fracture risk prediction,”Osteoporosis International, vol. 6, no. 1, pp. 43–49, 1996.
[20] G. Jones, T. Nguyen, P. N. Sambrook, P. J. Kelly, and J. A. Eisman,“A longitudinal study of the effect of spinal degenerative diseaseon bone density in the elderly,” Journal of Rheumatology, vol. 22,no. 5, pp. 932–936, 1995.
[21] B. Goker, D. R. Sumner, D. E. Hurwitz, and J. A. Block, “Bonemineral density varies as a function of the rate of joint spacenarrowing in the hip,” Journal of Rheumatology, vol. 27, no. 3,pp. 735–738, 2000.
[22] J. Wang and X. Yang, “Age-related changes in the orientation oflumbar facet joints,” Spine, vol. 34, no. 17, pp. E596–E598, 2009.
[23] R. Cubuk, N. Tasali, M. Kozakcioglu, and S. Guney, “Is bonemineral density measurements correlated with facet joint ori-entation? A dual energy X-ray absorptiometry study,” PragueMedical Report, vol. 110, no. 4, pp. 343–349, 2009.
[24] M. T. Vogt, D. A. Rubin, R. S. Valentin et al., “Degenerativelumbar listhesis and bone mineral density in elderly women:the study of osteoporotic fractures,” Spine, vol. 24, no. 23, pp.2536–2541, 1999.
[25] A. Pearson, E. Blood, J. Lurie et al., “Degenerative spondylolis-thesis versus spinal stenosis: does a slip matter? Comparison ofbaseline characteristics and outcomes (SPORT),” Spine, vol. 35,no. 3, pp. 298–305, 2010.
[26] H. Funao, T. Tsuji, N. Hosogane, K. Watanabe, K. Ishii, M.Nakamura et al., “Comparative study of spinopelvic sagittal
8 BioMed Research International
alignment between patients with and without degenerativespondylolisthesis,” European Spine Journal, vol. 21, pp. 2181–2187, 2012.
[27] P. J. Ryan, G. M. Blake, R. Herd, J. Parker, and I. Fogelman,“Distribution of bone mineral density in the lumbar spine inhealth and osteoporosis,” Osteoporosis International, vol. 4, no.2, pp. 67–71, 1994.
[28] NIH Consensus Development Panel on Osteoporosis Preven-tion, Diagnosis, and Therapy, “Osteoporosis prevention, diag-nosis, and therapy,” Journal of the AmericanMedical Association,vol. 285, pp. 785–795, 2001.
[29] H. J. Lipscomb, S. A. Grubb, and R. V. Talmage, “Spinal bonedensity following spinal fusion,” Spine, vol. 14, no. 4, pp. 477–479, 1989.
[30] B. Erdogan, T. Bagis,O. Sen et al., “Effects of lumbar disc surgeryon bone mineral density in women with lumbar disc disease,”Advances in Therapy, vol. 20, no. 2, pp. 114–120, 2003.
[31] G. M. Bogdanffy, D. D. Ohnmeiss, and R. D. Guyer, “Earlychanges in bonemineral density above a combined anteroposte-rior L4- S1 lumbar spinal fusion: a clinical investigation,” Spine,vol. 20, no. 15, pp. 1674–1678, 1995.
[32] K. Singh, H. S. An, D. Samartzis et al., “A prospective cohortanalysis of adjacent vertebral body bone mineral density inlumbar surgery patients with or without instrumented postero-lateral fusion: a 9- to 12-year follow-up,” Spine, vol. 30, no. 15,pp. 1750–1755, 2005.
[33] D. K. Chin, J. Y. Park, Y. S. Yoon et al., “Prevalence ofosteoporosis in patients requiring spine surgery: incidenceand significance of osteoporosis in spine disease,” OsteoporosisInternational, vol. 18, no. 9, pp. 1219–1224, 2007.
[34] T. Manabe, S.-I. Takasugi, and Y. Iwamoto, “Positive relation-ship between bone mineral density and low back pain inmiddle-aged women,” European Spine Journal, vol. 12, no. 6, pp.596–601, 2003.
[35] T. A.-Z. K. Gaber, K. A. McGlashan, S. Love, J. R. Jenner, and A.J. Crisp, “Bone density in chronic low back pain: a pilot study,”Clinical Rehabilitation, vol. 16, no. 8, pp. 867–870, 2002.
[36] P. H. F. Nicholson, M. J. Haddaway, M. W. J. Davie, andS. F. Evans, “Vertebral deformity, bone mineral density, backpain and height loss in unscreened women over 50 years,”Osteoporosis International, vol. 3, no. 6, pp. 300–307, 1993.


![Spondylolisthesis mimicking the progression of dissection ...Degenerative spondylolisthesis (DS) is common in el-derly patients.[2] It is characterized by the displacement, usually](https://img.pdfslide.net/doc/110x75/60803130ef7e7377cd0eda00/spondylolisthesis-mimicking-the-progression-of-dissection-degenerative-spondylolisthesis.jpg)