Embed Size (px)
Citation preview
Imaging of Spinal StenosisNeurogenic Intermittent Claudication andCervical Spondylotic Myelopathy
Timothy P. Maus, MD
SPINAL STENOSIS
Although spinal stenosis is one of the most com-mon reasons for spinal imaging, and most radiolo-gists likely perceive they “know it when they seeit,” it remains a more elusive phenomenon whenone carefully examines the literature. It is firstimportant to distinguish between the anatomicobservation of central canal narrowing and theclinical syndromes that it may provoke: neuro-genic intermittent claudication (NIC) and/or radi-culopathy in the lumbar spine, or myelopathy inthe cervical or thoracic spine. Anatomic centralcanal narrowing is a frequent observation in anasymptomatic population, and increases in preva-lence as an asymptomatic finding with age.1
Compromise of the central canal, with or withoutassociated subarticular recess (lateral recess) orforaminal compromise, provides the necessarybut insufficient anatomic substrate for the clinicalsyndromes of NIC, radiculopathy, or myelopathy.
This article initially examines the literature de-scribing the pathophysiology and imaging of NICcaused by lumbar central canal, lateral, andforaminal stenosis, followed by consideration ofthoracic central canal compromise, and finallythe pathophysiology and imaging literature ofcervical spondylotic myelopathy (CSM). It is as-sumed that the reader can make the observationsregarding compromise of the various spinalcompartments; the emphasis is on the clinicalsignificance of these observations as they affectthe patient’s clinical care and ultimate outcome.
NEUROGENIC INTERMITTENT CLAUDICATION
NIC caused by central and/or lateral and foraminalstenosis in the lumbar spine is a clinical syndromeof significant frequency and debility in the elderlypopulation. The North American Spine Society(NASS) 2011 evidence-based guidelines on thediagnosis and treatment of spinal stenosis define
Department of Radiology, Mayo Clinic, 200 First Street SW, Rochester, MN 55905, USAE-mail address: [email protected]
KEYWORDS
! Spinal stenosis ! Claudication ! Myelopathy cervical spondylotic myelopathy (CSM)! Neurogenic intermittent claudication (NIC) ! Diffusion tensor imaging (DTI) ! Foraminal stenosis
KEY POINTS
! Lumbar spinal stenosis is an anatomic observation; it may cause the clinical syndrome of neuro-genic intermittent claudication (NIC).
! The pathophysiology of NIC remains controversial; the best evidence suggests venous congestionfrom multiple sites of compression initiates an inflammatory reaction causing neural dysfunctionand irritability.
! The imager must identify all sites of neural compression in the central canal, subarticular recess,and foramen.
! The clinical syndrome of cervical spondylotic myelopathy (CSM) occurs in the setting of cervicalcentral canal compromise, frequently with underlying congenital narrowing.
! Intramedullary signal change, enhancement, and diffusion characteristics can aid in selecting CSMpatients for decompressive surgery.
Radiol Clin N Am 50 (2012) 651–679doi:10.1016/j.rcl.2012.04.0070033-8389/12/$ – see front matter ! 2012 Elsevier Inc. All rights reserved. ra
diologic.th
eclin
ics.com
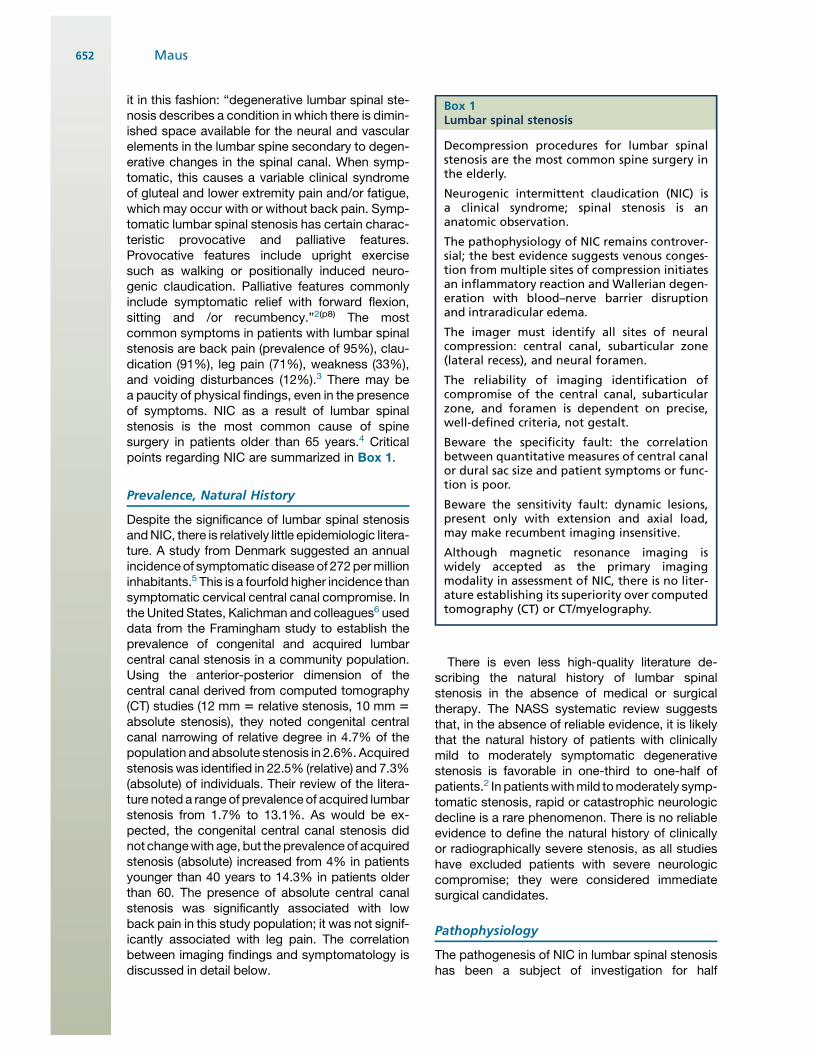
it in this fashion: “degenerative lumbar spinal ste-nosis describes a condition in which there is dimin-ished space available for the neural and vascularelements in the lumbar spine secondary to degen-erative changes in the spinal canal. When symp-tomatic, this causes a variable clinical syndromeof gluteal and lower extremity pain and/or fatigue,which may occur with or without back pain. Symp-tomatic lumbar spinal stenosis has certain charac-teristic provocative and palliative features.Provocative features include upright exercisesuch as walking or positionally induced neuro-genic claudication. Palliative features commonlyinclude symptomatic relief with forward flexion,sitting and /or recumbency.”2(p8) The mostcommon symptoms in patients with lumbar spinalstenosis are back pain (prevalence of 95%), clau-dication (91%), leg pain (71%), weakness (33%),and voiding disturbances (12%).3 There may bea paucity of physical findings, even in the presenceof symptoms. NIC as a result of lumbar spinalstenosis is the most common cause of spinesurgery in patients older than 65 years.4 Criticalpoints regarding NIC are summarized in Box 1.
Prevalence, Natural History
Despite the significance of lumbar spinal stenosisandNIC, there is relatively little epidemiologic litera-ture. A study from Denmark suggested an annualincidenceof symptomatic disease of 272permillioninhabitants.5 This is a fourfold higher incidence thansymptomatic cervical central canal compromise. Inthe United States, Kalichman and colleagues6 useddata from the Framingham study to establish theprevalence of congenital and acquired lumbarcentral canal stenosis in a community population.Using the anterior-posterior dimension of thecentral canal derived from computed tomography(CT) studies (12 mm 5 relative stenosis, 10 mm 5absolute stenosis), they noted congenital centralcanal narrowing of relative degree in 4.7% of thepopulation andabsolute stenosis in 2.6%.Acquiredstenosis was identified in 22.5% (relative) and 7.3%(absolute) of individuals. Their review of the litera-ture noted a range of prevalence of acquired lumbarstenosis from 1.7% to 13.1%. As would be ex-pected, the congenital central canal stenosis didnot changewith age, but theprevalence of acquiredstenosis (absolute) increased from 4% in patientsyounger than 40 years to 14.3% in patients olderthan 60. The presence of absolute central canalstenosis was significantly associated with lowback pain in this study population; it was not signif-icantly associated with leg pain. The correlationbetween imaging findings and symptomatology isdiscussed in detail below.
There is even less high-quality literature de-scribing the natural history of lumbar spinalstenosis in the absence of medical or surgicaltherapy. The NASS systematic review suggeststhat, in the absence of reliable evidence, it is likelythat the natural history of patients with clinicallymild to moderately symptomatic degenerativestenosis is favorable in one-third to one-half ofpatients.2 In patientswithmild tomoderately symp-tomatic stenosis, rapid or catastrophic neurologicdecline is a rare phenomenon. There is no reliableevidence to define the natural history of clinicallyor radiographically severe stenosis, as all studieshave excluded patients with severe neurologiccompromise; they were considered immediatesurgical candidates.
Pathophysiology
The pathogenesis of NIC in lumbar spinal stenosishas been a subject of investigation for half
Box 1Lumbar spinal stenosis
Decompression procedures for lumbar spinalstenosis are the most common spine surgery inthe elderly.
Neurogenic intermittent claudication (NIC) isa clinical syndrome; spinal stenosis is ananatomic observation.
The pathophysiology of NIC remains controver-sial; the best evidence suggests venous conges-tion from multiple sites of compression initiatesan inflammatory reaction and Wallerian degen-eration with blood–nerve barrier disruptionand intraradicular edema.
The imager must identify all sites of neuralcompression: central canal, subarticular zone(lateral recess), and neural foramen.
The reliability of imaging identification ofcompromise of the central canal, subarticularzone, and foramen is dependent on precise,well-defined criteria, not gestalt.
Beware the specificity fault: the correlationbetween quantitative measures of central canalor dural sac size and patient symptoms or func-tion is poor.
Beware the sensitivity fault: dynamic lesions,present only with extension and axial load,may make recumbent imaging insensitive.
Although magnetic resonance imaging iswidely accepted as the primary imagingmodality in assessment of NIC, there is no liter-ature establishing its superiority over computedtomography (CT) or CT/myelography.
Maus652
a century. Verbiest7 initially described mechanicalcompression of the nerve roots of the cauda equi-na as a cause of NIC in 1954. Subsequent investi-gators have postulated that arterial or venousischemia, perhaps exacerbated by restriction ofcerebrospinal fluid (CSF) flow (which participatesin nerve root nutrition), are major contributors tothe clinical syndrome. The current preponderanceof evidence would favor venous congestionsecondary to mechanical compression. Thishypothesis emphasizes the importance of multiplelevels of compression, and the physiologic effectsof lumbar extension. Both of these observationshave significant relevance to imaging.
Takahashi and colleagues8 demonstrated ina porcine model that blood flow within the caudaequina was reduced by 64% in the segmentbetween 2 zones of modest (10 mm Hg) compres-sion, providing early evidence that there areprofound microcirculatory changes even in an un-compressed segment of nerve between 2 zones ofcompression. Olmarker and Rydevik9 postulatedthat venous stasis between 2 zones of modest com-pression may cause proinflammatory compounds toleak from capillaries, stimulating a local inflammatoryresponse. Also in a porcine model, they demon-strated reduced amplitude of action potentials innerves subjected to 2 zones ofmodest compression.Furthermore, when 2 vertebral segments rather than1 separated the zones of compression, there wasa significant further reduction in the amplitude ofaction potentials. Thus, venous congestion canprecipitate neural dysfunction.
Kobayashi and colleagues,10 in a canine model,examined cauda equina histology after the applica-tion of a modest stenosis (30% of cross-sectionalarea) to the dural tube. The cauda equina demon-strated congestion and dilatation of intraradicularveins and an inflammatory cellular infiltrate. Therewas disruption of the blood–nerve barrier, both atthe site of the compression and also inmore distantsites ofWallerian degeneration. Thenecrotic debriscreated by Wallerian degeneration stimulatesmacrophage activity; macrophages are known togenerate inflammatory molecules, such asinterleukin-1 and tumor necrosis factor a. Macro-phages may also stimulate cytotoxic activity bythe release of nitric oxide and proteases. They areconsidered the chief effector cells causing aninflammatory neuritis that results in aberrantectopic neural discharge and conduction distur-bance leading to the pain and neural dysfunctionof NIC.10 In this canine model, the histologicallydemonstrated disruption of the blood–nerve barriercorrelatedwith strong gadolinium enhancement onmagnetic resonance imaging (MRI). It should beemphasized, paralleling the evidence presented
earlier on the genesis of radicular pain caused bydisc herniations, that an inflammatory reaction isintimately involved in the generation of pain.
There are thus experimental data to suggest thatmultilevel central canal compromise may provokeclinical symptoms even at modest levels ofcompression owing to venous congestion and asecondary inflammatory response. There are clin-ical studies supporting this contention. Sato andKikuchi11 stratified 81 patients with lumbar centralcanal stenosis caused by spondylosis and degen-erative spondylolisthesis into those with a single-level stenosis at the L4-L5 level and a secondgroupwith 2-level stenosis at L3-L4 and L4-L5. Thepatients with 2-level stenosis were significantlymore likely to have neurogenic claudication symp-toms than those with single-level stenosis. It wasalso observed that in 2-level stenosis, the symp-tomatic expression most closely matched theradicular distribution of the more caudal of the 2stenotic levels; in those patients with compromiseat the L3 and L4 disc levels, the pain patternmatched that of the traversing L5 roots.
The study of Porter and Ward12 noted that thesites of compression may be either in the centralcanal or the neural foramina. In their cohort of 49patients with symptomatic NIC, 94% had eithera multilevel central canal stenosis or central canalplus neural foraminal stenosis. They defined neuralforaminal stenosis as a foraminal diameter smallerthan 4 mm (the plane of the dimension was notspecified). Symptomatic single-level stenosis wasrare. Drawing on the earlier work of Takahashi andcolleagues9 and Olmarker and Rydevik,9 theypostulated that modest compression at 2 distantsites will cause venous congestion over a longsegment and this will be exacerbated by thedynamic effects of walking (ie, vasodilatation ofthe arterioles and capillaries will worsen the venoushypertension and capillary stasis rendering a longsegment of nerve ischemic and irritable, ultimatelyproducing pain). This hypothesis can explain bilat-eral and unilateral claudication with a varied combi-nation of central and lateral lesions, which may benear normal venous pressure in the static statebut then exceed venous pressure under the stressof walking. It also emphasizes the importance ofimaging detection of all stenotic zones, both withinthe central canal, the subarticular recess, and theneural foramina. Failure to address all zones ofstenosis during a decompression procedure mayresult in an undesirable clinical result.
The work of Morishita and colleagues13 empha-sized the importance of the neural foramen asa potential zone of compression, particularly withdynamic changes in posture. In 2006, they studied41 patients with central canal stenosis or disk
Imaging of Spinal Stenosis 653
herniations; intraoperatively, micro catheters withpressure transducers were placed in the neuralforamina of L5. Action potentials were measuredin the anterior tibial musculature. Intraforaminalpressures significantly increased when the patientposture was passively moved from lumbar flexionto extension. The amplitude of the action poten-tials diminished in concert with the rise in intrafor-aminal pressure. These patients did not haveforaminal stenosis by imaging. The findingssuggest that the neural foramen may be a site ofvenous constriction with the spine in extensioneven in the absence of stenosis detectable byimaging. This stenosis may act in concert withcentral or subarticular recess compromise toproduce symptoms in positions of lumbar exten-sion, such as walking. In a second study, Morishitaand colleagues14 again measured intraoperativeL5 intraforaminal pressures during passive posi-tional changes of the lumbar spine in a cohort ofpatients with spinal stenosis. These patientswere stratified into single or 2 levels of centralcanal compromise, as well as into greater or lesserdisability. The group with greater disability hadsignificantly greater rises in intraforaminal pres-sures in the movement from flexion to extension.The patients who had 2-level central canalcompromise had greater disability even thoughthe rises in intraforaminal pressure were moremodest. The study suggests that there is a cumula-tive effect of multiple sites of central canalcompromise that conspire with the rise in intrafor-aminal pressures during lumbar extension toproduce neural ischemia, presumably via venouscongestion. One can postulate that static foram-inal stenosis would further exacerbate thisprocess. All levels of neural compromise, central,subarticular, and foraminal, are potentially signifi-cant and must be detected by imaging.
Imaging
Congenital spinal stenosisIt is widely accepted, although poorly docu-mented, that in a portion (10%–15%) of patientswho present with NIC, the spinal canal is congen-itally or developmentally narrow, and only modestspondylotic changes are necessary to produceclinical symptoms (Figs. 1 and 2). Szpalski andGunzburg,15 in a recent review article on lumbarspinal stenosis, contended that there is a Gaussiandistribution of both canal size and dural sac size;when a canal size is too small for the dural sac itcontains, stenosis occurs. In this construct,disregarding the true achondroplasia syndromes,so-called congenitally narrow canals are merelythe extreme of Gaussian distribution of healthy
subjects. In contrast, Singh and colleagues16
studied themorphologic characteristics of a cohortof surgically treated patients carrying the clinicaldiagnosis of congenital lumbar stenosis. Theynoted that these patients had a significantly short-er pedicle length and, as a result, smaller cross-sectional spinal canal area when compared withcontrols matched for age and sex. The patientswith a congenitally narrowed lumbar central canaltypically exhibit these morphologic characteristicsover several vertebral segments, maximal at the L3level. This contrasts with purely “degenerative”stenosis, which is often more focal, particularly atthe L4 disc level.16 Patients with congenital centralcanal stenosis tend to present at a younger age(40–50) and with less spondylotic change thantypical. In this cohort of patients, congenital nar-rowing could be recognized on lateral radiographsby identifying a pedicle length to vertebral bodyratio of less than 0.43 at the L3 vertebral level.The common terminology of “congenital” spinal
stenosis may in fact be flawed; “developmental”may be a more accurate designation. Thesemorphologic changes may not simply representgenetic variation, but rather reflect a develop-mental insult. Papp and colleagues17 studiedpatients with “congenital” spinal canal stenosisand noted significant correlations with prenatalfactors. The spinal canal at the L3 level (>L4>L5)was found to be the most sensitive to the influenceof prenatal events. In a multiple regression anal-ysis, external factors accounted for 43% of thevariance of the spinal canal cross-sectional areaat L3; gestational age was by far the most signifi-cant factor. Shorter gestational age resulted ina smaller adult spinal canal. Significant factors ofless importance included low placental weight,greater maternal age, primiparity, low socioeco-nomic class, and low birth weight. The L3 and L4vertebral bodies are fully developed by age 1; L5,in contrast, is not fully mature until age 6. Thereis little opportunity for catch-up growth at L3 orL4 following a prenatal insult.17 The trunk andlimbs can recover from a prenatal disturbance,as they continue to grow until adulthood, resultingin normal external patient morphology concealinga mid-lumbar developmental stenosis.
Acquired spinal stenosisThe great majority of patients presenting with NIChave acquired “degenerative” spondylotic changeas their primary cause of central canal, subarticu-lar recess, and/or foraminal compromise. As notedby Dr Bogduk earlier in this issue, the term “degen-erative” is unduly pejorative and may contribute tonegative patient perceptions regarding their prog-nosis. Maturational or age change is preferred.
Maus654
The changes that result in compromise of thecentral canal are rooted in the 3-joint structure ofthe spine motion segment: the disc and the pairedfacet joints. In the anterior column, degradation ofthe nuclear compartment of the disc places exces-sive load on the posterior annulus, resulting in end-plate hypertrophs, or with annular failure, discherniation. These changes encroach on the ventralaspect of the central canal or LRs. Loss of discspace height obligates narrowing of the neuralforamina, and contributes to increased facet loadand ultimately arthrosis; facet capsular hyper-trophy and superior articular process (SAP) osteo-phytes compromise the subarticular recesses.Synovial cysts, particularly at the L4 level, maycontribute to central canal, subarticular recess,or foraminal compromise. The reduced height ofthe segment, and loss of elasticity of the ligamen-tum flavum, result in its buckling centrally asa dominant cause of loss of cross-sectional areaof the central canal. The ligamentum flavum mayalso thicken, although it is unclear if this representstrue hypertrophy.18 It is known to undergo fibrotic
chondrometaplastic change, diminishing its elas-ticity, and to calcify more commonly in patientspresenting with NIC.15 Thickening of the ligamen-tum flavum has also been associated with arthrop-athy in the adjacent facet joints, suggesting theremay be an inflammatory component to thisprocess, independent of simple mechanical buck-ling of ligament into the central canal as a result ofloss of disc height.19 These several anterior andposterior column phenomena conspire to narrowthe central canal most commonly at the L4-5disc level, followed by L3-L4, L5-S1, and L1-L2.20
This cascade of age changes compromise thecentral canal, subarticular recesses, and/or neuralforamina; there are a number of measurableparameters that could quantify the degree ofstenosis depicted by radiography, myelography,CT, or MRI. Verbiest,7 in his early descriptions ofthe entity of spinal stenosis, suggested that a 10-mm to 12-mm anterior-posterior (AP) diameter ofthe dural sac on conventional myelography consti-tuted relative stenosis, with a measurement of lessthan 10 mm denoting absolute stenosis. Steurer
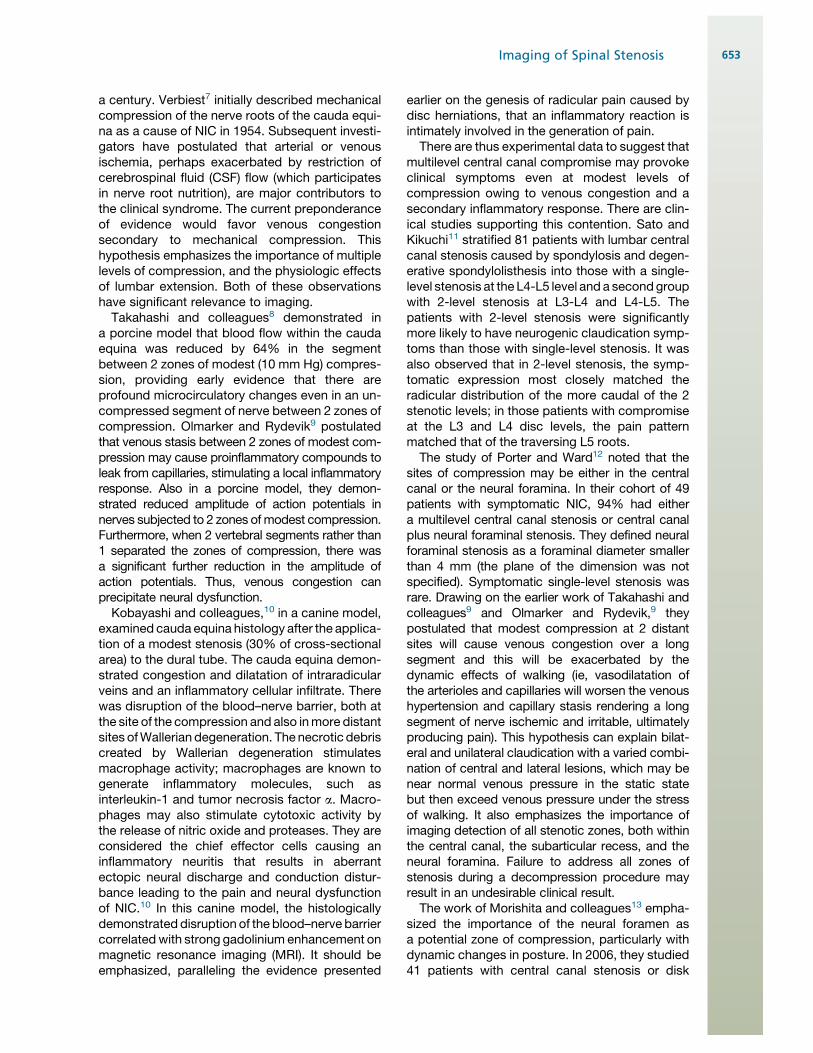
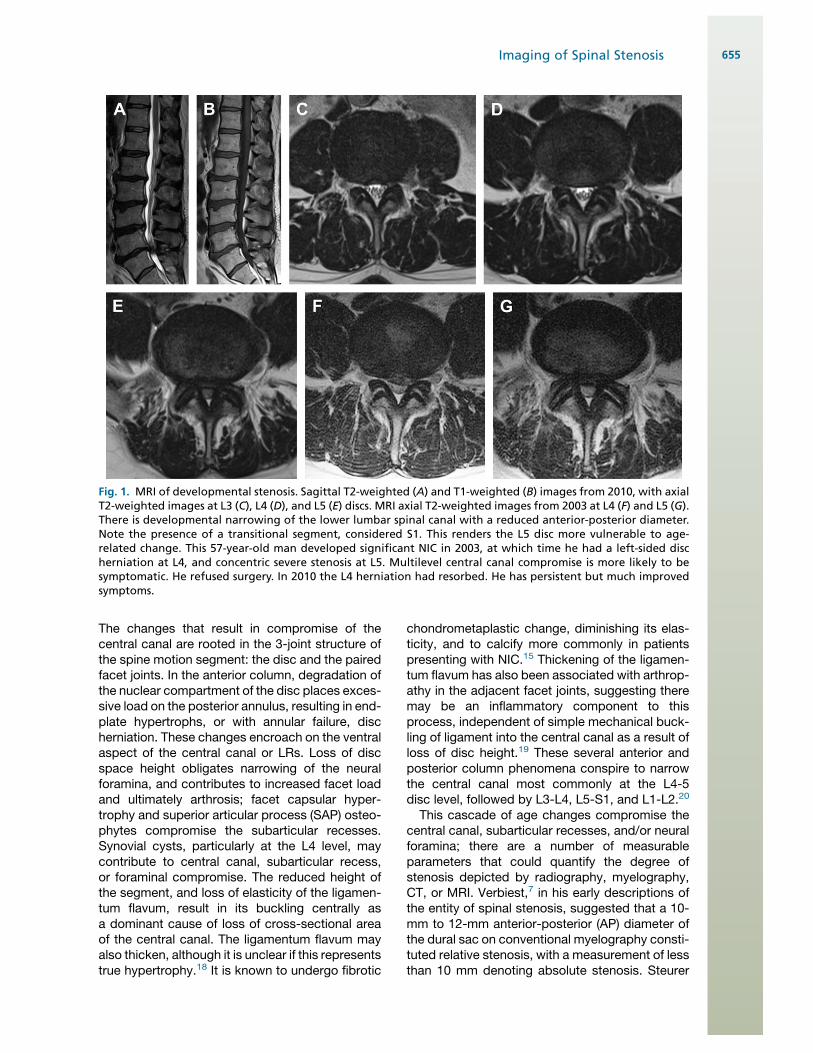
Fig. 1. MRI of developmental stenosis. Sagittal T2-weighted (A) and T1-weighted (B) images from 2010, with axialT2-weighted images at L3 (C), L4 (D), and L5 (E) discs. MRI axial T2-weighted images from 2003 at L4 (F) and L5 (G).There is developmental narrowing of the lower lumbar spinal canal with a reduced anterior-posterior diameter.Note the presence of a transitional segment, considered S1. This renders the L5 disc more vulnerable to age-related change. This 57-year-old man developed significant NIC in 2003, at which time he had a left-sided discherniation at L4, and concentric severe stenosis at L5. Multilevel central canal compromise is more likely to besymptomatic. He refused surgery. In 2010 the L4 herniation had resorbed. He has persistent but much improvedsymptoms.
Imaging of Spinal Stenosis 655
and colleagues,21 in a 2011 review, surveyed thenumerousmeasurements applied by various inves-tigators in the intervening decades in 25 uniquestudies and 4 systematic reviews. These parame-ters are detailed in Tables 1 and 2.The most common descriptors of central
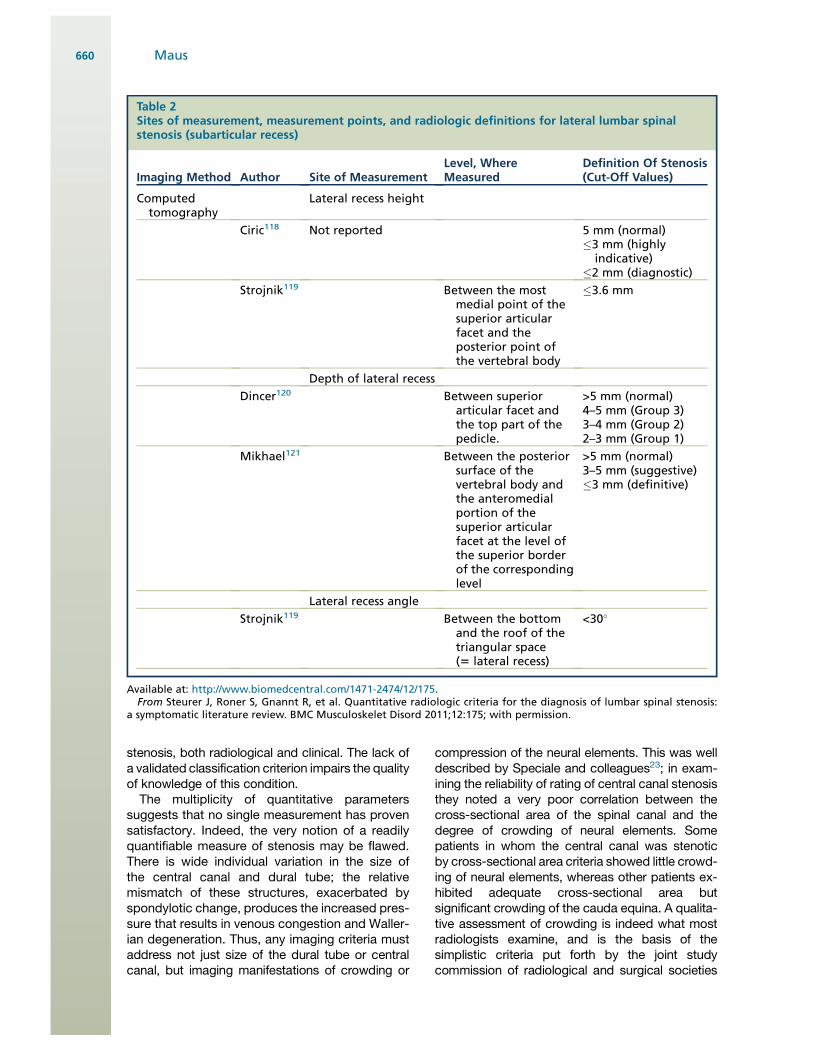
stenosis include the AP dimension of the osseouscanal or the dural sac and the cross-sectional areaof the dural sac. Dural sac AP dimension of lessthan 10 mm or dural sac cross-sectional area ofless than 100 mm2 constitutes stenosis. Descrip-tors of lateral recess or subarticular stenosisinclude the height and depth of the recess andthe subarticular recess angle. Height is definedas the shortest distance between the most anteriorpoint of the SAP and the posterior vertebral body,depth as the distance from the SAP to the junctionof the pedicle and the vertebral body, and recess
angle as the angle formed by the posterior verte-bral body and the pars interarticularis. Althoughdefined differently by different investigators, thereis little real distinction between height and depth.Subarticular recess stenosis is typically definedas height less than 2 mm, depth less than 3 mm,or angle smaller than 30". Descriptors of foraminalstenosis most commonly used suggest a diameterof 2 to 3 mm or smaller as indicative of stenosis.Steurer and colleagues21 correctly observed thatthe lack of a uniform quantitative description ofanatomic central canal, subarticular recess, orforaminal stenosis confounds the evaluation of therole of imaging in the diagnosis of the clinical entityof NIC. This criticism was echoed by Genevay andassociates,22 who lamented the high degree of vari-ability in the eligibility criteria for studies examiningneurogenic claudication caused by lumbar spinal
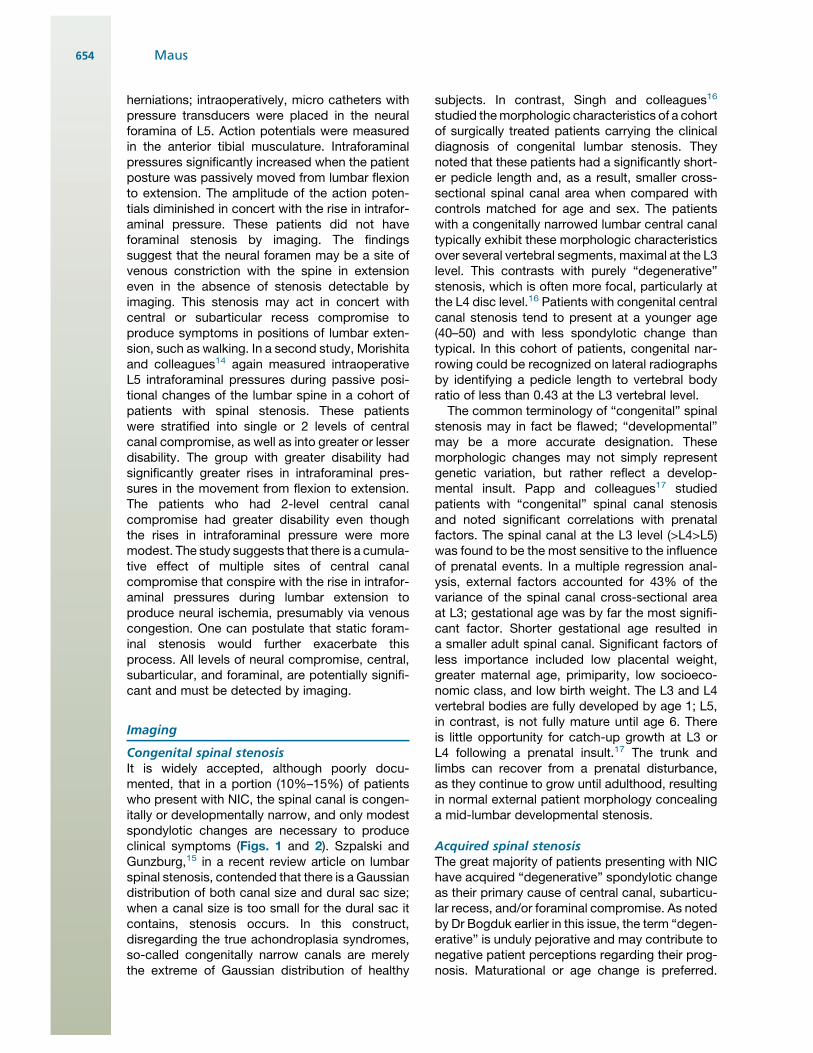
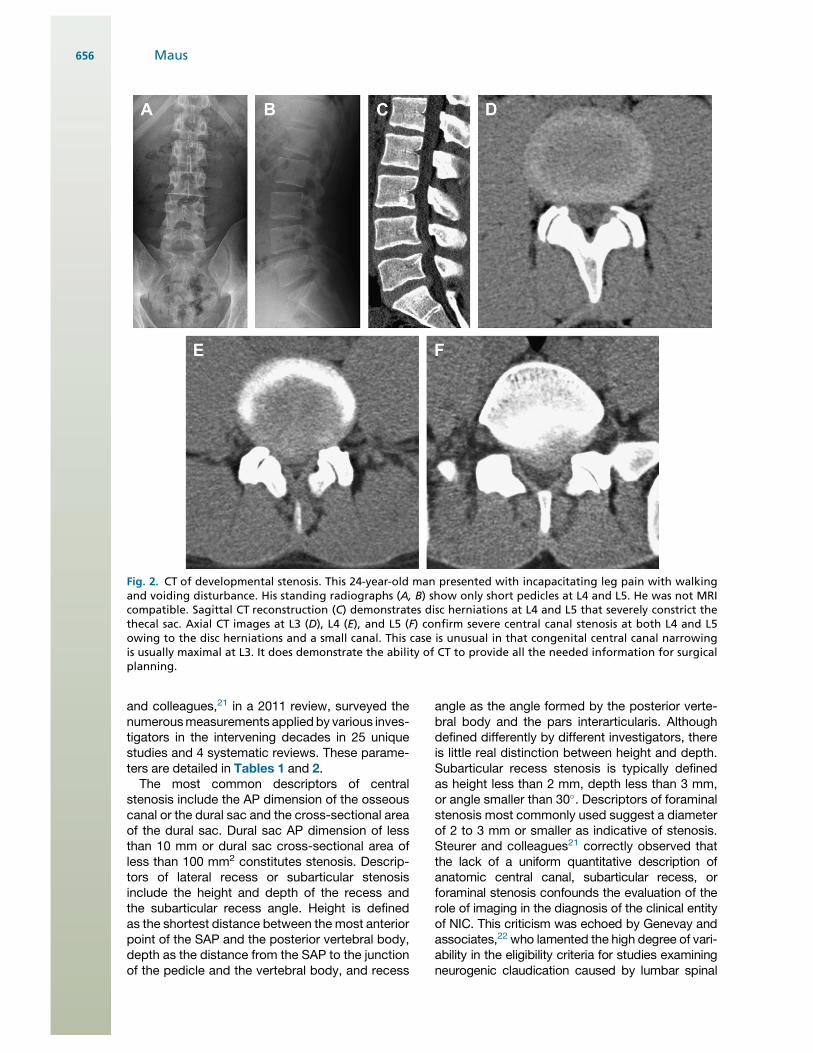
Fig. 2. CT of developmental stenosis. This 24-year-old man presented with incapacitating leg pain with walkingand voiding disturbance. His standing radiographs (A, B) show only short pedicles at L4 and L5. He was not MRIcompatible. Sagittal CT reconstruction (C) demonstrates disc herniations at L4 and L5 that severely constrict thethecal sac. Axial CT images at L3 (D), L4 (E), and L5 (F) confirm severe central canal stenosis at both L4 and L5owing to the disc herniations and a small canal. This case is unusual in that congenital central canal narrowingis usually maximal at L3. It does demonstrate the ability of CT to provide all the needed information for surgicalplanning.
Maus656
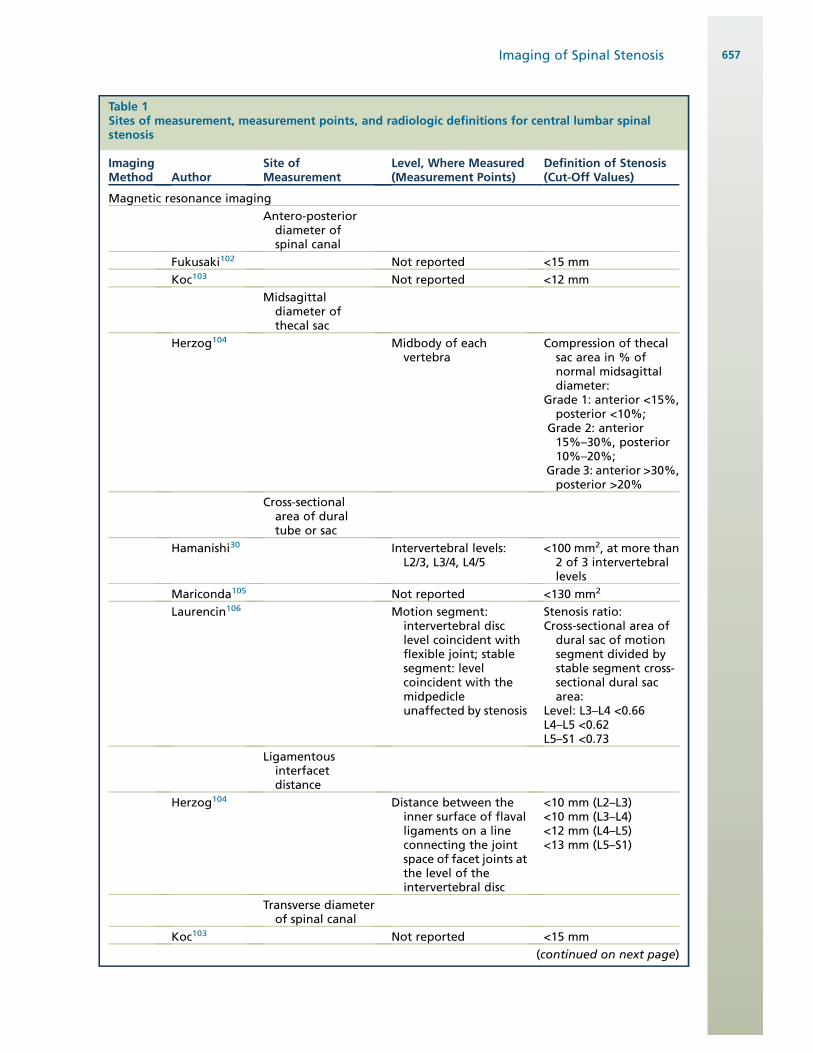
Table 1Sites of measurement, measurement points, and radiologic definitions for central lumbar spinalstenosis
ImagingMethod Author
Site ofMeasurement
Level, Where Measured(Measurement Points)
Definition of Stenosis(Cut-Off Values)
Magnetic resonance imaging
Antero-posteriordiameter ofspinal canal
Fukusaki102 Not reported <15 mm
Koc103 Not reported <12 mm
Midsagittaldiameter ofthecal sac
Herzog104 Midbody of eachvertebra
Compression of thecalsac area in % ofnormal midsagittaldiameter:
Grade 1: anterior <15%,posterior <10%;
Grade 2: anterior15%–30%, posterior10%–20%;
Grade 3: anterior >30%,posterior >20%
Cross-sectionalarea of duraltube or sac
Hamanishi30 Intervertebral levels:L2/3, L3/4, L4/5
<100 mm2, at more than2 of 3 intervertebrallevels
Mariconda105 Not reported <130 mm2
Laurencin106 Motion segment:intervertebral disclevel coincident withflexible joint; stablesegment: levelcoincident with themidpedicleunaffected by stenosis
Stenosis ratio:Cross-sectional area ofdural sac of motionsegment divided bystable segment cross-sectional dural sacarea:
Level: L3–L4 <0.66L4–L5 <0.62L5–S1 <0.73
Ligamentousinterfacetdistance
Herzog104 Distance between theinner surface of flavalligaments on a lineconnecting the jointspace of facet joints atthe level of theintervertebral disc
<10 mm (L2–L3)<10 mm (L3–L4)<12 mm (L4–L5)<13 mm (L5–S1)
Transverse diameterof spinal canal
Koc103 Not reported <15 mm
(continued on next page)
Imaging of Spinal Stenosis 657
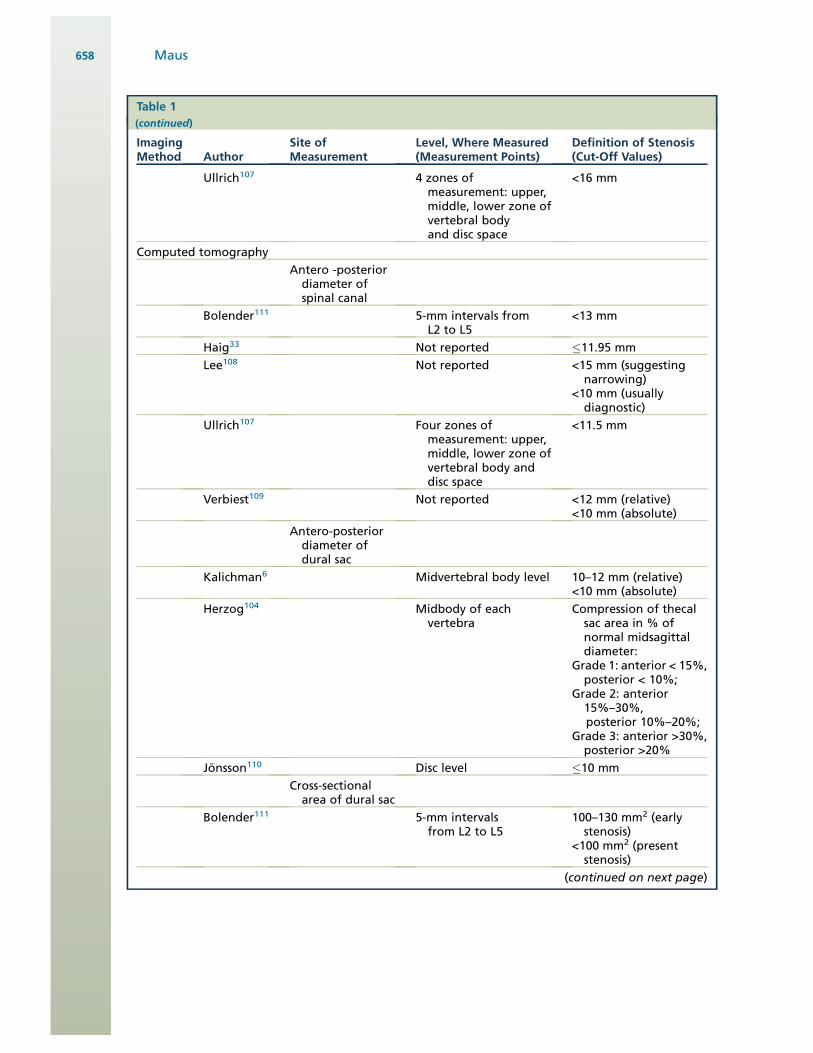
Table 1(continued)
ImagingMethod Author
Site ofMeasurement
Level, Where Measured(Measurement Points)
Definition of Stenosis(Cut-Off Values)
Ullrich107 4 zones ofmeasurement: upper,middle, lower zone ofvertebral bodyand disc space
<16 mm
Computed tomography
Antero -posteriordiameter ofspinal canal
Bolender111 5-mm intervals fromL2 to L5
<13 mm
Haig33 Not reported #11.95 mm
Lee108 Not reported <15 mm (suggestingnarrowing)
<10 mm (usuallydiagnostic)
Ullrich107 Four zones ofmeasurement: upper,middle, lower zone ofvertebral body anddisc space
<11.5 mm
Verbiest109 Not reported <12 mm (relative)<10 mm (absolute)
Antero-posteriordiameter ofdural sac
Kalichman6 Midvertebral body level 10–12 mm (relative)<10 mm (absolute)
Herzog104 Midbody of eachvertebra
Compression of thecalsac area in % ofnormal midsagittaldiameter:
Grade 1: anterior < 15%,posterior < 10%;
Grade 2: anterior15%–30%,posterior 10%–20%;
Grade 3: anterior >30%,posterior >20%
Jonsson110 Disc level #10 mm
Cross-sectionalarea of dural sac
Bolender111 5-mm intervalsfrom L2 to L5
100–130 mm2 (earlystenosis)
<100 mm2 (presentstenosis)
(continued on next page)
Maus658
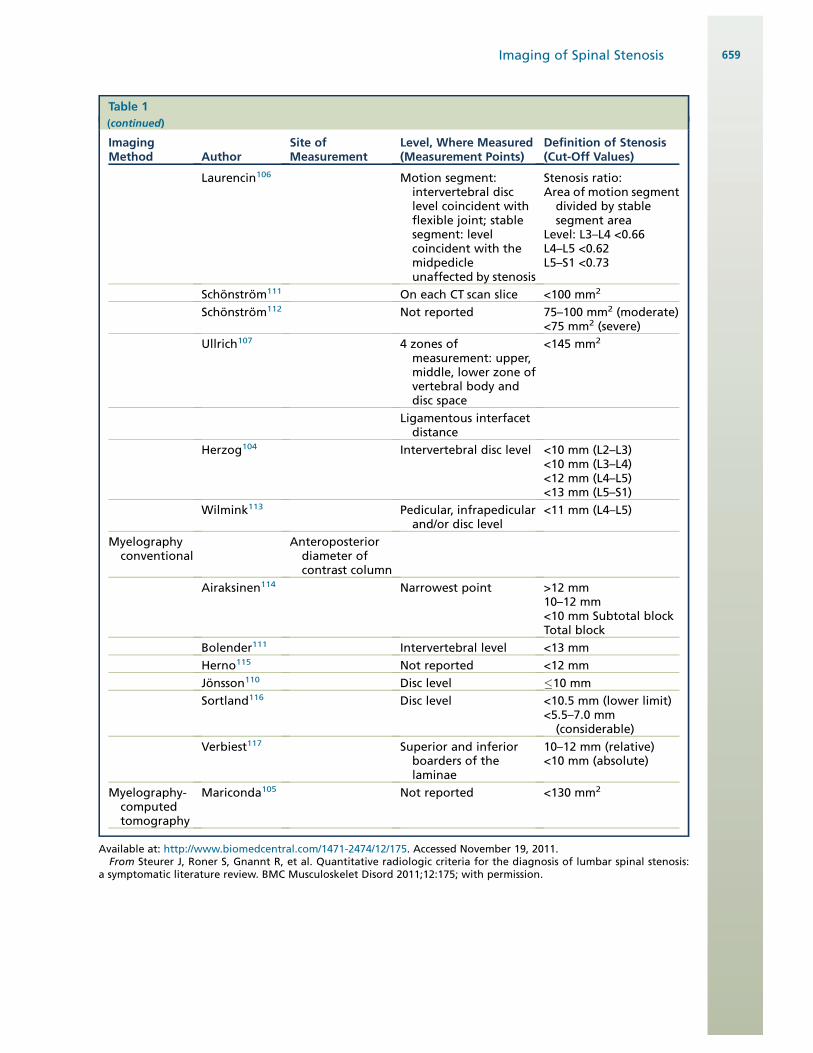
Table 1(continued)
ImagingMethod Author
Site ofMeasurement
Level, Where Measured(Measurement Points)
Definition of Stenosis(Cut-Off Values)
Laurencin106 Motion segment:intervertebral disclevel coincident withflexible joint; stablesegment: levelcoincident with themidpedicleunaffected by stenosis
Stenosis ratio:Area of motion segmentdivided by stablesegment area
Level: L3–L4 <0.66L4–L5 <0.62L5–S1 <0.73
Schonstrom111 On each CT scan slice <100 mm2
Schonstrom112 Not reported 75–100 mm2 (moderate)<75 mm2 (severe)
Ullrich107 4 zones ofmeasurement: upper,middle, lower zone ofvertebral body anddisc space
<145 mm2
Ligamentous interfacetdistance
Herzog104 Intervertebral disc level <10 mm (L2–L3)<10 mm (L3–L4)<12 mm (L4–L5)<13 mm (L5–S1)
Wilmink113 Pedicular, infrapedicularand/or disc level
<11 mm (L4–L5)
Myelographyconventional
Anteroposteriordiameter ofcontrast column
Airaksinen114 Narrowest point >12 mm10–12 mm<10 mm Subtotal blockTotal block
Bolender111 Intervertebral level <13 mm
Herno115 Not reported <12 mm
Jonsson110 Disc level #10 mm
Sortland116 Disc level <10.5 mm (lower limit)<5.5–7.0 mm(considerable)
Verbiest117 Superior and inferiorboarders of thelaminae
10–12 mm (relative)<10 mm (absolute)
Myelography-computedtomography
Mariconda105 Not reported <130 mm2
Available at: http://www.biomedcentral.com/1471-2474/12/175. Accessed November 19, 2011.From Steurer J, Roner S, Gnannt R, et al. Quantitative radiologic criteria for the diagnosis of lumbar spinal stenosis:
a symptomatic literature review. BMC Musculoskelet Disord 2011;12:175; with permission.
Imaging of Spinal Stenosis 659
stenosis, both radiological and clinical. The lack ofa validated classification criterion impairs the qualityof knowledge of this condition.The multiplicity of quantitative parameters
suggests that no single measurement has provensatisfactory. Indeed, the very notion of a readilyquantifiable measure of stenosis may be flawed.There is wide individual variation in the size ofthe central canal and dural tube; the relativemismatch of these structures, exacerbated byspondylotic change, produces the increased pres-sure that results in venous congestion and Waller-ian degeneration. Thus, any imaging criteria mustaddress not just size of the dural tube or centralcanal, but imaging manifestations of crowding or
compression of the neural elements. This was welldescribed by Speciale and colleagues23; in exam-ining the reliability of rating of central canal stenosisthey noted a very poor correlation between thecross-sectional area of the spinal canal and thedegree of crowding of neural elements. Somepatients in whom the central canal was stenoticby cross-sectional area criteria showed little crowd-ing of neural elements, whereas other patients ex-hibited adequate cross-sectional area butsignificant crowding of the cauda equina. A qualita-tive assessment of crowding is indeed what mostradiologists examine, and is the basis of thesimplistic criteria put forth by the joint studycommission of radiological and surgical societies
Table 2Sites of measurement, measurement points, and radiologic definitions for lateral lumbar spinalstenosis (subarticular recess)
Imaging Method Author Site of MeasurementLevel, WhereMeasured
Definition Of Stenosis(Cut-Off Values)
Computedtomography
Lateral recess height
Ciric118 Not reported 5 mm (normal)#3 mm (highly
indicative)#2 mm (diagnostic)
Strojnik119 Between the mostmedial point of thesuperior articularfacet and theposterior point ofthe vertebral body
#3.6 mm
Depth of lateral recess
Dincer120 Between superiorarticular facet andthe top part of thepedicle.
>5 mm (normal)4–5 mm (Group 3)3–4 mm (Group 2)2–3 mm (Group 1)
Mikhael121 Between the posteriorsurface of thevertebral body andthe anteromedialportion of thesuperior articularfacet at the level ofthe superior borderof the correspondinglevel
>5 mm (normal)3–5 mm (suggestive)#3 mm (definitive)
Lateral recess angle
Strojnik119 Between the bottomand the roof of thetriangular space(5 lateral recess)
<30"
Available at: http://www.biomedcentral.com/1471-2474/12/175.From Steurer J, Roner S, Gnannt R, et al. Quantitative radiologic criteria for the diagnosis of lumbar spinal stenosis:
a symptomatic literature review. BMC Musculoskelet Disord 2011;12:175; with permission.
Maus660
in 2001.24 This lexicon of spine “degenerative ”conditions defines central canal stenosis as mild ifthere is compromise of one-third or less of the ex-pected canal area, moderate if the compromise isone-third to two-thirds, and severe if the compro-mise exceeds two-thirds. This more subjectivestandard better addresses the crowding of neuralelements, but has reliability challenges, describedlater.
The observation of nerve root redundancy asa qualitative marker of central canal compromisedates from the original description of the entity ofspinal stenosis by Verbiest.7 This is presumed tooriginate from mechanical entrapment of the rootat the site of compression, with subsequent elon-gation of the nerve above this site under the tensilestress of physiologic flexion and extension motion.Although frequently observed, this sign has beensubjected to little study. Redundant nerve rootsare present in 34% to 42% of surgical candidateswith clinical NIC.25 In a 2007 study by Min andcolleagues,25 redundant nerve roots were morecommonly seen in older patients, but there wasno significant association with duration of symp-toms, diameter of the spinal canal, preoperativesymptom intensity, or surgical outcomes. Therewas a nonsignificant trend toward poorer surgicaloutcomes in patients with redundant roots.
Degenerative spondylolisthesisDegenerative spondylolisthesis was initiallydescribed by McNab as “spondylolisthesis withan intact neural arch.”26 It is highly associatedwith disk failure at this level, as well as significantfacet arthrosis; it frequently results in single-levelcentral canal compromise. Degenerative anterolis-thesis is present in 4% to 14% of elderlypatients.27 It is most frequent at the L4 level, fol-lowed by the L5 and L3 levels. It is significantlymore common in women than men.27
As degenerative spondylolisthesis is usuallypresent at a single segmental level, it mostcommonly causes radiculopathy or radicular painrather than NIC.15 Associated foraminal stenosisor modest central canal or LR compromise at otherlevels can provoke NIC (Fig. 3).
Reliability of imaging parametersSpeciale and associates23 studied the reliability ofa normal, mild, moderate, severe classification ofcentral canal stenosis. They observed only fairinterobserver reliability (k 5 0.26). Stratified byspecialties, reliability was higher among radiolo-gists (k 5 0.40), followed by neurosurgeons (k 50.21) and orthopedic surgeons (k 5 0.15). Intraob-server reliability was poor at k 5 0.11. Linearregression models showed that the classification
was highly correlated with central canal area;that is, although the grade of stenosis at a givenspinal level showed wide variability amongobservers, smaller canals were invariably diag-nosed as more severely stenotic than largercanals. In this study, the observers were not givencriteria or examples defining the mild, moderate,or severe classification.
In contrast, Lurie and associates28 studied thereliability of subjective grading of stenosis of thecentral canal, subarticular recesses, and neuralforamina and measurement of central canal anddural sac area aided by specific definitions andimaging examples of the criteria. Stenosis wassubjectively rated as none, mild, moderate, orsevere using the Fardon and Millette definitions;nerve root compromise in the foramen was cate-gorized as none, touching, displacing, or com-pressing. Inter-reader reliability in assessing thecentral canal was substantial, with k5 0.73. Therewas moderate to substantial reliability for foram-inal stenosis and nerve root impingement (k 50.58 and 0.51, respectively). Reliability for subar-ticular stenosis was only moderate at k 5 0.49. In-trareader reliability was greater than inter-readerreliability for all features. These results emphasizethe importance of clear definition of criteria for reli-able grading of stenosis by subjective scales.
Specificity: correlation of imaging findings withclinical stateThe ultimate challenge in establishing the utility ofdiagnostic imaging in the diagnosis of NIC is thelack of a gold standard against which to measureimaging parameters. Surgical findings may besubjective. Clinical outcomes are highly depen-dent on the technical success of the institutedsurgical therapy, and the outcome instrumentsused in any such measurement. Comparisonagainst the best available cross-sectional imagingresults in a circular argument.
The specificity fault in imaging of central canalstenosis can be seen in studies of asymptomaticvolunteers. Boden and associates1 noted sig-nificant central canal stenosis on MRI in 21% ofasymptomatic subjects older than 60. Jarvik andcolleagues29 demonstrated that asymptomaticstenosis on MRI increases in prevalence withage: moderate to severe central canal stenosiswas seen in 7% of subjects younger than 45,6% of subjects age 45 to 55, 11% of subjectsage 55 to 65, and in 21% of subjects olderthan 65.
Several studies involving patients with NIC sug-gested quantitative imaging correlates, which mayaid in the diagnosis. The study of Hamanishi andcolleagues30 showed that a decrease in the dural
Imaging of Spinal Stenosis 661
cross-sectional area (DCSA) to less than100mm2 atmore than2of3 lumbar levels (L2–3,L3–4,L4–5)washighly associated with the presence of clinical NIC.Similarly, Bolender and colleagues31 suggestedthat a DCSA of 100mm2 or less on CTwas unequiv-ocal evidence of central canal compromise. Schon-strom and Hansson,32 in a cadaver study,demonstrated that a DCSA of 75mm2 or less corre-sponded to the initial increase inpressure in the cau-da equina and represented a more physiologicmarker of central canal stenosis.On the contrary, numerous studies examining
patients with NIC have shown a poor correlationbetween imagingparametersofstenosisandclinicalstate. Haig and colleagues33 studied 126 patientsstratified into 3 groups: those with no back pain,those with mechanical back pain, and those withNIC by clinical diagnosis. MRI measurements didnot differentiate between patients with clinical NICand controls by better than chance. Sirvanci andcolleagues34 examined 63 patients undergoing de-compressive surgery for NIC. Morphologic stenosis
was assessed by dural cross-sectional area (normalwas greater than 100 mm2; 76 to 100 mm2 wasmoderately stenotic; less than 76mm2was severelystenotic) and a 4-point grading of subarticular andforaminal stenosis. There was no correlationbetween any of the measured parameters in anyspine compartment and patient disability asmeasured by the Oswestry Disability Index (ODI).This applied to both patients with multilevelcentral stenosis and a subset with degenerativespondylolisthesis.Yasar and colleagues35 performed a prospective
analysis of 125 patients with a clinical diagnosis ofNIC and anatomic central canal stenosis (DCSA<100 mm2) who underwent surgical decompres-sion. Preoperative evaluation included time to firstclaudicatory symptoms (FST) on treadmill testing,maximum walking distance (MWD), and ODI.There was no correlation between DCSA and theFST, MWD, or ODI preoperatively or at a 3-monthpostoperative evaluation. Results emphasize thatthe decision to operate and assessment at
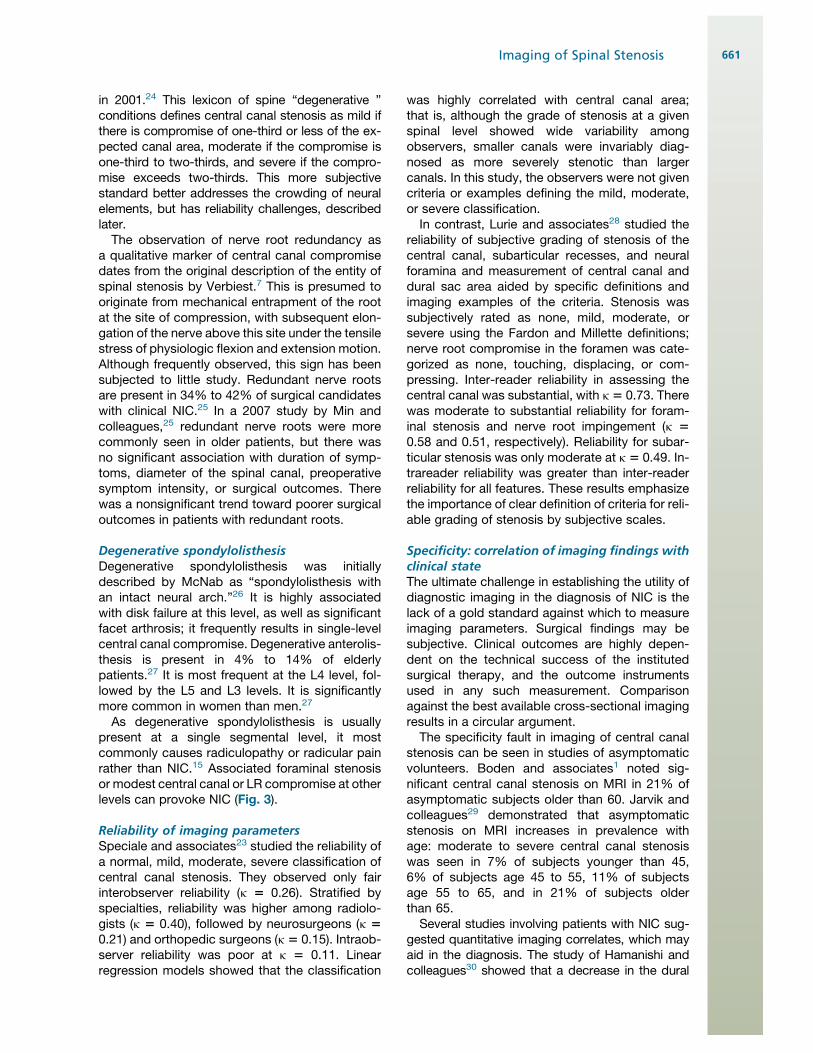
Fig. 3. Degenerative spondylolisthesis. Sagittal T1-weighted (A) and T2-weighted (B) images demonstrate grade 1anterolisthesis of L4 on L5with central canal compromise. Axial T2-weighted images through the L4disc space (C,D)confirm severe central canal stenosis. Paramedian T2 sagittal images through the left and right foramina (E, F) showonlymodest foraminal narrowing on the right. This patient presentedwith a radicular pain syndrome (bilateral L5)rather than NIC, likely owing to the single-level compressive disease.
Maus662
follow-up are better done with functional thananatomic parameters.
Geisser and colleagues,36 in a 2007 study of 50patients with clinical NIC, showed no correlationbetween the AP dimension of the spinal canal(using 10-mm or 13-mm criteria for stenosis) andfunctional assessments of patient disability.Zeifang and colleagues,37 in a 2008 evaluation of63 patients, found no correlation between MWDand DCSA. Although the NASS guidelines2
conclude that there is insufficient evidence torecommend for or against a correlation betweenclinical symptoms or function and the presenceof anatomic narrowing of the spinal canal oncross-sectional imaging, the preponderance ofevidence argues against such a correlation in thisauthor’s judgment.
Sensitivity: dynamic lesionsThere is also a basic sensitivity flaw in advancedimaging. NIC is by definition intermittent; mostpatients with NIC report exacerbation of symp-toms with extension and weight bearing. Thecross-sectional area of the central spinal canal,subarticular zone or lateral recess, and neuralforamina are maximized with flexion positioning;the dimensions of these structures diminish withextension and axial load. Intradiscal pressuresare significantly lower in a recumbent positionthan when sitting or standing. Schmid and associ-ates38 noted a 40 mm2 reduction in cross-sectional area of the dural sac at the L3-4 level inmoving from flexion to extension. Danielson andWillen39 studied asymptomatic volunteers andnoted a significant decrease in the DCSAwith axialloading in 56% of the subjects, most commonly atL4-5. This finding was more common withincreasing age. Decrease in DCSA with loadingwas less frequent in healthy volunteers than ina population of patients with NIC. In Willen andDanielson’s study,40 80% of symptomatic patientscrossed a threshold of relative (100 mm2) or abso-lute (75 mm2) in DCSA when axial load was appliedusing a loading device on a standard MRI scanner.Willen and colleagues41 reported on the follow-upof 25 patients who underwent lumbar decompres-sion based on central canal compromise detectedsolely on images obtained under axial load; 96%ofthe patients were improved or much improvedregarding their clinical NIC after decompression.The proportion of patients with a walking capacityof 500 m increased from 4% preoperatively to87% postoperatively. The NASS guidelinessuggest thatMRI or CTwith axial loading is a usefuladjunct to standard imaging in patients who haveclinical signs or symptoms of NIC, a DCSA ofless than 110 mm2 at 1 or more levels, and
suspected but not verified central or lateralstenosis on unloaded MRI or CT.2
A 2009 study by Hansson and associates42
identified the ligamentum flavum as the greatestdynamic contributor to central canal compromisewith axial load and extension. The averagecross-sectional area of the central canal dimin-ished by 23 mm2 at the L3 disk level and 14 mm2
at the L4 level under load. The ligamentum flavumwas responsible for 50% of the reduction at the L3level and 85% of the reduction at the L4 level.Madsen and associates43 attempted to distinguishbetween the effects of axial load and extension;their work suggested that lumbar spine extensionis the dominant cause of reduction in DCSA inthe standing patient. Axial load was less signifi-cant. The study of Feng and colleagues44 similarlyidentified a direct correlation between the degreeof lumbar angular motion and the observed reduc-tion in central canal diameter in the movementfrom flexion to extension. These studies wouldsuggest that recumbent imaging in lumbar exten-sion, with standard MRI scanners, may improvethe sensitivity to the detection of dynamic lesionswithout the cost and diminished signal-to-noiseratio of dedicated upright scanners. This remainsto be demonstrated in direct comparative studies.
Imaging modalities: CT, CT/myelography, MRIThere are no comparative effectiveness studiesaddressing the use of CT versus CT/myelographyversus MRI in the documentation of central canal,subarticular recess, or foraminal stenosis usingcurrent technologies. The NASS systematic reviewof this question revealed that there is little strongevidence preferring MRI over CT or CT/myelogra-phy.2 The studies of Kent and colleagues,45 Bis-choff and colleagues,46 Modic and colleagues,47
and Schnebel and colleagues48 show good agree-ment between the modalities and no substantiveevidence for the superiority of any modality. Basedprimarily on its noninvasive character, and lack ofradiation exposure, NASS suggests MRI as themost appropriate initial study in patients with clin-ically suspected NIC; CT/myelography or CT aloneare appropriate examinations in the non–MRI-compatible patient (Figs. 4 and 5).2
GadoliniumMRI studies in patients with clinical evidence ofNIC are typically performed without the adminis-tration of intravenous gadolinium, with the excep-tion of the postoperative setting. Given thespecificity challenges of purely anatomic imaging,the more physiologic parameter of gadoliniumenhancement may have a role. This is not a newobservation; Jinkins49 in 1993 observed abnormal
Imaging of Spinal Stenosis 663
intrathecal nerve root enhancement at the site ofstenosis on enhanced MRI in patients with NIC.He postulated that this represented breakdownof the blood–nerve barrier at sites of nerve rootinjury with subsequent Wallerian degeneration.This has been elegantly confirmed in a caninemodel by the recent work of Kobayashi andcolleagues.10 Histologic examination demon-strated congestion and dilatation of intraradicularveins and an inflammatory cellular infiltrate at sitesof gadolinium enhancement. Gadolinium enhance-ment may provide added specificity in the correla-tion of imaging and the clinical symptomatology ofNIC; this remains to be proven in clinical studiesFig. 6.
Recent Observations
A 2010 study by Barz and colleagues50 describedthe “nerve root sedimentation sign” as a marker ofsymptomatic NIC. In patients without central canalcompromise, the roots of cauda equina lie in thedorsal aspect of the dural sac on supine MRI. Apositive sedimentation sign was defined as theabsence of nerve root sedimentation to the dorsaldural sac on at least 1 image of axial MRI at a level
above or below the zone of compression; the 2nerve roots leaving the dural sac at the nextmost caudal segment are exceptions. This retro-spective study used a total of 200 patients: 100patients with low back pain but without clinicalNIC, and a DCSA greater than 120 mm2, anda cohort of 100 patients with clinical NIC,a maximum walking distance of less than 200 m,and a DCSA of less than 80 mm2 on at least 1 level.There was no correlation between the smallestDCSA and patient disability as measured by theODI. The sedimentation sign, however, was identi-fied in 94 of the patients in the NIC cohort but innone of the low back pain group. It remains to bedemonstrated that this sign provides additionalspecificity over quantitative measurement of theDCSA.
THORACIC SPINAL STENOSIS
Symptomatic central canal stenosis in the thoracicsegment of the spine owing to age-related changeis far less common than in the cervical and lumbarregions, likely because of the added mechanicalstability imparted by the rib cage. Systemic disease
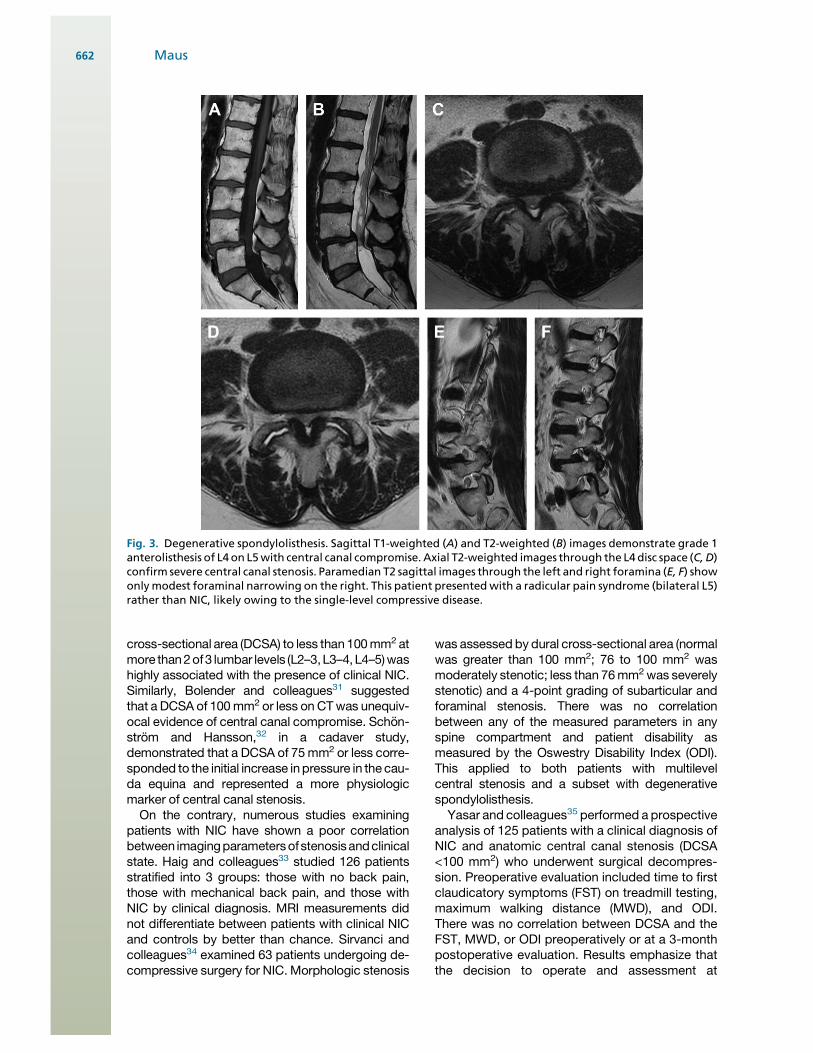
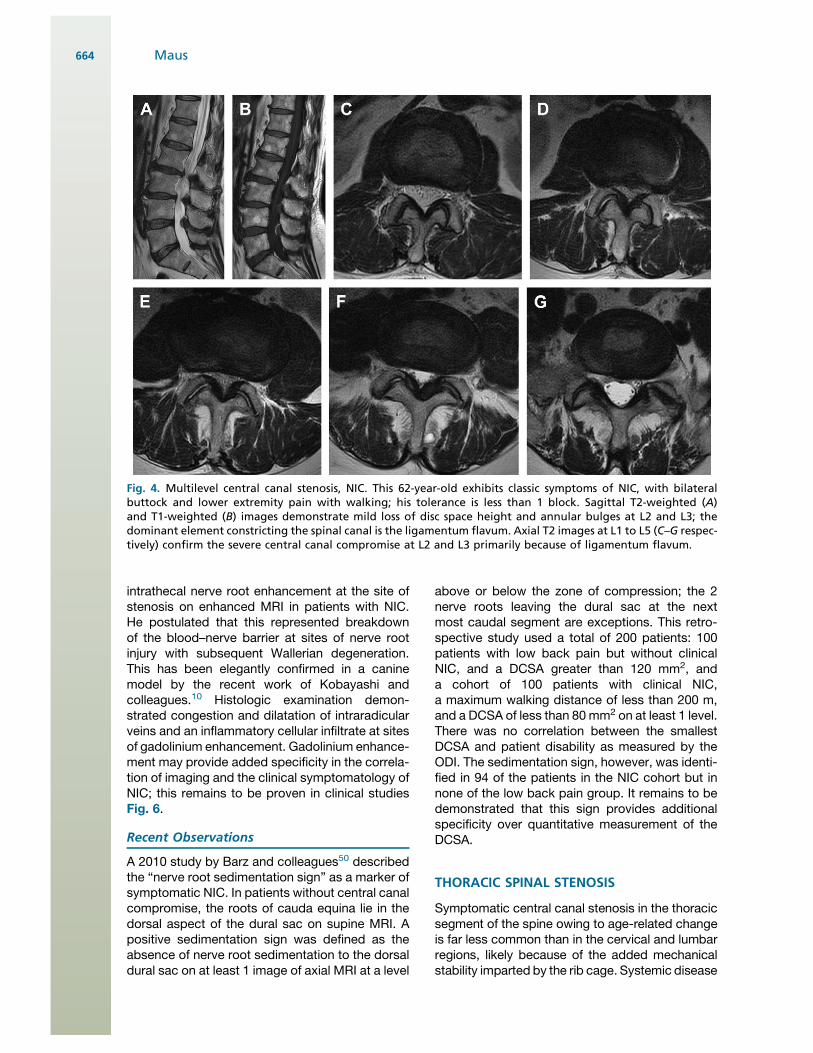
Fig. 4. Multilevel central canal stenosis, NIC. This 62-year-old exhibits classic symptoms of NIC, with bilateralbuttock and lower extremity pain with walking; his tolerance is less than 1 block. Sagittal T2-weighted (A)and T1-weighted (B) images demonstrate mild loss of disc space height and annular bulges at L2 and L3; thedominant element constricting the spinal canal is the ligamentum flavum. Axial T2 images at L1 to L5 (C–G respec-tively) confirm the severe central canal compromise at L2 and L3 primarily because of ligamentum flavum.
Maus664
accounts for a correspondingly greater proportionof cases. Systemic processes leading to thoraciccentral canal compromise include achondroplasia,osteochondrodystrophy, Scheuermannn disease,diffuse idiopathic skeletal hyperostosis (DISH),and Paget disease. Age-related causes and selectunique entities are addressed in the followingparagraphs.
Compromise of the thoracic spinal canal may bemanifest clinically as myelopathy, radiculopathy,or a mixed presentation. In a surgical series re-ported by Palumbo and colleagues,51 all patientsreported pain at presentation; half exhibited a clin-ical myelopathy. In another surgical series ofChang and associates,52 a myelopathy picturedominated in 86% (spastic paraparesis, hyperre-flexia, sensory level), whereas 14% exhibiteda mixed pattern (paraparesis, radicular pain, andnormal deep tendon reflexes). In this series, backpain was less frequent.
The segmental level of canal compromise ismost commonly reported to be in the lowerthoracic region. In the Palumbo and colleagues’series51 the stenotic zone was always in the lowerhalf of the thoracic spine; two-thirds bridged the
thoracolumbar junction, and most were multilevel.The larger series by Chang and colleagues52 had54% of cases with lesions in the T9 to T12 region,with 25% from T5 to T8, and the remainder in theupper thoracic region. Earlier surgical series alsodemonstrated stenotic segments exclusively inthe lower thoracic spine. Thoracic spine mobility,particularly flexion-extension motion, is greatestnear the thoracolumbar junction, likely the biome-chanical underpinning to this distribution of age-related pathology.
Posterior element age-related changes playa greater role in the genesis of thoracic centralcanal compromise. This takes the form primarilyof unilateral or bilateral facet joint hypertrophy.Thoracic disc herniations or disc-osteophytecomplexes may also contribute. Both the ventraland dorsal contributions to thoracic central canalcompromise are well seen on CT, CT/myelogra-phy, and MRI.
Ossification of the thoracic ligamentum flavum(OTLF), although rare in a white population, isa well-recognized cause of myelopathy or mixedmyelo-radiculopathy in an Asian population. Theprevalence of OTLF in an Asian population is
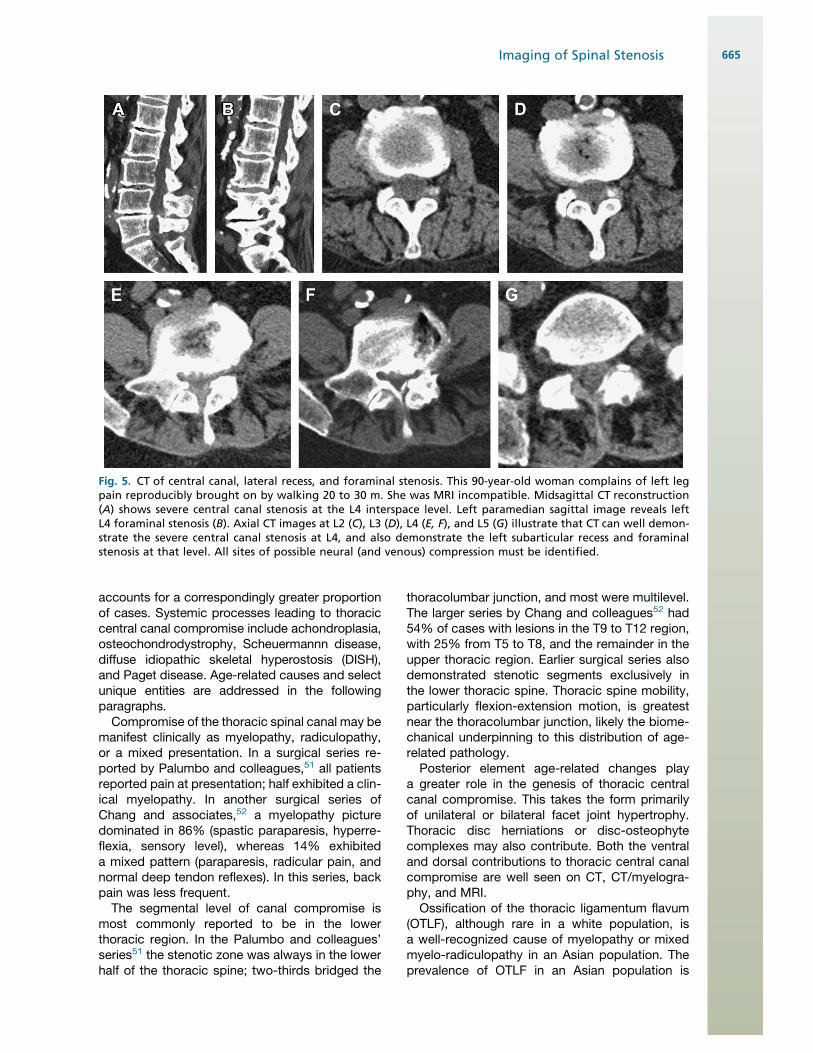
Fig. 5. CT of central canal, lateral recess, and foraminal stenosis. This 90-year-old woman complains of left legpain reproducibly brought on by walking 20 to 30 m. She was MRI incompatible. Midsagittal CT reconstruction(A) shows severe central canal stenosis at the L4 interspace level. Left paramedian sagittal image reveals leftL4 foraminal stenosis (B). Axial CT images at L2 (C), L3 (D), L4 (E, F), and L5 (G) illustrate that CT can well demon-strate the severe central canal stenosis at L4, and also demonstrate the left subarticular recess and foraminalstenosis at that level. All sites of possible neural (and venous) compression must be identified.
Imaging of Spinal Stenosis 665
estimated as 6.2% of men and 4.8% of women.53
The ossified, thickened ligamentum flavum isreadily demonstrated by either CT or MRI, and istypically seen in the lower third of the thoracicregion. Its pathogenesis is poorly understood. Itmay be associated with ossification of the poste-rior longitudinal ligament (OPLL), which is dis-cussed later in this article.Epidural lipomatosis is a rare cause of central
canal compromise in the thoracic or lumbar spine;it may be idiopathic or secondary to endogenousor exogenous steroid excess. Obesity is a commonfactor in both groups. Excess epidural fat acts asa mass compressing the dural sac, mostcommonly from a dorsal vector in the thoracicregion; it is more likely to be circumferential inthe lumbar region. A recent literature review by
Al- Khawaja and associates54 noted that thoracicinvolvement was more frequent in secondaryversus idiopathic cases; lumbar involvementdominated in idiopathic cases. Conservativetherapy with weight reduction (and removal ofany endocrine stimulus) was beneficial when noneurologic compromise was evident; in the faceof neurologic deficit, surgery was indicated.Surgical intervention was moderately successful(50%–60% full recovery) with the exception ofsecondary thoracic involvement, where surgicaloutcomes were much poorer (Fig. 7).
CERVICAL STENOSIS
Cervical spondylotic myelopathy (CSM) is themost common cause of spinal cord dysfunction
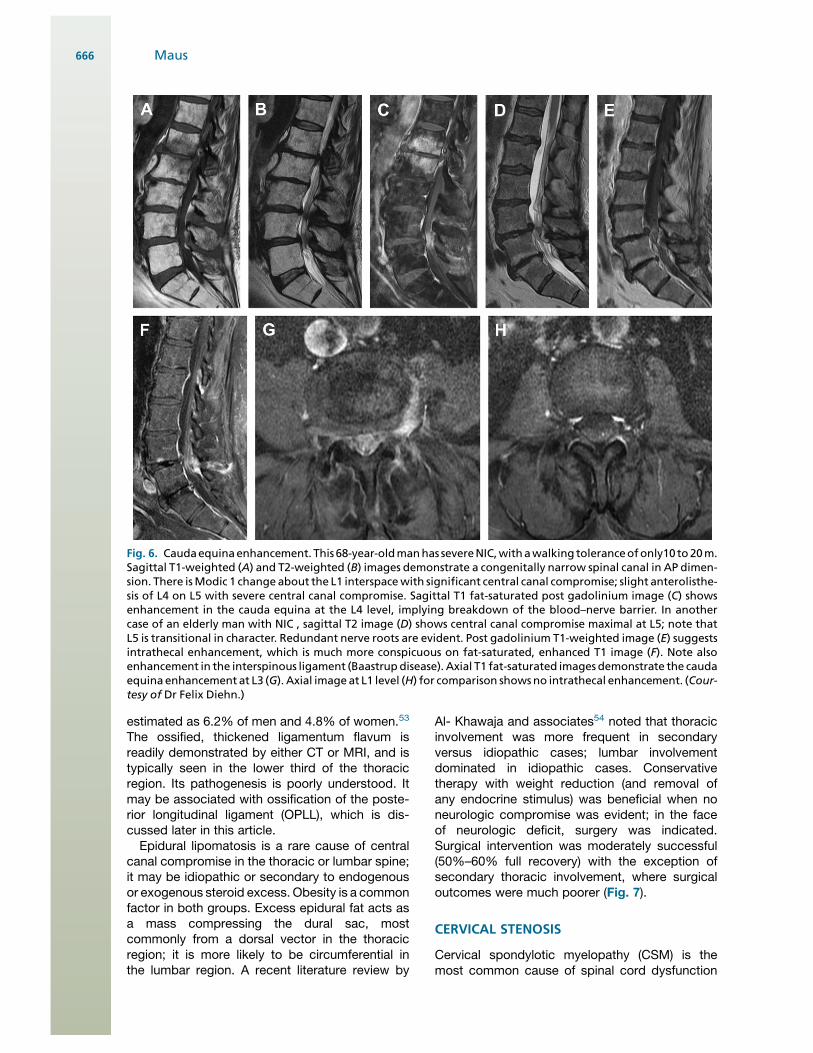
Fig. 6. Caudaequinaenhancement. This 68-year-oldmanhas severeNIC,withawalking toleranceofonly10 to20m.Sagittal T1-weighted (A) and T2-weighted (B) images demonstrate a congenitally narrow spinal canal in AP dimen-sion. There isModic 1 change about the L1 interspacewith significant central canal compromise; slight anterolisthe-sis of L4 on L5 with severe central canal compromise. Sagittal T1 fat-saturated post gadolinium image (C) showsenhancement in the cauda equina at the L4 level, implying breakdown of the blood–nerve barrier. In anothercase of an elderly man with NIC , sagittal T2 image (D) shows central canal compromise maximal at L5; note thatL5 is transitional in character. Redundant nerve roots are evident. Post gadolinium T1-weighted image (E) suggestsintrathecal enhancement, which is much more conspicuous on fat-saturated, enhanced T1 image (F). Note alsoenhancement in the interspinous ligament (Baastrupdisease). Axial T1 fat-saturated images demonstrate the caudaequina enhancement at L3 (G). Axial imageat L1 level (H) for comparison showsno intrathecal enhancement. (Cour-tesy of Dr Felix Diehn.)
Maus666
in patients older than 55 years.55 This sectionexamines the pathophysiology of CSM, the roleof imaging in the detection and characterizationof the underlying anatomic abnormality, and theuse of imaging in the selection of patients for ther-apeutic interventions, particularly surgical decom-pression. It is insufficient to simply describemorphologic alterations in cervical spondylosis;the imager must be familiar with the literature iden-tifying the clinical significance of imaging findings,guide the use of advanced imaging, and inform itsuse in patient selection for decompression. Theprognostic significance of MRI findings in CSMare discussed in depth. The critical points aresummarized in Box 2.
Stookey56 originally described CSM in 1928.Although its pathophysiology remains incom-pletely understood, it is widely acknowledged toinvolve static factors causing stenosis of thecervical canal and dynamic factors causing repet-itive cord injury.55 These mechanical factors bothdirectly injure neural tissue and initiate secondary
ischemia, inflammation, and apoptosis. The histo-logic characteristics of CSM include cystic cavita-tion and gliosis of the central gray matter anddemyelination of the medial portions of the whitematter long tracks. There is Wallerian degenera-tion in the posterior columns and posterolateraltracts cephalad to the site of compression. Lossof anterior horn cells and corticospinal tractdegeneration are seen at and caudal to the siteof compression.55 Imaging correlates are dis-cussed later in this section.
Pathogenesis: Static Factors
The developmentally narrow spinal canal is a moreuniversal substrate for CSM than is the case withNIC in the lumbar region. The sagittal diameter ofthe adult spinal cord is nearly constant, measuringabout 8 mm from C3 to C7; the cervical cordenlargement occurs primarily in the transverseplane.57 The normal cervical spinal canal sagittaldiameter (posterior vertebral body to spinolaminar
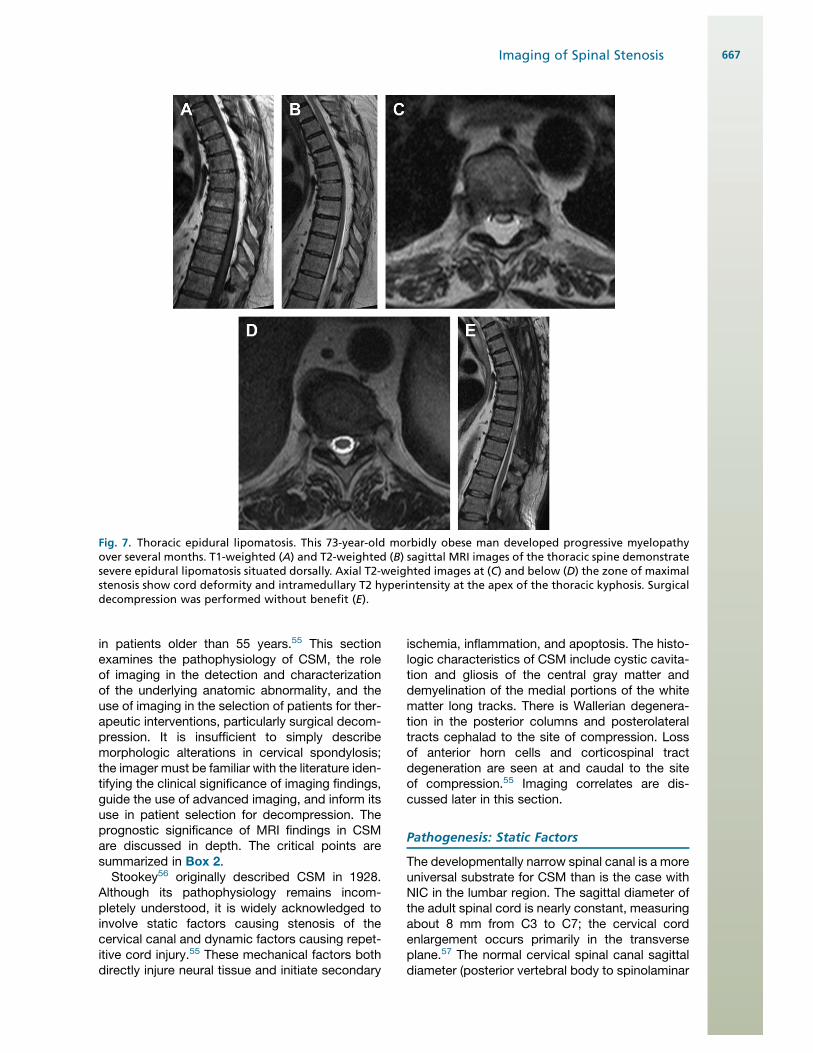
Fig. 7. Thoracic epidural lipomatosis. This 73-year-old morbidly obese man developed progressive myelopathyover several months. T1-weighted (A) and T2-weighted (B) sagittal MRI images of the thoracic spine demonstratesevere epidural lipomatosis situated dorsally. Axial T2-weighted images at (C) and below (D) the zone of maximalstenosis show cord deformity and intramedullary T2 hyperintensity at the apex of the thoracic kyphosis. Surgicaldecompression was performed without benefit (E).
Imaging of Spinal Stenosis 667
line) is 17 to 18 mm (C3–C7) in a white population;such subjects will rarely develop sufficient age-related change to provoke CSM. Edwards andLaRocca58 observed that patients with develop-mentally narrowed midcervical sagittal diameterssmaller than 10 mm were often myelopathic,patients with canals of 10 to 13 mm were at riskfor CSM, canals of 13 to 17 mm were seen inpatients with symptomatic spondylosis but rarelymyelopathy, and subjects with canals larger than17 mm were not prone to develop spondylosis.Morishita and colleagues57 recently examined
the kinematics of subjects with congenitallynarrow cervical canals, and noted significantdifferences when compared with normal canals.In congenitally narrowed canals, there is moresegmental mobility in the lower cervical segments,C4-5 to C6-7, and significantly greater disc age-related change in the lower cervical spine. Hence,the individual with a congenitally narrowed canal isat risk both because of the limited space availablefor the cord, and a greater propensity to age-related spondylotic change (Fig. 8).Acquired cervical central canal stenosis encom-
passes age-related spondylotic change (most
common), OPLL, and ossification of the ligamen-tum flavum (OLF). As in the lumbar region, age-related degradation of the matrix of the discnucleus transfers load to the annulus, resulting indisc-osteophyte complexes or protrusions en-croaching on the ventral canal. Increased loadingof the uncovertebral joints provokes hypertrophicchange, compromising the lateral recesses andproximal neural foramina. These anterior columnchanges excessively load the facet joints, withresultant hypertrophy. The ligamentum flavumloses elasticity and buckles centrally. Thiscascade of events circumferentially narrows thecanal and may directly compress the cord, exitingspinal nerves, and the anterior spinal artery. InMorio and colleagues’ surgical series,59 the mostcommon levels of compromise were C3-4 (27%),C4-5 (37%), and C5-6 (29%). This series includedpatients with spondylosis only and patients withOPLL.OPLL is a multifactorial disease, whose genetic
basis is a defect in the nucleotide pyrophospha-tase (NPPS) gene.55 The prevalence is 1.9% to4.3% of the Japanese population, and approxi-mately 3.0% in Korea and Taiwan. It is implicatedin up to 25% of the North American and Japanesecases of CSM.59 It has a significant association (upto 50%) with DISH, and is considered by somea subtype of DISH.60 It is progressive with age.OPLL imaging characteristics are discussed laterin this section.OLF is more common in the thoracic spine,
where it was previously described. It may alsoextend into the cervical spine; its prevalence inthe Japanese population older than 65 years isup to 20%.55
Pathogenesis: Dynamic Factors
In addition to static compression, dynamic forcescontribute to repetitive cord injury. Chen andcolleagues60 measured dynamic flexion-extension changes in cadavers; the flexion toextension motion increased disc bulging by10.8% of the canal diameter, and ligamentum fla-vum bucking by 24.3% of the canal diameter.Zhang and colleagues61 performed flexion andextension MRI studies on patients with CSM. Thecross-sectional area of the central canal wasgreater in the neutral position than in either flexionor extension; it was greater in flexion than exten-sion. There was functional cord impingement in12% of patients in flexion, 34% in the neutralposition, and 74% in extension. Muhle andcolleagues62 noted an increase in central canalstenosis in 48%of patientsmoving from the neutralto an extension position, with 20% exhibiting cord
Box 2Cervical spinal stenosis
The clinical syndrome of cervical spondyloticmyelopathy (CSM) very frequently occurs inthe setting of a congenitally narrowed spinalcanal.
Fixed stenosis, dynamic injury with motion, anda secondary cascade of ischemia, inflammation,and cell death cause the clinical syndrome ofCSM.
The specificity fault common to all spineimaging persists in the cervical region: patientsmeeting objective criteria of central canalstenosis may be asymptomatic.
Intramedullary T2 hyperintensity may reflecta spectrum of pathology, from reversible edemato demyelination and cystic necrosis; moreintense and well-defined T2 hyperintensitysuggests irreversible injury.
Intramedullary T1 hypointensity implies irre-versible necrotic change.
Intramedullary gadolinium enhancement isa negative prognostic finding in patients withCSM.
Diffusion tensor imaging is more sensitive thanT2 hyperintensity in the detection of early cordinjury; decreased fractional anisotropy values atthe site of compression are the most reliableparameter.
Maus668
compromise; the movement from neutral intoflexion increased central canal stenosis in 24%and cord compromise in 11%. Cervical neuralforamina diminish in cross-sectional area in exten-sion, and increase slightly in flexion.62
In addition to the mechanical trauma to the cordimparted by static compression or dynamiccompression and tension, secondary biochemicalprocesses, especially ischemia, contribute to thedevelopment of CSM.55 Ventral compression of thecordcompromises flow throughthearteriolesarisingfrom the anterior spinal artery in the ventral sulcus;dorsal compression reducesperfusion to the centralgray matter. Oligodendrocytes are extremelysensitive to ischemic injury; resultant apoptotic celldeath may cause the demyelination characteristi-cally seen in CSM. Recent animal evidence furthersupports the role of an inflammatory cascade and
Fas-mediated apoptosis in CSM.63 In an animalmodel, an antibody directed against the Fas-liganddiminished the inflammatory response andincreased neurologic recovery from compressiveinjury.63 Such medical management may becomea useful adjuvant to surgical decompression.
Imaging
Imaging of patients with CSM may include radio-graphs, CT, CT/myelography, and MRI. Imagingparameters, reliability, specificity challenges,correlation with clinical CSM, and imaging predic-tors of response to surgical decompression arediscussed.
Historically, radiographic assessment of cer-vical anatomic stenosis relied on the AP dimensionof the central canal as measured from the
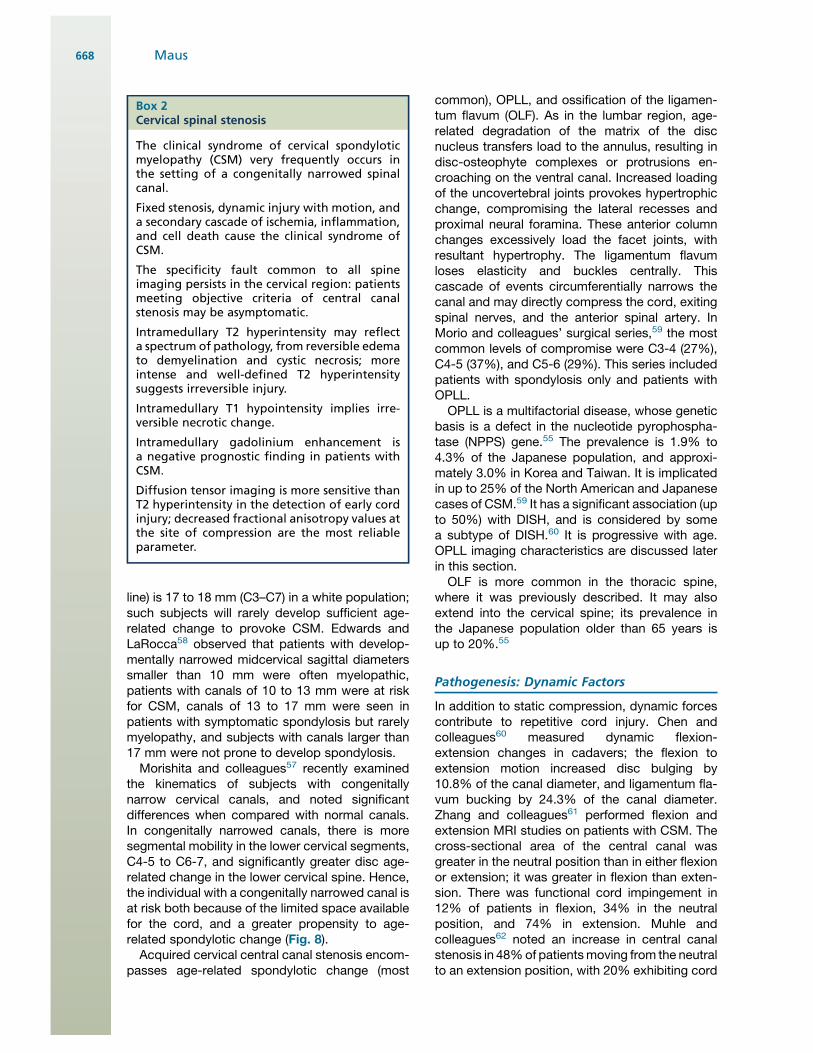
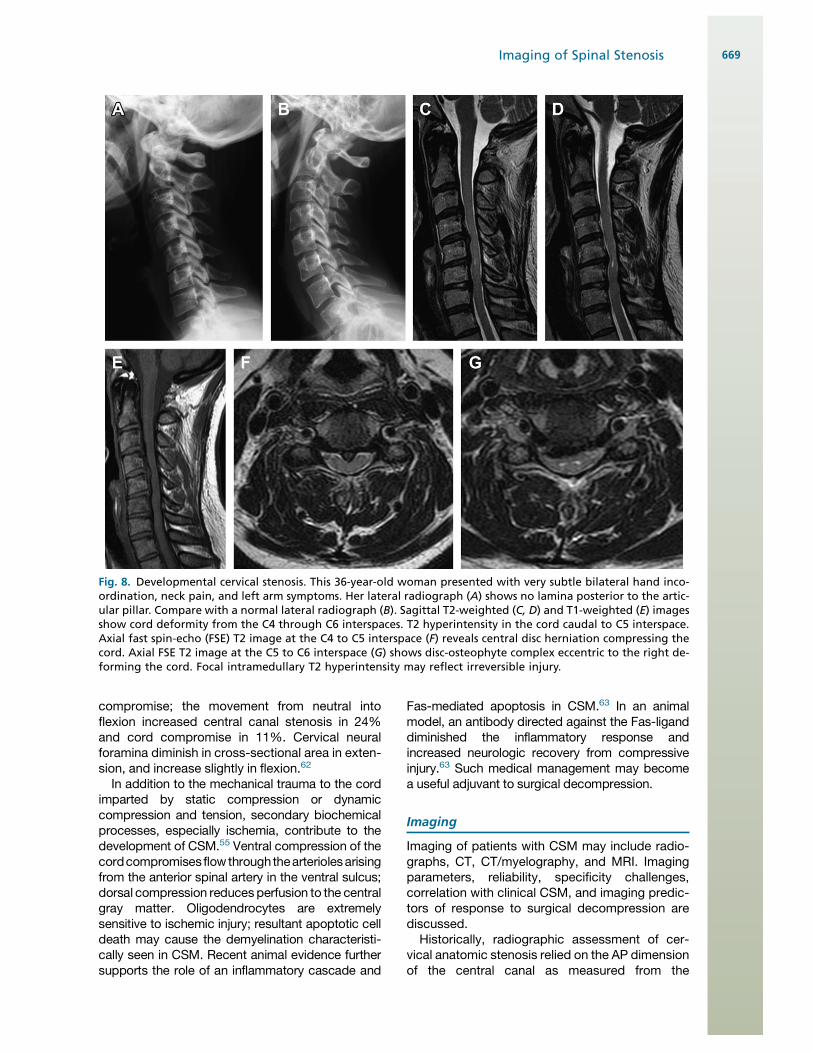
Fig. 8. Developmental cervical stenosis. This 36-year-old woman presented with very subtle bilateral hand inco-ordination, neck pain, and left arm symptoms. Her lateral radiograph (A) shows no lamina posterior to the artic-ular pillar. Compare with a normal lateral radiograph (B). Sagittal T2-weighted (C, D) and T1-weighted (E) imagesshow cord deformity from the C4 through C6 interspaces. T2 hyperintensity in the cord caudal to C5 interspace.Axial fast spin-echo (FSE) T2 image at the C4 to C5 interspace (F) reveals central disc herniation compressing thecord. Axial FSE T2 image at the C5 to C6 interspace (G) shows disc-osteophyte complex eccentric to the right de-forming the cord. Focal intramedullary T2 hyperintensity may reflect irreversible injury.
Imaging of Spinal Stenosis 669
posterior vertebral body to the spinolaminar line.As noted previously, the normal sagittal diameterfrom C3 through C7 is considered to be 17 to 18mm. Edwards and LaRocca58 noted that a cervicalcanal with a sagittal diameter smaller than 13 mmwas at risk for myelopathy; absolute stenosis wasdefined as being smaller than 10 mm. To compen-sate for magnification variables, Pavlov and Torg(Pavlov and colleagues64) promulgated the ratioof the sagittal diameter of the spinal canal to thesagittal diameter of themid-vertebral body; a valuegreater than 1was regarded as normal, and a valueless than 0.82 was considered absolute stenosis.More recent studies have shown a poor correlationbetween the Pavlov/Torg ratio and the space avail-able for the cord, suggesting its usefulness islimited.65
The advent of cross-sectional imaging has al-lowed us to directly measure the diameters andcross-sectional areas of the cervical spinal canaland the cervical cord. MRI has also given us theability to evaluate physiologic parameters: T2 hy-perintensity, T1hypointensity, gadoliniumenhance-ment, and, with diffusion tensor imaging (DTI),fractional anisotropy (FA) and apparent diffusioncoefficient (ADC).
ReliabilityA 2010 study by Naganawa and associates66
demonstrated good intraobserver and interob-server reliability in evaluation of the cross sectionsof the cervical canal and spinal cord with both CT/myelography and MRI. They noted that dural sacdiameter and cross-sectional area measurementswere slightly but significantly larger with CT/mye-lography than fast spin-echo T2-weighted MRI;conversely, the diameters and cross-sectionalareas of the spinal cord were slightly but signifi-cantly larger with MRI. These findings may reflecthalation by the myelographic contrast material,overestimating the CSF space. They also evalu-ated a semiquantitative 4-point rating scale of thedegree of stenosis; the interobserver kappa valueswere 0.69 for CT/myelography and 0.68 for MRI.MRI graded the stenosis as slightly, but signifi-cantly, more severe than CT/myelography, likelybecause of the halation effect. This study exam-ined fast spin-echo T2-weighted images; it couldbe anticipated that T2* (gradient echo) imagingwould have further accentuated this effect. Notethat the very good reliability figures in this studymay reflect the use of defined criteria and re-presentative images in training observers. Asimilar 2009 study by Song and associates67 foundno significant difference in interobserver orintraobserver reliability between CT/myelographyand MRI. With its superior spatial resolution,
CT/myelography was somewhat better in assess-ment of foraminal stenosis, and much better indiscriminating bony versus soft tissue lesions.MRI was more reliable in identifying direct nerveroot compression. An earlier (1999) study byShafaie and colleagues68 showed a poorer agree-ment between MRI and CT/myelography; giventhe interval evolution in technology, this is of ques-tionable relevance.
Imaging specificity: correlation withpathophysiology, clinical stateAs in the lumbar region, there is a basic specificityfault in all cervical imaging: subjective and quanti-tative evidence of central canal compromise maybe seen in asymptomatic subjects. The prevalenceof asymptomatic findings increases with age.Teresi and colleagues69 studied asymptomaticvolunteers 65 and older with MRI; 57% exhibitedcervical disc protrusions and 7% had frank cordcompression. Hayashi and colleagues70 noted10% of subjects older than 60 to demonstratesignificant stenosis in canal diameter (<13 mm)without signs or symptoms. Matsumoto and colle-ages,71 in a large study of 500 asymptomaticsubjects, observed direct cervical cord compres-sion in 8%.When a population of patients with a clinical
diagnosis of CSM is studied, the correlationsappear more favorable. The transverse area ofthe spinal cord as measured by MRI correlateswell with the severity of myelopathy and the path-ologic changes seen in the cord in CSM.72,73
The physiologic parameters of T2 hyperintensityor T1 hypointensity have provided further insightinto the evolution of CSM. Takahashi andcolleagues74 initially suggested that T2 hyperin-tensity within the cord represents the myelomala-cia or gliosis seen pathologically in patients withCSM. Ramanauskas and colleagues75 consideredthat early in the process of myelomalacia evolu-tion, T2 hyperintensity may reflect edema; thismay progress to cystic necrosis of the centralgray matter, which will ultimately manifest itselfas T1 hypointensity and T2 hyperintensity.Al-Mefty and associates76 considered T2 hyperin-tensity to represent myelomalacia, with T2 hyper-intensity accompanied by T1 hypointensity toreflect cystic necrosis or syrinx formation. Directcorrelation with histology in a canine model byAl-Mefty and associates76 showed motor neuronloss, necrosis, and cavitation in areas of cordsignal abnormality. Correlation with humanautopsy findings led Ohshiro and colleagues77 toconclude that T2 hyperintensity alone representsedema, gliosis, and minimal gray matter cell loss,whereas T1 hypointensity heralds necrosis,
Maus670
myelomalacia, and spongiform change. Theobservation that T2 hyperintensity may resolveled Taneichi and colleagues78 to ascribe it toreversible edema, whereas stable T2 hyperinten-sity reflects gliosis (Fig. 9).
From these studies, and additional outcomesstudies detailed in the following paragraphs, wecan conclude that
1. Intramedullary T2 hyperintensity representsa range of reversible (edema) and irreversible(demyelination,gliosis, cystic necrosis) pathology
2. Faint and indistinct T2 hyperintensity is morelikely to reflect reversible edema
3. Very intense and well-defined T2 hyperintensitymore likely represents fixed gliosis or cysticnecrotic change
4. Intramedullary T1 hypointensity represents irre-versible necrosis and myelomalacia.
A 2010 study by Ozawa and colleagues79 anda 2011 study by Cho and colleagues80 comparedpatients with CSM who exhibited gadoliniumenhancement with a nonenhancing control group.
The zone of enhancement was always within andsmaller than a zone of T2 hyperintensity at thesite of maximal compression, with extensioncaudally; it was typically seen in the posterior orposterolateral cord. There was no correlation ofenhancement with preoperative clinical symp-toms. Enhancement disappeared in most patientswithin 1 year of surgical decompression; patientswho exhibited preoperative enhancement hada poorer postoperative prognosis than those whodid not (Fig. 10).
Floeth and colleagues81 studied 20 patientswith CSM using 18F-fluorodeoxyglucose (18F-FDG) positron emission tomography (PET) in thesetting of a single-level stenosis at C3-4 or C4-5.All the patients with CSM showed a significantdecrease in 18F-FDG uptake in the lower cordbelow the stenosis, relative to healthy controls.A cohort of these patients also exhibitedincreased uptake at the level of the stenosis. Thepatients with increased 18F-FDG uptake at thestenosis had a significantly shorter duration ofsymptoms, a more precipitous decline in function
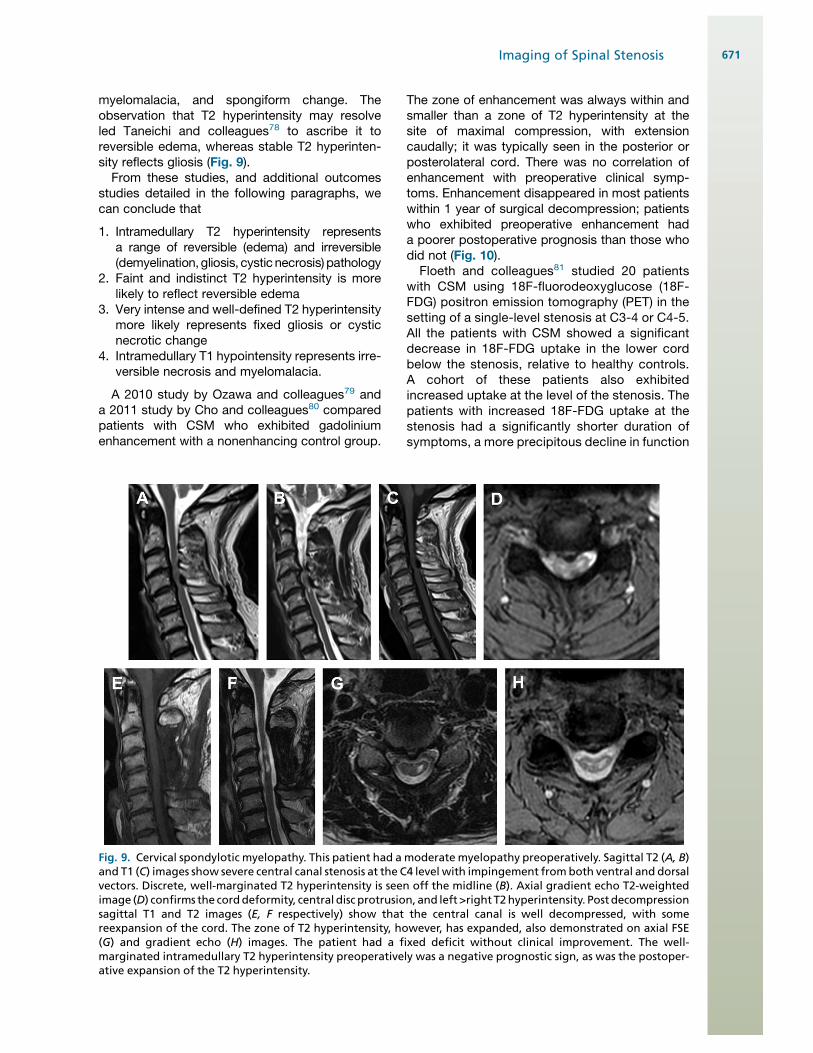
Fig. 9. Cervical spondylotic myelopathy. This patient had a moderate myelopathy preoperatively. Sagittal T2 (A, B)and T1 (C) images show severe central canal stenosis at the C4 level with impingement fromboth ventral and dorsalvectors. Discrete, well-marginated T2 hyperintensity is seen off the midline (B). Axial gradient echo T2-weightedimage (D) confirms the corddeformity, central disc protrusion, and left >right T2hyperintensity. Postdecompressionsagittal T1 and T2 images (E, F respectively) show that the central canal is well decompressed, with somereexpansion of the cord. The zone of T2 hyperintensity, however, has expanded, also demonstrated on axial FSE(G) and gradient echo (H) images. The patient had a fixed deficit without clinical improvement. The well-marginated intramedullary T2 hyperintensity preoperatively was a negative prognostic sign, as was the postoper-ative expansion of the T2 hyperintensity.
Imaging of Spinal Stenosis 671
in the 3 months before decompression, and ulti-mately exhibited significant improvement afterdecompression. Patientswithout increased uptakeat the stenotic zone did not recover neurologicfunction after decompression. Animal experimentshave shown increased immunoreactivity (postu-lated to cause increased metabolic activity) inneurons and glial cells in the early stages of cordcompression; chronic compression leads to cellloss, atrophy, and diminished metabolic activity.81
Imaging correlates: diffusion tensor imagingEarly reports suggest DTI may offer greater accu-racy in identification of symptomatic cord compro-mise than T2 hyperintensity or T1 hypointensity.The measured parameters are FA, mean diffusivity(MD), or ADC. The ADC or MD values reflect over-all diffusivity in the tissue irrespective of directionaldependence. Anisotropy (directional dependence)of diffusion in white matter tracts results from line-arly oriented membrane structures (ie, axons andmyelin). Diminished FA values may reflect loss ofdirectionally oriented membrane structures,increased extracellular edema, or both. Animalstudies have demonstrated that diminished FAvalues are seen in mechanical disruption, tearingof fibers and myelin sheaths, Wallerian degenera-tion, and demyelination.82 Kara and colleagues83
speculate that decreased FA values in the spinalcord devoid of T2 signal abnormality representearly demyelination owing to oligodendrocyteischemia and subsequent apoptosis. Direct histo-logic confirmation of this attractive hypothesis isnot yet available.Several recent studies have addressed DTI in
patients with CSM. Kara and colleagues83
examined 16 patients with a clinical diagnosis ofCSM but no T2 hyperintensity within the cord. Allof the patients showed a statistically significantreduction in FA values and an increase in ADCvalues at the site of maximum stenosis, promptingthe hypothesis that low FA reflects early demyelin-ation. Facon and colleagues82 studied DTI param-eters in 15 patients with cervical or thoracic cordcompressive lesions, both spondylotic and meta-static. FA values in the compressed cord werereduced compared with healthy controls in 10patients; ADC values were significantly increasedin only 2 patients. Seven patients showed T2 hy-perintensity in the cord. One patient with an acuteclinical onset of myelopathy had an increased FAvalue. Facon and colleagues82 suggest this maybe because of acutely restricted diffusivity; allother compressive processes have showndecreased FA.Budzik and colleagues84 studied 20 patients
with symptomatic CSM and 15 volunteers. FAvalues were significantly lower at the compressedlevels in patients than at comparable uncom-pressed levels in volunteers. There was a signifi-cant correlation between clinical state asmeasured by validated functional scores and theFA values. There was no such correlation betweenclinical state and the T2 hyperintensity; T2 hyperin-tensity did not correlate with FA or MD values.Patients who exhibited T1 hypointensity in thecord showed very low FA values.Finally, Kerkovsky and colleagues85 studied 52
patients with CSM and 13 volunteers using DTI.They demonstrated good interobserver reproduc-ibility in DTI values. The patients all exhibited cordcompression, but were stratified into those
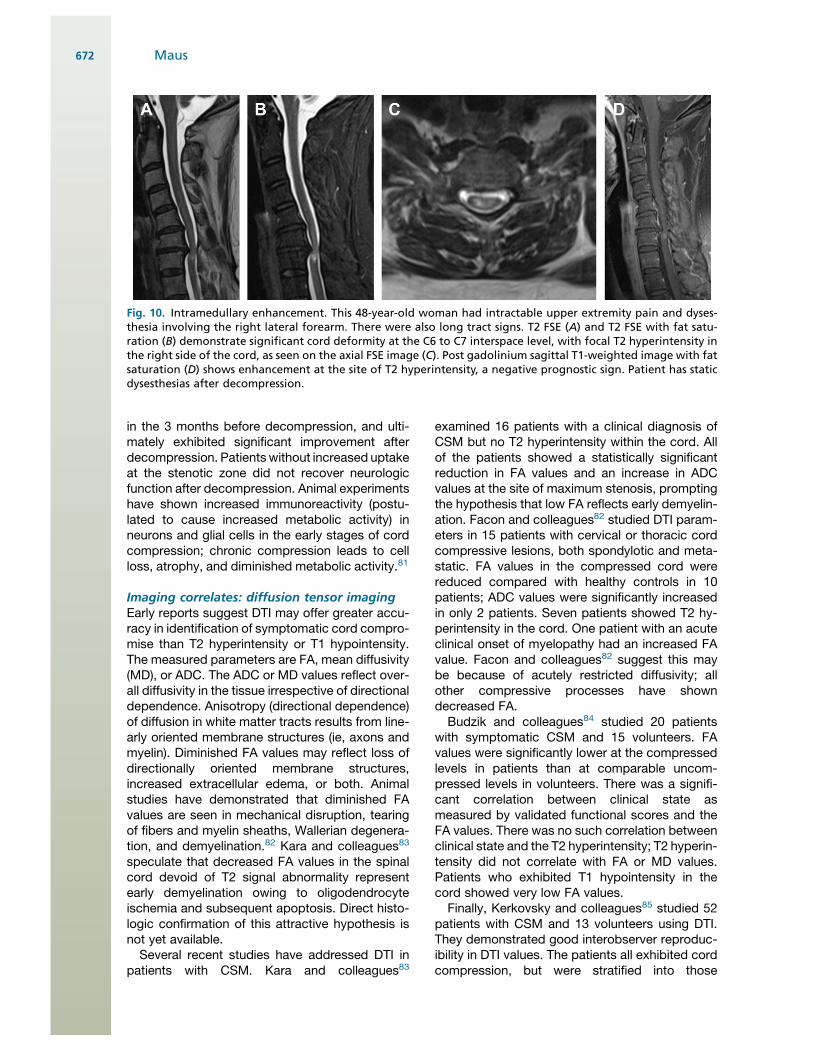
Fig. 10. Intramedullary enhancement. This 48-year-old woman had intractable upper extremity pain and dyses-thesia involving the right lateral forearm. There were also long tract signs. T2 FSE (A) and T2 FSE with fat satu-ration (B) demonstrate significant cord deformity at the C6 to C7 interspace level, with focal T2 hyperintensity inthe right side of the cord, as seen on the axial FSE image (C). Post gadolinium sagittal T1-weighted image with fatsaturation (D) shows enhancement at the site of T2 hyperintensity, a negative prognostic sign. Patient has staticdysesthesias after decompression.
Maus672
exhibiting signs and symptoms of CSM and thosewith nonspecific neck pain. The morphologicparameters of AP dimension of the central canalor cross-sectional area of the spinal canal didnot discriminate between symptomatic andasymptomatic patients. The FA values were signif-icantly reduced and ADC values elevated at thesite of maximal compression in the symptomaticpatients with CSM compared with the patientswith cord compression but no symptoms. The FAand ADC values also discriminated between the2 patient subgroups versus healthy controls.
DTI holds significant promise in identifyingpatients early in the course of CSM who are at riskfor progression. Currently available evidencesuggests diminished FA is more sensitive in thedetection of cord injury than T2 hyperintensity andis better correlated with symptoms. This may assistin selection of patients for surgical decompression,although additional work remains to be done.
Imaging: prognosis, selection of patients fordecompressionThe ultimate goal of imaging must be to improvethe clinical outcomes of patients. In the CSM pop-ulation, this currently implies timely and appro-priate selection of patents for therapeuticinterventions, primarily surgical decompression.There is a large body of literature that has exam-ined the role of imaging in predicting clinicalresponse to surgical decompression; this literatureis reviewed, hopefully adding clarity to a sometimesconfusing mass of work. The imaging parametersunder consideration include the cross- sectionalarea of the cord, intramedullary T2 hyperintensity,including its degree of intensity and multifocality,intramedullary T1 hypointensity, change or stabilityof intramedullary signal after decompression,recovery of cord cross-sectional area after decom-pression, and intramedullary gadolinium enhance-ment. The correlates are summarized in Box 3.
There is a consensus that there is a negativecorrelation in surgical prognosis with cross-sectional area of the cord at the site of compres-sion; patients with greater degrees of cordcompression do less well.72,86,87
There is reasonable consensus that symptom-atic patients with CSMwho have no intramedullarysignal change have a better prognosis for surgicaldecompression than those who exhibit T2 hyperin-tensity.74,75,80,86,88,89 There are contradictorystudies in which focal T2 hyperintensity did notgreatly affect prognosis.87,90,91 The studies ofShin and colleagues,92 Zhang and colleagues,61
Yasutsugu and colleagues,93 and Mastronardiand colleagues86 all semiquantitatively scoredthe intensity of T2 signal elevation on 3-point or
4-point scales; patients with intense T2 signalabnormality had the longest duration of diseaseand the poorest objective recovery rates. Moreintense and well-defined intramedullary T2 signallikely reflects fixed cavitary disease as opposedto reversible edema. The study of Avadhani andcolleagues94 also used a 3-point evaluation of T2intensity, but did not see a difference in recoveryrates. The systematic review of patient selectionby Mummaneni and colleagues 95 noted there isalso evidence that multilevel intramedullary T2 hy-perintensity predicts a poorer outcome fromsurgical decompression than single-level T2hyperintensity.
There is a strong consensus that intramedul-lary T1 hypointensity is a very poor prognosticsign for recovery following cervical decompres-sion.59,76,86,90,91,94–96 The diminished T1 signalrepresents cavitary change or necrotic tissue.Patients exhibiting intramedullary T1 hypointen-sity recovered less well than patients with T2 hy-perintensity alone, and much less well thanpatients without intramedullary signal abnormality.As noted previously, intramedullary gadoliniumenhancement is a negative prognostic sign forpostoperative recovery.79,80
Box 3CSM prognostic factors for surgicaldecompression
1. Intramedullary T2 hyperintensity diminishesprognosis relative to normal signal.
a. Intense, focal T2 hyperintensity is a morenegative prognostic sign than ill-definedhyperintensity.
b. Multilevel T2 hyperintensity is a morenegative prognostic sign than single-level change.
c. Resolution of T2 hyperintensity postoper-atively improves prognosis.
d. Expansion of T2 hyperintensity postoper-atively diminishes prognosis.
2. Intramedullary T1 hypointensity greatlydiminishes prognosis.
a. Evolution of T1 hypointensity postopera-tively diminishes prognosis.
3. Intramedullary gadolinium enhancementgreatly diminishes prognosis.
4. Increased metabolic activity at the site ofcompression on 18F-FDG PET improves prog-nosis over no increased activity.
5. Postoperative residual compression andfailure of reexpansion of the cord crosssection are negative prognostic signs.
Imaging of Spinal Stenosis 673
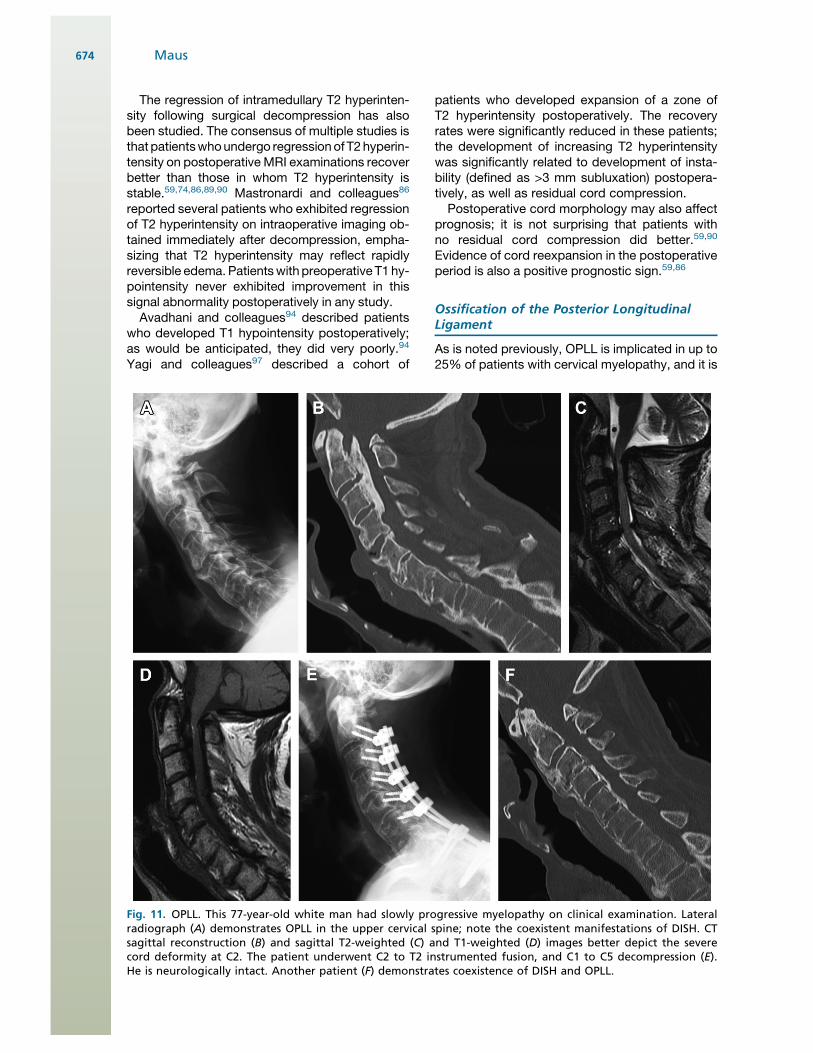
The regression of intramedullary T2 hyperinten-sity following surgical decompression has alsobeen studied. The consensus of multiple studies isthat patientswhoundergo regressionof T2hyperin-tensity on postoperative MRI examinations recoverbetter than those in whom T2 hyperintensity isstable.59,74,86,89,90 Mastronardi and colleagues86
reported several patients who exhibited regressionof T2 hyperintensity on intraoperative imaging ob-tained immediately after decompression, empha-sizing that T2 hyperintensity may reflect rapidlyreversible edema. Patientswith preoperative T1 hy-pointensity never exhibited improvement in thissignal abnormality postoperatively in any study.Avadhani and colleagues94 described patients
who developed T1 hypointensity postoperatively;as would be anticipated, they did very poorly.94
Yagi and colleagues97 described a cohort of
patients who developed expansion of a zone ofT2 hyperintensity postoperatively. The recoveryrates were significantly reduced in these patients;the development of increasing T2 hyperintensitywas significantly related to development of insta-bility (defined as >3 mm subluxation) postopera-tively, as well as residual cord compression.Postoperative cord morphology may also affect
prognosis; it is not surprising that patients withno residual cord compression did better.59,90
Evidence of cord reexpansion in the postoperativeperiod is also a positive prognostic sign.59,86
Ossification of the Posterior LongitudinalLigament
As is noted previously, OPLL is implicated in up to25% of patients with cervical myelopathy, and it is
Fig. 11. OPLL. This 77-year-old white man had slowly progressive myelopathy on clinical examination. Lateralradiograph (A) demonstrates OPLL in the upper cervical spine; note the coexistent manifestations of DISH. CTsagittal reconstruction (B) and sagittal T2-weighted (C) and T1-weighted (D) images better depict the severecord deformity at C2. The patient underwent C2 to T2 instrumented fusion, and C1 to C5 decompression (E).He is neurologically intact. Another patient (F) demonstrates coexistence of DISH and OPLL.
Maus674
typically grouped with age-related changes intothe CSM population. Most of the previously refer-enced studies describing the pathophysiologiccorrelates of imaging and prognostic signs fordecompression include large proportions ofpatients with OPLL. Like age-related causes ofstructural central canal narrowing, it is oftenasymptomatic. The ossification is most commonin the cervical region, where it causes static nar-rowing of the canal; repeated impact of the ventralcord on the bony mass also contributes to myelo-pathic injury. Patients may present in their 40s and50s with pain, chronic myelopathy, or acute neuro-logic injury after modest trauma. The naturalhistory of the ossification is progression.96 Fromthis flows the recommendation for surveillanceimaging and close clinical follow-up (Fig. 11).
The ligamentous ossification may be identified onradiographs, CT, and MRI. On lateral radiographs,reduction of the sagittal canal diameter availablefor the cord by more than 60% correlates stronglywith myelopathy.98 The ossification is located fromC2 to C4 in 70% of cases, T1 to T4 in 15%, and L1to L3 in 15%.98 On CT, the ossification may be clas-sifiedassegmental (posterior to individual vertebrae:39%), continuous (bridging across vertebrae: 27%),mixed type (29%), and other (ossification posteriorto discs, variable sagittal extension: 5%).98 It mayalso be classified as central or laterally deviated.Matsunaga and colleagues99 noted that clinicalmyelopathy was more frequent in the laterally devi-ated type. They also observed that myelopathywas more frequent when the range of flexion-extension motion was greater, emphasizing theimportance of dynamic trauma to the cord.
CT imaging is also critical to identify characteris-tics that suggest penetration of the dura. CSFleaks are a significant risk in anterior decompres-sion surgery, particularly when the dura is ossi-fied/inseparable from the bony ligamentousmass. Hida and colleagues100 described thesingle-layer and double-layer signs. A double-layer sign describes ossification continuous withthe dorsal vertebral body, an intervening layer ofhypodense hypertrophied PLL, and anothercentral ossified layer. The single-layer sign impliesa single homogeneous ossified mass. The double-layer sign is strongly associated with no identifi-able dural plane at surgery and significant risk ofpostoperative CSF leak. Epstein101 noted thata large laterally deviated single-layer mass thathooked in a “C” configuration was also seen inassociation with local dural penetration.
On MRI, mature ligamentous ossification is ofdiminished signal intensity on all sequences; earlyOPLL may have inhomogeneous signal and exhibitslight enhancement.98 When mature, there is no
enhancement, allowing differentiation from epi-dural fibrosis. The secondary signal alterations inthe cord are described previously.
SUMMARY
This article has reviewed pertinent pathophysi-ology, imaging findings, and the predictive valueof imaging when evaluating patients with the clin-ical syndromes of NIC and CSM. Key points aresummarized in the boxed comments. It shouldbe apparent that several of the themes of thisvolume are carried through: (1) imaging has signif-icant specificity and sensitivity faults; (2) theimager must understand the clinical state toprovide useful information to the referring physi-cian; and (3) imaging parameters that are basedin physiology will be more valuable than a purelymorphologic evaluation of spinal structures.
REFERENCES
1. Boden SD, Davis DO, Dina TS, et al. Abnormal
magnetic-resonance scans of the lumbar spine in
asymptomatic subjects. A prospective investiga-
tion. J Bone Joint Surg Am 1990;72(3):403–8.
2. North American Spine Society. Evidence-based
clinical guidelines for multidisciplinary spine care,
diagnosis and treatment of degenerative lumbar
spinal stenosis. Burr Ridge (IL): North American
Spine Society; 2011.
3. Amundsen T, Weber H, Lilleas F, et al. Lumbar
spinal stenosis. Clinical and radiologic features.
Spine 1995;20(10):1178–86.
4. Deyo RA. Treatment of lumbar spinal stenosis:
a balancing act. Spine J 2010;19(7):625–7.
5. Johnsson KE, Sass M. Cauda equina syndrome in
lumbar spinal stenosis: case report and incidence
in Jutland, Denmark. J Spinal Disord Tech 2004;
17:334–5.
6. Kalichman L, Cole R, Kim D, et al. Spinal stenosis
prevalence and association with symptoms: the
Framingham Study. Spine J 2009;9(7):545–50.
7. Verbiest H. A radicular symptom from develop-
mental narrowing of the lumbar vertebral canal.
J Bone Joint Surg Br 1954;36:230–7.
8. Takahashi K, Olmarker K, Porter RW, et al. Double
level cauda equina compression: an experimental
study with continuous monitoring of intraneural
blood flow in the porcine cauda equina. J Orthop
Res 1993;11:104–9.
9. Olmarker K, Rydevik B. Single-level versus double-
level nerve root compression: an experimental
study on the porcine cauda equina with analysis
of nerve impulse conduction properties. Clin Or-
thop 1992;(279):35–9.
Imaging of Spinal Stenosis 675
10. Kobayashi S, Uchida K, Takeno K, et al. Imaging of
cauda equina edema in lumbar canal stenosis by
using gadolinium-enhanced MR imaging experi-
mental constriction injury. AJNR Am J Neuroradiol
2006;27:346–53.
11. Sato K, Kikuchi S. Clinical analysis of two-level
compression of the cauda equina and the nerve
roots in lumbar spinal canal stenosis. Spine 1997;
16:1898–904.
12. Porter RW, Ward D. Cauda equina dysfunction: the
significance of two-level pathology. Spine 1992;17:
9–15.
13. Morishita Y, Hida S, Naito ME, et al. Measurement
of the local pressure of intervertebral foramen
and the electrophysiological values of the spinal
nerve roots in the vertebral foramen. Spine 2006;
31:3076–80.
14. Morishita Y, Hida S, Naito M, et al. Neurogenic
intermittent claudication in lumbar spinal canal
stenosis. The clinical relationships between the
local pressure of the intervertebral foramen and
the clinical findings in lumbar spinal canal stenosis.
J Spinal Disord Tech 2009;22:130–4.
15. Szpalski M, Gunzburg R. Lumbar spinal stenosis in
the elderly: an overview. Eur Spine J 2003;12(2):
S170–5.
16. Singh K, Samartzis D, Vaccaro AR, et al. Congenital
lumbar spinal stenosis: a prospective control-
matched, cohort radiographic analysis. Spine J
2005;5:615–22.
17. Papp T, Porter R, Craig C, et al. Significant ante-
natal factors in the development of lumbar spinal
stenosis. Spine 1997;22(16):1805–10.
18. Schonstron NR, Hansson GH. Thickness of the
lumbar ligamentum flavum as a function of load:
an in vitro experimental study. Clin Biomech 1991;
6:19–24.
19. Chokshi FH, Quencer RM, Smoker WR. The “thick-
ened” ligamentum flavum: is it buckling or enlarge-
ment? AJNRAm JNeuroradiol 2010;31(10):1813–6.
20. Siebert E, Pruss H, Klingebiel R, et al. Lumbar
spinal stenosis: syndrome, diagnostics and treat-
ments. Nat Rev Neurol 2009;5:392–403.
21. Steurer J, Roner S, Gnannt R, et al. Quantitative
radiologic criteria for the diagnosis of lumbar spinal
stenosis: a symptomatic literature review. BMC
Musculoskelet Disord 2011;12:175.
22. Genevay S, Atlas SJ, Katz JN. Variation in eligibility
criteria from studies of radiculopathy due to a herni-
ated disc and of neurogenic claudication due to
lumbar spinal stenosis: a structured literature
review. Spine (Phila PA 1976) 2010;35(7):803–11.
23. Speciale AC, Pietrobon R, Urban CT, et al.
Observer variability in assessing lumbar spinal
stenosis severity on magnetic resonance imaging
and its relation to cross-sectional spinal canal
area. Spine 2002;27(10):1082–6.
24. Fardon DF, Milette PC. Nomenclature and classifi-
cations of lumbar disc pathology. Recommenda-
tions of the Combined Task Forces of the North
American Spine Society, American Society of Spine
Radiology, and American Society of Neuroradi-
ology. Spine (Phila Pa 1976) 2001;26(5):E93–113.
25. Min JH, Jang JS, Lee SH. Clinical significance of
redundant nerve roots of the cauda equina in
lumbar spinal stenosis. Clin Neurol Neurosurg
2008;110(1):14–8.
26. McNab I. Spondylolisthesis with an intact neural
arch: the so-called pseudo-spondylolisthesis.
J Bone Joint Surg Br 1950;32:325–33.
27. Kauppila LI, Eustace S, Kiel D, et al. Degenerative
displacement of lumbar vertebrae: a 25-year follow-
up study in Framingham. Spine 1998;23:1868–73.
28. Lurie JD, Tosteson AN, Tosteson TD, et al. Reli-
ability of readings of magnetic resonance imaging
features of lumbar spinal stenosis. Spine (Phila Pa
1976) 2008;33(14):1605–10.
29. Jarvik JJ, Hollingworth W, Heagerty P, et al. The
longitudinal assessment of imaging and disability
of the back (LAIDBack) study: baseline data. Spine
(Phila PA 1976) 2001;26(10):1158–66.
30. Hamanishi C, Matukura N, Fujita M, et al. Cross-
sectional area of the stenotic lumbar dural tube
measured from the transverse views of magnetic
resonance imaging. J Spinal Disord 1994;7(5):
388–93.
31. Bolender NF, Schonstrom NG, Spengler DM. Role
of computed tomography and myelography in the
diagnosis of central spinal stenosis. J Bone Joint
Surg Am 1985;67(2):240–6.
32. Schonstrom N, Hansson T. Pressure changes
following constriction of the cauda equina. An
experimental study in site. Spine (Phila Pa 1976)
1988;13(4):385–8.
33. Haig AJ, Geisser ME, Tong HC, et al. Electromyo-
graphic and magnetic resonance imaging to
predict lumbar spinal stenosis, low back pain,
and no back symptoms. J Bone Joint Surg 2007;
89:358–66.
34. Sirvanci M, Bhatia M, Ganiyusufoglu KA, et al.
Degenerative lumbar spinal stenosis: correlation
with Oswestry disability index and MR imaging.
Eur Spine J 2008;17(5):679–85.
35. Yasar B, Sims‚ek S, Er U, et al. Functional and clin-
ical evaluation for the surgical treatment of degen-
erative stenosis of the lumbar spinal canal.
J Neurosurg Spine 2009;11(3):347–52.
36. Geisser ME, Haig AJ, Tong HC, et al. Spinal canal
size and clinical symptoms among persons diag-
nosed with lumbar spinal stenosis. Clin J Pain
2007;23:780–5.
37. Zeifang F, Schiltenwolf M, Abel R, et al. Gait anal-
ysis does not correlate with clinical and MR
imaging parameters in patients with symptomatic
Maus676
lumbar spinal stenosis. BMC Musculoskelet Disord
2008;9:89.
38. Schmid MR, Stucki G, Duewell S, et al. Changes in
cross-sectional measurements of the spinal canal
and intervertebral foramina as a function of body posi-
tion: in vivo studies on an open-configuration MR
system.AJRAmJRoentgenol1999;172(4):1095–102.
39. Danielson B, Willen J. Axially loaded magnetic
resonance image of the lumbar spine in asymptom-
atic individuals. Spine (Phila Pa 1976) 2001;26(23):
2601–6.
40. Willen J, Danielson B. The diagnostic effect from
axial loading of the lumbar spine during computed
tomography and magnetic resonance imaging in
patients with degenerative disorders. Spine 2001;
26(23):2607–14.
41. Willen J, Wessberg PJ, Danielson B. Surgical
results in hidden lumbar spinal stenosis detected
by axial loaded computed tomography and
magnetic resonance imaging: an outcome study.
Spine 2008;33(4):E109–15.
42. Hansson T, Suzuki N, Hebelka H. The narrowing of
the lumbar spinal canal during loaded MRI: the
effects of the disc and ligamentum flavum. Eur
Spine J 2009;18:679–86.
43. Madsen R, Jensen TS, Pope M, et al. The effect of
body position and axial load on spinal canal
morphology: an MRI study of central spinal
stenosis. Spine (Phila Pa 1976) 2008;33(1):617.
44. Feng W, Wang J, Zou J, et al. Effect of lumbar
angular motion on central canal diameter: posi-
tional MRI study in 491 cases. Chin Med J 2010;
123(11):1422–5.
45. Kent DL, Haynor DR, Larson EB, et al. Diagnosis of
lumbar spinal stenosis in adults: a metaanalysis of
the accuracy of CT, MR, and myelography. AJR Am
J Roentgenol 1992;158(5):1135–44.
46. Bischoff RJ, RodriquezRP,GuptaK, et al. A compar-
ison of computed tomography-myelography, mag-
netic resonance imaging, and myelography in the
diagnosis of herniated nucleus pulposus and spinal
stenosis. J Spinal Disord 1993;6(44):289–95.
47. Modic MT, Masaryk T, Boumphrey F, et al. Lumbar
herniated disk disease and canal stenosis:
prospective evaluation by surface coil MR, CT,
and myelography. AJR Am J Roentgenol 1986;
147(4):757–65.
48. Schnebel B, Kingston S, Watkins R, et al. Compar-
ison of MRI to contrast CT in the diagnosis of spinal
stenosis. Spine 1989;14(3):332–7.
49. Jinkins R. Gd-DTPA enhanced MR of the lumbar
spinal canal in patients with claudication.
J Comput Assist Tomogr 1993;17:555–62.
50. Barz T, Melloh M, Staub LP, et al. Nerve root sedi-
mentation sign: evaluation of a new radiological
sign in lumbar spinal stenosis. Spine (Phila Pa
1976) 2010;35(8):892–7.
51. Palumbo MA, Hilibrand AS, Hart RA, et al. Surgical
treatment of thoracic spinal stenosis: a 2 to 9 year
follow-up. Spine (Phila Pa 1976) 2001;26(5):558–66.
52. Chang UK, Choe WJ, Chung CK, et al. Surgical
treatment for thoracic spinal stenosis. Spinal Cord
2001;39(7):362–9.
53. Xiong L, Zeng QY, Jinkins JR. CT and MRI charac-
teristics of ossification of the ligament flava in the
thoracic spine. Eur Radiol 2001;11:1798–802.
54. Al-Khawaja D, Seex K, Eslick GD. Spinal epidural
lipomatosis—a brief review. J Clin Neurosci 2008;
15(12):1323–6.
55. Baptiste DC, Fehlings MG. Pathophysiology of
cervical myelography. Spine J 2006;6(Suppl 6):
190S–7S.
56. Stookey B. Compression of the spinal cord due to
ventral extradural cervical chondromas. Arch Neu-
rol Psychiatry 1928;20:275–91.
57. Morishita Y, Naito M, Hymanson H, et al. The rela-
tionship between the cervical spinal canal diameter
and the pathological changes in the cervical spine.
Eur Spine J 2009;18(6):877–83.
58. Edwards WC, LaRocca H. The developmental
segmental sagittal diameter of the cervical spinal
patients with cervical spondylosis. Spine (Phila Pa
1976) 1983;8(1):20–7.
59. Morio Y, Teshima R, Nagashima H, et al. Correlation
between operative outcomes of cervical compres-
sion myelography and MRI of the spinal cord.
Spine 2001;26(11):123.
60. Chen IH, Vasavada A, Panjabi M. Kinematics of the
cervical spine canal: changes with sagittal plane
loads. J Spinal Disord 1994;7(2):93–101.
61. Zhang L, Zeitoun D, Rangel A, et al. Preoperative
evaluation of the cervical spondylotic myelopathy
with flexion-extension magnetic resonance imag-
ing: about a prospective study of fifty patients.
Spine (Phila Pa 1976) 2011;36(17):E1134–9.
62. Muhle C, Weinert D, Falliner A, et al. Dynamic
changes of the spinal canal in patients with cervical
spondylosis at flexion and extension using magnetic
resonance imaging. Invest Radiol 1998;33(8):444–9.
63. Yu WR, Liu T, Kiehl TG, et al. Human neuropatho-
logical and animal model evidence supporting
a role for Fas-mediated apoptosis and inflamma-
tion in cervical spondylotic myelopathy. Brain
2011;134(Pt 5):1277–92.
64. Pavlov H, Torg JS, Robie B, et al. Cervical spinal
stenosis: determination with vertebral body ratio
method. Radiology 1987;164(3):771–5.
65. Prasad SS, O’Malley M, Caplan M, et al. MRI
measurements of the cervical spine and their
correlation to Pavlov’s ratio. Spine (Phila Pa 1976)
2003;28(12):1263–8.
66. Naganawa T, Miyamoto K, Ogura H, et al. Com-
parison of magnetic resonance imaging and
computed tomogram-myelography for evaluation
Imaging of Spinal Stenosis 677
of cross sections of cervical spine morphology.
Spine (Phila Pa 1976) 2011;36(1):50–6.
67. Song KJ, Choi BW, Kim GH, et al. Clinical useful-
ness of CT-myelogram comparing with the MRI in
degenerative cervical spinal disorders: is CTM still
useful for primary diagnostic tool? J Spinal Disord
Tech 2009;22:353–7.
68. Shafaie FF, Wippold FJ, Gado M, et al. Comparison
of computed tomography myelography and
magnetic resonance imaging in the evaluation of
cervical spondylotic myelopathy and radiculop-
athy. Spine 1999;24:1781–5.
69. Teresi LM, Lufkin RB, Reicher MA, et al. Asymptom-
atic degenerative disk disease and spondylosis of
the cervical spine: MR imaging. Radiology 1987;
164(1):83–8.
70. Hayashi H, Okada K, Hamada M, et al. Etiologic
factors of myelopathy. A radiographic evaluation
of the aging changes in the cervical spine. Clin Or-
thop Relat Res 1987;(214):200–9.
71. Matsumoto M, Fujimura Y, Suzuki N, et al. MRI of
cervical intervertebral discs in asymptomatic
subjects. J Bone Joint Surg Br 1998;80(1):19–24.
72. Okada Y, Ikata T, Katoh S, et al. Morphologic anal-
ysis of the cervical spinal cord, dural tube, and
spinal canal by magnetic resonance imaging in
normal adults and patients with cervical spondy-
lotic myelopathy. Spine (Phila Pa 1976) 1994;
19(20):2331–5.
73. Fujiwara K, Fujimoto M, Owaki H, et al. Cervical
lesions related to the systemic progression in rheu-
matoid arthritis. Spine 1998;23:2052–6.
74. Takahashi M, Yamashita Y, Sakamoto, et al. Chronic
cervical cord compression: clinical significance of
increased signal intensity on MR imaging. Radi-
ology 1989;173:219–24.
75. Ramanauskas WL, Wilner HI, Metes JJ, et al. MR
imaging of compressive myelomalacia. J Comput
Assist Tomogr 1989;13:399–404.
76. Al-Mefty O, Harkey LH, Middleton TH, et al. Myelo-
pathic cervical spondylotic lesions demonstrated
by magnetic resonance imaging. J Neurosurg
1988;68:217–22.
77. Ohshiro I, Hatayama A, Kaneda K, et al. Correlation
between histopathologic features and magnetic
resonance images of spinal cord lesions. Spine
1993;18:1140–9.
78. Taneichi H, Abumi K, Kaneda K, et al. Monitoring the
evaluation of intra medullary lesions in cervical spinal
cord injury. Qualitative and quantitative analysis with
sequential MR imaging. Paraplegia 1994;32:9–18.
79. Ozawa H, Sato T, Hyodo H, et al. Clinical signifi-
cance of intramedullary Gd-DTPA enhancement
in cervical myelopathy. Spinal Cord 2010;48(5):
415–22.
80. Cho YE, Shin JJ, Kim K, et al. The relevance of in-
tramedullary high signal intensity and gadolinium
(Gd-DTPA) enhancement to the clinical outcome
in cervical compressive myelography. Eur Spine J
2011;20(12):2267–74.
81. Floeth FW, Stoffels G, Herdmann J, et al. Prog-
nostic value of 18F-FDG PET in monosegmental
stenosis and myelopathy of the cervical spinal
cord. J Nucl Med 2011;52(9):1385–91.
82. Facon D, Ozanne A, Fillard P, et al. MR diffusion
tensor imaging and fiber tracking in spinal cord
compression. AJNR Am J Neuroradiol 2005;26(6):
1587–94.
83. Kara B, Celik A, Karadereler S, et al. The role of DTI
in early detection of cervical spondylotic myelop-
athy: a preliminary study with 3-T MRI. Neuroradi-
ology 2011;53(8):609–16.
84. Budzik JF, Balbi V, Le Thuc V, et al. Diffusion tensor
imaging and fibre tracking in cervical spondylotic
myelopathy. Eur Radiol 2011;21(2):426–33.
85. Ke!rkovsky M, Bedna!rık J, Du!sek L, et al. Magnetic
resonance diffusion tensor imaging in patients with
cervical spondylotic spinal cord compression: corre-
lations between clinical and electrophysiological
findings. Spine (Phila Pa 1976) 2012;37(1):48–56.
86. Mastronardi L, Elsawaf A, Roperto R, et al. Prog-
nostic relevance of the post operative evolution of
intramedullary spinal cord changes in signal inten-
sity on magnetic resonance imaging after anterior
decompression for cervical spondylotic myelop-
athy. J Neurosurg Spine 2007;7(6):615–22.
87. Wada E, Ohmura M, Yonenobu K. Intramedullary
changes of the spinal cord in cervical spondylotic
myelopathy. Spine 1995;20:2226–32.
88. Matsuda Y, Miyazaki K, Tada K, et al. Increased MR
signal intensity due to cervical myelopathy. Anal-
ysis of 29 surgical cases. J Neurosurg 1991;74:
887–92.
89. Mehalic TF, Pezzuti RT, Applebaum BI. Magnetic
resonance imaging and cervical spondylotic
myelopathy. Neurosurgery 1990;26(2):217–26
[discussion: 226–7].
90. Suri A, Chabbra RP, Mehta VS, et al. Effect of intra-
medullary signal changes on the surgical outcome
of patients with cervical spondylotic myelopathy.
Spine J 2003;3(1):33–45.
91. Fernandez de Rota JJ, Meschian S, Fernandez
de Rota A, et al. Cervical spondylotic myelopathy
due to chronic compression: the role of signal
intensity changes in magnetic resonance images.
J Neurosurg Spine 2007;6:17–22.
92. Shin JJ, Jin BH, Kim KS, et al. Intramedullary high
signal intensity and neurological status as prog-
nostic factors in cervical spondylotic myelopathy.
Acta Neurochir (Wien) 2010;152(10):1687–94.
93. Yasutsugu Y, Fumihiko K, Hisatake Y, et al. MR T2
image classification in cervical compression
myelopathy predictor of surgical outcomes. Spine
(Phila Pa 1976) 2007;32:167–8.
Maus678
94. Avadhani A, Rajasekaran S, Shetty AP. Comparison
of prognostic value of different MRI classifications
of signal intensity change in cervical spondylotic
myelopathy. Spine J 2010;10(6):475–85.
95. Mummaneni PV, Kaiser MG, Matz PG, et al. Preop-
erative patient selection with magnetic resonance
imaging, computed tomography, and electroen-
cephalography: does the test predict outcome
after cervical surgery? J Neurosurg Spine 2009;
11(2):119–29.
96. Smith ZA, Buchanon CC, Raphael D, et al. Ossifica-
tion of the posterior longitudinal ligament: pathogen-
esis,management, andcurrent surgical approaches.
A review. Neurosurg Focus 2011;30(3):E10.
97. Yagi M, Ninomiya K, Kihara M, et al. Long-term
surgical outcome and risk factors in patients with
cervical myelopathy and a change in signal intensity
of intramedullary spinal cord on magnetic resonance
imaging. J Neurosurg Spine 2010;12(1):59–65.
98. Epstein N. Ossification of the cervical posterior
longitudinal ligament: a review. Neurosurg Focus
2002;13(2):ECP1.
99. Matsunaga S, Nakamura K, Seichi A, et al. Radio-
graphic predictors for the development of myelop-
athy in patients with ossification of the posterior
longitudinal ligament: a multicenter cohort study.
Spine (Phila Pa 1976) 2008;33(24):2648–50.
100. Hida K, Iwasaki Y, Koyanagi I, et al. Bone window
computed tomography for detection of dural defect
association with cervical ossified posterior longitu-
dinal ligament. Neurol Med Chir (Tokyo) 1997;
37(2):173–5 [discussion: 175–6].
101. Epstein NE. Identification of ossification of the
posterior longitudinal ligament extending through
the dura on preoperative computed tomographic
examinations of the cervical spine. Spine (Phila
Pa 1976) 2001;26(2):182–6.
102. Fukusaki M, Kobayashi I, Hara T, et al. Symptoms
of spinal stenosis do not improve after epidural
steroid injection. Clin J Pain 1998;14(2):148–51.
103. Koc Z, Ozcakir S, Sivrioglu K, et al. Effectiveness of
physical therapy and epidural steroid injections in
lumbar spinal stenosis. Spine (Phila Pa 1976)
2009;34(10):985–9.
104. HerzogRJ, Kaiser JA, Saal JA, et al. The importance
of posterior epidural fat pad in lumbar central canal
stenosis. Spine (Phila Pa 1976) 1991;16(6 Suppl):
S227–33.
105. Mariconda M, Fava R, Gatto A, et al. Unilateral lam-
inectomy for bilateral decompression of lumbar
spinal stenosis: a prospective comparative study
with conservatively treated patients. J Spinal Dis-
ord Tech 2002;15(1):39–46.
106. Laurencin C, Lipson S, Senatus P, et al. The
stenosis ratio: a new tool for the diagnosis of de-
generative spinal stenosis. Int J Surg Investig
1999;1(2):127–31.
107. Ullrich C, Binet E, Sanecki M, et al. Quantitative
assessment of the lumbar spinal canal by computed
tomography. Radiology 1980;134(1):137–43.
108. Lee B, Kazam E, Newman A. Computed tomog-
raphy of the spine and spinal cord. Radiology
1978;128(1):95–102.
109. Verbiest H. The significance and principles of
computerized axial tomography in idiopathic devel-
opmental stenosis of the bony lumbar vertebral
canal. Spine (Phila Pa 1976) 1979;4(4):369–78.
110. Jonsson B, Annertz M, Sjoberg C, et al. A prospec-
tive and consecutive study of surgically treated
lumbar spinal stenosis. Part I: Clinical features
related to radiographic findings. Spine (Phila Pa
1976) 1997;22(24):2932–7.
111. Schonstrom N, Bolender N, Spengler D. The path-
omorphology of spinal stenosis as seen on CT
scans of the lumbar spine. Spine (Phila Pa 1976)
1985;10(9):806–11.
112. Schonstrom N, Willen J. Imaging lumbar spinal
stenosis. Radiol Clin North Am 2001;39(1):31–53.
113. Wilmink J, Korte J, Penning L. Dimensions of the
spinal canal in individuals symptomatic and non-
symptomatic for sciatica: a CT study. Neuroradi-
ology 1988;30(6):547–50.
114. Airaksinen O, Herno A, Turunen V, et al. Surgical
outcome of 438 patients treated surgically for
lumbar spinal stenosis. Spine (Phila Pa 1976)
1997;22(19):2278–82.
115. Herno A, Airaksinen O, Saari T. Computed tomog-
raphy after laminectomy for lumbar spinal stenosis.
Patients’ pain patterns, walking capacity, and
subjective disability had no correlation with
computed tomography findings. Spine (Phila Pa
1976) 1994;19(17):1975–8.
116. Sortland O, Magnaes B, Hauge T. Functional mye-
lography with metrizamide in the diagnosis of
lumbar spinal stenosis. Acta Radiol Suppl 1977;
355:42–54.
117. Verbiest H. Neurogenic intermittent claudication in
cases with absolute and relative stenosis of the lumbar
vertebral canal (ASLC and RSLC), in cases with
narrow lumbar intervertebral foramina, and in cases
with both entities. Clin Neurosurg 1973;20:204–14.
118. Ciric I, Mikhael MA, Tarkington JA, et al. The lateral
recess syndrome. A variant of spinal stenosis. J
Neurosurg 1980;53(4):433–43.
119. Strojnik T. Measurement of the lateral recess angle
as a possible alternative for evaluation of the lateral
recess stenosis on a CT scan. Wien Klin Wo-
chenschr 2001;113(Suppl 3):53–8.
120. Dincer F, Erzen C, Basgoze O, et al. Lateral recess
syndrome and computed tomography. Turkish
Neurosurgery 1991;2:30–5.
121. Mikhael M, Ciric I, Tarkington J, et al. Neuroradio-
logical evaluation of lateral recess syndrome. Radi-
ology 1981;140(1):97–107.
Imaging of Spinal Stenosis 679