Embed Size (px)
Citation preview

University of South Carolina University of South Carolina
Scholar Commons Scholar Commons
Theses and Dissertations
Spring 2021
Degradative Processes of Commercial and Next-Generation Degradative Processes of Commercial and Next-Generation
Lithium-Ion Battery Materials Lithium-Ion Battery Materials
Benjamin Ng
Follow this and additional works at: https://scholarcommons.sc.edu/etd
Part of the Chemical Engineering Commons
Recommended Citation Recommended Citation Ng, B.(2021). Degradative Processes of Commercial and Next-Generation Lithium-Ion Battery Materials. (Doctoral dissertation). Retrieved from https://scholarcommons.sc.edu/etd/6372
This Open Access Dissertation is brought to you by Scholar Commons. It has been accepted for inclusion in Theses and Dissertations by an authorized administrator of Scholar Commons. For more information, please contact [email protected].

DEGRADATIVE PROCESSES OF COMMERCIAL AND NEXT-GENERATION
LITHIUM-ION BATTERY MATERIALS
by
Benjamin Ng
Bachelor of Science
University of Connecticut, 2017
Submitted in Partial Fulfillment of the Requirements
For the Degree of Doctor of Philosophy in
Chemical Engineering
College of Engineering and Computing
University of South Carolina
2021
Accepted by:
William E. Mustain, Major Professor
Ralph E. White, Committee Member
Kevin Huang, Committee Member
John Regalbuto, Committee Member
Melissa Moss, Committee Member
Tracey L. Weldon, Interim Vice Provost and Dean of the Graduate School

ii
© Copyright by Benjamin Ng, 2021
All Rights Reserved.

iii
ACKNOWLEDGEMENTS
Over the course of many years, and through all the excitement, laughter, hopes and
dreams, disappointment, fear, battle, and perseverance, I take another look at this torch that
is in my hand, and to see now, I am ready to pass it on to the next person. The flashbacks
come rushing back, like running your thumb through the pages of a book and un-
encapsulating those small time capsules that are sealed in the form of memories. I had very
few people throughout my life that were willing to go that extra mile to mentor, to mold,
to push me like I never pushed before, and to assure than my mentor William Mustain. Bill,
I want to pause, and take a moment to thank you for being that pivotal person, that critical
eye, and that simultaneously big pictured, deep brained, and curious person that you are
for all these years. I am deeply grateful.
Next, I want to thank Paul Coman and Ralph White, whose collaboration with Bill
taught me to juggle many new ideas and taught me how to execute each idea to the best of
my capability. Paul and Ralph, I want to thank you for the exciting projects, guidance, and
all the fun times we had, and may we continue that into the future. I also want to thank
Scott Roberts for the opportunity and mentorship during my time at Sandia National Labs
- especially all the trials and difficulties during the COVID-19 pandemic. Next, I want to
thank my Committee members Kevin Huang and John Regalbuto for their continuous
support, critical thinking, and guidance along this journey. And finally, I have to give a
special thanks to all my friends and colleagues that were monumental in my success

iv
(Alessandro Palmieri, Xiong Peng, Ehsan Faegh, Sujan Shrestha, Xinfang Jin, Travis
Omasta, Yiwei Zheng, Niloofar Kamyab, Hori Adabi Firouzjaie, Noor Ul Hassan, Hanna
Soucie, Saheed Lateef, Golareh Jalilvand, Emanuele Magliocca, Lyzmarie Colon, Xinyi
Zhao).
For prospective people, the journey is much like a marathon, and that there is
wisdom in everything. “Even when the man with the hammer comes swinging, we endure,
and through that endurance, we find out who we truly are, and that those boundaries are
just defined by us.” – Analogous to “der Mann mit dem Hammer” and referring to when
your glycogen-levels severely deplete in your liver and muscles during a marathon and you
hit a wall - but you keep pushing forward.

v
ABSTRACT
The work embodied in this thesis bridges the gap between modern and next-
generation Li-ion batteries (LIBs). First, a detailed study of the complex interfacial
interactions (e.g. electrode/electrolyte, particle/particle, particle/solid-electrolyte
interphase) in existing LIBs (graphite anode, Li(Ni0.5Mn0.3Co0.2)O2 cathode) are
investigated and then used to develop strategies for safer, more energy-dense, and more
durable electrode materials (i.e. tailored hybrid materials). The first portion of this thesis
focuses heavily on decoupling the complex thermodynamics, reaction kinetics, and mass
transport properties in commercially available LIBs. This thesis includes a detailed
investigation into the operating parameter space for LIBs, including temperature (-30oC to
+52oC), state-of-charge (SOC, 0% to 100%), applied currents, and lifetime (>1000 cycles).
Fundamental parameters are extracted from experimental data and implemented into two
different computational models (tau lumped model and pseudo-2D model) to provide
system-level predictions and isolate the inherent loss mechanisms that hinder performance,
such as electrical conduction, lithium diffusion, electrolyte diffusion, and charge transfer
resistance.
The next section of this thesis applies a large suite of characterization tools –
including microscopy, multiple-location liquid N2 Raman spectroscopy, gas
chromatography/mass spectroscopy, and X-ray photoelectron spectroscopy – to probe
complex reactions that lead to cell failure. Modern LIBs, particularly commercial cells

vi
with large electrodes, can experience severe gassing, Li-plating, and anisotropic
lithiation/delithiation. These negative behaviors can trigger a cascade of complex reactions
that lead to thermal runaway. Such reactions include high surface area plated Li with the
organic electrolyte (ethylene carbonate, dimethyl carbonate, diethyl carbonate, lithium
hexafluorophosphate) under charge/discharge vs. open circuit storage. Electrolyte
decomposition reactions can also occur that result in the release of large volumes of CO2,
H2, O2, CO, CH4, C2H4, and C2H6 gases, which causes drastic morphological and
microstructural changes to the electrode. Also, the severe polarization of the electrode at
low temperatures can cause significant Li0 residence at high-stress regions (i.e. high
curvature, edges, electrode ripples).
A paradigm shift is needed to move past the limiting factors that plague current LIB
systems (e.g. low-moderate energy densities and inherent safety risks realized in Chapter
2 - Chapter 4). A search for new materials is required to meet the demands of the future.
Conversion-based materials – such as transition metal sulfides, fluorides, and oxides – that
leverage bond-breaking reactions are promising candidates to provide higher gravimetric
and volumetric energy densities in comparison to the incumbent intercalation-based
materials. Conversion materials also have a higher redox potential (~1V vs Li/Li+), which
additionally provides protection from Li-plating, resulting in safer batteries. However, in
the literature, conversion-based materials have suffered from poor reaction reversibility
that can lead to short battery life. Chapter 5 applies electroanalytical techniques and
electron transfer theory to probe the reaction mechanisms that form the solid electrolyte
interphase (SEI) and the conversion reaction for one conversion-based anode material,
NiO. First, a combination of physical and electro-analytical techniques were used to

vii
investigate the SEI formation, which is the predominant capacity-degrading process in
LIBs. One of the most important methods was the current-pulse relaxation method via
galvanostatic intermittent titration technique (GITT), which allows for both diffusion and
kinetics to be quantified along the reaction pathway (0%-100% SOC). Also, the Butler-
Volmer (BV) and Marcus-Hush-Chidsey (MHC) models are used to investigate the
effective transfer coefficients and reaction reorganizational energies. This information is
used to provide new mechanistic insight into the rate-determining step and the SEI
formation reaction pathway at different SOC and to compare the SEI formation chemistry
with modern materials.
In addition to SEI formation, conversion materials undergo other degradative
processes as well, including metal (charge) trapping, transformation of the transition metal
in the oxide (NiO) to higher oxidation states, and agglomeration-induced loss of
electrochemically active sites. Taking that into consideration, Chapter 5 introduces a new
concept that isolates the NiO from the electrolyte, effectively eliminating all of the above-
mentioned degradation mechanisms. This concept uses nanoconfinement of the
conversion-based anode inside of small diameter carbon nanotubes. The CNT host was
found to provide a termination-length for the SEI by specifically isolating the active
material from the bulk electrolyte. In addition, the CNT host provides long-range
interparticle electronic conductivity and immobilizes the reactants/products to one semi-
closed packet. The result is a very high-capacity material (ca. 700 mAh g-1) with very high
coulombic efficiency (> 99.9%) that also has the ability for long-term operation (> 2000
deep charge/discharge cycles between 0-100% SOC at 1C).

viii
Chapters 7 and 8 of this thesis are meant to provide some perspective on the state
of the technology and where it is going. More specifically, Chapter 7 is a summary of all
the fundamental findings in this work. Chapter 8 proposes future work that can be done to
achieve long-life, high energy density lithium-ion batteries in the near future.

ix
TABLE OF CONTENTS
ACKNOWLEDGEMENTS ................................................................................................... iii
ABSTRACT ........................................................................................................................v
LIST OF TABLES ............................................................................................................. xii
LIST OF FIGURES ............................................................................................................xv
LIST OF SYMBOLS .........................................................................................................xxv
CHAPTER 1: INTRODUCTION TO LI-ION BATTERIES ...........................................................1
1.1 ELECTROCHEMISTRY OF COMMERCIAL LI-ION BATTERIES .................................3
1.2 INTERCALATION REACTION MECHANISMS ..........................................................7
1.3 AGING MECHANISMS AND TEMPERATURE EFFECTS IN LIBS .............................10
1.4 CAPACITY LIMITATIONS WITH INTERCALATING MATERIALS IN LIBS ...............13
1.5 SELECTION OF NEXT-GENERATION BATTERY MATERIALS ...............................13
1.6 THEORETICAL FRAMEWORK FOR UNDERSTANDING THE
PERFORMANCE AND LOSS MECHANISMS OF LI-ION BATTERIES ........................22
CHAPTER 2: DECONVOLUTION OF THE THERMODYNAMIC, KINETIC,
AND TRANSPORT PROPERTIES FROM COMMERCIAL LARGE
FORMAT LI-ION BATTERIES ........................................................................28
2.1 EXPERIMENTAL .................................................................................................31
2.2 EXTRACTED COMMERCIAL BATTERY PARAMETERS .........................................35

x
2.3 ELECTROCHEMICAL-THERMAL MODEL: PERFORMANCE
PREDICTIONS OF COMMERCIAL LI-ION BATTERIES ...........................................44
2.4 SUMMARY .........................................................................................................52
CHAPTER 3: INVESTIGATION OF THE KINETIC AND TRANSPORT
NON-IDEALITIES IN COMMERCIAL LI-ION ELECTRODES -
DECONVOLUTING COMPLEX ELECTROCHEMICAL IMPEDANCE
SPECTROSCOPY DATA ................................................................................53
3.1 EXPERIMENTAL EXTRACTION OF ELECTRODE-LEVEL PARAMETERS .................56
3.2 PERTURBATION FORM OF PSEUDO-2-DIMENSIONAL MODEL ............................62
3.3 PARAMETER ESTIMATION .................................................................................62
3.4 EIS MODEL PARAMETERS .................................................................................63
3.5 THERMODYNAMIC NONIDEALITY ......................................................................69
3.6 IMPORTANCE OF INTEGRATING NONIDEALITY INTO PHYSICS-
BASED MODELS .................................................................................................71
3.7 SUMMARY .........................................................................................................73
CHAPTER 4: EXTREME OPERATION OF LI-ION BATTERIES ..............................................75
4.1 FAILURE MODES ...............................................................................................77
4.2 LITHIUM PLATING MECHANISM AND RAPID BATTERY
DEGRADATION OF COMMERCIAL LI-ION BATTERIES UNDER
LOW TEMPERATURE .........................................................................................78
4.3 EXPERIMENTAL .................................................................................................79
4.4 RESULTS AND DISCUSSION ................................................................................82
4.5 SUMMARY .......................................................................................................100
CHAPTER 5: STRATEGIC DESIGN OF DURABLE, SAFE, ENERGY
DENSE LIB ANODES ...............................................................................101
xi
5.1 MATERIAL SELECTION AND DESIGN STRATEGIES ...........................................102
5.2 THE STRUCTURE AND CHEMISTRY OF THE SOLID
ELECTROLYTE INTERPHASE ............................................................................103
5.3 EXPERIMENTAL AND THEORETICAL FRAMEWORK ..........................................108
5.4 RESULTS AND DISCUSSION ..............................................................................114
5.5 SUMMARY .......................................................................................................135
CHAPTER 6: AVOIDING THE SOLID ELECTROLYTE INTERPHASE
DEGRADATION MECHANISM IN NEXT GENERATION
CONVERSION ANODES .............................................................................136
6.1 EXPERIMENTAL ...............................................................................................138
6.2 RESULTS AND DISCUSSION ..............................................................................145
6.3 SUMMARY .......................................................................................................160
CHAPTER 7: CONCLUSIONS ...........................................................................................163
CHAPTER 8: RECOMMENDATION FOR FUTURE WORK ...................................................168
8.1 PARAMETERIZATION OF NEXT-GENERATION LI-ION BATTERIES .....................169
8.2 LI-SULFUR BATTERIES ....................................................................................175
8.3 IMPLEMENTING AN ION-EXCHANGE TRAPPING AGENT
TO STOP THE POLYSULFIDE DEGRADATION PROCESS .....................................181
8.4 OPERANDO TECHNIQUES FOR STUDYING THE CORROSION
OF LI0 ELECTRODEPOSITS IN LI/S BATTERIES .................................................185
REFERENCES .................................................................................................................190
APPENDIX A: COPYRIGHT & PERMISSIONS ...................................................................208

xii
LIST OF TABLES
Table 1.1. | United States Advanced Battery Consortium (USAB) goals for
advanced high-performance batteries for electric vehicle (EV)
applications in 202310 ....................................................................................... 2
Table 1.2. | Summary of the energy density of commercial and commonly
proposed next-generation Li-based batteries. ................................................... 6
Table 1.3. | Reaction description and mechanism for the transport of Li+ from
the bulk electrolyte to the conversion of NiO to Ni ........................................ 18
Table 2.1. | Table showing the atomic ratio of Li, Co, Ni, Mn in the cathode
and anode obtained by ICP-OES. ................................................................... 33
Table 2.2. | List of parameters measured experimentally. ............................................... 36
Table 2.3 | Table showing the dimensions of the 50Ah cell and the 1000Hz AC
ohmic resistance measurement. ...................................................................... 41
Table 2.4 | Table showing the method used to measure the average active
material loading of the anode and the cathode. ............................................... 43
Table 2.5 | Table showing the equations in the lumped model from
Ekström et al.74................................................................................................ 45
Table 2.6 | Model parameters calculated using the Levenberg-Marquardt
optimization method. ...................................................................................... 49
Table 2.7 | Parameters used for model. ............................................................................ 51

xiii
Table 3.1 | Perturbation form of the Lithium-Ion battery P2D model ............................. 61
Table 3.2 | Parameters used in the EIS Model. ................................................................ 63
Table 3.3 | Optimized parameters..................................................................................... 65
Table 3.4 | Parameters used in Fitting of A in Figure 3.9 ............................................... 68
Table 3.5 | Advantages and Disadvantages of different model techniques ...................... 74
Table 4.1. | Presents the spatial heterogeneity of both the Li(Ni0.5Mn0.3Co0.2)O2
cathode and graphite anode for the full jellyroll analysis. .............................. 88
Table 4.2 | Transition metal speciation for various regions (e.g. edge, center,
curvature) of surface Li(Ni0.5Mn0.3Co0.2)O2 and LixC6 ................................... 99
Table 4.3 | Mass and atomic percentages (%) of the elements Li, P, C, O, F,
Mn, Co, and Ni at different regions for Li(Ni0.5Mn0.3Co0.2)O2
and LixC6 from XPS spectra analysis after non-thermal
runaway venting .............................................................................................. 99
Table 5.1. | Hypothetical generalized mechanism where n is the total number
of e-, is the number of e- before RDS, is the number of e- after
RDS, and is either 0 (chemical) or 1 (electrochemical) 180,183 ................... 115
Table 5.2. | Tafel calculations of eff for Vulcan XC-72R carbon black. ...................... 120
Table 5.3. | Effective transfer coefficient calculated by Tafel slope and
reorganizational energy calculated by the low overpotential
approximation for the Marcus-Hush-Chidsey theory ................................... 128
Table 5.4. | Mechanistic insight in the reaction pathway for Region IV (2.2 < x
< 2.8), showing chemical (C) and electrochemical (E) steps. ...................... 133
Table 6.1. | Evaluation of Oxidation States. The overall reaction pathways
associated with various degrees of constraints of confinement of
metal oxides. ................................................................................................. 162

xiv
Table 8.1 | Reactions in Li/S batteries ............................................................................ 176

xv
LIST OF FIGURES
Figure 1.1. | Diagram elucidating the operating principles of a Li-ion battery
with the conventional anode (e.g. graphite, Li4Ti5O12), cathode
materials (e.g. LiCoO2, Li2MnO3), and electrolyte (e.g. LiPF6 in
organic carbonates). Reproduced with permission from IOP
Publishing 11 ...................................................................................................... 4
Figure 1.2. | Atomic structure of Lithium intercalation in graphitic carbon
(LiCx) and showing, (a) the top view, (b) side view of stage-2 LiC18,
(c) top view, (d) side view of stage-3 LiC18, (e) LiC12, and (f) LiC6.
Reproduced with permission from IOP Publishing.17...................................... 8
Figure 1.3. | Comparison of layered, disordered rocksalt, and spinel cation
ordering. Reproduced with permission from John Wiley and Sons18 ............... 9
Figure 1.4. | Depicts the instability of the anode interface under high and low
temperatures. High temperatures can result in (a) deterioration of the
SEI, (b) decomposition of the electrolyte and release of gas, (c)
transition metal dissolution from cathode and reaction at anode, (d)
severe chemical changes to the SEI. Low temperatures can cause (e)
severe anode polarization to drive Li-plating, and (f) reduced
reaction kinetics and increase in SEI resistances. Reproduced with
permission from Macmillan Publishers Ltd23 ................................................. 11
Figure 1.5. | Depicts the instability in the structure of cathode materials at
different temperatures (red = high T and blue = low T). The cathodes
include (a) LiCoO2, (b) LiNi1/3Mn1/3Co1/3O2, (c) spinel LiMn2O4,
and olivine LiFePO4. Reproduced with permission from Macmillan
Publishers Ltd23 ............................................................................................... 12
Figure 1.6. | Anode selection list and their theoretical capacities. Reproduced
with permission from Royal Society of Chemistry.30 ..................................... 16

xvi
Figure 1.7. | Depicts the conversion reaction mechanism with MF3 as a
representative material. The conversion process involves limited
diffusion of the anion (e.g. F, O, N, P, etc.) to react with the Li+
during charge which generates metal (M) crystals and LiX.
Reproduced with permission from Macmillan Publishers Ltd31..................... 16
Figure 1.8. | Typical energy landscape (a) diffusion; (b) reaction.49 .............................. 25
Figure 2.1. | Photograph of (a) the large format 50 Ah prismatic cell and (b)
one of two jelly rolls ....................................................................................... 32
Figure 2.2. | Physical and Electrochemical Characterization. Field-emission
scanning electron microscope (FE-SEM) of (a,b) NMC532 cathode,
and (c) galvanostatic intermittent titration technique (GITT) for the
open circuit potential (OCP) of the cathode. (d,e) FE-SEM images
of graphite anode and (f) GITT for the OCP of the anode.
Reproduced with permission from Elsevier.78 ................................................ 37
Figure 2.3. | Entropic Heat Coefficient Calculations. Open circuit potential
(OCP) changes due to temperature (T) for the calculation of dUdT-1
at various state of charge (SOC). Reproduced with permission from
Elsevier.78 ........................................................................................................ 38
Figure 2.4 | Extracting Modeling Parameters at Different SOC and
Temperatures. (a) Open circuit potential, (b) Area independent
diffusivity (S2D), (c) exchange current (i0S), and (d) internal
resistance (RIR) for 50Ah cells at different SOC (100% to 0%) and
at varying temperatures (-15°C to 45°C). Reproduced with
permission from Elsevier.78 ............................................................................ 39
Figure 2.5. | Modeling Parameters and Cycling Profile. (a) Represents the
average exchange current (red line), area independent diffusivity
(black line), and ohmic resistance (blue line), (b) entropic heat
coefficient at different state of charge, and (c) CC-CP charge-
discharge profile with temperature measurements on the 50Ah cell
terminal and casing body. Reproduced with permission from
Elsevier.78 ........................................................................................................ 44
Figure 2.6. | Plot showing the cell potential calculated using the TLM and the
potential measured experimentally for a discharge process of 0.3C.
Reproduced with permission from Elsevier.78 ................................................ 48

xvii
Figure 2.7. | Plots showing the cell temperature calculated using the TLM and
the potential measured experimentally for a CC discharge process
of 0.3C when a) the reversible term is included and b) when the
reversible term is neglected. Reproduced with permission from
Elsevier.78 ........................................................................................................ 48
Figure 2.8. | Plot showing the cell potential calculated using the TLM and the
potential measured experimentally for a discharge process of 0.3C
using the measured internal resistance and the exchange current at
25°C. Reproduced with permission from Elsevier.78 ...................................... 50
Figure 2.9. | Plots showing the cell potentials calculated using the TLM and the
potential measured experimentally for a) a discharge process of 0.5C
and for b) a discharge process of 1C, using the measured internal
resistance and the exchange current at 25°C. Reproduced with
permission from Elsevier.78 ............................................................................ 51
Figure 3.1. | Schematic of a Li-ion half-cell PBM. The porous electrodes are
formed by spherical insertion particles. Reproduced with permission
from IOP Publishing.98.................................................................................... 55
Figure 3.2. | Images depicting the teardown process with (a) Ar-filled MBraun
glovebox <0.1 ppm H2O and O2, (b) side view of the 2 jelly rolls,
(c) tab orientation, and (d) a face view of a jellyroll. ..................................... 57
Figure 3.3. | a) SEM images of electrode cross-sections; b) the box and whisker
graph of particle size and one side electrode thickness; (c) the
cumulative pore area and porosity distribution of cathode, anode,
and separator calculated from mercury intrusion porosimetry. ...................... 58
Figure 3.4. | Potential vs current experimental data and fitting of the electronic
conductivity of NMC532. ............................................................................... 60
Figure 3.5. | Model and Experimental data comparison in (a) complex plan
(Nyquist) plot, (b) magnitude of impedance (|Z|), and (c) phase angle
(θ). Reproduced with permission from IOP Publishing.98 .............................. 64

xviii
Figure 3.6. | Comparing the Nyquist plots from model and experimental data
with 95% Confidence Intervals under different xLi of the cathode: a)
xLi =0.96, b) xLi =0.89, c) xLi =0.81, d) xLi =0.74, e) xLi =0.66, f) xLi
=0.59, g) xLi =0.52, h) xLi =0.47, and i) xLi =0.40. Reproduced with
permission from IOP Publishing.98 ................................................................. 66
Figure 3.7. | Optimized Parameters as a function of OCV for (a-f) Ak,cathode,
Ak,anode, Ac,cathode, Ac,anode, AD,cathode, and AR. Reproduced with
permission from IOP Publishing.98 ................................................................. 66
Figure 3.8. | Sensitivity of each parameter. Reproduced with permission from
IOP Publishing.98 ............................................................................................ 67
Figure 3.9. | Relative pre-factors for k and D for the cathode. Reproduced with
permission from IOP Publishing.98 ................................................................. 68
Figure 3.10. | 𝑑ln𝛾𝑑𝑥𝐿𝑖 as a function of xLi obtained from Equation 2.30.
Reproduced with permission from IOP Publishing.98..................................... 70
Figure 3.11. | GITT measurement of NMC532 half-cell during the
charging/discharging cycles Reproduced with permission from IOP
Publishing.98 .................................................................................................... 71
Figure 3.12. | Comparison between different pre-factors: (a) discharge profiles
(Current=1C); (b) overpotentials; (c) xLi concentration profiles in
active particles at the end of discharge. Reproduced with permission
from IOP Publishing.98.................................................................................... 72
Figure 4.1. | New European Driving Cycle (NEDC) speed correlations to
current for a given 1200s experiment. ............................................................ 76
Figure 4.2 | Schematic of low-temperature Li0 plating and gas generation over
repetitive cycling and subsequent over-pressurized venting after
room-temperature recovery. Reproduced with permission from
American Chemical Society.130 ...................................................................... 78

xix
Figure 4.3. | Low temperature electrochemical and thermal analysis on the
effects of Li0 plating and gas generation. (a) Cycle performance and
coulombic efficiency during temperature transitions (RT→ -29oC
→RT), (b) charge-discharge profile highlighting the temperature
transitions and charge/discharge currents (i.e. characteristic no
plating curve at 2.5 A and other plating curves at 15A), (c) internal
resistance measured by AC-1000Hz method and relaxation voltage
before discharge, (d) Qmax normalized differential capacity analysis
to decouple the no Li+ stripping characteristic curve and identify Li+
stripping peaks79 under the more extreme charge/discharge current
(15A), and (e) temperature recovery back to RT and cycling results
catastrophic venting that causes the cell to internally shutdown.
Reproduced with permission from American Chemical Society.130 ............... 83
Figure 4.4. | Plot showing (a) the gases accumulated during cycling, as detected
by the Gas chromatography-Mass spectrometry (GC-MS) analysis
of post-mortem electrodes and (b) proposed Li0 corrosion reaction
mechanism for gas generation. Reproduced with permission from
American Chemical Society.130 ...................................................................... 87
Figure 4.5. | SEM images of different areas on the surface of the anode reveal
high spatial anisotropy of low-temperature Li0 plating/gas
generation and the sample collection regions on the LixC6 negative
electrode at the center with near-tab, center, far-edge, and curvature
designations. Reproduced with permission from American
Chemical Society.130 ....................................................................................... 89
Figure 4.6. | Enhanced optically filtered images of (a) Li(Ni0.5Mn0.3Co0.2)O2
and (b) LixC6, and multi-location liquid nitrogen Raman
spectroscopy of the respective electrodes after non-abuse conditions
(room temperature) and post-mortem (low temperature) to analyze
spatial distribution of chemical species, state of charge, and
electrolyte degradation products. Reproduced with permission from
American Chemical Society.130 ...................................................................... 93
Figure 4.7. | X-ray photoelectron spectroscopy analysis of (a) Ni 2p, Mn 2p, O
1s, C 1s for Li(Ni0.5Mn0.3Co0.2)O2, and (b) Ni 2p, Li 1s, O 1s, C 1s
for graphite electrodes after -29oC cycling and non-thermal runaway
over-pressurization and venting. Reproduced with permission from
American Chemical Society.130 ...................................................................... 96

xx
Figure 5.1 | Energy diagram of a Li-ion battery and reaction mode inside the
electric double layer (pre-cycled) and the solid electrolyte interphase
(post-cycled). The schematic captures the interfacial dynamics in
the inner/outer Helmholtz plane (I/O-HP) and shows desolvated Li+
transport through the SEI. Adapted from 165,166 Reproduced with
permission from The Royal Society of Chemistry.167 .................................. 105
Figure 5.2. | Represents (a) charge/discharge curves for Vulcan XC-72R carbon
black, (b) Tafel-like plots with Butler-Volmer (solid line) and
Marcus-Hush-Chidsey (dashed lines) models on-top of
experimental data (dots), and (c) illustration of the interfacial
structure of carbon during initial charge stages and reaction
mechanism as proposed by (Wang et al.186). The reaction
mechanism designations are C = chemical step, E = electrochemical
step, D = dimerization reaction, and a double line highlight the rate-
determining step. Reproduced with permission from The Royal
Society of Chemistry.167................................................................................ 119
Figure 5.3. | Depicts galvanostatic intermittent titration technique for the
parameter extraction of (a) apparent diffusion coefficient and (b) the
apparent exchange current. Both plots contain the open circuit
potential of NiO marked in (blue). Each section contains a dot that
indicates locations where linear sweep voltammetry is done. Four
sections are broken down (I, II, III, IV) to delineate dominant
mechanisms. Also, high-resolution transmission electron
microscopy is depicted as (c) TEM of post-cycled NiO. The atomic
resolution HRTEM is depicted in (d) for the Ni domain
(~2.1Å[111], ~1.8Å[200]) and (e) for the NiO domain (2.4Å[111],
2.0Å[200]). The Fast Fourier Transform (FFT) analysis of the
HRTEM (f) for Ni and (g) for NiO. (h) Depicts the schematic for
NiO particle transformation and showing the conversion reaction
front propagation for the particle-level HRTEM image in Figure
5-3c (i.e. lithiation propagates from the bulk electrode until the
reaction front stops due to high local polarization (i.e. the electrical
losses generate a termination distance) and resulting in trapped
charge). Reproduced with permission from The Royal Society of
Chemistry.167 ................................................................................................. 125
Figure 5.4. | Represents Tafel-like plots for Butler-Volmer (solid line) and
Marcus-Hush-Chidsey (dashed lines) models on-top of
experimental data (dots). Reproduced with permission from The
Royal Society of Chemistry.167 ..................................................................... 127

xxi
Figure 5.5. | High-resolution XPS spectra of (a) pre-cycled and (b) post-cycled
NiO electrodes in the Ni 2p, C 1s, and O 1s spectra. Reproduced
with permission from The Royal Society of Chemistry.167 .......................... 130
Figure 5.6. | Transmission electron microscopy was used in (c) which
represents the post-cycle surface mesostructure and highlights high
anisotropy in SEI formation, (d) high resolution of the SEI, (e)
energy-dispersive X-ray spectroscopy, and elemental mapping of
the SEI. Reproduced with permission from The Royal Society of
Chemistry.167 ................................................................................................. 134
Figure 6.1. | Physical and Electrochemical Characterization. (a) SEM, (b)
TEM/EDS of NiO/C. (c) X-Ray Diffraction (XRD) patterns
comparing the crystallography (e.g. crystallite domain size,
structure) of NiO/C (blue line), ID-NiO/CNT (green line), and NC-
NiO@CNT50 (purple line). (d) SEM and (e) TEM/ESC of ID-
NiO/CNT. (f) Comparing the capacity retention of NiO/C (blue
line), ID-NiO/CNT (green line), and NC-NiO@CNT50 (purple line)
at 1C charge/discharge rate to observe the reaction and cell-level
reversibility. Reproduced with permission from The Royal Society
of Chemistry.37 .............................................................................................. 146
Figure 6.2. | Evaluation of Physical and Chemical Transformations. (a) TEM
image of NiO/C after 10 electrochemical cycles. XPS spectra of
NiO/C including (b) Ni2p, (c), O1s, and (d) oxidation state
percentages for NiO/C. (e) TEM images of ID-NiO/CNT after 10
electrochemical cycles. XPS spectra of ID-NiO/CNT including (f)
Ni2p, (g) O1s, and (h) oxidation state percentages for ID-NiO/CNT.
Reproduced with permission from The Royal Society of Chemistry. 37 .................................................................................................................... 152
Figure 6.3. | Material Nanoconfinement. (a) Illustration of metal oxides spatial
rearrangement during charge/discharge in the case of
nanoconfinement, (b) SEM images of nano-confined NiO in NC-
NiO@CNT50, (c) TEM images and EDS mapping of NC-
NiO@CNT50, (c-1) interlayer spacing of CNT, (c-2) interface
between MO-CNT, (c-3) lattice fringes of NiO, (d) TEM image of
NiO@CNT50 after 10 electrochemical cycles. XPS spectra of NC-
NiO@CNT50 including (e) Ni2P, (f) O1s, as well as (g) the
percentage of active materials remaining in the 2+ oxidation state
after cycling. Reproduced with permission from The Royal Society
of Chemistry.37 .............................................................................................. 156

xxii
Figure 6.4. | Electrochemical performance. (a) The charge-discharge curves
and (b) differential capacity analysis (dQdV-1) of NC-NiO@CNT50.
(c) Rate capability evaluation for charge reversibility and rate-
specific side reactions at different current densities for NC-
NiO@CNT50. (d) EIS spectra after 10, 50, and 100 charge/discharge
cycles for ID-NiO/CNT and NC-NiO@CNT50, showing the
evolution of chemical and physical processes (e.g. diffusion, charge
transfer, electrolyte conductivity, SEI resistance) during cycling. (e)
Capacity retention over 2000 cycles for NC-NiO@CNT10 at 1C (718
mAh g-1). (f) Capacity retention, charge-discharge curves, and
differential capacity analysis for high loading full cells made from
NC-NiO@CNT10 anodes and Li(Ni0.5Mn0.3Co0.2)O2 cathodes
(anode loading: 5.16 mg cm-2; cathode loading: 18.23 mg cm-2) full
cell. XPS spectra for NC-NiO@CNT10 before and after cycling
including (g) Ni2P, (h) O1s, and (i) the percentage of NiO remaining
in the 2+ oxidation post-cycling. Reproduced with permission from
The Royal Society of Chemistry.37 ............................................................... 157
Figure 6.5. | Phase Separation and Degradation Pathway. Identifying the
degradation pathways in conversion MOs (e.g. M/MO
agglomeration, metal trapping, electrical detachment, SEI
engulfment of MO, particle delamination) caused by fluctuations in
the local e-, Li+, oxygen, and metal balance during phase separation
for (a) physically mixed NiO/C, (b) anchored ID-NiO/CNT, and (c)
nano-confined NC-NiO@CNT. Reproduced with permission from
The Royal Society of Chemistry.37 ............................................................... 161
Figure 8.1. | Illustration of the simulation domain and geometry .................................. 170
Figure 8.2. | Prototype model of a two-particle Intercalation/Conversion (2P-
I/C) hybrid FeS2 chemistry for secondary battery purposes, where
(a) represents the model simulation for the discharge/charge reaction
with multiple reaction plateaus, and (b) contains the particle-level
reaction modes and electrolyte loss. ............................................................. 174
Figure 8.3. | Reconstruction of X-ray computed tomography (XCT) of NMC
from Ebner et al.217 ....................................................................................... 175
Figure 8.4. | Next-generation conversion electrodes based on energy-dense Li-
Sulfur technologies where (a) is the cycle performance plot, and (b)
shows the charge-discharge profile ............................................................... 181

xxiii
Figure 8.5. | Homopolymer based on (a) block, (b) random, (c) casting
membranes. Reproduced with permission from The Royal Society
of Chemistry.220............................................................................................. 184
Figure 8.6. | Charge-discharge curves for (a) GT32 and (b) GT72 ............................... 185
Figure A.1 | Copyright permission for Figure 1.2. Qi, Y., Guo, H., Hector, L.
G. & Timmons, A. Threefold Increase in the Young ’ s Modulus of
Graphite Negative Electrode during Lithium Intercalation Threefold
Increase in the Young ’ s Modulus of Graphite Negative Electrode
during Lithium Intercalation. J. Electrochem. Soc. 157,
A558–A566 (2010). ...................................................................................... 208
Figure A.2 | Copyright permission for Figure 1.3. Radin, M. D., Hy, S., Sina,
M., Fang, C., Liu, H., Vinckeviciute, J., Zhang, M., Whittingham,
M. S., Meng, Y. S. & Van der Ven, A. Narrowing the Gap between
Theoretical and Practical Capacities in Li-Ion Layered Oxide
Cathode Materials. Adv. Energy Mater. 7, 1–33 (2017). .............................. 209
Figure A.3 | Copyright permission for Figure 1.4 and Figure 1.5 Rodrigues,
M.-T. F., Babu, G., Gullapalli, H., Kalaga, K., Sayed, F. N., Kato,
K., Joyner, J. & Ajayan, P. M. A materials perspective on Li-ion
batteries at extreme temperatures. Nat. Energy 2, 17108 (2017).................. 209
Figure A.4 | Copyright permission for Figure 1.7. Amatucci, G. G. Stabilized
iron fluoride cathodes. Nat. Mater. 18, 1275–1276 (2019). ......................... 210
Figure A.5 | Copyright permission for Figure 1.8 and Figure 3.1-Figure 3.12
Spinner, N., Zhang, L. & Mustain, W. E. Investigation of metal
oxide anode degradation in lithium-ion batteries via identical-
location TEM. J. Mater. Chem. A 2, 1627–1630 (2014). ............................. 211
Figure A.6 | Copyright permission for Figure 1.8 and Figure 3.1-Figure 3.12.
Ng, B., Duan, X., Liu, F., Agar, E., White, R. E., Mustain, W. E. &
Jin, X. Investigation of Transport and Kinetic Nonideality in Solid
Li-Ion Electrodes through Deconvolution of Electrochemical
Impedance Spectra. J. Electrochem. Soc. 167, 020523 (2020)..................... 212

xxiv
Figure A.7 | Copyright permission for Figure 2.2 to Figure 2.5 and . Ng, B.,
Duan, X., Liu, F., Agar, E., White, R. E., Mustain, W. E. & Jin, X.
Investigation of Transport and Kinetic Nonideality in Solid Li-Ion
Electrodes through Deconvolution of Electrochemical Impedance
Spectra. J. Electrochem. Soc. 167, 020523 (2020). ...................................... 213
Figure A.8 | Copyright permission for Figure 1.8 and Figure 3.1-Figure 3.12.
Ng, B., Duan, X., Liu, F., Agar, E., White, R. E., Mustain, W. E. &
Jin, X. Investigation of Transport and Kinetic Nonideality in Solid
Li-Ion Electrodes through Deconvolution of Electrochemical
Impedance Spectra. J. Electrochem. Soc. 167, 020523 (2020)..................... 213
Figure A.9 | Copyright permission for Figure 5.1 to Figure 5.6. Ng, B., Faegh,
E., Lateef, S., Karakalos, S. G., Mustain, W. E. Structure and
Chemistry of the Solid Electrolyte Interphase on High Capacity
Conversion-based Anodes: NiO. J. Mater. Chem. A, 2021, 9, 523 .............. 214
Figure A.10 | Copyright permission for Figure 6.1 to Figure 6.4. Ng, B.,
Faegh, E., Peng, X., Mustain, W. E. Using nanoconfinement to
inhibit the degradation pathways of conversion-metal oxide anodes
for highly stable fast-charging Li-ion batteries. Journal of Materials
Chemistry A. (2020) 8, 2712-2727 ................................................................ 215
Figure A.11 | Copyright permission for Figure 8.5. Mandal, M., Huang, G.,
Hassan, N. U., Mustain, W. E. & Kohl, P. A. Poly(norbornene)
anion conductive membranes: homopolymer, block copolymer and
random copolymer properties and performance. J. Mater. Chem. A
8, 17568–17578 (2020). ................................................................................ 216

xxv
LIST OF SYMBOLS
𝛼𝑎 anode transfer coefficient
𝛼𝑐 cathode transfer coefficient
𝐴 the surface of the cell exposed to convection
𝐵𝑖 Biot number
𝐶𝑝 specific heat capacity
𝐷 chemical diffusion coefficient
𝑑𝑈𝑑𝑇−1 entropic heat coefficient
𝑒 electric charge constant
𝐹 Faraday’s constant, C/mol
ℎ heat transfer coefficient
Icell applied current, A
I1C the current corresponding to 1C, A
i current density
i0 charge exchange current density
i0S charge exchange current
𝑘 effective thermal conductivity
𝑘𝐵 Boltzmann constant
𝑙𝑝 cathode thickness
𝑙𝑛 anode thickness
ℒ Laplace transform
𝐿 characteristic length
𝑚𝑐𝑒𝑙𝑙 mass of cell
ηIR ohmic losses in electrode and electrolyte, V
ηIR1C ohmic overpotential at 1C, V

xxvi
ηconc concentration overpotential, V
ηCT charge transfer overpotential, V
𝑄𝑐𝑒𝑙𝑙,0 initial state of charge, -
𝑟𝑝 NMC532 particle radius
𝑟𝑛 Graphite particle radius
𝑅 gas constant, J mol-1 K-1
𝑅𝑐𝑒𝑙𝑙 internal resistance of the cell
S electrochemical active surface area
𝑆𝑂𝐶 state of charge
𝑆𝑂𝐶0 initial state of charge
𝜏 diffusion time constant, s
𝑡 pulse time
𝑇 cell temperature
𝑇𝑎𝑚𝑏 ambient temperature, K
𝑇𝑟𝑒𝑓 reference temperature, K
𝑈𝑜 cell open circuit potential, V
𝑉 cell potential, V
𝑉𝑚 molar volume
𝑥 dimensionless position inside the particle (x=0@center, x=1@surface)
𝑧 number of electrons
1
CHAPTER 1: INTRODUCTION TO LI-ION BATTERIES
The global energy consumption and the production of climate changing agents (e.g.
waste heat, H2O vapor, CO2) have skyrocketed in the 21st century.1,2 Of the various forms
of energy conversion, alternative energy (e.g. solar, wind, hydro) is projected to help solve
the energy demands of the future and control emissions from fossil fuels. However, the
intermittent nature of most alternative energy makes their widespread deployment
beholden to energy storage technologies. Among all options, electrochemical energy
storage (EES) devices are widely recognized as being integral to meeting these energy
storage and distribution needs at many scales. This has led to a surge in interest for the
development and optimization of batteries and supercapacitors. Li-ion batteries (LIBs)
have been widely touted as the most promising EES devices because of their high energy
(~250 Wh kg-1), power densities (~500 W L-1), efficiency (~90%), fast charge capability,
and remarkable durability,3–5 which is the reason why LIBs are now implemented in
electrified transportation (e.g. electric cars, electric trucks), portable electronics (e.g.
computer, cellphones, accessories), medical devices (e.g. cardiac pacemaker, artificial
hearts, prostheses), and grid storage.6–9
Of these technologies, electric vehicles (EVs) are pivotal in fostering a cleaner and
sustainable future. In comparison to the standard gasoline-powered internal combustion
engine (ICE) whose energy efficiency is around 20%-35%, EVs can reach efficiencies
greater than 90%. As a bonus, EVs require 50% fewer moving parts which translates to

2
easier maintenance and less costly repairs. The main drawback, however, is the relatively
low energy density of LIBs in comparison to gasoline (12 kWh kg-1), which either increases
the weight and volume of the battery pack (10x heavier and 6-7x greater in volume) or
limits the driving range (<600km). For EVs to push past commercial ICE vehicles, the
energy density must be significantly improved, the pack must have a comparable lifetime,
and the cost ($ kWh-1) must be competitive. The United States Advanced Battery
Consortium has established goals for advanced EV batteries for the year 2023 (Table 1.1).
The USABC develops benchmarking strategies so automobile/battery manufacturers,
government agencies (e.g. U.S. Department of Energy and its National Laboratories),
universities, and other affiliated institutions can have comparable data and a unified
direction for the future of EES devices. To meet these goals, advances are needed at both
the material and system levels (including the battery management system, BMS). To make
such advances, additional fundamental understanding of the limiting factors of component-
level behavior and design is essential.
Table 1.1. | United States Advanced Battery Consortium (USAB) goals for advanced high-
performance batteries for electric vehicle (EV) applications in 202310
End-of-Life (EOF)
Characteristics
System-Level Cell-Level
Specific Energy at C/3 235 Wh kg-1 350 Wh kg-1
Energy Density at C/3 500 Wh L-1 750 Wh L-1
Calendar Life 15 Years 15 Years
Life Cycles 1000 1000
Operating Temperature -40 to +66oC -40 to +66oC
Cost at 100,000 Units $125 kWh-1 $100 kWh-1
Maximum Self-Discharge <1% month-1 <1% month-1
Normal Recharge Time <7 Hours, SAE J1772 <7 Hours SAE J1772
Fast Charge 80% SOC in 15 mins 80% SOC in 15 mins

3
1.1 ELECTROCHEMISTRY OF COMMERCIAL LI-ION BATTERIES
Li-ion batteries are secondary batteries (rechargeable) that traditionally operate
based on intercalation-based materials (i.e. reversible insertion or extraction of Li+ charge
carriers). Figure 1.1 illustrates the electrochemical operating principles of conventional
Li-ion batteries. During the discharge, the oxidation of the negative electrode (e.g. graphite,
Li4Ti5O12) releases electrons (e-), Equation 1.1, which travel through the external circuit
to reduce the positive electrode (e.g. LiCoO2, Li2MnO2). Simultaneously, the migration of
Li+ from the anode to the cathode maintains the charge electroneutrality of the system. A
generic form for the anode reaction is presented in Equation 1.1.
𝐿𝑖𝐶6 𝐿𝑖1−𝑥𝐶6 + 𝑥𝑒− + 𝑥𝐿𝑖+ Equation 1.1
The Li+ migration is facilitated by dissolved charge carriers in the electrolyte. Here,
Li salts, such as LiPF6 LiClO4, or LiBF4, are dissolved in a mixture of ethylene carbonate
(EC), diethyl carbonate (DEC), dimethyl carbonate (DMC), or ethyl methyl carbonate
(EMC). Many cells also introduce small quantities of additives such as vinylene carbonate
(VC) or fluoroethylene carbonate (FEC). When the Li+ ions reach the positive electrode,
standard LiMO2 (where M can be Ni, Co, Mn, or mixed) materials undergo a reduction,
Equation 1.2.
𝐿𝑖1−𝑥𝑀𝑂2 + 𝑥𝑒− + 𝑥𝐿𝑖+ 𝐿𝑖𝑀𝑂2 𝑀 = 𝑁𝑖, 𝐶𝑜, 𝑀𝑛, 𝑜𝑟 𝑚𝑖𝑥𝑒𝑑) Equation 1.2
The overall electrochemical reaction for a modern Li-ion battery is:
𝐿𝑖1−𝑥𝑀𝑂2 + 𝐿𝑖𝐶6 𝐿𝑖𝑀𝑂2 + 𝐿𝑖1−𝑥𝐶6 Equation 1.3
Also, the reaction processes are highly reversible, which makes the charge reaction just
the opposite direction of Equation 1.1 to Equation 1.3.

4
Figure 1.1. | Diagram elucidating the operating principles of a Li-ion battery with the
conventional anode (e.g. graphite, Li4Ti5O12), cathode materials (e.g. LiCoO2, Li2MnO3),
and electrolyte (e.g. LiPF6 in organic carbonates). Reproduced with permission from IOP
Publishing 11
The operating voltage for the overall cell reaction in an operating battery can be
determined by both the thermodynamic limit (Nernstian potential) for the electrochemical
reactions and the net resistive losses (e.g. ohmic, kinetic, mass transfer). Therefore, the cell
operating voltage can be represented as:
𝐸𝑐𝑒𝑙𝑙 = 𝐸𝑜 − [(𝐶𝑇)𝑎
+ (𝐶𝑇)𝑐] − [(𝑀𝑇)
𝑎+ (𝑀𝑇)
𝑐] − 𝑖𝑅𝑖 = 𝑖𝑅 Equation 1.4
where Ecell is the cell-level voltage, Eeq is the cell thermodynamic voltage (𝐸𝑒𝑞 = 𝐸𝑐 −
𝐸𝑎 =−∆𝐺
𝑛𝐹), 𝐺 is the Gibbs free energy of the overall cell reaction, F is Faraday’s constant
(96485.33 C mol-1), ηCTa is the kinetic overpotential for the anode, ηCTc is the kinetic
overpotential for the cathode, ηMTa is the mass transfer overpotential for the anode, ηMTc is
the mas transfer overpotential for the cathode, and iRi is the net ohmic loss due to particle-
particle contact, ionic conductivity (typically dominant) and electronic conductivity.
Higher operating voltages are desired for the discharge process (i.e. higher Gibbs free
energy in the spontaneous direction), whereas lower voltages are desired for the charging

5
(i.e. less energy is required to put energy into the system). One method to increase the
energy is by achieving higher operating voltages for the discharge process (Equation 1.4),
which can be done by increasing the cathode potential and/or decreasing the anode
potential. The other method is to minimize the resistive losses (i.e. ohmic, kinetic, and/or
mass transport), such that the operating voltage approaches the thermodynamic value.
In addition to the cell operating voltages, the overall energy density of the cell is
dictated by the amount of charge that can be stored per unit mass of active material, which
is called the capacity. The capacity for any material – either the anode or the cathode – can
be calculated from Equation 1.5.
𝑄𝑥 =𝑛 𝐹
3.6𝑀𝑊 ; 𝑄𝐶6
=1 (96485.33 𝐶 𝑚𝑜𝑙−1)
3.6 (72.0 𝑔 𝑚𝑜𝑙−1)= 372.2 𝑚𝐴ℎ 𝑔−1 Equation 1.5
where F is Faraday’s constant (96485.33 C mol-1), n is the number of electrons transferred
per mol of reactant, and MW is the molar mass of the active material. Equation 1.5 gives
a representative theoretical calculation for graphite, which can hold one lithium atom per
every six carbon atoms (LiC6), though the practically achievable capacity (because of
resistive losses) is ~330 mAh g-1. Doing the same calculation for a typical cathode
material, LixCoO2 (LCO), yields a value of 273.8 mAh g-1, but LCO is unstable when x <
0.5, resulting in practical capacities of ~140 mAh g-1. The theoretical gravimentric energy
density is defined by the electrochemical voltage of the cell and the specific capacities of
the anode (Qa) and cathode (Qc) and can be determined by the following equation,
𝑇ℎ𝑒𝑜𝑟. 𝐸𝑛𝑒𝑟𝑔𝑦 𝐷𝑒𝑛𝑠𝑖𝑡𝑦 =𝑄𝑐×𝑄𝑎
𝑄𝑐+𝑄𝑎× 𝐸𝑎𝑣𝑔 ; LiC6/𝐿𝑖𝐶𝑜𝑂2 = 354 𝑊ℎ 𝑘𝑔−1 Equation 1.6
where Qc = 140 mAh g-1, Qa = 330 mAh g-1, and the average operating voltage is 3.6V for
a theoretical LiC6/LiCoO2 system. However, this calculation does not provide the true cell-
level energy density, because it does not take the mass of the anode (ma), cathode (mc),

6
electrolyte (me), separator (ms), and packaging material (mp) into consideration. Also, the
negative-to-positive capacity ratio (N/P) is hardly ever unity and typically between 1.03 to
1.2, which increases the amount of inactive mass in the system.12 Thus, the practical cell-
level gravimetric energy density is typically much less than the theoretical value and can
be calculated by the following equation,13
𝐶𝑒𝑙𝑙 − 𝐿𝑒𝑣𝑒𝑙 𝐸𝑛𝑒𝑟𝑔𝑦 𝐷𝑒𝑛𝑠𝑖𝑡𝑦 =𝑄 × 𝐸𝑎𝑣𝑔
𝑚a + 𝑚c + 𝑚e + 𝑚s + 𝑚p Equation 1.7
where the anode and cathode mass quantities include active material, inactive components,
and current collector. In Table 1.2 is a summary of the achieved energy density for
commercial and proposed next-generation Li-based batteries. The gravimetric energy
density of the electrochemical system is one of the most important features because low
battery weight is essential in aerospace, space, wearables, and military applications,14
whereas the volumetric energy density is critical for grid storage and EV applications.
Table 1.2. | Summary of the energy density of commercial and commonly proposed next-
generation Li-based batteries. The calculations are based on an average discharge voltage
reported in Wu et al,15 but in short, the calculation considers 4.5 m thick Al and Cu current
collectors, 9 m separator, and single-sided electrodes with desired volume percentages
based on chemistry (70 vol% for intercalation-materials, 60 vol% for next-generation
electrodes like Si, Li, sulfur – remaining volume contains inactive components like binder,
conductive agents, voids). Note, the calculation also assumes a packaging of 10 wt%.16
System Anode Cathode Avg.
Discharge
Voltage (V)
Volumetri
c Energy
(Wh/L)
Gravimetric
Energy
(Wh/kg)
Commercial LixC6 a
LiCoO2 (layered) a 3.6 737 245
Commercial LixC6a LiMn2O4 (spinel) a 3.8 724 264
Commercial LixC6 a LiFePO4 (olivine) a 3.2 606 241
Next-Gen Si b LiNi0.84Co0.12Al0.04O4 a 3.4 1277 459
Next-Gen Li d LiNi0.84Co0.12Al0.04O4 a 3.7 1363 541
Next-Gen Li d Li2S/Sulfur c 2.15 1066 904 a intercalation mechanism b alloying mechanism c conversion mechanism d plating/stripping mechanism

7
1.2 INTERCALATION REACTION MECHANISMS
Intercalation reactions are by far the dominant reaction mechanism in both the
anode and cathode of commercial LIBs. In the case of graphitic anodes (theoretical
capacity = 372 mAh g-1), the electrochemical insertion of Li into the inner structure of
graphite occurs through multiple stages (LiCx) based on thermodynamic stability. Figure
1.2 illustrates the atomic structures of various stages (designated stage-n or # of layers) in
Li-intercalated graphite. In general, Li intercalates into the interstitial sites between
graphite layers in a dilute formation and stabilized by the introduction of an electron to the
sp2 ring of graphite – resulting in a highly reversible reaction.17 Driving up the Li-
concentration in the electrolyte results in the formation of the stage-4 structure for the
intercalated compound, and further increasing the Li-concentration leads to the transition
towards the dilute stage-3 structure. Electrochemical intercalation can force the dilute
stage-3 structure to stage-2 (LiC18) and further reduction can result in a two-phase
transition (filled stage-2 LiC12 and saturated concentration stage-1 LiC6 structure).
Therefore, based on the fundamental reaction, only one Li atom can be stored for every
six-carbon repeat unit, which gives rise to the a relatively theoretical limit of 372 mAh g-1.
Other commercialized anode materials, such as lithium titanate (LTO, Li4Ti5O12), also
follow intercalation mechanisms, but their higher density and larger unit size than graphite
drive their capacity down even further. For example, the theoretical capacity of LTO is
only 175 mAh g-1. This means that despite LTO being a very stable anode, it cannot be
used in applications where high energy density is required.

8
Figure 1.2. | Atomic structure of Lithium intercalation in graphitic carbon (LiCx) and
showing, (a) the top view, (b) side view of stage-2 LiC18, (c) top view, (d) side view of
stage-3 LiC18, (e) LiC12, and (f) LiC6. Reproduced with permission from IOP Publishing.17
At the cathode, intercalation compounds are also used. The most common
materials are metal oxides with the general formula LixMO2 where M = Mn, Ni, Co, Al.
Typically, M is a mixture of most or all of these elements. For example, a very common
material is LixNi0.5Mn0.3Co0.2O2 (also called NMC532). These LixMO2 typically have a
layered crystal structure. The close-packed O-framework shared with metal forms MO2-
sheets that enables the transfer of Li into and out of the crystal structure. Variations in the
interstitial sites are typically designated with a letter that indicates the coordination (O, P,
or T) and a number that reveals the number of layers. The majority of Li-intercalation

9
cathodes are O1 and O3, which means Li is octahedrally coordinated to an anion every
layered repeat unit or structured with an AB CA BC framework.18 Also, disordered rocksalt
and spinel crystallographic structures are related to the O3 structure (LiMnO2 and
Li0.5CoO2) but differ in the Li and M cation arrangement and can be seen in Figure 1.3.
However, in these materials, the large repeat groups and the fact that these materials
collapse when too much Li is removed, severely limits the achievable capacity to only 140-
220 mAh g-1.
Figure 1.3. | Comparison of layered, disordered rocksalt, and spinel cation ordering.
Reproduced with permission from John Wiley and Sons18

10
1.3 AGING MECHANISMS AND TEMPERATURE EFFECTS IN LIBS
One of the most important concepts in LIBs is the formation of the solid electrolyte
interphase (SEI) and its role in battery performance. Electrodes with redox potentials
(graphite, Si, Li-metal) within the reactive region of the electrolyte (i.e. lowest unoccupied
molecular orbital or LUMO of the electrolyte is at a higher energy state than the Fermi
energy of the anode) like Li/Li+ will reduce the electrolyte to semi-stable compounds to
form the SEI. Likewise, electrolyte oxidation can occur on the cathode-side, if the HOMO
of the electrolyte is lower in free energy than the electrode Fermi level, leading to electron
transfer. The common consensus19–22 is a stratified film for the SEI, which is composed of
a densely-packed inorganic inner layer (i.e. directly at the electrode interface and consists
of Li2CO3, LiF, Li2O) and a porous organic layer consisting of semi-carbonates and
polyolefins. The SEI formation process is detrimental to cell performance since it
consumes active Li and electrolyte-components (i.e. ethylene carbonate), which leads to
capacity loss, resistance build-up, and poor power density.
The temperature plays a significant role in the performance of the cell. Elevated
temperatures can temporarily result in a higher achievable capacity due to the improved
kinetics and mass transport but can also trigger degradation reactions (represented in
Figure 1.4). Long term operation at high temperatures causes thickening of the SEI
(increased interfacial impedance), electrolyte decomposition (reduction in ionic
conductivity), and undesirable SEI compositional change (loss of elastic organic
components and generation of brittle inorganics). Electrolyte decomposition reactions can
also release gasses that alter the electrode morphology and decrease the safety of the cell.
At the cathode side, metal dissolution can occur at elevated temperatures causing

11
irreversible cathode damage. Subsequently, the metal ions migrate to the anode and can
integrate itself into the SEI, generating a conductive pathway, or even catalyze the
destruction of the SEI. At low temperatures, the impedance drastically increases due to
hindrance in charge transfer and contributions from both the SEI and electrolyte. Also, the
solid-state diffusivity of Li+ into graphite plummets severely at 0oC.23 As a result, severe
polarization of the electrode occurs and enables the deposition of high surface area Li-
metal, which is then prone to severe corrosion (i.e. severe safety risk), as well as dendrites.
Figure 1.4. | Depicts the instability of the anode interface under high and low temperatures.
High temperatures can result in (a) deterioration of the SEI, (b) decomposition of the
electrolyte and release of gas, (c) transition metal dissolution from cathode and reaction at
anode, (d) severe chemical changes to the SEI. Low temperatures can cause (e) severe
anode polarization to drive Li-plating, and (f) reduced reaction kinetics and increase in SEI
resistances. Reproduced with permission from Macmillan Publishers Ltd23

12
The standard cathodes (layered, spinel, and olivine) used in commercial LIBs are
phase-dependent and operate based on a highly ordered insertion and extraction of Li+ ions.
High-temperature operation with these cathodes can lead to accelerated metal dissolution,
crystallographic disorder, and oxygen evolution – resulting in severe performance
degradation due to loss of active material and destabilization of the structural composition
(represented in Figure 1.5). The release of oxygen can also lead to electrolyte combustion
and thermal runaway, which causes catastrophic cell failure. At low temperatures (<0oC),
the cathode performance is hindered by slow charge transfer and poor solid-state diffusion
of Li+ in the cathode - which leads to severe polarization of the electrode and anisotropic
lithiation processes at low temperature both on a particle-level and on an electrode-level
(later discussed in Chapter 4).
Figure 1.5. | Depicts the instability in the structure of cathode materials at different
temperatures (red = high T and blue = low T). The cathodes include (a) LiCoO2, (b)
LiNi1/3Mn1/3Co1/3O2, (c) spinel LiMn2O4, and olivine LiFePO4. Reproduced with
permission from Macmillan Publishers Ltd23

13
1.4 CAPACITY LIMITATIONS WITH INTERCALATING MATERIALS IN LIBS
The selection of anodes and cathodes has not changed significantly over the years
(e.g. anode = graphite, Li4Ti5O12 or LTO, cathode = LixMO2). This has some negative
consequences. Consider the anode. Yes, the most common anode, graphite, has high
natural abundance, is easy to process and manufacture, and has a high cycle life. As
mentioned earlier, LTO has ultra-high stability and cycle life. However, both anodes use
intercalation reactions to store charge, severely limiting their theoretical capacities
(graphite = 372 mAh g-1, LTO = 175 mAh g-1). Existing cathodes are even worse. Though
commercial cathodes are reversible over a large number of cycles and have low self-
discharge properties, their achievable capacities are only 140 mAh g-1 (LiCoO2) to 220
mAh g-1 (LiNi0.8Co0.15Al0.05O2). Also, Co-based cathodes are expensive.6 The low
capacities of these materials and high cost translate to a material that cannot meet the
demands of the future. To enable the widespread adoption of battery EVs, the driving range
must exceed 500 km (300 miles) with affordable prices that are <$40,000 (battery energy
density 350Wh kg-1/750 Wh L-1 with a battery pack cost of $125 kWh-1).24 This means that
new materials must be developed at the anode and cathode side to enable emerging
applications that seek to use LIBs.
1.5 SELECTION OF NEXT-GENERATION BATTERY MATERIALS
There is a need to develop reliable and energy-dense materials for LIBs that can
operate under extreme conditions (i.e. low T, high T, fast charge) and over long operational
life. Regarding materials, a portion of this thesis will focus (in Chapters 5-6) on the
development of new high energy density anode materials. Though graphite has been the

14
standard Li-ion battery anode for decades, it has three undesirable properties. First, as
discussed above is the intercalation storage reaction, leading to low capacity (372 mAh/g).
Second, graphite intrinsically has a low thermodynamic redox potential, which can lead to
Li-plating, dendrite formation, thermal runaway, and thermal propagation over repetitive
fast charging cycles (5-10C). Third, is attributed to graphite’s fundamental inability to
perform well at low temperatures (i.e. stage transformation is hindered by poor-diffusion
of Li into the bulk and sluggish transfer through the SEI layer) and at high temperatures
(i.e. anode potential is deep in the instability range of the electrolyte, leading to overgrowth
of the SEI). Therefore, the development of any advanced material for the LIB anode must
address all of these issues.
Li-metal has been proposed as the “holy grail” of anode materials due to its
extremely high theoretical capacity (3860 mAh g-1) and low electrochemical potential
(-3.04V vs SHE). Despite these seductive properties, Li-metal is known to have poor
coulombic efficiencies (𝑄𝑑𝑖𝑠𝑐ℎ𝑎𝑟𝑔𝑒
𝑄𝑐ℎ𝑎𝑟𝑔𝑒) due to severe corrosion of high surface area Li
electrodeposits – leading to continuous electrolyte decomposition (SEI formation) and
consumption of the finite reserve of active material and electrolyte. Also, Li-metal is
known to cause severe gassing, which can drastically increase the internal pressure of the
cell (i.e. overpressurization). Constant Li redeposition also causes dendrites that can lead
to internal short circuits and possibly thermal runaway.25–29
High-capacity alternatives to metallic Li include alloying materials (Si, Ge, Sn, Sb).
Their capacities typically range from 1600-3800 mAh g-1, which is very good. However,
for the host to store that much charge, the material must expand, with typical values being
more than 250% from its original volume. As a result, anode electrodes deploying these

15
materials tend to undergo severe structural change that leads to electrode pulverization (i.e.
cracking) and delamination (i.e. electronically detached from the current collector). This
is not good for LIB operation. Fortunately, other alternatives exist, such as metal fluorides,
nitrides, phosphides, hydrides, and oxides. As shown in Figure 1.6, these materials tend
to have a capacity between 600– 1000 mAh/g. These alternatives all tend to store charge
through conversion-based mechanisms such as the one depicted in Figure 1.7. These
conversion-based materials leverage the breakage of bonds to store significantly more
electrons per unit mass. The general reaction for a conversion-based electrode is shown in
Equation 1.8,
Mαμ+
Xβπ− + βπ(Li+ + e−) αM + βLiπX Equation 1.8
Of the conversion anodes, metal oxides (MOs) offer distinct advantages over
alloying materials such as: i) a redox potential around 1V vs Li/Li+, which means it is
thermodynamically less favorable for Li deposition to occur during rapid recharge or low
temperature than it is with a graphite anode; ii) a volumetric expansion that is considerably
less than other high-capacity materials like Si (60% vs 400%); iii) and their capacities are
several times greater than graphite. NiO has been a widely used conversion MO in LIBs.
Its overall reaction is given by Equation 1.9:
𝑁𝑖𝑂 + Li+ + e− Ni + Li2𝑂 Equation 1.9
NiO has a theoretical gravimetric capacity of 718 mAh g-1 and a very high density
(6.67 g cm-3), which makes it an attractive material for both gravimetrically and/or
volumetrically-constrained applications (e.g. space applications, electrified transportation,
wearable electronics).32

16
Figure 1.6. | Anode selection list and their theoretical capacities. Reproduced with
permission from Royal Society of Chemistry.30
Figure 1.7. | Depicts the conversion reaction mechanism with MF3 as a representative
material. The conversion process involves limited diffusion of the anion (e.g. F, O, N, P,
etc.) to react with the Li+ during charge which generates metal (M) crystals and LiX.
Reproduced with permission from Macmillan Publishers Ltd31

17
Despite these positive attributes, untailored NiO (raw or simple formulations with
conductive carbon) is severely hindered by very poor cycle performance (~20 cycles results
in 40-80% capacity loss)33,34 and poor rate capability, which is typically attributed to the
intrinsically low conductivity (~10-4 to 10-5 Ω-1 cm-1)34 and the repetitive volumetric
expansion/contraction during charge/discharge.32 However, this explanation only scratches
the surface of what causes poor cycle performance and rate capability in NiO. Thus, near-
elementary steps that occur during the NiO conversion reaction are provided in Equation
1.10 through Equation 1.15 in Table 1.3, which is a combination of the work by Palmieri
et al.34, Jow et al.35, and Soto et al.36 and applied in Ng et al.37 During the charge
(reduction), Li desolvation occurs at the SEI/bulk electrolyte interface and then undergoes
inclusion into the SEI.38 The propagation of LiSEI+ through the SEI migrates to the bulk NiO
(≡NiO-NiO) interface to form a ≡NiO-NiO-Li junction.35,37 Next, oxygen displacement
occurs to form an ≡NiO-Niads+ LiOads
− . Thermodynamically, Li2O exists at a lower energy
state which makes the chemical reaction of LiSEI+ and ≡NiO-Niads
+ LiOads− highly favorable
and represented in Equation 1.14.34 During the nucleation event, the oxygen vacant
≡NiO-Niads+ reduces to ≡NiO-Ni. Based on the minimization of surface free energy (σNi >
σLi2O), any Ni that exists on the surface of the nucleation platform will exhibit a driving
force for spontaneous rearrangement, and Li2O or other low surface free energy materials
will phase segregate to the surface.39 Li2O has extremely low electronic conductivity,
which can lead to increased kinetic and Ohmic resistances in the cells.

18
Table 1.3. | Reaction description and mechanism for the transport of Li+ from the bulk
electrolyte to the conversion of NiO to Ni
Description Reaction Mechanism Equation
Li desolvation at the SEI/bulk
electrolyte interface Lisolvated
+ Li+ Equation 1.10
Li transport through the SEI Li+ + ≡SEI LiSEI+ Equation 1.11
Junction Formation LiSEI+ + ≡NiO-NiO + e− ≡NiO-NiO-Li Equation 1.12
Displacement ≡NiO-NiO-Li ≡NiO-Niads+ LiOads
− Equation 1.13
Li2O Formation ≡NiO-Niads+ LiOads
− + LiSEI+
≡NiO-Niads+ + Li2O
Equation 1.14
Ni nucleation ≡NiO-Niads+ + e- ≡NiO-Ni Equation 1.15
≡ Denotes bulk material
In addition, during charge/discharge cycling electrochemical Ostwald ripening can
result in the formation of larger crystals, which can lead to the growth of particles and a
decrease in charge carriers at the electrochemically active sites.39 The Ni-core of large
crystals can therefore become electrically and ionically isolated (via a large Li2O and NiO
shell) and lead to trapped Ni metal within the bulk material.40 Furthermore, the destabilized
oxygen balance due to the spontaneous phase segregation of Li2O leads to higher interfacial
oxygen content within the Ni agglomerates, and promote the evolution to higher oxidation
states (Ni2+ →Ni3+) during the discharge (oxidation) 34,41,42. When the electron flow
switches during charge (reduction), the unstable higher oxidation states (Ni3+) can react
with the SEI and/or electrolyte resulting in exposed reactive sites or irreversible
consumption of active components.
Spinner et al. 40 were one of the first groups to use identical-location transmission
electron microscopy (IL-TEM) to explore how degradative processes evolve over the
course of a few cycles and found that untailored NiO undergoes rapid structural
degradation. Pre/post cycled X-ray diffraction (XRD) studies suggest that on a bulk-scale,
the severe performance loss is attributed to NiO becoming trapped in the charged state. The

19
study continued to probe the interface of NiO via IL-TEM, and found that the structural
degradation resulted in continuous merging and growth of active particles. Also, small and
low/dark transmission particles (Z contrast) were discovered inside the SEI. The SEI is
known to have electronic insulating properties, which can fully disconnect a NiO/Ni
particle from the current collector, leading to loss of active material. As a result, severe
capacity loss over limited cycles (<20 cycles) was observed. In another study with in-situ
TEM, Su et al.43 found two dominant modes for MOs, 1) a violent reaction mode where
agglomeration of small particles happens very fast (1-2mins), and 2) a gradual reaction
mode where phase separation of MOs form core-shell like particles with multiple domains
consisting of M, MO, and Li2O – which expands the discoveries of Spinner et al.40
Another concern of conversion electrodes is the large voltage hysteresis (i.e. the
gap between the charge-to-discharge voltage), which ranges between several hundreds of
mV to ~2 V,44 which limits the energy efficiency of the system. Li et al. 44 used a
combination of X-ray absorption spectroscopy (XAS), TEM, density functional theory
(DFT), and galvanostatic intermittent titration technique (GITT) to elucidate the root cause
of large voltage hysteresis in conversion-based materials and found that FeF3 in a 1M LiPF6
EC/DMC (1:1 volume ratio) electrolyte exhibits a fairly low iR drop but the overpotential
required for nucleation, growth of phases, mass transport, and charge transfer between the
Fe/LiF phases is quite large (spans up to 300mV for the FeF3→Fe/LiF charge and ~70mV
for the Fe/LiF →FeF3 discharge). Another consideration that was proposed is the spatial
distribution of each phase, which either facilitates or restricts access to Li+ and e-. In their
observation from in-situ TEM, a core-shell behavior was found for the active material
during lithiation (i.e. intermediate FeF2 core with a Fe/LiF shell in contact with the

20
electrolyte and conductive agents. During the delithiation, the core-shell reaction proposed
by Li et al. 44 reverses with intermediate FeF2 covering the reaction surface, which is
electrically and ionically insulating. Their conclusion for the large voltage hysteresis for
conversion based FeF3 is based on comparing similar SOCs, and how an intermediate FeF2
surface (Li-poor) and a Fe/LiF surface (Li-rich) will set the electrochemical system to
different potentials vs Li/Li+ (i.e. compositional inhomogeneity can result in ~400 mV).44
Next, the evolution to higher oxidation states is an intrinsic barrier to conversion-
based transition metals. Transition metals can occupy multiple oxidation states (+1, +2, +3,
+4, +7, etc.), which can either alter the system chemistry (i.e. destabilizing the counter-ion
balance in the system) or introduce instability to the system (i.e. decomposition of SEI or
electrolyte). Palmieri et al41,45 discovered the effects of higher oxidation states, by using a
Mn-based oxide (MnxCo1-xO) as the system of interest and conducting cyclic voltammetry
(CV) for different oxidation states of Mn-oxides. First, the CV study found mixed cathodic
peaks that are present and ascribable to Mn3O4. Second, pre- and post-cycled X-ray
photoelectron spectroscopy (XPS) was used to corroborate the electrochemical data and
found that the deconvolution of the Mn 2p region, resulted in peaks that are attributed to
Mn3O4 (mixed oxidation state of +2 and +3) and MnO (+2). The study proposed three
possible root causes: 1) Mn3O4 formation coupled with the emergence of oxygen
vacancies 46; 2) MnO reacts with oxygen-species (e.g. SEI components, electrolyte) to
either attack the SEI and form reactive pockets or direct facilitation of the SEI growth; and
3) the reactant dynamics are very high leading anisotropy in local stoichiometries and
kinetically favoring the formation of higher oxidation states.

21
Cumulatively, the performance limitations of conversion-based materials can be
broken down into four key mechanisms:
1. Metal (charge) trapping within the SEI causes rapid loss of active material
2. Particle agglomeration and compositional inhomogeneity results in larger
overpotentials that limits accessible capacity within a fixed voltage range
3. Destabilized oxygen balances and the reaction with the electrolyte or SEI leads to
uncontrolled growth of the SEI and impacts the coulombic efficiency
4. The transition of active material to higher oxidation states reduces the coulombic
efficiency
Much effort has been devoted to either eliminating the root cause or controlling the
effects of degradation. One of which is regulating the key conductance parameters
(interparticle and intraparticle conductivity), which has been proposed in the literature to
have numerous benefits including: 1) minimization of the resistive losses within the cell,
which enables higher achievable energy-densities and faster rate-capabilities; and 2)
strategic control of ions and electrons that can minimize degradative processes within a
cell (i.e., uniform ion flux and current densities can result in more homogenous reaction
fronts). Inter-particle conductivity via the addition of either carbon black, graphene or
carbon nanotubes has been shown to drastically improve the performance of MO anodes.
Palmieri et al34,42 found that there is a direct correlation between the inter-particle electronic
conductivity and the stable capacity (log-log linear relationship), a correlation between the
enhancement of the intra-particle electronic conductivity to the evolution to higher
oxidation states (i.e. attenuation of large particle-level polarizations), and more stable cycle
performance.

22
These degradative processes that are intrinsic to conversion-based materials are
further investigated in Chapter 5, and methods to circumvent these them are studied in
Chapter 6 for the development of next-generation LIBs.
1.6 THEORETICAL FRAMEWORK FOR UNDERSTANDING THE
PERFORMANCE AND LOSS MECHANISMS OF LI-ION BATTERIES
The electrochemical mechanisms for the materials in the LIB anode and cathode
were discussed in the previous sections. However, that alone does not describe the
behavior of the electrochemical system as a whole. In this section, fundamental
relationships describing the thermodynamics, kinetics, and mass transfer of species in an
operating Li-ion battery are discussed. The goal here is to develop a framework that will
be used in Chapters 3 and Chapter 4 to understand the cell-level and material-level
properties, performances, non-idealities, and loss mechanisms.
1.6.1 NONEQUILIBRIUM THERMODYNAMICS OF A CONCENTRATED SOLID SOLUTION
Nonequilibrium thermodynamics47 captures the evolution of energy states with the
assumption that the system proceeds through small perturbations from equilibrium, such
that the changes can be linearized, and requires the system to be a reversible process. The
chemical potential defines the differential energy of the system for a given change in the
number of particles and can be defined in terms of state variables of the system by a
Legendre transformation of the Gibbs-Duhem equation (e.g. internal energy, Helmholtz
free energy, enthalpy, and internal energy):48
𝜇𝑖 = (𝜕𝐺
𝜕𝑛) |𝑇,𝑃,𝑛𝑗≠𝑛𝑖
Equation 1.16

23
Therefore, the chemical potential (𝜇𝑖) relates the change in energy of the system to
the change in the number of the specified species, and when the other species within the
system remains constant. In other words, the transition from one state to another at
equilibrium must have an energy change of zero - the definition must hold for the rate
equation. The chemical potential of a species in a solid solution is defined as:
𝜇𝑖 = 𝑘𝐵𝑇 𝑙𝑛 𝑎𝑖 + 𝜇𝑖0 Equation 1.17
where the activity can be further broken down via:
𝑎𝑖 = 𝑐𝑖𝛾𝑖 Equation 1.18
Here, ci denotes concentration, 𝛾𝑖 represents the activity coefficient for additional
non-ideal effects, 𝜇𝑖0 is defined as the reference chemical potential where 𝛾𝑖 = 1; kB is
Boltzmann constant; T is temperature. The activity considers the concentration effects and
non-ideality.
1.6.2 DIFFUSIVITY: MODIFIED FICK’S LAW
Using the definition of the chemical potential, along with the general state energy
diagram in Figure 1.8, random walk diffusivity of a species diffusing through a medium
can be expressed as49:
𝐷𝑖 =(𝛥𝑥)2
2𝜏0 𝑒𝑥𝑝((𝜇,𝑖𝑇𝑆−𝜇𝑖)
𝑘𝐵𝑇)
=(𝛥𝑥)2
2𝜏0
𝛾𝑖
𝛾𝑖,𝑇𝑆= 𝐷0
𝛾𝑖
𝛾𝑖,𝑇𝑆 Equation 1.19
Here, 𝛥𝑥 is the average step length (i.e. the distance of one diffusive hop); 𝜏0 is the
time between barrier-less transitions; 𝛾𝑖 = 𝑒𝑥𝑝 (𝜇𝑖−𝜇𝑖
0
𝑘𝐵𝑇) and 𝛾𝑖,𝑇𝑆 = 𝑒𝑥𝑝 (
𝜇𝑖,𝑇𝑆−𝜇𝑖,𝑇𝑆0
𝑘𝐵𝑇) are the
activity coefficients of the diffusing particle in the inactivated and the transition (activated)
states, respectively. Essentially, the excess chemical potential drives the random walk

24
diffusion (making it not just dependent on temperature and entropic effects), which can be
determined by equating the squared distance of a diffusive hop to the probability for a
particle to translate in the positive direction (factor of two) and the mean time for each
transition. The diffusion flux of a species can then be calculated by47:
𝐹𝑖 = −𝐷𝑖𝑐𝑖
𝑘𝐵𝑇
𝜕𝜇𝑖
𝜕𝑥= −𝐷0
𝛾𝑖
𝛾𝑖,𝑇𝑆(1 +
𝜕 𝑙𝑛 𝛾𝑖
𝜕 𝑙𝑛 𝑐𝑖) 𝛻𝑐𝑖
Equation 1.20
Equation 1.20 can subsequently be further generalized as,
𝐹𝑖 = −𝐷𝑐ℎ𝑒𝑚𝛻𝑐𝑖 Equation 1.21
where 𝐷𝑐ℎ𝑒𝑚 is referred to as the chemical diffusivity and decomposed as49:
𝐷𝑐ℎ𝑒𝑚 = 𝐷0𝐴𝐷 Equation 1.22
Here, pre-factor AD is defined, which collectively includes all the terms related to activity
coefficient,
𝐴𝐷 =𝛾𝑖
𝛾𝑖,𝑇𝑆(1 +
𝜕 𝑙𝑛 𝛾𝑖
𝜕 𝑙𝑛 𝑐𝑖) Equation 1.23
For a dilute solution, Fick’s Law can be recovered from Equation 1.20 when the
activity approaches the actual concentration (𝑎𝑖 → 𝑐𝑖), the activity coefficient of the
transition (activated) state approaches one (𝛾𝑇𝑆 → 1), and the pre-factor is equal to one
(𝐴𝐷 = 1). For Li-ion diffusion in the solid electrode, Fick’s Law has been widely used,
where Dchem is assumed to be a constant. However, as reported from experimental results50,
the diffusivity obtained using Fick’s Law varies significantly as a function of SOC. Since
the Li-ion concentration xLi changes substantially over the SOC range during
charge/discharge, the dilute solution assumption breaks down, especially at high Li-ion
concentration51. Therefore, the inclusion of the activity coefficient term 𝐴𝐷 becomes
critical in correlating the diffusivity of Li-ion with SOC.

25
Figure 1.8. | Typical energy landscape (a) diffusion; (b) reaction.49
1.6.3 REACTION KINETICS: MODIFIED BUTLER-VOLMER EQUATION
For the charge transfer reaction at the interface between the liquid electrolyte and
solid electrode:
𝐿𝑖+ + 𝑒− 𝐿𝑖 Equation 1.24
The electrochemical potentials of each species are represented as:
𝜇𝐿𝑖+ = 𝜇𝐿𝑖+0 + 𝑘𝐵𝑇 𝑙𝑛 𝑎𝐿𝑖+ + 𝑒𝜙𝑖 Equation 1.25
𝜇𝐿𝑖 = 𝜇𝐿𝑖0 + 𝑘𝐵𝑇 𝑙𝑛 𝑎𝐿𝑖 + 𝑒𝜙𝑠 Equation 1.26
𝜇𝑒 = 𝜇𝑒0 − 𝑒𝜙𝑠 Equation 1.27
where, i and s denote liquid phase and solid phase; e is the elementary charge on an
electron, 1.6×10⁻¹⁹C; is the electric potential. At equilibrium, the sum of the chemical
potentials on each side of Equation 1.24 are equal, and:
𝜇𝐿𝑖+ + 𝜇𝑒 = 𝜇𝐿𝑖 Equation 1.28
The equilibrium potential, eq, between the Li+ and Li (𝛥𝜙𝑒𝑞 = 𝜙𝑠 − 𝜙𝑖) can be
related to the activity of the reacting species by the Nernst Equation:
𝛥𝜙𝑒𝑞 = 𝑉0 +𝑘𝐵𝑇
𝑒𝑙𝑛
𝑎𝐿𝑖+
𝑎𝐿𝑖
Equation 1.29

26
where 𝑉0 =−𝜇
𝐿𝑖+0 +𝜇𝐿𝑖
0 +𝜇𝑒0
𝑒. To model the charge transfer reaction for a nonideal solution, the
activity of the reactants and products needs to be accounted for, and the transition state
needs to be considered. Here, state 1 is Li+ and an electron, and state 2 is the Li in the active
material. The potential of the transition state is the linear combination of the two present
potentials,
𝜇𝑇𝑆 = 𝜇𝑇𝑆0 + 𝑘𝐵𝑇 𝑙𝑛 𝛾𝑇𝑆 + 𝛼𝑒𝜙𝑠 − (1 − 𝛼)𝑒𝛥𝜙 Equation 1.30
The coefficient α denotes the symmetry of the transition state. A general reaction
rate for species proceeding between two states, denoted 1 and 2, can be represented by:
𝑟 = −𝑘0 [𝑒𝑥𝑝 (−(𝜇𝑇𝑆−(𝜇
𝐿𝑖++𝜇𝑒))
𝑘𝐵𝑇) − 𝑒𝑥𝑝 (−
(𝜇𝑇𝑆−𝜇𝐿𝑖)
𝑘𝐵𝑇)]
Equation 1.31
where the reaction rate is defined in units of t-1, attempt frequency is ko, 1 is the chemical
potential of state 1, 2 is the chemical potential for state 2, 𝜇𝑇𝑆 − (𝜇𝐿𝑖+ + 𝜇𝑒) is the
forward reaction energy barrier, and 𝜇𝑇𝑆 − 𝜇𝐿𝑖 is the reverse reaction energy barrier.
Defining another pre-factor, Ak and expressed as,
𝐴𝑘 =𝛾𝑂
(1−𝛼)𝛾𝑅𝛼
𝛾𝑇𝑆
Equation 1.32
After plugging in 𝜇𝑇𝑆 and 𝛥𝜙𝑒𝑞 from Equation 1.30 and Equation 1.29, the
reaction rate equation becomes49:
𝑟 = 𝑘0𝑐𝑂(1−𝛼)𝑐𝑅
𝛼𝐴𝑘 [𝑒𝑥𝑝 ((1 − 𝛼)𝑒𝜂
𝑘𝐵𝑇) − 𝑒𝑥𝑝 (−
𝛼𝑒𝜂
𝑘𝐵𝑇)]
Equation 1.33
where 𝑘0 = 𝑘0 𝑒𝑥𝑝 ((1−𝛼)(𝜇
𝐿𝑖+0 +𝜇𝑒
0)+𝛼𝜇𝐿𝑖0 −𝜇𝑇𝑆
0
𝑘𝐵𝑇), 𝜂 = 𝛥𝜙 − 𝛥𝜙𝑒𝑞, and 𝛥𝜙 = 𝜙𝑠 − 𝜙𝑖; k0 is
the attempt frequency. The reaction rate Equation 1.33 recovers the Butler-Volmer
Equation in Newman’s model for dilute solutions with 𝛾𝑂 = 𝛾𝑅 = 𝛾𝑇𝑆 = 1 and 𝐴𝑘 = 1.

27
The pre-factor 𝐴𝑘 affects the interfacial reaction rate constant for concentrated solutions
over the whole SOC range.
As a result, a modified porous electrode theory for a LIB is presented in this
section, which combines the Butler-Volmer equation with concentrated solution theory
and standard porous electrode theory equations. The derivation here will later be used in
Chapter 3 for studying non-ideality in electrochemical impedance spectroscopy (EIS)
data for a Li(Ni0.5Mn0.3Co0.2)O2 system at various SOC.

28
CHAPTER 2: DECONVOLUTION OF THE THERMODYNAMIC,
KINETIC, AND TRANSPORT PROPERTIES FROM COMMERCIAL
LARGE FORMAT LI-ION BATTERIES
Multi physics-based Li-ion battery models, developed by Newman’s group, use
partial differential equations (PDEs) to describe the interfacial transport of charge carriers
(e.g. electrons, ions, holes) and reactants across the solid/liquid interfaces of LIB cells.52,53
In addition, LIBs under different operating conditions (e.g. high current, temperature
variations) and cell configurations (e.g. 18650 cylindrical, prismatic, coin cell) lead to
anisotropic distributions of voltage, temperature, and concentration.54,55 Newman’s
pseudo-2D (P2D) models can describe complex behaviors inside LIBs. However, solving
the P2D model equations requires complex mathematical solvers. In addition to the
electrochemical model, a generic thermal model was proposed by Bernardi et.al that
utilized a general energy balance to determine the heat generation and temperature
distribution within battery systems. Electrochemical-thermal coupled (ECT) models56–59
have been developed to predict temperature effects on the capacity fade, performance, and
the dynamic response of LIBs (e.g. pulse charge/discharge driving cycles). In general, ECT
models follow two primary approaches: discrete or homogenous.60 The main tradeoffs
between the two ECT approaches are accuracy and speed (i.e. discrete ECT has greater
temperature accuracy but homogeneous ECT has faster computational speed).
Furthermore, the parameters that describe the multi-dimensional and multi-physics

29
behavior inside LIBs need to be extracted experimentally61, fitted empirically62, or
determined by ab initio calculation63. Approximately 40 parameters need to be determined,
which decreases the model flexibility when considering one LIB chemistry versus another.
There are modeling strategies in the literature for reducing P2D models to a model that
consists of only ODEs.64 However, many of these reduced-order models (ROMs) consist
of overly complex mathematical artifices and transformations (i.e. parabolic profile
estimation65,66, state-space67, Padé approximation68,69, orthogonal decomposition70), which
require further development and optimization to convert into code for BMS
implementation.67
At low-to-moderate current densities, the current distribution throughout the LIB
electrodes is essentially homogenous and the reactant concentration gradients are
negligible. Under these conditions, the P2D model can be simplified to a single particle
model (SPM), which idealizes the respective electrodes as a single porous and spherical
particle.54,71 Both P2D and SPM models need many parameters (P2D ≃40 and SPM ≃22)
to describe the electrodes, separator, and electrolyte properties, which can either be
obtained from experiments or data fitting. The key problem in experimentally derived
parameters is the destructive and invasive nature of the extraction procedure (e.g. cell-
teardown and reassembly). The experimental determination of model parameters can be
very complex, and hence there have been very few studies focusing on combined modeling
and experimental work of full-cells.72,73 It has been shown that it is possible to measure
and combine the properties of each electrode and compare with the measurements
performed on the full cell, which opens a new way of modeling Li-ion cells, without the
need for complex experimentation. Verma et. al50 was able to use galvanostatic

30
intermittent titration technique (GITT) to characterize the kinetic and transport properties
of NMC532 and coupled the results with both SPM and P2D models. A surface roughness
factor was incorporated to model the alterations in electrode/electrolyte interfacial area,
diffusion coefficients, and exchange current densities. However, the computational load
of P2D and SPM models, with a large number of parameters, can be exhaustive and require
fine meshes to predict the concentration and voltage gradients.74 Therefore, alternative
modeling strategies that require fewer parameters and computational load are more
advantageous for a BMS. Lower-dimensional or nondimensional models are traditionally
evaluated with equivalent circuit models (ECM) (e.g. resistors, capacitors, inductors),
which cannot be directly linked to any specific chemical/physical process inside a LIB.
Hence, SPMs are preferred over ECMs in situations where computation power is limited,
such as in a BMS, though a model that can capture the battery behavior with few parameters
without losing connection to the physical world is much preferred. It would also be
advantageous if the experimental parameters could be determined without being
destructive to the cells/stacks.
To model a full-cell without the invasiveness of disassembling a full-cell and
without needing to know the chemistry, a simplified numerical electrochemical-thermal
battery model is presented in this section. The model requires only four parameters that
need fitting/experimental measurements (later extracted in Section 2.2 and will be
implemented in Section 2.3.2): the exchange current (i0S), the diffusion time constant (τ),
the internal resistance (RIR), and the entropic heat coefficient (dUdT-1). The model is semi-
empirical and based on a lumped model developed by Ekström et al74 using the diffusion
time constant (τ). The model presented consists of one PDE which solves the SOC equation

31
for the LIB full-cell, but in this section, the State Space approach is used to further reduce
the PDEs to ODEs for rapid model calculation. The higher computational speed and model
simplification to ODEs makes implementation in BMS chips more facile. In addition to
this mathematical reduction, a thermal model is also coupled to the lumped model for
evaluating the temperature and heat generation. For simplicity, the new model is defined
as the tau lumped model (TLM). The calculation time of the TLM is reduced even further,
but still requires physical interpretation, which an experimental methodology is developed
to find the fitting bounds. Detailed experimental determination of the critical modeling
parameters is reported in this section to accentuate the extremely high accuracy of the
model in predicting the voltage and temperature profiles of a commercial 50Ah Samsung
NCM532/Graphite Li-ion battery cell, using the simplified reduced electrochemical-
thermal lumped model.
2.1 EXPERIMENTAL
2.1.1 CELL TEARDOWN AND PHYSICAL CHARACTERIZATION
Thermodynamic, kinetic, and transport properties for commercial LIBs were
extracted from Samsung large-format 50Ah prismatic cells (refer to Figure 2.1a). These
cells were assembled with a LiNi0.5Mn0.3Co0.2O2 (NMC532) cathode and a graphite anode.
There were two jelly rolls inside the casing (refer to Figure 2.1b). Most of the experiments
focused on full-cell-level properties, while electrode-level experiments were also done to
enhance interpretation and discussion. To obtain the electrode-level properties, it was
necessary to tear down the cells. This allowed both physical characterizations to be
performed and for individual electrodes to be rebuilt as half cells – where one electrode
was paired with a Li foil counter/reference electrode.

32
Figure 2.1 | Photograph of (a) the large format 50 Ah prismatic cell and (b) one of two
jelly rolls
Cell teardown was conducted following complete discharge to a lower voltage
bound of 2.8V, following a 24 hr relaxation time to reach electrochemical equilibrium.
During the cell teardown process, the tabs were wrapped with electrical tape to prevent
short-circuiting and transferred inside an argon-filled (Ar, UHP Praxair) MBraun
Glovebox (H2O and O2 levels < 0.1ppm). First, two parallel lines separated by 1 mm were
drawn 2 mm below and above the edge of the casing with a scalpel. A hydraulic prismatic
cell opener was used to remove the casing on the drawn lines. The tabs and busbar were
separated from the two jellyrolls for half-cell and electrode-level characterization purposes.
Energy-dispersive X-ray Spectroscopy (EDX) and Scanning Electron Microscopy
(SEM) were performed on a Zeiss Ultraplus Field Emission Scanning Electron
Microscope. X-ray photoelectron spectroscopy (XPS) measurements were conducted on a
Kratos AXIS Ultra DLD XPS system. Atomic ratios of Ni, Co, and Mn in the cathode
active material were determined using a Perkin-Elmer Inductively Coupled Plasma Optical
Emission Spectroscopy (ICP-OES). Electrodes that were salvaged from the 50Ah prismatic
cells for chemical analysis were first cut into 1.76 cm2 disk electrodes and stored in EMC

33
(Ethyl-Methyl Carbonate) for 30 minutes to remove residual salts. Afterwards, the
electrodes were transferred to an Ar-filled Kratos AXIS Ultra multipurpose transfer vessel
and finally removed from the glovebox for physical characterization.
Inductively coupled plasma optical emission spectroscopy (ICP-OES) was used to
confirm the atomic ratios of Ni, Co, and Mn in the cathode material (Table 2.1). In
accordance with the linearity and sensitivity of the instruments, standard solutions of Li,
Mn, Cobalt, and Ni have been prepared for the analysis. The cathode samples were digested
in nitric acid and diluted as needed to match the standard solution concentrations. It was
found that the cathode composition was Li0.978(Ni0.48Mn0.28Co0.20)O2. ICP-OES analysis of
the anode found minor indications that possible Ni, Co, and Mn dissolution from the
cathode occurred and subsequently redeposited on graphite. X-ray photoelectron
spectroscopy (XPS) was also used to confirm cell chemistry.
Table 2.1. | Table showing the atomic ratio of Li, Co, Ni, Mn in the cathode and anode
obtained by ICP-OES. The cathode was found to be Li0.98Ni0.48Mn0.28Co0.20O2 and minor
transition metal dissolution at the graphite anode.
Li 610.37 nm Co 238.89 nm Ni 230.29 nm Mn 257.60 nm
Cathode Intensity 69595 120889 290719 155454
Relative Cathode Composition 0.98 0.20 0.48 0.28
Anode Intensity 20840 136 290 195
2.1.2 ELECTROCHEMICAL AND THERMAL CHARACTERIZATION
LIB half-cells were assembled in an argon-filled MBraun glovebox at 5-8 psig to
determine the electrochemical behavior of the cathode and anode independently with
respect to a Li/Li+ reference state. The electrochemical tests were performed in CR2032

34
coin cells (Hohsen Corp.) – which had 1.76 cm2 lithium metal (99.9%, Alfa Aesar)
counter/reference electrodes, 2320 Celgard tri-layer PP/PE/PP separators, and 1.2M
lithium hexafluorophosphate (LiPF6, Acros 98%) salt in EC: EMC (3:7 by wt.%)
electrolytes. Full-cell-level properties (voltage window: 2.8-4.25V) and electrode-level
properties (anode voltage window: 0.001-1V vs. Li/Li+; cathode voltage window: 3-4.4V
vs Li/Li+) were extracted through galvanostatic intermittent titration technique (GITT),
1000Hz AC impedance, and constant current–constant potential (CC-CP) charge/discharge
in a Tenney Temperature Control Chamber (temperature range of -15 to 45°C) with a Bio-
logic MPG-205 Battery Tester. The protocol for extracting the Open Circuit Potential
(OCP) was outlined in Verma et al.50, but in short, the OCP was determined from the
steady-state voltage during the relaxation period of the GITT experiment that will be
discussed next. For the GITT experiments, two pre-conditioning full charge/discharge CC-
CP cycles were performed at C/3 (15A) before the repetitive pulse-rest GITT protocol.
After the CP stage, the 50Ah cell was discharged at current pulses of C/10 (5A) for 1 hour
followed by a relaxation period of 30 minutes. A total of 50 pulses were used in the GITT
protocol.
Entropic heat coefficient (dUdT-1) measurements were carried out by first fully
charging the 50Ah cell at 45°C with the constant current-constant potential (CC-CP)
procedure on an Arbin MSTAT battery cycler inside a Tenney T6S-1 Temperature Control
Chamber. In a typical setup, four K-type thermocouples were attached to the 50Ah
NMC532/graphite Li-ion battery body with heat-shrink skin, the body without skin,
positive terminal, and ambient interior of the chamber. A Graphtec GL240 datalogger with

35
pre-calibrations for K-type sensors were tested in ice water (T = 0 °C) to ensure the
reliability of the measurements.
The 50Ah cells were placed inside the chamber on a Teflon mat to insulate the cell
from the metallic body of the thermal chamber. The cell was set in the upright position to
minimize high surface area heat transfer for high fidelity modeling. The 50Ah cell was
relaxed at OCP for 4 hours to reach thermal and electrochemical equilibrium. After
relaxation, the temperature was reduced to 30 °C and held for 4 hours until thermal
equilibrium was reestablished. The same procedure was repeated for experiments
conducted at 20 °C, 10 °C, 0 °C, and -15 °C. After completion, the cell was reheated to 45
°C for 4 hours and pulsed for 30 minutes at C/5 (10A), and allowed to relax for an
additional 4 hours to reach equilibrium. The same temperature cycling procedure from
45°C to -15°C was used for every decrement in SOC.
The EIS experiments were conducted using an Autolab PGSTAT302N potentiostat
for an NMC532/Li metal half-cell. In a typical procedure, the Li-ion half-cell was pulsed
12 times with a current of C/20 for 2 hours. After each pulse, the cell was given time to
reach electrochemical equilibrium (i.e. until open circuit voltage (OCV) reach (
1dOCV
dt
V
s
) before an EIS measurement was taken. EIS was conducted at a frequency
range of 20kHz – 0.01Hz with a sinusoidal voltage amplitude of 10mV in a Tenney T10RS
climate control chamber set to 25oC.
2.2 EXTRACTED COMMERCIAL BATTERY PARAMETERS
Particle size and electrode thickness for both the anode and cathode were
determined by creating a statistical distribution on 100 particles from SEM. Figure 2.2a

36
shows that the cathode consisted of spherical NMC cathode particles with a range of
particle sizes between 0.129-24.89 µm, with an average of 6.32 µm. Figure 2.2 (a,b) shows
a typical cross-sectional image of the cathode with an average thickness of ca. 50 µm. The
deconvolution of the GITT dataset, by taking the steady-state voltage during the relaxation
period, yielded the OCP as a function of lithiation state for NMC532 as shown in Figure
2.2c. The OCP for the lithiated and delithiated state for NMC532 overlaps from the state
of charge (SOC) = 20-70% and diverges slightly outside of that range.
Figure 2.2d shows that the anode consisted of irregular shaped graphite particles
with a range of sizes between 2.78-20.04 µm with an average particle size of 9.93 µm.
Figure 2.2e shows a characteristic cross-sectional SEM image of the anode with an average
electrode thickness of 68.77 µm. Figure 2.2f shows the OCP at various SOC, with the
thermodynamically favored phases LiC32, LiC12, and LiC6 labeled as well. It should be
noted that minor voltage hysteresis that is ascribed to phase transitions or order-disorder
transitions can be observed in both the OCP vs SOC for NMC532 and graphite75–77. The
diameter and the thicknesses of the electrodes were useful for estimating the diffusion
length, which can be used to estimate a range for the time diffusion constant in the model
(Refer to Table 2.2).
Table 2.2. | List of parameters measured experimentally.
Parameter Value Unit
Diameters of NMC532 cathode - dp 6.32 µm
Diameters of LiC6 anode - dn 9.93 µm
Thickness of NMC532 cathode - lp 50.27 µm
Thickness of LiC6 anode - ln 68.77 µm

37
Figure 2.2 | Physical and Electrochemical Characterization. Field-emission scanning
electron microscope (FE-SEM) of (a,b) NMC532 cathode, and (c) galvanostatic
intermittent titration technique (GITT) for the open circuit potential (OCP) of the cathode.
(d,e) FE-SEM images of graphite anode and (f) GITT for the OCP of the anode.
Reproduced with permission from Elsevier.78
For the full-cell analysis, the entropic heat coefficient (dUdT-1) measurements were
extracted from the OCP and temperature-vs-time plots at various SOCs from 100% charge
to complete discharge in increments of 10% SOC.
Figure 2.3(a-d) shows the characteristic OCP measurements as a function of
temperature at various SOC. Across a wide SOC range (100% to 30%), the OCP decreases
in a staging fashion similar to that of the temperature loss. Also, from 100% to 30% SOC,
the differential OCP (dU) ranges from 2 mV to 9 mV and then transitions to an inverse
relationship (i.e. OCP increases as the temperature of the cell drops). At SOC < 20%, dU
ranges from -6 mV to -4 mV. The average OCP at electrochemical and thermal equilibrium
was chosen for the entropy calculation.

38
Figure 2.3 | Entropic Heat Coefficient Calculations. Open circuit potential (OCP) changes
due to temperature (T) for the calculation of dUdT-1 at various state of charge (SOC).
Reproduced with permission from Elsevier.78
In electrochemical systems, lowering the temperature does more than simply
slightly modify the cell voltage. The lower temperature also leads to a reduction in the
conductance of charge carriers (e.g. ions, electrons), impedes Li+ ion migration within the
SEI, elevates charge transfer resistance, and introduces diffusional limitations, which leads
to large drops in cell-level voltage and capacity loss. Also, anodic overpotentials can reach
the Li+/Li redox couple for Li-plating.79 To better understand these effects, the large format
cells were charged at 25°C with CC-CP and relaxed at OCP at different iterations in
temperature (-15°C, 10°C, 25°C, 45°C) to reach electrochemical and cell-level thermal
equilibrium.

39
Figure 2.4 | Extracting Modeling Parameters at Different SOC and Temperatures. (a) Open
circuit potential, (b) Area independent diffusivity (S2D), (c) exchange current (i0S), and (d)
internal resistance (RIR) for 50Ah cells at different SOC (100% to 0%) and at varying
temperatures (-15°C to 45°C). Reproduced with permission from Elsevier.78
The OCP of the 50Ah cells at different temperatures and SOC is plotted in Figure
2.4a. The OCP for 100% to 40% SOC from -15°C to 45°C follows a similar trend (i.e.
temperature and OCP decreases in tandem) but then diverges at SOC < 30%. The
divergence in OCP is proposed to be due to the onset of the next lithiation phase of graphite,
LiC1280. The first inflection point at 3.7V in the OCP of the 50Ah cell corresponds well
with the NMC half-cell inflection point at 3.8V. Overall, the end-of-discharge capacity was
determined to be 52.54Ah (T = 45 °C), 51.81Ah (T = 25 °C), 51.41, (T = 10 °C), and 47.41
Ah (T = - 15 °C).

40
Figure 2.4b shows the effective area independent diffusivity (S2D) of the 50Ah
cells and reflects the limiting diffusional process for the entire system during discharge (i.e.
NMC532, graphite). It should be noted that the N/P ratio was determined to be
approximately 1.24. The electrochemically active surface area (S) for both NMC and
graphite varies with temperature and SOC, which makes the determination of the limiting
S2D difficult. The effective chemical diffusion coefficient or diffusion time constant of Li+
ions change with SOC. During charge, the anode undergoes various degrees of lithiation
to the thermodynamic stable phases LiC32, LiC12, and LiC6, and, due to an increase in
electrostatic repulsive forces, the diffusion coefficient of the anode will decrease as a
function of increased lithiation.81 On the other hand, the cathode exhibits opposite trends
as the delithiation of Li+ from the bulk NMC crystal leads to more facile pathways for
diffusion and leads to higher diffusion coefficients as the amount of Li in the crystal
decreases.82 The non-destructive extraction of the effective diffusion coefficient (D) was
obtained by GITT. In the GITT method, the Li-ion cell system is perturbed by an applied
constant current (I) for a specified pulse time (t) and relationships from the relaxation
period to the pulse time give the chemical diffusion coefficient83.
𝐷 =4
𝜋(
𝐼𝑉𝑚
𝑧𝐹𝑆)
2
[𝑑𝑈
𝑑𝑆𝑂𝐶⁄𝑑𝑉
𝑑√𝑡⁄
⁄ ]
2
Equation 2.1
where Vm is the molar volume of the active material, F is Faraday’s constant (F =96485.3
C mol-1), z is the charge number of the carrier ion, S is the electrochemical active surface
area, U is the open circuit potential (OCP), V is the measured voltage, SOC is the state-of-
charge, and 𝑑𝑈 ⁄ 𝑑𝑆𝑂𝐶 or 𝑑𝑉 ⁄ (𝑑√𝑡) were calculated from the linear regression of each
pulse. During the pulsation period, the voltage will exhibit a pseudo-instantaneous jump

41
when current is applied, followed by a steady increase in the voltage. These two regions
can then be deconvoluted to express the ohmic plus the kinetic overpotentials (𝜂𝐼𝑅 + 𝜂𝐶𝑇)
and the concentration overpotential 𝜂𝐶 , respectively. The ohmic resistance as calculated is
negligible to that of the kinetic contributions. Because of this, the ohmic overpotential is
subsequently neglected.
Table 2.3 | Table showing the dimensions of the 50Ah cell and the 1000Hz AC ohmic
resistance measurement.
Length
[mm]
Width 1
[mm]
Width 2
[mm]
Width 3
[mm]
Height
[mm]
AC
Resistanc
e at 1000
Hz [mΩ]
147.8 27.21 26.64 27.14 91.21 0.783089
By applying GITT relations for diffusivity and keeping S independent for parameter
estimation, S2D shows a decreasing trend when the temperature drops from 45°C to -15°C
and as SOC goes from 100% to 0%. However, at 45°C the diffusivity spikes towards low
SOC (15% to 5%), which is attributed to the phase transition from graphite and seen as an
additional plateau at 3.26V (i.e. phase transition from the thermodynamic stable phase
LiC12 to LiC32) in the OCP vs SOC plot for the 50Ah cell. The phase transition is consistent
with the entropic heat coefficient measurement,80 where at higher temperatures, the
differential OCP between LiC12 and LiC32 shrinks and gives rise to the LiC32 plateau. Also,
lower overpotentials in graphite at both elevated temperatures and low SOCs
simultaneously lead to more cell-level capacity.

42
The electrochemical kinetics of the cell can be represented by the Butler-Volmer
(BV) current density formulation shown in Equation 2.2, followed by the linearized BV
expression (which assumes low kinetic overpotentials) as shown in Equation 2.3.50:
𝑖 =𝐼
𝑆= 𝑖0 [𝑒𝑥𝑝
𝛼𝑎𝑧 𝐹𝑅𝑇 𝜂𝐶𝑇 − 𝑒𝑥𝑝
𝛼𝑐𝑧 𝐹𝑅𝑇 𝜂𝐶𝑇] Equation 2.2
𝑖 =𝐼
𝑆=
𝑖0(𝛼𝑎 + 𝛼𝑐)𝐹
𝑅𝑇𝜂𝐶𝑇 =
𝑖0𝐹
𝑅𝑇 𝜂𝐶𝑇 ; 𝑖𝑜𝑆 =
𝑅𝑇
𝐹
𝐼
𝜂𝐶𝑇 Equation 2.3
where i is the current density, i0 is the exchange current density, α is the transfer coefficient,
z is the number of electrons participating in the electrode reaction (z = 1), R is the universal
gas constant (R = 8.314 J mol-1 k-1), T is the temperature (T = 293.15 K), and ηCT is the
charge transfer overpotential.
The charge transfer resistance, RCT, can be deconvoluted from the 50Ah full-cell
GITT measurements by applying the linearized Butler-Volmer equation and extracting the
exchange current (i0S) as given in Equation 2.2 and Equation 2.3. It should be noted that
the extraction of the electrochemical active surface area (S) is difficult for LIB electrodes
due to faradaic processes buried inside the double-layer response in cyclic voltammetry
and also varies depending on the volumetric expansion/contraction of the electrode active
material at different temperatures due to thermal expansion, lithium-induced expansion
(13.2% volume expansion from LiC12 to fully lithiated LiC6),84 and/or lifetime history
(particle detachment85, graphite exfoliation86). Therefore, neither the experiments nor the
model attempt to decouple exchange current density and the electrochemical surface area
(i0S). Figure 2.4c shows the extracted value for the effective i0S in the 50Ah full-cell. The
i0S decreases at lower temperatures and the i0S vs SOC oscillatory behavior shrinks. The
i0S behavior indicates sluggish kinetics at low temperature (-15oC) and the typical increase
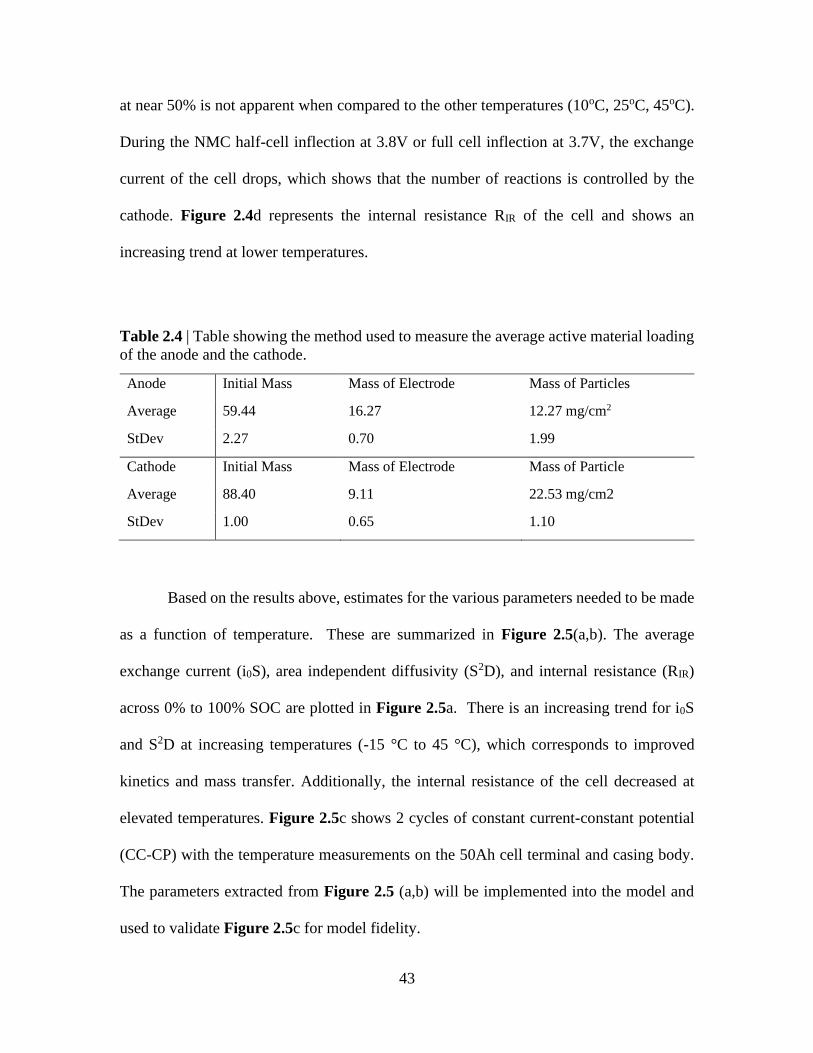
43
at near 50% is not apparent when compared to the other temperatures (10oC, 25oC, 45oC).
During the NMC half-cell inflection at 3.8V or full cell inflection at 3.7V, the exchange
current of the cell drops, which shows that the number of reactions is controlled by the
cathode. Figure 2.4d represents the internal resistance RIR of the cell and shows an
increasing trend at lower temperatures.
Table 2.4 | Table showing the method used to measure the average active material loading
of the anode and the cathode.
Anode Initial Mass Mass of Electrode Mass of Particles
Average 59.44 16.27 12.27 mg/cm2
StDev 2.27 0.70 1.99
Cathode Initial Mass Mass of Electrode Mass of Particle
Average 88.40 9.11 22.53 mg/cm2
StDev 1.00 0.65 1.10
Based on the results above, estimates for the various parameters needed to be made
as a function of temperature. These are summarized in Figure 2.5(a,b). The average
exchange current (i0S), area independent diffusivity (S2D), and internal resistance (RIR)
across 0% to 100% SOC are plotted in Figure 2.5a. There is an increasing trend for i0S
and S2D at increasing temperatures (-15 °C to 45 °C), which corresponds to improved
kinetics and mass transfer. Additionally, the internal resistance of the cell decreased at
elevated temperatures. Figure 2.5c shows 2 cycles of constant current-constant potential
(CC-CP) with the temperature measurements on the 50Ah cell terminal and casing body.
The parameters extracted from Figure 2.5 (a,b) will be implemented into the model and
used to validate Figure 2.5c for model fidelity.

44
Figure 2.5 | Modeling Parameters and Cycling Profile. (a) Represents the average
exchange current (red line), area independent diffusivity (black line), and ohmic resistance
(blue line), (b) entropic heat coefficient at different state of charge, and (c) CC-CP charge-
discharge profile with temperature measurements on the 50Ah cell terminal and casing
body. Reproduced with permission from Elsevier.78
2.3 ELECTROCHEMICAL-THERMAL MODEL: PERFORMANCE PREDICTIONS
OF COMMERCIAL LI-ION BATTERIES
2.3.1 REDUCED ORDER LUMPED MODEL (TLM-MODEL)
The tau lumped model presented by Ekström et al.74 provides the possibility to
model a full cell and consists of the equations presented in Table 2.5.

45
Table 2.5 | Table showing the equations in the lumped model from Ekström et al.74
Model Equations
SOC estimation 𝜏
𝜕𝑆𝑂𝐶
𝜕𝑡+ ∇ ⋅ (−∇𝑆𝑂𝐶) = 0 Equation 2.4
𝐁𝐂: ∇𝑆𝑂𝐶|𝑥=1 =𝜏𝐼𝑐𝑒𝑙𝑙
3𝑄𝑐𝑒𝑙𝑙,0 Equation 2.5
𝐁𝐂: ∇𝑆𝑂𝐶|𝑥=0 = 0 Equation 2.6
𝐈𝐂: ∇𝑆𝑂𝐶|𝑡=0 = 𝑆𝑂𝐶𝑐𝑒𝑙𝑙,0 Equation 2.7
𝑆𝑂𝐶 = 3 ∫ 𝑆𝑂𝐶 𝑥2𝜕𝑥1
0
Equation 2-8
Overpotential
calculations 𝑉𝑐𝑒𝑙𝑙 = 𝑈(𝑆𝑂𝐶 , 𝑇) + 𝜂𝑖𝑟 + 𝜂𝑎𝑐𝑡 + 𝜂𝑐𝑜𝑛𝑐 Equation 2.9
𝜂𝑖𝑟 = 𝐼𝑐𝑒𝑙𝑙𝑅𝑐𝑒𝑙𝑙 Equation 2.10
𝜂𝑎𝑐𝑡 =2𝑅𝑇
𝐹asinh
𝐼𝑐𝑒𝑙𝑙
2𝑖0𝑆 Equation 2.11
𝜂𝑐𝑜𝑛𝑐 = 𝑈𝑐𝑒𝑙𝑙(𝑆𝑂𝐶|𝑥=1, 𝑇) − 𝑈(𝑆𝑂𝐶 , 𝑇) Equation 2.12
𝑈(𝑆𝑂𝐶 , 𝑇) = 𝑈𝑟𝑒𝑓(𝑆𝑂𝐶, 𝑇)
+ (𝑇 − 𝑇𝑟𝑒𝑓)𝑑𝑈(𝑆𝑂𝐶)
𝑑𝑇
Equation 2.13
In this section, the notations were slightly modified to introduce the temperature
dependency of the open circuit potential. The equations from Table 2.5 can predict the
voltage profiles for a driving cycle with relatively high precision.74 Two main advantages
make this model reliable: it is fast and requires no knowledge of cell chemistry. Even
though it is a relatively fast model, it still contains one PDE (Partial Differential Equation),
which requires a one-dimensional meshed domain, making it difficult to implement in the
chipsets of a BMS, for example. In this study, the PDE shown in Equation 2.5 was reduced
to a series of ODEs given in Equation 2.15 to Equation 2.17:
𝜏𝜕𝑆𝑂𝐶
𝜕𝑡+ ∇ ⋅ (−∇𝑆𝑂𝐶) = 0
Equation 2.14

46
𝜕𝑆𝑂𝐶𝑎𝑣𝑒𝑟𝑎𝑔𝑒
𝜕𝑡=
3𝐼
3𝑄0
Equation 2.15
SOCsurface = 𝑆𝑂𝐶𝑎𝑣𝑒𝑟𝑎𝑔𝑒 + ∑ 𝑄𝑖
𝑁=4
𝑖=1
Equation 2.16
𝑑𝑄𝑖
𝑑𝑡=
𝑎𝑖𝑄𝑖
𝜏+
𝑏𝑖I
3𝑄0
Equation 2.17
𝑆𝑂𝐶𝑎𝑣𝑒𝑟𝑎𝑔𝑒(𝑡 = 0) = 𝑆𝑂𝐶0 Equation 2.18
Equation 2.15 - Equation 2.17 were used to model the average SOC and the SOC
at the surface. In addition to this simplification, a heat generation term was also added to
the model for calculating the temperature (Equation 2.19):
𝑔𝑒𝑛 = I (𝑉𝑐𝑒𝑙𝑙 − U(SOCaverage) + 𝑇𝑑𝑈(𝑆𝑂𝐶𝑎𝑣𝑒𝑟𝑎𝑔𝑒)
𝑑𝑇)
Equation 2.19
where I is the current applied to the cell, U is the open circuit potential, Vcell is the potential
of the cell, calculated with Equation 2.9, T the temperature of the cell, and the last term
represents the variation of the OCP with the temperature, which in the heat generation term
represents the reversible heat generation due to the displacement of the lattice during the
intercalation/de-intercalation. While the cell potential was calculated with the model, the
reversible term requires time-consuming experiments.
The Biot number was calculated to check if the cell can be modeled as a lumped
capacitance model (Equation 2.20):
𝐵𝑖 =ℎ𝐿𝑐
𝑘
Equation 2.20
where h is the heat transfer coefficient, Lc is the characteristic length and k is the effective
thermal conductivity of the cell. The heat transfer coefficient is calculated using the Nusselt
correlations considering natural convection for a vertical block with the dimensions

47
provided and the thermal conductivity derives from Lundgren et al87. For both thermal
conductivities (in-plane and through-plane), the Biot number is smaller than 0.1, which
means that that cell can be modeled using the lump capacitance model88 using Equation
2.21:
𝑚𝑐𝑒𝑙𝑙𝐶𝑝𝑑𝑇
𝑑𝑡= 𝑔𝑒𝑛 − ℎ𝐴(𝑇 − 𝑇𝑎𝑚𝑏(𝑡)) Equation 2.21
The mass of the cell (mcell) was measured experimentally, while the specific heat
(Cp) was taken from Schmalstieg et al72. The ambient temperature increases slowly with
time and was extracted from the data logger. The final TLM consists of Equation 2.9 to
Equation 2.21. The time diffusion constant (τ) from Equation 2.17, the exchange current
(i0S) from Equation 2.11, and the ohmic overpotential (ηIR) from Equation 2.10 are the
unknowns that require fitting or experimental determination. The complete list of
parameters can be found in the next section, in Table 2.7. Calculating or measuring these
parameters using experimental data is a challenging task since the model was used for
modeling a full-cell and not for separate electrodes.
2.3.2 APPLICATION OF EXPERIMENTAL BATTERY PARAMETERS INTO THE MODEL
The Levenberg-Marquardt nonlinear optimization method was used for fitting the
three parameters during a discharge process for the 50Ah cells at a constant current (CC)
of 15A (0.3C) in ambient conditions. After the optimization, the fitted values were
extracted and inserted into the final model. The TLM model showed an excellent
agreement with the experimental data when comparing the potentials, as seen in Figure
2.6.

48
Figure 2.6. | Plot showing the cell potential calculated using the TLM and the potential
measured experimentally for a discharge process of 0.3C. Reproduced with permission
from Elsevier.78
Figure 2.7. | Plots showing the cell temperature calculated using the TLM and the potential
measured experimentally for a CC discharge process of 0.3C when a) the reversible term
is included and b) when the reversible term is neglected. Reproduced with permission from
Elsevier.78
The difference between the experiment and the model is less than 7 mV on average
over the entire discharge time. The temperature calculated using Equation 2.11 also shows
good agreement with the experimental data, as seen in Figure 2.7. The temperature
calculated with the model not only shows a good agreement with experimental data, but it
also follows the phase changes within the cell and the subsequent alterations in the entropic
(b) (a)

49
heat coefficient (dUdT-1) at different SOCs. When the dUdT-1 term is neglected in Figure
2.7b, the temperature differences are still small, but the model does not capture the
influence of phase changes within the cell. The fitted parameters used for getting the data
in Figure 2.6 and Figure 2.7 are given in Table 2.6.
Table 2.6 | Model parameters calculated using the Levenberg-Marquardt optimization
method.
i0S [A] τ [s] ηIR [V]
6.808 1716 0.0028
The exchange current (i0S) has the electrochemical active area (S) embedded in the
term for the entire cell as it is exceedingly difficult to deconvolute. The exchange current
was measured experimentally at different temperatures for the entire cell (Figure 2.5), but
at 25°C, the average value over the entire discharge time was around 6.8 A, which is very
close to the value obtained using the Levenberg-Marquardt optimization method. This
observation shows that it is possible to measure this parameter for a full-cell, reducing the
number of unknowns that require fitting. The time diffusion constant (τ) can be calculated
analytically using the following equation89:
𝜏 =𝑙2
𝐷
Equation 2.22
where l is the electrochemical diffusion length, which can be the thickness of the electrode
in thin-film electrodes or the particle radius, and D is the diffusion coefficient. For this
section, the diffusion length was assumed to be the radius of the particles, for finding the
fitting bounds. Because the study was focused on a full-cell rather than on individual
electrodes, it is important to find which radius can be used, the cathode or the anode. Taking
the constant value for the graphite anode diffusion coefficient from Sikha et al90, the

50
diffusion time constant was found (τ) to be a value of 630.8 s, which is lower than the one
predicted by the model. When considering the diffusion coefficient from Yang et al91 and
the measured radius of the cathode, the time diffusion constant yields values between 64 s
and 12,948 s, which is extremely wide. However, the value given by the fitting process
falls in between this range and it can give the bounds for the parameter estimation process.
The ohmic overpotential (ηIR) is calculated using the internal resistance of the cell
and the discharge current. For a CC discharge process of 15A and a resistance of 0.79 mΩ
at 25°C, the ohmic overpotential gives 0.012 V, which is higher than the value fitted in the
model. By using the values of the exchange current (i0S = 6.8 A), the time diffusion of the
anode (τ = 630.8s) and the internal resistance at 25°C (Rcell = 0.79 mΩ), the model still
shows a good agreement with the experimental data, as seen in Figure 2.8, which indicates
that the values for the TLM can be obtained experimentally. The exchange current can be
measured using the GITT method for a full-cell and the internal resistance can be directly
measured for a full-cell using the AC resistance at 1kHz. However, the diffusion coefficient
term for the entire cell contains the electrochemical area, which requires additional
deconvolution. \
Figure 2.8. | Plot showing the cell potential calculated using the TLM and the potential
measured experimentally for a discharge process of 0.3C using the measured internal
resistance and the exchange current at 25°C. Reproduced with permission from Elsevier.78

51
An exceptionally good agreement between the model and the experiment can be
observed when increasing the discharge current to 25 A (0.5C) as seen in Figure 2.9a.
When increasing the discharge current to 50A or 1C (Figure 2.9a), the model still shows a
good agreement for almost the entire discharge process, with the exception that at the end
of discharge (EOD), the model predicts a slightly lower capacity. This indicates that at
rates that are higher than 0.5C, the parameters should be set to be dependent on the C-rate
or the temperature (e.g. such as an Arrhenius dependency), considering that the measured
parameters depend on the temperature, but this is beyond the scope of this work.
Figure 2.9. | Plots showing the cell potentials calculated using the TLM and the potential
measured experimentally for a) a discharge process of 0.5C and for b) a discharge process
of 1C, using the measured internal resistance and the exchange current at 25°C.
Reproduced with permission from Elsevier.78
Table 2.7 | Parameters used for model.
Symbol Description Value Unit Source
SOC0 Initial state of charge 1 - Estimated
I Applied current 15/25/50 A Measured
Q0 Cell capacity 50 Ah Estimated
Cp Specific heat of the entire cell 937.5 J kg-1 K-1 [87]
h Heat transfer coefficient 4.5 W m-2 K-1 Calculated
[88]
A Surface of cell exposed to convection 0.0359 m2 Measured
mcell Mass of the cell 0.875 kg Measured
Tref Reference temperature 298.15 K Measured
Tamb Ambient temperature 294.15 K Measured
(b) (a)

52
2.4 SUMMARY
Non-destructive experimental extraction of parameters through a pulse-relaxation
GITT method can map the temperature and SOC dependent parameter surface for the OCP,
exchange current (i0S), diffusion time constant (τ), internal resistance (RIR), and the
entropic heat coefficient (dUdT-1). Also, the reduced order Lumped electrochemical-
thermal model (TLM) is fully capable of utilizing the extracted parameters to obtain fast
calculation times for voltage and temperature predictions that are consistent with the
experimental measurements. The TLM model deviates at high current densities (>1C) from
cell-level SOCs < 5%; however, LIB packs typically operate within the voltage plateau
(SOC = 10% to 100%) and BMS discharge cutoffs occur at a specified dV dt-1 to ensure
pack longevity.
In summary, the State Space approach (PDE to ODE transformation) is an effective
method to greatly enhance the calculation time for BMS applications, and the non-
destructive GITT measurement for four cell-level parameters (i0S, τ, RIR, dUdT-1) is
directly relatable to mathematical quantities in the reduced order-TLM. In a world that
requires faster calculations/computational time, a novel method to extract parameters non-
destructively can be implemented as initial guesses to increase the convergence time and
approach higher-fidelity voltage and temperature predictions.

53
CHAPTER 3: INVESTIGATION OF THE KINETIC AND TRANSPORT
NON-IDEALITIES IN COMMERCIAL LI-ION ELECTRODES -
DECONVOLUTING COMPLEX ELECTROCHEMICAL IMPEDANCE
SPECTROSCOPY DATA
Chapter 2 explored cell-level properties (OCV, i0S, τ, RIR, dUdT-1) for large 50Ah
commercial cells and applied those parameters into a Lumped reduced-order model that
utilized a State Space transformation for order reduction. The full cell model in Chapter 2
plays a significant role when fast computational speed, low processing power, and
minimal/nondestructive parameter extraction is needed. However, the model cannot
capture a necessary-level of fidelity at high C-rates, nor any information at the electrode-
level. Therefore, this chapter uses a modified version of the porous electrode theory to
investigate the impedance response of a LIB at a higher level of fidelity and complexity.
Electrochemical impedance spectroscopy (EIS) is widely considered to be a
powerful characterization tool for separating individual electrochemical processes by their
timescales and enabling quantitative analysis of electron transport, interfacial reaction
mechanisms, and Li-ion intercalation processes. EIS has been widely used to estimate the
diffusivity (D) of Li-ions in the solid active materials and the reaction rate constant (k) at
the electrolyte/electrode interface. The quantitative analysis of EIS data is highly
complementary to the development of physics-based models (PBMs)92,93. Macroscopic

54
PBMs of Li-ion cells and batteries began with a relatively simple Fick’s law governed
solid-phase Li-ion diffusion model, extended from Atlung et al.’s94 work in 1979 and
named by Santhanagopalan et al.95 as the single-particle (SP) model in 2006. Another
dominant Li-ion cell full-order model (FOM), commonly referred to as the “pseudo-2D
model (P2D)”, was developed in 1994 by Fuller et al.96, who represented a dual foil Li-ion
cell by a pseudo-two-dimensional domain.
Even though PBMs contain most battery physics that represent the key
electrochemical processes, it is possible that some important physics-based phenomena are
neglected. For example, in a general PBM of LIBs, Li-ion diffusion is governed by Fick’s
law in a dilute solution, which neglects the thermodynamic nonideality of the solid active
material, which experiences large concentration variation during charge/discharge.
Although both k (solid/liquid interface reaction or Li-ion intercalation rate) and D
(diffusivity of Li-ion in a solid phase) have exhibited correlations with Li-ion content xLi
(equals 1-SOC, state of charge), especially at the end of discharge, they have been assumed
to be constants over the entire range of SOC68. Likely because of this, their values reported
from different experimentalists show a wide variation spanning two-to-five orders of
magnitude97. With this large variation, both battery SOC and State-of-Health (SOH) will
remain unpredictable, which means that, ultimately, true battery management and
diagnosis remains uncertain.
In the existing literature, the occurrence of nonideality of mixed conducting
materials has been widely reported when the charge carrier concentration comprises a
significant percentage of the total lattice sites. Concentrated solution theory, with the
inclusion of the activity coefficient of the transporting ion, has generally been employed to

55
account for the nonideal portions of the thermodynamic properties. This chapter seeks to
understand the nonideality of a solid Li-ion active material using nonequilibrium
thermodynamics in a concentrated solution to correlate k and D with the activity coefficient
of the solid solution (γ). These new correlations are then paired with deconvoluted EIS
experimental data, where regression is done to determine the experimental γ. This research
provides theoretical explanations of the governing mechanisms for such nonlinear
interrelationships and a mathematical methodology is developed to obtain such correlations
by parameter estimation with experimental data.
The model was developed for a Li-ion half-cell with the geometry illustrated in
Figure 3.1. This cell includes a porous cathode consisting of solid particles, a polymer
separator, and a lithium metal foil that acts as both the counter and reference electrode. The
governing equations for this half-cell model are like Newman’s pseudo-2D model,
including the solution phase Li-ion diffusion, charge conservation in the electrolyte, charge
conservation in the cathode, and Li-ion diffusion in the cathode particle.
Figure 3.1. | Schematic of a Li-ion half-cell PBM. The porous electrodes are formed by
spherical insertion particles. Reproduced with permission from IOP Publishing.98

56
3.1 EXPERIMENTAL EXTRACTION OF ELECTRODE-LEVEL PARAMETERS
There are around 40 parameters that are needed from experimental measurements
to run the PBM model. To characterize the anode and cathode separately, Samsung
prismatic 50Ah cells were dissected, and then electrodes were cut from each side to
construct coin cells in a half-cell configuration. By doing this, the number of parameters
can be reduced to 20. These cells had an NMC532 cathode, resulting in half-cells
containing the commercial cathode and a Li metal anode/reference. Several material
characterization methods were used to deduce chemical and structural information that can
be correlated to the information gained from EIS studies. These studies are also designed
to provide essential input for the new physics-based EIS model.
3.1.1 MATERIAL CHARACTERIZATION
The microstructure, composition, and electrical conductivity of the extracted
NMC532 cathodes were characterized by scanning electron microscopy (SEM), mercury
intrusion porosimetry (MIP), X-ray photoelectron spectroscopy (XPS), and four-terminal
Linear Scan Voltammetry (LSV). Detailed descriptions of each method are given in the
supplementary material. Surface and cross-sectional SEM images were taken to create a
statistical distribution of the particle diameter and electrode thickness using ImageJ so that
the electrode active area (S) could be assessed. Further, MIP was used to determine the
electrode porosity and provide complementary information about the electrode active area.
Specifically, the electrodes were cut into 1.76 cm2 disk electrodes and then massed. Then,
they were delaminated from the current collector using a scalpel. Each component was
massed to determine its loading and weight. Ten trials were done for each sample. The
samples were then cut into 2mm squares and placed into a holder. The active material mass

57
was used for porosimetry measurements. XPS and four-terminal LSV measurements were
conducted to confirm the elemental composition of the active material and determine the
electrical conductivity, respectively.
3.1.2 CELL TEARDOWN AND COIN CELL ASSEMBLY
Samsung prismatic 50 Ah cells purchased from the market were disassembled to
make CR2032 coin cells in the half-cell configuration, as shown in Figure 3.2. In a typical
cell disassembly, the cell was fully discharged to the lower voltage bound (2.8V) and
allowed to stabilize for 24 hours. The cell tabs were taped with electrical tape to prevent
any abrupt short-circuiting upon transfer. After transferring the cell into the glovebox, a
scalpel was used to draw 2 parallel lines 1 mm apart and 2 mm from the top and bottom on
the face of the cell. A total of 8 lines were drawn on the casing. A diagonal plier was used
to remove the casing at the previously drawn lines. Upon removal of the casing, the tabs
and busbar were removed to separate the two jellyrolls (Figure 3.2b). Jellyroll 1 was
unraveled, measured with a Fisher Scientific Traceable® caliper, and then discarded.
Jellyroll 2 was sealed away for coin cell assembly.
Figure 3.2. | Images depicting the teardown process with (a) Ar-filled MBraun glovebox
<0.1 ppm H2O and O2, (b) side view of the 2 jelly rolls, (c) tab orientation, and (d) a face
view of a jellyroll.

58
3.1.3 PHYSICAL CHARACTERIZATION
Scanning Electronic Microscopy (SEM) was conducted on a Zeiss Ultra Plus Field-
emission Scanning Electron Microscope. In typical sample preparation, the electrode was
cut with a scalpel and placed vertically onto the stage. Several images were captured
(representative image of the NMC532 cathode in Figure 3.3a) to create a statistical
distribution.
Figure 3.3. | a) SEM images of electrode cross-sections; b) the box and whisker graph of
particle size and one side electrode thickness; (c) the cumulative pore area and porosity
distribution of cathode, anode, and separator calculated from mercury intrusion
porosimetry.

59
The particle size and electrode thickness were determined to be an average of 100
samples and were calculated with ImageJ. Figure 3.3a are the SEM images of both
NMC532 cathode and Graphite anode. In Figure 3.3b, their particle sizes were collected
statistically, and are 6.32 for NMC532 and 9.93μm Graphite; their electrode thicknesses
are 50.27 for the cathode and 68.77 μm for the anode.
Mercury porosimetry was conducted on the anode and cathode by first passivating
the current collector in an oven at 100oC for 24 hours. The electrodes were cut into 1.76
cm2 disk electrodes and massed. The electrodes were then delaminated from the current
collector by using a scalpel. The separate components were massed to determine the
loading and the weight of the current collector. Ten trials were done for each sample. The
samples were then cut into 2mm squares and placed into the holder. The active material
mass was used for porosimetry. Figure 3.3c shows the pore area versus the pore size
diameter, together with the measurements for porosity. The dimension, porosity, and
particle size will be used in the Physics-based EIS model later.
3.1.4 ELECTRONIC CONDUCTIVITY OF ELECTRODES
In a typical electronic conductivity measurement, the active electrode material was
removed from the current collector with a scalpel then pressed into a pellet with an MTI
hydraulic press. Silver wires and silver paste were used to decrease contact resistance
between the bipotentiostat and the pellet. Figure 3.4 shows the electronic conductivity
determined for the NMC532 cathode.

60
Figure 3.4. | Potential vs current experimental data and fitting of the electronic
conductivity of NMC532.
3.1.5 EIS MEASUREMENTS
The EIS experiments were conducted using an Autolab PGSTAT302N potentiostat
for an NMC532/Li metal half-cell. In a typical procedure, the Li-ion half-cell was pulsed
12 times with a current of C/20 for 2 hours. After each pulse, the cell was given time to
reach electrochemical equilibrium (i.e. until open circuit voltage (OCV) reach (
1dOCV
dt
V
s
) before an EIS measurement was taken. EIS was conducted at a frequency
range of 20kHz – 0.01Hz with a sinusoidal voltage amplitude of 10mV in a Tenney T10RS
climate control chamber set to 25oC.
3.1.6 GALVANOSTATIC INTERMITTENT TITRATION TECHNIQUE (GITT)
GITT measurements were performed on the assembled coin cell (NMC532/Li
metal half-cells) during both charging and discharging cycles to determine the OCV of the
NMC532 cathode. The cells were conditioned for 2 cycles with constant current charge-
discharge at C/10. Then 25 intermittent pulses were applied at C/20 for 2 hours until the

61
upper or lower voltage bound was met. The rest period was over 30 minutes to ensure
equilibrium conditions are reached between adjacent pulses.
Table 3.1 | Perturbation form of the Lithium-Ion battery P2D model
Model Equations
Solution phase
diffusion ε1𝑖ωΔ𝑐1(𝑥, ω) = 𝐷1, eff
∂
∂𝑥(
∂Δ𝑐1(𝑥,ω)
∂𝑥) + 𝑎(1 − 𝑡+)
Δ𝑗s(𝑥,ω)
𝐹;𝐷1,eff = 𝐷1, bulk ε1
1.5
𝜕Δ𝑐1(𝑥, 𝜔)
𝜕𝑥|
𝑥=0
= 0 ;𝜕Δ𝑐1(𝑥, 𝜔)
𝜕𝑥|
𝑥=𝑙𝑛+𝑙2+𝑙𝑝
= 0
Δ𝑗s(𝑥, 𝜔) = 0 in the separator region (0 < 𝑥 < 𝑙𝑠)
Charge
conservation in the
electrolyte
𝜕
𝜕𝑥(𝜅eff
𝜕Δ𝜙(𝑥, 𝜔)
𝜕𝑥− 𝜅d
𝜕Δ𝑐1(𝑥, 𝜔)
𝜕𝑥) + 𝑎Δ𝑗s(𝑥, 𝜔) = 0
Δ𝑗s(𝑥, 𝜔) = 0 for 0 < 𝑥 < 𝑙s
𝜕Δ𝜙1(𝑥, 𝜔)
𝜕𝑥|
𝑥=0
= 0 ; 𝜕Δ𝜙1(𝑥, 𝜔)
𝜕𝑥|
𝑥=𝑙𝑛+𝑙1+𝑙𝑝
= 0
𝐾eff = 𝜅bulk 휀11.5 ; 𝜅d = 𝜅eff
2𝑅𝑇
𝐹𝑐1
(1 − 𝑡+) (1 +𝑑 ln 𝑓±
𝑑 ln 𝑐1
)
Charge
conservation in
solid phase
𝜕
𝜕𝑥(𝜎eff
𝜕Δ𝜙s(𝑥, 𝜔)
𝜕𝑥) − 𝑎Δ𝑗s(𝑥, 𝜔) = 0 𝜎eff = 𝜎휀s
1.5
Δ𝜙s(𝑥, 𝜔)|𝑥=0 = 0 𝜕Δ𝜙s(𝑥, 𝜔)
𝜕𝑥|
𝑥=𝑙n
= 0 𝜕Δ𝜙s(𝑥, 𝜔)
𝜕𝑥|
𝑥=𝑙n+𝑙s
= 0
Not applied in the separator region (0 < 𝑥 < 𝑙s)
Butler-Volmer
equation for
electrochemical
reactions
Δ𝑗𝑠(𝑥, 𝜔) = 𝑗0 [(0.5𝐹
𝑅𝑇+
0.5𝐹
𝑅𝑇) Δ𝜂(𝑥, 𝜔)]
+ i𝜔Δ𝜂(𝑥, 𝜔)𝐶𝑑𝑙 Not applied for 0 < 𝑥 < 𝑙s
Δ𝜂(𝑥, 𝜔) = Δ𝜙𝑠(𝑥, 𝜔) − Δ𝜙1(𝑥, 𝜔) − Δ𝑈(𝑥, 𝜔) − Δ𝑗𝑠(𝑥, 𝜔)𝑅𝑓𝑖𝑙𝑚
𝑗0 = 𝐴𝑘𝐹𝑘r𝑐10.5(𝑐s,max − 𝑐s|𝑟=𝑅𝑠
)0.5
(𝑐s|𝑟=𝑅𝑠)
0.5
Δ𝑈(𝑥, 𝜔) =𝑑𝑈
𝑑𝜃Δ𝜃(𝑥, 𝜔)
Solid-phase
diffusion 𝑖𝜔Δ𝑐𝑠(𝑟, 𝜔) = 𝐴𝐷𝐷𝑠
1
𝑟2
𝜕
𝜕𝑟(𝑟2
𝜕[Δ𝑐𝑠(𝑟, 𝜔)]
𝜕𝑟)
− 𝐷s
𝜕Δ𝑐𝑠(𝑟, 𝜔)
𝜕𝑟|
𝑟=0
= 0 − 𝐷s
𝜕Δ𝑐𝑠(𝑟, 𝜔)
𝜕𝑟|
𝑟=𝑅s
=Δ𝑗s(𝑟, 𝜔)
𝐹Δ𝜃∗
=Δ𝑐s|𝑟−𝑅𝑠
𝑐s,𝑚𝑎𝑥
Not applied in the separator region (0 < 𝑥
< 𝑙s)
Impedance 𝑍 =Δ𝑉
Δ𝐼(𝑥, 𝜔)=
Δ𝑉
𝜎eff 𝜕Δ𝜙𝑠(𝑥, 𝜔)
𝜕𝑥|
𝑥=𝑙𝑠+𝑙𝑝
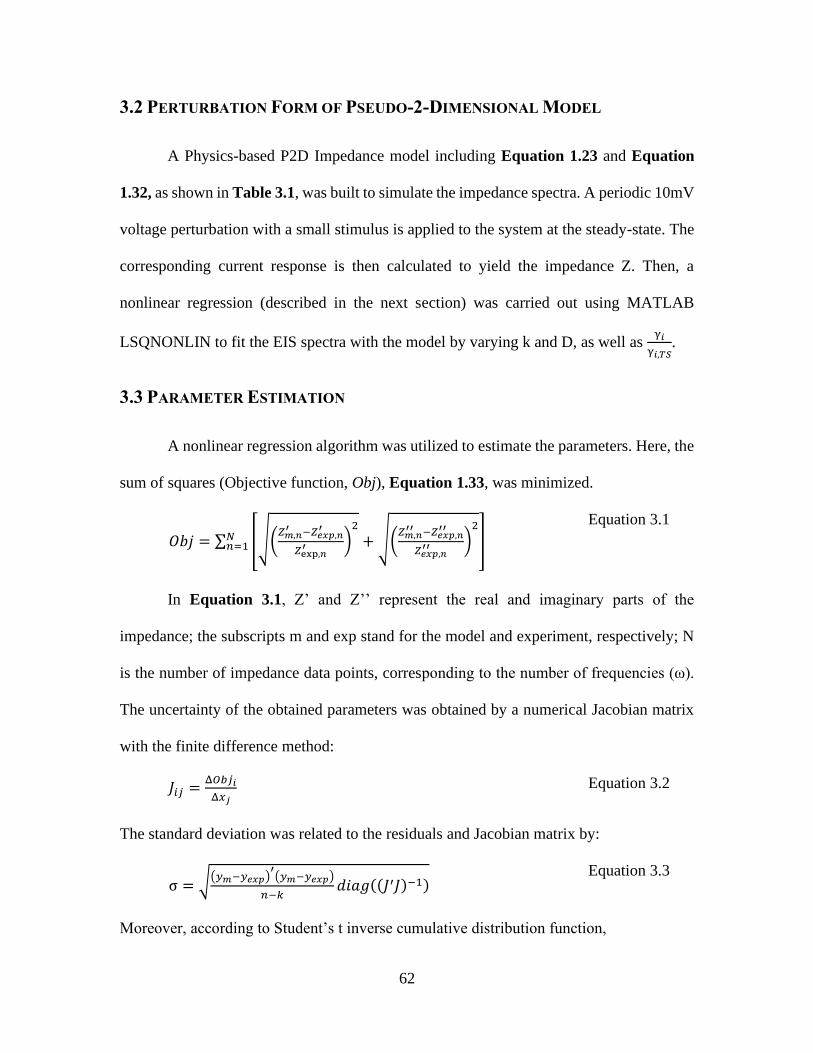
62
3.2 PERTURBATION FORM OF PSEUDO-2-DIMENSIONAL MODEL
A Physics-based P2D Impedance model including Equation 1.23 and Equation
1.32, as shown in Table 3.1, was built to simulate the impedance spectra. A periodic 10mV
voltage perturbation with a small stimulus is applied to the system at the steady-state. The
corresponding current response is then calculated to yield the impedance Z. Then, a
nonlinear regression (described in the next section) was carried out using MATLAB
LSQNONLIN to fit the EIS spectra with the model by varying k and D, as well as γ𝑖
γ𝑖,𝑇𝑆.
3.3 PARAMETER ESTIMATION
A nonlinear regression algorithm was utilized to estimate the parameters. Here, the
sum of squares (Objective function, Obj), Equation 1.33, was minimized.
𝑂𝑏𝑗 = ∑ [√(𝑍𝑚,𝑛
′ −𝑍𝑒𝑥𝑝,𝑛′
𝑍exp,𝑛′ )
2
+ √(𝑍𝑚,𝑛
′′ −𝑍𝑒𝑥𝑝,𝑛′′
𝑍𝑒𝑥𝑝,𝑛′′ )
2
]𝑁𝑛=1
Equation 3.1
In Equation 3.1, Z’ and Z’’ represent the real and imaginary parts of the
impedance; the subscripts m and exp stand for the model and experiment, respectively; N
is the number of impedance data points, corresponding to the number of frequencies (ω).
The uncertainty of the obtained parameters was obtained by a numerical Jacobian matrix
with the finite difference method:
𝐽𝑖𝑗 =Δ𝑂𝑏𝑗𝑖
Δ𝑥𝑗 Equation 3.2
The standard deviation was related to the residuals and Jacobian matrix by:
σ = √(𝑦𝑚−𝑦𝑒𝑥𝑝)′(𝑦𝑚−𝑦𝑒𝑥𝑝)
𝑛−𝑘𝑑𝑖𝑎𝑔((𝐽′𝐽)−1)
Equation 3.3
Moreover, according to Student’s t inverse cumulative distribution function,

63
𝑝 = 𝐹( 𝑡 ∣ 𝑣 ) = ∫Γ(
𝑣+1
2)
Γ(𝑣
2)
𝑡
−∞
1
√𝑣π
1
(1+𝑡2
𝑣)
𝑣+12
𝑑𝑡 Equation 3.4
where p is the desired probability and lies on the interval [0 1]; t values fall into 95%
probability. The confidence interval (CI) of a parameter was determined by:
𝐶 𝐼 = 𝑥 ± 𝑡 ⋅ σ Equation 3-5
3.4 EIS MODEL PARAMETERS
As discussed, the parameters used in the Physics-based impedance model are listed
in Table 3.2. Most of the parameters used in the model were determined from the
experimental measurements. A few were taken from the literature and the remaining six
were estimated by the non-linear regression described above. In the optimization process,
initial constants were taken from the literature, as shown in Table 3.2.
Table 3.2 | Parameters used in the EIS Model.
Variable Value Source
Initial electrolyte concentration ce,0 2000 [mol/m3] 69
Maximum Li capacity Cspmax 48230 [mol/m3] 50
Radius of particle Rsp 3.16 um SEM
Thickness of components Ls/Ln/Lp 20/50.27/68.77 um SEM
Porosity of electrode ɛls 0.67 MIP
Porosity of electrode ɛlp 0.42 MIP
Volume fraction of active material
ɛsp 0.7 MIP
Li-ion diffusivity Dspref 8.5966e-15[m2/s]*AD,cathode PBM
Interface reaction rate ienref 496.11[A/m2]*Ak,anode PBM
Interface reaction rate iepref 2.24[A/m2]* Ak,cathode PBM

64
Interface capacitance Cdln 0.2393[F/m2]* Ac,cathode PBM
Interface capacitance Cdlp 0.2393[F/m2]* Ac,anode PBM
Contact resistance Rcur 0.0013[Ωm2]* AR PBM
Electronic conductivity σpos 8.27·10-3[S/m] Four-terminal
LSV
Maximum SOC SoCmax,pos 0.997 GITT
Minimum SOC SoCmin,pos 0.305 GITT
Open circuit voltage OCVpos Variable of xpos GITT
Li-ion conductivity in electrolyte κl Variable of ce, 67
In total, there are six pre-factors in the optimization procedures and they are
associated with six parameters: Ak,cathode (the reaction rate at the cathode/electrolyte
interface), Ak,anode (the reaction rate at the Li-metal foil/electrolyte interface), Ac,cathode (the
capacitance at the cathode/electrolyte interface, Ac,anode (the capacitance at the Li-metal
foil/electrolyte interface), AD,cathode (the Li-ion diffusivity in the cathode particles), and AR
(the current collector/electrode contact resistance).
Figure 3.5. | Model and Experimental data comparison in (a) complex plan (Nyquist) plot,
(b) magnitude of impedance (|Z|), and (c) phase angle (θ). Reproduced with permission
from IOP Publishing.98

65
As shown in Figure 3.5, nine impedance spectra were collected, each tested at a
different cathode xLi. The xLi are listed in Table 3.3. Good agreement between the
experimental data (symbols) and model predictions (lines) was reached for all the
impedance spectra. Generally, each of the impedance spectra contained two overlapping
arcs and a long Li-ion diffusion tail. The intermediate frequency peak is associated with
Butler-Volmer reactions at NMC532/electrolyte interface; the high-frequency peak is
related to the reaction at the Li-metal/electrolyte interface.
Table 3.3 | Optimized parameters
Curve No. xLi OCV Ak AD
1 0.96 3.63 3.63 0.01
2 0.89 3.68 6.97 0.04
3 0.81 3.72 9.30 0.10
4 0.74 3.75 10.98 0.19
5 0.66 3.79 13.23 1.15
6 0.59 3.86 15.05 4.92
7 0.52 3.96 17.94 12.39
8 0.47 4.06 20.42 17.49
9 0.40 4.18 19.79 22.65
Table 3.3 also lists the optimized Ak,cathode and AD,cathode to make the predictions in
Figure 3.5. Figure 3.6 shows the model prediction with a 95% model Confidence Interval
(CI) using the optimized parameters. The calculation of the model CI was detailed in the
Parameter Estimation Section. The model predictions fall between the 95% confidence
interval for all nine curves. The sensitivity of different portions of the curves to the
parameters varies with OCV.

66
Figure 3.6. | Comparing the Nyquist plots from model and experimental data with 95%
Confidence Intervals under different xLi of the cathode: a) xLi =0.96, b) xLi =0.89, c) xLi
=0.81, d) xLi =0.74, e) xLi =0.66, f) xLi =0.59, g) xLi =0.52, h) xLi =0.47, and i) xLi =0.40.
Reproduced with permission from IOP Publishing.98
Figure 3.7. | Optimized Parameters as a function of OCV for (a-f) Ak,cathode, Ak,anode,
Ac,cathode, Ac,anode, AD,cathode, and AR. Reproduced with permission from IOP Publishing.98
a b c
d e f

67
Figure 3.7 shows the correlation between xLi and the optimized parameters. For
Ak,cathode and Ak,anode, the uncertainties in the parameters are higher at higher OCVs. While
both pre-factors increases vs OCV, the magnitude of Ak,anode is more than one order of
magnitude lower than Ak,cathode. Besides, combining with the baseline parameters in Table
3.2, the order of magnitude of exchange current density in both electrodes are similar. For
Ac,cathode and Ac,anode, the capacitance at the NMC/electrolyte interface first decreases with
the OCV, and then reaches a plateau. The uncertainty in Ac,cathode is almost 50%; the
magnitude of Ac,anode (high-frequency arc) is around one order of magnitude smaller than
Ac,cathode; Ac,anode increases first and then reaches a relatively stable value. For AD,cathode, the
diffusion coefficient in NMC particles increases nonlinearly with the OCV. However, the
uncertainty in AD,cathode can be 100%, especially at higher OCV. For AR, the current
collector/electrode interfacial resistance does not appreciably vary, though it does decrease
with the OCV. The sensitivity of each of the estimated parameters is shown in Figure 3.8.
The sensitivity of AD,cathode varies significantly in the OCV range.
Figure 3.8. | Sensitivity of each parameter. Reproduced with permission from IOP
Publishing.98

68
Therefore, there might be relatively larger uncertainty in this parameter. The
uncertainty of the parameters was obtained by the numerical Jacobian matrix with the finite
difference method, as given in the Parameter Estimation Section. Processing the data AD
and Ak in Table 3.3 by dividing their counterparts at the lowest xLi (0.4, curve 9), their
relative values can be obtained as A𝐷 =γ𝑖
γ𝑖,0.4(1 +
∂ ln γ𝑖
∂ ln 𝑐𝑖) / (1 +
∂ ln γ𝑖,0.4
∂ ln 0.4) and A𝑘 =
(γ𝑖
γ0.4)
α
, which are plotted versus xLi in Figure 3.9. Also, D varies over 3 orders of
magnitude, and k changes by 1-2 orders of magnitude. Both pre-factors were fit by a
lognormal function A = 𝑦0 +𝐵
√2𝜋𝜔𝑥𝑒
(−(ln(𝑥
𝑥𝑐)
2/2𝜔2))
with a Levenberg-Marquardt iteration
algorithm. The parameters are given in Table 3.4.
Table 3.4 | Parameters used in Fitting of A in Figure 3.9
Pre-factor y0 B w xc
AD -0.0085 0.22746 0.21916 0.42365
Ak -0.05953 0.68552 0.53641 0.54787
Figure 3.9. | Relative pre-factors for k and D for the cathode. Reproduced with permission
from IOP Publishing.98

69
3.5 THERMODYNAMIC NONIDEALITY
As discussed in Section 1.6, the transport and kinetic nonideality (diffusion or
reaction) of a Li-ion electrode is closely correlated to its thermodynamic non-ideality
(chemical potential). The variation of the latter can be described by the open circuit voltage
of the electrode mathematically. For an electrode reaction (where M = Ni, Mn, Co, or
mixed), the intercalation/deintercalation energy of Li-ion can be calculated as,
(𝑥2 − 𝑥1)(Li+ + e-) + Lix1𝑀*O2 → Lix2
𝑀 ∗ O2 Equation 3.6
The Li-ion content, xLi, was varied between 0.4 and 1 according to the experimental
section. The thermodynamic equilibrium of the system can be expressed as:
μ𝐿𝑖𝑥2𝑀∗𝑂2− (𝑥2 − 𝑥1)μ𝐿𝑖 − μ𝐿𝑖𝑥1𝑀∗𝑂2
= −𝑒(𝑥2 − 𝑥1)𝐸 Equation 3.7
where E is the open circuit voltage at a given xLi; e is the magnitude of the elementary
electrical charge of an electron with a value 1.6×10⁻¹⁹C; Li , the chemical potential of
Lithium metal is not a function of xLi and therefore equals 0Li . Plugging Equation 1.17
and Equation 1.18 into Equation 3.7, and with further derivation, the following
relationship can be obtained:
𝑑 ln γ
𝑑𝑥𝐿𝑖= −
𝑒𝐸𝑥𝐿𝑖− μ𝐿𝑖
0
𝑘𝐵𝑇−
1
𝑥𝐿𝑖
Equation 3.8
In Equation 3.8, E versus xLi can be obtained by GITT measurements, as shown in
Figure 3.11; μ𝐿𝑖0 = −𝑒𝐸𝐿𝑖 = 3.04[eV] can be determined by the chemical potential of Li-
metal versus Standard Hydrogen electrode reported in the literature. With the two terms on
the right-hand side of Equation 3.8 known, the first-order derivative of the logarithm of
the activity coefficient towards xLi, 𝑑 ln γ
𝑑𝑥𝐿𝑖, can be calculated. If the solid electrode particles

70
are dilute solutions, the activity coefficient equals 1, so 𝑑 ln γ
𝑑𝑥𝐿𝑖should be 0; on the contrary,
if nonideal effects exist in the particles during charge/discharge cycles, 𝑑 ln γ
𝑑𝑥𝐿𝑖 will be a
function of xLi. Based on the available experimental data, 𝑑 ln γ
𝑑𝑥𝐿𝑖 is contrived in the following
plot, shown in Figure 3.10.
Figure 3.10. | 𝑑 ln 𝛾
𝑑𝑥𝐿𝑖 as a function of xLi obtained from Equation 3.8. Reproduced with
permission from IOP Publishing.98
In Figure 3.10, obviously, 𝑑 ln γ
𝑑𝑥𝐿𝑖 is a strong function of xLi, and γ is cannot be a
constant. Such a correlation is consistent with the nonlinear profiles of pre-factors A shown
in Figure 3.9. It also illustrates that the variation in the activity coefficient contributes to a
significant portion of the chemical potential change −𝑒𝐸𝑥𝐿𝑖
−μ𝐿𝑖0
𝑘𝐵𝑇, whereas the change of
chemical potential that resulted from xLi variation can almost be neglected. Such
predictions further confirm that significant thermodynamic nonideality exists in the solid

71
cathode material during charge/discharge cycles and it will lead to substantial transport and
kinetic nonideality in the electrode material.
Figure 3.11. | GITT measurement of NMC532 half-cell during the charging/discharging
cycles Reproduced with permission from IOP Publishing.98
3.6 IMPORTANCE OF INTEGRATING NONIDEALITY INTO PHYSICS-BASED
MODELS
Li-ion batteries are not only energy conversion devices but also a proxy to store
energy in the form of chemical potential in electrodes. For such energy storage materials,
both the transport and kinetic properties of electrodes will affect the overall cell
performance. Especially, when the Li-ion concentration becomes close to 1, the diffusivity
and reaction kinetics reduces exponentially with respect to xLi. Therefore, significant
overpotential is likely to occur, which is the root of degradation from undesirable parasitic
reactions. As shown in Figure 3.12, there are three discharge profiles predicted by models
with different pre-factors. For the black curve, A𝐷 and A𝑘 are both 1. In other words, the
diffusivity D and reaction kinetics constant k are assumed to be the same as those with
xLi=0.4. For the green curve, it is predicted by the model with functions A𝐷(𝑥𝐿𝑖) and

72
A𝑘(𝑥𝐿𝑖) shown in Figure 3.9. For the red curve, A𝐷 and A𝑘 are optimized to be 0.06 and
1 to regress the best fit with the green curve. There are no equivalent constants for A𝐷 and
A𝑘, which can lead to a same discharge profile as that with functions A𝐷(𝑥𝐿𝑖) and A𝑘(𝑥𝐿𝑖).
On the contrary, the discharge profile with the pre-factors in Figure 3.12 deviates
substantially from that obtained with constant pre-factors. Adjusting the two constant pre-
factors does not necessarily provide the same discharge profile.
Figure 3.12. | Comparison between different pre-factors: (a) discharge profiles
(Current=1C); (b) overpotentials; (c) xLi concentration profiles in active particles at the
end of discharge. Reproduced with permission from IOP Publishing.98

73
In practice, additional parameters will be augmented to fit the experimental curve,
so the obtained parameters do not represent the true properties of the cell. Only functions
A𝐷(𝑥𝐿𝑖) and A𝑘(𝑥𝐿𝑖) can reveal the true physical properties of the cell and equivalent
constants of them could lead to significant deviations in the electrochemical performance
predictions of the batteries. Figure 3.12b shows the overpotential profiles with different k
and D. The green (AD and Ak are constants) and red (AD=0.06 and Ak=1) curves reach
higher overpotentials much earlier than the black curve (AD=1 and Ak=1) due to the
different diffusivity into the cathode particles. As shown in Figure 3.12c, the Li-ion
concentration gradient at the end of discharge is much higher for the green curve than that
for the black curve. Therefore, the large diffusion resistance will lead to a significant loss
in capacity, which is the major reason for the shorter discharge time shown in Figure 3.12a.
3.7 SUMMARY
New pre-factors were derived that accurately describe the diffusivity and interfacial
reaction rate constant of a Li-ion battery cathode under the framework of concentrated
solution theory. To do this, electrochemical impedance spectra were fit by a physics-based
model through nonlinear optimization. The optimized pre-factors show significant
variation as a function of the SOC. Therefore, large nonideality exists in the solid Li-ion
active materials during the intercalation/deintercalation process. In the application of BMS,
especially for degradation prognosis through parameter estimation, it is important to
include such nonlinear pre-factors to achieve high fidelity prediction.
In summary, the work presented in this chapter is a corollary to Chapter 2, which
for recollection, applied experimental parameters from 50Ah full-cells to a reduced-order
Lumped model and prioritized rapid computation for BMS applications. The speed,

74
fidelity, and limitations can be seen in Table 3.5, which compares various model
complexities (e.g. standard pseudo-2D (P2D), pseudo-2D reduced order model (P2D
ROM), single particle model (SPM), Lumped model, and Lumped reduced-order model).
In essence, Chapter 2 showed the successful implementation of the State Space approach
to transform the PDEs in the Lumped model for order reduction and as a result, decreased
the computational time for 1 charge/discharge cycle by 50%. The Lumped reduced-order
model in Chapter 2 shines when computation speed, processing power, and parameter
extraction is the limiting factor (i.e. standard BMS), but the modified P2D model in this
Chapter explains the system at a much higher level of fidelity and is capable of capturing
non-ideality and describing the loss mechanisms on an electrode-level.
Table 3.5 | Advantages and Disadvantages of different model techniques
MODEL* P2D 53 P2D ROM 64 SPM 71 Lumped 74 TLM
# of parameters ~40 37 ~22 4 4
Calculation time
(single cycle) **
~73 s ~5 s ~6 s ~2 s <1 s
Model
complexity
Moderate-
to-high High Moderate Easy Easy
Ability to model
high C-Rates Yes Yes
Works well
for
moderate-
to-low rates
(<1.5C)
Works well
for low rates
(<1C), but
with fitting, it
can go to
>1C
Works well
for low rates
(<1C), but
with fitting,
it can go to
>1C
Current
distribution Yes Yes No No No
Need for
measurements/
experimental
difficulty
Yes/
Complex
Yes/
Complex
Yes/
Moderate
Minimal
(Discharge
profiles and
OCV is all)
No
Needs parameter
fitting Yes Yes Yes Yes Yes
*The other models (P2D, P2D ROM, SPM and Lumped) were developed using other experimental measurements that were not presented in this section.
**The calculations were performed using COMSOL Multiphysics 5.4 on a Precision WorkStation T7500 with Intel® Xenon® 12-core CP, 48Gb of RAM and NVIDIA Quadro 4000 video card.

75
CHAPTER 4: EXTREME OPERATION OF LI-ION BATTERIES
The experiments and models in Chapters 2 and 3 described commercial LIBs under
stable operating conditions, but nowadays LIBs are widely-integrated into advanced
applications (e.g. satellites, electric cars), which can be subjected to extreme conditions.
This chapter was created out of urgency and deals with the effect of low-temperature
operation of commercial LIBs, and seeks to answer questions about how rapid degradation
occurs and what are the root-cause and effects from a multi-scale perspective (e.g.
chemistry-level, particle-level, electrode-level, and cell-level). The U.S. Advanced Battery
Consortium (USABC) has established targets for deployed LIB packs, including 1) stable
operating temperatures from -40°C to +66°C, 2) lifespan of 15 years, and 3) 350 mile
drivable distance per full charge.99 For next-generation LIBs to achieve longer driving
ranges, it is imperative to extend the reversible energy density of operating cells, but this
typically comes with a tradeoff in safety and pack cycle life. The safe operation of high
energy density LIBs is a prerequisite of government regulations and it requires the
mitigation of thermal runaway. Extreme conditions and discrepancies in Li-ion battery
operating conditions (i.e. oscillations in temperatures, current, and depth-of-discharge)4,100–
102 and chemistry (i.e. additive engineering, fluorination, electrolyte,
anodes/cathodes)42,103–109 have led to unpredictable variations in the onset for catastrophic
cell-failure (i.e. rapid performance degradation, abrupt cell death, thermal runaway)110–114.
In particular, electrified transportation (e.g. electric cars, electric trucks, aircraft)5,115–117 are

76
on the precipice of extreme operating conditions, which include repetitive fast-charge/fast-
discharge in a matter of seconds (i.e. effect of acceleration and regenerative braking in
Figure 4.1)118–120 and possible exposure to extreme temperatures on Earth ranging from -
29oC (e.g. mountainous regions, troposphere for commercial airplanes) to +52oC (e.g.
desert regions, hotter areas)99 or abusive cold-mission space temperatures down to -20oC
to -40oC with thermal regulators (e.g. exploration rovers, spacecraft).121 Also, thermal
expansion and contraction due to temperature oscillations can lead to thermal shock and
mechanical failures, including active material delamination and current collector cracking.
The state-of-charge (SOC) of both the anode and cathode drifts due to parasitic Li-losses
either from kinetically governed solid-electrolyte interphase (SEI) formation at elevated
temperatures or thermodynamically forced irreversible Li deposition followed by SEI
passivation on the reactive Li surface at low temperatures or high C-rates.
Figure 4.1. | New European Driving Cycle (NEDC) speed correlations to current for a
given 1200s experiment.

77
4.1 FAILURE MODES
High-rate charging is highly desirable – especially in the electric vehicle sector that
is looking to compete with the timescale for refueling both gasoline and H2-fueled cars (~5
min, a battery charging rate ~10 C). During rapid charging of existing Li-ion batteries
(LIBs), either from fast-charging stations or regenerative braking, over polarization at the
anode drives Li deposition and dendrite formation, which can cause internal short-
circuiting leading to thermal runaway (TR) and catastrophic failure of the battery pack.5,122
Wide temperature operation for Li-ion batteries is also desirable – especially for electric
vehicles that operate in regional locations that are colder or hotter than usual.
Generally, TR initiates through a series of exothermic runaway reactions that build
upon each other (i.e. resulting in a cyclic pathway: heat enables reaction, reaction generates
heat) and can result in both cell-temperatures that far-exceed 600oC and complete release
of hot, toxic, and combustible gases (e.g. H2, O2, CO, CO2, CH4, C2H4, C2H6, HF).123,124
Generally, the electrolyte consisting of lithium hexafluorophosphate (LiPF6) dissolved in
ethylene carbonate (EC) and dimethyl carbonate (DMC) are employed and also have
combustible characteristics that can fuel the propagating flame (Figure 4.2). Furthermore,
hazardous gases like carbon monoxide (CO) are toxic and preferentially attacks
hemoglobin to form the deactivated oxygen carrier carboxyhemoglobin, resulting in tissue
hypoxia (acute CO toxicity = 1000 ppm).125
The evolution of other toxic fluorinated-gases (e.g. HF, POF3, PF5) is primarily the
direct result of the hydrolysis reaction of LiPF6, which under USA’s Protective Action
Criteria (PAC), gaseous HF is incredibly toxic and has irreversible/serious health effects
at 24 ppm, poses life-threatening risks at 44 ppm,126 and displays high corrosivity. The

78
resulting fire, gas emissions, and/or explosion due to thermal runaway are spotlight hazards
that result in the catastrophic failure of the entire application system.127 Real-world
implications have severe consequences such as events involving thermal damage of Li-ion
batteries on the Boeing 787 Dreamliner128 or the Samsung Galaxy Note 7 where welding
burrs or design flaw and deflected electrodes can result in high local mechanical and/or
thermal stress that eventually compromises the separator and causes thermal runaway.129
Figure 4.2 | Schematic of low-temperature Li0 plating and gas generation over repetitive
cycling and subsequent over-pressurized venting after room-temperature recovery.
Reproduced with permission from American Chemical Society.130
4.2 LITHIUM PLATING MECHANISM AND RAPID BATTERY DEGRADATION OF
COMMERCIAL LI-ION BATTERIES UNDER LOW TEMPERATURE
Fast charge and/or low-temperature operation of Li-ion batteries at a relatively high
state of charge (SOC), can result in anode overpotentials that well-exceed the Li/Li+ redox
couple, resulting in Li0 deposition, which is widely debated in the literature to be a trigger

79
for thermal runaway. Therefore, an extensive suite of characterization techniques was used
to study how rapid battery degradation occurs due to severe Li0 plating. First, the
electrocrystallization of Li0 onto a nucleation seed depends largely on the crystallization
surface and the facet orientation of Li0 seeds. Determining the facet where Li0
preferentially deposits is extremely difficult due to poor interaction with X-ray sources and
high reactivity in many testing environments. Steiger131 was able to deposit well-faceted
Li0 particles potentiostatically at -0.1V vs Li/Li+ for 100s, and found due to interfacial
interaction of Li0-SEI interface, that Li0 deposition preferentially occurs on the lowest
interfacial energy plane, 110. It should be noted that the electrolyte, additives, and SEI
composition will create inherent differences in the electrodeposition process. Steiger also
found whisker formation after a set termination-size of the particle, and then homoepitaxial
elongation of the same facet occurs to form whiskers. The preferential growth of
electrodeposits is also compounded with non-homogenous current densities, which causes
non-uniform Li0 deposition. The growth of high surface area and high reactivity Li0
electrodeposits, results in further electrolyte reduction, depletion of Li+, and uncontrolled
growth of a resistive SEI layer. Also, Li0 dendrites can grow within the pores of the
polymeric separator that result in internal short circuits and aggressive thermal runaway.
4.3 EXPERIMENTAL
4.3.1 EXTREME BATTERY OPERATION AND ELECTROCHEMICAL TESTING
Low-temperature gas generation experiments were conducted on as-received 50Ah
NMC532/graphite large-format prismatic cells with two jellyrolls inside. The cycle
performance of these cells is evaluated by low-temperature constant current-constant
potential (CC-CP) cycling and 1000Hz AC impedance inside a Tenney T6S-1 temperature

80
control chamber (T = -29oC or 0oC) with an Arbin MSTAT battery cycler. Each
NMC532/graphite large-format prismatic cell was equipped with three K-type
thermocouples (thermocouple 1: terminal, thermocouple 2: in-between clamps and cell,
thermocouple 3: ambient). Both -29oC and 0oC temperature experiments were carried out
on cells that were cycled at 0.3C (15A) from 2.8-4.25V with a CP tapering constraint of
<0.05C (2.5A).
To understand the effects of low-temperature cycling on the structure of the
electrodes and cells, both tested and fresh cells were disassembled. Cell teardown was done
at complete discharge to the lower voltage bound (2.8 V) and relaxed at open circuit
potential (OCP) for 24 hours to reach electrochemical equilibrium. These fully discharged
cells were securely insulated with electrical tape and transferred inside an argon-filled (Ar,
UHP Praxair) MBraun Labmaster SP glovebox (H2O and O2 levels < 0.1 ppm). Two
parallel breaching lines separated by 1 mm were etched 2 mm from the top and bottom of
the casing with a scalpel and acted as guides for cell opening. Next, a hydraulic cell opener
was used to remove the casing. Upon complete removal of the cell casing, the tabs and
busbar were mechanically separated from the jellyrolls and used for further electrochemical
and physical characterization. Each jellyroll was examined carefully to distinguish flat vs.
curved locations, edge vs. center, and tab proximity.
4.3.2 COIN-CELL TESTING
From some of the electrodes, 1.5 cm2 disks (cathode: NMC532, anode: graphite)
were cut from the jellyrolls with a Precision Disc Cutter (MTI Corporation). Each disk was
placed into its own glass vial (labeled to indicate anode vs. cathode, location on the
jellyroll, etc.) containing dimethyl carbonate (DMC, 99.9% purity, Sigma Aldrich Fine
81
Chemicals Biosciences) for 30 minutes and dried under vacuum for 30 minutes. Some of
the disks were transferred to an Ar-filled Kratos AXIS Ultra multipurpose transfer vessel
and removed from the glovebox for characterization. Other disks were used to assemble a
three-electrode split cell (MTI Corporation, equipped with a pressure gauge). To do this,
the active material was removed from one side of the current collector foils by exposing
the electrode to N-methyl-pyrrolidone (NMP, 99.5% Extra Dry, Acros). The reference
electrode was a lithium metal (Li, 99.9%, Alfa Aesar) ring (outer diameter = 24 mm, inner
diameter =15 mm). The electrolyte was 1.2M lithium hexafluorophosphate (LiPF6, 99.9%,
TCl America) salt dissolved in ethylene carbonate (EC, 99%, ACROS Organics) and
dimethyl carbonate (DMC, 99.9% purity, Sigma Aldrich Fine Chemicals Biosciences) at
3:7 EC: DMC mass ratio. The three-electrode cells were tested at both -29oC and 0oC at a
rate equivalent to 0.3C from 2.8-4.25V with a CP tapering current equivalent to <0.05C.
The anode potential was measured vs Li/Li+ reference electrode in the three-electrode
setup.
4.3.3 PHYSICAL CHARACTERIZATION
An extensive array of physical characterization tools was also used to understand
cell behavior. Energy-dispersive X-ray spectroscopy (EDS) and scanning electron
microscopy (SEM) were conducted with a Zeiss Ultraplus Field Emission Scanning
Electron Microscope (FE-SEM). X-ray photoelectron spectroscopy (XPS) wide scan and
high-resolution measurements were performed on a Kratos AXIS Ultra DLD XPS system.
The cathode composition and metal deposition (e.g. Li, Ni, Mn, Co) on the anode electrode
were evaluated by inductively coupled plasma optical emission spectroscopy (ICP-OES)
using a Perkin-Elmer 2100DV Spectrometer. To analyze the gaseous species in the cells

82
after cycling, the gas products were first collected in a syringe and fed to a customized,
multi-detector Agilent 7890B-5977B GC-MSD instrument. Carbon dioxide and carbon
monoxide were detected with a flame ionization detector (FID) and ethylene, methane,
hydrogen, nitrogen, and oxygen were detected with a thermal conductivity detector (TCD).
The GC response was calibrated by standard gases before the analysis. Multi-location
liquid nitrogen (N2) Raman Spectroscopy was conducted with a 633nm laser source set to
0.1% intensity, 1025m hole size, 300m width, grating 950. Raman samples were first
treated with liquid nitrogen(N2) to prevent material degradation due to the laser source.
The calibration of the spectrometer was done before the samples with a =520.7cm-1 silica
standard at a tolerance of 1.0cm-1.
4.4 RESULTS AND DISCUSSION
4.4.1 ELECTROCHEMICAL-THERMAL RESPONSE UNDER EXTREME OPERATION (THERMAL
RUNAWAY AND OVER-PRESSURIZATION)
Low temperature (LT) cycling experiments on 50Ah NMC532/graphite large
format cells were found to undergo two primary life-limiting processes: 1) non-thermal
runaway venting process (i.e. over-pressurization) or 2) thermal runaway venting with
ejecta products (e.g. Cu/Al shreds, carbon, cathode material) after room temperature
recovery from repetitive cycling at T = -29oC (thermocouple temperature) at a current of
15A (C-Rate = 0.3C). As shown in Figure 4.3a, the characteristic average discharge
capacity (over 5 cycles) was 50.85 Ah. Transitioning from room temperature to low
temperature (LT, T = -29oC) immediately caused the discharge capacity to drop to 36.72
Ah (Cycle 6), a loss of 28%, as expected.

83
Figure 4.3. | Low temperature electrochemical and thermal analysis on the effects of Li0
plating and gas generation. (a) Cycle performance and coulombic efficiency during
temperature transitions (RT→ -29oC →RT), (b) charge-discharge profile highlighting the
temperature transitions and charge/discharge currents (i.e. characteristic no plating curve
at 2.5 A and other plating curves at 15A), (c) internal resistance measured by AC-1000Hz
method and relaxation voltage before discharge, (d) Qmax normalized differential capacity
analysis to decouple the no Li+ stripping characteristic curve and identify Li+ stripping
peaks79 under the more extreme charge/discharge current (15A), and (e) temperature
recovery back to RT and cycling results catastrophic venting that causes the cell to
internally shutdown. Reproduced with permission from American Chemical Society.130

84
Over 390 cycles of low-temperature CC-CP cycling, the final discharge capacity
was found to be 3.96Ah, only 11% of the original low-temperature capacity. The
coulombic efficiency at 25oC was near 1.00, but significantly dropped initially, and was
only 0.988 over the first 100 cycles. Coulombic efficiencies less than 1.00 are typically
attributed to irreversible parasitic reactions (i.e. irreversible Li0 plating/stripping, SEI
formation, electrolyte oxidation). After room temperature recovery and cell-relaxation to
electrochemical and thermal equilibrium, the discharge capacity was 31.37 Ah (Cycle 396),
showing that some of the capacity loss was due to parasitic reactions that consume charge,
but some can also be ascribed to higher electrode overpotentials during cell aging. After 8
additional cycles at 25oC (Cycle 404), one 50Ah cell (red curve in Figure 4.3b) underwent
non-thermal runaway venting during the discharge process (~3.8V).
Figure 4.3b takes a closer look at the cycling behavior of the cell that experienced
non-thermal runaway. Discharge profiles at various operating conditions and cycle number
(note the temperature and current applied in the legend) are presented. The characteristic
discharge profile at room temperature (1st cycle) displays characteristics that are consistent
with NMC532 and graphite full cells (i.e. transition at ~50% SOC attributed to NMC532
and phase transitions at lower SOCs to graphite). After transitioning from RT to LT in
Cycle 6 (0.05 C), the most notable change in the discharge profile is the disappearance of
the phase change region attributed to graphite at low SOCs. This is due to a drastic increase
in the ohmic and kinetic overpotentials, which drives the voltage to the end-of-discharge
voltage prematurely (which manifests as a loss in capacity). Upon recovery to room
temperature (396th cycle), the discharge follows a similar trend to that of the (1st cycle) but
diverges significantly with the loss of the inflection point attributed to NMC532. The

85
discharge profile is also completely devoid of the phase change response for graphite (refer
to my archival publications on the same 50Ah cells for delineation)78,98. As mentioned
above, after 8 RT cycles, this particular cell underwent catastrophic cell failure by non-
thermal runaway and venting. Operationally, this meant that the pressure valve opened,
and the safety fuse was triggered, which led to the instantaneous drop in voltage. As shown
in Figure 4.3c, the average starting discharge voltage at LT increased nearly linearly with
cycle number (slope ~ 1.2 mV/cycle) over the first 100 cycles, then tapering off at 0.13
mV/cycle for the remaining cycles. After recovery to room temperature (RT), the voltage
was 32 mV higher than the 1st cycle, which indicated a mixed potential between Li0 and
LixC6. Also, the ohmic resistance at RT was 0.839 mΩ, which more than doubled to
2.08mΩ at -29oC. By the end of LT cycling, the ohmic resistance had doubled to 4.03 mΩ.
The increase in ohmic resistance during the transition from RT to LT is attributable to the
decrease in charge carrier mobility in the electrolyte. The cycling-induced ohmic resistance
can originate from multiple factors including Li0 plating/SEI formation which decreases
the ionic conductivity of the electrolyte due to electrolyte reduction(anode) or
oxidation(cathode).
Figure 4.3d presents the differential voltage analysis normalized to Qmax (for
comparison of different capacities).79 QmaxdV dQ-1 is capable of differentiating potential
plateaus, even in narrow voltage regions where a competing reaction is occurring and can
be used to interrogate peaks associated with Li-stripping.132 The characteristic QmaxdV dQ-
1 at room temperature/0.3C (labeled: RT/15A) and low temperature/0.05C (labeled:
LT/2.5A) confirms the hypothesis that Li-stripping does not occur under mild conditions
and will be used as characteristic curves. Peak 2, 3, and 4 in QmaxdV dQ-1 at room

86
temperature/0.3C is consistent plateaus/peaks ascribed to NMC532/graphite cells. In
contrast, the QmaxdV dQ-1 for LT/0.3C (labeled: 29oC/15A in Figure 4.3d) shows the
occurrence of an inflection at the beginning of discharge which indicates a plateau/peak
for Li-stripping (indicated as peak 1). At the end of LT/0.3C experiments, the cells
recovered from LT to RT after a 24-hour relaxation period to reach thermal and
electrochemical equilibrium. Figure 4.3e shows the temperature and voltage profile for the
cell after equilibration back to 25oC, which starts with a low 0.05C charge. The temperature
profile during the venting event drops to 25oC, the cell shuts down as indicated by the drop-
in voltage and referred to as non-thermal runaway overpressurized venting.
4.4.2 SEVERE GASSING AND ELECTRODE CHARACTERIZATION
The electrolyte and active material (NMC532/graphite) decomposition are
exacerbated under abuse conditions and results in severe gas evolution. Postmortem gases
were evaluated by GC-MS and represented in Figure 4.4a. The presence of carbon dioxide
(CO2) and carbon monoxide (CO) was detected by flame ionization detector (FID).
Additional gases including ethylene (C2H4), methane (CH4), hydrogen (H2), and oxygen
were detected by thermal conductivity detector (TCD). It is important to note, GC-MS has
limitations in deconvoluting multicomponent mixtures and detecting trace quantities of
short-lived reactive chemicals (e.g. HF, POF3, etc.). Besides the gas evolution reactions
listed in Figure 4.2, which are the more common gassing reactions, additional side
reactions can occur during extreme conditions. The proposed gas generation reaction
mechanism is illustrated in Figure 4.4b. The combination of Li0 deposition and the large
electrochemical polarization at low temperatures can drive further electrolyte
decomposition. The formation of ethane (C2H6) proceeds via Li0 corrosion and attack on

87
dimethyl carbonate (DMC), to cause the cleaving of two C-O bonds, then dimerization,
and subsequent formation of Li2CO3. Also, steric hindrance can prevent significant ethane
evolution from the cleavage of the methyl groups on DMC and the subsequent dimerization
reaction. The hydrogenation reaction of the cleaved methyl group can evolve methane. The
decomposition of ethylene carbonate (EC) via Li0 corrosion and electron propagation
causes the EC ring-opening mechanism to form ethylene and Li2CO3. Significant release
of the gases during -29oC cycling, in combination with the shift in equilibrium vapor
pressure of the electrolyte and gas expansion when the cell was brought back up to 25oC,
significantly increased the internal pressure – leading to valve rupture and failure.
Figure 4.4. | Plot showing (a) the gases accumulated during cycling, as detected by the Gas
chromatography-Mass spectrometry (GC-MS) analysis of post-mortem electrodes and (b)
proposed Li0 corrosion reaction mechanism for gas generation. Reproduced with
permission from American Chemical Society.130

88
Electrode samples were collected from the non-thermal runway vented cell inside
the MBraun glovebox (H2O and O2 levels < 0.1 ppm) with a hydraulic prismatic cell
opener. Table 4.1 reveals significant variations from the “initial-to-final layers” (that is,
the first unravel of jellyroll to final unravel). The initial layers (outermost) were found to
have a greater degree of particle delamination from the current collector. Also, there’s
significant warping at the “curved regions” of the jellyroll. The most likely explanation for
this originates from the volumetric expansion/contraction during charge/discharge, such
that the outermost layers experience the cumulative expansion/contraction of all the
subsequent layers. Subsequently, the outermost layers stretch more, and microfractures in
the active layer propagate after repetitive cycling, which results in particle delamination.
Graphite was much more extensively detached from the current collector surface than
NMC532, which is potentially due to Li0 deposition and gas evolution that leads to drastic
volumetric expansion.133 Most notably, the curved areas of the jellyroll shows a tendency
for warping and significant fractures. Also, there was significant color anisotropy from the
“tab edge to the center” of each layer (RT vs LT cycling). In fact, a ripple-type structure
propagated from the electrode edge towards the center.
Table 4.1. | Presents the spatial heterogeneity of both the Li(Ni0.5Mn0.3Co0.2)O2 cathode
and graphite anode for the full jellyroll analysis.
Electrode
Designations
Description
Initial-to-final
layers
Initial layers have a greater degree of particle delamination from the
current collector and displayed high warping at the curved regions
compared to the final layers at the interior of the jellyroll
Flat-to-curved
regions
Curved regions appear extremely brittle in comparison to flat
regions
Tab edge-to-
center
Ripple distribution from edges to center region and from tab to
curved regions

89
Figure 4.5 explores the spatial morphological inhomogeneity of the outermost
anode of the jellyroll. This analysis looked at the electrode in 8 distinct locations. SEM
images of the near-tab edge (Location 1) found gas pockets in the vicinity of particles that
are fused together (that is, indistinguishable boundaries between particles) as well as Li0
deposits. Furthermore, the gas evolution and transformation of the electrode morphology
is intensified in immediate proximity to the tab (Location 2). Severe gas evolution at
Location 2 seems to have caused the significant displacement of the graphite particles,
indicated by a random distribution of peaks and valleys. Also, large quantities of voids are
present.
Figure 4.5. | SEM images of different areas on the surface of the anode reveal high spatial
anisotropy of low-temperature Li0 plating/gas generation and the sample collection regions
on the LixC6 negative electrode at the center with near-tab, center, far-edge, and curvature
designations. Reproduced with permission from American Chemical Society.130

90
However, the severity of displaced particles due to gas evolution at the tab itself
(Location 3) was found to be less severe than that of Location 2. Negligible gas pockets
were found at Locations 4, 5, and 6 which correspond to regions away from the electrode
edge. At higher magnifications, Li deposits were observed on top of graphite. The Li
deposits in Locations 1, 2, 3, and 4 appear mossy-like and agglomerated in comparison to
Locations 5 and 6, where Li covers the surface semi-uniformly. Large electrochemical
polarization during low-temperature cycling can exacerbate highly stressed areas, and
cause voltage spikes at the edges, which promotes dendritic whiskers and/or mossy
Li0.134,135 At the far edge (Location 7), the combination of Li deposits and severe gassing
were observed similar to that of Locations 1-3. Micro-fractures and cracks were found at
the curved area of the jellyroll (Location 8). In addition to the micro-fractures, severe Li
plating was apparent from the SEM and indicated by the lighter deposits on top of graphite
in every Location.
In general, SEM analysis suggests large discrepancies in the degree of Li
deposition, gas evolution, and morphological changes, and can be isolated into 3 primary
regions. At the electrode edges, there was significant Li deposition in combination with
severe gassing (indicated by gas pockets and lighter deposits on the surface of graphite).
The center region of the electrode had less gassing, reduced Li deposition on the surface,
and graphite agglomeration. At the curved region of the jellyroll, the cumulative
expansion/contraction of the subsequent layers during cycling led to significant fracturing
and particle delamination from the current collector. Also, the spatial dependence of Li0
plating and gas generation was elucidated and provides probable cause for the non-thermal
runaway venting.

91
4.4.3 VARIABLE STATE OF CHARGE (SOC) IDENTIFICATION
To better show how the LT abuse cycling impacted electrode morphology, Figure
4.6 presents enhanced optically filtered images (EOFI) of Li(Ni0.5Mn0.3Co0.2)O2 (Figure
4.6a) and LixC6 (Figure 4.6b) from both a cell that was cycled under non-abuse conditions
as well as one that experienced non-thermal runaway venting. Non-abuse cycled cells
(RT/0.3C and no extreme conditions) had fairly uniform electrodes from the tab to the
region of high curvature (note, the tab indication is for the anode because +/- tabs alternate
between full revolutions). The deviations in intensity in the EOFI relates to the deformity
of the electrode. By interrogating the EOFI, rippling contours can be accentuated in the
abuse conditions (i.e. electrode warping) in comparison to the non-abuse conditions (i.e.
uniformity in electrodes). Analysis of the EOFI shows post-mortem electrodes (i.e. vented
cell) with high anisotropy and significant warping, which is consistent with the severe
gassing and bloating of the cell. Most notably, the electrodes display a ripple-type
distribution that propagates from the “edge-to-center” and “tab-to-high curvature”.
During repetitive charge/discharge at low temperature, current distributions tend to
follow a ripple-type behavior (i.e. indicated by peaks and troughs of Li0 deposits), which
is potentially due to warping of the electrodes under high electro-mechanical stress
conditions. Multi-location liquid N2 Raman spectroscopy was performed on
Li(Ni0.5Mn0.3Co0.2)O2 and LixC6. Essentially, NMC532 has 𝑅3𝑀(D3D5) space group
tendencies that produce A1g and Eg in all regions (e.g. curvature, ripples, center, and
bottom) in Figure 4.6a. The A1g and Eg correspond to M-O (M = Ni, Mn, Co) out of plane
stretch at ~595 cm-1 and the O-M-O in-plane bend at ~474 cm-1. Therefore, the relative

92
intensities of A1g for M-O and Eg for O-M-O vibrations can be used to determine the spatial
Li distribution.
The high-resolution metal-oxygen vibrations at bands between 300-750 cm-1 for
the cathode change significantly based on locations, which indicates different lithiated
states of NMC532 lattice across the electrode. At a lower degree of lithiation (x < 0.4) or
subject to higher local voltages, the Raman peak shifts from 595 cm-1 to values greater than
600 cm-1 and become a merged-broad peak. However, when the Raman A1g and Eg bands
are well resolved, NMC exists at higher state of charges and experienced lower voltages.
The Raman spectra at several locations on the anode and cathode are shown in the bottom
portions of Figure 4.6 and Figure 4.6b, respectively. Qualitatively, well-resolved A1g and
Eg bands are observed for NMC electrodes at high curvature, which indicates higher
degrees of lithiation (I595/I474 ~1.81). When correlating this region with graphite (Figure
4.6b), a pronounced Raman peak at 1837 cm-1 was observed and was attributed to
vibrations from Li-carbide (Li-CC-Li) bonds.46
To form Li2C2, the Li0 corrosion reaction can facilitate neighbor-neighbor EC
reduction to adsorbed acetylene and further reaction to Li2C2. The same 1837 cm-1 peak
can be observed at various locations on the graphite electrode including regions of high
curvature, ripple-peaks near the edge, and the bottom edge. By focusing the Raman laser
source on the striation lines (ripple-peaks) and at the negative lines (ripple-troughs), an
1837 cm-1 high-intensity peak trend can be observed. Li-carbide was found to preferentially
form on ripple-peaks and absent at the troughs. Therefore, regions of high stress (e.g. high
curvature, ripple peaks, edges) exacerbate Li0 deposition and subsequently results in the
conditions that favor the formation of Li-carbides. Also, the degree of lithiation after low-

93
temperature repetitive cycling varies spatially in parallel with the counter graphite
electrode. High lithiation states for NMC was found in the highly stressed regions, which
corroborates the finding that under low-temperature cycling, severe gradients cause
preferential Li residence.
Figure 4.6. | Enhanced optically filtered images of (a) Li(Ni0.5Mn0.3Co0.2)O2 and (b) LixC6,
and multi-location liquid nitrogen Raman spectroscopy of the respective electrodes after
non-abuse conditions (room temperature) and post-mortem (low temperature) to analyze
spatial distribution of chemical species, state of charge, and electrolyte degradation
products. Reproduced with permission from American Chemical Society.130

94
4.4.4 CHEMISTRY ANALYSIS OF LIB FAILURE MODES UNDER EXTREME OPERATION
Finally, XPS was used to understand the chemical transformations of NMC532
after low-temperature cycling and to find the causes for the over-pressurization of the cell
without thermal runaway. XPS spectral analysis and deconvolution is shown in Figure
4.7for NMC532 and Figure 4.7b for graphite. XPS results for uncycled NMC532 showed
the presence of NiO (Ni2p peak 854.9 eV), CoO (Co2p peak 780.2 eV), and MnO2 (Mn2p
peak 642.5 eV). Of course, even electrodes that were cycled under non-abuse conditions
(e.g. RT/0.3C discharged to 2.8V) showed deviations in the chemical species and oxidation
state from the undischarged cell. The speciation of NMC532 electrodes found Ni2O3 (855.8
eV), CoO (780.2eV), Co(OH)2 (782.0eV), MnO2 (642.4 eV), and MnFx (644.4eV).
For cells discharged at LT, there were significant deviations in the chemical species
present on the anode, such as the presence of NiFx/Ni2O3 (857 eV), NiO (854.6 eV), and
Ni-carbides (849.9 eV). This is shown in the deconvoluted Ni 2p, Mn 2p, O 1s, and C 1s
spectra in Figure 4.7a. The existence of two valence states for Ni (Ni2+ and Ni3+) also
shows that the material degree of lithiation is not homogeneous. For Mn, cells cycled at
LT showed the presence of MnFx(643.5 eV), Mn2O3 (641.5 eV), and Mn-carbides (638.0
eV). A prominent peak for metal oxides is observed in the O1s for the non-abuse cycled
electrodes but a significant depression in the metal oxide 529.5 eV peak was observed in
the cells cycled at LT. Therefore, significant oxygen loss from NMC532 can be inferred
and is also confirmed by the speciation of Ni/Mn/Co fluorides and carbides in Ni2p, Mn2p,
and Co2p. The oxygen-associated species on the surface layer indicates the presence of C-
O bonds (peak at 531.0eV) and C=O bonds (peak at 532.0eV), which are the expected
spectra for Li2CO3 and lithium alkyl carbonates.136,137

95
Furthermore, the cathode electrolyte interphase (CEI) formed at low temperatures
can be probed in Figure 4.7a. The presence of carbon bonded to one oxygen (C-O) at
286.1eV, to two oxygens (O-C=O) at 288.2 eV, and three oxygens (carbonate-type) at
290.1eV was found. The bond formations reveal the CEI contains lithium carbonate
(Li2CO3) and possibly lithium alkyl (that is, methyl or ethyl) carbonates (R-
CH2O(C=O)OLi), which corroborates the O 1s spectrum analysis. Also, the spectrum
suggests the ring-opening mechanism for EC, which can lead to the formation of
LiO(C=O)OCH2CH2O(C=O)OLi (it is important to note that the decomposition product
can be formed during manufacturing or induced by harsh low-temperature conditions).138
The metal carbide peak at 283.0eV confirms the degradation of NMC532. The
phosphorus content in the sample is only 1.2 by mass or 0.6 by atomic percentage. The P2p
spectra indicate the presence of phosphates (133.2 eV), which are LiPF6 decomposition
products such as LiPOF2 or Li2PFO3, and are typically given a generic formula as LixPFyOz.
Overall, the electrolyte decomposition products on NMC532 consist of primarily Li2CO3,
lithium alkyl carbonates (CH3O(C=O)OLi, CH3CH2O(C=O)OLi and/or
LiO(C=O)OCH2CH2O(C=O)OLi), phosphates (LiPOF2 and/or Li2PFO3) (Note: further
deconvolution of the actual species require more information than C1s and O1s). There is
significant anisotropy in the electrolyte and/or active material decomposition products
across the electrode (i.e. tab, center, and high curvature regions), which indicates high
spatial dependence in the capacity fade and failure mechanisms of the cell.

96
880 870 860 850 658 651 644 637 537 534 531 528 292 288 284 280
880 870 860 850 60 56 52 48 537 534 531 528 292 288 284 280
Carbide849.9 eV
NiFx, Ni2O3
857.0 eV
NiO854.6 eV
Ni 2p
XP
S P
eak
Inte
nsi
ty /
a.u
.
Li(Ni0.5Mn0.3Co0.2)O2
LixC6
(a)
(b)
Carbide638.0 eV
MnFx643.5 eV
Mn2O3
641.5 eV
Mn 2p
Metal oxides529.5 eV
OH533.5 eV
O 1s
C=O532.0 eV
C-O531.0 eV
Carbides283.0 eV
C 1s
Carbonates, CFx290.1 eV
O-C=O288.2 eV
C-O286.1 eV
C=C284.6 eV
Carbide849.4 eV
NiFx, Ni2O3
857.8 eV
NiO854.3 eV
Ni 2p
LiF, Li2CO3, LiOH 55.3 eV
Binding Energy /eV
Li 1s
Lio
52.5 eV
Metal oxides528.6 eV
OH533.5 eV
O 1s
C=O532.0 eV
C-O530.8 eV
Carbides281.2 eV
C 1s
Carbonates, CFx289.7 eV
O-C=O288.0 eV
C-O286.1 eV
C=C284.6 eV
Figure 4.7. | X-ray photoelectron spectroscopy analysis of (a) Ni 2p, Mn 2p, O 1s, C 1s for
Li(Ni0.5Mn0.3Co0.2)O2, and (b) Ni 2p, Li 1s, O 1s, C 1s for graphite electrodes after -29oC
cycling and non-thermal runaway over-pressurization and venting. Reproduced with
permission from American Chemical Society.130
Multiple-location XPS was very useful for developing a firm understanding of the
degradation processes at the anode. The Ni2p, Li 1s, O 1s, and C 1s spectra at the curved
region of the anode are given in Figure 4.7b. Spectral peaks were discovered in the Ni2p
region for all three anode regions (tab, edge, high curvature), which indicates Ni as the
primary transition metal that is dissolved and redeposited on the anode at LT. Furthermore,
in the Ni2p spectra, Ni exists in a mixed oxidation state with NiFx/Ni2O3 (857.8 eV), NiO
(854.3eV), and Ni-carbide (849.4eV) species. In addition, by probing the Li1s spectrum a
muddled peak at 55.3eV attributes the solid electrolyte interphase (SEI) with LiF, Li2CO3
and LiOH species. Also, the shoulder peak protruding out at lower binding energies

97
indicates the presence of metallic Li0 at a binding energy of 52.5 eV, which confirms low-
temperature plating and irreversibly trapped Li0, even after room temperature recovery and
cycling. The quantity of Li also varies spatially along the electrode, which leads to
significant gradients in the concentration, potential, and current during operation as well as
uneven Li deposition at LT. In the O1s spectrum for LixC6, there is a prominent metal oxide
peak at 528.6eV which is ascribed to Li2O and Ni2+/Ni3+ species in the form of NiO and
Ni2O3. Also, similar C-O (530.8eV), C=O (532.0eV), and OH (533.5eV) peaks can be
deconvoluted from the broad main peak and ascribed to the SEI. In the C1s spectra, similar
bonds are observed for carbonates/CFx (289.7ev), O-C=O (288.0eV), C-O (286.1eV), C=C
(284.6eV), and metal carbide (281.2eV). The metal carbide peak shoulder extends further
out and displays significantly greater electron intensity in comparison to NMC532. Surface
Ni/Mn speciation of the NMC532 electrode indicates 18.3%/35% carbides near the tab,
54.4%/34.6% near the center, and 11.4%/32.7% near the region of high curvature. The low
Li atomic percentage near the center exacerbates the degradation of the cathode via metal
carbide formation. Therefore, the net flux of Li repetitively migrating towards areas of high
stress during cycling leads to over-exhaustion of NMC532 surfaces and results in severe
degradation.
Overall, one of the key findings of this work is that the degradation processes for
large jellyroll electrodes were highly spatially heterogeneous, where the degradation
process was found to be exacerbated at highly stressed regions (e.g. high curvature, ripple-
peaks, edges). SEM analysis discovered severe gassing and pocket formation near regions
of high mossy-like Li0 deposits. Also, the complete destruction of the graphite particle
morphology was observed and realized by the large-scale fusing of graphite particles (i.e.

98
indistinguishable boundaries that potentially originate from degradation residuals due to
Li0 plating) that span for >500m. At the center regions, Li0 plating still occurs but follows
a relatively more uniform deposition process. Also, negligible gassing was observed at the
center regions. At the electrode curvature, cumulative volumetric expansion/contraction of
every layer during cycling led to micro-fractures and large-scale cracks. Furthermore, XPS
revealed severe cathode degradation and indicated by oxygen release and subsequent M-
carbide (M = Ni, Co) degradation product. Low-temperature cycling appears to exacerbate
the cathode electrolyte interphase (CEI) formation due to large electrochemical
polarization, and XPS reveals the chemistry consists of significant quantities of Li, C, and
O elements that encompasses Li2CO3, lithium alkyl carbonates (CH3O(C=O)OLi,
CH3CH2O(C=O)OLi and/or LiO(C=O)OCH2CH2O(C=O)OLi), phosphates (LiPOF2
and/or Li2PFO3). Metallic Li0 and carbide formation at the anode was found to be severe.
By using Raman spectroscopy, a ripple-type behavior was observed for large jellyroll
electrodes. Also, Li-carbide (Li-CC-Li) 1837 cm-1 high-intensity band was observed at
ripple-peaks and absent at ripple-troughs. Lastly, highly stressed regions during low-
temperature cycling were found to have severe gassing, mossy-like Li0 plating,
morphological changes, and Li-carbide formation.
The speciation of Ni-species (Table 4.2) and the atomic ratio of Ni in the
anode:cathode is 1.1:2.5 (Table 4.3), which means that the high-intensity peak from metal
carbides (C1s peak at 281.eV) is attributed to a different metal-substitution (that is,
lithium). Therefore, one possible explanation for the high-intensity peak is the formation
of lithium carbides (Li2C2) from the corrosion of irreversibly trapped Li0 that is deposited
during plating at low temperature. Li2C2 is the most thermodynamically stable state out of

99
the possible lithium carbides (including LiC6, Li4C2, Li4C3), and exist with C22- as the
backbone tethered to two alkali metals in the form of LiC≡CLi. Li-carbides have similar
applications as diamonds,139 and exhibit physical properties of extreme hardness,
toughness, and excellent electrical conductivity, which can harden soft Li0 deposits.
Table 4.2 | Transition metal speciation for various regions (e.g. edge, center, curvature) of
surface Li(Ni0.5Mn0.3Co0.2)O2 and LixC6
Transition
metal
speciation
NMC532
Near-tab
NMC532
Center
NMC532
Curvature
LixC6
Near-tab
LixC6
Center
LixC6
Curvature
NixCy 18.3% 54.4% 11.4% 33.9% 26.7% 27.3%
NiO 39.7% - 25.3% 14.0% 35.3% 28.5%
NiFx,
Ni2O3
42.0% 45.6% 63.3% 52.1% 38.0% 44.2%
MnxCy 35.0% 34.6% 32.7% - - -
MnO2 65.0% 65.4% 35.3% - - -
Mn2O3 - - 32.0% - - -
Table 4.3 | Mass and atomic percentages (%) of the elements Li, P, C, O, F, Mn, Co, and
Ni at different regions for Li(Ni0.5Mn0.3Co0.2)O2 and LixC6 from XPS spectra analysis after
non-thermal runaway venting
Li(Ni0.5Mn0.3Co0.2)O2 LixC6 Edge Center High
Curvature
Edge Center High
Curvature
Species Atomic
%
Atomic
%
Atomic
%
Atomic
%
Atomic
%
Atomic
%
Li 15.1 7.3 11.1 30.8 16.5 23.6
P 1.3 1.0 0.6 0.7 0.9 1.1
C 43.2 52.6 48.0 28.0 40.9 34.8
O 21.0 18.5 22.0 30.8 28.3 26.9
F 16.7 16.3 14.6 8.9 11.8 12.5
Mn 0.3 0.6 0.3 - 0.2 -
Co 0.1 0.8 0.9 - - -
Ni 2.3 2.9 2.5 0.8 1.4 1.1

100
4.5 SUMMARY
Overall, one of the key findings of this work is that the degradation processes for
large jellyroll electrodes were spatially heterogeneous, where the degradation processes
were found to be exacerbated at highly stressed regions (e.g. high curvature, ripple-peaks,
edges). SEM analysis discovered severe gassing and pocket formation near regions of high
mossy-like Li0 deposits. In addition, the complete destruction of the graphite particle
morphology was observed and realized by the large-scale fusing of graphite particles (i.e.
indistinguishable boundaries that potentially originate from degradation residuals due to
Li0 plating) that span for >500m. At the center regions, Li0 plating still occurs but follows
a relatively more uniform deposition process. At the electrode curvature, cumulative
volumetric expansion/contraction of every layer during cycling led to micro-fractures and
large-scale cracks. Furthermore, XPS revealed severe cathode degradation and indicated
by oxygen release and subsequent M-carbide (M = Ni, Co) degradation product. Low-
temperature cycling appears to exacerbate the cathode electrolyte interphase (CEI)
formation due to large electrochemical polarization, and XPS reveals the chemistry
consists of significant quantities of Li, C, and O elements that encompasses Li2CO3, lithium
alkyl carbonates (CH3O(C=O)OLi, CH3CH2O(C=O)OLi and/or
LiO(C=O)OCH2CH2O(C=O)OLi), phosphates (LiPOF2 and/or Li2PFO3). Metallic Li0 and
carbide formation at the anode was found to be severe. By using Raman spectroscopy, a
ripple-type behavior was observed for large jellyroll electrodes. In addition, Li-carbide (Li-
CC-Li) 1837 cm-1 high-intensity band was observed at ripple-peaks and absent at ripple-
troughs. Lastly, highly stressed regions during low-temperature cycling were found to have
severe gassing, mossy-like Li0 plating, morphological changes, and Li-carbide formation.

101
CHAPTER 5: STRATEGIC DESIGN OF DURABLE, SAFE, ENERGY
DENSE LIB ANODES
The demands of emerging portable electronics, electric vehicles (EVs), and space
technologies have ushered in a new paradigm for engineers and scientists to develop safe,
durable, and lightweight rechargeable batteries.2,4,140,141 Commercial LIBs, which were
discussed in Chapters 1-4, have become the backbone of our electrified and interconnected
society, and have allowed device manufacturers to push the performance boundaries of cell
phones, laptops, and other devices. However, the emergence of enhanced capabilities (e.g.
GPS, music players, web browsing, video chats) and processing power (e.g. emerging 5G
networks, cloud computing) is expected to drain existing onboard batteries at an alarming
rate – thereby creating an urgency for Chapter 5 to discuss the development of advanced
next-generation, high energy density, and safe LIB materials.116,142 Also, high-rate
charging is highly desirable – especially in the electric vehicle sector that is looking to
compete with the timescale for refueling both gasoline and H2-fueled cars (~5 min, a
battery charging rate ~10 C). During such rapid charging of existing Li-ion batteries
(LIBs), over polarization at the anode drives Li deposition and dendrite formation, which
can cause internal short-circuiting leading to thermal runaway and catastrophic failure of
the battery pack.5,122 Therefore, new LIB anode materials are needed that are safer (no Li
plating during fast charging), have higher capacities (> 600 mAh g-1), and are durable (>
1000 deep cycles).42,55,143

102
5.1 MATERIAL SELECTION AND DESIGN STRATEGIES
One pathway to achieve high-rate charging at lower overpotentials (reducing the
driving force for Li-plating) is to create nano-sized electroactive materials. Small particle
sizes allow for enhanced reaction kinetics and rapid diffusion.117,144 Small size can
simultaneously enhance the ability of active particles to accommodate strain, as well as
significantly increase the number of charge carriers near the electrode-electrolyte interface.
However, batteries employing nano-sized active materials are typically penalized with
increased irreversible capacity loss, as well as decreased stability and reversibility. The
result is typically electrodes with low coulombic efficiency (CE), mediocre capacity, and
limited cycle life.
A second pathway to avoiding Li plating is to search for materials with a reversible
potential substantively higher than the Li/Li+ redox couple to provide a buffer in its
operating potential. Though materials with higher anode potentials might have lower
operating voltages, materials with much higher theoretical capacity than commercial
graphite will more than compensate for any energy density concerns, and the ability to
safely operate at higher discharge rates can also result in comparable or superior power
density. The desire to have nanostructured active materials with a higher anode potential
during charge/discharge leads to the consideration of a whole new set of chemistries that
have never before been deployed in commercial LIBs such as metal hydrides, nitrides,
oxides, fluorides, phosphides, and sulfides33,44,145–149 – each of these conversion materials
has its advantages and challenges, but the most widely studied family of conversion anodes
is metal oxides (MOs). Recall in Chapter 1, the primary advantages that MO materials have
over the standard graphite intercalation compounds (GICs) are: 1) multiple electrons per

103
repeat unit (e.g. 2 e-/NiO, resulting in a theoretical capacity of 718 mAh g-1) compared to
one electron per six carbons (372 mAh g-1 theoretical capacity) – giving MO-anode LIBs
a higher theoretical energy density than graphite-anode LIBs; and 2) a redox potential
approximately 1 V greater than Li/Li+ redox couple, which makes Li plating
thermodynamically unfavorable.
MOs also have advantages over the most widely touted graphite alternative, Si: 1)
MOs can be operated between 0-100% state of charge at high rates with as little as 5-10
wt% carbon added to the electrode34, where Si electrodes typically have nearly 50% added
carbon150–153 to achieve high performance and employ voltage cutoff strategies. In
combination, these significantly limit the achievable capacity of Si-based anodes; 2) the
volumetric expansion of MOs is much less than Si, typically ~60%, versus ~300% for
Si;154–156 and 3) MOs are air-stable and easy to process, unlike Si (and other more widely
discussed anode replacements, such as Li metal).
5.2 THE STRUCTURE AND CHEMISTRY OF THE SOLID ELECTROLYTE
INTERPHASE
As higher energy density materials are developed to enable such next-generation
Li-ion batteries, their interfacial interaction with the electrolyte and reaction mechanism
might be expected to be different than existing materials. This will be particularly
important at the anode, where the formation of the solid electrolyte interphase (SEI) from
electrolyte decomposition at low potentials is one of the most important phenomena that
allow for conventional graphite anodes to be chemically stable over long-duration cycling
and/or storage. The SEI and its formation is well-characterized for graphite, and even on
some alternative materials such as Si.36,157,158 Figure 5.1a shows the electrode/electrolyte

104
interface immediately after cell assembly, but before charge has been passed, where a non-
faradaic electric double layer formation (via specific and non-specific
adsorption/desorption) and faradaic electrochemical reactions (facilitated by the reversible
transfer of electrons at open circuit) occur.159 The thermodynamic potential gap between
the electrode and electrolyte (Figure 5.1b) determines the initial specific adsorption
behavior, solvation-shell near the interface, and the electrochemical reaction (e.g.
intercalation/conversion/alloying, electrolyte decomposition, Li plating, etc.). The SEI is
formed during initial charging where the anode potential is driven negative of its open-
circuit value (Figure 5.1c). Electrolyte instability at these potentials leads to electrolyte
reduction to more stable compounds – both organic and inorganic. One of the most
pervasive components of modern electrolytes is ethylene carbonate (EC), and it is known
to play an important role in SEI formation. Aurbach et al.19,160 proposed a general reaction
pathway for EC reduction on carbon-based anodes.
𝐸𝐶 + 2𝑒− + 𝐿𝑖+ → 𝐶2𝐻4 + (𝐶𝑂3𝐿𝑖)− Equation 5.1
(𝐶𝑂3𝐿𝑖)− + 𝐿𝑖+ → 𝐿𝑖2𝐶𝑂3 Equation 5.2
(𝐶𝑂3𝐿𝑖)− + 𝐿𝑖+ + 𝐸𝐶 → 𝐿𝑖2𝐸𝐷𝐶(𝑃𝑆𝐸𝐼) Equation 5.3
Experimentally, it has been shown that EC reduction occurs at potentials around
0.8-1.4V vs. Li/Li+, which is in reasonable agreement with theoretical calculations that fall
between 0.48 – 0.96V. 19,160 EC undergoes a 2-electron reduction, though the reaction
pathway can vary based on the EC concentration. At high EC concentrations, the 1st
electron transfer destabilizes a Li+-EC moiety, causing the carbonate anion to attack a
neighboring Li+-EC to form Li+(CO3)R(CO3)Li+ (where R can be methyl, ethyl, butyl,
etc.).

105
Figure 5.1 | Energy diagram of a Li-ion battery and reaction mode inside the electric double
layer (pre-cycled) and the solid electrolyte interphase (post-cycled). The schematic
captures the interfacial dynamics in the inner/outer Helmholtz plane (I/O-HP) and shows
desolvated Li+ transport through the SEI. Adapted from 165,166 Reproduced with permission
from The Royal Society of Chemistry.167
At low EC concentrations and potentials closer to Li/Li+ redox couple, the
carbonate anion will instead abstract a Li+ to form Li2CO3.19
The more stable compounds
become an electronically insulating shield (typically 10-40nm for graphite-based
electrodes22, ~0-50nm for metal oxide based electrodes161, and non-observable for titanate-
based electrodes162) that naturally prevents the high energy electrode surface from further

106
reaction, and enhancing long-term durability and capacity retention.133 Depending on the
electrolyte the SEI is considered to finish after 1-5 cycles163, however different stress
factors (e.g. volumetric expansion, gas formation, Li-plating, external impact) can expose
reactive surfaces that allow additional SEI to grow during operation (Figure 5.1d). The
continual build-up and consumption of the electrolyte increase the internal resistance of
the cell, leading to performance loss (Figure 5.1e), which can eventually include battery
failure. Though the SEI formation on carbon/graphite has been extensively studied, very
little information exists in the literature regarding SEI formation on promising next-
generation anode materials with high capacity, which are expected to be vital to device
design and operation in the near future as the demand to increase the energy density of Li-
ion batteries for commercial devices intensifies.164
By leveraging the breakage of bonds, both alloying materials (e.g. Si, capacity up
to 4200mAh g-1)152 and M-X conversion materials (capacity ~ 700-1200 mAh g-1, where M
= V, Cr, Mn, Fe, Co, Ni, Cu, W, Mo, Ru, and X = H, N, O, F, P, or S)37, can store
significantly more electrons per unit mass than intercalation compounds. Alloying
materials undergo several crystallographic phase changes to accommodate the inclusion of
Li, which results in a tradeoff between the desire for high energy density and the need to
avoid catastrophic volumetric expansion and material fracture. When the latter occurs, the
original solid-solid interfaces (active material-binder-conductive carbon) break down, and
contact resistance increases, or, worse yet, delamination (electrode particles becoming fully
detached from the current collector) occurs. The most common characteristic of alloying
materials in Li-ion batteries is rapid capacity loss (some <10 cycles)168. Conversion
materials, on the other hand, operate under a similar bond-breaking principle, but the

107
reaction also involves the displacement of the counter-ion (X) from the parent host (M).
This helps to limit volumetric expansion. Recall, the conversion-based reactions follow
the generalized reaction depicted below and in Chapter 1,37
Mαμ+
Xβπ− + βπ(Li+ + e−) αM + βLiπX Equation 5.4
Also unlike Si, M-X conversion-based materials have a higher reversible redox
potential than graphite(~1V vs Li/Li+)169. Though at first, this may seem like a negative,
because it does slightly lower the operating voltage in practical batteries, it is actually an
advantage because high potentials offer significantly increased protection from thermal
runaway by avoiding Li plating and dendrite formation. Additionally, it should be noted
that the much higher capacity for M-X materials more than compensates for the reduced
operating voltage from an energy density perspective. Though M-X materials do show
promise, they are still relatively understudied, particularly when it comes to their long-term
stability and operation in LIBs. That being said, researchers33,34,170–172 have started to
understand and control the in-cell M-X degradation pathways, including 1) metal (charge)
trapping, 2) transition of the MO to higher oxidation states, 3) exposed reactive sites for
electrolyte decomposition, and 4) agglomeration-induced loss of electrochemically active
sites, which causes capacity fade and oscillations/low coulombic efficiency. The various
methodologies that have been proposed in the literature to improve the cyclability of these
M-X electrodes (encapsulation, nanoconfinement, etc.)173,174. One of the M-X materials
that have particularly shown high performance recently is NiO. In fact, NiO-based anodes
have boosted their cycle performance from <25 cycles30 a decade ago to >2000 deep cycles
in 2020 at a 1C rate175,176. These promising results have increased interest in this family of
materials for commercial applications, which makes further studies regarding their

108
reactivity and long-term stability an important endeavor, including developing a better
understanding of the formation of the SEI on these materials.
Therefore, the overarching goal of this section is to electroanalytically decouple the
multi-step SEI reaction mechanism from the conversion reaction at the Ni-O/electrolyte
interface. A multitude of electroanalytical techniques, such as galvanostatic intermittent
titration technique (GITT) and transient voltammetry were performed. The resulting data
was analyzed using kinetic relationships derived from electron transfer theory (Marcus-
Hush-Chidsey, Butler Volmer). Diffusivity (S2D) and apparent exchange current (i0S)
measurements at different states of charge (SOC) were calculated to elucidate the complex
mesostructural changes of the conversion reaction. The effective transfer coefficient (eff)
was used to provide a mechanistic understanding of EC activation at the M-X/electrolyte
interface. The combined electroanalytical techniques and theory are combined to
fundamentally deconvolute the complex growth mechanism of the SEI on conversion-
based electrodes.
5.3 EXPERIMENTAL AND THEORETICAL FRAMEWORK
5.3.1 REAGENTS
Pluronic P123 triblock copolymer (poly(ethylene glycol)-block-poly(propylene
glycol)-block- poly(ethylene glycol), Mn ~5800, CAS#9003-11-6), tetraethyl orthosilicate
(TEOS, >99.0%, CAS#78-10-4), hydrochloric acid (HCl, ACS reagent grade 37%,
CAS#7647-01-0) were purchased from Sigma Aldrich. Nickel (II) nitrate hexahydrate
(Ni(NO3)2-6H2O, 99%, CAS#13478-00-7) and potassium hydroxide (NaOH, Certified
ACS, CAS#1310-58-3) were purchased from Fisher Scientific. Vulcan XC-72R was

109
purchased from Cabot. All water used in the synthesis processes uses ultrapure deionized
water (18.2 MΩ cm) from a lab-scale Millipore Milli-Q Integral system with E-POD. All
chemicals were used as received with no further purification.
5.3.2 SYNTHESIS OF HIGHLY ORDERED MESOPOROUS NICKEL OXIDE (NIO)
Highly ordered mesoporous NiO was produced via a mesoporous silica (SBA-15)
template-assisted synthesis. The SBA-15 template was synthesized in accordance with a
similar procedure in previous publications.33,177,178 Typically, 6g of Pluronic P123 triblock
copolymer and 13.6 mL tetraethyl orthosilicate was dissolved in 180mL of concentrated
(2M) HCl solution, heated to 45oC for 20 hours, and then heated to 100oC for an additional
24 hours. The product was washed with a 50:50 vol.% DI water/ethanol mixture, dried in
a Fisherbrand Isotemp Model 281A vacuum oven (~ -30in.Hg, 50oC) for 12 hours and
calcined at 500oC for 3 hours in air.
Next, an aqueous 0.5M Ni(NO3)2 solution was added dropwise to a beaker
containing the synthesized SBA-15 until 6.3 mL/gSBA-15 was achieved. The resulting gel
was magnetically stirred under ambient conditions and then calcined at 400oC for 3.5h in
air. After calcination, the template was removed by immersion in a 5M KOH solution for
12 hours at 100oC. Finally, the remaining solids were rinsed with three rounds of excess
deionized water, centrifuged at 4500rpm, and dried under vacuum at 70oC for 8 hours.
5.3.3 ELECTRODE FABRICATION AND COIN CELL ASSEMBLY
Anodes were created using either the highly ordered mesoporous NiO anodes or
Vulcan XC-72R carbon. Vulcan XC-72R carbon black was chosen in this study as a
control material since it does not store charge significantly via intercalation; this allows the

110
reaction plateaus to be dominated by electrolyte decomposition and not muddled with
intercalation-based phase changes. NiO-based anodes were prepared with a ratio of 95:5
active material to polyvinylidene fluoride binder (PVDF, Kynar Blend). Vulcan-based
anodes were prepared with a 90:10 carbon:PVDF ratio. The change in the active
material:PVDF ratio between the two types of electrodes considers the differences in their
surface area (conductive carbon > NiO) and the amount of binder required to maintain
sufficient particle-particle contact. In a typical setup, 400 µL of N-methyl-pyrrolidone
(NMP, Acros, 99.5% Extra Dry) solvent was micropipetted into a vial containing a total of
100 mg of total solids to obtain an ink with moderate viscosity. The ink was homogenized
via 3 successive rounds of sonication (20 mins) and magnetic stirring (8 hrs). The ink was
sprayed onto a 50 µm thick Cu current collector (Alfa Aesar, Catalog No. AA42972FI)
with an Iwata-Medea Eclipse HP-CS. The electrodes were then dried at 75oC for 24 hours
under vacuum. Then, to minimize particle-particle contact resistance, the electrodes were
hydraulically pressed at 1500 lbs (MTI 5T Max. Manual Mechanical Press) and calendared
(MTI Electric Roller-MSK-MR100DC) to a specified gap of 60 µm. The final active
loading target was 1 mg cm-1.
Coin cell assembly was done inside of an argon-filled (Ultra-high purity 5.0 Argon,
Airgas) MBraun Labmaster SP glove box (O2 and H2O < 0.1 ppm). All coin cells were
assembled in a half cell configuration using CR2032 coin cells (Hohsen Corp.). The
counter/reference electrode was a 1.5 cm diameter lithium metal foil (99.9%, Alfa Aesar).
In a typical procedure, the Li foil was polished, positioned at the center of the coin cell
base, and then flattened to ensure minimal contact resistance. Then, 15 µL of electrolyte
(1M lithium hexafluorophosphate (LiPF6, Acros 98%) in a 1:1:1 volumetric mixture of

111
ethylene carbonate (EC, Acros 99+%): dimethyl carbonate (DMC, Acros 98+%): diethyl
carbonate (DEC, Acros 99+%)) was injected uniformly onto the Li-metal. A Celgard 2320
tri-layer PP/PE/PP separator was centered on top of the Li-metal/electrolyte surface. Next,
an additional 15 µL of electrolyte was injected uniformly onto the separator. The gasket
was placed along the outer diameter of the coin-cell base to ensure proper centering of the
working electrode and sealing of the cell. A spacer disk and spring was used to ensure
uniform distribution of pressure and electrical continuity in the cell. Finally, the cap of the
coin cell was used to seal the cell with an MTI hydraulic press (MSK-110) at a pressure of
750 PSI.
5.3.4 CHEMICAL AND STRUCTURAL CHARACTERIZATION
Pre-/post-cycled transmission electron microscopy (TEM) was performed on
electrodes of interest by a similar procedure that was outlined in a previous publication.30
To preserve the region of interest during microscopy, a Cu TEM finder grid (3mm
diameter, 100 mesh, Ted Pella, Inc) was used. First, 1µL of diluted active material slurry
(1:10 dilution ratio) was deposited onto the grid and capillary drained via light application
of a lint-free laboratory cloth (KimwipesTM). The procedure was repeated three times and
fully-dried before TEM. After microscopy, the TEM grid, loaded with the active material,
was mounted into a custom-designed electrode fixture between a Teflon shroud and a
cylindrical Cu current collector. The assembly was electrochemically cycled (details in the
following section) in a 3-electrode cell inside of an Ar-filled Mbraun glovebox. After the
electrochemical experiments, the TEM grid with active material removed from the
assembly was submerged in excess DMC for 30 minutes and dried inside the glovebox for
24 hours prior to additional microscopy. All microscopy was performed either using a FEI

112
Talos scanning transmission electron microscopy (S/TEM) and a Hitachi H8000 TEM with
integrated energy-dispersive x-ray spectroscopy (EDS). In addition, X-ray Photoelectron
Spectroscopy (Kratos AXIS Ultra DLD XPS System) was used to determine the elemental
composition on the surface, chemical state, and electronic structure of the active material.
5.3.5 ELECTROCHEMICAL TESTING
Three electrochemical methods were primarily used in this work. Current-pulse
relaxation, via the galvanostatic intermittent titration technique (GITT), was done using an
Arbin MSTAT battery cycler under pseudo-isothermal conditions inside a Tenney T6S-1
climate-control chamber at 25oC. The method involves 100 intermittent current pulses at
C/10 for a time that satisfies 𝑡 ≪ 𝐿2/𝐷, followed by a relaxation time (i.e. no current) to
electrochemical equilibrium. In addition to a time constraint (i.e. satisfies 𝑡 ≪ 𝐿2/𝐷), the
voltage window was specified to be 0.001-3.0V. The GITT data allowed for the apparent
diffusion coefficients and apparent exchange current densities to be extracted as a function
of the state of charge (SOC). The other method used in this work was linear sweep
voltammetry (LSV), which was done using the Arbin MSTAT battery cycler. LSV was
used to determine the effective transfer coefficient as a function of the SOC during a
parallel GITT test. The scan rate was 1mV s-1 and the upper/lower cutoff voltage was +/-
100mV vs. the open circuit voltage (OCV). A 30-minute relaxation time was given between
the positive and negative scan. Finally, the samples deposited on the TEM grid for pre-post
imaging were exposed to cyclic voltammetry (CV) at a 0.1mV/s scan rate over the same
potential window as the GITT measurements (0.001- 3.0 V).

113
5.3.6 ELECTROKINETIC FRAMEWORK
The electrokinetics for complex heterogeneous reactions (combinations of multi-
step electrochemical and/or chemical reactions) are developed to understand current-
potential (i-E) relationships. The i-E relationship can be rigorously derived by applying
Dirac’s time-dependent perturbation theory to Schrodinger’s wavefunction () of an
electron and integrating the density of states for the electrolyte (detailed proof can be found
in Fletcher et al.179). For most reactions, the reaction rate is expressed in the Butler-Volmer
(BV) formulation, given as Equation 5.547:
𝑖 = 𝑖0[𝑒−α𝑒𝑓𝑓𝑓(𝐸−𝐸0) − 𝑒(𝑛−α𝑒𝑓𝑓)𝑓(𝐸−𝐸0)] Equation 5.5
where i0 is the exchange current density, eff is the transfer coefficient, f = F/RT, n is the
number of electrons, E – E0 is the overpotential. If all of the electrochemical steps can be
assumed to be reversible, the overall effective transfer coefficient is represented as:180
𝛼𝑒𝑓𝑓 =
+ 𝜌𝛽
Equation 5.6
in which is the number of electrons prior to the rate-determining step, is the number of
times the rate-determining step occurs, 𝜌 is either 0 (if the rate-determining step, RDS, is
a chemical step) or 1 (if the RDS is an electrochemical step), and 𝛽 is 0.5. The Butler-
Volmer electrokinetic expression is typically valid in a very narrow regime where the free
energy curves for oxidation and reduction are linear. However, the potential energy surface
based on Marcus theory is represented by intersecting parabolas that account for the
cumulative coordination energy between the initial and final states of the electrolyte. This
model results in the Marcus-Hush-Chidsey (MHC) relationship between the current and
overpotential, which is given below:181

114
iox /red MHC (λ, η)=A ∫ exp (-
(x-λ±eη)2
4 λ)
dx
1+ exp(x)
∞
∞
Equation 5.7
In Equation 5.7, λ is reorganizational energy normalized to the thermal voltage,
and η = e(E − E0)/kBT. The Fermi distribution of the electronic energy upon an applied
potential is accounted for in the MHC framework by integrating x = (εe1 − eE)/kBT. The
pre-exponential factor (A) accounts for the strength of the electronic coupling and density
of states. Previous studies182 found that the Fermi distribution in the MHC is negligible
(x = (εe1 − eE)/kBT), resulting in the low overpotential approximation for the Marcus-
Hush-Chidsey kinetic expression. Therefore, the MHC breaks down to a modified transfer
coefficient to the Butler-Volmer expression and can be represented as a potential-
dependent property and as a function of the electrolyte reorganizational energy, Equation
5.8.182
αeff =γ
+ ρ [ +
e(E − Eeq)
4λ]
Equation 5.8
5.4 RESULTS AND DISCUSSION
5.4.1 MECHANISTIC FRAMEWORK – KNOWN EC REACTIONS ON CARBON BASED ANODES
The effective transfer coefficient can help researchers to elucidate the mechanistic
pathway of the reaction and it is capable of decoupling multi-step reactions because it
elucidates the nature of the RDS. For a generalized multi-step reaction that follows the
form of A + ne- Z, the RDS plays an essential role in the rate of reaction. Therefore, a
multi-step reaction can be broken down into the number of electrons prior to the RDS and
the number of electrons after the RDS to give a cumulative number of electrons of n. By

115
writing out every rate expression for every step of the pathway, the effective transfer
coefficient can be derived and used for mechanistic insight (Table 5.1).
Table 5.1. | Hypothetical generalized mechanism where n is the total number of e-, is the
number of e- before RDS, is the number of e- after RDS, and is either 0 (chemical) or 1
(electrochemical) 180,183
Generalized Reaction for: A + ne− z
# of electrons
A + e− B 1
B + e− C 2
…
M + e− N
N + e− O + RDS
O + e− P
…
X + e− Y n-1
Y + e− Z n
With the present theoretical framework for multi-step reactions, electroanalytical
techniques can be applied to study the activation of EC on conversion electrodes.
Numerous studies have applied high-level density functional theory (DFT) calculations for
the reduction pathway of EC, which is the dominant reactant participating in the SEI
formation step on carbon/graphite (Equation 5.9 to Equation 5.17).160,184,185 First,
supermolecules of (EC)n and Li+ are formed during the electrolyte preparation step.
nEC + Li+ → (EC)n − Li
+ Equation 5.9
The supermolecules of Li+(EC)n then undergo a 2-electron decomposition reaction at the
electrified surface. The 1st electron transfer step destabilizes the system to an ion-pair
intermediate via homolytic C-O bond cleavage:
(EC)𝑛 − L𝑖+ + e− → [(EC)−] − Li+ − (EC)𝑛−1 Equation 5.10
(EC)𝑛 − L𝑖+ + e- → (EC)n − Li Equation 5.11

116
[(EC)−] − Li+ − (EC)n−1 → H2CCH2(CO3)−Li
+−(EC)𝑛−1 Equation 5.12
From here, the EC can further decompose to a lithium organic(R) dicarbonate (ROCO2Li)2
where R can either be ethylene or butylene:
2H2CCH2(CO3)−Li+ − (EC)n−1
→ (EC)n−1 − L𝑖+(CO3)−(CH2)4(CO3)−Li+
− (EC)n−1
Equation 5.13
2H2CCH2(CO3)−Li+ − (EC)𝑛−1
→ (EC)𝑛−1 − L𝑖+(CO3)−(CH2)2(CO3)−Li+
− (EC)n−1 + C2H4
Equation 5.14
An alternative decomposition reaction can occur at low EC concentrations via the
formation of an unpaired carbonate nucleophile (LiCO3-), which can react after the 1st
electron transfer to either Li2CO3 or (CH2OCO2Li)2:
H2CCH2(CO3)−Li+ − (EC)n−1 + e-
→ (CO3)2−Li+ − (EC)𝑛−1 + C2H4
Equation 5.15
(EC)𝑛 − Li+ + (CO3)2−Li
+ − (EC)n−1
→ (EC)n − Li+(CO3)2−Li
+ − (EC)n−1
Equation 5.16
(EC)𝑛 − Li+ + (CO3)2−Li
+ − (EC)n−1
→ (EC)n−1 − Li+(CO3)−(CH2)2(CO3)−Li
+
− (EC)n−1 + C2H4
Equation 5.17
Despite the plethora of experimental data that corroborates the EC reaction
mechanism above for carbon (a detailed DFT study can be found in Wang et al.186), there
is a demand to generalize the reaction mechanism on developmental-stage electrodes with
higher energy densities or phenomenal reversibility. Therefore, this section attempts to
bridge this gap by providing a systematic approach to deconvoluting the SEI reaction

117
mechanism on M-X anodes. First, SEI formation is summarized on Vulcan XC-72R
carbon. Vulcan XC-72R provides a control case for SEI formation that is well-studied (i.e.
carbon) where the result is well known – without interference from intercalation. This is
meant to validate the overall methodology, which is then extended to a representative M-
X material, NiO. To my knowledge, this study contains the most comprehensive dataset
and analysis for the SEI formation on M-X anodes, which has resulted in a much more
complete understanding of the reaction mechanism as a function of SOC on this family of
materials as well as a framework for others to apply to similar systems in the future.
The SEI reaction mechanism and location of the electrolyte decomposition (inner
or outer-sphere reaction) primarily occurs during the first charge. The charge curve for the
first charge of Vulcan XC-72R (carbon control) is shown in Figure 5.2a. The curve can
be split into 3 regions (Arabic numerals: 1, 2, 3). In Region 1, the charge is primarily
stored via electric double layer (EDL) capacitance, though some of the current passed also
contributes to electrolyte decomposition/SEI formation. In Region 2, the behavior is
dominated by charging the EDL. Finally, Region 3 shows both EDL charge storage as well
as extended capacity from electrolyte reduction. The diffusional transport properties
extracted from galvanostatic intermittent titration technique show a stepwise decrease in
the apparent diffusion coefficient (S2D) and are represented as the solid/dashed black lines
in Figure 5.2a. Region 1 shows a gradual decrease in the apparent diffusion coefficient
from 10-13 to 10-14 cm6 s-1. The electrolyte reduction process and formation of the SEI
impede Li+ diffusion, resulting in an average diffusion coefficient that decreases as a
function of the SEI film growth. The transition from Region 1 to Region 2 is reflected by
a stabilization of the apparent diffusion coefficient, which corresponds well with the

118
inflection point of the OCP (i.e. transition from an electrochemical reaction (EC) that forms
the SEI to a purely capacitive behavior). The transition between Region 2 to Region 3 is
marked by a comparative extension in the capacity in the low potential range and the
increase in the diffusional barrier. The stage-wise decrease in the diffusion coefficient
captures a two-stage SEI formation process and this phenomenon elucidates some of the
previous SEI-related literature (i.e. a porous SEI near the electrolyte interface and
densification near the electrode surface).22 The apparent exchange current in Figure 5.2b
captures the kinetics at different SOC. The V-shape curve for i0S is consistent with the
potential response and delineation of Region 1-3. Region 1, which shows tendencies that
are consistent with an electrochemical reaction with EDL charge storage. The delineation
is reflected in the form of a higher exchange current in-comparison to Region 2, which
comparatively shows similarities to subsequent cycles. The steep drop in the apparent
exchange current in the transition from Region 1 to Region 2 marks the near completion of
the first SEI formation process. At low potentials vs Li/Li+ the apparent exchange current
increases significantly, which is a corollary to a secondary plateau or more specifically a
secondary reaction.
Linear sweep voltammograms taken in Region 1 and Region 3 during the first
charge are plotted in Figure 5.2c. In Figure 5.2c, experimental data are represented by
semi-transparent dots, while Tafel curves are indicated by straight dashed lines and the low
overpotential approximated MHC analysis is indicated by solid lines. The highlighted
colors and labels in Figure 5.2c also show the constituent physical and/or chemical
processes that primarily contribute to the LSV behavior in various potential regimes.

119
Figure 5.2. | Represents (a) charge/discharge curves for Vulcan XC-72R carbon black, (b)
Tafel-like plots with Butler-Volmer (solid line) and Marcus-Hush-Chidsey (dashed lines)
models on-top of experimental data (dots), and (c) illustration of the interfacial structure of
carbon during initial charge stages and reaction mechanism as proposed by (Wang et al.186).
The reaction mechanism designations are C = chemical step, E = electrochemical step, D
= dimerization reaction, and a double line highlight the rate-determining step. Reproduced
with permission from The Royal Society of Chemistry.167

120
At low overpotentials, the quasi-reversible regime near the equilibrium potential is
highlighted in blue. In this regime, reversible interfacial charge transfer occurs. At
moderate overpotentials, highlighted in purple, linear Tafel behavior can be observed. At
high overpotentials, highlighted in green, mass transfer limitations take over as the log(i)
response deviates significantly from linearity181,182,187. Calculations of eff and low
overpotential MHC calculations of the reorganization energy () for Vulcan XC-72R
carbon black are provided in Table 5.2. First, the reorganizational energy for Region 1 and
Region 3 were found to be = 0.33 eV 0.01 and 0.37 eV 0.01, respectively. The small
reorganizational energy suggests that electrolyte reduction is controlled by electron transfer
and not solvation/desolvation ion transport mechanisms that typically exhibit
reorganizational energies above 0.5 eV. The good agreement of the experimental data to
the MHC model, combined with low reorganization energies, indicates that the SEI
formation on carbon in this region is an outer-sphere electron transfer process.188
Table 5.2. |Tafel calculations of eff for Vulcan XC-72R carbon black.
Region 1 Region 3
eff 0.43 0.01 0.47 0.01
0.33 eV 0.01 0.37 eV 0.01
5.4.2 MECHANISTIC ASSESSMENT OF EC ACTIVATION AND ORGANIC SEI FORMATION
(REGION 1)
As shown in Table 5.2, kinetic deconvolution of the LSV data yielded an eff of
0.43 in Region 1. From this value, it can be surmised that = 0 and 𝜌 = 1, meaning that
the rate determining step is the first electron transfer step. To ascertain the number of times

121
the RDS occurs, additional information is needed. Wang et al.186 proposed the reaction
mechanism in Figure 5.2c for Region 1, which indicates a fast adsorption step followed by
an activation step and a dimerization reaction to form organic Li2EDC and ethylene
(translates to a = 2). From their DFT calculations, they also proposed the 1st electron
transfer step to be the rate-determining step. In this region, the SEI formation is dominated
by organic species formation because the bulk EC concentration (~7M) makes it highly
available, with high surface coverage as well. Even though surface mobility of activated
EC is low due to steric hindrance, there is a boundless supply of EC in Region 1 prior to
SEI formation. In this region, the simultaneous ethylene evolution and Li2EDC formation
enable the formation of the porous, organic portion of the SEI.
5.4.3 MECHANISTIC MODEL FOR EC ACTIVATION TO INORGANIC SEI (REGION 3)
During the first charge, Region 3 has an eff of 0.47, which again suggests that =
0 and 𝜌 = 1. However, by the time that the charge has reached Region 3, the surface is
much different than it was in Region 1 since a significant portion of the porous, organic
SEI (Li2EDC) has already been formed as discussed above. The existence of this porous
layer, as opposed to a flat, open surface, also means that the reaction likely becomes EC
mass transport limited184. Because the surface mobility of activated EC is low, the lower
concentration of EC results in severely hindered dimerization due to lack of proximity
between active species184. Also, in Region 3, the anode potential is lower than it was in
Region 1. The combination of a high driving force and low EC concentration results in
nucleophilic attack of neighboring Li-species, as shown in Figure 5.2c, which changes the
formed reduction products from organic species to inorganic compounds such as Li2CO3.

122
In addition to the electroanalytical analysis, XPS was used to corroborate the
reaction mechanism for SEI formation on carbon. High-resolution Li 1s, O 1s, and C1s for
post-SEI formation on carbon are presented in Figure 5.2d. The Li 1s high-resolution
spectrum captures one broad peak at 55.1 eV, which is difficult to deconvolute but
characteristic of Li2CO3 (Eb ~ 55.2 eV), Li2O (Eb ~ 53.8 eV), LiF (Eb ~ 55.6 eV), and
ROCO2Li (Eb ~ 54.7 eV).189–191 A deconvolution of the O 1s high-resolution spectrum
indicates the presence of C-O, C=O functionalities (Eb ~ 531.7 eV), and possible O-H (Eb
~ 533.5eV). Also, a shoulder corresponding to the formation of Li2O is observed at 528.5
eV. The C 1s spectrum contains a convoluted set of peaks that are consistent with
carbonate/CFx (Eb ~ 289.9 eV), O-C=O (Eb ~ 288.4 eV), C-O (Eb ~ 284.6 eV), and carbide-
related species (Eb ~ 283.7 eV). The observed CFx binding energies are expected and
related to the PVDF binder. The remaining peaks correspond to compounds in the SEI and
conductive carbon and are consistent with the known products for SEI formation on carbon,
including lithium alkyl carbonates (e.g. ROCO2Li) in Region 1 and Li2CO3 in Region III.
5.4.4 SUMMARY OF SEI FORMATION ON CARBON
The potential and concentration dependence of the SEI formation process can
therefore be broken down into three primary regions on the carbon control. In Region 1,
the extended reaction plateau at 0.93V and the non-existent reaction plateau in the
subsequent cycles can be used to decouple the two charge storage mechanisms, EDL
charging and SEI formation. The SEI formation process can then be further deconvoluted
via electron transfer theory to yield an effective transfer coefficient (eff = 0.43) that
corroborates the reaction pathway of highly concentrated EC to the organic-phase SEI
(either (CH2CH2OCO2Li)2 or (CH2OCO2Li)2). In Region 2, the potential profile resembles

123
characteristics of subsequent cycles and indicates charge storage that is consistent with
EDL storage (i.e. no definitive reaction plateau). As the charging reaches Region 3, an
extended reaction plateau at <0.3V is observed and corroborates the widely accepted 2nd
reaction pathway of the SEI. A further deconvolution of Region 3 reveals an effective
transfer coefficient of 0.47, which leads to the observation that the 1st electron transfer step
is the rate-determining step. These findings agree with the widely-accepted literature
pathway for SEI formation, where EC reduction leads to the Li2CO3-rich19,160,184 Though
this first section is a validation of already-published work, it is included here to provide a
baseline for comparison with the true system of interest in this work: M-X species. The
results above show that the mechanistic framework shown here is fully capable of
deconvoluting the complex multi-step reaction pathway of the primary active electrolyte
species (EC) – meaning that it can be extended to M-X species with a high chance for
success.
5.4.5 SOLID ELECTROLYTE INTERPHASE ON CONVERSION METAL OXIDE
After confirming the plausibility for the DFT-proposed reaction mechanisms by
Wang et al.192,193 and the experimental observations by Aurbach et al.184 for SEI formation
on the control-carbon electrodes in this study, the methodology was then extended to M-X
conversion anodes, specifically using NiO as a representative material. Figure 5.3a shows
the galvanostatic intermittent titration technique (GITT) results for the open circuit
potential (OCP) and diffusivity (S2D) for NiO as a function of the state of charge (SOC)
during the initial charge (solid lines) and discharge (dashed lines). The apparent exchange
current as a function of SOC during the initial charge (solid line) and discharge (dashed
line), also from GITT, is shown in Figure 5.3b. Because SEI formation occurs during the

124
1st charge, that will be the focus of the discussion. From the trends in the data, four regions
(denoted by Roman numerals: I, II, III, IV) could be identified.
In Region I (OCP > 1 V), the initial reaction occurs at the solid/liquid interface,
which is indicated by a high apparent diffusion coefficient (10-8 – 10-9 cm6 s-1) and the
lowest exchange current, ca. 2x10⁻⁵ A. By the end of Region 1, the apparent diffusion
coefficient decreased to 10-10 cm6 s-1, while the apparent exchange current increased
slightly to ca. 2.5x10⁻⁵ A. In Region II (0.7 < OCP < 1 V vs. Li/Li+, 72 < Q < 610 mAh g-
1), the apparent diffusion coefficient was fairly stable (~10-11 cm6 s-1) and its magnitude is
characteristic of solid-state diffusion, most likely lithium ions through the porous SEI and
active metal oxide particles. Concurrently, the apparent exchange current continuously
increased to ca. 5.0x10⁻⁵ A. In Region III (0.5 < OCP < 0.7 V vs. Li/Li+, 610 < Q < 790
mAh g-1), there was an increase in the apparent diffusion coefficient from ~10-11 to ~10-9,
which indicates a possible transition in the diffusion mechanism from purely solid-state
diffusion back to a combination of solid-state + liquid-state phase diffusion. The most
likely reason for this phenomenon can be attributed to slight volumetric expansion as well
as the phase segregation of Ni-metal + Li2O domains, which exposes the additional active
material surface to the electrolyte (visual evidence will be discussed later along with
Figure 5.3c). However, the exchange current was not changed in this Region. In Region
IV (0 < OCP < 0.5 V vs. Li/Li+, Q > 790 mAh g-1), there was a rapid drop in the apparent
diffusion coefficient from (10-9 to 10-12), suggesting a transition from a mixed solid-
state/liquid-state diffusion back to a purely solid-state mechanism.

125
Figure 5.3. | Depicts galvanostatic intermittent titration technique for the parameter
extraction of (a) apparent diffusion coefficient and (b) the apparent exchange current. Both
plots contain the open circuit potential of NiO marked in (blue). Each section contains a
dot that indicates locations where linear sweep voltammetry is done. Four sections are
broken down (I, II, III, IV) to delineate dominant mechanisms. Also, high-resolution
transmission electron microscopy is depicted as (c) TEM of post-cycled NiO. The atomic
resolution HRTEM is depicted in (d) for the Ni domain (~2.1Å[111], ~1.8Å[200]) and (e)
for the NiO domain (2.4Å[111], 2.0Å[200]). The Fast Fourier Transform (FFT) analysis of
the HRTEM (f) for Ni and (g) for NiO. (h) Depicts the schematic for NiO particle
transformation and showing the conversion reaction front propagation for the particle-level
HRTEM image in Figure 5.3c (i.e. lithiation propagates from the bulk electrode until the
reaction front stops due to high local polarization (i.e. the electrical losses generate a
termination distance) and resulting in trapped charge). Reproduced with permission from
The Royal Society of Chemistry.167

126
The rapid drop in the diffusion coefficient in combination with an overpotential in-
proximity to Li/Li+ is consistent with the 2nd stage of SEI formation in carbon electrodes,
which included densification and a transition from organic to inorganic electrolyte
decomposition products. A HRTEM image of a partially charged NiO particle is shown in
Figure 5.3c. The image captures a moving phase boundary between the charged state and
the discharged-state that does not begin homogenously at the surface and move inward, a
so-called shrinking core model, as might be initially expected. Instead, evidenced by a
distinct lateral phase boundary in the particle, the particles begin their charge from the side
of the particle closest to the current collector/substrate and the reaction plane moves from
that side of the particle to the other. By zooming in at higher magnification, atomic
resolution images are captured for both the charged Ni (Figure 5.3d) and discharged NiO
(Figure 5.3e) domains within the particle. The corresponding fast Fourier transform (FFT)
is also shown below the HRTEM images for both phases. The FFT deconvolution shows
two distinct lattice fringes neighboring the phase boundary with lattice constants of 2.0 Å
[200] and 2.4 Å [111] corresponding to planes of NiO in Figure 5.3f, and 2.1Å [111] and
1.8Å [200] corresponding to Ni-metal in Figure 5.3g. The anisotropic
lithiation/delithiation behavior of the conversion reaction suggests that the reaction front is
controlled by electronic conductance (the charge does result in the formation of metallic
Ni particles, which have high conductivity). This seems to confirm previous work showing
that the charge/discharge efficacy of metal oxide anode materials is strongly dependent on
the intra-particle and inter-particle conductivity.34,45
Figure 5.4 applies Tafel and MHC electrokinetic models to LSV data taken in each
Region during the first charge, as was done for carbon in the previous sections, to better

127
understand the reaction mechanism during SEI formation. In all Regions, the Tafel and
MHC descriptions capture the near linear log(i) response with reasonable agreement, and
the resulting effective transfer coefficients and reorganizational energies are shown in
Table 5.3. Even with the simplification of the MHC used here, the model is in good
agreement with the data, suggesting that the Fermi distribution and EDL have a negligible
contribution to the kinetic behavior in this system. Also, symmetry in the data indicates
that an electron transfer step is rate-limiting, and not ion transport through the EDL or the
prematurely formed SEI, even though some studies have suggested that desolvation of Li+
from the electrolyte into the SEI may be rate-limiting.194 Typically, desolvation requires
reorganizational energies greater than 0.5 eV.
Figure 5.4. | Represents Tafel-like plots for Butler-Volmer (solid line) and Marcus-Hush-
Chidsey (dashed lines) models on-top of experimental data (dots). Reproduced with
permission from The Royal Society of Chemistry.167

128
Table 5.3. | Effective transfer coefficient calculated by Tafel slope and reorganizational
energy calculated by the low overpotential approximation for the Marcus-Hush-Chidsey
theory
I II III IV
eff 0.41 0.01 0.55 0.02 0.58 0.01 0.67 0.02
0.23 eV 0.01 0.28 eV 0.01 0.30 eV 0.01 0.38 eV 0.01
Since Marcus theory188 was originally derived for outer-sphere electron transfer
reactions, the reorganizational energy indicates the reduction of EC at the outer Helmholtz
plane. The interfacial interaction of the electrolyte and the electrode can be deconvoluted
from the reorganization energy in the MHC model and studied at different SOC to provide
a temporal view of the electrode/electrolyte interaction across the entire reaction
coordinate. From the beginning to the end of the first charge, Region I→II→III→IV,
continuously increased from 0.23 to 0.38. Since is an indicator of the energy required to
reorganize the electrolyte, differences in this value can elucidate surface interactions. The
fact that electrolyte reorganization energy increased from low SOC to high SOC suggests
that the interface is altered by the SEI formation and it is likely that the ion-pairing between
Li+ and solvent dipoles or PF6- anions become stronger at higher SOC (i.e. the coordination
level increases or ion-pairing changes). In comparison, the reorganizational energy on
carbon is higher than on NiO at low SOC (C = 0.33 eV 0.01 in Region 1 vs NiO = 0.23
eV 0.01 for Region I), which means the transfer of charge on an oxide surface is initially
more facile on NiO. This could be due to a catalytic effect, since the surface area of C (250
m2/g) vs. NiO (80.4 m2/g) is drastically different, though this needs to be probed more
deeply in the future. However, as the electrolyte decomposition proceeds to a more mature
stage, the reorganization energies (and hence the electrolyte-SEI interaction) become

129
statistically identical (C = 0.37 eV 0.01 in Region 3 vs NiO = 0.38 eV 0.01 for Region
IV), which suggests that the advanced SEI/electrolyte interfaces are likely similar.
5.4.6 MECHANISTIC ASSESSMENT OF EC ACTIVATION ON CONVERSION MATERIALS
(REGION I)
Because two processes are occurring simultaneously during the first charge, both
the conversion reaction and SEI formation, isolating the process of interest can be difficult
and requires several pieces of experimental data to be systematically pieced together to
generate a full understanding. Based on the effective transfer coefficient in Region I, and
the consistency to Region 1 in carbon, the analysis strongly suggests that the reaction
pathway for the reduction of EC to (ROCO2Li)2 also occurs on NiO. The effective transfer
coefficient results are also fully consistent, with the value of the eff indicating that the
reaction is again rate-limited by the 1st electron transfer ( = 0, 𝜌 = 1). Here, Li+(EC)n
supermolecules are rapidly adsorbed onto the active material, followed by activation and
dimerization to Li2EDC and ethylene. Again, the lower reorganization energy for this
initial process does suggest possible catalytic decomposition in the early stages of SEI
formation on the NiO surface, which requires future study.
5.4.7 BEHAVIOR IN REGIONS II AND III
The effective transfer coefficient in Regions II and III were very similar (eff = 0.55
for Region II and eff= 0.58 for Region III). In-combination with the behavior of the
apparent diffusion coefficient as discussed above and the apparent exchange current
density, the behavior in these two Regions appears to correspond primarily to the
conversion reaction (Ni2+O2- + Li+→ Ni0 + Li2O), not SEI formation. Palmieri et al.

130
proposed a reaction mechanism based on thermodynamic arguments and behaviors
consistent with the observations here.34 Because it is not expected that significant SEI
formation occurs in Regions II and III, they will not be extensively discussed here as their
dynamics fall outside of the focus of this work.
5.4.8 MECHANISTIC MODEL FOR EC ACTIVATION ON CONVERSION MATERIALS (REGION
IV)
XPS chemical analysis was performed to guide the mechanistic deconvolution of
Region IV, which also is comprised of responses from multiple reactions.
Figure 5.5. | High-resolution XPS spectra of (a) pre-cycled and (b) post-cycled NiO
electrodes in the Ni 2p, C 1s, and O 1s spectra. Reproduced with permission from The
Royal Society of Chemistry.167

131
Figure 5.5a shows a high-resolution XPS spectrum for pre-cycled NiO in the Ni 2p
spectra, which shows characteristic (872.5eV) 2p1/2 and (854.3eV) 2p3/2 with an 18.2 eV
displacement from the split spin-orbit of nickel oxide (NiO). Satellite peaks for Ni 2p1/2 at
872 eV and Ni2p3/2 at 862 eV can be observed as well. After being cycled (100x), the Ni
2p spectra (Figure 5.5b) indicates the presence of mixed oxidation states between Ni2+ and
Ni3+ that is characteristic of Ni2O3, NiF2, Ni carbide, and Nickel carbide species at Ni 2P3/2
binding energies of 858 eV, 855.5 eV, and 849.7 eV, respectively.
In the pre-cycled C1s spectrum, responses were observed from C=C (Eb ~
284.6eV), C-C/C-H (Eb ~ 285.5 eV), C-O (Eb = 286.7eV) , O-C=O (Eb ~ 288.3 eV), and -
CO3- (or PVDF at Eb ~290.0 eV) species. In addition, the π- π* shakeup satellites were
observed at Eb ~ 291.8 eV. The high resolution pre-cycled C 1s spectrum shows
functionalities for PVDF and carbon black. The post-cycled C 1s spectrum reveals a
significant increase in -CO3- functionalities at Eb ~ 289.5 eV. O-C=O (Eb ~283.3 eV), C-
O (Eb ~286.1 eV), and C=C (Eb ~ 284.6 eV) were also observed, which correspond to the
typical SEI components discussed for carbon, including Li2CO3 and Li(CO3)-R-(CO3)Li.
Finally, a noticeable shoulder peak was observed at Eb ~ 283.0 eV, which corresponds to
the formation of carbides and corroborates the Ni 2p peak at 849.7 eV.
The pre- and post-cycled high-resolution XPS spectra for O 1s are also shown in
Figure 5.5. The O1s XPS spectrum for the post-cycled electrode shows the presence of
C=O (Eb ~ 533.5 eV) and C-O bonds (Eb ~ 532.2 eV), which corroborates the C1s spectrum
for the formation of Li2CO3. Additional lithium alkyl carbonate species (R-CH2O
(C=O)OLi (Eb ~ 532.2 eV) and R-CH2O(C=O)OLi (Eb ~ 533.5 eV) were also identified

132
during the deconvolution. A less pronounced peak for Ni2O3 (Eb ~ 530.3) was observed
from the peak shoulder at 530.3 eV.
By coupling the XPS results with electroanalytical analysis of the RDS, it is
possible to decouple the controlling processes in the reaction mechanism. There is a
discrepancy in the effective transfer coefficient when comparing Region I to Region II/III
and to Region IV. Like SEI formation on the carbon black control, eff was ~0.4. For
carbon, the transfer coefficient is almost independent of the SOC, but for NiO eff increased
with the SOC from 0.41 to 0.67, suggesting a deviation in the reaction mechanism. More
specifically, in Region IV the observed effective transfer coefficient is an amalgam of the
competition between the SEI formation and the conversion. From previous work34, it is
known that the transfer coefficient for the conversion reaction is around 0.5. This means
that the large positive deviation in the measured eff must come from a process whose
transfer coefficient is > 0.5 and the only other process occurring is the latter stages of SEI
formation, which is discussed below.
As the conversion and SEI formation simultaneously occur, there is likely depletion
of Li+ reactants near the anode surface. This phenomenon does not affect the conversion
due to the fact that the Ni+ transition state formed during the RDS is unstable and all the
subsequent steps are relatively facile (i.e. the dissociation step and formation of Li2O is
highly thermodynamically favorable). However, electrolyte reduction in its latter stages,
just like carbon, relies on the reaction of free electrolyte that is trapped inside of the pore
space formed during reaction in Region I. When this happens, the reaction is not just
limited by surface activated electrolyte species, it also encounters a deficiency in Li+ ions
that may be abstracted to form Li2CO3. This abstraction is energetically uphill, and if it

133
becomes controlling, this chemical step would be the RDS and the resulting transfer
coefficient would be 1 ( = 1, = 1, 𝜌 = 0) and fully consistent with all of the
experimental observations in this work.
Table 5.4. | Mechanistic insight in the reaction pathway for Region IV (2.2 < x < 2.8),
showing chemical (C) and electrochemical (E) steps.
MO Reaction mechanism(𝑪𝑪𝑪𝑬) Process
𝑆𝐸𝐼 − 𝐿𝑖+ 𝑆𝐸𝐼 + 𝐿𝑖+ Li+ Dissociation from
SEI C
𝑀𝑂 + 𝐿𝑖+ + 𝑒− 𝑀𝑂 − 𝐿𝑖+ 1st electron transfer E
𝑀𝑂 − 𝐿𝑖+ 𝑀+ + 𝐿𝑖𝑂− Dissociation C
𝐿𝑖 + + 𝐿𝑖𝑂− 𝐿𝑖2𝑂 Li2O recombination C
𝑀+ + 𝑒− 𝑀0 2nd electron transfer E
EC Reaction mechanism (𝐂𝐄𝑬) Process
(𝐿𝑖+ − 𝐸𝐶) + M ∗ M ∗ −(𝐿𝑖+ − 𝐸𝐶) Adsorption in open
pore C
M ∗ −(𝐿𝑖+ − 𝐸𝐶) + 1𝑒− M ∗ −𝐿𝑖+ − 𝐸𝐶− EC activation E
𝑆𝐸𝐼 − 𝐿𝑖+ 𝑆𝐸𝐼 + 𝐿𝑖+ Li+ Dissociation from
SEI C
M ∗ −𝐿𝑖+ − 𝐸𝐶− + 1𝑒− + 𝐿𝑖+
M ∗ −𝐿𝑖2𝐶𝑂3(𝐼𝑜𝑆𝐸𝐼) + 𝐶2𝐻4 Li2CO3 formation E
5.4.9 PHYSICAL STRUCTURE OF THE SEI ON NIO
Figure 5.6a shows TEM images of the mesoscale-scale structure of the post-cycled
NiO. Compared to pre-cycled NiO, significant structural changes were observed. Some
were expected, such as particle agglomeration – leading to a loss of distinguishable
boundaries between particles. Also observed was the non-uniform deposition of SEI
components onto the surface of the active material. In fact, NiO and SEI components were
found to preferentially cluster, leading to fully agglomerated regions and partial vacancies
in the SEI that can be areas for high reactivity.

134
Figure 5.6. | Transmission electron microscopy was used in (c) which represents the post-
cycle surface mesostructure and highlights high anisotropy in SEI formation, (d) high
resolution of the SEI, (e) energy-dispersive X-ray spectroscopy, and elemental mapping of
the SEI. Reproduced with permission from The Royal Society of Chemistry.167
High-resolution TEM images in Figure 5.6b show two regions in the SEI with
multiple particles embedded into the SEI matrix. HAADF and EDS elemental mapping in
Figure 5.6c suggest that the SEI’s elemental composition consists of C, O, F, P, and Ni,
confirming constituents of Li2CO3, Li(CO3)R(CO3)Li, LiF, trapped-Ni, etc. Also, from
elemental mapping, Ni clusters appear to be enveloped inside of the electronically
insulating SEI. This indicates a possible aging mechanism that involves metals becoming
trapped and detached from the bulk electrode. This metal-trapping mechanism leads to the
active material becoming stuck in the charged state, reducing the achievable capacity. It
also can sacrifice the mechanical integrity of the SEI later itself, which relates back to the

135
GITT results, where the apparent diffusion coefficient increased near the end of Region III.
What is likely occurring is that the volumetric changes from the conversion reaction,
coupled with the formation of the SEI forcing some particles off the surface, temporarily
increase the porosity of the newly-formed SEI, allowing a different mode of transport (fully
solid-state to liquid phase diffusion) to be active.
5.5 SUMMARY
First, characteristic regions were isolated for conversion-based MOs anodes based
on the thermodynamic, kinetic, and transport properties at different SOC. The reaction
mechanisms were isolated for each region and revealed very similar characteristics to the
SEI formation process in Region 1 on carbon and Region I on MO. Unlike carbon, where
only SEI formation and EDL storage were observed, MOs store charge via bond-breakage,
which dominated the response for Regions II and III. The conversion reaction mechanism
also occurs extensively in Region IV; however, increased driving force for SEI formation
(lower potential) leads to a competition between the two reactions that revolves around the
Li+ dissociation from the SEI. This results in a shift in the Tafel slope and the RDS for SEI
formation from an electrochemical step to a chemical step with an eff = 1. Cumulatively,
it can be surmised that the SEI formation on M-X materials appears to initiate identically
to carbon, though some surfaces may show a catalytic effect that needs to be studied
further. However, the final stages of SEI formation, though they result in very similar
inorganic products, appear to diverge mechanistically.

136
CHAPTER 6: AVOIDING THE SOLID ELECTROLYTE INTERPHASE
DEGRADATION MECHANISM IN NEXT GENERATION
CONVERSION ANODES
The fundamental reaction mechanism to the formation of the SEI and the
conversion reaction has been discussed in depth in Chapter 5 and this Chapter will take the
study one step further to study the long-term effects of conversion metal oxides (e.g.
cyclability, reaction reversibility, coulombic efficiency, chemistry) and methods to bypass
these degradative processes. Recall from Chapter 1, metal oxides (MOs) typically suffer
from intrinsically low electronic conductivities (10-8 – 10-3 Ω-1 cm-1)195 and display several
degradation mechanisms that are inherent to their chemistry. First, if the structure and
electronic conductivity of the local environment are not well controlled, the base metal (M)
and Li2O reaction products can phase separate, resulting in the trapping of the active
material in the charged state, rapidly lowering the capacity during cycling196–198. Second,
there is an entropic penalty associated with the repetitive restructuring and collapse of the
parent host (MO→M + Li2O)198–200, which can lead to the growth of larger particles and
phase segregation to minimize surface free energy. Third, there can be the continued
growth of the SEI due to physical changes in the electrode during charge/discharge,201–205
which can reduce the electrode capacity during cycling through both increased irreversible
capacity loss as well as particle detachment and metal trapping within the SEI85,189,206,207.
Finally, through reaction either with excess electrolyte or the SEI, MOs undergo a side

137
reaction that forces them to higher oxidation states during their lifetime – a reaction that
lowers their achievable coulombic efficiency (but not their achievable capacity since the
reaction does not consume Li)42. In combination, these four degradation mechanisms have
often significantly limited the performance and lifetime of MO-based anode materials and
have led to their exclusion from cells of commercial interest.
Therefore, Li-ion cells employing MO anodes must overcome the low (particle-
level) and long-range (electrode-level) electronic conductivity problems, long-term phase
segregation, and irreversible capacity loss due to uncontrolled overgrowth of the SEI. One
possible approach is physically confining the MO from the electrolyte in a highly
entangled, high-aspect-ratio conductive matrix (e.g. high crystallinity carbon nanotubes),
which has the potential to significantly reduce the effects of all the “inherent” degradation
mechanisms listed above – increasing their cyclability and coulombic efficiency – and limit
irreversible capacity loss in the first cycle. Doing so with a low loading of the conductive
material (~10%) can provide a practical pathway forward for these materials – resulting in
a low cost, long-life, high-rate active material with no Li plating during fast charge, which
would have a significant impact on the LIB technology. This chapter will provide the first
steps in this direction – using NiO confined inside of carbon nanotubes (NiO@CNT) as a
proof-of-concept. The physical and electrochemical properties of the NiO@CNT material
will be investigated. It will be shown that nano-confinement is a convincing panacea to
eliminate the existing degradation pathways, allowing for these materials to be extensively
cycled with full material utilization and fast-charged.

138
6.1 EXPERIMENTAL
6.1.1 REAGENTS
Multi-walled carbon nanotubes (CNTs) (average D = 10 nm, P/N 412988 and
average D = 50 nm, P/N 901002), Pluronic P123 triblock copolymer (PEG-PPG-PEG, Mn
~ 5800), tetraethyl orthosilicate (TEOS, >99.0%), hydrochloric acid (HCl, ACS reagent
grade, 37%) and nitric acid (HNO3, ACS reagent grade, 70%) were purchased from Sigma
Aldrich. Nickel (II) nitrate hexahydrate (Ni(NO3)2-6H2O, 99%) and potassium hydroxide
(NaOH) were purchased from Acros Organics through Fisher Scientific. Vulcan XC-72R
was purchased from Cabot. The CNTs were purified with an acid treatment and high-
temperature defunctionalization (detailed in Section 2.2). Li(Ni0.5Mn0.3Co0.2)O2 powder
was purchased from MTI corporation. Ultrapure deionized water (18.2 MΩ cm) was
supplied by a lab-scale Millipore Milli-Q Integral system with E-POD. All other chemicals
were used as received.
6.1.2 SYNTHESIS OF NIO/C, ID-NIO/CNT, AND NC-NIO@CNT
Three unique NiO-carbon composite materials were synthesized: (1) unconstrained
deposition of NiO on the surface of carbon black (Vulcan XC-72R), which will be denoted
as NiO/C; (2) NiO indiscriminately deposited on both the inside and outside of CNTs,
denoted as ID-NiO/CNT; and (3) NiO nano-confined exclusively on the inside of CNTs,
denoted as NC-NiO@CNTx (where x = the CNT diameter in nm).
NiO/C was synthesized through a mesoporous silica (SBA-15) template-assisted
synthesis. First, the SBA-15 template was produced using the same procedure as previous
publications.33,177,178 In a typical synthesis, 6g of Pluronic P123 and 13.6 mL TEOS was

139
first dissolved in 180mL of 2M HCl solution and successively heated at 45oC (20 hours)
and 100oC (24 hours). The resulting SBA-15 template was washed with a DI water/ethanol
mixture and dried under a vacuum. The dried SBA-15 was then calcined in air at 500oC for
3 hours. Next, 500 mg of nickel nitrate hexahydrate was dissolved to create an aqueous
0.5M Ni(NO3)2 solution. The solution was added dropwise to the SBA-15 until a ratio of
6.3 mL/gSBA-15 was obtained. The Ni(NO3)2/SBA-15 gel was magnetically stirred and then
calcined in air for 3.5 hours at 400oC. The resulting powder was immersed into an aqueous
5M KOH solution for 12 hours at 100oC to etch away the SBA-15 template. The
supernatant was disposed of, and the remaining solids were rinsed three times with excess
DI water, centrifuged at 4500rpm using a Sorvall ST-8 centrifuge, and then dried for 8
hours at 70oC under vacuum. Finally, the templated NiO was added to a mortar along with
Vulcan XC-72R in a 7:1 mass ratio and ground with a pestle for 30 minutes.
ID-NiO/CNT was synthesized by dispersing 200 mg of CNT50 into 20 mL nitric
acid with a magnetic stirring rod. The CNT50 dispersion was refluxed at 120oC for 30
minutes to purify the CNTs, which also opened their closed-ends. Next, the CNT50
dispersion was diluted slowly under magnetic stirring with a total of 80 mL of DI water.
The diluted dispersion was then transferred to a 50 mL centrifuge tube and the solids were
separated by centrifugation at 4500 rpm for 10 min. After decanting the liquid, an
additional 40mL of DI water was added to the centrifuge tube, which was then sonicated
and centrifuged (repeated three times with the liquid being decanted off each time). The
solids were vacuum dried at 70oC for 24 hours and defunctionalized for 4 hours at 1500oC
in a tube furnace under an Argon atmosphere to ensure high CNT crystallinity. Next, 30
mL of a 10M nickel nitrate hexahydrate (Ni (NO3)2 · 6 H2O) in 70% nitric acid solution

140
was prepared by stirring for 1 h. 100 mg of the defunctionalized CNT50 was added to the
solution and refluxed at 120oC for 12 hours. The solid precipitate was vacuum filtered
with a G2-grade glass fiber membrane (Fisherbrand) in a Büchner funnel, vacuum dried at
70oC for 24 hours, and then placed in a tube furnace and heated to 450oC for 4 hours under
Argon atmosphere. The final ID-NiO/CNT was obtained after grinding with a mortar and
pestle for 30 minutes to break up any agglomerates.
NC-NiO@CNTx anodes were synthesized by dispersing 200 mg of CNTx into
20mL of 70% nitric acid under continuous stirring. The CNT dispersion was refluxed at
120oC for 30 minutes. The temperature was reduced to room temperature and then slowly
diluted with 80mL of DI water. The diluted dispersion was centrifuged at 4500 rpm for 10
minutes, then decanted and refilled with 40mL of DI water, and finally sonicated. The
process was repeated three times. The supernatant was removed, and the remaining CNTx
solids were dried at 70oC for 24 hours under vacuum. The dried solids were thermally
treated and defunctionalized for high CNT crystallinity in a tube furnace under continuous
Argon flow for 4 hours at 1500oC. The samples were re-dispersed in a 30mL 70% nitric
acid and 10M Ni(NO3)2 solution. Then, the 10M Ni(NO3)2-CNTx solution was refluxed for
12 hours at 120oC to allow for complete permeation of the nickel precursor into the CNTx.
After filtration with a G2-grade glass fiber filter, the samples were dried under vacuum at
70oC for 24 hours and pyrolyzed at 450oC for 4 hours under continuous Argon flow. 300
mg of the pyrolyzed solids were dispersed in 50 ml of 0.25M nitric acid and stirred for 1
hour. The remaining solids were collected by vacuum filtration with G2-grade glass fiber
circles in a Büchner funnel (the liquid filtrate was bluish-green), dried under vacuum at
70oC for 24 hours, and then heated in a tube furnace at 450oC for 2 hours in an Argon

141
atmosphere. The final NC-NiO@CNT50 (i.e. CNTs with 50 nm diameter) and NC-
NiO@CNT10 (i.e. CNTs with 10 nm diameters) active materials were obtained after
grinding with a mortar and pestle for 30 minutes.
6.1.3 ELECTRODE FABRICATION AND COIN CELL ASSEMBLY
NiO/C, ID-NiO/CNT, and NC-NiO@CNTx anodes were prepared by mixing 95%
active material with 5% polyvinylidene fluoride binder (PVDF, Kynar Blend). A transfer
micropipette was used to measure 400 µL of N-methyl-pyrrolidone (NMP, Acros, 99.5%
Extra Dry) solvent, which was used as a dispersing agent for 100 mg of total solids to
obtain an anode ink with moderate viscosity. The final ink was obtained after
homogenization by 3 rounds of sonication (20 minutes) and continuous stirring (8 hours).
The homogenized ink was uniformly sprayed onto a 50 µm thickness Cu current collector
(Alfa Aesar, Catalog No. AA42972FI) with an Iwata-Medea Eclipse HP-CS sprayer. The
resulting electrodes were dried in a vacuum oven at 75oC for 24 hours, pressed at 1500 lbs
with a hydraulic press (MTI 5T Max. Manual Mechanical Press), and calendared (MTI
Electric Roller-MSK-MR100DC). Electrodes used in half-cell studies had an active
loading between 0.5 and 1.5 mg cm-2. Full cells had a higher target anode mass loading of
5 mg cm-2 and the cathode target mass loading was 18 mg cm-2. (target N/P ratio ~ 1.1).
The full cell cathode active material:carbon:binder ratio was 8:1:1.
Coin cells were assembled in an argon (Ar, UHP Praxair) filled glove box (O2 and
H2O < 0.1 ppm, MBraun Labmaster SP) in a half cell configuration with a Li metal
counter/reference electrode. All electrochemical tests were conducted with CR2032 coin
cells (Hohsen Corp.), 1.5 cm diameter lithium metal (99.9%, Alfa Aesar) counter
electrodes, Celgard 2320 tri-layer PP/PE/PP membrane separator, and 1M lithium

142
hexafluorophosphate (LiPF6, Acros 98%) salt in a 1:1:1 volumetric mixture of ethylene
carbonate (EC, Acros 99+%): dimethyl carbonate (DMC, Acros 98+%): diethyl carbonate
(DEC, Acros 99+%) electrolyte. A typical coin cell assembly began with a lithium counter
electrode centered and flattened onto the coin cell base. A micropipette was used to transfer
15 µL of electrolyte to both sides of the Celgard separator, which was then placed, centered,
onto the lithium electrode. The gasket was placed to position the working electrode (NiO/C,
ID-NiO/CNT, NC-NiO@CNTx) directly in the center of the assembly. The spacer disk,
spring, and the anodic cap of the coin cell were placed on top and the cell was finished by
crimping with an MTI hydraulic press (MSK-110) to a pressure of 750 PSI. All sealed coin
cells were inspected and safely transferred out of the glove box for electrochemical testing.
To assemble the high loading full cells, the anodes were first prelithiated to control
the state of charge of anode upon assembly and to avoid any irreversible capacity loss in
the initial cycles. The anode electrode was prelithiated by first immersing the electrode in
a 1:1:1 EC: DMC, DEC, 1M LiPF6 electrolyte for 72 hours to allow for full electrolyte
penetration. Then, the anode was cycled in the same electrolyte 10 times between 0.001
and 3.0 V versus a Li foil. The first cycle rate was C/20 and subsequent cycles were 1C.
Then, the prelithiated anode (5.16 mg cm-2) was paired with a Li(Ni0.5Mn0.3Co0.2)O2 (18.23
mg cm-2) cathode using the same procedure as the half-cell experiments. Before cycling,
full cells were aged for 48-hours at 40oC inside a Tenney temperature control chamber to
allow the electrolyte to fully permeate into the electrodes. After removal from the Tenney
chamber, the cell was given an additional 8-hour relaxation to equilibrate to ambient
temperature before testing.

143
6.1.4 CHEMICAL AND STRUCTURAL CHARACTERIZATION
An extensive suite of characterization tools was used to determine the structural
and chemical state of the active materials before and after cycling. For materials
characterized at the end of cycling, the Li-ion cells were disassembled in the MBraun Ar-
filled glovebox detailed above. The electrodes were washed with dimethyl carbonate
(DMC) to remove residual Li salts and dried for 1 hour under vacuum at room temperature.
X-Ray Diffraction (XRD) patterns were collected between 10 and 90 2 degrees at a scan
rate of 0.0285 degrees s-1 using a Rigaku Miniflex II at room temperature equipped with a
high sensitivity D/tex Ultra Si slit detector. The Miniflex II had a Cu K(α) radiation source
(λ = 0.15405 nm) that was operated at 30 mA and 15kV. Thermo-gravimetric Analysis
(TGA) was done using a NETZSCH STA 449. The TGA traces were collected from room
temperature to 1000 oC. Each sample was purged of moisture for one hour at 120oC under
UHP N2. Scanning transmission electron microscopy (S/TEM) images were collected
using a FEI Talos S/TEM and Hitachi H8000 TEM with integrated energy-dispersive x-
ray spectroscopy (EDS). X-ray photoelectron spectroscopy (XPS) measurements were
performed with a Kratos AXIS Ultra DLD XPS system.
Pre-/post-cycled TEM images were collected using the identical-location TEM
technique from a previous publication.40 Generally, a Cu TEM finder grid (3mm diameter,
100 mesh, Ted Pella, Inc) was dropped with 1µL of diluted active material ink (1:10 ratio),
drained, repeated three times, and dried for 24 hours under ambient conditions. After TEM
imaging, the TEM grid/active material was cycled with a custom-designed Teflon-
shrouded Cu electrode with a Teflon cap that applies pressure to the outer ring of the Cu
grid. A 3-electrode system was employed to ensure high-fidelity voltage measurements

144
(i.e. mitigate external factors that contribute to high overpotentials) inside the Ar-filled
Mbraun glovebox. The 3-electrode system (working electrode: NiO/C, ID-NiO/CNT, NC-
NiO@CNT; counter electrode: Li foil; reference electrode: Li foil) was separated with a
Celgard separator inside a beaker and filled with 1M LiPF6 in 1:1:1 volumetric mixture of
EC/DMC/DEC. After electrochemical treatment, described in the next section, the working
electrodes were rinsed with DMC by submersion for 30 minutes and dried under ambient
glovebox conditions for 24 hours. Afterwards, the post-cycled electrodes were transferred
to an Ar-filled Kratos AXIS Ultra multipurpose transfer vessel and removed from the
glovebox for further characterization (e.g. XPS, TEM, SEM).
6.1.5 ELECTROCHEMICAL TESTING
Electrochemical measurements were done on both coin-cells and the identical
location TEM working electrodes. For the coin cell experiments, chronopotentiometric
charge/discharge experiments were performed using an Arbin MSTAT battery test station.
The voltage window for half-cells charge/discharge measurements were 0.001-3.0V. The
C-rates for the charge/discharge were determined based on the NiO mass, and all capacities
are normalized to the total material mass (NiO + C + PVDF). The voltage window for full-
cells was set to 0.001-4.0V at C/2 with respect to Li(Ni0.5Mn0.3Co0.2)O2 and held at upper
cutoff voltage until C/20 current taper. The coin cells were also exposed to cyclic
voltammetry and Electrochemical Impedance Spectroscopy (EIS) using an Autolab
PGSTAT302N Potentiostat (Metrohm USA). Cyclic voltammograms (CVs) were
collected in the same voltage window as the charge/discharge experiments with a 0.1 mV
s-1 scan-rate. EIS experiments were done at open circuit with a 5mV amplitude after full
discharge (3V) at multiple frequencies between 1 MHz and 0.01 Hz. The open circuit

145
potential assumed to be reached was reached when dV dt-1 < 1µV s-1. All the
electrochemical measurements were made at room temperature. The electrodes used for
identical location TEM electrodes were exposed to either 10 or 100 CV cycles were
performed between 0.001-3.0V at 0.8 mV s-1,
6.2 RESULTS AND DISCUSSION
6.2.1 BEHAVIOR OF NON-CONFINED METAL OXIDE NANOPARTICLES
Li-ion cells employing MO anodes must overcome the low (particle-level) and
long-range (electrode-level) electronic conductivity problems, long-term phase
segregation, and irreversible capacity loss due to uncontrolled overgrowth of the SEI. One
possible approach is physically confining the MO from the electrolyte in a highly
entangled, high-aspect-ratio conductive matrix (e.g. high crystallinity carbon nanotubes),
which has the potential to significantly reduce the effects of all the “inherent” degradation
mechanisms listed above – increasing their cyclability and coulombic efficiency – and limit
irreversible capacity loss in the first cycle. Figure 6.1a is an SEM image of the NiO/C
macrostructure, showing that the material synthesized consisted of large agglomerations of
NiO nanoparticles with good porosity. Figure 6.1b presents transmission electron
microscopy (TEM) images and energy-dispersive X-ray (EDS) spectroscopy of pre-cycled
NiO/C and shows the successful synthesis of ordered mesoporous NiO via the SBA-15
template-assisted synthesis. The TEM images of NiO/C indicate highly distinctive
boundaries between each NiO nanoparticle.

146
Figure 6.1. | Physical and Electrochemical Characterization. Depicts (a) scanning electron
microscopy (SEM), (b) transmission electron microscopy and energy dispersive
spectroscopy (TEM/EDS) of NiO/C. (c) X-Ray Diffraction (XRD) patterns comparing the
crystallography (e.g. crystallite domain size, structure) of NiO/C (blue line), ID-NiO/CNT
(green line), and NC-NiO@CNT50 (purple line). (d) SEM and (e) TEM/ESC of ID-
NiO/CNT. (f) Comparing the capacity retention of NiO/C (blue line), ID-NiO/CNT (green
line), and NC-NiO@CNT50 (purple line) at 1C charge/discharge rate to observe the
reaction and cell-level reversibility. Reproduced with permission from The Royal Society
of Chemistry.37

147
High angle annular dark-field (HAADF) and elemental mapping of NiO shows the
majority of the NiO is distributed on Vulcan carbon, though some NiO particles extend
beyond the main carbon cluster. The images and EDS mapping shows that the MO particles
were not chemically attached to the surface but existed as a physical mixture with the
carbon. The X-ray diffraction (XRD) pattern for the NiO/C (blue line) is presented in
Figure 6.1c. Characteristic peaks for NiO were observed at 37o, 44o, 63o, 75o, and 80o
(2θ), corresponding to its (111), (200), (220), (311), and (222) Miller indices,
respectively.208 Additionally, two carbon-related peaks were observed at 26o and 44o,
which are associated with the graphitic (002) and C(100) Miller planes, respectively.209 No
secondary phases or peaks ascribed to contaminants were observed. The Scherrer equation
was applied to calculate the average crystallite domain size for NiO/C, 24.1 nm. Figure
6.1d is an SEM image of NiO indiscriminately deposited and anchored onto the surface of
the 50 nm diameter CNTs, ID-NiO/CNT. The image clearly shows a semi-entangled
carbon nanotube network with a high degree of surface NiO deposition. As shown in the
SEM image, the MO particles are tethered to the CNT surface as both dispersed particles
as well as larger agglomerates. Also, TEM and EDS in Figure 6.1e, were used to analyze
the nanostructure and spatial arrangement of NiO and CNT in the ID-NiO/CNT material
before any electrochemical testing. Since HAADF is able to contrast by atomic weight
(high Z-contrasted material is ascribed to Ni, whereas the lighter Z-contrasted material is
C), it was confirmed that the surface of the CNTs was covered extensively by NiO, though
it should be noted that some NiO was also deposited inside of the CNTs. The XRD pattern
for ID-NiO/CNT (green line) has similar characteristic peaks for NiO and C, NiO: 37o
(111), 44o (200), 63o (220), and 75o (222); C: 26o (002) and 44o (100). The average

148
crystallite domain size for ID-NiO/CNT was found to be 16.6 nm, smaller than that of
NiO/C.
Although their physical structures are different, one important similarity between
the NiO/C and ID-NiO/CNT materials is that they are both comprised of NiO particles that
are completely exposed to the electrolyte in operating cells. Therefore, it can be expected
that all four of the degradation mechanisms discussed in the Introduction will be active for
these materials and it is likely that their behavior in operating LIBs would be similar.
Figure 6.1f presents the normalized capacity retention (Q/Qo) plots for both NiO/C (blue
line) and ID-NiO/CNT (green line) over 100 cycles at a 1C rate. Each experiment was
repeated on three cells to confirm the repeatability of the electrochemical performance.
Also, the reference point for the initial capacity (Qo) was assumed to be the 2nd cycle to
account for the irreversible capacity loss from SEI formation. The overall electrochemical
cycling performance of NiO/C and ID-NiO/CNT showed similar capacity fade over 100
cycles – showing that the type of carbon is not an intrinsically determining factor when
considering the onset of degradation. For NiO/C, the irreversible capacity loss in the first
cycle was 23%. From the 2nd cycle to the 15th cycle, the rate of capacity fade was very
high, and the NiO/C anode lost 41% of its capacity during this time. The average coulombic
efficiency (CE) over the first 15 cycles was also low, only 97.4%. After cycle 15, the
degradation rate for NiO/C was slowed, though still relatively severe and over 100 cycles;
NiO/C lost 69.4% of its capacity and the average CE of a single cycle was 97.1%.
As an anode, ID-NiO/CNT (Figure 6.1f green line) experienced a similar trend in
capacity fade to NiO/C. The SEI-related irreversible capacity loss for ID-NiO/CNT was
35.4%, which was higher than that of NiO/C, most likely due to the higher surface area of

149
the smaller NiO crystallites in ID-NiO/CNT (16.6 nm) compared to NiO/C (24.1 nm). The
total capacity loss of ID-NiO/CNT was 73.1% over 100 cycles whereas NiO/C was 69.4%,
which shows a high degree of similarity in the onset of degradation and overall capacity
loss. An important point related to the capacity retention plots in Figure 6.1f is that the
data for both NiO/C and ID-NiO/CNT had seemingly large scatter, particularly at low cycle
numbers. What this suggests is that MO degradation by metal (e.g. Li, M) trapping, SEI
(re)formation, and/or transition to higher oxidation states is a complex series of events that
can be triggered over the distribution of cycle numbers – though typically the onset of
degradation will occur within the first 30 cycles, and the rate of initial degradation is rapid.
Finally, the average CE for ID-NiO/CNT was also low, 95.8%, with a notable trend of CE
loss over 50 cycles followed by a gradual recovery. The correlation between capacity loss
and CE loss indicates that material is being trapped in the charged state repetitively after
each cycle. This would result in larger Ni agglomerates, which were investigated by
collecting TEM images of post-cycled materials and comparing them to Figure 6.1b and
Figure 6.1e. Also, the low measured CE without catastrophic failure and loss of capacity
is direct evidence of the conversion of the NiO to higher oxidation states during
charge/discharge34, which was further investigated by XPS before and after cycling.
Figure 6.2 shows post-cycle TEM images and pre/post-cycled XPS of NiO/C and
ID-NiO/CNT. It is important to observe the evolution of the MO particle size, as this
impacts the electrochemical behavior. As observed in Figure 6.2 for NiO/C, even after 10
cycles the interfacial boundaries between each NiO nanoparticle appear to merge. After
100 cycles, the NiO agglomerates in NiO/C are so large that individual particles are almost
indistinguishable. The repetitive restructuring and collapse of the MO active material

150
during the conversion reaction led to larger and larger phases each time it is reformed,
causing a gradual decrease in the Ni/Li2O interfacial contact area during discharge
(oxidation) and trapping of material in the charged state. In other words, the NiO/C
undergoes significant metal trapping during discharge and is likely the primary cause for
capacity fade during cycling.
Figure 6.2(b-d) presents the pre- and post-cycle XPS analysis for NiO/C. Figure
6.2 (b,c) shows the Ni2p and O1s post-cycled XPS spectra for electrodes both before and
after 100 cycles (the spectra were collected for materials in the discharged state). The high
resolution Ni2p XPS spectrum before cycling (Figure 6.2b) shows characteristic Ni2p1/2
(872.5eV) and Ni2p3/2 (854eV) with a multiplet-split and displacement of 18.5 eV (from
Ni2p1/2 to Ni2p3/2), which is characteristic of NiO spin-orbital levels.34 After 100 cycles, a
peak at 859 eV emerged, which could be attributed to the formation of surface NiF2 (a
likely SEI product). In addition, a shoulder peak was found at a binding energy of 855.4
eV, which is characteristic of higher oxidation state Ni2O3, and indicates a pre-to-post cycle
material transformation from (Ni2+→Ni3+). The O1s XPS spectrum (Figure 6.2) for the
post-cycled NiO/C shows the presence of C=O, OH bonds at a binding energy of 533.0 eV
and C-O bonds at 531.3 eV. Evidence for lithium alkyl carbonates, R-CH2O(C=O)OLi was
also found at O1s binding energies of 532.5 eV and 533.5 eV.210 A less pronounced peak
for the oxygen associated with metal oxides was observed from the peak shoulder at 530.1
eV. From the XPS results, the portion of the Ni in the active material in the 2+ (NiO) and
3+ (Ni2O3) oxidation states are summarized in Figure 6.2d. During cycling, the
unconstrained NiO/C underwent a material transformation from 100% Ni2+ to a mixed
oxidation state of 52% Ni3+ and 48% Ni2+, accounting for the low CE observed in Figure

151
6.1f. As stated in the introduction, the most likely cause for the transition of Ni2+ to Ni3+
is the reaction of NiO with oxygen-containing species in the SEI and/or the electrolyte.
However, because there are several oxygen-containing species in the system, it can be
difficult to determine which one is responsible for the transformation of NiO to Ni2O3 over
time. Though there are many possible reactions, the O1s XPS spectra does provide
evidence for at least one possible reaction, shown in Equation 6.1.
2𝑁𝑖𝑂 + 2𝑅𝐶𝐻2𝑂𝐶𝑂𝑂𝐿𝑖 Ni2𝑂3 + 𝐿𝑖2𝑂 +
𝑅𝐶𝐻2𝐶𝑂𝐶𝑂𝐶𝐻2𝑅
Equation 6.1
In the O1s XPS spectra for NiO/C (Figure 6.2c) and ID-NiO/CNT (Figure 6.2c)
there is a clear asymmetry in the C-O peak where the peak shifts towards the left. The
integrated area on either side of the peak suggests there are more C=O bonds than C-O
bonds, which suggests that the alkyl carbonate SEI decomposition product R-
CH2O(C=O)OLi likely undergoes further decomposition. It is also noted that the
asymmetry of this peak coincides well with the emergence of the Ni2O3 species, suggesting
that these events are related; however, it is acknowledged that additional reactions are
certainly possible, even likely. Figure 6.2e shows that after 10 cycles ID-NiO/CNT was
able to retain its pre-cycled architecture with no observable deformation to the CNT.
However, it was observed that some NiO agglomeration occurs and that some of the active
material particles were detached and isolated from the CNTs as they were engulfed by the
SEI. These particles remain trapped in the electronically insulating SEI and become
deactivated. The SEI was found to grow similarly to that of graphite, where the SEI
partially extends out of the CNT edge planes and caps. Also, SEI-clusters were found near
large MO deposits.

152
Figure 6.2. | Evaluation of Physical and Chemical Transformations. (a) TEM image of
NiO/C after 10 electrochemical cycles. XPS spectra of NiO/C including (b) Ni2p, (c), O1s,
and (d) oxidation state percentages for NiO/C. (e) TEM images of ID-NiO/CNT after 10
electrochemical cycles. XPS spectra of ID-NiO/CNT including (f) Ni2p, (g) O1s, and (h)
oxidation state percentages for ID-NiO/CNT. Reproduced with permission from The Royal
Society of Chemistry. 37
Figure 6.2 (f-h) presents the pre- and post-cycled XPS analysis of ID-NiO/CNT
and the characteristic peaks in ID-NiO/CNT show the degradation pathway to form nickel
carbides at 852.6 eV and Ni2O3 at 857.5 eV. Figure 6.2f shows the high-resolution Ni2p
XPS spectra for pre- and post-cycled ID-NiO/CNT. Prior to cycling, the XPS spectra were
very similar to NiO/C, where Ni2p1/2 (873eV) and Ni2p3/2 (854.5eV) displayed an electron-
spin difference of 18.5 eV. Also, like NiO/C, significant material transformation occurred
after 100 cycles, and the presence of nickel fluorides (857.5eV), nickel oxide (855.6eV),
and nickel carbides (852.8eV) were observed. The indiscriminately deposited ID-
NiO/CNT post-cycled XPS analysis suggests similar chemical transformation of higher
oxidation states (Ni2+→Ni3+) as that found in NiO/C, Figure 6.2h. Finally, Figure 6.2g

153
shows that the O1s spectrum for ID-NiO/CNT showed a similar presence of C=O, and OH
bonds (533 eV) and C-O bonds (531 eV) as NiO/C.
In total, the observations in Figure 6.1 and Figure 6.2 suggest that the behavior of
NiO/C and ID-NiO/CNT are very similar, though there were some subtle differences. For
instance, the degradation rate of ID-NiO/CNT seems slightly slower and the transition to
higher oxidation states is not quite as severe. These differences may be due to the partial
confinement of NiO inside the CNT host, which might be able to minimize degradation of
those particles, which are mostly isolated from the bulk electrolyte.
6.2.2 CNT-NANOCONFINED NIO
The proposed role of nanoconfinement to inhibit the dominant MO degradation
pathways (in this case NiO) is illustrated in Figure 6.3a. When the MO particles are
deposited solely inside the CNT, the CNT acts as an immobilization host that isolates MOs
from the bulk electrolyte – which is expected to limit the extent to which the MO active
material can react with the electrolyte, minimizing degradation. Also, the finite space
within the CNT provides some elasticity for volumetric expansion, but limited opportunity
for continuous SEI growth (i.e. CNT confinement can minimize particle detachment,
isolation, and ripening/agglomeration). In addition, the CNT holds all reactants and
products in one closed packet, which is hypothesized to minimize possible parasitic
degradation reactions and increase the interaction area between reactants – increasing the
material-level reaction reversibility and improving coulombic efficiency.
Therefore, to explore the realized effect of confinement on long-term reversibility
and stability, NC-NiO@CNT50 was synthesized. The SEM images in Figure 6.3b show
that the synthesized material was nearly completely free of surface MO particles compared

154
to ID-NiO/CNT in Figure 6.1d. Not only is this expected to yield the advantages discussed
above, it should also be noted that the resulting electrode would primarily consist of a
highly conductive, interconnected carbon matrix that can freely transport electrons
throughout the active layer211,212. Figure 6.3c further shows the successful synthesis of the
nanoconfinement concept presented in Figure 6.3a, providing a high-resolution view of
the structure alongside EDS elemental mapping, which showed the presence and
distribution of Ni, O, and C. Also, the NiO particles appeared to be tethered to the inner
walls of the CNT, which physically restricts the MOs and their charge products (M and
Li2O) to a finite space, thereby suppressing movement.
The high-resolution TEM images (HR-TEM) in Figure 6.3(c-1 to c-3) shows the
lattice fringes of NiO nanocrystallites with a d-spacing of 2.4Å, which is ascribed to (111)
plane of NiO. The interlayer separation of the CNT was determined to be 3.4 Å. Finally,
XRD patterns for NC-NiO@CNT50 (purple line) are shown in Figure 6.1e. The same
characteristic peaks for NiO (at 37o, 44o, 63o, 75o, and 80o) and carbon (at 26o and 44o)
were observed in NC-NiO@CNT50 that were observed for NiO/C and ID-NiO/CNT.
Application of the Scherrer equation yielded a calculated average crystallite domain size
for NC-NiO@CNT50 of 15.9 nm, similar to ID-NiO/CNT (16.6 nm).
After synthesis, the electrochemical response of NC-NiO@CNT50 was investigated
and its normalized capacity retention (Q/Qo) over 100 cycles is shown in Figure 6.1f,
alongside the data for NiO/C and ID-NiO/CNT for comparison. Unlike NiO/C and ID-
NiO/CNT, the NC-NiO@CNT50 retained essentially all its capacity over the first 100
cycles. Also positive, NC-NiO@CNT50 had a much lower irreversible capacity loss than
the other two NiO materials, only 12.2%. Because of this excellent initial performance,

155
the NC-NiO@CNT50 could cycle for an additional 300 cycles. Over the 400 total deep
charge/discharge cycles at 1C, the NC-NiO@CNT50 retained 96.3% of its capacity with
very little scatter over three repeated cells. In addition, the average coulombic efficiency
of NC-NiO@CNT50 was 99.2%.
Figure 6.3d shows post-cycle TEM images of NC-NiO@CNT50, which shows that
minimal structural changes occurred during charge/discharge, in stark contrast to NiO/C
and ID-NiO/CNT (Figure 6.2). The NiO particle size distribution of confined MOs was
very similar pre- and post-cycling. Also, there was no evidence of either particle
detachment or migration that led to the formation of large M/MO agglomerates.
Furthermore, the SEI appeared to remain confined within the interior of the CNT, which
can effectively limit SEI growth during long-term cycling. Finally, XPS analysis showed
that confinement also inhibited the transition of the nickel to higher oxidation states.
Figure 6.3e shows a similar pre-cycled high-resolution Ni2p XPS spectrum for
NC-NiO@CNT to that of NiO/C and ID-NiO/CNT. Post-cycling (100 cycles), NC-
NiO@CNT only showed the presence of NiF2 (from SEI formation) and NiO, which
suggests that after repeated charge/discharge cycles, Ni2+ →Ni2+ retention was achieved
and that no measurable transformation to Ni3+ was observed (Figure 6.3g). Therefore, the
possible reaction pathways for a constrained material appear to be limited to the reversible
electrochemical reaction pathways – which should allow for long term operation. To better
understand the electrochemical behavior of the NC-NiO@CNT50, Figure 6.4a and Figure
6.4b shows charge/discharge and differential capacity analysis (dQ dV-1) curves,
respectively, during the 1st, 100th, 200th, 300th, and 400th cycle.

156
Figure 6.3. | Material Nanoconfinement. (a) Illustration of metal oxides spatial
rearrangement during charge/discharge in the case of nanoconfinement, (b) SEM images
of nano-confined NiO in NC-NiO@CNT50, (c) TEM images and EDS mapping of NC-
NiO@CNT50, (c-1) interlayer spacing of CNT, (c-2) interface between MO-CNT, (c-3)
lattice fringes of NiO, (d) TEM image of NiO@CNT50 after 10 electrochemical cycles.
XPS spectra of NC-NiO@CNT50 including (e) Ni2P, (f) O1s, as well as (g) the percentage
of active materials remaining in the 2+ oxidation state after cycling. Reproduced with
permission from The Royal Society of Chemistry.37

157
Figure 6.4. | Electrochemical performance. (a) The charge-discharge curves and (b)
differential capacity analysis (dQdV-1) of NC-NiO@CNT50. (c) Rate capability evaluation
for charge reversibility and rate-specific side reactions at different current densities for NC-
NiO@CNT50. (d) EIS spectra after 10, 50, and 100 charge/discharge cycles for ID-
NiO/CNT and NC-NiO@CNT50, showing the evolution of chemical and physical
processes (e.g. diffusion, charge transfer, electrolyte conductivity, SEI resistance) during
cycling. (e) Capacity retention over 2000 cycles for NC-NiO@CNT10 at 1C (718 mAh g-
1). (f) Capacity retention, charge-discharge curves, and differential capacity analysis for
high loading full cells made from NC-NiO@CNT10 anodes and Li(Ni0.5Mn0.3Co0.2)O2
cathodes (anode loading: 5.16 mg cm-2; cathode loading: 18.23 mg cm-2) full cell. XPS
spectra for NC-NiO@CNT10 before and after cycling including (g) Ni2P, (h) O1s, and (i)
the percentage of NiO remaining in the 2+ oxidation post-cycling. Reproduced with
permission from The Royal Society of Chemistry.37

158
The conversion reaction and the SEI formation is shown in the 1st cycle at a mixed
potential of 0.350V. The subsequent reduction plateau occurs at 1.15V and the oxidation
plateau at 2.15V. Cycles 100, 200, 300, and 400 show minimal deviations in both the
charge and discharge voltage plateaus/peaks, which indicates excellent reaction
reversibility and active material utilization over time. Subsequent cycles result in a
decoupled reduction plateau that is characteristic of the conversion reaction. It is noted that
the CNT is a non-dilutive conductive carbon additive that also allows for some Li-ion
intercalation, which may contribute a little to the total capacity. During the oxidation, a Li
de-intercalation peak was observed at 0.2 V and a metallic Ni reconversion back to NiO at
1.5V and 2.15 V.
Electrodes made of well-embedded MOs in conductive carbon matrices will exhibit
less contact resistance at the MO/Carbon interface. Therefore, it might also be possible
that these confined, nano-sized MOs will exhibit enhanced reaction kinetics and rapid
diffusion of Li ions compared to other structures. This was explored through experiments
at several charge/discharge rates. Figure 6.4c shows the rate capability of NC-
NiO@CNT50 and shows a capacity of 460 mAh g-1 at 5C. Even after alternating among
various C-rates, the cell capacity retention after 400 cycles was at 627 mAh g-1 at 1C, which
was 94% of the original capacity.
EIS measurements (Figure 6.4d) can be used to explain the evolution of the
physical and chemical processes because each of the characteristic phenomena (diffusion,
reaction, etc.) have their time constants and relaxation times, which hence can be probed
at different frequencies. It was observed that unlike ID-NiO/CNT, where the evolution of
the Rohmic increased over 100 cycles, the nano-confined NC-NiO@CNT50 showed a

159
negligible increase in charge transport impedance. NC-NiO@CNT50 also had a lower
charge transfer resistance than ID-NiO/CNT and the charge transfer resistance was
unaffected by cycling.
The combination of cycling performance, pre-/post-cycled TEM/XPS, and EIS
analysis suggest that the degree of confinement and isolation from the bulk electrolyte
might play a pivotal role in concomitantly increasing the MO reaction reversibility and
minimizing the size reactions responsible for the change in Ni oxidation state and long-
term SEI growth. Therefore, a version of the NC-NiO/CNTx anode was synthesized with
the specific goal of providing even less void space (i.e. less volume for excess electrolyte
exposure) and more rapid Li+ diffusion. This was accomplished by using CNTs with a
small diameter, 10 nm versus 50 nm. The total active loading of NiO was determined to
be 89.9% through thermogravimetric analysis (TGA).
Figure 6.4e shows the capacity retention of NC-NiO@CNT10 over 2000
charge/discharge cycles at 1C. It was found that this material was highly reversible,
showing an achievable capacity 686 mAh g-1 after 2000 cycles (initial capacity = 824 mAh
g-1, retention = 83.3%). Also, a coulombic efficiency greater than 99.9% was measured (to
be more quantitative would require High Precision Coulometry measurements, which is
beyond the scope of this study). Additionally, Figure 6.4 (f-h) shows the pre- and post-
cycle XPS spectra after 2000 cycles for the highly-constrained NC-NiO@CNT10. In short,
it was found that all of the nickel after 2000 cycles was in the 2+ oxidation state, suggesting
that the confined MO in NC-NiO@CNT50 is highly stable and highly reversible.

160
6.3 SUMMARY
The main descriptor for whether high capacity and capacity retention was achieved
was whether or not the MO was exposed to (NiO/C and ID-NiO/CNT) or isolated from
(NC-NiO@CNTx) the electrolyte. As summarized in Figure 6.5, MOs undergo four types
of physical processes that influence their behavior in operating LIBs: uncontrolled growth
of the SEI, a transition to higher oxidation states, metal agglomeration, and metal trapping.
These processes directly impact the coulombic efficiency, capacity retention, and onset of
degradation. Randomly dispersed MOs on conductive carbon (whether its carbon black or
advanced carbon) are susceptible to continuous uncontrolled growth of the SEI, and this
phenomenon is primarily found to be caused by the repetitive expansion/contraction of
MOs during phase separation/recombination that exposes the highly reactive surfaces of
the MO nanoparticles. Without a proper barrier, the SEI grows onto the highly exposed
surface and uncontrollably dislodges particles from the conductive medium in the
electrode. These electronically isolated particles become electrochemically deactivated,
and with the loss of active material, results in capacity fade. Also, the destabilized oxygen
balance and local overpotentials due to elevated internal resistance drive the evolution to
higher oxidation states. The reactions that guide the transformation of the MO to higher
oxidation states do not consume Li, but they do consume oxygen in the system and change
the number of electrons transferred per metal atom. This results in lower coulombic
efficiencies but does not result in capacity loss.

161
Figure 6.5. | Phase Separation and Degradation Pathway. Identifying the degradation
pathways in conversion MOs (e.g. M/MO agglomeration, metal trapping, electrical
detachment, SEI engulfment of MO, particle delamination) caused by fluctuations in the
local e-, Li+, oxygen, and metal balance during phase separation for (a) physically mixed
NiO/C, (b) anchored ID-NiO/CNT, and (c) nano-confined NC-NiO@CNT. Reproduced
with permission from The Royal Society of Chemistry.37
The SEI reactions and the reactions associated with coulombic efficiency loss in
operating cells are summarized in Table 6.1. The MO particles were always contained
inside the CNT-matrix, which enabled it to obtain a very high reaction reversibility. In
other words, the Ni atoms in the fully discharged state remained in the 2+ oxidation state.
NiO was extremely stable over a large number of cycles with high coulombic efficiency.
Therefore, it appears that constraint-based synthesis routes minimize the degradation
pathways associated with MOs and such nano-confinement represents a very promising
strategy to increase the adoption and practicality of MO-based anodes for Li-ion batteries.

162
Table 6.1. | Evaluation of Oxidation States. The overall reaction pathways associated with various
degrees of constraints of confinement of metal oxides.
Case Study Pre-
Cycled
Post-
Cycle
Possible Reaction Pathway Results
Control
(NiO/C)
100 cycles
100% Ni2+ 48% Ni2+
52% Ni3+
2LiF + Ni NiF2 + 2Li+ +2e−(SEI)
2NiO + 2RCH2OCOOLi Ni2O3 + Li2O +RCH2COCOCH2R (HOS)
Resulted in the
formation of
higher oxidation
states (HOS) 3+
oxidation state
Indiscriminately
Deposited
(ID-NiO/CNT)
100 cycles
100% Ni2+
63% Ni2+
37% Ni3+
2LiF + Ni NiF2 + 2Li+ +2e−(SEI)
2NiO + 2RCH2OCOOLi Ni2O3 + Li2O +RCH2COCOCH2R (HOS)
LixCyOz + Ni NiCyOz +
xLi+ + xe− (SEI)
Similar results to
control the
Formation of
higher oxidation
states (HOS) and
NiCyOz species
Nanoconfined
(NC-
NiO@CNTx)
2000 cycles
100% Ni2+ 100% Ni2+ 2LiF + Ni NiF2 + 2Li+ +2e−(SEI)
NiO transformed
to NiF2 and
remained in the
2+ oxidation state

163
CHAPTER 7: CONCLUSIONS
Li-based batteries play a pivotal role in enabling of all the luxuries of our electrified
society and are here to stay. This thesis fostered a better understanding of the complex
thermodynamics, kinetics, and transport properties of current-generation
graphite/NMC532 cells. A non-destructive parameter extraction via a pulse-relaxation
GITT method was used to map the exchange current (i0S), diffusion time constant (τ),
internal resistance (RIR), and the entropic heat coefficient (dUdT-1) as a function of
temperature (-30oC to 45oC) and SOC (0% to 100%). The extracted parameters were later
used in a reduced order lumped electrochemical-thermal model (TLM) to capture the
voltage and temperature profiles, which is consistent with the experimental validation in
Ng et al78. The TLM model deviates at high current densities (>1C) from cell-level SOCs
< 5%; however, LIB packs typically operate within the voltage plateau (SOC = 10% to
100%) and BMS discharge cutoffs occur at a specified dV dt-1 to ensure pack longevity.
The state space transformation of the PDEs used in this lumped model was able to decrease
the computational time for 1 charge/discharge cycle by 50% (~2s to less than 1s). The state
space approach (PDE to ODE transformation) is an effective method to greatly enhance
the calculation time for BMS applications, and the non-destructive GITT measurement for
four cell-level parameters (i0S, τ, RIR, dUdT-1) and is directly relatable to mathematical
quantities in the reduced order TLM. In a world that requires faster calculations and
reduced computational time, a novel method to extract parameters non-destructively can

164
be implemented as initial guesses to increase the convergence time and approach higher-
fidelity voltage and temperature predictions.
The next section of this thesis focused on studying the effects of the extreme
operating conditions that are expected to be experienced in multiple applications (e.g.
satellites, UUV, electric aircraft, cold-climate EVs, etc.) on LIBs. Low-temperature cycling
at low rates were found to catastrophically compromise the cell, and the electrode
(NMC532/LixC6) morphology, by a combination of Li0 deposition and severe gassing. The
morphology of Li0 deposits was found to vary spatially on an electrode, where mushroom-
shaped and/or mossy-like Li0 grows near electrode edges but near-uniform Li0 deposition
occurs towards the electrode center. The anisotropy in the Li0 growth mechanism indicates
severe (voltage, current, concentration) gradients within the electrode from tab-to-center,
flat-to-curved, and initial-to-final layers. First, Li0 deposition exacerbates the formation of
gases, which was found to result in a chemical reaction that causes particles to fuse together
and form numerous gas pockets that drastically alter the porosity and volume of the
electrode. Gas formation was also found to occur preferentially near the anode edge.
Furthermore, severe volumetric expansion/contraction during LT cycling causes high
warping of the curved regions of each jellyroll and can cause electrode buckling fractures
and complete breakage of the electrode. Therefore, next-generation battery electrode
design should incorporate reinforced anodes and/or cathodes that mechanically strengthen
regions where high-stress is expected. Most notably, this study showed that there exists
two catastrophic failure pathways for large format LIBs under low-temperature cycling:
1) non-thermal runaway from pressurized venting and 2) thermal runaway.

165
The last portion of this thesis dealt with NiO as a possible safe, high energy density
anode material. The next-generation of Li-based batteries must balance the safety, energy
density, and durability trilemma that plagues material development. It is well known and
further elucidated in this thesis that the pursuit of high energy density materials (e.g. Si, Li,
conversion metals) usually leads to poor cyclability or compromised safety. Conversion-
based materials, such as MOs, can be a promising alternative to commercialized
intercalation chemistries. Although conversion-based metal oxides have high gravimetric
capacities, it was shown that a complex series of degradation mechanisms can be active,
even over a very limited number of cycles. MO-based anode materials undergo four
primary degradation pathways that limit their achievable capacity, coulombic efficiency,
and long-term stability. When the MO particles are fully exposed to the electrolyte in
networks with insufficient electronic conductivity, all the degradation pathways are active,
and the MO anode can undergo rapid material degradation.
SEI formation on NiO was found to be broken down into four Regions. At the
beginning of SEI formation on NiO, the results were very consistent to those observed
during early-stage SEI formation on carbon, suggesting that SEI formation begins very
similarly from a mechanistic perspective. After the early stages of SEI formation, the
behavior is dominated by the conversion reaction itself with little contribution to the SEI
formation. The conversion reaction did result in some volumetric expansion and some
particle detachment from the surface, with some of the detached particles being embedded
in the SEI. In the final stages, a densified SEI layer is formed, just like on carbon-based
materials, but the mechanism for its formation is different. On carbon-based materials, the
formation of the dense SEI is limited by the electrochemical activation of low concentration

166
EC-intermediates on the surface. For NiO, the nature of the RDS to form the dense SEI is
consistent with Li+ abstraction from the SEI. In the future, these new insights can help
battery manufacturers to engineer appropriate environments and pre-treatment protocols to
build robust SEI layers on this family of materials, enabling long-life, stable, high-capacity
Li-ion batteries.
It is additionally shown that nano-confinement of MO nanoparticles can
significantly reduce the rate of some degradation mechanisms and eliminate others –
extending the achievable lifetime of LIBs with MO anodes significantly. In fact, the top-
performing material in this study, NC-NiO@CNT10, was able to cycle for more than 2000
deep charge/discharge cycles at 1C while retaining > 80% of its initial capacity (824 mAh
g-1) with a coulombic efficiency > 99.9%. Nanoconfined NiO was also able to support a
very high capacity of 460 mAh g-1 at 5C, a rate that is very relevant for fast-charging and
high-power applications. Also, high loading full metal oxide Li-ion cells (prelithiated NC-
NiO@CNT10/LiNi0.5Mn0.3Co0.2O2) were assembled and tested. The MO/LMO full cell
confirmed the hypothesis that confinement inhibits anode degradation (increasing the
coulombic efficiency) and the long-range conductive CNT networks helps electrons
percolate through thick, high loading electrodes (boosting material utilization). Finally,
the discovery that nanoconfinement can improve the reaction reversibility and longevity of
conversion metal oxides can likely also be applied to other conversion-based chemistries
as well (e.g. metal hydrides, nitrides, oxides, fluorides, phosphides, and sulfides. Therefore,
the findings of this work help represent one promising pathway to find a safe, high capacity,
fast-charge, and highly reversible anode that may one day enable LIBs for applications that
require high-energy density and/or high-power density and long life. One reasonable

167
question that remains from this work is the practicality of using CNTs in commercial cells,
which have historically been thought of as cost-prohibitive. There are some CNTs
available today that have lower aspect ratios and/or increased defect density that are
relatively inexpensive; these may be viable options, though the ramifications of their use
need to be further investigated. Also, it may be possible to implement lower-cost solutions
for nanoparticle confinement that are yet to be discovered.

168
CHAPTER 8: RECOMMENDATION FOR FUTURE WORK
The future for battery technology is bright, filled with opportunity, and ever-
changing. As a result, there are still many questions left unknown. Four main
recommendations are presented here. First, new batteries are being rolled out since there is
a paradigm shift towards higher energy density batteries that are extremely durable.
Batteries like the million-mile battery chemistry213 (Li(Ni0.5Mn0.3Co0.2)O2/LixC6) or
secondary Li/FeS2 are of high interest214 and the parameterization of these next-generation
Li-ion batteries can be highly beneficial from an optimization and safety standpoint. The
next recommendation takes a bigger leap beyond Li-ion batteries. In particular, Li/S
batteries have very attractive properties including very high energy densities and low cost,
but are limited by how long these systems last (i.e. poor cycle life). A detailed study on the
fundamental parameters (thermodynamics, kinetics, and transport) of Li/S batteries can
help battery researchers isolate and develop strategies to circumvent the degradative
processes inherent to sulfur and Li0 metal. The third recommendation is built on the second
and explores various ion-exchange trapping agents as a method to stop the polysulfide
shuttle problem. Finally, operando optical/spectroscopic studies are proposed as a viable
method to study the corrosion of Li0 metal and the polysulfide shuttle problem. The
inclusion of Li2S on the anode is known to drastically alter the SEI film and change the
deposition/stripping process but how does the reaction mechanism change is left unknown.

169
8.1 PARAMETERIZATION OF NEXT-GENERATION LI-ION BATTERIES
Li-ion batteries or Li-related batteries are the most promising energy storage
devices for the adoption of new technologies. Also, EVs are still in their infancy and still
require years before full maturation. The adoption of the million-mile battery chemistry213
(Li(Ni0.5Mn0.3Co0.2)O2/LixC6) in later-generation EVs will require full parameterization of
that system to aid in the predictive analytics and wide-scale distribution of the technology.
The principles in this thesis can be used for that specific cell chemistry and design. The
extracted parameters can in-turn be used in the standard P2D, SPM, or Lumped model.
Model-driven design provides invaluable information in R&D and helps researchers
develop a fundamental framework to optimize the system of interest. In the case of
batteries, near-theoretical limits to energy density, cyclability, and total performance of the
system can be targeted (i.e. as an objective) to tease out optimal operating conditions,
geometry, chemistry, etc. Also, degradative processes, and loss mechanisms (e.g. electrical
conduction, lithium diffusion, electrolyte diffusion, and charge transfer kinetics) can be
deconvoluted into fundamental principles that limit the battery. In combination with the
macroscale models (P2D, SPM, lumped), mesoscale models that apply similar physics-
based principles to real cross-sectional images of battery electrodes can prove to be
invaluable in engineering design. A similar method is currently being used for secondary
Li/FeS2 batteries in nonaqueous or polymer electrolytes (e.g. LiTFSI in DOL/DME or ionic
liquids) that have high energy density (>300 Wh/kg) and cyclability. Unlike LiCoO2 or
graphite (standard electrodes for Li-ion batteries), whose reactions are based on highly
reversible intercalation/deintercalation, FeS2 leverages a two-stage reaction mechanism
that intercalates/deintercalates (0 < x < 2 for LixFeS2) and then bond-breaks (conversion

170
reaction) in the presence of Li+ ions to form Fe0-metal and Li2S (x > 2). A two-stage
physics-based reaction mechanism (Figure 8.1) was implemented in COMSOL
Multiphysics® via an interfacial reaction of Li+|FeS2 coupled to solid-state diffusion
(intercalation reaction) and a shrinking core phase separation reaction mechanism of
LiFeS2 | Fe0 + Li2S (conversion reaction). Below contains the design equations and
simulation domain for the 3D mesoscale model.
Figure 8.1. | Illustration of the simulation domain and geometry
Ion transport in the electrolyte of an electrochemical system (i.e. a battery) is
coupled with electron conduction in the electrode domain. The electron conduction within
the FeS2 cathode particles can be modeled using charge conservation of Ohm’s law, and
expressed as,

171
∇ ⋅ 𝑖𝑠 = ∇ ⋅ (−σ𝑠∇ϕ𝑠) = 0 Equation 8.1
where 𝜎𝑠 denotes the electrical conductivity and 𝜙𝑠 represents the solid phase potential of
the particle. The material balance of species within the cathode and separator is represented
as,
𝜕(𝐶𝑖)𝑑
𝜕𝑡= −∇ ⋅ 𝑱𝒊 + 𝑹𝒊
Equation 8.2
where 𝐶𝑖 is the concentration of species i (i = Li+, TFSI-) [mol m-3] and the index d
represents the individual domain (separator, cathode, electrolyte). The intercalation of Li+
into the FeS2 particle is described by Fick’s second law of diffusion and represented as,
𝑱𝑳𝒊 = −𝐷𝐿𝑖∇𝑐𝐿𝑖 Equation 8.3
where 𝐷𝑖 is the solid-phase diffusion coefficient for lithium and 𝑐𝐿𝑖 is the concentration of
lithium in the intercalating particle. The conversion reaction of fully intercalated Li2FeS2
is converted to Fe0 and Li2S via a level-set field function that moves an interface between
the shell (Fe0/Li2S, = 1), the core phase (fully intercalated Li2FeS2, = 0), and
represented as,
𝜕
𝜕𝑡+ 𝒖 ⋅ ∇ = 𝛾∇ ⋅ (휀∇ − (1 − )
∇
|∇|)
Equation 8.4
where the 휀 parameter is proportional to the element size, 𝛾 is the reinitialization parameter
that accounts for the conversion reaction rate. The interfacial velocity of Li2FeS2 | Fe +
Li2S core-shell is calculated based on the expression below,
𝑢 = 𝑛 ⋅ (−𝑖loc
𝑛𝐹
𝑀P
𝜌P
) Equation 8.5
where 𝑖loc is the local current density, n is the number of electrons, 𝑀P is the molar mass
and 𝜌P is the density of Fe0/Li2S, and the interface normal is defined as 𝑛 =∇
|∇| . The source

172
and consumption terms are implemented into the mass balance to simultaneously produce
the Fe0/Li2S and consume the Li2FeS2 phase.
The flux term 𝑱𝒊 is expressed as the diffusion and migration term in the Nernst-
Planck expression,
𝑱𝑖,𝑚 = −𝐷𝑖,𝑚∇𝐶𝑖 − 𝑧𝑖
𝐷𝑖,𝑚
𝑅𝑇𝐹𝐶𝑖∇𝜙𝑙
Equation 8.6
where 𝐷𝑖,𝑑is the diffusion coefficient for the domain d and species i, 𝑧𝑖 is the valence state,
F is Faraday’s constant (96,485 C mol-1), R is the gas constant (8.314 J mol-1K-1), and 𝜙𝑙
is the liquid-phase potential. The reaction rate is modeled by the Butler-Volmer kinetic
expression,
𝑖 = 𝑖0 [exp (α𝑎𝐹η
𝑅𝑇) − exp (
−α𝑐𝐹η
𝑅𝑇)]
Equation 8.7
where 𝛼𝑎/𝛼𝑐 is the anodic/cathodic transfer coefficient, 𝜂 is the overpotential for the
electrochemical reaction (𝜂𝑗 = 𝜙𝑠 − 𝜙𝑙 − 𝜙𝑒𝑞), and 𝑖0 is the exchange current density and
represented as,
𝑖0,𝑖 = 𝑘𝑖𝑐𝑠,𝑚𝑎𝑥,𝑖𝑐𝑙0.5 (1 −
𝑐𝑠,𝑖|𝑟=𝑅𝑠,𝑖
𝑐𝑠,𝑚𝑎𝑥,𝑖
)
0.5
(𝑐𝑠,𝑖|𝑟=𝑅𝑠,𝑖
𝑐𝑠,𝑚𝑎𝑥,𝑖)
0.5
Equation 8.8
where 𝑘𝑖 is the reaction rate constant.
The temperature dependency of important kinetic and transport parameters was
investigated for the intercalation/conversion hybrid chemistry model. Parameters such as
diffusion coefficients, reaction rate constants, and electrical conductivity are temperature-
dependent and their values as a function of temperature can be expressed via an Arrhenius
formulation.
Ds,j(t) = Ds,j, ref exp [Ead,j
R(
1
T−
1
Tref
)] Equation 8.9

173
𝑘j(𝑡) = 𝑘j, ref exp [E𝑎r,j
𝑅(
1
𝑇−
1
𝑇ref
)] Equation 8.10
j(𝑡) = j, ref exp [E𝑎r,j
𝑅(
1
𝑇−
1
𝑇ref
)] Equation 8.11
where 𝑇ref represents the reference temperature, 𝐷s,j, ref is the solid-state diffusion
coefficient at reference state, 𝑘j is the reaction rate constant of reaction j (intercalation or
conversion), j is the electrical conductivity, and Ead,j is the activation energy of the
parameter.
Figure 8.2a shows the open circuit potential (OCP) curves (blue dots) and
charge/discharge profile (black dots) for a solid-state Li/FeS2 battery that undergoes a four-
electron transfer process. The first two electrons transferred from FeS2 to form Li2FeS2 is
an intercalation reaction (Equation 8.14) and the reaction of Li2FeS2 to Li2S and Fe0
follows a conversion-type reaction (Equation 8.15). The simulation profile shows model
fidelity to a multi-plateau and multi-reaction process. Figure 8.2b shows the particle
reaction dynamics. At 100% SOC the interfacial reaction of Li and FeS2 particles is
facilitated by the solid-state diffusion of Li into the particle which generates the
concentration gradient within the particle. Next, the Li2FeS2 undergoes a conversion
reaction at the interface to form a shrinking core type reaction mode. The process in Figure
8.2b resembles the in-operando TEM experiments of FeS2 by Yersack et al215
FeS2 + 2Li+ + 2e- ↔ Li2FeS2 Equation 8.12
Li2FeS2 + 2Li+ + 2e- ↔ 2Li2S + Fe0 Equation 8.13

174
Figure 8.2. | Prototype model of a two-particle Intercalation/Conversion (2P-I/C) hybrid
FeS2 chemistry for secondary battery purposes, where (a) represents the model simulation
for the discharge/charge reaction with multiple reaction plateaus, and (b) contains the
particle-level reaction modes and electrolyte loss.
The remaining goals of this project is to convert the prototype model into the full-
3D mesoscale model using the X-ray computed tomography of FeS2 electrodes (XCT and
3D mesoscale simulation from the previous project216 and represented in Figure 8.3). In
short, the futures tasks required in converting the prototype 2-particle model into the full
3D XCT mesoscale model includes:
1) Full implementation of hybrid chemistry (intercalation/conversion) into the 3D
XCT mesoscale model and capture snapshots of ∆𝐶𝐿𝑖/𝐶𝐿𝑖,𝑚𝑎𝑥 , 𝐿𝑖+(𝑀), 𝐼/
𝐼𝑎𝑝𝑝, ∆𝑉 (𝑉), 𝜎(𝑆 𝑐𝑚−1), 𝑣𝑜𝑛𝑀𝑖𝑠𝑒𝑠𝑆𝑡𝑟𝑒𝑠𝑠(𝐺𝑃𝑎)
2) Calculate per-particle reaction rates which are classified based on whether it is
the near binder or electrolyte surfaces for various depths of discharge
3) Re-simulate the hybrid chemistry charge/discharge curves using the 3D XCT
mesoscale model

175
4) Determine the mechanical effects due to expansion/contraction of FeS2
5) Isolate the loss mechanisms that are inherent to the FeS2 electrode design (i.e.
electrical conduction, lithium diffusion, electrolyte diffusion, and charge
transfer resistance) and at different SOC.
Figure 8.3. | Reconstruction of X-ray computed tomography (XCT) of NMC from Ebner
et al.217
8.2 LI-SULFUR BATTERIES
Lithium-sulfur (Li-S) batteries that operate based on a series of complex
dissolution/precipitation reactions benefit from a high theoretical energy density (~600
Wh/kg – which is 4x greater than standard Li-ion batteries). Also, Li-S systems exhibit
good performance under low-temperature operation and the materials are abundant, non-
toxic, low cost, and highly sustainable – which makes the system a promising future
alternative to the current Li-ion battery technologies. Several hurdles hinder wide-scale

176
adoption of Li-S batteries: 1) the complex dissolution and diffusion/migration of
polysulfides from the cathode to the anode, which causes severe active material loss and
impedance build up at the anode, and 2) the high-capacity results in large volumetric
variations and morphological degradation, which leads to interfacial instability (S/carbon,
S/binder, etc).
Li-S batteries are still under development but typically consist of a Li-metal anode
paired with a sulfur/carbon (thermodynamically stable state cyclo-S8 rings) composite
cathode. The electrolyte consists of 1M LiTFSI in 1:1 volumetric ratio of 1,3-dioxolane
(DOL) and 1,2-dimethoxyethane (DME). During discharge, the Li-metal oxidizes to
release electrons and Li+ into the electrolyte. The Li+ migrate from the cathode to react
with the sulfur. At the same time, sulfur undergoes a complex series of
dissolution/precipitation reactions. Cyclo-S8 rings solubilize during the reduction process
to produce lithium polysulfide species as depicted in Table 8.1. Typically, higher-order
chains are soluble (>S4) whereas low orders polysulfide chains are not.
Table 8.1 | Reactions in Li/S batteries
Dissolution Reactions Precipitation Reactions
𝐿𝑖 𝐿𝑖+ + 𝑒− Equation 8.14
𝑆8(𝑠) 𝑆8(𝑙) Equation 8.15
1
2𝑆8(𝑙) + 𝑒−
1
2𝑆8
2− 2𝐿𝑖+ + 𝑆82− 𝐿𝑖2𝑆8(𝑠) Equation 8.16
3
2𝑆8
2− + 𝑒− 2𝑆62− 2𝐿𝑖+ + 𝑆6
2− 𝐿𝑖2𝑆6(𝑠) Equation 817
𝑆62− + 𝑒−
3
2 𝑆4
2− 2𝐿𝑖+ + 𝑆42− 𝐿𝑖2𝑆4(𝑠) Equation 8.18
1
2 𝑆4
2− + 𝑒− 𝑆22−
2𝐿𝑖+ + 𝑆22− 𝐿𝑖2𝑆2(𝑠) Equation 8.19
1
2 𝑆2
2− + 𝑒− 𝑆2− 2𝐿𝑖+ + 𝑆2− 𝐿𝑖2𝑆 Equation 8.20

177
Experiments should be designed and performed to obtain different parameters and
provide validation data for the models. One of the most important sets of parameters is the
design parameters (e.g. thickness of electrodes, particle size, etc.), diffusion coefficients,
and exchange currents densities, which can be determined experimentally.
As with a typical coin cell assembly, a 1.76 cm2 lithium reference/counter should
be centered on the cathodic side of the case. A micropipette can be used to transfer 30 µL
of 1M LiTFSI in 1:1 volumetric ratio of 1,3-dioxolane (DOL) and 1,2-dimethoxyethane
(DME) onto the lithium reference/counter electrode. The separator should be cut to 1.96
cm2 and placed on top of the lithium foil. Another 30 µL of 1M LiTFSI in DOL/DME can
be deposited onto the separator. A gasket should be put on the outer casing to prevent short-
circuiting. The working electrode (Sulfur-graphene oxide nanocomposite) should be placed
facedown onto the electrolyte wetted separator. The spacer disk, wave washer, and cap
should be placed on top and then crimped at 750 PSI with an MTI hydraulic press.
A current-pulse relaxation method via galvanostatic/potentiostatic intermittent
titration technique (GITT/PITT) on an ARBIN battery cycler can be used to extract the
diffusion coefficient (DLi+) as a function of the state of charge (SOC) and operating
temperature. The temperature of each cell can be controlled inside a Tenney climate-
control chamber. A typical procedure can include 100 current pulses at C/10 for a
designated time that satisfies 𝑡 ≪ 𝐿2/𝐷, followed by a relaxation period (i.e. no current)
that lasts until electrochemical equilibrium. In accordance with Fickian diffusion, the
diffusion coefficient can be extracted from the equation50:
𝐷 =4
𝜋⋅ (
𝑖𝑉𝑀
𝑆 ⋅ 𝐹 ⋅ 𝑛)
2
⋅ [(𝑑𝐸
𝑑𝛿) / (
𝑑𝐸
𝑑√𝑡)]
2
Equation 8.21

178
where VM is the molar volume (cm3/mol), i is the pulsing current (A), S is the
electrochemically active surface area (cm2), F is Faraday’s constant (96485 C/mol), n
represents the charge number, 𝛿 is the titration step, and t is the pulse time duration (s).
The steady-state potential response during the relaxation period of the GITT/PITT
protocol can also reveal the open circuit potentials (OCP) of the electrodes. In addition to
DLi+ and the OCP, the exchange current density and the reaction rate constant can also be
extracted at low overpotentials via the Taylor series expansion of the Butler-Volmer (BV)
equation to the Linearized form of the BV equation,
𝑖 = 𝑖𝑜
(𝛼𝑎 + 𝛼𝑐)𝐹
𝑅𝑇𝜂𝑠
Equation 8.22
where (𝛼𝑎 + 𝛼𝑐) is the anodic and cathodic transfer coefficient, R is the ideal gas constant,
T is temperature, and 𝜂𝑠 is the overpotential. In addition to the diffusion coefficient and
exchange current density, the reaction rate constant can also be measured at various states
of charge following the equation below,
𝑘𝑆 =𝑒0𝑆
𝐹𝑐𝑠𝑚𝑎𝑥𝑐𝑒
0.5(1 − 𝜃𝑠𝑢𝑟𝑓)0.5
𝜃𝑠𝑢𝑟𝑓0.5
Equation 8.23
in which csmax is the maximum Li solid-phase concentration (mol/m3), ce is the electrolyte
concentration, 𝜃𝑠𝑢𝑟𝑓 is cs(r=R)/csmax. The electrochemical properties of different
polysulfides are convoluted but are important parameters to develop a high-fidelity model.
In order to extract the diffusion coefficient, exchange current density, and reaction rate
constant, a binary solution at various concentrations should be procured. The samples
should contain stoichiometric amounts of lithium, sulfur, and LiTFSI. The mixture should
be rigorously stirred for 4 days via magnetic agitation and the procedure should create a

179
binary electrolyte containing LiTFSI and Li2Sn (n = 6, 4) in DOL/DME. The fundamental
diffusion coefficient can be realized by the equation below for ternary electrolytes,
𝒟𝒾𝒿0 =
𝐹2
𝜅∑ ∑
𝑧𝑘𝑧𝑤
𝑔𝑖−1,2𝜃𝑗−1,𝑎(𝑙𝑖𝑗
0 𝑙𝑘𝑤0 − 𝑙𝑖𝑛
0 𝑙𝑘𝑗0 )
3
𝑤=1
3
𝑘=1
, 𝑖, 𝑗 = 2,3
Equation 8.24
where 𝜅 = 𝐹2 ∑ ∑ 𝑧𝑘𝑧𝑤𝑙𝑘𝑤03
𝑤=13𝑘=1 , 𝑙𝑖𝑗
0 is the fundamental transport coefficients for
irreversible processes, 𝑔𝑖−1,2 is the stoichiometries of the ions, and z is the charge number.
Additional electrode properties can be extracted from several methods including
scanning electron microscopy (SEM), mercury intrusion porosimetry (MIP), and Brunauer
Emmett Teller (BET). The particle size can be collected from a statistical distribution of
multiple SEM images at different locations (sample size = 100) for the sulfur/graphene
nanocomposite cathode. The microscopy can be performed on a field emission scanning
electron microscope (Zeiss Ultraplus field emission SEM) that is equipped with energy-
dispersive X-ray spectroscopy (Oxford Instruments). Pre-/post-mortem SEM analysis can
be done at different cycles to provide a temporal view of the morphological changes in the
particle and mesostructural changes of the electrode. Sulfur-based conversion reactions
coupled with dissolution effects can drastically change over time.
In addition, porosity, pore size distributions, and pore volume measurements can
be evaluated from mercury intrusion porosimetry (MIP). In a typical procedure, the
mercury penetrometer is filled with electrode materials with passivated current collectors
(prevent amalgamation effects) and sealed. The porosimeter utilizes a pressure vessel to
incrementally step the pressure such that mercury can fill the pore spaces of the porous
electrode. The Washburn Equation can be used to relate the incremental pressure to extract
a pore size distribution. The surface area can be extracted from the nitrogen (N2) adsorption

180
Brunauer Emmett Teller (BET) method. Applied principles of gas adsorption can be
applied on pre-/post-cycled electrodes to determine the dynamics of surface area due to
sulfur-conversion. In a typical procedure, the sample is immersed into a bath of liquid
nitrogen followed by injection of nitrogen gas at a given partial pressure. The relationship
between the amount of gas required to reach a designated partial pressure is related to the
amount of monolayer adsorption of gases to the substrate. In other words, more surface
area translates to more gas required to reach the designated partial pressure.
The electrochemical performance of a Li/S cell (formula: 50wt%-Sulfur, 40wt%-
Carbon, 10wt%-PVDF) based on 1M LiTFSI in DOL/DME is presented in Figure 8.4. The
high carbon content is designed to alleviate the low electronic conductivity (5 x 10-14 S m-
1) and provide additional surface area/void space for the precipitation of lithium
polysulfides. Since conductive carbon hardly stores charge at this voltage window (1V –
3V), the majority of the charge/discharge capacity performance is attributed to sulfur itself
and nears the theoretical capacity. However, the coulombic efficiency which reflects the
amount of charge extracted vs. the amount of charge applied is relatively low (80% to
90%). The low coulombic efficiency indicates partial loss of active material during the
charge/discharge process.
In general, Li-S batteries are widely touted as the next-generation Li-based
chemistry. Researchers that can carve up a piece of this topic either in modeling (e.g. P2D,
3D-mesoscale, machine learning) or in advanced material design for ultra-stable
performance (i.e. capacity retention, coulombic efficiency, energy density) can reap the
benefit for years to come.

181
Figure 8.4. | Next-generation conversion electrodes based on energy-dense Li-Sulfur
technologies where (a) is the cycle performance plot, and (b) shows the charge-discharge
profile
8.3 IMPLEMENTING AN ION-EXCHANGE TRAPPING AGENT TO STOP THE
POLYSULFIDE DEGRADATION PROCESS
As discussed above, several challenges hinder the practical deployment of Li-S
based batteries.218 Below are the main detrimental factors of ‘sulfur cathodes’:

182
(1) Polysulfide shuttle effect – The higher-order lithium polysulfide species readily
dissolve into the electrolyte, resulting in a continual active material loss to the
electrolyte. During this process, the solubilized polysulfides can transport from
the cathode through the electrolyte to the anode and then partially undergo a
return trip. During the transport process, the solubilized polysulfides that
interact with the Li anode can become reduced to shorter chain Li2S2 or Li2S.
The precipitation of Li2S2 or Li2S on the anode is trapped and results in severe
active material loss. On a cell-level, the polysulfide shuttle effect results in poor
coulombic efficiency and rapid performance loss.
(2) Poor utilization of Sulfur – The low electronic conductivity of cyclo-S8 (~ 5 x
10-14 S m-1) results in poor utilization of the active material. This effect is
exacerbated during the precipitation event of Li2S4 to Li2S2 and Li2S as well.
The deposition increases the impedance and results in poor reaction kinetics,
high polarization, poor sulfur utilization, and low-rate performance.
(3) Catastrophic change in the cathode structure – The repetitive
dissolution/precipitation event during discharge/charge results in severe
mesostructural changes. First, the density of cyclo-S8 vs. the end-form Li2S is
very different (2.03 vs. 1.66 g cm-3),218 resulting in hydrostatic stress from the
volumetric expansion/contraction. The precipitation event is not well-
controlled in these systems and results in a very transient and unstable cathode
structure.
One method to circumvent the degradative processes of sulfur is to control the
effects of the polysulfide shuttle. Pham et al.219 utilized a cationic polymer, poly[2,2’ -

183
(2,2’’,4,4’’’,6,6’’-hexamethyl-p-terphenyl-3,3’’-diyl)-5,5’ -bibenzimidazolium iodide]
(HMT-PMBI(I)), to preferentially increase the residence of polysulfides at the cathode.
The HMT-PMBI(I) serves as a binder and the active benzimidazolium cation couples with
polysulfides, which prevents polysulfides from escaping the cathode. The HMT-PMBI(I)
binder enabled >440 cycles at a loading of 3-4 mg cm-2 with an electrolyte/sulfur (E/S)
ratio of 6 L mgs-1.
A similar principle can be applied with ionomers based on highly tunable
poly(norbornene) tetrablock copolymers in the form of homopolymers, block copolymers,
or random copolymers with high ion-exchange capacities (Figure 8.5). Various cross-
linking of the polymer can be tested to explore the effects of the electrolyte uptake vs
mechanical properties, effects on polysulfide shuttle, and impacts on reaction kinetics. The
poly(norbornene) polymer at various cross-linkings was tested as a potential candidate for
regulating the polysulfide shuttle effect. The sulfur electrode formula was based on 50wt%-
Sulfur, 38wt%-Carbon, 2wt% active ionomer, and10wt%-PVDF. At small quantities of
ionomer, the gravimetric capacity of sulfur is relatively low (~700-900 mAh g-1), but shows
characteristics of typical sulfur charge-discharge profiles. By comparison, the S8 → Li2S8
reactions for both GT-32 and GT-72 are well-defined but GT-72 displays a narrower gap
between subsequent cycles, whereas GT-32 has a sparser distribution for the first plateau
(i.e. potential direction). The transition from Li2S8 to Li2S6 shows negligible change but
GT-72 does spread more in the gravimetric capacity direction. The conversion from Li2S4
to Li2S2 primary region is captured in Figure 8.6(a,b) by an extended reaction plateau at
~2.15V.
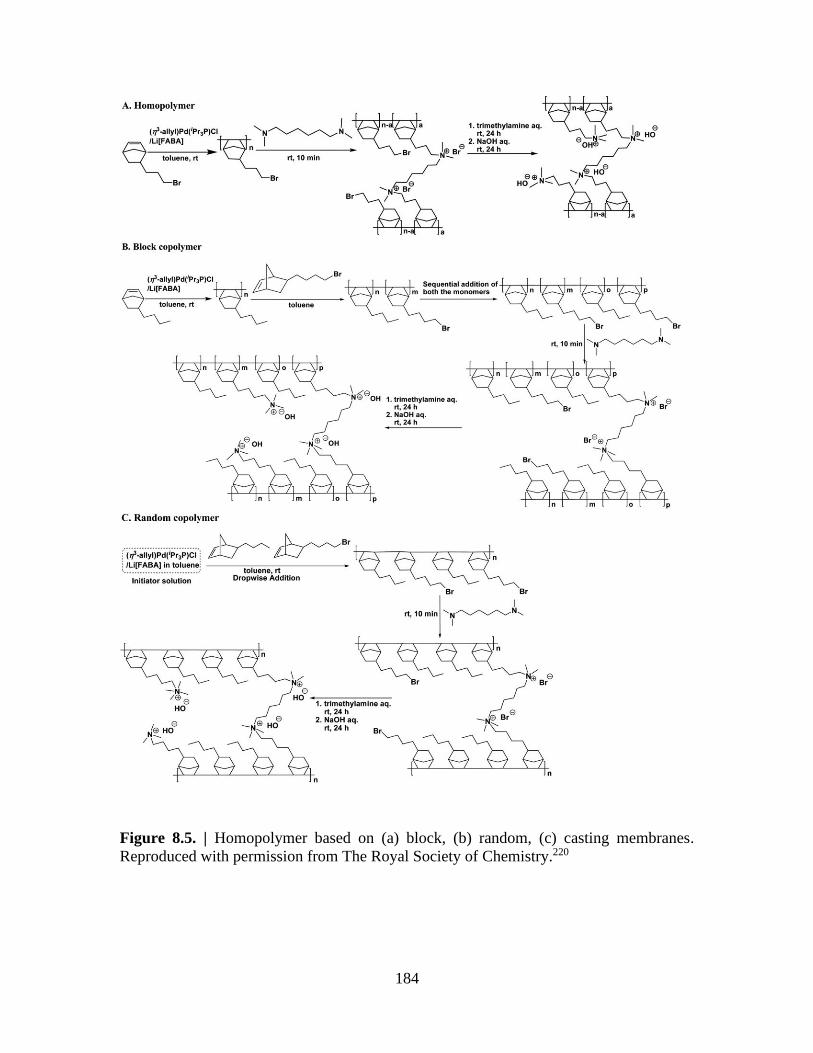
184
Figure 8.5. | Homopolymer based on (a) block, (b) random, (c) casting membranes.
Reproduced with permission from The Royal Society of Chemistry.220
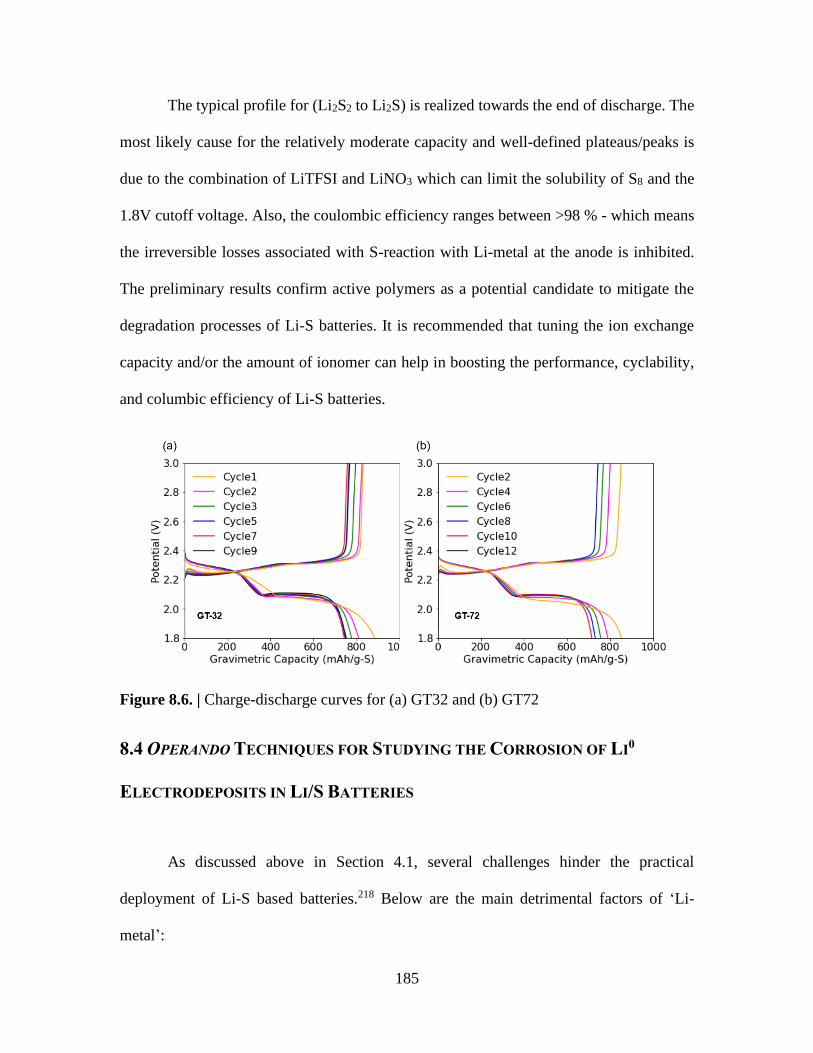
185
The typical profile for (Li2S2 to Li2S) is realized towards the end of discharge. The
most likely cause for the relatively moderate capacity and well-defined plateaus/peaks is
due to the combination of LiTFSI and LiNO3 which can limit the solubility of S8 and the
1.8V cutoff voltage. Also, the coulombic efficiency ranges between >98 % - which means
the irreversible losses associated with S-reaction with Li-metal at the anode is inhibited.
The preliminary results confirm active polymers as a potential candidate to mitigate the
degradation processes of Li-S batteries. It is recommended that tuning the ion exchange
capacity and/or the amount of ionomer can help in boosting the performance, cyclability,
and columbic efficiency of Li-S batteries.
Figure 8.6. | Charge-discharge curves for (a) GT32 and (b) GT72
8.4 OPERANDO TECHNIQUES FOR STUDYING THE CORROSION OF LI0
ELECTRODEPOSITS IN LI/S BATTERIES
As discussed above in Section 4.1, several challenges hinder the practical
deployment of Li-S based batteries.218 Below are the main detrimental factors of ‘Li-
metal’:

186
(1) Poor coulombic efficiency – Lithium metal as an anode is well-known to undergo
severe irreversible losses due to the corrosion of high surface area Li0
electrodeposits during post-charging processes (i.e. storage). Electron loss from the
Li-metal facilitates the reduction of the electrolyte to form additional passivation at
the Li-metal/electrolyte interface. The increase in SEI film thickness will cause
resistance to build-up in the cell. Also, the Li-metal is known to form arborescent
tree-like formations and drastic volumetric expansion that can fracture the
passivating film, which leads to continual electrolyte consumption at the exposed
reactive sites. The loss in active material during charge/discharge results in poor
coulombic efficiency.
(2) Safety issues - Lithium dendrites are a well-known safety hazard as previously
discussed in the early chapters of this thesis. The dendrites can result in internal
short circuits that lead to rapid discharge and generation of significant heat,
resulting in thermal runaway.
(3) Low lithium utilization – After repetitive charge/discharge, the Li0 electrodeposits
can break off from the bulk electrode and become electronically insulated. The loss
in contact results in loss of active material.
(4) Severe polarization – The anisotropic deposition/dissolution of Li-metal (porosity,
different locations/structures) leads to regions with longer diffusion pathways.
Also, the SEI continual build-up after each cycle leads to increased resistance.
Extreme operating conditions (i.e. fluctuating temperatures, current, and depth-of-
discharge) and alterations in the battery chemistry (i.e. additives, fluorination,
electrolyte, anodes, cathodes) can result in highly unpredictable degradation

187
processes (i.e. capacity loss, rapid cell death, and thermal runaway). It is important
to understand the effects of temperature on the growth of Li metal and interaction
with polysulfides in Li-S batteries. During a previous project, my research group
discovered that a graphite/NMC532 (LiC6/LiNi0.5Mn0.3Co0.2O2) cell, which was
cycled at low temperatures (-29 ⁰C) then brought back to room temperature,
experienced two disastrous events: one cell vented gases after cycling at room
temperature and the other one went into a thermal runaway after room temperature
storage (at open circuit voltage).
During post-mortem analysis, a high spatial dependency of degradation processes
on both the cathode and anode for a large Li-ion cell was discovered. Extreme conditions
was found to exacerbate highly stressed regions (e.g. region of high curvature, edges) and
discovered a unique ripple-type current distribution for large format jellyroll-type
electrodes. The ripple-type gradients were realized by enhanced optically filtered imaging
of post-mortem electrodes that were salvaged from compromised cells. Multiple-location
liquid N2 Raman Spectroscopy confirmed a preferential Li0 residence at ripple-peaks and
absent at ripple-troughs. The root cause derives from severe electrochemical polarization
and thermal gradients generated during charge/discharge, which caused drastic electrode
warping and non-uniform Li+ flux from complex current gradients. Toward the edge of the
electrode, alternating positive-then-negative striation lines were observed, which
correspond to alternating high-then-low Li0 electrodeposition. Stress-buildup at specific
electrode regions can lead to highly vulnerable sites where an internal short circuit can
occur.

188
Li0 plating is a known hazard that can trigger catastrophic thermal runaway and
result in continuous propagation to neighboring cells.221 Li0 plating occurs on a nucleation
site (most notably a Li0 seed or other mixable materials that can be determined by Pourbaix
Diagrams) and crystallizes in various formations depending on the material and operating
condition. In rare cases, uniform single layer electrodeposition can occur, but other higher-
order growth patterns can form. This phenomenon depends on many factors including the
uniformity of the electrodeposition surface (i.e. anisotropy/isotropy of facet orientation,
peaks, and valleys, etc.) and whether the system is diffusion-limited. When the distribution
of nucleation seeds is not uniform, display high anisotropy in facet orientation, and is
diffusion-limited, the Li0 electrodeposition process favors arborescent tree-like formations
known as Li0 dendrites.135 Dendrites have a high surface area and display high reactivity,
which increases the number of reaction-zones where electrolyte reduction can occur.
Electrolyte reduction (e.g. decomposition of ethylene carbonate, ethyl methyl carbonate,
dimethyl carbonate, lithium hexafluorophosphate) can result in severe gas evolution and
formation of a partially soluble and partially insoluble film on the surface of the active
material. The film, also known as the solid-electrolyte interphase (SEI) acts as a barrier
that increases the internal resistance of the cell by slowing down the mass transfer of Li+
ions that facilitate the redox reaction. SEI formation accelerates performance loss in Li-ion
batteries and gassing significantly decreases the safety of the battery. Gasses such as CO,
H2, O2, C2H4, C2H6, POF3, and entrained-HF123 can be released by a minor breach in the
casing (either through compromised vents or punctures). The majority of the gasses
released are flammable or toxic which pose safety concerns and exacerbate thermal
runaway events.

189
For experimental work, it would be beneficial to the scientific community if further
investigation of the degradative processes in Li-S batteries is done. Questions such as, what
is the temperature-dependence of Li0 electrodeposition growth and interaction with
polysulfides? What is the surface area and temperature trend for Li0 electrodeposits? How
do polysulfides impact the surface area, resistance build-up, and porosity? What happens
to Li0 under no reductive current and storage? What is the corrosion rate? What gasses are
evolved from high surface area Li0 during storage? Do the gases facilitate other reactions?
In answering these questions, the potential adoption of Li-S technology into various
applications can be evaluated.

190
REFERENCES
1. Gür, T. M. Review of electrical energy storage technologies, materials and systems:
Challenges and prospects for large-scale grid storage. Energy Environ. Sci. 11,
2696–2767 (2018).
2. Hannan, M. A., Lipu, M. S. H., Ker, P. J., Begum, R. A., Agelidis, V. G. &
Blaabjerg, F. Power electronics contribution to renewable energy conversion
addressing emission reduction: Applications, issues, and recommendations. Appl.
Energy 251, 113404 (2019).
3. Zhang, H., Zhao, H., Khan, M. A., Zou, W., Xu, J., Zhang, L. & Zhang, J. Recent
progress in advanced electrode materials, separators and electrolytes for lithium
batteries. J. Mater. Chem. A 6, 20564–20620 (2018).
4. Zhu, G. L., Zhao, C. Z., Huang, J. Q., He, C., Zhang, J., Chen, S., Xu, L., Yuan, H.
& Zhang, Q. Fast Charging Lithium Batteries: Recent Progress and Future
Prospects. Small 15, 1–14 (2019).
5. Lin, X., Salari, M., Arava, L. M. R., Ajayan, P. M. & Grinstaff, M. W. High
temperature electrical energy storage: Advances, challenges, and frontiers. Chem.
Soc. Rev. 45, 5848–5887 (2016).
6. Nitta, N., Wu, F., Lee, J. T. & Yushin, G. Li-ion battery materials: Present and
future. Mater. Today 18, 252–264 (2015).
7. Hu, C., Ye, H., Jain, G. & Schmidt, C. Remaining useful life assessment of lithium-
ion batteries in implantable medical devices. J. Power Sources 375, 118–130 (2018).
8. Schmidt, C. L. & Skarstad, P. M. The future of lithium and lithium-ion batteries in
implantable medical devices. J. Power Sources 97–98, 742–746 (2001).
9. Rajaeifar, M. A., Tabatabaei, M., Aghbashlo, M., Nizami, A. S. & Heidrich, O.
Emissions from urban bus fleets running on biodiesel blends under real-world
operating conditions: Implications for designing future case studies. Renew. Sustain.
Energy Rev. 111, 276–292 (2019).
10. USABC. USABC Goals for Advanced High-Performance Batteries for Electric
Vehicle (EV) Applications. (2019).
11. Gao, J., Shi, S. Q. & Li, H. Brief overview of electrochemical potential in lithium
ion batteries. Chinese Phys. B 25, 1–27 (2015).

191
12. Wu, X., Song, K., Zhang, X., Hu, N., Li, L., Li, W., Zhang, L. & Zhang, H. Safety
Issues in Lithium Ion Batteries: Materials and Cell Design. Front. Energy Res. 7, 1–
17 (2019).
13. Faegh, E., Ng, B., Hayman, D. & Mustain, W. E. Practical assessment of the
performance of aluminium battery technologies. Nat. Energy (2020).
doi:10.1038/s41560-020-00728-y
14. Wu, F. & Yushin, G. Conversion cathodes for rechargeable lithium and lithium-ion
batteries. Energy Environ. Sci. 10, 435–459 (2017).
15. Thackeray, M. M., Wolverton, C. & Isaacs, E. D. Electrical energy storage for
transportation—approaching the limits of, and going beyond, lithium-ion batteries.
Energy Environ. Sci. 5, 7854 (2012).
16. Ping, P., Wang, Q. S., Huang, P. F., Li, K., Sun, J. H., Kong, D. P. & Chen, C. H.
Study of the fire behavior of high-energy lithium-ion batteries with full-scale
burning test. J. Power Sources 285, 80–89 (2015).
17. Qi, Y., Guo, H., Hector, L. G. & Timmons, A. Threefold Increase in the Young ’ s
Modulus of Graphite Negative Electrode during Lithium Intercalation Threefold
Increase in the Young ’ s Modulus of Graphite Negative Electrode during Lithium
Intercalation. J. Electrochem. Soc. 157, A558–A566 (2010).
18. Radin, M. D., Hy, S., Sina, M., Fang, C., Liu, H., Vinckeviciute, J., Zhang, M.,
Whittingham, M. S., Meng, Y. S. & Van der Ven, A. Narrowing the Gap between
Theoretical and Practical Capacities in Li-Ion Layered Oxide Cathode Materials.
Adv. Energy Mater. 7, 1–33 (2017).
19. Aurbach, D., Markovsky, B., Weissman, I., Levi, E. & Ein-Eli, Y. On the correlation
between surface chemistry and performance of graphite negative electrodes for Li
ion batteries. Electrochim. Acta 45, 67–86 (1999).
20. Peled, E. & Menkin, S. Review—SEI: Past, Present and Future. J. Electrochem. Soc.
164, A1703–A1719 (2017).
21. Wang, A., Kadam, S., Li, H., Shi, S. & Qi, Y. Review on modeling of the anode
solid electrolyte interphase (SEI) for lithium-ion batteries. npj Comput. Mater. 4,
(2018).
22. An, S. J., Li, J., Daniel, C., Mohanty, D., Nagpure, S. & Wood, D. L. The state of
understanding of the lithium-ion-battery graphite solid electrolyte interphase (SEI)
and its relationship to formation cycling. Carbon N. Y. 105, 52–76 (2016).
23. Rodrigues, M.-T. F., Babu, G., Gullapalli, H., Kalaga, K., Sayed, F. N., Kato, K.,
Joyner, J. & Ajayan, P. M. A materials perspective on Li-ion batteries at extreme
temperatures. Nat. Energy 2, 17108 (2017).
24. Chen, S., Dai, F. & Cai, M. Opportunities and Challenges of High-Energy Lithium
Metal Batteries for Electric Vehicle Applications. ACS Energy Lett. 5, 3140–3151
(2020).

192
25. Rodrigues, M.-T. F., Kalaga, K., Trask, S. E., Dees, D. W., Shkrob, I. A. &
Abraham, D. P. Fast Charging of Li-Ion Cells: Part I. Using Li/Cu Reference
Electrodes to Probe Individual Electrode Potentials. J. Electrochem. Soc. 166,
A996–A1003 (2019).
26. Petzl, M. & Danzer, M. A. Nondestructive detection, characterization, and
quantification of lithium plating in commercial lithium-ion batteries. J. Power
Sources 254, 80–87 (2014).
27. Fan, J. & Tan, S. Studies on Charging Lithium-Ion Cells at Low Temperatures. J.
Electrochem. Soc. 153, A1081 (2006).
28. Anseán, D., Dubarry, M., Devie, A., Liaw, B. Y., García, V. M., Viera, J. C. &
González, M. Operando lithium plating quantification and early detection of a
commercial LiFePO4 cell cycled under dynamic driving schedule. J. Power Sources
356, 36–46 (2017).
29. Ng, B., Coman, P. T., Faegh, E., Peng, X., Karakalos, S. G., Jin, X., Mustain, W. E.
& White, R. E. Low-Temperature Lithium Plating/Corrosion Hazard in Lithium-Ion
Batteries: Electrode Rippling, Variable States of Charge, and Thermal and
Nonthermal Runaway. ACS Appl. Energy Mater. 3, 3653–3664 (2020).
30. Spinner, N., Zhang, L. & Mustain, W. E. Investigation of metal oxide anode
degradation in lithium-ion batteries via identical-location TEM. J. Mater. Chem. A
2, 1627–1630 (2014).
31. Amatucci, G. G. Stabilized iron fluoride cathodes. Nat. Mater. 18, 1275–1276
(2019).
32. Cao, K., Jin, T., Yang, L. & Jiao, L. Recent progress in conversion reaction metal
oxide anodes for Li-ion batteries. Mater. Chem. Front. 1, 2213–2242 (2017).
33. Spinner, N. S., Palmieri, A., Beauregard, N., Zhang, L., Campanella, J. & Mustain,
W. E. Influence of conductivity on the capacity retention of NiO anodes in Li-ion
batteries. J. Power Sources 276, 46–53 (2015).
34. Palmieri, A., Spinner, N., Zhao, S. & Mustain, W. E. Explaining the role and
mechanism of carbon matrices in enhancing reaction reversibility of metal oxide
anodes for high performance Li ion batteries. Carbon N. Y. 130, 515–524 (2018).
35. Jow, T. R., Delp, S. A., Allen, J. L., Jones, J.-P. & Smart, M. C. Factors Limiting
Li + Charge Transfer Kinetics in Li-Ion Batteries . J. Electrochem. Soc. 165, A361–
A367 (2018).
36. Soto, F. A., Marzouk, A., El-Mellouhi, F. & Balbuena, P. B. Understanding Ionic
Diffusion through SEI Components for Lithium-Ion and Sodium-Ion Batteries:
Insights from First-Principles Calculations. Chem. Mater. 30, 3315–3322 (2018).
37. Ng, B., Peng, X., Faegh, E. & Mustain, W. E. Using nanoconfinement to inhibit the
degradation pathways of conversion-metal oxide anodes for highly stable fast-
charging Li-ion batteries. J. Mater. Chem. A 8, 2712–2727 (2020).

193
38. Soto, F. A., Marzouk, A., El-Mellouhi, F. & Balbuena, P. B. Understanding Ionic
Diffusion through SEI Components for Lithium-Ion and Sodium-Ion Batteries:
Insights from First-Principles Calculations. Chem. Mater. 30, 3315–3322 (2018).
39. Chorkendorff, I. & & Niemantsverdriet, J. W. Concepts of Modern Catalysis and
Kinetics. Weinheim: Wiley-VCH (2003).
40. Spinner, N., Zhang, L. & Mustain, W. E. Investigation of metal oxide anode
degradation in lithium-ion batteries via identical-location TEM. J. Mater. Chem. A
2, 1627–1630 (2014).
41. Palmieri, A., Yazdani, S., Kashfi-Sadabad, R., Karakalos, S. G., Pettes, M. T. &
Mustain, W. E. Cobalt Doping as a Pathway to Stabilize the Solid-State Conversion
Chemistry of Manganese Oxide Anodes in Li-Ion Batteries. J. Phys. Chem. C 122,
7120–7127 (2018).
42. Palmieri, A., Yazdani, S., Kashfi-Sadabad, R., Karakalos, S. G., Ng, B., Oliveira,
A., Peng, X., Pettes, M. T. & Mustain, W. E. Improved Capacity Retention of Metal
Oxide Anodes in Li-Ion Batteries: Increasing Intraparticle Electronic Conductivity
through Na Inclusion in Mn3O4. ChemElectroChem 5, 2059–2063 (2018).
43. Su, Q., Dong, Z., Zhang, J., Du, G. & Xu, B. Visualizing the electrochemical
reaction of ZnO nanoparticles with lithium by in situ TEM: Two reaction modes are
revealed. Nanotechnology 24, (2013).
44. Li, L., Jacobs, R., Gao, P., Gan, L., Wang, F., Morgan, D. & Jin, S. Origins of Large
Voltage Hysteresis in High-Energy-Density Metal Fluoride Lithium-Ion Battery
Conversion Electrodes. J. Am. Chem. Soc. 138, 2838–2848 (2016).
45. Palmieri, A., Yazdani, S., Kashfi-Sadabad, R., Karakalos, S. G., Ng, B., Oliveira,
A., Peng, X., Pettes, M. T. & Mustain, W. E. Improved Capacity Retention of Metal
Oxide Anodes in Li-Ion Batteries: Increasing Intraparticle Electronic Conductivity
through Na Inclusion in Mn3O4. ChemElectroChem 5, 2059–2063 (2018).
46. Durmus, Z., Baykal, A., Kavas, H. & Szeri, H. Preparation and characterization of
polyaniline (PANI)Mn3O 4 nanocomposite. Phys. B Condens. Matter 406, 1114–
1120 (2011).
47. Bazant, M. Z. Theory of chemical kinetics and charge transfer based on
nonequilibrium thermodynamics. Acc. Chem. Res. 46, 1144–1160 (2013).
48. Nalewajski, R. F. & Parr, R. G. Legendre transforms and Maxwell relations in
density functional theory. J. Chem. Phys. 77, 399–407 (1982).
49. Ferguson, T. R. & Bazant, M. Z. Nonequilibrium Thermodynamics of Porous
Electrodes. J. Electrochem. Soc. 159, A1967–A1985 (2012).
50. Verma, A., Smith, K., Santhanagopalan, S., Abraham, D., Yao, K. P. & Mukherjee,
P. P. Galvanostatic Intermittent Titration and Performance Based Analysis of LiNi
0.5 Co 0.2 Mn 0.3 O 2 Cathode . J. Electrochem. Soc. 164, A3380–A3392 (2017).

194
51. Dalaker, H. Thermodynamic computations of the interaction coefficients between
boron and phosphorus and common impurity elements in liquid silicon. Comput.
Methods Mater. Sci. 13, 407–411 (2013).
52. Fuller, T. F. & Newman, J. Relaxation Phenomena in Lithium-ion-Insertion Cells.
J. Electrochem. Soc. 141, 855 (1994).
53. Doyle, M., Newman, J., Gozdz, A. S., Schmutz, C. N. & Tarascon, J. Comparison
of Modeling Predictions with Experimental Data from Plastic Lithium Ion Cells. J.
Electrochem. Soc. 143, 1890–1903 (1996).
54. Li, J., Adewuyi, K., Lotfi, N., Landers, R. G. & Park, J. A single particle model with
chemical/mechanical degradation physics for lithium ion battery State of Health
(SOH) estimation. Appl. Energy 212, 1178–1190 (2018).
55. Tippmann, S., Walper, D., Balboa, L., Spier, B. & Bessler, W. G. Low-temperature
charging of lithium-ion cells part I: Electrochemical modeling and experimental
investigation of degradation behavior. J. Power Sources 252, 305–316 (2014).
56. Prada, E., Di Domenico, D., Creff, Y., Bernard, J., Sauvant-Moynot, V. & Huet, F.
A Simplified Electrochemical and Thermal Aging Model of LiFePO 4 -Graphite Li-
ion Batteries: Power and Capacity Fade Simulations . J. Electrochem. Soc. 160,
A616–A628 (2013).
57. Xu, M., Zhang, Z., Wang, X., Jia, L. & Yang, L. Two-dimensional electrochemical-
thermal coupled modeling of cylindrical LiFePO4 batteries. J. Power Sources 256,
233–243 (2014).
58. Saw, L. H., Ye, Y. & Tay, A. A. O. Electrochemical-thermal analysis of 18650
Lithium Iron Phosphate cell. Energy Convers. Manag. 75, 162–174 (2013).
59. Ye, Y., Shi, Y. & Tay, A. A. O. Electro-thermal cycle life model for lithium iron
phosphate battery. J. Power Sources 217, 509–518 (2012).
60. Capron, O., Samba, A., Omar, N., Van Den Bossche, P. & Van Mierlo, J. Thermal
behaviour investigation of a large and high power lithium iron phosphate cylindrical
cell. Energies 8, 10017–10042 (2015).
61. Tripathi, A. M., Su, W. N. & Hwang, B. J. In situ analytical techniques for battery
interface analysis. Chem. Soc. Rev. 47, 736–751 (2018).
62. Zhu, J., Knapp, M., Darma, M. S. D., Fang, Q., Wang, X., Dai, H., Wei, X. &
Ehrenberg, H. An improved electro-thermal battery model complemented by current
dependent parameters for vehicular low temperature application. Appl. Energy 248,
149–161 (2019).
63. Cui, S., Wei, Y., Liu, T., Deng, W., Hu, Z., Su, Y., Li, H., Li, M., Guo, H., Duan,
Y., Wang, W., Rao, M., Zheng, J., Wang, X. & Pan, F. Optimized Temperature
Effect of Li-Ion Diffusion with Layer Distance in Li(NixMnyCoz)O2 Cathode
Materials for High Performance Li-Ion Battery. Adv. Energy Mater. 6, 1501309
(2016).

195
64. Guo, M., Jin, X. & White, R. E. Nonlinear State-Variable Method for Solving
Physics-Based Li-Ion Cell Model with High-Frequency Inputs. J. Electrochem. Soc.
164, E3001–E3015 (2017).
65. Wang, C. Y., Gu, W. B. & Liaw, B. Y. Micro‐Macroscopic Coupled Modeling of
Batteries and Fuel Cells: I. Model Development. J. Electrochem. Soc. 145, 3407–
3417 (1998).
66. Subramanian, V. R., Diwakar, V. D. & Tapriyal, D. Efficient Macro-Micro Scale
Coupled Modeling of Batteries. J. Electrochem. Soc. 152, A2002 (2005).
67. Guo, M., Jin, X. & White, R. E. An Adaptive Reduced-Order-Modeling Approach
for Simulating Real-Time Performances of Li-Ion Battery Systems. J. Electrochem.
Soc. 164, A3602–A3613 (2017).
68. Tran, N. T., Vilathgamuwa, M., Farrell, T., Choi, S. S., Li, Y. & Teague, J. A Padé
Approximate Model of Lithium Ion Batteries. J. Electrochem. Soc. 165, A1409–
A1421 (2018).
69. Cai, L. & White, R. E. Reduction of Model Order Based on Proper Orthogonal
Decomposition for Lithium-Ion Battery Simulations. J. Electrochem. Soc. 156,
A154 (2009).
70. Forman, J. C., Bashash, S., Stein, J. L. & Fathy, H. K. Reduction of an
Electrochemistry-Based Li-Ion Battery Model via Quasi-Linearization and Padé
Approximation. J. Electrochem. Soc. 158, A93 (2011).
71. Guo, M., Sikha, G. & White, R. E. Single-Particle Model for a Lithium-Ion Cell:
Thermal Behavior. J. Electrochem. Soc. 158, A122 (2011).
72. Schmalstieg, J., Rahe, C., Ecker, M. & Sauer, D. U. Full Cell Parameterization of a
High-Power Lithium-Ion Battery for a Physico-Chemical Model: Part I. Physical
and Electrochemical Parameters. J. Electrochem. Soc. 165, A3799–A3810 (2018).
73. Schmalstieg, J. & Sauer, D. U. Full Cell Parameterization of a High-Power Lithium-
Ion Battery for a Physico-Chemical Model: Part II. Thermal Parameters and
Validation. J. Electrochem. Soc. 165, A3811–A3819 (2018).
74. Ekström, H., Fridholm, B. & Lindbergh, G. Comparison of lumped diffusion models
for voltage prediction of a lithium-ion battery cell during dynamic loads. J. Power
Sources 402, 296–300 (2018).
75. Jiang, J., Shi, W., Zheng, J., Zuo, P., Xiao, J., Chen, X., Xu, W. & Zhang, J.-G.
Optimized Operating Range for Large-Format LiFePO 4 /Graphite Batteries . J.
Electrochem. Soc. 161, A336–A341 (2014).
76. Viswanathan, V. V., Choi, D., Wang, D., Xu, W., Towne, S., Williford, R. E.,
Zhang, J. G., Liu, J. & Yang, Z. Effect of entropy change of lithium intercalation in
cathodes and anodes on Li-ion battery thermal management. J. Power Sources 195,
3720–3729 (2010).

196
77. Burns, J. C., Kassam, A., Sinha, N. N., Downie, L. E., Solnickova, L., Way, B. M.
& Dahn, J. R. Predicting and Extending the Lifetime of Li-Ion Batteries. J.
Electrochem. Soc. 160, A1451–A1456 (2013).
78. Ng, B., Coman, P. T., Mustain, W. E. & White, R. E. Non-destructive parameter
extraction for a reduced order lumped electrochemical-thermal model for simulating
Li-ion full-cells. J. Power Sources 445, 227296 (2020).
79. Campbell, I. D., Marzook, M., Marinescu, M. & Offer, G. J. How Observable Is
Lithium Plating? Differential Voltage Analysis to Identify and Quantify Lithium
Plating Following Fast Charging of Cold Lithium-Ion Batteries. J. Electrochem.
Soc. 166, A725–A739 (2019).
80. Yun, F., Jin, W., Tang, L., Li, W., Pang, J. & Lu, S. Analysis of Capacity Fade from
Entropic Heat Coefficient of Li[Ni x Co y Mn z ]O 2 /Graphite Lithium Ion Battery
. J. Electrochem. Soc. 163, A639–A643 (2016).
81. Konar, S., Häusserman, U. & Svensson, G. Intercalation compounds from lih and
graphite: Relative stability of metastable stages and thermodynamic stability of
dilute stage Id. Chem. Mater. 27, 2566–2575 (2015).
82. Dees, D. W., Abraham, D. P., Lu, W., Gallagher, K. G., Bettge, M. & Jansen, A. N.
Electrochemical Modeling and Performance of a Lithium- and Manganese-Rich
Layered Transition-Metal Oxide Positive Electrode. J. Electrochem. Soc. 162,
A559–A572 (2015).
83. Han, B. C., Van Der Ven, A., Morgan, D. & Ceder, G. Electrochemical modeling of
intercalation processes with phase field models. Electrochim. Acta 49, 4691–4699
(2004).
84. Schweidler, S., De Biasi, L., Schiele, A., Hartmann, P., Brezesinski, T. & Janek, J.
Volume Changes of Graphite Anodes Revisited: A Combined Operando X-ray
Diffraction and in Situ Pressure Analysis Study. J. Phys. Chem. C 122, 8829–8835
(2018).
85. Müller, S., Pietsch, P., Brandt, B. E., Baade, P., De Andrade, V., De Carlo, F. &
Wood, V. Quantification and modeling of mechanical degradation in lithium-ion
batteries based on nanoscale imaging. Nat. Commun. 9, 389–390 (2018).
86. Chung, G.-C., Kim, H.-J., Yu, S.-I., Jun, S.-H., Choi, J. & Kim, M.-H. Origin of
Graphite Exfoliation An Investigation of the Important Role of Solvent
Cointercalation. J. Electrochem. Soc. 147, 4391 (2000).
87. Lundgren, H., Svens, P., Ekström, H., Tengstedt, C., Lindström, J., Behm, M. &
Lindbergh, G. Thermal Management of Large-Format Prismatic Lithium-Ion
Battery in PHEV Application. J. Electrochem. Soc. 163, A309–A317 (2016).
88. Cengel, Y. A. Heat Transfer: A Practical Approach (2nd Edition). (McGraw-Hill,
2003).
89. Nguyen, T. Q. & Breitkopf, C. Determination of Diffusion Coefficients Using
Impedance Spectroscopy Data. J. Electrochem. Soc. 165, E826–E831 (2018).

197
90. Sikha, G., Popov, B. N. & White, R. E. Effect of Porosity on the Capacity Fade of a
Lithium-Ion Battery. J. Electrochem. Soc. 151, A1104 (2004).
91. Yang, S., Wang, X., Yang, X., Bai, Y., Liu, Z., Shu, H. & Wei, Q. Determination of
the chemical diffusion coefficient of lithium ions in spherical Li[Ni 0.5Mn 0.3Co
0.2]O 2. Electrochim. Acta 66, 88–93 (2012).
92. Murbach, M. D. & Schwartz, D. T. Analysis of Li-Ion Battery Electrochemical
Impedance Spectroscopy Data: An Easy-to-Implement Approach for Physics-Based
Parameter Estimation Using an Open-Source Tool. J. Electrochem. Soc. 165, A297–
A304 (2018).
93. Ramadesigan, V., Northrop, P. W. C., De, S., Santhanagopalan, S., Braatz, R. D. &
Subramanian, V. R. Modeling and Simulation of Lithium-Ion Batteries from a
Systems Engineering Perspective. J. Electrochem. Soc. 159, R31–R45 (2012).
94. Atlung, S., West, K. & Jacobsen, T. Dynamic Aspects of Solid Solution Cathodes
for Electrochemical Power Sources. J. Electrochem. Soc. 126, 1311–1320 (1979).
95. Santhanagopalan, S., Guo, Q., Ramadass, P. & White, R. E. Review of models for
predicting the cycling performance of lithium ion batteries. J. Power Sources 156,
620–628 (2006).
96. Fuller, T. F., Doyle, M. & Newman, J. Simulation and Optimization of the Dual
Lithium Ion Insertion Cell. J. Electrochem. Soc. 141, 1–10 (1994).
97. Yang, S., Wang, X., Yang, X., Bai, Y., Liu, Z., Shu, H. & Wei, Q. Determination of
the chemical diffusion coefficient of lithium ions in spherical Li[Ni 0.5Mn 0.3Co
0.2]O 2. Electrochim. Acta 66, 88–93 (2012).
98. Ng, B., Duan, X., Liu, F., Agar, E., White, R. E., Mustain, W. E. & Jin, X.
Investigation of Transport and Kinetic Nonideality in Solid Li-Ion Electrodes
through Deconvolution of Electrochemical Impedance Spectra. J. Electrochem. Soc.
167, 020523 (2020).
99. Lu, J., Li, L., Park, J. B., Sun, Y. K., Wu, F. & Amine, K. Aprotic and aqueous Li-
O2 batteries. Chem. Rev. 114, 5611–5640 (2014).
100. Yang, X. G., Zhang, G., Ge, S. & Wang, C. Y. Fast charging of lithium-ion batteries
at all temperatures. Proc. Natl. Acad. Sci. U. S. A. 115, 7266–7271 (2018).
101. Liu, Y., Zhu, Y. & Cui, Y. Challenges and opportunities towards fast-charging
battery materials. Nat. Energy 4, 540–550 (2019).
102. Hosseinzadeh, E., Genieser, R., Worwood, D., Barai, A., Marco, J. & Jennings, P.
A systematic approach for electrochemical-thermal modelling of a large format
lithium-ion battery for electric vehicle application. J. Power Sources 382, 77–94
(2018).

198
103. Zhao, J., Liao, L., Shi, F., Lei, T., Chen, G., Pei, A., Sun, J., Yan, K., Zhou, G., Xie,
J., Liu, C., Li, Y., Liang, Z., Bao, Z. & Cui, Y. Surface Fluorination of Reactive
Battery Anode Materials for Enhanced Stability. J. Am. Chem. Soc. 139, 11550–
11558 (2017).
104. Lee, W., Muhammad, S., Sergey, C., Lee, H., Yoon, J., Kang, Y. M. & Yoon, W. S.
Advances in the Cathode Materials for Lithium Rechargeable Batteries. Angew.
Chemie - Int. Ed. 59, 2578–2605 (2020).
105. Richards, W. D., Dacek, S. T., Kitchaev, D. A. & Ceder, G. Fluorination of Lithium-
Excess Transition Metal Oxide Cathode Materials. Adv. Energy Mater. 8, 1701533
(2018).
106. Li, G., Liu, Z., Huang, Q., Gao, Y., Regula, M., Wang, D., Chen, L. Q. & Wang, D.
Stable metal battery anodes enabled by polyethylenimine sponge hosts by way of
electrokinetic effects. Nat. Energy 3, 1076–1083 (2018).
107. Liu, K., Liu, Y., Lin, D., Pei, A. & Cui, Y. Materials for lithium-ion battery safety.
Sci. Adv. 4, eaas9820 (2018).
108. Fan, X., Ji, X., Han, F., Yue, J., Chen, J., Chen, L., Deng, T., Jiang, J. & Wang, C.
Fluorinated solid electrolyte interphase enables highly reversible solid-state Li metal
battery. Sci. Adv. 4, 9245 (2018).
109. Ng, B., Peng, X., Faegh, E. & Mustain, W. E. Using nanoconfinement to inhibit the
degradation pathways of conversion-metal oxide anodes for highly stable fast-
charging Li-ion batteries. J. Mater. Chem. A 8, 2712–2727 (2020).
110. Lisbona, D. & Snee, T. A review of hazards associated with primary lithium and
lithium-ion batteries. Process Saf. Environ. Prot. 89, 434–442 (2011).
111. Ping, P., Kong, D., Zhang, J., Wen, R. & Wen, J. Characterization of behaviour and
hazards of fire and deflagration for high-energy Li-ion cells by over-heating. J.
Power Sources 398, 55–66 (2018).
112. Li, W., Wang, H., Zhang, Y. & Ouyang, M. Flammability characteristics of the
battery vent gas: A case of NCA and LFP lithium-ion batteries during external
heating abuse. J. Energy Storage 24, 100775 (2019).
113. Tarascon, J. M. & Armand, M. Issues and challenges facing rechargeable lithium
batteries. Nature 414, 359–367 (2001).
114. Zeng, X., Li, M., Abd El-Hady, D., Alshitari, W., Al-Bogami, A. S., Lu, J. & Amine,
K. Commercialization of Lithium Battery Technologies for Electric Vehicles. Adv.
Energy Mater. 9, 1900161 (2019).
115. Li, W., Song, B. & Manthiram, A. High-voltage positive electrode materials for
lithium-ion batteries. Chem. Soc. Rev. 46, 3006–3059 (2017).
116. Kim, T., Song, W., Son, D. Y., Ono, L. K. & Qi, Y. Lithium-ion batteries: outlook
on present, future, and hybridized technologies. J. Mater. Chem. A 7, 2942–2964
(2019).

199
117. Huang, H., Wang, X., Tervoort, E., Zeng, G., Liu, T., Chen, X., Sologubenko, A. &
Niederberger, M. Nano-Sized Structurally Disordered Metal Oxide Composite
Aerogels as High-Power Anodes in Hybrid Supercapacitors. ACS Nano 12, 2753–
2763 (2018).
118. Poullikkas, A. Sustainable options for electric vehicle technologies. Renew. Sustain.
Energy Rev. 41, 1277–1287 (2015).
119. Keil, P. & Jossen, A. Impact of Dynamic Driving Loads and Regenerative Braking
on the Aging of Lithium-Ion Batteries in Electric Vehicles. J. Electrochem. Soc.
164, A3081–A3092 (2017).
120. Ren, G., Ma, G. & Cong, N. Review of electrical energy storage system for vehicular
applications. Renew. Sustain. Energy Rev. 41, 225–236 (2015).
121. Chin, K. B., Brandon, E. J., Bugga, R. V., Smart, M. C., Jones, S. C., Krause, F. C.,
West, W. C. & Bolotin, G. G. Energy Storage Technologies for Small Satellite
Applications. Proc. IEEE 106, 419–428 (2018).
122. Gao, S., Lu, L., Ouyang, M., Duan, Y., Zhu, X., Xu, C., Ng, B., Kamyab, N., White,
R. E. & Coman, P. T. Experimental Study on Module-to-Module Thermal Runaway-
Propagation in a Battery Pack. J. Electrochem. Soc. 166, A2065–A2073 (2019).
123. Larsson, F., Bertilsson, S., Furlani, M., Albinsson, I. & Mellander, B. E. Gas
explosions and thermal runaways during external heating abuse of commercial
lithium-ion graphite-LiCoO2 cells at different levels of ageing. J. Power Sources
373, 220–231 (2018).
124. Larsson, F., Andersson, P., Blomqvist, P. & Mellander, B. E. Toxic fluoride gas
emissions from lithium-ion battery fires. Sci. Rep. 7, 1–13 (2017).
125. Omaye, S. T. Metabolic modulation of carbon monoxide toxicity. Toxicology 180,
139–150 (2002).
126. Lebedeva, N. P. & Boon-Brett, L. Considerations on the Chemical Toxicity of
Contemporary Li-Ion Battery Electrolytes and Their Components. J. Electrochem.
Soc. 163, A821–A830 (2016).
127. Finegan, D. P., Darcy, E., Keyser, M., Tjaden, B., Heenan, T. M. M., Jervis, R.,
Bailey, J. J., Vo, N. T., Magdysyuk, O. V., Drakopoulos, M., Michiel, M. Di, Rack,
A., Hinds, G., Brett, D. J. L. & Shearing, P. R. Identifying the Cause of Rupture of
Li-Ion Batteries during Thermal Runaway. Adv. Sci. 5, 1700369 (2018).
128. Williard, N., He, W., Hendricks, C. & Pecht, M. Lessons learned from the 787
dreamliner issue on Lithium-Ion Battery reliability. Energies 6, 4682–4695 (2013).
129. Loveridge, M. J., Remy, G., Kourra, N., Genieser, R., Barai, A., Lain, M. J., Guo,
Y., Amor-Segan, M., Williams, M. A., Amietszajew, T., Ellis, M., Bhagat, R. &
Greenwood, D. Looking deeper into the galaxy (Note 7). Batteries 4, 1–11 (2018).

200
130. Ng, B., Coman, P. T., Faegh, E., Peng, X., Karakalos, S. G., Jin, X., Mustain, W. E.
& White, R. E. Low-Temperature Lithium Plating/Corrosion Hazard in Lithium-Ion
Batteries: Electrode Rippling, Variable States of Charge, and Thermal and
Nonthermal Runaway. ACS Appl. Energy Mater. 3, 3653–3664 (2020).
131. Steiger, J. & Erlangung, Z. Mechanisms of Dendrite Growth in Lithium Metal
Batteries. Dissertation (Karlsruher Institut für Technologie (KIT). Karlsruhe, 2015).
132. Lin, D., Liu, Y., Li, Y., Li, Y., Pei, A., Xie, J., Huang, W. & Cui, Y. Fast galvanic
lithium corrosion involving a Kirkendall-type mechanism. Nat. Chem. 11, 382–389
(2019).
133. Sun, Y., Liu, N. & Cui, Y. Promises and challenges of nanomaterials for lithium-
based rechargeable batteries. Nat. Energy 1, 16071 (2016).
134. Bhattacharyya, R., Key, B., Chen, H., Best, A. S., Hollenkamp, A. F. & Grey, C. P.
In situ NMR observation of the formation of metallic lithium microstructures in
lithium batteries. Nat. Mater. 9, 504–510 (2010).
135. Liu, Y., Liu, Q., Xin, L., Liu, Y., Yang, F., Stach, E. A. & Xie, J. Making Li-metal
electrodes rechargeable by controlling the dendrite growth direction. Nat. Energy 2,
17083 (2017).
136. Guan, T., Sun, S., Yu, F., Gao, Y., Fan, P., Zuo, P., Du, C. & Yin, G. The degradation
of LiCoO2/graphite batteries at different rates. Electrochim. Acta 279, 204–212
(2018).
137. Hellqvist Kjell, M., Malmgren, S., Ciosek, K., Behm, M., Edström, K. & Lindbergh,
G. Comparing aging of graphite/LiFePO4 cells at 22 C and 55 C - Electrochemical
and photoelectron spectroscopy studies. J. Power Sources 243, 290–298 (2013).
138. Dedryvère, R., Laruelle, S., Grugeon, S., Gireaud, L., Tarascon, J.-M. & Gonbeau,
D. XPS Identification of the Organic and Inorganic Components of the
Electrode/Electrolyte Interface Formed on a Metallic Cathode. J. Electrochem. Soc.
152, A689 (2005).
139. Ruschewitz, U. Binary and ternary carbides of alkali and alkaline-earth metals.
Coord. Chem. Rev. 244, 115–136 (2003).
140. Thackeray, M. M., Wolverton, C. & Isaacs, E. D. Electrical energy storage for
transportation - Approaching the limits of, and going beyond, lithium-ion batteries.
Energy Environ. Sci. 5, 7854–7863 (2012).
141. Grey, C. P. & Tarascon, J. M. Sustainability and in situ monitoring in battery
development. Nat. Mater. 16, 45–56 (2016).
142. Liu, K., Liu, Y., Lin, D., Pei, A. & Cui, Y. Materials for lithium-ion battery safety.
Sci. Adv. 4, 9820 (2018).
143. Kim, N., Chae, S., Ma, J., Ko, M. & Cho, J. Fast-charging high-energy lithium-ion
batteries via implantation of amorphous silicon nanolayer in edge-plane activated
graphite anodes. Nat. Commun. 8, 812 (2017).

201
144. Li, Q., Zhu, G., Zhao, Y., Pei, K. & Che, R. Ni x Mn y Co z O Nanowire/CNT
Composite Microspheres with 3D Interconnected Conductive Network Structure via
Spray-Drying Method: A High-Capacity and Long-Cycle-Life Anode Material for
Lithium-Ion Batteries. Small 15, 1–12 (2019).
145. Dong, Y., Wang, B., Zhao, K., Yu, Y., Wang, X., Mai, L. & Jin, S. Air-Stable Porous
Fe2N Encapsulated in Carbon Microboxes with High Volumetric Lithium Storage
Capacity and a Long Cycle Life. Nano Lett. 17, 5740–5746 (2017).
146. Yuan, H., Wu, M., Zheng, J., Chen, Z. G., Zhang, W., Luo, J., Jin, C., Sheng, O.,
Liang, C., Gan, Y., Xia, Y., Zhang, J., Huang, H., Liu, Y., Nai, J. & Tao, X.
Empowering Metal Phosphides Anode with Catalytic Attribute toward Superior
Cyclability for Lithium-Ion Storage. Adv. Funct. Mater. 29, 1–8 (2019).
147. Liu, Z., Yang, S., Sun, B., Chang, X., Zheng, J. & Li, X. A Peapod-like CoP@C
Nanostructure from Phosphorization in a Low-Temperature Molten Salt for High-
Performance Lithium-Ion Batteries. Angew. Chemie - Int. Ed. 57, 10187–10191
(2018).
148. Chen, C., Xie, X., Anasori, B., Sarycheva, A., Makaryan, T., Zhao, M.,
Urbankowski, P., Miao, L., Jiang, J. & Gogotsi, Y. MoS2-on-MXene
Heterostructures as Highly Reversible Anode Materials for Lithium-Ion Batteries.
Angew. Chemie - Int. Ed. 57, 1846–1850 (2018).
149. Zhan, J., Wu, K., Yu, X., Yang, M., Cao, X., Lei, B., Pan, D., Jiang, H. & Wu, M.
α-Fe2O3 Nanoparticles Decorated C@MoS2 Nanosheet Arrays with Expanded
Spacing of (002) Plane for Ultrafast and High Li/Na-Ion Storage. Small 15, 1–10
(2019).
150. Li, Z., Zhao, H., Lv, P., Zhang, Z., Zhang, Y., Du, Z., Teng, Y., Zhao, L. & Zhu, Z.
Watermelon-Like Structured SiOx–TiO2@C Nanocomposite as a High-
Performance Lithium-Ion Battery Anode. Adv. Funct. Mater. 28, 1–11 (2018).
151. Luo, J., Ma, B., Peng, J., Wu, Z., Luo, Z. & Wang, X. Modified Chestnut-Like
Structure Silicon Carbon Composite as Anode Material for Lithium-Ion Batteries.
ACS Sustain. Chem. Eng. 7, 10415–10424 (2019).
152. Li, P., Hwang, J. Y. & Sun, Y. K. Nano/microstructured silicon-graphite composite
anode for high-energy-density li-ion battery. ACS Nano 13, 2624–2633 (2019).
153. Cai, X., Liu, W., Yang, S., Zhang, S., Gao, Q., Yu, X., Li, J., Wang, H. & Fang, Y.
Dual-Confined SiO Embedded in TiO2 Shell and 3D Carbon Nanofiber Web as
Stable Anode Material for Superior Lithium Storage. Adv. Mater. Interfaces 6, 1–
11 (2019).
154. Wang, W., Jiang, B., Xiong, W., Sun, H., Lin, Z., Hu, L., Tu, J., Hou, J., Zhu, H. &
Jiao, S. A new cathode material for super-valent battery based on aluminium ion
intercalation and deintercalation. Sci. Rep. 3, 3383 (2013).
202
155. Liu, N., Lu, Z., Zhao, J., Mcdowell, M. T., Lee, H. W., Zhao, W. & Cui, Y. A
pomegranate-inspired nanoscale design for large-volume-change lithium battery
anodes. Nat. Nanotechnol. 9, 187–192 (2014).
156. Wu, H., Chan, G., Choi, J. W., Ryu, I., Yao, Y., Mcdowell, M. T., Lee, S. W.,
Jackson, A., Yang, Y., Hu, L. & Cui, Y. Stable cycling of double-walled silicon
nanotube battery anodes through solid-electrolyte interphase control. Nat.
Nanotechnol. 7, 310–315 (2012).
157. Lanz, M. & Novák, P. DEMS study of gas evolution at thick graphite electrodes for
lithium-ion batteries: The effect of γ-butyrolactone. J. Power Sources 102, 277–282
(2001).
158. Steinhauer, M., Risse, S., Wagner, N. & Friedrich, K. A. Investigation of the Solid
Electrolyte Interphase Formation at Graphite Anodes in Lithium-Ion Batteries with
Electrochemical Impedance Spectroscopy. Electrochim. Acta 228, 652–658 (2017).
159. Steinrück, H. G., Cao, C., Tsao, Y., Takacs, C. J., Konovalov, O., Vatamanu, J.,
Borodin, O. & Toney, M. F. The nanoscale structure of the electrolyte-metal oxide
interface. Energy Environ. Sci. 11, 594–602 (2018).
160. Li, T. & Balbuena, P. B. Theoretical studies of the reduction of ethylene carbonate.
Chem. Phys. Lett. 317, 421–429 (2000).
161. Wang, S., Zhang, W., Chen, Y., Dai, Z., Zhao, C., Wang, D. & Shen, C. Operando
study of Fe 3 O 4 anodes by electrochemical atomic force microscopy. Appl. Surf.
Sci. 426, 217–223 (2017).
162. Wang, S., Yang, K., Gao, F., Wang, D. & Shen, C. Direct visualization of solid
electrolyte interphase on Li4Ti5O12 by: In situ AFM. RSC Adv. 6, 77105–77110
(2016).
163. Shen, C., Wang, S., Jin, Y. & Han, W. Q. In Situ AFM Imaging of Solid Electrolyte
Interfaces on HOPG with Ethylene Carbonate and Fluoroethylene Carbonate-Based
Electrolytes. ACS Appl. Mater. Interfaces 7, 25441–25447 (2015).
164. Wang, X., Kerr, R., Chen, F., Goujon, N., Pringle, J. M., Mecerreyes, D., Forsyth,
M. & Howlett, P. C. Toward High-Energy-Density Lithium Metal Batteries:
Opportunities and Challenges for Solid Organic Electrolytes. Adv. Mater. 32,
1905219 (2020).
165. Yan, C., Xu, R., Xiao, Y., Ding, J. F., Xu, L., Li, B. Q. & Huang, J. Q. Toward
Critical Electrode/Electrolyte Interfaces in Rechargeable Batteries. Adv. Funct.
Mater. 30, 1–21 (2020).
166. Goodenough, J. B. & Kim, Y. Challenges for rechargeable Li batteries. Chem.
Mater. 22, 587–603 (2010).
167. Ng, B., Faegh, E., Lateef, S., Karakalos, S. G. & Mustain, W. E. Structure and
chemistry of the solid electrolyte interphase (SEI) on a high capacity conversion-
based anode: NiO. J. Mater. Chem. A 9, 523–537 (2021).

203
168. Wang, H., Fu, J., Wang, C., Wang, J., Yang, A., Li, C., Sun, Q., Cui, Y. & Li, H. A
binder-free high silicon content flexible anode for Li-ion batteries. Energy Environ.
Sci. 13, 848–858 (2020).
169. Elishav, O., Shener, Y., Beilin, V., Shter, G. E., Ng, B., Mustain, W. E., Landau, M.
V., Herskowitz, M. & Grader, G. S. Electrospun nanofibers with surface oriented
lamellar patterns and their potential applications. Nanoscale 12, 12993–13000
(2020).
170. Liu, H., Li, Q., Yao, Z., Li, L., Li, Y., Wolverton, C., Hersam, M. C., Wu, J. &
Dravid, V. P. Origin of Fracture-Resistance to Large Volume Change in Cu-
Substituted Co3O4 Electrodes. Adv. Mater. 30, 1–8 (2018).
171. Deng, J., Yu, X., Qin, X., Zhou, D., Zhang, L., Duan, H., Kang, F., Li, B. & Wang,
G. Co–B Nanoflakes as Multifunctional Bridges in ZnCo 2 O 4 Micro-/Nanospheres
for Superior Lithium Storage with Boosted Kinetics and Stability. Adv. Energy
Mater. 9, 1–11 (2019).
172. Ren, W., Liu, D., Sun, C., Yao, X., Tan, J., Wang, C., Zhao, K., Wang, X., Li, Q. &
Mai, L. Nonhierarchical Heterostructured Fe2O3/Mn2O3 Porous Hollow Spheres
for Enhanced Lithium Storage. Small 14, 1–9 (2018).
173. Yan, S., Song, H., Lin, S., Wu, H., Shi, Y. & Yao, J. GeO 2 Encapsulated Ge
Nanostructure with Enhanced Lithium-Storage Properties. Adv. Funct. Mater. 29,
1–7 (2019).
174. Hao, J., Zhang, J., Xia, G., Liu, Y., Zheng, Y., Zhang, W., Tang, Y., Pang, W. K. &
Guo, Z. Heterostructure Manipulation via in Situ Localized Phase Transformation
for High-Rate and Highly Durable Lithium Ion Storage. ACS Nano 12, 10430–
10438 (2018).
175. Lu, Y., Nai, J. & Lou, X. W. D. Formation of NiCo2V2O8 Yolk–Double Shell
Spheres with Enhanced Lithium Storage Properties. Angew. Chemie - Int. Ed. 57,
2899–2903 (2018).
176. Liu, Z., Yu, X. Y. & Paik, U. Etching-in-a-Box: A Novel Strategy to Synthesize
Unique Yolk-Shelled Fe3O4@Carbon with an Ultralong Cycling Life for Lithium
Storage. Adv. Energy Mater. 6, 3–7 (2016).
177. Shrestha, S. & Mustain, W. E. Properties of Nitrogen-Functionalized Ordered
Mesoporous Carbon Prepared Using Polypyrrole Precursor. J. Electrochem. Soc.
157, B1665 (2010).
178. Zhao, D., Feng, J., Huo, Q., Melosh, N., Fredrickson, G. H., Chmelka, B. F. &
Stucky, G. D. Triblock copolymer syntheses of mesoporous silica with periodic 50
to 300 angstrom pores. Science (80-. ). 279, 548–552 (1998).
179. Fletcher, S. Tafel slopes from first principles. J. Solid State Electrochem. 13, 537–
549 (2009).

204
180. Bockris, J. O. M. & Nagy, Z. Symmetry factor and transfer coefficient: A source of
confusion in electrode kinetics. J. Chem. Educ. 50, 839–843 (1973).
181. Bai, P. & Bazant, M. Z. Charge transfer kinetics at the solid-solid interface in porous
electrodes. Nat. Commun. 5, 1–7 (2014).
182. Boyle, D. T., Kong, X., Pei, A., Rudnicki, P. E., Shi, F., Huang, W., Bao, Z., Qin, J.
& Cui, Y. Transient Voltammetry with Ultramicroelectrodes Reveals the Electron
Transfer Kinetics of Lithium Metal Anodes. ACS Energy Lett. 5, 701–709 (2020).
183. Fletcher, S. Tafel slopes from first principles. J. Solid State Electrochem. 13, 537–
549 (2009).
184. Aurbach, D., Moshkovich, M., Cohen, Y. & Schechter, A. Study of surface film
formation on noble-metal electrodes in alkyl carbonates/Li salt solutions, using
simultaneous in situ AFM, EQCM, FTIR, and EIS. Langmuir 15, 2947–2960
(1999).
185. Aurbach, D., Levi, M. D., Levi, E. & Schechter, A. Failure and stabilization
mechanisms of graphite electrodes. J. Phys. Chem. B 101, 2195–2206 (1997).
186. Wang, Y., Nakamura, S., Tasaki, K. & Balbuena, P. B. Theoretical studies to
understand surface chemistry on carbon anodes for lithium-ion batteries: How does
vinylene carbonate play its role as an electrolyte additive? J. Am. Chem. Soc. 124,
4408–4421 (2002).
187. Ahamad, S. & Gupta, A. A systematic study of kinetics in mesocarbon microbeads
anodes in presence of nano-conductive additives. Electrochim. Acta 297, 916–928
(2019).
188. Marcus, R. A. Electron Transfer Reactions in Chemistry: Theory and Experiment
(Nobel Lecture). Angew. Chemie Int. Ed. English 32, 1111–1121 (1993).
189. Gilbert, J. A., Bareño, J., Spila, T., Trask, S. E., Miller, D. J., Polzin, B. J., Jansen,
A. N. & Abraham, D. P. Cycling Behavior of NCM523/Graphite Lithium-Ion Cells
in the 3–4.4 V Range: Diagnostic Studies of Full Cells and Harvested Electrodes. J.
Electrochem. Soc. 164, A6054–A6065 (2017).
190. Bock, D. C., Waller, G. H., Mansour, A. N., Marschilok, A. C., Takeuchi, K. J. &
Takeuchi, E. S. Investigation of Solid Electrolyte Interphase Layer Formation and
Electrochemical Reversibility of Magnetite, Fe3O4, Electrodes: A Combined X-ray
Absorption Spectroscopy and X-ray Photoelectron Spectroscopy Study. J. Phys.
Chem. C 122, 14257–14271 (2018).
191. Chattopadhyay, S., Lipson, A. L., Karmel, H. J., Emery, J. D., Fister, T. T., Fenter,
P. A., Hersam, M. C. & Bedzyk, M. J. In situ X-ray study of the solid electrolyte
interphase (SEI) formation on graphene as a model Li-ion battery anode. Chem.
Mater. 24, 3038–3043 (2012).
192. Wang, Y., Nakamura, S., Ue, M. & Balbuena, P. B. Theoretical studies to
understand surface chemistry on carbon anodes for lithium-ion batteries: Reduction
mechanisms of ethylene carbonate. J. Am. Chem. Soc. 123, 11708–11718 (2001).

205
193. Balbuena, P. B. First Principles Modeling of SEI Formation on Bare and Surface /
Additive Modified Silicon Anodes. (2015).
194. Vassiliev, S. Y., Sentyurin, V. V., Levin, E. E. & Nikitina, V. A. Diagnostics of
lithium-ion intercalation rate-determining step: Distinguishing between slow
desolvation and slow charge transfer. Electrochim. Acta 302, 316–326 (2019).
195. Zheng, M., Tang, H., Li, L., Hu, Q., Zhang, L., Xue, H. & Pang, H. Hierarchically
Nanostructured Transition Metal Oxides for Lithium-Ion Batteries. Adv. Sci. 5,
1700592 (2018).
196. Zhou, J., Song, H., Chen, X., Zhi, L., Yang, S., Huo, J. & Yang, W. Carbon-
encapsulated metal oxide hollow nanoparticles and metal oxide hollow
nanoparticles: A general synthesis strategy and its application to lithium-ion
batteries. Chem. Mater. 21, 2935–2940 (2009).
197. Ming, J., Park, J. B. & Sun, Y. K. Encapsulation of metal oxide nanocrystals into
porous carbon with ultrahigh performances in lithium-ion battery. ACS Appl. Mater.
Interfaces 5, 2133–2136 (2013).
198. Luo, L., Wu, J., Xu, J. & Dravid, V. P. Atomic resolution study of reversible
conversion reaction in metal oxide electrodes for lithium-ion battery. ACS Nano 8,
11560–11566 (2014).
199. Karki, K., Wu, L., Ma, Y., Armstrong, M. J., Holmes, J. D., Garofalini, S. H., Zhu,
Y., Stach, E. A. & Wang, F. Revisiting Conversion Reaction Mechanisms in Lithium
Batteries: Lithiation-Driven Topotactic Transformation in FeF 2. J. Am. Chem. Soc.
140, 17915–17922 (2018).
200. Evmenenko, G., Warburton, R. E., Yildirim, H., Greeley, J. P., Chan, M. K. Y.,
Buchholz, D. B., Fenter, P., Bedzyk, M. J. & Fister, T. T. Understanding the Role
of Overpotentials in Lithium Ion Conversion Reactions: Visualizing the Interface.
ACS Nano 13, 7825–7832 (2019).
201. Choi, S. H., Lee, J. H. & Kang, Y. C. Perforated Metal Oxide-Carbon Nanotube
Composite Microspheres with Enhanced Lithium-Ion Storage Properties. ACS Nano
9, 10173–10185 (2015).
202. Sun, J., Lv, C., Lv, F., Chen, S., Li, D., Guo, Z., Han, W., Yang, D. & Guo, S.
Tuning the Shell Number of Multishelled Metal Oxide Hollow Fibers for Optimized
Lithium-Ion Storage. ACS Nano 11, 6186–6193 (2017).
203. Du, N., Zhang, H., Chen, J., Sun, J., Chen, B. & Yang, D. Metal oxide and sulfide
hollow spheres: Layer-by-layer synthesis and their application in lithium-ion
battery. J. Phys. Chem. B 112, 14836–14842 (2008).
204. Tao, S., Yue, W., Zhong, M., Chen, Z. & Ren, Y. Fabrication of graphene-
encapsulated porous carbon-metal oxide composites as anode materials for lithium-
ion batteries. ACS Appl. Mater. Interfaces 6, 6332–6339 (2014).

206
205. Lee, D., Wu, M., Kim, D. H., Chae, C., Cho, M. K., Kim, J. Y., Lee, S. S., Choi, S.,
Choi, Y., Shin, T. J., Chung, K. Y., Jeong, S. & Moon, J. Understanding the Critical
Role of the Ag Nanophase in Boosting the Initial Reversibility of Transition Metal
Oxide Anodes for Lithium-Ion Batteries. ACS Appl. Mater. Interfaces 9, 21715–
21722 (2017).
206. Nordh, T., Younesi, R., Hahlin, M., Duarte, R. F., Tengstedt, C., Brandell, D. &
Edström, K. Manganese in the SEI Layer of Li4Ti5O12 Studied by Combined
NEXAFS and HAXPES Techniques. J. Phys. Chem. C 120, 3206–3213 (2016).
207. Harris, O. C. & Tang, M. H. Molecular Probes Reveal Chemical Selectivity of the
Solid-Electrolyte Interphase. J. Phys. Chem. C 122, 20632–20641 (2018).
208. Lin, Z., Du, C., Yan, B., Wang, C. & Yang, G. Two-dimensional amorphous NiO
as a plasmonic photocatalyst for solar H2 evolution. Nat. Commun. 9, 4036 (2018).
209. Chen, Y. M., Yu, X. Y., Li, Z., Paik, U. & Lou, X. W. Hierarchical MoS2 tubular
structures internally wired by carbon nanotubes as a highly stable anode material for
lithium-ion batteries. Sci. Adv. 2, e1600021 (2016).
210. Xu, M., Li, W. & Lucht, B. L. Effect of propane sultone on elevated temperature
performance of anode and cathode materials in lithium-ion batteries. J. Power
Sources 193, 804–809 (2009).
211. Wang, Y., Wang, Z., Chen, Y., Zhang, H., Yousaf, M., Wu, H., Zou, M., Cao, A. &
Han, R. P. S. Hyperporous Sponge Interconnected by Hierarchical Carbon
Nanotubes as a High-Performance Potassium-Ion Battery Anode. Adv. Mater. 30,
1–10 (2018).
212. Wu, Z., Wang, Y., Liu, X., Lv, C., Li, Y., Wei, D. & Liu, Z. Carbon-Nanomaterial-
Based Flexible Batteries for Wearable Electronics. Adv. Mater. 31, 1–25 (2019).
213. Harlow, J. E., Ma, X., Li, J., Logan, E., Liu, Y., Zhang, N., Ma, L., Glazier, S. L.,
Cormier, M. M. E., Genovese, M., Buteau, S., Cameron, A., Stark, J. E. & Dahn, J.
R. A Wide Range of Testing Results on an Excellent Lithium-Ion Cell Chemistry to
be used as Benchmarks for New Battery Technologies. J. Electrochem. Soc. 166,
A3031–A3044 (2019).
214. Zhang, S. S. The redox mechanism of FeS2 in non-aqueous electrolytes for lithium
and sodium batteries. J. Mater. Chem. A 3, 7689–7694 (2015).
215. Yersak, T. A., Macpherson, H. A., Kim, S. C., Le, V. D., Kang, C. S., Son, S. B.,
Kim, Y. H., Trevey, J. E., Oh, K. H., Stol dt, C. & Lee, S. H. Solid state enabled
reversible four electron storage. Adv. Energy Mater. 3, 120–127 (2013).
216. Ferraro, M. E., Trembacki, B. L., Brunini, V. E., Noble, D. R. & Roberts, S. A.
Electrode Mesoscale as a Collection of Particles: Coupled Electrochemical and
Mechanical Analysis of NMC Cathodes. J. Electrochem. Soc. 167, 013543 (2020).
217. Ebner, M., Geldmacher, F., Marone, F., Stampanoni, M. & Wood, V. X-Ray
Tomography of Porous, Transition Metal Oxide Based Lithium Ion Battery
Electrodes. Adv. Energy Mater. 3, 845–850 (2013).

207
218. Guo, J. & Liu, J. A binder-free electrode architecture design for lithium-sulfur
batteries: A review. Nanoscale Adv. 1, 2104–2122 (2019).
219. Pham, C. Van, Liu, L., Britton, B., Walter, M., Holdcroft, S. & Thiele, S.
Stabilization of Li-S batteries with a lean electrolyte: Via ion-exchange trapping of
lithium polysulfides using a cationic, polybenzimidazolium binder. Sustain. Energy
Fuels 4, 1180–1190 (2020).
220. Mandal, M., Huang, G., Hassan, N. U., Mustain, W. E. & Kohl, P. A.
Poly(norbornene) anion conductive membranes: homopolymer, block copolymer
and random copolymer properties and performance. J. Mater. Chem. A 8, 17568–
17578 (2020).
221. Gao, S., Feng, X., Lu, L., Kamyab, N., Du, J., Coman, P., White, R. E. & Ouyang,
M. An experimental and analytical study of thermal runaway propagation in a large
format lithium ion battery module with NCM pouch-cells in parallel. Int. J. Heat
Mass Transf. 135, 93–103 (2019).

208
APPENDIX A: COPYRIGHT & PERMISSIONS
Figure A.1 Copyright permission for Figure 1.2. Qi, Y., Guo, H., Hector, L. G. &
Timmons, A. Threefold Increase in the Young ’ s Modulus of Graphite Negative Electrode
during Lithium Intercalation Threefold Increase in the Young ’ s Modulus of Graphite
Negative Electrode during Lithium Intercalation. J. Electrochem. Soc. 157, A558–A566
(2010).

209
Figure A.2 Copyright permission for Figure 1.3. Radin, M. D., Hy, S., Sina, M., Fang, C.,
Liu, H., Vinckeviciute, J., Zhang, M., Whittingham, M. S., Meng, Y. S. & Van der Ven,
A. Narrowing the Gap between Theoretical and Practical Capacities in Li-Ion Layered
Oxide Cathode Materials. Adv. Energy Mater. 7, 1–33 (2017).
Figure A.3 Copyright permission for Figure 1.4 and Figure 1.5 Rodrigues, M.-T. F.,
Babu, G., Gullapalli, H., Kalaga, K., Sayed, F. N., Kato, K., Joyner, J. & Ajayan, P. M. A
materials perspective on Li-ion batteries at extreme temperatures. Nat. Energy 2, 17108
(2017).

210
Figure A.4 Copyright permission for Figure 1.7. Amatucci, G. G. Stabilized iron fluoride
cathodes. Nat. Mater. 18, 1275–1276 (2019).

211
Figure A.5 Copyright permission for Figure 1.8 and Figure 3.1-Figure 3.12 Spinner, N.,
Zhang, L. & Mustain, W. E. Investigation of metal oxide anode degradation in lithium-ion
batteries via identical-location TEM. J. Mater. Chem. A 2, 1627–1630 (2014).

212
Figure A.6 Copyright permission for Figure 1.8 and Figure 3.1-Figure 3.12. Ng, B.,
Duan, X., Liu, F., Agar, E., White, R. E., Mustain, W. E. & Jin, X. Investigation of
Transport and Kinetic Nonideality in Solid Li-Ion Electrodes through Deconvolution of
Electrochemical Impedance Spectra. J. Electrochem. Soc. 167, 020523 (2020).

213
Figure A.7 Copyright permission for Figure 2.2 to Figure 2.5 and . Ng, B., Duan, X., Liu,
F., Agar, E., White, R. E., Mustain, W. E. & Jin, X. Investigation of Transport and Kinetic
Nonideality in Solid Li-Ion Electrodes through Deconvolution of Electrochemical
Impedance Spectra. J. Electrochem. Soc. 167, 020523 (2020).
Figure A.8 Copyright permission for Figure 1.8 and Figure 3.1-Figure 3.12. Ng, B.,
Duan, X., Liu, F., Agar, E., White, R. E., Mustain, W. E. & Jin, X. Investigation of
Transport and Kinetic Nonideality in Solid Li-Ion Electrodes through Deconvolution of
Electrochemical Impedance Spectra. J. Electrochem. Soc. 167, 020523 (2020).

214
Figure A.9 Copyright permission for Figure 5.1 to Figure 5.6. Ng, B., Faegh, E., Lateef,
S., Karakalos, S. G., Mustain, W. E. Structure and Chemistry of the Solid Electrolyte
Interphase on High Capacity Conversion-based Anodes: NiO. J. Mater. Chem. A, 2021, 9,
523

215
Figure A.10 Copyright permission for
Figure 6.1 to Figure 6.4. Ng, B., Faegh, E., Peng, X., Mustain, W. E. Using
nanoconfinement to inhibit the degradation pathways of conversion-metal oxide anodes for
highly stable fast-charging Li-ion batteries. Journal of Materials Chemistry A. (2020) 8,
2712-2727

216
Figure A.11 Copyright permission for Figure 8.5. Mandal, M., Huang, G., Hassan, N. U.,
Mustain, W. E. & Kohl, P. A. Poly(norbornene) anion conductive membranes:
homopolymer, block copolymer and random copolymer properties and performance. J.
Mater. Chem. A 8, 17568–17578 (2020).