Embed Size (px)
Citation preview

Delaware Shootings 2019
An Analysis of Incidents, Suspects, and Victims
November 2020
State of Delaware Criminal Justice Council
Statistical Analysis Center 410 Federal Street, Suite 6
Dover, Delaware 19901

Delaware Shootings 2019 An Analysis of Incidents, Suspects, and Victims
November 2020
Delaware Criminal Justice Council Christian Kervick, Executive Director
Delaware Statistical Analysis Center
Spencer Price, Director
Author Jim Salt
Research Analyst
State of Delaware Document Control # 100703-20-11-06
Please visit our website: https://sac.delaware.gov

Contents
Executive Summary ......................................................................................................................... 1
An Analysis of Delaware Shootings in 2019 .................................................................................... 4
Shooting Analysis Brief Methodology ............................................................................................. 4
Considerations and Limitations ...................................................................................................... 4
Shooting Incidents, Victims, and Suspects ..................................................................................... 6
Demographic Profile of Shooting Suspects and Victims ............................................................... 11
Demographic Profile of Shooting Incidents .................................................................................. 13
Criminal Histories of Shooting Suspects and Victims ................................................................... 15
Day and Time Analysis of 2019 Shootings in Delaware ................................................................ 17
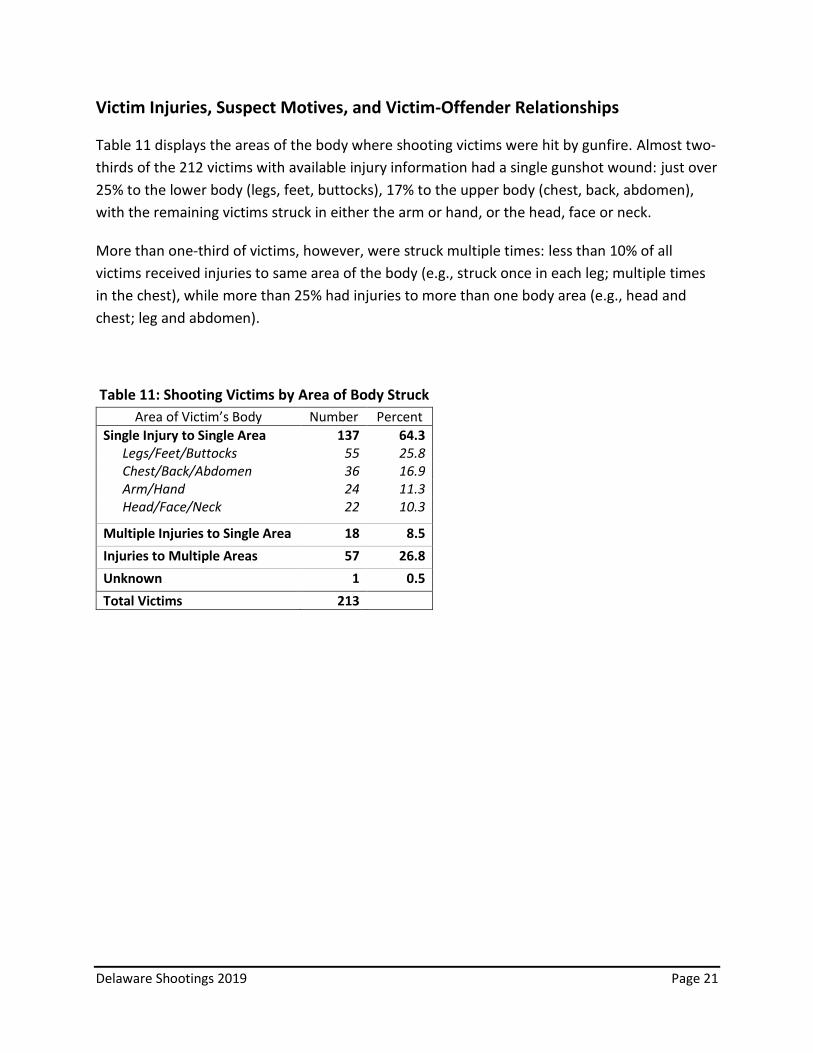
Victim Injuries, Suspect Motives, and Victim-Offender Relationships ......................................... 21
Important Issues and Considerations ........................................................................................... 24
Victim and Witness Cooperation .................................................................................................. 24
Conclusion ..................................................................................................................................... 25
Technical Appendix ....................................................................................................................... 26
Data Appendix ............................................................................................................................... 29

Delaware Shootings 2019 Page 1
Executive Summary
Delaware Shootings 2019: An Analysis of Incidents, Suspects, and Victims
This is the ninth report, covering 2019, in the Delaware Statistical Analysis Center’s statewide
shooting incident analysis effort.
Methodology: To identify incidents for inclusion in the analysis, the Center uses a variety of
methods, including monitoring media reports and police websites and exploring criminal
incident data within Delaware’s Criminal Justice Information System. These methods are
described in the Methodology section of the report.
Key Findings:
• After a marked decline in 2018, shooting incidents increased in most of the state but remain
below 2015 to 2017 levels (Figure E-1).
Figure E-1: Geographic Distribution of Shooting Incidents, 2015-2019
Delaware Shootings 2019 Page 2
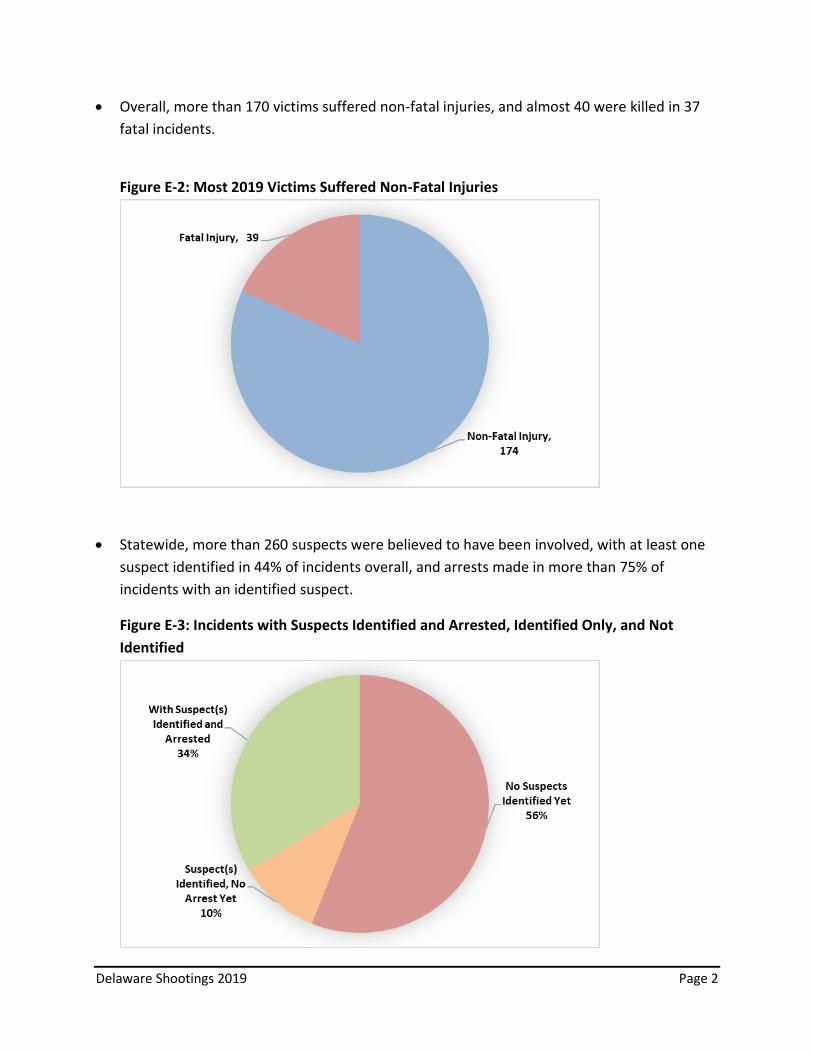
• Overall, more than 170 victims suffered non-fatal injuries, and almost 40 were killed in 37
fatal incidents.
Figure E-2: Most 2019 Victims Suffered Non-Fatal Injuries
• Statewide, more than 260 suspects were believed to have been involved, with at least one
suspect identified in 44% of incidents overall, and arrests made in more than 75% of
incidents with an identified suspect.
Figure E-3: Incidents with Suspects Identified and Arrested, Identified Only, and Not
Identified

Delaware Shootings 2019 Page 3
• Most victims and most suspects had a Delaware criminal history prior to the shooting
incident each was involved in.
Figure E-4: Most Victims and Identified Suspects Had at Least One Delaware Felony Arrest
• For suspects and victims with a Delaware arrest history, most were first arrested as
juveniles.
Figure E-5: Most Delaware First Arrests Occurred as Juveniles.

Delaware Shootings 2019 Page 4
An Analysis of Delaware Shootings in 2019
The following report is the nineth in a series examining criminal, non-accidental shooting
incidents in Delaware that resulted in the injury or death of another person. This report
examines multiple characteristics of shooting incidents, victims injured as a result, and suspects
involved, along with an examination of victim and witness cooperation with subsequent
shooting investigations. This iteration of the report includes additional examination of suspect
and arrest data, along with some stylistic changes.
For further information and background, see the Technical Appendix.
Shooting Analysis Brief Methodology
The Center actively monitors media and law enforcement agency websites throughout the year
to flag shooting incidents as they are publicly announced. This work is supplemented by an
extensive examination of data within Delaware’s Criminal Justice Information System (CJIS) to
identify additional potential incidents. All of these data are then filtered to identify incidents
where a criminal, non-accidental discharge of a firearm resulted in the death or injury of one or
more victims (whether the person struck was an intended target or a bystander). Once the final
set of qualifying incidents is identified, the additional data needed for the report are
downloaded and analyzed.
Maps of shooting incidents for the state, each county, and the cities of Wilmington and Dover
were also created. Please see Shooting Incidents in Delaware: Mapping Supplement for the
2018 and 2019 Statewide Reports, located on the SAC’s website
(https://sac.delaware.gov/crime/ ), for further detail and the methodology used to create
them.
The methodology is fully described in the Technical Appendix.
Considerations and Limitations
Criminal investigation of shooting incidents, as is typical for many violent crimes, can be
complex. As a result, the data generated can be equally complex leading to challenges in
analyzing those data. To account for simple data entry errors and information which can change
as an investigation proceeds, the Center employs various quality control measures to ensure
the final data set is complete as possible. However, it remains possible that shooting incidents
are undercounted in this report, although likely to only a very minor degree.
Delaware Shootings 2019 Page 5
A more complete discussion of considerations and limitations is included in the Technical
Appendix.
Note that this report does not address accidental shooting incidents (of one’s self or another,
excluding incidents in which a bystander was struck), intentional self-inflicted shooting
incidents, or shooting incidents determined by law enforcement investigation to be justified
(e.g., self-defense).

Delaware Shootings 2019 Page 6
Shooting Incidents, Victims, and Suspects
Incidents and Victims: This study identified 173 shooting incidents reported to Delaware’s
police agencies in 2019, up from the record-low of 144 set in 2018, but still well below 2015 to
2017 levels. These incidents resulted in the injury of 174 victims and the death of an additional
39 individuals (213 total victims). Nine incidents were related to an intimate partner
relationship, leading to the death of two victims during two of those incidents. The total
numbers of incidents and victims, broken out by geography and fatal versus non-fatal incidents,
are shown in Table 1. These totals reflect only criminal, non-accidental shootings of another
person.
Overall, almost 75% of 2019 incidents occurred in New Castle County, resulting in almost 75%
of the overall victim total. The City of Wilmington accounted for 54% of all 2019 shooting
incidents and more than half of all victims, while suburban New Castle County accounted for
almost 20% of incidents and a similar proportion of victims. Kent County accounted for just
over 20% of incidents and victims. Sussex County experienced more than 5% of incidents with a
similar proportion of victims.
Statewide, just over one out of every five incidents resulted in a fatal injury to a victim. Incident
fatality percentages generally ranged from 22% in Wilmington to 27% in Sussex County, with
Kent County the lone exception (14%).
More than 75% of the 37 fatal incidents occurred in New Castle County, with 14% in Kent
County and 8% in Sussex County. Wilmington accounted for 57% of all fatal incidents in 2019.
Fatality-related proportions can be found in Table 1.
Table 1: Incidents and Victims by County
Incidents Victims Count Count
Total Non-Fatal Fatal Percent Fatal Total Injured Killed Percent Killed
Delaware 173 136 37 21.4 213 174 39 18.3
New Castle County 125 96 29 23.2 157 126 31 24.6
Wilmington 94 73 21 22.3 120 97 23 19.2
Suburban NCC 31 23 8 25.8 37 29 8 21.6
Kent County 37 32 5 13.5 44 39 5 11.4
Sussex County 11 8 3 27.3 12 9 3 25.0
Incident and victim counts by police agency can be found in Tables A-1 and A-2 in the Data
Appendix. Figures 1 and 2 provide more information about the locations of the 2019 shooting
incidents (with 2015 through 2018 location data provided for comparison).

Delaware Shootings 2019 Page 7
Figure 1: Distribution of 2015-2019 Shooting Incidents (All Incidents)
Figure 2: Distribution of 2015-2019 Shooting Incidents Involving Homicide

Delaware Shootings 2019 Page 8
Note: Further geographic information regarding fatal and non-fatal shooting incidents in this report may be found in Shooting Incidents in Delaware: Mapping Supplement for the 2018 and 2019 Statewide Reports, located on the SAC’s website (https://sac.delaware.gov/crime/ ). This supplement contains maps for the entire state (pages 3-4), each county (pages 5-10), and the cities of Wilmington (pages 11-12) and Dover (pages 13-14).
Suspects and Arrests: A review of police complaint records shows that at least 266 suspects
were thought to be involved in the 173 incidents shown in Table 1. As of May 29, 2020, more
than 40% of incidents statewide had at least one suspect identified by name (see Table 2). The
percentages for non-fatal and fatal incidents were similar to the overall percentage.
In New Castle County, almost one-third of all Wilmington incidents and nearly 40% of incidents
in the suburban portion of the county had at least one identified suspect. Just over two-thirds
of Kent County incidents and more than 80% of Sussex County incidents (where the overall
number of incidents is very low) had an identified suspect. The percentages for non-fatal
incidents for each of the areas above were similar to their overall percentages. For the areas
with a small number of fatal incidents (suburban New Castle, Kent, and Sussex counties),
suspect-identified percentages were markedly higher than their overall and non-fatal rates. In
Wilmington, however, this rate was just under 20%.
Note to the Reader About Suspect Counts
The actual number of suspects involved in the shooting incidents cannot be determined as of the report date. A number of factors affect the suspect numbers derived from CJIS, including:
• The number of suspects in an incident may not be known or revealed to police.
• Substantial differences in victim and witness accounts of suspect information.
• In incidents where multiple suspects are identified by name or arrested, determination of who discharged a weapon or otherwise materially participated in the incident (e.g., aided in an attempt to rob a victim) may not be resolved for some time.
• In many incidents, general information about suspects (such as their general descriptions, number, age range) is clear, but their identities remain unknown even after extensive investigation.
• Victim criminal behavior during the incident that may preclude full disclosure of facts.
Each of these factors requires a different response when recording information in the complaint record and these factors can lead to an over- or undercount of suspects involved in the incident. SAC staff reviewed individual complaint records to make appropriate adjustments to the suspects count. However, it is likely that the number of suspects reported in this study undercounts the actual number of offenders who participated in the incidents.

Delaware Shootings 2019 Page 9
Table 2: Incidents with Identified Suspects and Arrests*
Total Incidents Non-Fatal Fatal
Count
With Identified Suspect
With Arrest Count
With Identified Suspect
With Arrest Count
With Identified Suspect
With Arrest
Delaware N 173 76 58 136 59 46 37 17 11
% -- 43.9 33.5 -- 43.4 33.8 -- 45.9 29.7
New Castle
N 125 42 36 96 33 29 29 9 7
% -- 33.6 28.8 -- 34.4 30.2 -- 31.0 24.1
Wilmington
N 94 30 27 73 26 23 21 4 4
% -- 31.9 28.7 -- 35.6 31.5 -- 19.0 19.0
Sub. NCC
N 31 12 9 23 7 6 8 5 3
% -- 38.7 29.0 -- 30.4 26.1 -- 62.5 37.5
Kent
N 37 25 16 32 20 13 5 5 3
% -- 67.6 43.2 -- 62.5 40.6 -- 100.0 60.0
Sussex
N 11 9 6 8 6 4 3 3 2
% -- 81.8 54.5 -- 75.0 50.0 -- 100.0 66.7
*With-Arrest counts include two incidents (one fatal) where suspects committed suicide (one at the scene, one
shortly after fleeing) and three where suspects (one responsible for two incidents) were killed in later shootings.
Overall Arrest Rates: Nearly one-third of incidents statewide had an arrest by the May
2020 date or were considered closed through an exceptional clearance (Table 2). Percentages
for non-fatal and fatal incidents were similar to the overall percentage. Five incidents (including
one fatal incident) were classified as exceptional clearances due to the death of a suspect.
In New Castle County, almost 30% of incidents overall in Wilmington and the suburban portion
of the county had an arrest. Kent and Sussex counties had arrest rates exceeding 40% and 50%,
respectively. Rates for non-fatal incidents were similar to overall rates, while those for fatal
incidents varied substantially.
Refined Arrest Rates: Overall incident arrest rates, however, do not tell a complete
story. As discussed in other sections of this report, numerous factors affect the ability of law
enforcement agencies to identify suspects and gather sufficient evidence for an arrest. When
examining arrest rates for incidents where at least one suspect has been identified, a different
picture emerges.

Delaware Shootings 2019 Page 10
Statewide, the arrest rate for all incidents where a suspect had been identified was 76%. This
percentage was slightly higher for non-fatal incidents (78%) and lower for fatal incidents (65%).
In New Castle County, refined arrest rates in Wilmington were 90% for all incidents, 89% for
non-fatal incidents, and 100% for fatal incidents. The percentages for suburban New Castle
County were 75% for all incidents, 86% for non-fatal, and 60% for fatal incidents. Sussex saw
rates of two-thirds for each incident category, while Kent had rates of 64%, 64%, and 60%,
respectively.
When interpreting the refined arrest rates for fatal incidents, keep in mind the low numbers
with identified suspects.
Individual Suspects and Arrests: Table 3 presents the count of total, identified, and
arrested suspects by incident type and geographic region. Of the 266 total suspects, nearly 100
(37%) had been identified by late May 2020, with 69 arrests. The percent of suspects identified
ranged from 27% in Wilmington to 56% in Sussex County. Suspect identification rates for non-
fatal incidents were similar to overall rates, while rates for fatal incidents ranged from 13% in
Wilmington to 100% in Sussex County (40% statewide). Suspect information by law
enforcement agency is located in Tables A-1 and A-2 in the Data Appendix.
The overall rates of arrest for identified suspects was 71% statewide, ranging from 66% in Kent
County to 82% in Wilmington. Rates for non-fatal incidents were slightly higher (75%
statewide), while fatal incident rates were generally lower (57% statewide) and more variable
between geographic regions.
Table 3: Suspect and Arrest Counts by Incident Type
Overall Non-Fatal Fatal Arrested* Total Identified Total Identified Total Identified Overall Non-Fatal Fatal
Delaware 266 97 214 76 52 21 69 57 12
New Castle 189 56 148 45 41 11 44 37 7
Wilmington 146 39 115 35 31 4 32 28 4
Sub. NCC 43 17 33 10 10 7 12 9 3
Kent 61 32 53 25 8 7 21 17 4
Sussex 16 9 13 6 3 3 6 4 2
*Arrest counts include five deceased suspects, two who died by suicide (one at the scene of a fatal shooting, one
shortly after fleeing). Two additional suspects (one responsible for two incidents) were killed in later shootings. All would otherwise have been arrested for their respective shootings, with each incident classified as an exceptional
clearance.
Delaware Shootings 2019 Page 11
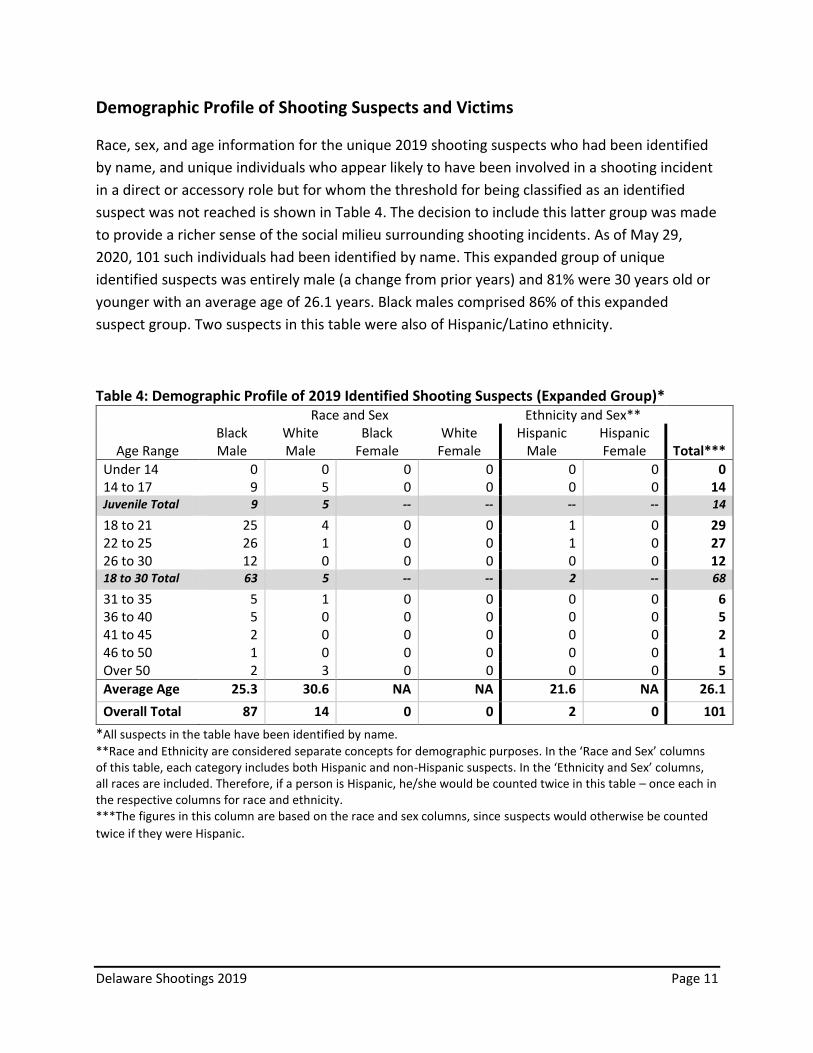
Demographic Profile of Shooting Suspects and Victims
Race, sex, and age information for the unique 2019 shooting suspects who had been identified
by name, and unique individuals who appear likely to have been involved in a shooting incident
in a direct or accessory role but for whom the threshold for being classified as an identified
suspect was not reached is shown in Table 4. The decision to include this latter group was made
to provide a richer sense of the social milieu surrounding shooting incidents. As of May 29,
2020, 101 such individuals had been identified by name. This expanded group of unique
identified suspects was entirely male (a change from prior years) and 81% were 30 years old or
younger with an average age of 26.1 years. Black males comprised 86% of this expanded
suspect group. Two suspects in this table were also of Hispanic/Latino ethnicity.
Table 4: Demographic Profile of 2019 Identified Shooting Suspects (Expanded Group)* Race and Sex Ethnicity and Sex**
Age Range Black Male
White Male
Black Female
White Female
Hispanic Male
Hispanic Female Total***
Under 14 0 0 0 0 0 0 0 14 to 17 9 5 0 0 0 0 14 Juvenile Total 9 5 -- -- -- -- 14
18 to 21 25 4 0 0 1 0 29 22 to 25 26 1 0 0 1 0 27 26 to 30 12 0 0 0 0 0 12 18 to 30 Total 63 5 -- -- 2 -- 68
31 to 35 5 1 0 0 0 0 6 36 to 40 5 0 0 0 0 0 5 41 to 45 2 0 0 0 0 0 2 46 to 50 1 0 0 0 0 0 1 Over 50 2 3 0 0 0 0 5
Average Age 25.3 30.6 NA NA 21.6 NA 26.1
Overall Total 87 14 0 0 2 0 101
*All suspects in the table have been identified by name.
**Race and Ethnicity are considered separate concepts for demographic purposes. In the ‘Race and Sex’ columns of this table, each category includes both Hispanic and non-Hispanic suspects. In the ‘Ethnicity and Sex’ columns, all races are included. Therefore, if a person is Hispanic, he/she would be counted twice in this table – once each in the respective columns for race and ethnicity. ***The figures in this column are based on the race and sex columns, since suspects would otherwise be counted
twice if they were Hispanic.

Delaware Shootings 2019 Page 12
While 56% of shooting incidents remain without an identified primary suspect, the larger
patterns observed in the incident, victim, and suspect characteristics data since 2011 suggest
that unidentified suspects in the remaining 2019 incidents would likely be very similar in
demographic characteristics to those included in Table 4.
Demographic information for the 2019 shooting victims is shown in Table 5. Most victims (86%)
were male. Overall, 65% of victims were between 18 and 35 years old with an average age of
27.5 years. Black males accounted for 78% of all shooting victims in 2019. Less than 3% of all
victims were also of Hispanic/Latino ethnicity.
Table 5: Demographic Profile of 2019 Shooting Victims
Race and Sex Ethnicity and Sex*
Age Range Black Male
White Male
Black Female
White Female
Hispanic Male
Hispanic Female Total**
Under 14 1 0 0 0 0 0 1 14 to 17 28 3 3 0 1 0 34 Juvenile Total 29 3 3 -- 1 -- 35
18 to 21 41 2 6 0 1 0 49 22 to 25 22 3 2 0 2 0 27 26 to 30 31 2 6 1 1 0 40 18 to 30 Total 94 7 14 1 4 -- 116
31 to 35 17 2 3 1 0 0 23 36 to 40 16 0 4 0 0 0 20 41 to 45 4 2 2 0 0 0 8 46 to 50 2 0 0 0 0 0 2 Over 50 5 2 1 1 1 0 9
Average Age 26.6 30.6 28.9 47.0 28.6 NA 27.5
Overall Total 167 16 27 3 6 0 213
*Race and Ethnicity are considered separate concepts for demographic purposes. In the ‘Race and Sex’ columns of this table, each category includes both Hispanic and non-Hispanic victims. In the ‘Ethnicity and Sex’ columns, all races are included. Therefore, if a person is Hispanic, he/she would be counted twice in this table – once each in the respective columns for race and ethnicity. **The figures in this column are based on the race and sex columns, since victims would otherwise be counted
twice if they were Hispanic.

Delaware Shootings 2019 Page 13
Demographic Profile of Shooting Incidents
Since a number of shootings involved multiple suspects and/or multiple victims, comparing the
total set of victims with the total set of suspects to understand the demographics of 2019
shooting incidents can be misleading. Instead, race and age data for the victims and suspects
(using the 97 suspects identified by name in Table 3) involved in each incident were examined
and then consolidated so that each incident could be assigned single categories for victim age,
victim race, suspect age, and suspect race. Each victim-suspect category pair could then be
compared and the incident categorized on the extent to which suspects and victims were
similar to or different from each other based on each pairing.
Table 6 explores the relationship between suspect and victim race based on the categories
assigned for each incident. Of the 76 incidents in 2019 where race information was available for
both named suspects and victims, eight involved multiple suspects or victims equally split
between racial categories, and therefore excluded from further analysis. For the remaining 68
incidents, (91%) involved suspects and victims who were all or mostly of the same race. This
percentage was higher for incidents that involved Black victims (96.6% of 58 incidents) and
lower for incidents involving White victims (60% of 10 incidents).
Table 6: Correlation Between Victim and Suspect Race by Incident Level
Victim Race Category Assigned to Incident
Black White Overall
Number
% of Row Total
% of Column
Total Number
% of Row Total
% of Column
Total Number
ALL Suspects and ALL Victims of Same Race 53 89.8% 91.4% 6 10.2% 60.0% 59
MAJORITY of Victims and of Suspects BOTH of Same Race 3 100% 5.2% 0 NA NA 3
Victims Shot by Suspects of DIFFERENT Race 2 33.3% 3.5% 4 66.7% 40.0% 6
Total 58 10 68

Delaware Shootings 2019 Page 14
Table 7 explores the relationship between suspect and victim age based on the categories
assigned for each incident. In 76 incidents, age information was available for both suspects and
victims. One of five broad age categories was then assigned to victims in an incident if at least a
majority belonged to the same age group. This same process was repeated for the named
suspects in each incident. For 20 incidents there was no majority age group. In 56 incidents,
each victim and suspect group could be assigned an age category and were then compared. In
the incidents where victim and suspect age categories could be compared, overall, 57% of
shooting incidents involved suspects and victims who were within the same age range
(indicated by the shaded boxes in the table). Except for the age 18 to 30 category, the
remaining groups saw only a minority of victims shot by suspects in the same age range, with
proportions ranging from 0% to 40%. Overall, 38 of the 56 incidents examined (68%) involved
suspects in the 18 to 30 age group.
Table 7: Victim-Suspect Age Correlation by Incident Level
Victim Age Category Assigned to Incident Suspect
Category Totals Under 18 18-30 31-40 41-50 Over 50
Suspect Age
Category
Assigned to
Incident
Under 18 0 3 0 1 0 4
18-30 2 24 7 3 2 38
31-40 0 1 5 0 0 6
41-50 0 0 1 1 1 3
Over 50 1 1 1 0 2 5
Victim Category Totals 3 29 14 5 5 56

Delaware Shootings 2019 Page 15
Criminal Histories of Shooting Suspects and Victims
Table 8 summarizes the Delaware criminal arrest histories for unique victims, unique shooting
suspects, and unique individuals who appear likely to have been involved in a shooting incident
in a direct or accessory role but for whom the threshold for being classified as an identified
suspect was not reached. The decision to include this latter group was made to provide a richer
sense of the social milieu surrounding shooting incidents. Most of the 101 suspects in this
expanded group (93%) and of the 209 shooting victims (88%) had an arrest history in Delaware.
Of those with such arrest histories, 82 suspects (87%) and 139 victims (76%) had at least one
felony arrest. Of those with a felony history, 66% of victims and 76% of suspects had three or
more arrests on felony charges. Note that the number of unique shooting suspects represents
less than half of the total minimum suspect count. Therefore, caution is urged when drawing
conclusions about differences between suspect and victim arrest histories. The inclusion of
additional known suspects could lead to smaller or larger differences in these patterns.
Table 8: Delaware Criminal Histories for Shooting Victims and Expanded Suspect Group
(Unique Individuals)
Unique Suspects Unique Victims
Number Percent Number Percent Known Suspects and Victims 101 209
Have Arrest History in Delaware*
94 93.1 183 87.6
>1 Arrest was for a Felony 82 87.2 139 76.0
Felony Drug Arrests 45 47.9 79 43.2
1 or 2 30 66.7 44 55.7
3 or more 15 33.3 35 44.3
Felony Weapons Arrests 59 62.8 88 48.1
1 or 2 47 79.7 72 81.8
3 or more 12 20.3 16 18.2
Other Felony Arrests 73 77.7 121 66.1
1 or 2 36 49.3 69 57.0
3 or more 37 50.7 52 43.0
Violent Felony Arrests** 79 84.0 131 71.6
1 or 2 30 38.0 63 48.1
3 or more 49 62.0 68 51.9
*Felony percentages are of those with an arrest history.
**Violent felonies included in this table are those defined in Title 11, § 4201(c) of the Delaware Code.

Delaware Shootings 2019 Page 16
More than 40% of victims and almost 50% of suspects with an arrest history had at least one
arrest for a felony drug offense. Most suspects and victims had at least one arrest for a violent
felony (as defined in Title 11, § 4201(c) of the Delaware Code, which includes certain drug and
weapons felonies) or a non-violent, non-drug-related felony (termed ‘other felony’). More than
60% of suspects and almost half of victims had at least one arrest for a felony weapons offense.
Table 9 compares the age at first contact with the Delaware criminal justice system for the
shooting suspects and victims from Table 8 who had criminal histories prior to the shooting
incident. The table shows that 89% of the 94 suspects in 2019 with histories and 79% of 183
shooting victims with histories were younger than age 18 at the time of their first arrest in
Delaware.
Table 9: Age of Suspects in Expanded Group and Victims with Delaware Arrest Histories at
First Contact with Delaware’s Criminal Justice System
Age Range Unique Suspects Unique Victims Number Percent Number Percent
Under 14 48 51.1 61 33.3
14 to 17 36 38.3 83 45.4
Juvenile Total 84 89.4 144 78.7
18 to 21 4 4.3 23 12.6
22 to 25 2 2.1 8 4.4
26 to 30 0 0 5 2.7
31 to 35 0 0 1 0.5
36 to 40 2 2.1 0 0
41 to 45 0 0 0 0
46 to 50 1 1.1 0 0
Over 50 1 1.1 2 1.1
Total with Delaware History 94 183

Delaware Shootings 2019 Page 17
Day and Time Analysis of 2019 Shootings in Delaware
Table 10 and the two figures that follow show the distribution of 2019 shooting incidents by the
day of the week and the month in which they occurred. Incidents most frequently occurred on
a Saturday (31 incidents) and least often on Wednesday (21 incidents). More shooting incidents
occurred in December (27 incidents) with the fewest occurring in April (5). For illustrative
purposes, figures for Delaware and Wilmington showing the monthly progression of shootings
for 2011 through 2019 are also included (see Figures 5 and 6).
Table 10: 2019 Shooting Incidents by Month and Day of Week
Sunday Monday Tuesday Wednesday Thursday Friday Saturday Month Total
January 1 2 3 1 3 2 2 14
February 1 1 2 0 3 2 2 11
March 1 2 1 3 3 0 3 13
April 1 0 0 2 1 1 0 5
May 3 1 0 3 3 5 3 18
June 3 0 0 0 0 0 4 7
July 2 1 1 2 3 2 2 13
August 5 2 3 2 2 2 5 21
September 3 6 2 1 2 3 1 18
October 2 3 2 3 1 1 1 13
November 0 5 0 1 0 2 5 13
December 1 5 9 3 2 4 3 27
Day Total 23 28 23 21 23 24 31 173

Delaware Shootings 2019 Page 18
Figure 3: Shooting Incidents by Day of the Week—Wilmington and Rest of Delaware
Figure 4: Shooting Incidents by Month—Wilmington and Rest of Delaware

Delaware Shootings 2019 Page 19
Figure 5: Monthly Progression of Delaware Shooting Incidents, 2011-2019
Figure 6: Monthly Progression of Wilmington Shooting Incidents, 2011-2019
Delaware Shootings 2019 Page 20
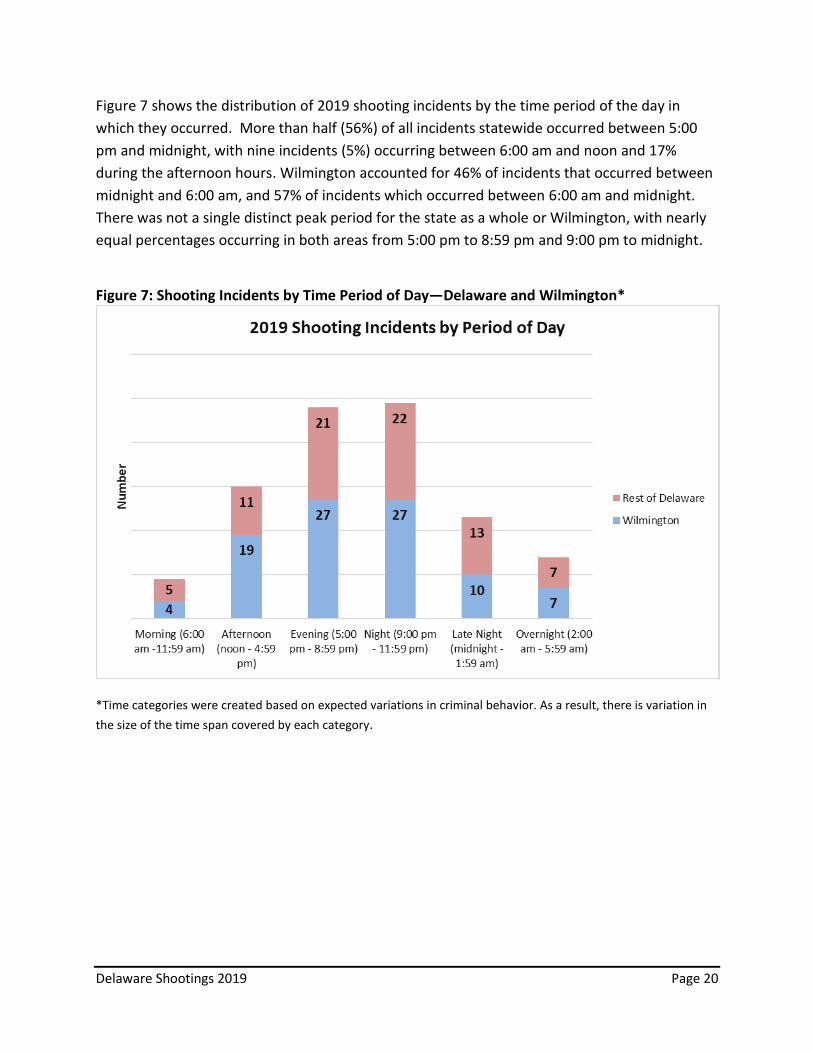
Figure 7 shows the distribution of 2019 shooting incidents by the time period of the day in
which they occurred. More than half (56%) of all incidents statewide occurred between 5:00
pm and midnight, with nine incidents (5%) occurring between 6:00 am and noon and 17%
during the afternoon hours. Wilmington accounted for 46% of incidents that occurred between
midnight and 6:00 am, and 57% of incidents which occurred between 6:00 am and midnight.
There was not a single distinct peak period for the state as a whole or Wilmington, with nearly
equal percentages occurring in both areas from 5:00 pm to 8:59 pm and 9:00 pm to midnight.
Figure 7: Shooting Incidents by Time Period of Day—Delaware and Wilmington*
*Time categories were created based on expected variations in criminal behavior. As a result, there is variation in
the size of the time span covered by each category.
Delaware Shootings 2019 Page 21
Victim Injuries, Suspect Motives, and Victim-Offender Relationships
Table 11 displays the areas of the body where shooting victims were hit by gunfire. Almost two-
thirds of the 212 victims with available injury information had a single gunshot wound: just over
25% to the lower body (legs, feet, buttocks), 17% to the upper body (chest, back, abdomen),
with the remaining victims struck in either the arm or hand, or the head, face or neck.
More than one-third of victims, however, were struck multiple times: less than 10% of all
victims received injuries to same area of the body (e.g., struck once in each leg; multiple times
in the chest), while more than 25% had injuries to more than one body area (e.g., head and
chest; leg and abdomen).
Table 11: Shooting Victims by Area of Body Struck
Area of Victim’s Body Number Percent
Single Injury to Single Area 137 64.3 Legs/Feet/Buttocks 55 25.8 Chest/Back/Abdomen 36 16.9 Arm/Hand 24 11.3 Head/Face/Neck 22 10.3
Multiple Injuries to Single Area 18 8.5
Injuries to Multiple Areas 57 26.8
Unknown 1 0.5
Total Victims 213

Delaware Shootings 2019 Page 22
The ultimate motives for committing a crime may not become apparent until well into a
criminal investigation or sometimes not even until a case is being adjudicated. Table 12 displays
information about apparent motives and/or relevant circumstances for 105 shooting incidents
where specific information about any/all motives or circumstances surrounding an incident was
available. The most common motive or circumstance was an Altercation (41%), followed by a
Drug-Related issue (34%), Robbery (17%), and Retaliation (14%). A bystander or otherwise
unintended person was struck in just over 10% of incidents.
Table 12: Motives/Circumstances Related to Shooting Incidents—Incident Level Motives/Circumstances Incidents* Percent of Incidents
Altercation/Dispute/Argument 43 41.0
Drug-related 36 34.3
Robbery 18 17.1
Retaliation 15 14.3
Bystander 12 11.4
Intimate Partner Violence 8 7.6
Other 22 21.0
Unknown, but with secondary circumstances 38 36.2
Total Where Motive/Circumstances Known 105
*Many incidents have more than one motive/circumstance; therefore, counts and percentages reflect
the inclusion of multiple motives/circumstances within an incident.
Note: Additional information about Delaware domestic violence homicides is available in the Delaware Domestic Violence Coordinating Council’s Fatal Incident Review Team Reports ( https://dvcc.delaware.gov/reports/ ).

Delaware Shootings 2019 Page 23
For the 57 incidents where at least one suspect had been identified by name (or where there
was good evidence that the victim knew the suspect) and victim-offender relationship
information was available, the relationships between all suspects and all victims involved in an
incident were examined. The victim-offender relationship for the incident was then classified
based on the closest relationship between any suspect and any victim. For example, if the
incident involved three suspects and one victim and the three offender-victim relationships
were friend, stranger, and someone known in the community, ‘friend’ would be the
relationship level assigned to the incident. This approach provides an additional way of
examining the circumstances that may have brought a shooting suspect and victim into the
proximity required for the shooting to occur.
The relationships between shooting suspects and their victims at the incident level are shown in
Table 13. The most frequent victim-to-offender relationship was Otherwise Known (42%),
followed by Acquaintance (25%). Family and Spouse/Boyfriend/Girlfriend (current/former)
relationships each comprised 12% of relationships. Note that in two of the incidents identified
as being related to intimate partner violence, the nature of the circumstances warranted a
victim-suspect relationship determination other than Spouse/Boyfriend/Girlfriend
(current/former).
Table 13: Victim to Suspect Relationship—Incident Level Type of Relationship Number Percent
Otherwise Known 24 42.1%
Acquaintance 14 24.6%
Family (e.g., sibling, parent, child, in-law) 7 12.3%
Spouse/Boyfriend/Girlfriend (current/former) 7 12.3%
Stranger 3 5.3%
Neighbor 2 3.5%
Total Where Relationship Is Known 57

Delaware Shootings 2019 Page 24
Important Issues and Considerations
Victim and Witness Cooperation
The data in this report indicate that, where specific suspects are identified by name, most are
subsequently arrested (76% statewide). However, the cooperation of shooting victims and of
witnesses to shooting incident investigations is often critical in securing the accurate
identification of suspects, and the subsequent generation of arrests and successful criminal
prosecutions.
In this shooting report, both victim and witness cooperation were explored for all incidents,
with cooperation classified at the level of the incident. Based on a review of information
available in the complaint reports, cooperation for each group was classified at one of three
levels: full cooperation, limited cooperation, or no cooperation. Where possible, statements of
police officers were used as the primary criteria in determining cooperation.
This review indicates that in 74% of incidents overall (86% where witnesses were known), at
least one witness could be classified as being fully cooperative with the investigation (Table 14).
In 40% of incidents overall (50% where a victim was able to cooperate), victims were similarly
cooperative (Table 15).
Table 14: Level of Witness Cooperation (Incident Level) Number* Percent
Full Cooperation 116 73.9
Limited Cooperation 15 9.6
Witnesses Refused to Cooperate 4 2.5
No Known Witnesses 22 14.0
Total 157
*Could not classify 16 incidents
Table 15: Level of Victim Cooperation (Incident Level) Number* Percent
Full Cooperation 59 39.6
Limited Cooperation 48 32.2
No Cooperation 11 7.4
Victim Deceased/Unable to Cooperate 31 20.8
Grand Total 149 *Could not classify 24 incidents

Delaware Shootings 2019 Page 25
Conclusion
In 2019, there were 173 criminal, non-accidental shooting incidents in Delaware that resulted in
the injury or death of another person. The year-end total was higher than the record low set
the prior year, but well below the totals for 2015-2017. More than half of all incidents (54%)
occurred in the City of Wilmington, with another 18% occurring in suburban New Castle County,
21% in Kent County, and 6% in Sussex County.
One-hundred-seventy-four individuals had non-fatal injuries as a result of these incidents, and
39 died of their wounds in 37 homicide incidents. Two victims died during two incidents related
to an intimate relationship. More than 260 individuals were suspected of involvement in the
shooting incidents, with 97 suspects identified by name. As of May 29, 2020, arrests or
exceptional clearances had been made in 34% of all shooting incidents and 32% of homicide
incidents, but 76% and 71%, respectively where at least one suspect had been identified.
Most shooting victims (86%) were male, with Blacks comprising the largest racial group of
victims (91% of all victims, 91% of male victims). For the 68 incidents where demographic
information was available for both victims and suspects, 91% involved victims and suspects who
were predominantly of the same race.
More than 85% of victims and more than 90% of identified suspects had criminal histories in
Delaware. Of those with a Delaware arrest history, 76% of victims and 87% of identified
suspects had at least one felony arrest. Most victims and identified suspects were juveniles at
the time of their first Delaware arrest (89% and 79%, respectively).
It is worth noting that the findings for gender, race, arrest history, and age at first Delaware
arrest have been highly consistent across all nine statewide shooting reports the Center has
produced, reflecting an important set of dynamics relevant to decreasing the occurrence of
shooting incidents.
An examination of the cooperation of witnesses and victims in shooting investigations indicates
that, in 74% of incidents overall (86% where witnesses were known), at least one witness could
be described as being fully cooperative. Victims had a similar level of cooperation in 40% of
incidents overall (50% where a victim was able to cooperate).
Delaware Shootings 2019 Page 26
Technical Appendix
History of the Statewide Shooting Report
The first three reports covered 2011, 2012, and 2013 and focused on multiple characteristics of
shooting incidents, victims injured as a result, and suspects involved. The 2013 report also
included an analysis of the legal status and outcomes of incidents from 2011 and 2012. The
2014 and 2015 reports built on those prior reports and included an examination of victim and
witness cooperation with subsequent shooting investigations. To reflect an apparent increase in
gang-related activity, a brief section on apparent gang involvement was added to the 2016
report, while the legal status and outcomes section was temporarily eliminated due the
complex impact of gang-related arrest and prosecution activity during 2016 and 2017 on
relevant data.
The 2017 report continued the approach taken for 2016, except that the gang-involvement
section was eliminated due to insufficient data. The 2018 edition continued the 2017 approach
as gang-involvement data remained insufficient.
Detailed Methodology
The data presented in this report were obtained from Delaware’s Criminal Justice Information
System (CJIS). First, complaint records filed by law enforcement agencies were downloaded
from CJIS for 2019. After the initial download, these records went through multiple stages of
filtering to identify incidents where a criminal, non-accidental discharge of a firearm resulted in
the death or injury of one or more victims (whether the person struck was an intended target
or a bystander). Detailed records were then reviewed individually to verify that every incident
included at least one victim who was injured or killed by a firearm through criminal, non-
accidental actions. Once all incidents had been identified, information about suspect and victim
demographics and arrest histories was downloaded from CJIS and matched with incident
information. Analyses were then conducted to examine characteristics of shooting incidents,
victims, and suspects.
To inform the process of identifying, locating, and confirming incidents within CJIS, active
monitoring of media and law enforcement agency websites was conducted throughout the year
to flag shooting incidents as they were publicly announced.

Delaware Shootings 2019 Page 27
Expanded Considerations and Limitations
Criminal investigation of shooting incidents, as is typical for many violent crimes, can be
complex. In some situations, an investigation may be quickly and definitively closed through the
clear identification and speedy arrest of a suspect. In many incidents however, much time and
effort is required to interview witnesses and victims, sort through and follow up on
investigative leads, interview persons of interest and possible suspects, and finally build a
criminal case that leads to the issuance of a warrant and eventually to an arrest. Much
information can be generated during the course of the investigation and old information can
change, particularly as the investigation moves through its early stages. In other cases, an
investigation may reveal little information—there may be no witnesses to the incident, the
victim may not be able to provide information helpful to the investigation, or, in some
situations, the victim may refuse to cooperate with the investigation.
In investigations that generate much information, law enforcement agencies must update
complaint records often, introducing numerous opportunities for errors and missing data and
creating a large amount of data for crime analysis review. In incidents where an investigation
generates little information, only limited data is available for analysis.
Occasional data issues in the complaint records submitted and maintained by law enforcement
agencies (e.g., incorrectly labeled records, missing or inaccurate information in victim, suspect,
and brief text fields, records updated after the SAC’s filtering process begins, etc.) require the
use of triangulated data sources to increase the confidence that the final data set is as
complete as possible. These data issues require extensive checking and rechecking of the data
to arrive at the final counts presented in this report. Despite these quality control measures, it
remains a possibility that shooting incidents are undercounted in this report, although likely to
only a very minor degree.
Victim and witness cooperation can also impact the Center’s ability to accurately count
shooting incidents. Occasionally, a shooting investigation will locate a scene complete with
blood and spent casings; however, no victim can be located, despite a canvas of hospitals in
Delaware and the surrounding states. In some of these cases, the potential victim’s injuries may
have been minor enough that they chose not to seek treatment at a medical facility. Based on
reports of victim behavior, it is also possible that a victim presented for medical treatment but
was effective in deceiving medical personal regarding the nature and cause of the injury,
knowing that hospitals would have to report a suspected shooting incident to police.
Additionally, in some incidents where injuries have been minor or where the nature of the
wound raised questions about whether the injury was the result of a qualifying incident, a lack
of cooperation made it challenging for the Center to classify the incident. In such cases the

Delaware Shootings 2019 Page 28
Center followed the best available information: determinations by medical personnel, police
statements, or absent both of these, the preponderance of information. As a result of these
issues and this process, the determinations for some incidents may not reflect the unknown
truth. However, in the Center’s experience, incidents included and excluded through the
determination process generally balance each other balance each other out (i.e., there is
minimal net effect on the final counts).

Delaware Shootings 2019 Page 29
Data Appendix
Table A-1: Incidents, Victims, and Suspects by County
Shootings in 2019 by Reporting Agency
County Agency Incidents Victims
Suspects
All Suspects
Identified by Name
Incidents with an Arrest
(Individual Arrests)*
New
Cas
tle
Wilmington Police Dept. 94 120 146 39 27 (32)
Suburban New Castle County 31 37 43 17 9 (12)
New Castle County PD 22 24 32 14 7 (10)
Delaware State Police Trp. 1 3 5 4 1 1 (1)
DSP Troop 2 2 4 3 0 0
DSP Troop 6 2 2 2 0 0
DSP Troop 9 1 1 1 1 1 (1)
Newark Police Dept. 1 1 1 1 0
New Castle County Total 125 157 189 56 36 (44)
Ke
nt
Dover Police Dept. 23 28 40 22 13 (17)
DSP Troop 3 9 11 14 4 2 (2)
Harrington Police Dept. 3 3 3 3 0
DSP Troop 9 1 1 3 3 1 (2)
Smyrna Police Dept. 1 1 1 0 0
Kent County Total 37 44 61 32 16 (21)
Suss
ex
DSP Troop 5 6 6 11 4 2 (2)
DSP Troop 4 1 1 1 1 1 (1)
DSP Troop 7 1 1 1 1 0
Bridgeville Police Dept. 1 2 1 1 1 (1)
Georgetown Police Dept. 1 1 1 1 1 (1)
Seaford Police Dept. 1 1 1 1 1 (1)
Sussex County Total 11 12 16 9 6 (6)
Statewide Total 173 213 266 97 56 (69) *Arrest counts include five deceased suspects, two who died by suicide (one at shooting scene, one shortly after fleeing). Two additional suspects (one responsible for two incidents) were killed in later shootings. All would otherwise have been arrested for their respective shootings, with each incident classified as an exceptional clearance.

Delaware Shootings 2019 Page 30
Table A-2: Fatal Shootings by Reporting Agency
Fatal Shootings in 2019 by Reporting Agency
County Agency Incidents Victims
Suspects
All Suspects
Identified By Name
Incidents with an Arrest
(Individual Arrests)*
New
Cas
tle
Wilmington Police Dept. 21 23 31 4 4 (4)
Suburban New Castle County 8 8 10 7 3 (3)
New Castle County PD 4 4 6 4 1 (1)
DSP Troop 1 2 2 2 1 1 (1)
DSP Troop 9 1 1 1 1 1 (1)
Newark Police Dept. 1 1 1 1 0
New Castle County Total 29 31 41 11 7 (7)
Ke
nt
Dover Police Dept. 2 2 3 2 2 (2)
Harrington Police Dept. 2 2 2 2 0
DSP Troop 9 1 1 3 3 1 (2)
Kent County Total 5 5 8 7 3 (4)
Suss
ex DSP Troop 5 3 3 3 3 2 (2)
Sussex County Total 3 3 3 3 2 (2)
Statewide Total 37 39 52 21 11 (12) *The arrest counts include one deceased suspect who would otherwise have been arrested for committing the shooting, with the incident classified as an exceptional clearance.