Embed Size (px)
Citation preview
A CX leader’s guide to integrating X- and O-data
DELIVER MORE VALUE WITHX- AND O-DATA
2
OPERATIONAL DATA AND EXPERIENCE DATA . . . . . . . . . . . . . . . 3
THE VALUE . . . . . . . . . . . . . . . . . . . . . . . . . . . . . 4
MAKING IT WORK . . . . . . . . . . . . . . . . . . . . . . . . . . 6STAGE 1: O-DATA INVENTORY AND XM DESIGN . . . . . . . . . . . . . . . . . . . . . . . . . . . . . . . 8
STAGE 2: O-DATA PREP/ACQUISITION AND X-DATA COLLECTION . . . . . . . . . . . . . . . . . . . . . . . 9
STAGE 3: OPERATIONAL DRIVERS AND EXPERIENCE DRIVERS . . . . . . . . . . . . . . . . . . . . . . . . 10
STAGE 4: X+O ALERTS . . . . . . . . . . . . . . . . . . . . . . . . . . . . . . . . . . . . . . . . . . 11
STAGE 5: X+O PERSONALIZE . . . . . . . . . . . . . . . . . . . . . . . . . . . . . . . . . . . . . . . 12
STAGE 6: X+O ROI . . . . . . . . . . . . . . . . . . . . . . . . . . . . . . . . . . . . . . . . . . . 13
COMMON OBSTACLES . . . . . . . . . . . . . . . . . . . . . . . . 14
THE WALKER DIFFERENCE . . . . . . . . . . . . . . . . . . . . . . 15
TABLE OF CONTENTS
Copyright ©2020 Walker Information, Inc. All rights reserved.
Walker is an experience management (XM) services firm. We specialize in helping today’s companies build and maintain a competitive advantage by delivering exceptional experiences.
3
Admittedly, X- and O-data integration can be a
tough concept to grasp, with many companies
failing to execute simply because they have
trouble seeing why it makes sense and how it
adds value. Stepping outside the business arena,
consider an analogy from healthcare. Every visit
to a doctor starts with a series of checks such
as body temperature, blood pressure, heart rate
and more – all forms of O-data. But then the
doctor gathers the patient’s personal feedback
regarding how they feel – the X-data. This
patient input might prompt the doctor to gather
additional O-data – perhaps a blood test or
diagnostic exam – to get a complete picture.
In business, a well-executed marriage of X and
O works in a similar way. With deliberate upfront
planning, insightful X- and O-data integration
paints the full picture, setting the stage for more
effective data-driven decision-making and the
robust improvements that enhance customer
experiences and ultimately drive business
success.
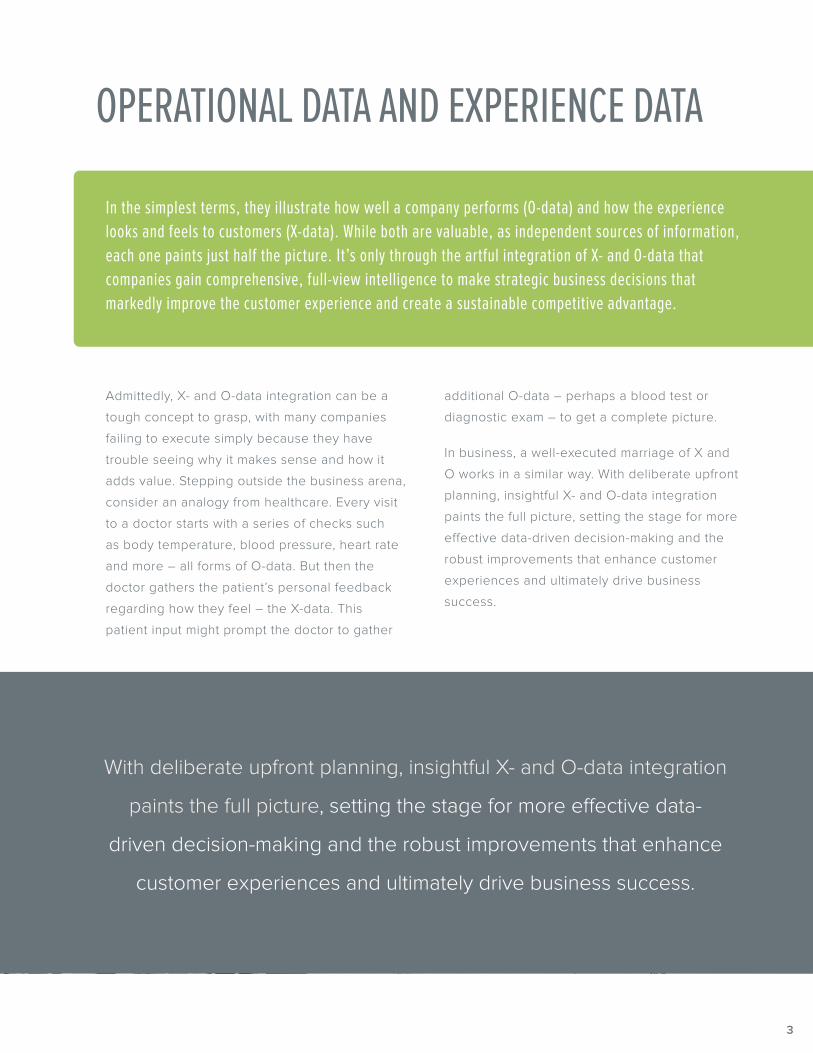
In the simplest terms, they illustrate how well a company performs (O-data) and how the experience looks and feels to customers (X-data). While both are valuable, as independent sources of information, each one paints just half the picture. It’s only through the artful integration of X- and O-data that companies gain comprehensive, full-view intelligence to make strategic business decisions that markedly improve the customer experience and create a sustainable competitive advantage.
OPERATIONAL DATA AND EXPERIENCE DATA
With deliberate upfront planning, insightful X- and O-data integration
paints the full picture, setting the stage for more effective data-
driven decision-making and the robust improvements that enhance
customer experiences and ultimately drive business success.
4
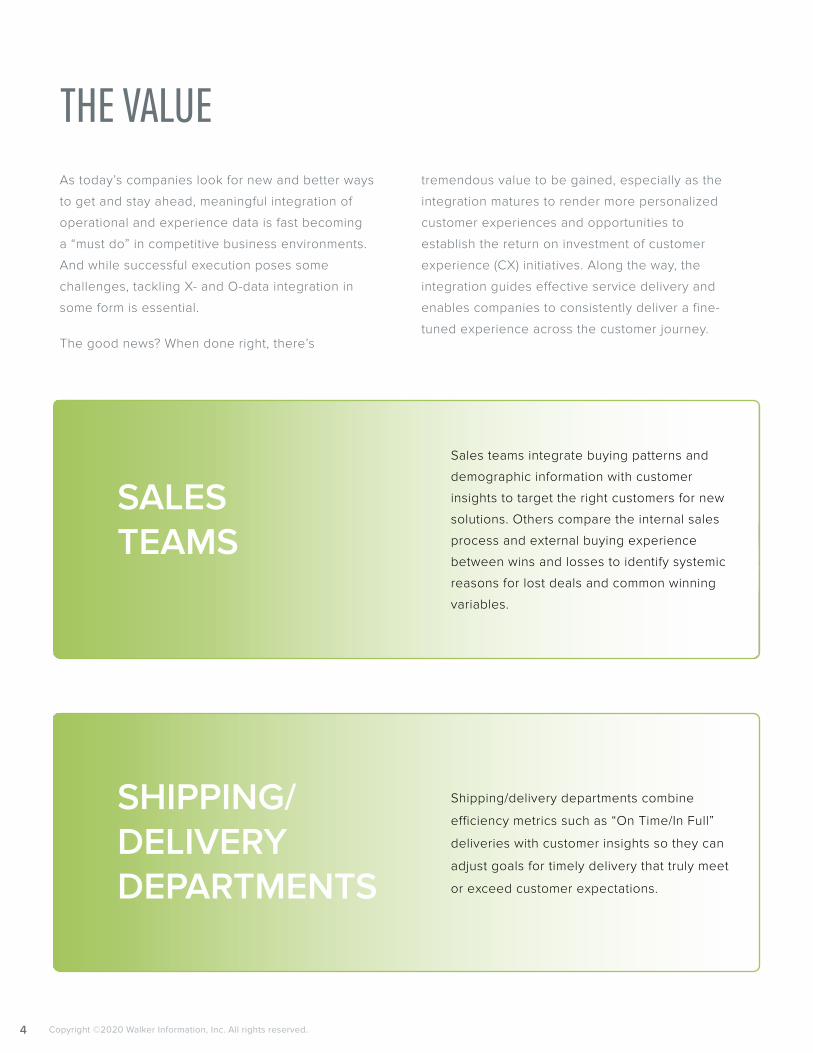
Sales teams integrate buying patterns and
demographic information with customer
insights to target the right customers for new
solutions. Others compare the internal sales
process and external buying experience
between wins and losses to identify systemic
reasons for lost deals and common winning
variables.
SALES TEAMS
THE VALUE
Copyright ©2020 Walker Information, Inc. All rights reserved.
As today’s companies look for new and better ways
to get and stay ahead, meaningful integration of
operational and experience data is fast becoming
a “must do” in competitive business environments.
And while successful execution poses some
challenges, tackling X- and O-data integration in
some form is essential.
The good news? When done right, there’s
tremendous value to be gained, especially as the
integration matures to render more personalized
customer experiences and opportunities to
establish the return on investment of customer
experience (CX) initiatives. Along the way, the
integration guides effective service delivery and
enables companies to consistently deliver a fine-
tuned experience across the customer journey.
Shipping/delivery departments combine
efficiency metrics such as “On Time/In Full”
deliveries with customer insights so they can
adjust goals for timely delivery that truly meet
or exceed customer expectations.
SHIPPING/ DELIVERY DEPARTMENTS

5
Early on, however, X- and O-data integration helps
companies ensure their internal metrics align with
customer expectations. This can be accomplished in
functional areas across the organization.
Aligning internal metrics (O-data) with customer
expectations (X-data) is just one of the valuable
outcomes of data integration. The process also
enables companies to identify key experience and
operational drivers that expand the organization’s
understanding of the symptoms and causes of
both customer experience failures and operational
inefficiencies.
Contact centers do a better job of exceeding
customer expectations and preferences by
combining customer insights with metrics, such
as first-call resolution, average resolution time,
adherence to service level agreements (SLAs)
and number of transfers/handoffs.
CONTACT CENTERS
Account management uses loyalty metrics
along with revenue figures and renewal
metrics to develop more accurate forecasts,
identify at-risk customers and target customers
poised for upsell.
ACCOUNTMANAGEMENT
6
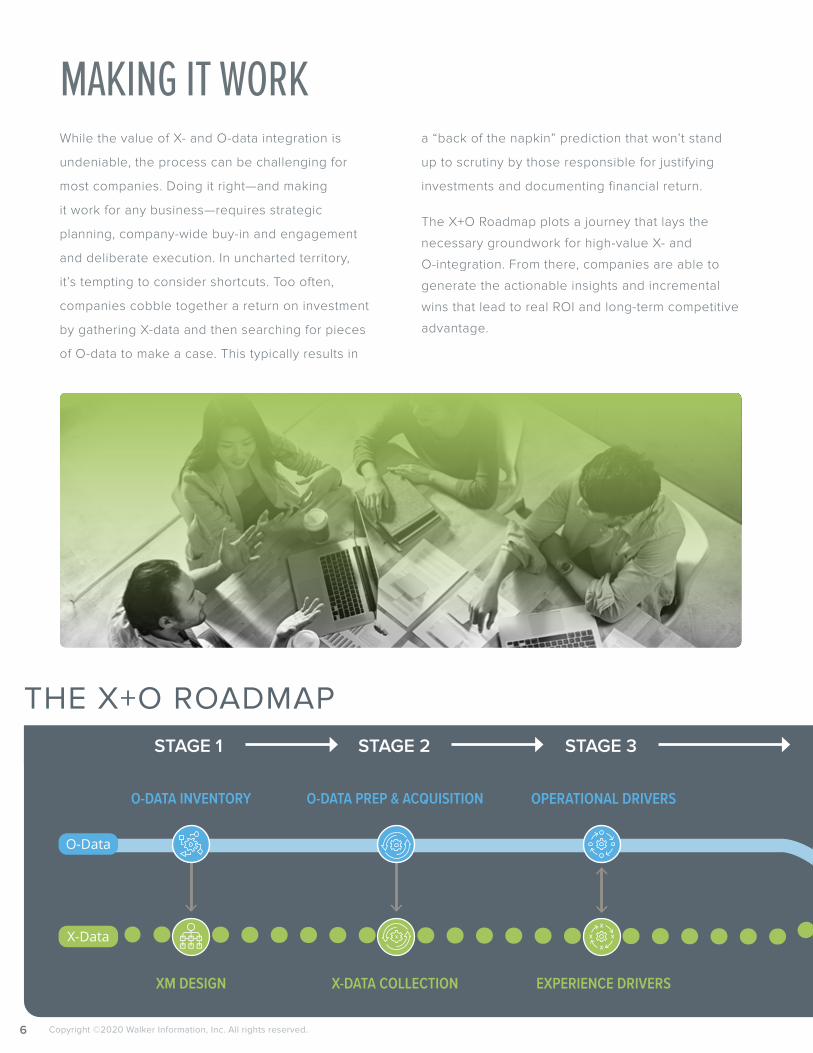
O-DATA INVENTORY O-DATA PREP & ACQUISITION OPERATIONAL DRIVERS
XM DESIGN X-DATA COLLECTION EXPERIENCE DRIVERS
STAGE 1 STAGE 2 STAGE 3
O-DataInventory
XMDesign
O-Data Prep& Acquisition
OperationalDrivers
X-Data Collection
ExperienceDrivers
X+OAlerts
X+OPersonalize
X+OROI
X-Data
O-Data
6
While the value of X- and O-data integration is
undeniable, the process can be challenging for
most companies. Doing it right—and making
it work for any business—requires strategic
planning, company-wide buy-in and engagement
and deliberate execution. In uncharted territory,
it’s tempting to consider shortcuts. Too often,
companies cobble together a return on investment
by gathering X-data and then searching for pieces
of O-data to make a case. This typically results in
a “back of the napkin” prediction that won’t stand
up to scrutiny by those responsible for justifying
investments and documenting financial return.
The X+O Roadmap plots a journey that lays the
necessary groundwork for high-value X- and
O-integration. From there, companies are able to
generate the actionable insights and incremental
wins that lead to real ROI and long-term competitive
advantage.
MAKING IT WORK
THE X+O ROADMAP
Copyright ©2020 Walker Information, Inc. All rights reserved.
7
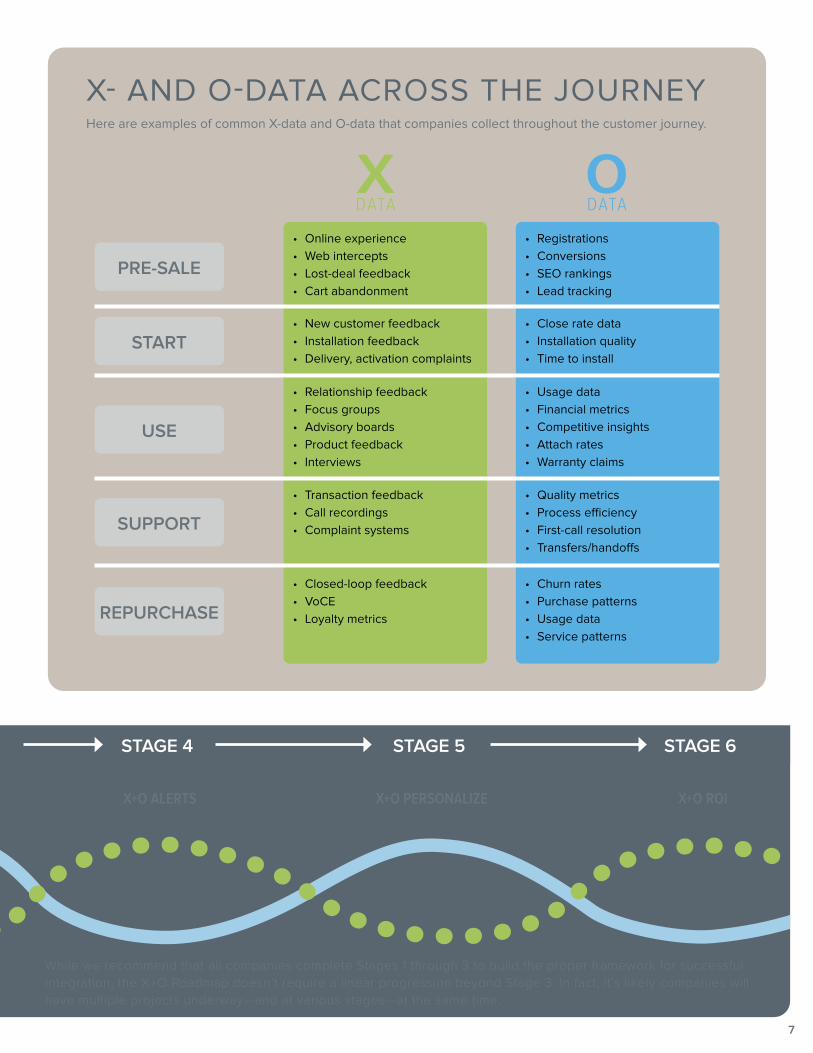
While we recommend that all companies complete Stages 1 through 3 to build the proper framework for successful integration, the X+O Roadmap doesn’t require a linear progression beyond Stage 3. In fact, it’s likely companies will have multiple projects underway—and at various stages—at the same time.
O-DataInventory
XMDesign
O-Data Prep& Acquisition
OperationalDrivers
X-Data Collection
ExperienceDrivers
X+OAlerts
X+OPersonalize
X+OROI
X-Data
O-Data
X+O ALERTS X+O PERSONALIZE X+O ROI
STAGE 4 STAGE 5 STAGE 6
7
Here are examples of common X-data and O-data that companies collect throughout the customer journey.
X- AND O-DATA ACROSS THE JOURNEY
PRE-SALE
X DATA
O DATA
START
USE
SUPPORT
REPURCHASE
• Online experience• Web intercepts• Lost-deal feedback• Cart abandonment
• Registrations• Conversions• SEO rankings• Lead tracking
• New customer feedback• Installation feedback• Delivery, activation complaints
• Close rate data• Installation quality• Time to install
• Relationship feedback• Focus groups• Advisory boards• Product feedback• Interviews
• Usage data• Financial metrics• Competitive insights• Attach rates• Warranty claims
• Transaction feedback• Call recordings• Complaint systems
• Quality metrics• Process efficiency• First-call resolution• Transfers/handoffs
• Closed-loop feedback• VoCE• Loyalty metrics
• Churn rates• Purchase patterns• Usage data• Service patterns
8
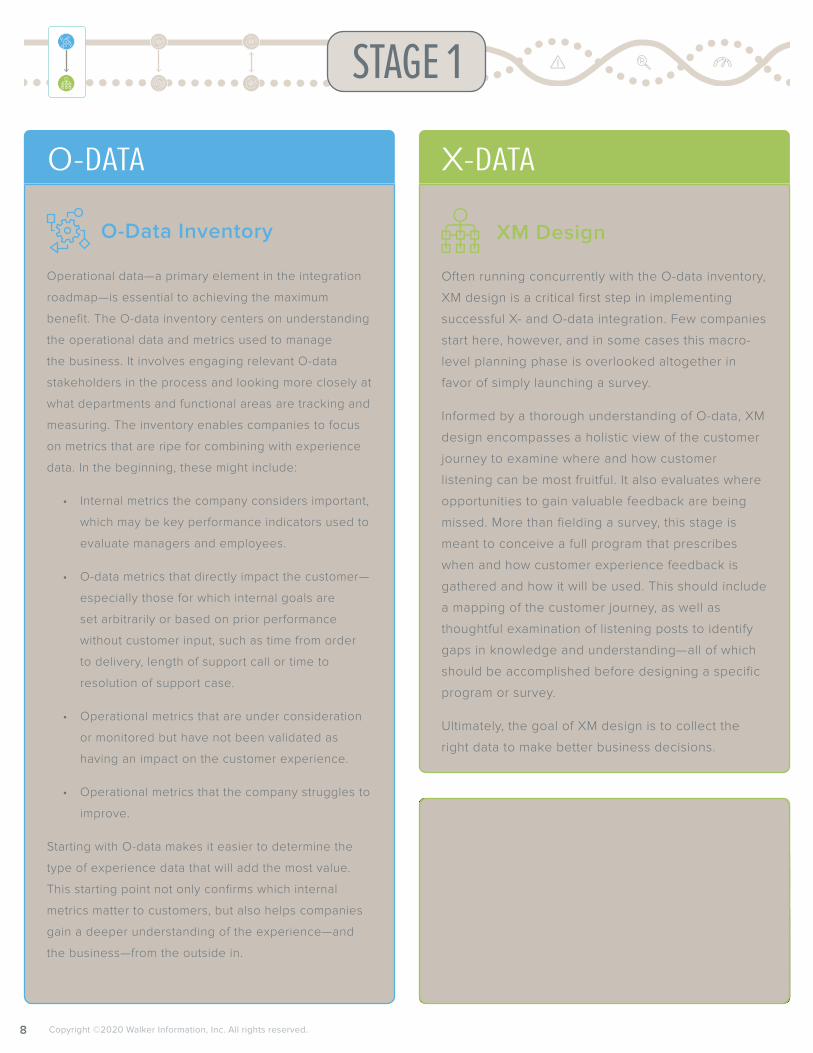
STAGE 1
Copyright ©2020 Walker Information, Inc. All rights reserved.
Often running concurrently with the O-data inventory,
XM design is a critical first step in implementing
successful X- and O-data integration. Few companies
start here, however, and in some cases this macro-
level planning phase is overlooked altogether in
favor of simply launching a survey.
Informed by a thorough understanding of O-data, XM
design encompasses a holistic view of the customer
journey to examine where and how customer
listening can be most fruitful. It also evaluates where
opportunities to gain valuable feedback are being
missed. More than fielding a survey, this stage is
meant to conceive a full program that prescribes
when and how customer experience feedback is
gathered and how it will be used. This should include
a mapping of the customer journey, as well as
thoughtful examination of listening posts to identify
gaps in knowledge and understanding—all of which
should be accomplished before designing a specific
program or survey.
Ultimately, the goal of XM design is to collect the
right data to make better business decisions.
XM Design
X-DATA
Operational data—a primary element in the integration
roadmap—is essential to achieving the maximum
benefit. The O-data inventory centers on understanding
the operational data and metrics used to manage
the business. It involves engaging relevant O-data
stakeholders in the process and looking more closely at
what departments and functional areas are tracking and
measuring. The inventory enables companies to focus
on metrics that are ripe for combining with experience
data. In the beginning, these might include:
• Internal metrics the company considers important,
which may be key performance indicators used to
evaluate managers and employees.
• O-data metrics that directly impact the customer—
especially those for which internal goals are
set arbitrarily or based on prior performance
without customer input, such as time from order
to delivery, length of support call or time to
resolution of support case.
• Operational metrics that are under consideration
or monitored but have not been validated as
having an impact on the customer experience.
• Operational metrics that the company struggles to
improve.
Starting with O-data makes it easier to determine the
type of experience data that will add the most value.
This starting point not only confirms which internal
metrics matter to customers, but also helps companies
gain a deeper understanding of the experience—and
the business—from the outside in.
O-Data Inventory
O-DATA
9
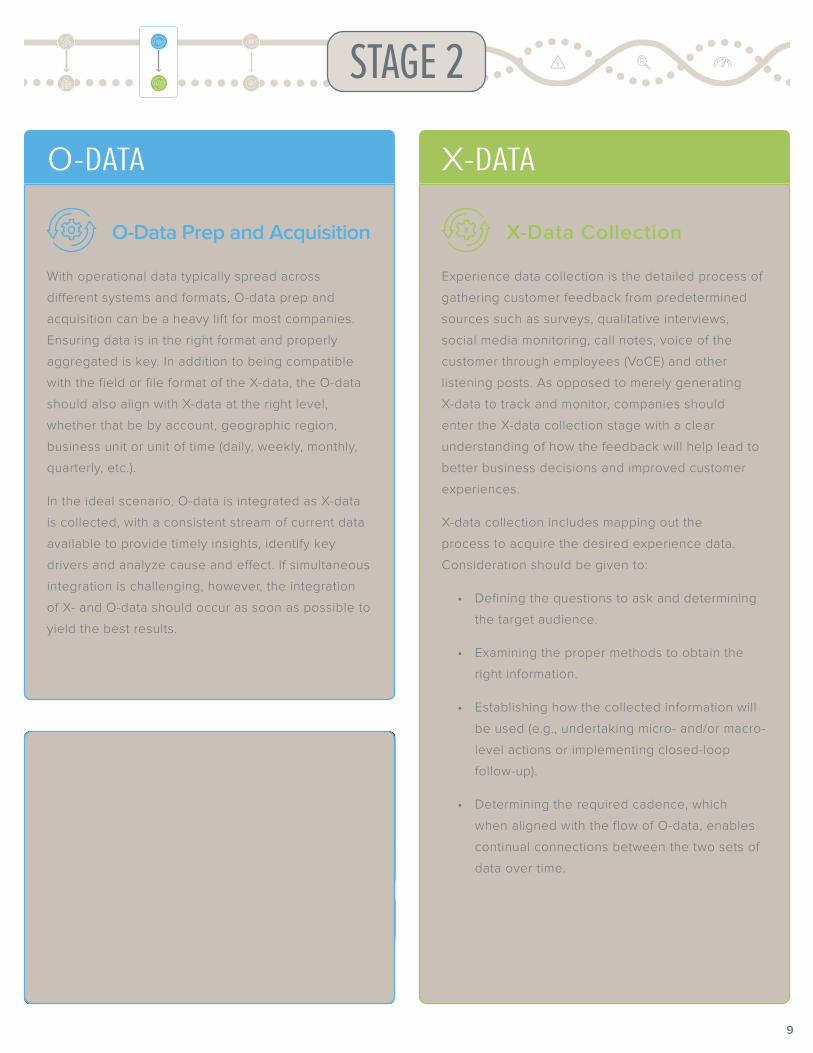
With operational data typically spread across
different systems and formats, O-data prep and
acquisition can be a heavy lift for most companies.
Ensuring data is in the right format and properly
aggregated is key. In addition to being compatible
with the field or file format of the X-data, the O-data
should also align with X-data at the right level,
whether that be by account, geographic region,
business unit or unit of time (daily, weekly, monthly,
quarterly, etc.).
In the ideal scenario, O-data is integrated as X-data
is collected, with a consistent stream of current data
available to provide timely insights, identify key
drivers and analyze cause and effect. If simultaneous
integration is challenging, however, the integration
of X- and O-data should occur as soon as possible to
yield the best results.
O-Data Prep and Acquisition
O-DATA
STAGE 2
Experience data collection is the detailed process of
gathering customer feedback from predetermined
sources such as surveys, qualitative interviews,
social media monitoring, call notes, voice of the
customer through employees (VoCE) and other
listening posts. As opposed to merely generating
X-data to track and monitor, companies should
enter the X-data collection stage with a clear
understanding of how the feedback will help lead to
better business decisions and improved customer
experiences.
X-data collection includes mapping out the
process to acquire the desired experience data.
Consideration should be given to:
• Defining the questions to ask and determining
the target audience.
• Examining the proper methods to obtain the
right information.
• Establishing how the collected information will
be used (e.g., undertaking micro- and/or macro-
level actions or implementing closed-loop
follow-up).
• Determining the required cadence, which
when aligned with the flow of O-data, enables
continual connections between the two sets of
data over time.
X-Data Collection
X-DATA
10
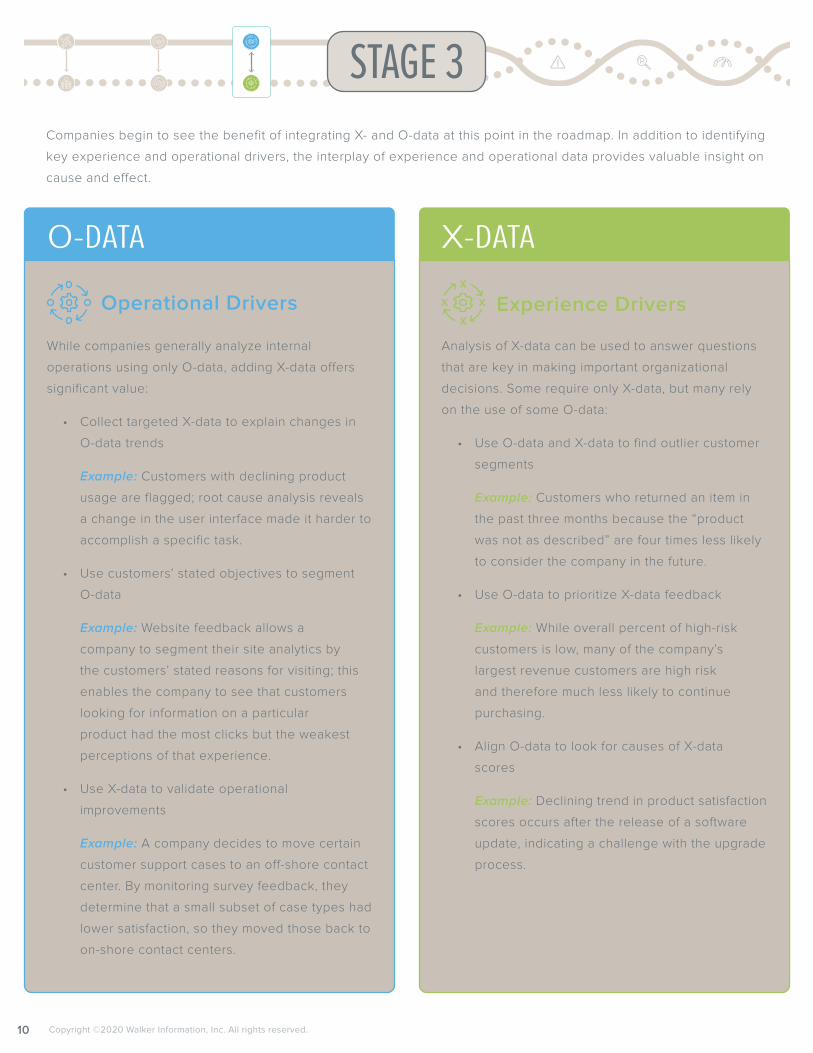
While companies generally analyze internal
operations using only O-data, adding X-data offers
significant value:
• Collect targeted X-data to explain changes in
O-data trends
Example: Customers with declining product
usage are flagged; root cause analysis reveals
a change in the user interface made it harder to
accomplish a specific task.
• Use customers’ stated objectives to segment
O-data
Example: Website feedback allows a
company to segment their site analytics by
the customers’ stated reasons for visiting; this
enables the company to see that customers
looking for information on a particular
product had the most clicks but the weakest
perceptions of that experience.
• Use X-data to validate operational
improvements
Example: A company decides to move certain
customer support cases to an off-shore contact
center. By monitoring survey feedback, they
determine that a small subset of case types had
lower satisfaction, so they moved those back to
on-shore contact centers.
O-DATA
Operational Drivers
Companies begin to see the benefit of integrating X- and O-data at this point in the roadmap. In addition to identifying
key experience and operational drivers, the interplay of experience and operational data provides valuable insight on
cause and effect.
Analysis of X-data can be used to answer questions
that are key in making important organizational
decisions. Some require only X-data, but many rely
on the use of some O-data:
• Use O-data and X-data to find outlier customer
segments
Example: Customers who returned an item in
the past three months because the “product
was not as described” are four times less likely
to consider the company in the future.
• Use O-data to prioritize X-data feedback
Example: While overall percent of high-risk
customers is low, many of the company’s
largest revenue customers are high risk
and therefore much less likely to continue
purchasing.
• Align O-data to look for causes of X-data
scores
Example: Declining trend in product satisfaction
scores occurs after the release of a software
update, indicating a challenge with the upgrade
process.
X-DATA
Experience Drivers
STAGE 3
Copyright ©2020 Walker Information, Inc. All rights reserved.
11
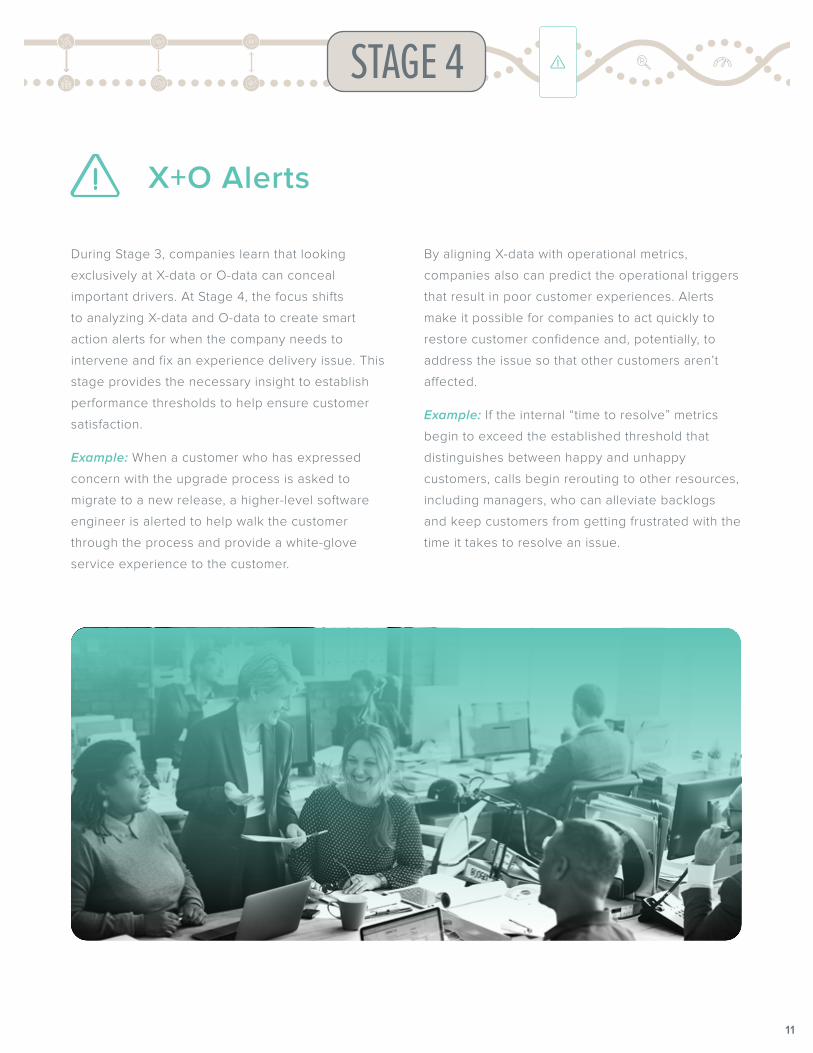
During Stage 3, companies learn that looking
exclusively at X-data or O-data can conceal
important drivers. At Stage 4, the focus shifts
to analyzing X-data and O-data to create smart
action alerts for when the company needs to
intervene and fix an experience delivery issue. This
stage provides the necessary insight to establish
performance thresholds to help ensure customer
satisfaction.
Example: When a customer who has expressed
concern with the upgrade process is asked to
migrate to a new release, a higher-level software
engineer is alerted to help walk the customer
through the process and provide a white-glove
service experience to the customer.
By aligning X-data with operational metrics,
companies also can predict the operational triggers
that result in poor customer experiences. Alerts
make it possible for companies to act quickly to
restore customer confidence and, potentially, to
address the issue so that other customers aren’t
affected.
Example: If the internal “time to resolve” metrics
begin to exceed the established threshold that
distinguishes between happy and unhappy
customers, calls begin rerouting to other resources,
including managers, who can alleviate backlogs
and keep customers from getting frustrated with the
time it takes to resolve an issue.
X+O Alerts
STAGE 4
12
STAGE 5
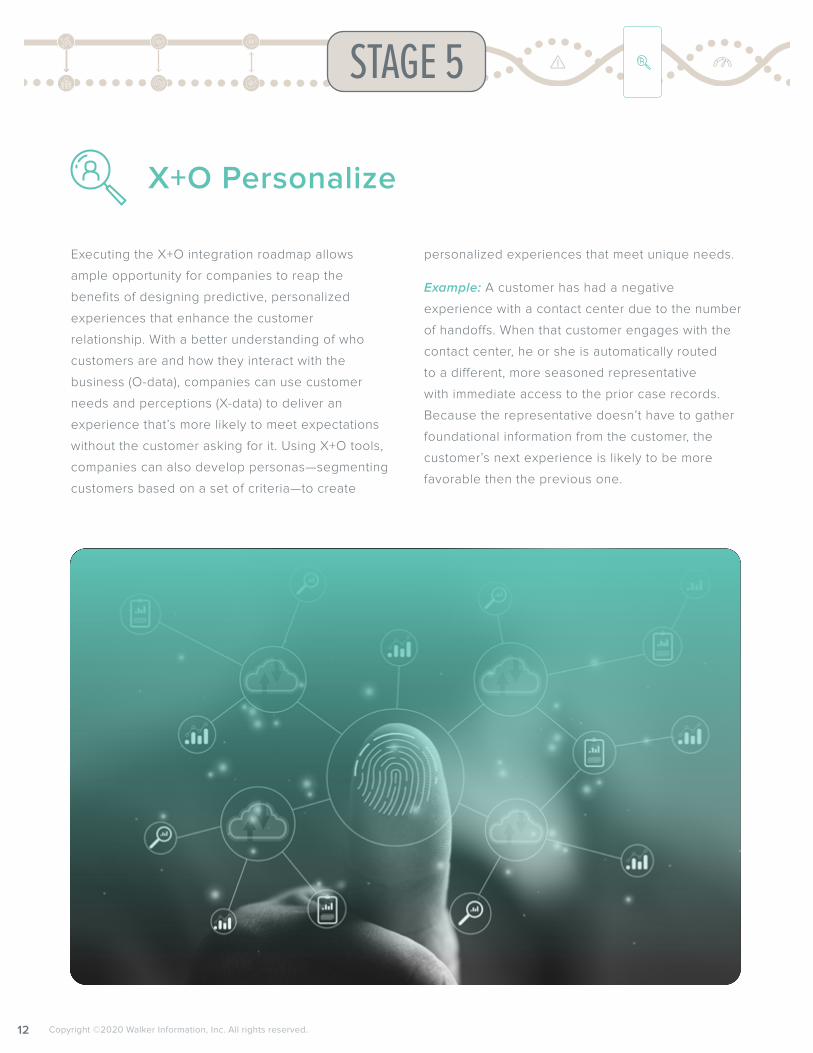
Executing the X+O integration roadmap allows
ample opportunity for companies to reap the
benefits of designing predictive, personalized
experiences that enhance the customer
relationship. With a better understanding of who
customers are and how they interact with the
business (O-data), companies can use customer
needs and perceptions (X-data) to deliver an
experience that’s more likely to meet expectations
without the customer asking for it. Using X+O tools,
companies can also develop personas—segmenting
customers based on a set of criteria—to create
personalized experiences that meet unique needs.
Example: A customer has had a negative
experience with a contact center due to the number
of handoffs. When that customer engages with the
contact center, he or she is automatically routed
to a different, more seasoned representative
with immediate access to the prior case records.
Because the representative doesn’t have to gather
foundational information from the customer, the
customer’s next experience is likely to be more
favorable then the previous one.
X+O Personalize
Copyright ©2020 Walker Information, Inc. All rights reserved.
13
STAGE 6
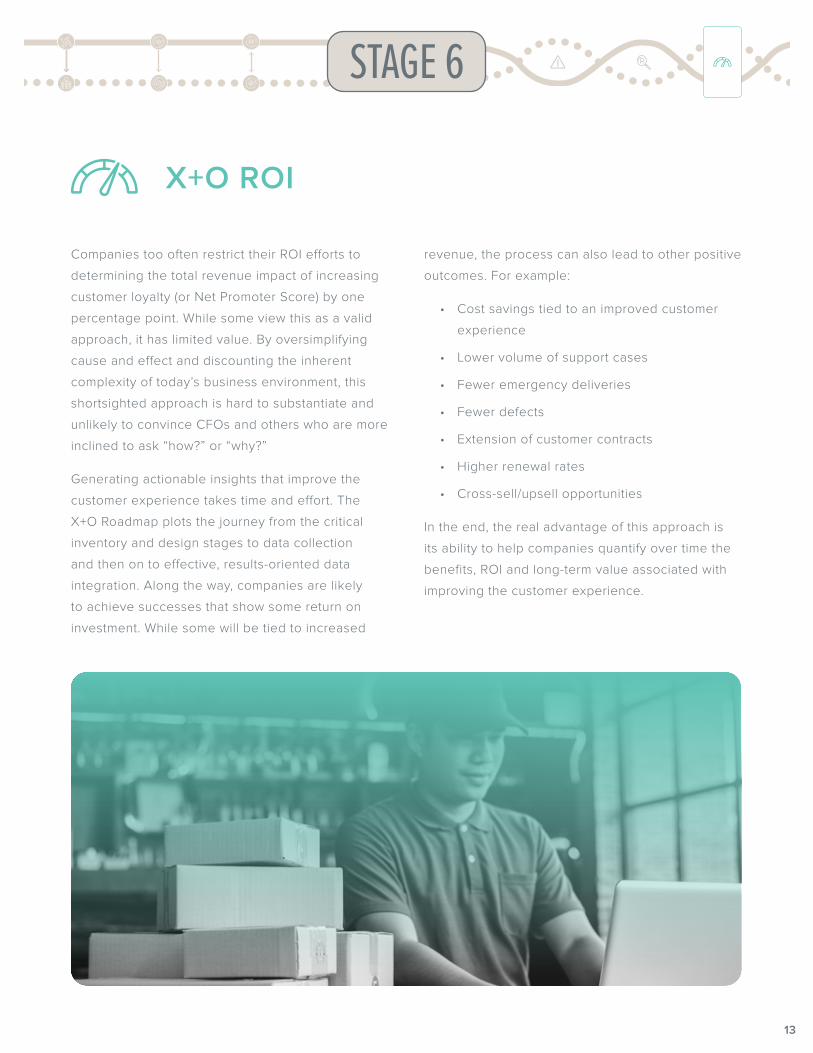
Companies too often restrict their ROI efforts to
determining the total revenue impact of increasing
customer loyalty (or Net Promoter Score) by one
percentage point. While some view this as a valid
approach, it has limited value. By oversimplifying
cause and effect and discounting the inherent
complexity of today’s business environment, this
shortsighted approach is hard to substantiate and
unlikely to convince CFOs and others who are more
inclined to ask “how?” or “why?”
Generating actionable insights that improve the
customer experience takes time and effort. The
X+O Roadmap plots the journey from the critical
inventory and design stages to data collection
and then on to effective, results-oriented data
integration. Along the way, companies are likely
to achieve successes that show some return on
investment. While some will be tied to increased
revenue, the process can also lead to other positive
outcomes. For example:
• Cost savings tied to an improved customer
experience
• Lower volume of support cases
• Fewer emergency deliveries
• Fewer defects
• Extension of customer contracts
• Higher renewal rates
• Cross-sell/upsell opportunities
In the end, the real advantage of this approach is
its ability to help companies quantify over time the
benefits, ROI and long-term value associated with
improving the customer experience.
X+O ROI
14
COMMON OBSTACLESGathering the right data and using it in the right way
are imperative to achieving optimal success with
an X+O strategy. Even with a roadmap, it’s easy to
veer off course chasing data-related issues that
can be cumbersome and complicated, especially in
complex organizations. Particularly in the first two
stages of the integration roadmap—O-data inventory
and O-data prep and acquisition—companies may
encounter obstacles as they procure, manage and
organize their operational data.
Derailed by data
We mentioned earlier that it’s best to start with
O-data when implementing an X+O strategy. And
while it’s the ideal entry point, this is also where
companies are likely to run into barriers related to:
Accessibility. There is a tendency for data to
be siloed across multiple functional areas and
departments. Building a cross-functional network
and gaining buy-in are critical. Completing
a comprehensive O-data inventory is best
accomplished by engaging with various O-data
stakeholders to enlist a network of allies and
advocates.
Accuracy. For the best results, data needs to be
continually updated. It’s important to link back to
the source data and avoid creating redundant or
duplicate processes.
Completeness. It’s not uncommon for customer
data to be incomplete, especially the data fields that
are entered by account management. These may
include the customer contact’s management level or
whether the customer represents a strategic or new
account. One way to help address this concern is to
create initiatives or motivational campaigns targeted
to account management teams to ensure data fields
are complete and all customers are covered.
Continuity. X- and O-data integration shouldn’t be
considered a single point-in-time activity. There
are advantages in being able to identify and
analyze patterns in the data over long periods of
time. For example, there may be a lag between
when something is noticed internally and when
it’s realized by customers. A better understanding
of lag times helps companies be more proactive
with communications to improve the customer
experience. A long lag time presents an opportunity
for targeted communications to ensure customers
are aware of what has been changed and how it
impacts them. Overall, automating the processes will
help address data continuity issues, allowing for a
stream of fresh data, not a drip.
Aggregation. Data can exist at a variety of disparate
levels—individual, business unit, geography,
account, etc. This can make it difficult to aggregate
and join data, especially if customers are identified
or named differently across data sources. It’s
beneficial to identify the user audience to prioritize
which level will generate the most value.
Timing. Request data from stakeholders well before
it’s needed. Allowing ample time up front will help
identify and troubleshoot any issues with format or
aggregation. It also provides time to truly consider
the questions the data integration should answer
and how those insights can help improve the
experience. When asking for data, it’s important to
let stakeholders know what they can expect in return
to help them better manage their corner of the
business and demonstrate the value of the program.
Copyright ©2020 Walker Information, Inc. All rights reserved.
WALKER’S PARTNERSHIPS
Walker’s strategic partnerships ensure that we provide
best-in-class XM tools to complement our broad range
of services. Walker is a charter member of the Qualtrics
Partner Network (QPN) and is proud to be a top Delivery
and Consulting partner in North America – recognized
as CX Partner of the Year in 2019. Walker is also an SAP
Silver Partner, specializing in helping companies make
the most of their data.
To learn more about Walker, please visit walkerinfo.com
WALKER’S SERVICES
Walker provides a wide range of flexible services to maximize your
technology investment and accelerate the success of XM initiatives.
• Technology services. Implementation and engineering services for all
programs, from fast starts to highly customized deployments.
• Managed services. Flexible professional services model for end-to-end
program management and optimization.
• Advisory services. Tailored advisory solutions to build a world-class
experience management practice.
As important as what we provide is how we deliver it. At Walker, we provide
a highly personalized experience regardless of if you are new to XM or you
have a well-established program that you want to take to the next level.
THE CX LEADER PODCAST
The CX Leader Podcast with host Steve Walker provides
weekly insights for business leaders to improve results
by unlocking the potential of their customer experience.
More than a discussion of CX topics, the podcast
focuses on ways CX professionals can develop the
right skills and ideas to be effective leaders in their
organizations.
To learn more and view more than 100 episodes, visit
cxleaderpodcast.com.

www.walkerinfo.comCopyright ©2020 Walker Information, Inc. All rights reserved.