Embed Size (px)
Citation preview

G A H2020 – 730617 FR8-WP4-D-DLR-036-02 P a g e 1 | 73
Deliverable D 4.2 Optimized acoustic and aerodynamic
characteristics
Reviewed: (yes)
Project acronym: FR8RAIL
Starting date: 01/10/2016
Duration (in months): 36
Call (part) identifier: S2R-CFM-IP5-01-2015
Grant agreement no: H2020 - 730617
Due date of deliverable: Month 24
Actual submission date: 13-05-2019
Responsible/Author: Emir Öngüner, Arne Henning + DLR
Dissemination level: PU/CO
Status: Final
Ref. Ares(2020)804467 - 07/02/2020

G A H2020 – 730617 FR8-WP4-D-DLR-036-02 P a g e 2 | 73
Document history
Revision Date Description
1 11.05.2018 Collecting input headlines from participants
2 22.05.2019 Draft after requesting input from all participants
Report contributors
Name Beneficiary Short Name
Details of contribution
Emir Öngüner DLR First Version
Arne Henning DLR First Version
Uwe Fey DLR First Version

G A H2020 – 730617 FR8-WP4-D-DLR-036-02 P a g e 3 | 73
Table of Contents 1. Executive Summary ................................................................................................................ 4
2. Background ............................................................................................................................. 5
3. Objective/Aim ......................................................................................................................... 6
4. Aerodynamics of Freight Trains .............................................................................................. 7
4.1. State of the art ........................................................................................................................ 7
4.2. Aerodynamic measures ........................................................................................................... 7
4.3. Wagon positioning .................................................................................................................. 9
4.4. Adapting experimental methods to needs of freight train aerodynamics ........................... 16
4.4.1. Installation of a moving belt for ground simulations ............................................................ 17
4.4.2. Installation of burst flaps system for simulation of instationary wind effects...................... 25
4.5. Expansion of Existing Experimental Methods ....................................................................... 37
4.5.1. Wind tunnel model ................................................................................................................ 38
4.5.2. Installation of the Decoupled Balance System ...................................................................... 40
4.6. Wind Tunnel Test Campaign ................................................................................................. 41
4.6.1. Determination of aerodynamic forces as an input for vehicle dynamics ............................. 41
4.6.2. Investigation of crosswind conditions for next generation freight wagons .......................... 52
4.7. A preliminary approach to generate artificial turbulence on model .................................... 60
5. Conclusions ........................................................................................................................... 69
6. References ............................................................................................................................ 70

G A H2020 – 730617 FR8-WP4-D-DLR-036-02 P a g e 4 | 73
1. Executive Summary The here presented deliverable describes the work and outcome of the work in task 4.2: Optimized acoustic and aerodynamic characteristics. In a first step the state of the art for aerodynamic of freight trains is summarized, as far as new developments or new relevant aspects are taken into account, additional to the existing state of the art report in the FR8RAIL-project. This includes the results of an aerodynamic survey, resulting in a data-basis for the prioritization of measures in aerodynamic design. This basis will build the basis for effective measures in terms of drag reduction as well as acoustic and aero acoustic measures for an early implementation in the design process of the freight-wagon. This will includes passive systems like an acoustic air-curtain to optimize air flow around the connections between wagons and fairings in the vicinity of the running gear. Additionally aerodynamic optimized wagon positioning is investigated. In order to perform the aforementioned tasks, the experimental methods are adapted to the needs of freight train aerodynamics. This includes the expansion of existing experimental methods as well as the development of new methods. A special wind-tunnel model has been designed, in order to decouple the forces acting on the single wagon from the ones acting on the complete model. In order to perform investigations on measures at the underfloor region of the wagon, a moving belt was installed in order to simulate the relative movement of the ground. The dynamic loads due to transient aerodynamics and drive dynamics are investigated by means of cross-wind investigations. An existing low-speed wind tunnel has been adapted and measures for the aerodynamic drag reduction were developed. For different scenarios by means of train composition and loading scheme are investigated, quantifying the potential energy savings for next generation freight wagons at different scenarios (max. speed, wagon fleet etc...). The results are based on experimental and analytical studies for different scenarios like higher speed and combination of wagon top-units. An extensive wind-tunnel measurement campaign has been conducted in order to determine the aerodynamic forces, which can be used as an input for vehicle dynamics. For a large number of configurations, the crosswind conditions were investigated and the resulting forces and moments are quantified.

G A H2020 – 730617 FR8-WP4-D-DLR-036-02 P a g e 5 | 73
2. Background The present document constitutes the Deliverable D4.2 “Optimized acoustic and aerodynamic characteristics” in the framework of the TD 5.3, BB5_3_2 and BB5_3_3 of IP 5 (referring to MAAP Version from 11/2017).

G A H2020 – 730617 FR8-WP4-D-DLR-036-02 P a g e 6 | 73
3. Objective/Aim State of the art technology freight wagons have not been design taking into account aerodynamics neither aero-acoustic due to the limited speed of the freight train. However, the increase in the speed of the freight trains is expected thanks to new automatic couplers and lightweight wagons. In this situation, aerodynamics and aero-acoustic will start playing a major role. FR8RAIL will develop wagon concepts based on multidisciplinary optimisation which brings very quiet wagons (according to TSI limits) comparable to passenger train limit (75 dB(A)) and lower, as well as advanced aerodynamic drag reduction concepts. In parallel, FR8RAIL will develop noise emission prediction method as a reliable part of testing and validation process to eliminate the cost associated to expensive series of on-track noise tests required to achieve standard limits. The work described in here are performed in order to contribute to the high level objective of a 10 % reduction of cost of the freight transportation measured as Tonne per Km by means of aerodynamic drag reduction and therewith energy savings. Reduction of operational cost due to reduction in energy consumption will have a clear impact on the logistic market. The current power consumption is far from the strategic objective of UIC/CER for 2030. FR8RAIL aims at introducing a power saving per train in the order of the 10% of the current value, which seems to be reasonable according to the previous experiences in aerodynamics with passenger trains that have obtained 10% saving for speeds above 100km/h. Considering an average cost of € 0,15/Kwh, this supposes an impact of 720M€ saving per year in Europe only. In order to eliminate existing barriers in the freight business and to achieve the high level – market oriented- objectives of FR8RAIL, the specific technical objective is the development of technologies for a new concept of wagon and running gear which reduce noise impact, reduce energy consumption due to a better aerodynamic behaviour and lower weight. FR8RAIL has the objective of developing technologies for the wagon intending the reduction of aerodynamic resistance and noise. In order to do so, specifications for the wagon will be developed, focusing on optimising aerodynamics. FR8RAIL project will contribute to this objective by reducing the CO2 emissions per train by 10%, thanks to the better aerodynamics of the wagon. Considering that FR8RAIL product could be implemented in the freight trains that are the 5% of the rail vehicles in Europe, this could suppose a reduction of more than 5 million tCO2 every year.

G A H2020 – 730617 FR8-WP4-D-DLR-036-02 P a g e 7 | 73
4. Aerodynamics of Freight Trains
4.1. State of the art The Deliverable D4.2 - The State of the Art - has already provided a comprehensive overview of the state of the art in freight train aerodynamics. In the following, the relevant results from the past in connection with the work described here will be briefly presented. Freight trains play a big role in ground transportation as a significant type of good transport since decades. It is a growing sector with growing volumes of international trade. According to recent data of 2017 published by European Statistical Office (Eurostat, 2017), 1.7 million tons of goods have been transported in Europe with an increase of approximately 11 percent according to previous year (in 2016: 1.5 million tons). The potential of rail freight transport is considered as the key aspect of the FR8RAIL project (as a part of Shift2Rail) which is aiming at the development of functional requirements for sustainable and attractive European freight with work packages by different project participants as such as new running gear concepts including intelligent coupling, lightweight design, electrification, telematics and monitoring. In terms of wind resistance the freight transportation devices incl. locomotives and containers can be characterized as bluff bodies with their sharp edges and straight vertical surfaces. The high penalty due to their poor aerodynamics provides a lot of potential for any exterior design optimizations. Among exterior shape, there are also other important parameters which directly affect the resistance of a railway vehicle. In countries such as Australia, Canada and USA the rail freight is used over large distances and the number of wagons can reach even 200 and more (Golovanevskiy et al., 2012) with a length-to-height ratio of L/H ≈ 300 (Gielow and Furlong, 1988; Lai and Barkan, 2005). Their velocities reach up to 115 km/h with an aerodynamic drag contribution of 80 % of the total drag. Therefore an aerodynamic optimization in order to reduce the drag would be advantageous for saving energy and fuel. Expectations to increase the top speed of freight trains up to 160 km/h in near future are forcing the industry to put aerodynamics more in focus whereby security aspects considering roll, pitch and yaw moments will also play an important role, especially in case the train is exposed to cross-winds.
4.2. Aerodynamic measures One of the oldest studies on the wind resistance of railway vehicles published by Goos, 1907 shows the relationships between wagon types, lengths, positions and train speeds with the atmospheric resistance. A specific wagon in a train composition may cause different resistance at various positions and the inter-car-gaps (as well as containers in freight transport). There are numbers of experimental studies which have proven that the drag growth is dependent on the increase of gap width. Lai and Barkan, 2005 states that filling the gaps with empty containers or trailers may reduce the aerodynamic drag up to 27% and improves the energy efficiency. A further study by Lai et al., 2008 introduces an aerodynamic loading assignment model for freight trains to optimize the gap utilization. Paul et al., 2009 show that the drag of a single container wagon can be decreased up to 32% by changing the gap length from 1.6m to 0.5m. As the gap length is decreased, the wagons (including containers) start to behave as a single body. Because

G A H2020 – 730617 FR8-WP4-D-DLR-036-02 P a g e 8 | 73
the separated flow of the upstream container is reattaching on the downstream containers surface without creating a large-scale cavity flow between the wagons. Numerical simulations of Östh and Krajnovic, 2014 report that the drag coefficient of a specific wagon in periodic case is only 10% of the drag in a stand-alone condition. It has also been found out that the cavity flow regarding different gap lengths in the front and the back of a specific wagon behave independently. As stated in Li et al., 2014 the front gap induces much larger drag on the test wagon than the rear gap. According to aforementioned studies, one can say that the large distances between containers in a freight train cause so much resistance that any aerodynamic improvement in that area is definitely essential. In order to improve the aerodynamic characteristics of freight containers, which are identified as bluff bodies with their conventional cuboid shapes, some modifications can be attached at the rear surface. The flow separations on their sharp edges create a detached flow characteristic which is responsible for a certain drag increase. Firstly, the wind tunnel measurements at DLR focus on the aerodynamic shape optimization acting as passive flow control elements. Any kind of rear extensions at bluff bodies’ tail could manipulate the flow. Several experiments and numerical simulations have already been performed delivering following statement: the wake region gets smaller, the base pressure increases, thereby the drag can be reduced. Additionally, boat tailing acts also as well-known drag reduction method; however the flow condition is highly dependent on the upstream geometry (Morelli, 2000; Khalighi et al., 2001; Coon & Visser, 2004; Englar, 2004). Naturally turbulent crosswinds and transient air flows create unsteady aerodynamic loads that can induce significant effects on train surfaces. A high level of rolling moment may overturn the container or the wagon in case of a strong crosswind. The crosswind behavior of railway vehicles has been studied in past decades (Gawthorpe, 1994; Andersson et al., 2004; Baker & Sterling, 2009; Hemida & Baker, 2010; Dorigatti et al. 2015), but the research predominantly focuses on the passenger trains due to security aspects and risk of human life losses in passenger transport (Raghunatan et al., 2002). Some commission reports for safety aspects were also published in Australia (ATSB, 2008), EU (TSI, 2008) and UK (RAIB, 2009) considering crosswind incidents on railways. First definitive experimental study on the influence of container loading configuration on the aerodynamic flow conditions subjected to a freight train has been done by Soper et al. 2015. According to this investigation, surface pressure magnitudes of passenger trains are similar to those observed for freight container at a yaw angle of 30°. Similar experiments have been performed on moving model of a passenger train by Dorigatti et al. 2015. The results reveal that the lateral and lift force and the rolling moment have a quasi-steady response relative to incoming wind velocity. In the light of previous works it can be concluded that the aerodynamic characteristics of container freight trains have not been explored completely. This report describes the headwind and crosswind behavior of various exterior elements and the interaction of the 40-foot long intermodal container on a flatcar with its upstream and downstream vehicles in 1:25 scale.

G A H2020 – 730617 FR8-WP4-D-DLR-036-02 P a g e 9 | 73
4.3. Wagon positioning Each wagon in a long freight train is exposed to a different level of wind resistance. Vollmer, 1989 provides a large series of experimental analysis with single and group of wagons in various configurations. The wind tunnel experiments have been performed in 1:32 scale at 40 m/s under wide range of yaw angles and in total 240 measurements were conducted using 21 different types of freight wagons. Crosswind characteristics were considered between 1 and 8 wagons. At each measurement three aerodynamic forces and moments have been recorded and the angular variation of each set of results is approximated by a few terms of Fourier expansion in cosines (Beagles & Fletcher, 2013). In the same study, a series of tables of Fourier coefficients have been established which enables the calculation of longitudinal and lateral forces at various yaw angles. Figure 1 provides an overview on the distribution of predicted drag forces of different freight cars using Fourier coefficients given in Vollmer, 1989 at various driving speeds. The exponential increase of longitudinal drag can be seen at below mentioned types of car.
Figure 1: Increase of drag force acting on different types of freight wagons based on Vollmer,
1989
This method enables us to develop scenarios with different wagon compositions of freight trains
and determine their approximated resistance using a numerical approach. Vollmer, 1989
proposed an additional term as a constant value determined from wind tunnel measurements,
proportional to the difference in total frontal areas of wagons in a rake [312.5 x (frontal
area_loaded – frontal area_unloaded)]. Additionally Wende, 2003 mentioned that the additional
aerodynamic drag coefficient can be obtained by multiplying front/rear areas by fractional
change in frontal areas [(frontal area_loaded / frontal area_unloaded) x frontal area_loaded /
(frontal area_loaded + frontal area_unloaded)]. Using both methods similar results can be
obtained.
At the very beginning a multiple car arrangement with 5 identical wagons are considered for the

G A H2020 – 730617 FR8-WP4-D-DLR-036-02 P a g e 10 | 73
drag estimation and GLS205 (for the geometry see Figure 1) is chosen as reference wagon. In Figure 2 the force prediction of 5 x GLS205 wagons is given. Although the current freight trains are not able to achieve velocities higher than 110 km/h the values are calculated also at these velocities to demonstrate the tendency of force variation over a wide range of speed. The longitudinal force acting in x-direction (blue line) is growing fast with the velocity squared whereas the lateral force in y-direction has a flatter growth characteristic. Considering the current maximum velocity v ≈ 30 m/s (approx. 110 km/h) the corresponding forces are shown in Figure 3. The total drag in longitudinal direction of 5 identical wagons with same geometry and dimensions is ≈ 1.4 and the maximum force is higher than 7 kN.
Figure 2: Force prediction considering group of wagons with 5 x identical GLS205 wagons
A single GLS205 wagon in 5-car-composition has been analyzed over a large yaw angle range (0° < β < 180°) as shown in Figure 4. It can easily be seen that the longitudinal drag force (blue line) at β = 90° is drastically increasing due to the contact of airflow with large lateral surfaces of the freight train model, however the increase of lateral drag force (red line) does not have the same magnitude as forces in longitudinal direction. Maximum lateral force can be achieved at around β = 30°. Other types of wagons deliver similar values in terms of highest lateral force. For this reason β = 30° can be taken as maximum yaw angle in wind tunnel experiments.

G A H2020 – 730617 FR8-WP4-D-DLR-036-02 P a g e 11 | 73
Figure 3: Total drag coefficient and drag force acting on 5 x GLS205 cars at v = 30 m/s (left
columns: in longitudinal direction, right columns: in lateral direction)
Figure 4: Force development of a single wagon in crosswind (0° < β < 180°)

G A H2020 – 730617 FR8-WP4-D-DLR-036-02 P a g e 12 | 73
Figure 5: Force prediction considering group of wagons with 5 different cars
In an optimistic point of view the freight trains are consisting of different types of wagons
according to their loads. Beside a composition of multiple identical wagons combination of
different wagons can also be investigated. On the right hand side of Figure 5, some randomly
chosen wagons are pictured. A combination of these freight cars (5 different wagons: Fad168,
E040, GLS205, Kbs442-without load and Ed090) cause much higher drag forces than the previous
scenario (Figure 3). The same growth as in group of wagons with identical cars can also be
observed in this configuration and the total drag force at v=30 m/s (approx. 110 km/h) is 11.4 kN
(Figure 6).

G A H2020 – 730617 FR8-WP4-D-DLR-036-02 P a g e 13 | 73
Figure 6: Total drag coefficient and drag force acting on 5 different cars at v = 30 m/s
Figure 7: Drag distribution of each freight wagon at v = 30 m/s

G A H2020 – 730617 FR8-WP4-D-DLR-036-02 P a g e 14 | 73
Each component of multiple-freight-wagon-configuration can be analysed by decomposing the
group of cars as suggested by Vollmer, 1989. In Figure 7, drag distribution of single wagons is
demonstrated (based on Figure 8a). As expected, first wagon is exposed to highest resistance in
longitudinal direction. As moving in streamwise direction second and third wagons drag
contribution is much lower than the first one and in the last two wagons the drag is increasing
again. It should also be noted that the wagon nr. 4 (Typ: Kbs 442, see Figure 5) is an unloaded flat
car which completely disturbs the uniformity of flow. For that reason it is obvious to observe a
drag increase in that position which also affects the resistance of the last wagon as well.
Figure 8: Two configuration scenarios, a) random composition, b) composition of identical cars
Figure 9: Drag distribution of each identical freight wagon (GLS205) at v = 30 m/s (based on
Figure 8b)
G A H2020 – 730617 FR8-WP4-D-DLR-036-02 P a g e 15 | 73
Figure 10: Drag distribution of each identical freight wagon (GLS205) at v = 30 m/s, β = 30°
(based on Figure 8b)
Based on Figure 8b, an additional configuration has also been studied to observe the difference
of drag distribution by different compositions. In this case 5 wagons with the same type as
before (GLS205) are taken into consideration. Figure 9 shows the drag variation over the 5
identical cars without crosswind condition. The drag is drastically decreased by 2nd, 3rd and 4th
wagons in x- and y-directions because of uniformity of the incoming flow. Only the gaps between
each wagon cause the major contribution to wagons resistance. Last wagon (No. 5) is
characterized with its higher lateral force.

G A H2020 – 730617 FR8-WP4-D-DLR-036-02 P a g e 16 | 73
4.4. Adapting experimental methods to needs of freight train aerodynamics
The experimental investigation of the aerodynamics of freight trains in wind tunnels is a task in which specific boundary conditions have to be taken into account. On the one hand, in contrast to aerodynamic investigations of aircrafts, the motion close to the ground has to be considered. In particular, if aerodynamic measures in the underbody are to be evaluated, it is important to map this relative motion in experiments on scaled models. One possibility to consider this relative motion in laboratory experiments is the use of a catapult or towing system, like a water-towing tank or the unique tunnel simulation facility at the Institute of Aerodynamics and Flow Technology at the DLR in Göttingen. In such facilities, a model of the vehicle is moved by a sled, so that the movement relative to the underbody can be simulated by appropriate installations. A drawback of such systems is the high effort, which has to be put in to obtain a sufficiently good statistic of the averaged flow quantities. In this case, particular attention must be paid to the repeatability of the measurements. Therefore, the use of such a catapult or towing system is not an appropriate tool for the optimization of the freight wagon, which implies a multitude of variants. It is not realistic to be productive with such a system in case of the present investigation, as up to 100 runs are necessary per configuration (depending on the fluctuation of the examined quantity) in order to be able to record these quantities with an acceptable error margin. For this reason, other measures are used in the project to take into account the simulation of the moving ground. In automotive aerodynamics, the use of a moving belt in wind tunnels has become a standard tool. However, it took decades until methods were established which were powerful enough in real operation to meet the demands of very high productivity. In wind tunnels of the automotive industry, solutions have prevailed which make it possible to test real vehicles at full-scale in the corresponding test facilities. This means that the belts used have to rotate with a turntable and that the force measurement balances has to be taken into account during planning and installation. Within the framework of the FR8RAIL project, a moving belt was installed in the DLR's cross-wind test facility (see Figure 32). A special feature of this moving belt is high length/width ratio. The reason for this is the long length of the train models on which the aerodynamic investigations are to be carried out. Due to the length of the belt, it is not possible to consider integration in the turn-table usually used for cross-wind analysis. However, this is not necessary for the investigations aimed at here, since the aerodynamic drag is in the foreground of the investigations, and not, for example, the investigations on crosswind stability. Of course crosswind stability is also relevant for the design of the train, especially if higher speeds are to be driven. But it can be assumed that in the case of a container train, it is above all the superstructure that has a decisive influence on the stability in crosswinds. Although the flow between the superstructure and the underside of the train also plays an important role, the relative movement is not so decisive if a strong crosswind component prevails, since the inflow is then dominated by the lateral wind component. Another difference in comparison to aerodynamic investigations of aircrafts is the profile of the boundary layer, which is formed in a wind tunnel. This boundary layer implies a velocity gradient

G A H2020 – 730617 FR8-WP4-D-DLR-036-02 P a g e 17 | 73
with decreasing wind velocity in the direction of the wind tunnel walls; with the velocity equal to zero at the walls (so called “no-slip condition”) merging to the free stream velocity. This boundary layer grows with the length of the respective surface. If one considers the movement of a train in it frame of reference, such a boundary layer is not part of the air moving relative to the train. Rather, a so-called block profile must be achieved in the wind tunnel in order to be able to simulate realistic conditions. In the following we will describe the process of installing the moving belt together with a special system, designed to reach an acceptable boundary profile and relative motion of the ground.
4.4.1. Installation of a moving belt for ground simulations In a first step, the flow condition in the wind tunnel needs to be quantified, with a special focus on the boundary layer at the floor of the test-section inside the wind-tunnel. In order to do so, Laser-Doppler-Anemometry (LDA) has been conducted in several measurements campaigns. The experimental setup of the LDA Laser-head is depicted in Figure 11. For a characterisation of the boundary layer upstream and at the level of the installed moving belt, an area has been predefined for the measurements as shown in Figure 13. Results of the LDA measurements for the base-line (no measures for the conditioning of the boundary layer) are shown in the upper half of Figure 13. It shows velocity profiles (U-component pointing in the x-direction) along the lateral direction for different distances from the wind-tunnel floor. Y=0 marks the position of the symmetry line pointing downstream.
Figure 11: LDA-System installed at the cross-wind test facility at the DLR in Göttingen

G A H2020 – 730617 FR8-WP4-D-DLR-036-02 P a g e 18 | 73
Figure 12: Area covered by the LDA measurement
Measurements were conducted at a free stream velocity of U∞ = 30 m/s. The profiles are showing a high level of fluctuations for distanced up to 80 mm from the ground. Especially in the central region of the wind-tunnel (-450 mm < y < 450 mm) the fluctuation level is up to 4 m/s. For the measurements on freight-train aerodynamics, the central region close to the ground will be the most important location; where most of the train-models will be placed. There the bad flow-quality is not acceptable for the investigations on train aerodynamics in the framework of the study presented here.

G A H2020 – 730617 FR8-WP4-D-DLR-036-02 P a g e 19 | 73
Figure 13: Velocity profiles resulting from the LDA-measurements at different positions as
depicted in the previous figure
Thus, for the measurements carried out in the past in the wind tunnel on aircraft models or train models on the splitter plate, the large deviations of the near-ground speeds were no problem. However, it is problematic with the measurements in this project, conducted with scaled models close to the ground. For this reason, it was important to identify and eliminate the causes of these large velocity fluctuations. The reasons for the strong periodic fluctuations in the boundary layer are various. One cause can be vortices that form downstream of fastening screws. Also, the wake downstream of the baffles in the corner vanes are a possible cause. Further possibilities are Görtler-vortices, which can occur in the contraction area upstream of the test-section. Thermal inhomogeneities are another possible cause. Such inhomogeneities could be caused by the differences in thermal conductivity of the elements which are part of the supporting structure of the wind tunnel in the contraction upstream of the test-section. In order to limit the source region for the fluctuations as far as possible, velocity measurements were carried out in the area between the deflecting corner and the contraction. The experimental setup of the measurement is depicted in Figure 14.

G A H2020 – 730617 FR8-WP4-D-DLR-036-02 P a g e 20 | 73
Figure 14: Position of the velocity probe downstream of the grid inside of the settling chamber
Figure 15: Results of the velocity measurements downstream of the contraction
The resulting velocity profile can be seen in Figure 15. In principle, very similar fluctuations can be observed here, so that the location for the cause of the disturbances could be limited to the area upstream of the contraction. Due to the dimension and the wavelength of the disturbances, the baffles of the last deflection

G A H2020 – 730617 FR8-WP4-D-DLR-036-02 P a g e 21 | 73
corner before the test-section were the first possible cause. In a first step unevenness and disturbances in this area were removed. Unfortunately, these measures did not have the desired effect; most of the disturbances in the velocity profiles were still present. Even after the removal of an entire blade, the disturbances were still present in the profiles. Therefore, the deflection blades can definitely be excluded as the source for the inhomogeneous profile. In order to exclude the influence of inhomogeneities in the temperature distribution on the wind tunnel floor as the cause of the fluctuations, thermographic images were taken at various points upstream of the contraction as depicted in Figure 16.
Figure 16: Thermographic recording at the wind-tunnel test-section. Resulting temperature
distribution in the upper left corner.
However, the subsequent coating of the floor to achieve a more homogeneous temperature distribution did not lead to any improvement. In order to obtain a clearer picture of the flow condition in the vicinity of the test section, Oil-flow visualisation together with computational fluid dynamics simulation were performed.
Figure 17: Oil-Flow visualisation upstream of the test section

G A H2020 – 730617 FR8-WP4-D-DLR-036-02 P a g e 22 | 73
Figure 17 shows the results of the oil-film visualisation. As it can be seen, no signatures from any evolving vortices are present at these images. From these results and the conclusions drawn from the results of the numerical simulation (see Figure 18), any strong vortices can be excluded from being the source for the velocity fluctuations in the wind tunnel test-section. Therefore further investigations were focused on influencing the boundary layer in the region upstream of the contraction. After several parametric studies, the final solution involves two tripping devices. Together with a suction of the boundary layer directly upstream of the moving belt, the flow quality has been improved significantly. In Figure 19 the flow condition without any measures are depicted by means of the respective velocity profiles. In Figure 20 the final results with moving belt, tripping devices for flow conditioning and suction upstream of the moving belt, are depicted. As it can be seen, the flow condition in the lower section of the test section is improved significantly, representing now a block-profile, which is necessary to quantify the performance of measures at the underfloor body.
Figure 18: Results of the CFD-simulation. Depicted are the velocity contours in the region of
the contraction upstream of the test section.

G A H2020 – 730617 FR8-WP4-D-DLR-036-02 P a g e 23 | 73
Figure 19: initial configuration with the respective velocity profiles. In the upper image the
situation in the wind tunnel test section and upstream is depicted.

G A H2020 – 730617 FR8-WP4-D-DLR-036-02 P a g e 24 | 73
Figure 20: Final configuration with the improved flow conditions in the wind tunnel test
section. The different velocity profiles are shown. The different measures for the flow
conditioning are depicted in the sketch of the upper figure.

G A H2020 – 730617 FR8-WP4-D-DLR-036-02 P a g e 25 | 73
4.4.2. Installation of burst flaps system for simulation of instationary wind effects
4.4.2.1. Introduction & requirements Over the last decades train design has experienced fundamental changes. Former trains have typically consisted of heavy lodges and have usually been operated at low speed. Modern train design tries to combine higher passenger capacity and light-weight construction. Therefore, the trend is to construct double-deck trains out of light metal. Both measures affect the crosswind stability, as the double-deck design may lead to an increased size of the side area and a higher balance point of the wagon. Due to the enlarged side surface area the side force also rises. Furthermore, the higher balance point leads to an increased rolling moment. Cooper, 1981 and Baker, 2009 both point out that the crosswind stability is a key factor for safety as well as for comfort of ride, especially considering sudden crosswind excitation. The response force to gusts and other sudden crosswinds, as well as the resulting rolling moment, are then observed as a shaking and therefore uncomfortable ride. Especially the passengers seated in the upper-deck experience a lack of comfort. Hence, it is desirable to identify countermeasures in the train design providing a high level of passenger comfort. Additionally, the link between unsteady aerodynamics and their response force is still not well understood. In order to find the relation between unsteady aerodynamics and the mechanical behavior of a test model wind tunnel experiments, a gust generator has been developed for the side wind test facility at DLR Göttingen (Müller, 2018). It is designed to induce crosswinds with frequencies and flow angles in a known and repeatable manner, to the otherwise nearly uniform wind tunnel flow. To find a suitable design for the purpose of investigating unsteady aerodynamics of trains in the ground-based vehicles facility of the DLR Göttingen the respective requirements need to be defined. Therefore, the characteristics of unsteady aerodynamics and gust generators are considered in the following. When investigating unsteady aerodynamics, the reduced frequency defined as
𝑓𝑟𝑒𝑑 = 𝐿 × 𝑓
𝑢∞
which is one of the characteristic quantities. By normalizing the frequencies in the flow with the
length of the model and the approaching wind speed, the wavelength of the flow structures
reflects the model. Hence, the results in wind tunnel experiments can be scaled to full-scale
observations. Baker, 2010 shows that for small reduced frequencies, quasi steady approaches
work well, whereas for reduced frequencies of fred ≫ 1 unsteady effects become more influent.
Hence, to study those effects it is desirable to exceed a reduced frequency of fred = 1.
Moreover, regarding the aerodynamic admittance function, which is a common approach to link
the frequencies in the unsteady flow to aerodynamic forces; it can be observed that the
admittance function decreases rather fast for reduced frequencies fred ≫ 1. Furthermore,
Reynolds effects need to be considered. For the speed and dimensions of high speed trains,
G A H2020 – 730617 FR8-WP4-D-DLR-036-02 P a g e 26 | 73
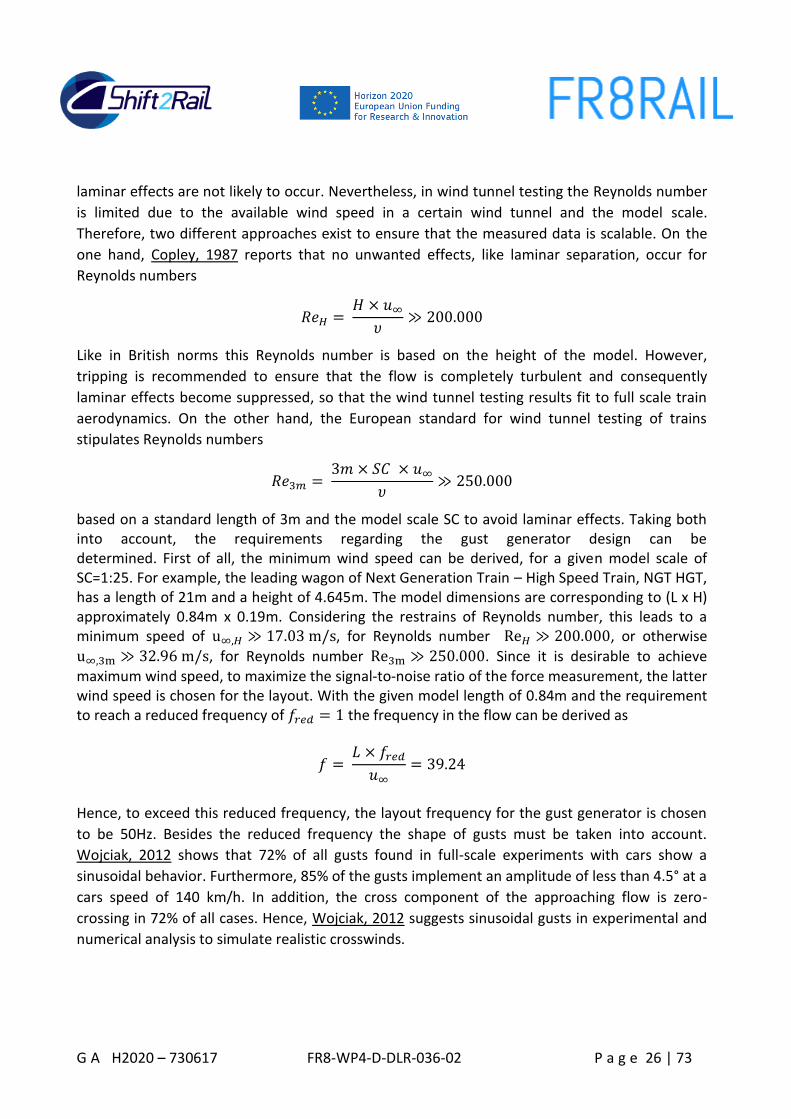
laminar effects are not likely to occur. Nevertheless, in wind tunnel testing the Reynolds number
is limited due to the available wind speed in a certain wind tunnel and the model scale.
Therefore, two different approaches exist to ensure that the measured data is scalable. On the
one hand, Copley, 1987 reports that no unwanted effects, like laminar separation, occur for
Reynolds numbers
𝑅𝑒𝐻 = 𝐻 × 𝑢∞
𝜐≫ 200.000
Like in British norms this Reynolds number is based on the height of the model. However,
tripping is recommended to ensure that the flow is completely turbulent and consequently
laminar effects become suppressed, so that the wind tunnel testing results fit to full scale train
aerodynamics. On the other hand, the European standard for wind tunnel testing of trains
stipulates Reynolds numbers
𝑅𝑒3𝑚 = 3𝑚 × 𝑆𝐶 × 𝑢∞
𝜐≫ 250.000
based on a standard length of 3m and the model scale SC to avoid laminar effects. Taking both into account, the requirements regarding the gust generator design can be determined. First of all, the minimum wind speed can be derived, for a given model scale of SC=1:25. For example, the leading wagon of Next Generation Train – High Speed Train, NGT HGT, has a length of 21m and a height of 4.645m. The model dimensions are corresponding to (L x H) approximately 0.84m x 0.19m. Considering the restrains of Reynolds number, this leads to a minimum speed of u∞,𝐻 ≫ 17.03 m/s, for Reynolds number Re𝐻 ≫ 200.000, or otherwise
u∞,3m ≫ 32.96 m/s, for Reynolds number Re3m ≫ 250.000. Since it is desirable to achieve
maximum wind speed, to maximize the signal-to-noise ratio of the force measurement, the latter wind speed is chosen for the layout. With the given model length of 0.84m and the requirement to reach a reduced frequency of 𝑓𝑟𝑒𝑑 = 1 the frequency in the flow can be derived as
𝑓 = 𝐿 × 𝑓𝑟𝑒𝑑
𝑢∞= 39.24
Hence, to exceed this reduced frequency, the layout frequency for the gust generator is chosen
to be 50Hz. Besides the reduced frequency the shape of gusts must be taken into account.
Wojciak, 2012 shows that 72% of all gusts found in full-scale experiments with cars show a
sinusoidal behavior. Furthermore, 85% of the gusts implement an amplitude of less than 4.5° at a
cars speed of 140 km/h. In addition, the cross component of the approaching flow is zero-
crossing in 72% of all cases. Hence, Wojciak, 2012 suggests sinusoidal gusts in experimental and
numerical analysis to simulate realistic crosswinds.

G A H2020 – 730617 FR8-WP4-D-DLR-036-02 P a g e 27 | 73
4.4.2.2. Evaluation of common existing gust generators In the following familiar designs are discussed in detail. Gust generators are used widely, especially in the research field of aeroelastics. To find a suitable design for a new gust generator device, existing devices and the experiences with them should be taken into account. In this case the focus lies on the mode of operation, considering the capability of providing the required frequency of 50Hz in the flow field. The most common way of inducing oscillating flow angles is by using oscillating airfoils. Those are usually mounted vertically and need a bearing on both sides of the wing, for example Micelbach & Blumrich, 2010. However, the wings need extra support to deal with the forces. Nevertheless, such devices are very flexible in motion, because they are only limited by the drive`s abilities. Hence, this means that the drive needs to provide a high amount of torque and consequently it has comparably high energy consumption. Such wing based devices are often used in wind tunnel experiments for ground-based vehicle. Many wind tunnels in the automobile industry use a ¾ open jet design as test section. Therefore, it is possible to simply build an array of airfoils in lateral direction reaching from the ground to the top end of the nozzle. The deflection of the flow induces a compensation movement, which forms a tip-vortex. This vortex is in the case of wide plenums not expected to interact with walls or to interfere with the basic wind tunnel flow. Considering closed test sections, the walls hinder the development of the tip vortices and therefore damp the efficiency of such a gust generator device. Furthermore, the wings` wakes induce additional frequencies to the flow. Thus, at the NASA Langley Research Center a different design has been chosen for the transonic dynamic tunnel, see Bennett & Gilman, 1966. Two horizontal airfoils are mounted on each side of the nozzle. The vanes are relatively small. The main idea is to overlay the tip vortices of each pair of airfoils and thus to obtain a vertical sinusoidal flow field in the middle of the tunnel. The resulting flow field does not contain any interference of wake structures with the flow field and the test object. To overcome the disadvantage of high requirements regarding the drive of a wing system, considering torque and precision of the movement, a new design has been presented by Tang et al., 1996. Rotating slotted cylinders (RSC) are mounted downstream of a symmetrical airfoil. The span wisely slotted cylinders rotate without performing an oscillatory movement like a wing arrangement. The requirements regarding the mechanics, or the drive, are lower compared to the design used in Bennett & Gilman, 1966. Nevertheless, the amplitude and synchrony is controlled by timing belts and pulleys. Hence, this suggested design requires additional mechanic devices. Furthermore, with rising rotational speed of the RSC, their performance declines. This means that if high frequencies are to be induced to the flow, the maximum crosswind speed decreases. For crosswind gusts with regard to the 50Hz requirement for this purpose, it is therefore questionable to obtain mandatory crosswind strength, fitting to the crosswind gust characteristics described before. Another approach, trying to avoid the above mentioned wake interferences, is to use moving walls, as reported in Holmes, 1973. In this case, two side walls of the wind tunnel upstream of a free-stream test section are flexible. Springs and cams constrain the wall shape in a sinusoidal manner. By moving the walls in-phase, a transverse gust is induced. Stream-wise gusts can be

G A H2020 – 730617 FR8-WP4-D-DLR-036-02 P a g e 28 | 73
obtained by moving the walls in counter-phase. However, such a design needs a considerably greater amount of space than the above discussed approaches, and therefore it is difficult to be implemented in existing wind tunnels. Furthermore, only frequencies up 7.7Hz have been presented so far, which is far from the desired 50Hz. Thus it is questionable whether it is possible to reach the required frequency with such a device.
4.4.2.3. Design characteristics of a wing system consisting of four two-element wings with active trailing edges
After defining the aerodynamic requirements to the gust generator has to fulfill and considering common gust generator designs, the next step during the design phase was to finalize the design, taking into account the characteristics of the side wind test facility Göttingen, SWG. Thereafter, the results of the initial tests are presented, which focus on the mechanical distortion of the device during operation and the flow field that generated by the device. The new gust generator device is going to be implemented in the side wind test facility Göttingen, SWG. Hence, another design requirement is to fit the wing system into the dimensions of this wind tunnel. The closed test section of this closed-circuit wind tunnel has a height of 1.6m and a width of 2.4m. Further, as mentioned above, it has to be prevented that the tip vortices are not to be damped by the walls of the considered test section. Thus, the height of the wings is chosen to be 800mm, which is half the height of the test section. Therefore a compensational flow movement is allowed in the upper half of the test section. Further blocking effects have to be considered. Multiple effects need to be taken into account. First, the oscillatory movement of the wings flaps induces an alternating blocking ratio, which leads to an alternating total pressure loss in the test section. Consequently the operation point of the wind tunnel drive might be moving and consequently provide additional dynamics to the freestream velocity. The second blocking effect becomes important, if the outer wings are too close to the side walls of the test section. Considering the maximum deflection of the flaps, they would then form a nozzle on one wall and a diffuser on the other side. This changes the upstream flow field of the flaps by a dynamic change of the angle of attack. Additionally, for the wings extend only to the half-height of the wind tunnel, their blockage deflects the approaching flow into the upper half of the test section. All these blockage effects result in added dynamics to the flow field downstream the wing system. It is difficult to control these additional dynamics. Therefore, the most promising countermeasure is to keep the blockage ratio small, and consequently minimize the blockage effects. By choosing the lateral spreading of the wing system to be lower or equal to 1m, the wing system covers only less than 20% of the cross section. Because the wing is only half size of the wind tunnel, the moving flaps need to be mounted on it
on either side. In order to deal with the forces of the flaps and to prevent alternating solid
blockage a NACA 0018 has been chosen as a relatively thick symmetrical main body with a chord
length of c = 300mm. Respectively this gives a thickness of 54mm. The flaps chord length is

G A H2020 – 730617 FR8-WP4-D-DLR-036-02 P a g e 29 | 73
chosen to be 1/3 of the wings chord length. This allows a flap movement amplitude of 15°,
without affecting the solid blockage of the wing. Hence, alternating blockage effects are
considered to be negligible. Before setting the final lay-out an Unsteady Reynolds averaged
Navier-Stokes simulation has been carried out, to prove whether such wings are able to induce
the required 50Hz to the flow.
Furthermore, the simulation was used to be able to select the optimal number of wings and their
spacing. Four wings appeared to deliver the best flow field. As mentioned above one main wing
has a width of 54mm. This gives for all the four wings a solid blocking ratio of 4.5%, which is
considered not to add blockage effects during the measurements.
Following, a four wing system has been set up. The main wings consist out of alloy, whereas the
flaps are made from carbon fiber. The flaps are attached to the main wing by two plain bearings.
Each flap is connected to an own servo drive by a bellow coupling. Giving each flap an own drive
provides maximum degree of freedom to the flap movement. Hence, single pitch movements are
possible, as well as sinusoidal oscillation.
Figure 21: Two wing system configurations: equal (left) and wide (right)
4.4.2.4. Mechanical behaviour Before studying the generated flow field, the mechanical behaviour of the flaps was analyzed. The focus was in the distortion of the bellows coupling and the distortion of the carbon fiber flap itself. It is crucial to know both factors in advance, because both distortions imply a difference between the expected and the actual angle of the flap to the flow. Since all wings of the wing system are identical, the mechanical testing was carried out on a single wing prototype. The distortion was determined by relating the signal of the servomotor´s resolver to the instantaneous flap position, measured with a laser vibrometer. In order to measure the

G A H2020 – 730617 FR8-WP4-D-DLR-036-02 P a g e 30 | 73
distortion of the flap, 23 measurement points along the span-wise direction of the flap were used, as illustrated in Figure 13. A laser vibrometer measures the phase shift between the beam reflected by a measurement point and a reference beam. Hence, precise information about the movement of the measurement point is obtained using the Doppler Effect. The outcome is a contact-free measured, precise and time-resolved signal of the movement relative to a starting position.
Figure 22: Measurement points for the distortion measurements with laser vibrometer
During the test series the amplitude of the sinusoidal flap movement was varied from 1° over 2° to 3° and the frequency from 1Hz over 5Hz and then in steps of 5Hz up to 50Hz. First, the distortion of the bellows coupling was investigated. The graphs, in Figure 23, show the distortion angle of the bellows coupling. With rising frequency the drive needs to produce more torque. Therefore, depending on the applied torque, the distortion angle rises as expected. Nevertheless, the distortion is little more than 5% of the amplitude and by that acceptably small. The second investigation concerned the flaps distortion. Exemplarily, the distortion of the flap is shown, Figure 24, for an amplitude of 3° and frequencies of 5Hz, 25Hz and 50Hz. Again the
distortion angle is acceptably small. It is found that the absolute value of the distortion angle rises with the height of the flap. This is a result of the single-sided torque input. Surprisingly, the distortion at 25Hz is higher than the distortion resulting for the other two frequencies. Regarding the amplitude of the flap movement, it can be observed that even though the same amplitude of 3° was programmed, the outcome is different. In the range of 25Hz, the actual amplitude is higher than the programmed value, whereas with higher frequencies the outcome decreases again. By taking the first measurement point as a reference for the distortion, the distortions

G A H2020 – 730617 FR8-WP4-D-DLR-036-02 P a g e 31 | 73
become comparable and show a behavior connected to the higher mode`s deformation, as can be seen in Figure 25. The behaviour of the actual amplitude with respect to the programmed amplitude has its origin in the way the flap movement is implemented in the drive control. There is no direct feedback control, for the correction behavior of such a feedback system is considered to affect the synchrony and smoothness of the movement of the flaps. Moreover, in the actual measurements, for which the wing system is designed, the programmed amplitude is not part of the analysis. Typically by testing response forces of unsteady aerodynamic conditions, the flow characteristics are measured straight in front of the model. Hence, the actual flow structures need to be connected to the measured response forces. This shows that in this case a difference between the programmed amplitude and the actual amplitude, as a function of the frequency, does not harm the purpose of the flap system.
Figure 23: Coupling distortion angle as a function of frequency for different amplitudes
Figure 24: Flap distortion as function of height for different frequencies and amplitude 3°
G A H2020 – 730617 FR8-WP4-D-DLR-036-02 P a g e 32 | 73
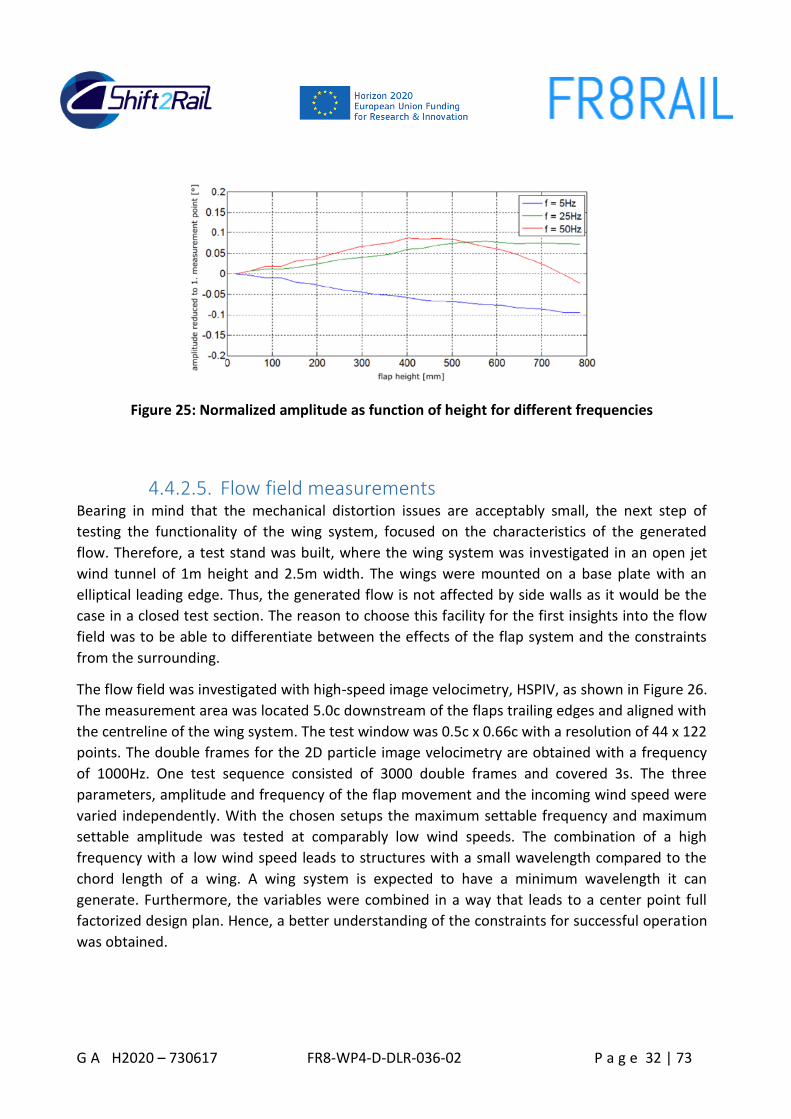
Figure 25: Normalized amplitude as function of height for different frequencies
4.4.2.5. Flow field measurements Bearing in mind that the mechanical distortion issues are acceptably small, the next step of
testing the functionality of the wing system, focused on the characteristics of the generated
flow. Therefore, a test stand was built, where the wing system was investigated in an open jet
wind tunnel of 1m height and 2.5m width. The wings were mounted on a base plate with an
elliptical leading edge. Thus, the generated flow is not affected by side walls as it would be the
case in a closed test section. The reason to choose this facility for the first insights into the flow
field was to be able to differentiate between the effects of the flap system and the constraints
from the surrounding.
The flow field was investigated with high-speed image velocimetry, HSPIV, as shown in Figure 26.
The measurement area was located 5.0c downstream of the flaps trailing edges and aligned with
the centreline of the wing system. The test window was 0.5c x 0.66c with a resolution of 44 x 122
points. The double frames for the 2D particle image velocimetry are obtained with a frequency
of 1000Hz. One test sequence consisted of 3000 double frames and covered 3s. The three
parameters, amplitude and frequency of the flap movement and the incoming wind speed were
varied independently. With the chosen setups the maximum settable frequency and maximum
settable amplitude was tested at comparably low wind speeds. The combination of a high
frequency with a low wind speed leads to structures with a small wavelength compared to the
chord length of a wing. A wing system is expected to have a minimum wavelength it can
generate. Furthermore, the variables were combined in a way that leads to a center point full
factorized design plan. Hence, a better understanding of the constraints for successful operation
was obtained.

G A H2020 – 730617 FR8-WP4-D-DLR-036-02 P a g e 33 | 73
Figure 26: Sketch of the wing system and the high-speed PIV test setup (configuration: wide)
The later use of the flap system requires a homogenous flow field. A strong locally concentrated
velocity deficit is not recommended. The same applies to not fully developed structures.
Therefore, the point of interest was chosen to be 5c downstream of the flaps and on the
centreline. In order to check qualitatively, whether the induced lateral component v is
homogeneous in y direction, the v-component was unwound. Therefore, at x/c=5 for each point
of the measurement grid in y direction the v component was phase-averaged and color-coded,
so that the timeline of a single period could be plotted for the whole y direction. Consequently,
the axis of ordinates shows the cross-wise position and the axis of abscissae the normalized time.
Figure 27 shows the comparison of case 1 and case 2, and it can be derived that for both,
configuration equal and wide the lateral velocity component is distributed homogenously in y
direction.
Figure 27: Unwound v-component at x/c=5, left: case 1, right: case 2

G A H2020 – 730617 FR8-WP4-D-DLR-036-02 P a g e 34 | 73
The main purpose of the device is to induce a sinusoidal flow field. The induced main frequencies in the flow were obtained by analyzing the cross-directional velocity component v. A fast Fourier transformation, FFT, was performed, to prove that the main frequency in the flow corresponds to the set frequency of the flap movement. By normalizing all frequencies by the set flap frequency, a single peak at f/fset = 1 is expected. In Figure 28 all tested variations are plotted, to get a first impression, whether there are test series that show different characteristics. Since no further peaks appear in the chart, the second focus was on the strength of the peak for different cases. Extracting the peak of case 3 to case 5, it is obvious that the strength declines with the generated wavelength. Thus we conclude that the wing system generates a sinusoidal crosswind component with the set flap movement frequency. Nevertheless, the strength of the crosswind component is only satisfactory, for wavelengths well above the chord length of a wing. Next the influence of the wakes downstream of the wings was considered. The latter affects the u-component as the velocity deficit lies in the main flow direction. At x/c=5, the u-component of the flow was unwound as described above for the v-component. Plotting the u-component that way, the shape of the wakes becomes visible. In Figure 29 the wake structure of case 1 and 2 is compared. Case 1 and 2 are characterized by the same parameter settings, but a different spacing of the wings. In case 1 the maxima of the sinusoidal wake structure overlap, so that for example at y/c=0.3 a low-speed event appears twice in one period. Therefore, a frequency twice as high as the set flap frequency occurs, which hence can be considered as a second harmonic. Accordingly, in regions where the velocity deficit appears once in a period the first harmonic is dominant, and so on.
Figure 28: FFT results for v-component, left: normalized test series, right: extracted case 3 to 5
For case 2 the wake structure does not appear around the centerline. Therefore, no additional harmonics exist in the velocity fluctuations in x direction. Thus there is a region, where the force response measurements, the wing system is designed for, are not going to be disturbed by wake interaction. Furthermore, the width of this region can be derived by searching for the first harmonic. This frequency appears at the maximum of the sinusoidal wake structure.

G A H2020 – 730617 FR8-WP4-D-DLR-036-02 P a g e 35 | 73
Figure 29: Unwound u-component at x/c=5, left: case 1, right: case 2
In order to obtain the spatial distribution of the harmonic frequencies in x direction an FFT analysis was performed for all points on the grid, for which the velocity vector was evaluated. The amplitude of the first four harmonics was extracted and color-coded. The derived amplitudes are mapped on the measurement area, so that a spatial distribution for each of the harmonics is obtained. The color-coding then implies the impact of the harmonic on a certain point, which will be considered as strength of the harmonic in the latter, to compare certain spatial areas. Exemplarily the results for the first two harmonics obtained for case 1 and case 2 are shown in Figure 30 and Figure 31. The chosen examples illustrates the differences between configuration “equal” and configuration “wide”, since, as mentioned before, case 1 and case 2 have the same parameter setting. By plotting the strength of the harmonics in a color map, the first thing to be mentioned is that the shape of the spatial distributions follows the main flow direction. Second, it can be seen that the existence and strength of the harmonic frequencies is connected to the appearance of the wake structures as discussed above. The impact of the appearance of the wake depends on its duration, which becomes obvious for case 1.
Figure 30: Spatial distribution of the strength of the 1st harmonic (left), 2nd harmonic (right) of
test case 1

G A H2020 – 730617 FR8-WP4-D-DLR-036-02 P a g e 36 | 73
Comparing the duration of the appearance of a wake at a certain point, Figure 29 left, with the shapes of the second harmonic, Figure 30 right, the downstream behavior of the wake structures generated by the wings can be derived. At y/c=0 the wake structures of wing 2 and 3 are overlapping. Therefore, the velocity deficit occurs twice, like directly behind a wing, at y/c= 0.3. However, the strength of the second harmonic is higher, for the velocity deficit occurs for a longer time at the maxima of the sinusoidal shape, compared to the region around y/c=0.3, where the wake passes rather fast.
The mappings for case 1, show that additional harmonic frequencies appear spatially distributed in y direction. For the latter use of the wing system this distribution is considered to disturb the measurements. A region with a homogenous distribution of the strength of the u-fluctuations is desired, so that a model can fit between the areas influenced by the wakes and is not exposed to wake structures at all. Therefore, the spacing in between wing 2 and 3 is enhanced in configuration wide, exemplarily shown by case 2. The mapping of the harmonics shows that this countermeasure to additional harmonic frequencies in x direction induced by the wake structures, works for a certain area around the centerline, y/c=0. Figure 31 shows that there is an even distribution around that area for the two first harmonic frequencies. Nevertheless, it can be seen, that the minimum range is set up by the first harmonic, because this indicates the existence of the maxima of the wake structure, compare Figure 29 right and Figure 31 right.
Figure 31: Spatial distribution of the strength of the 1st harmonic (left), 2nd harmonic (right) of
test case 2
4.4.2.6. Future prospects For the purpose of testing unsteady aerodynamics and their response forces on trains in a wind tunnel a gust generator has been built. The major layout constraints are to exceed a reduced frequency of fred = 1 and thus providing a homogenous flow field. Therefore, a wing system has been developed that is able to provide frequencies in the flow of up to 50Hz, with respect to a certain required Reynolds number. For the dimensioning of the wing system, blockage effects are considered. The final design consists of four two-element wings with active trailing edges.

G A H2020 – 730617 FR8-WP4-D-DLR-036-02 P a g e 37 | 73
In the next step the mechanical distortion of the flap and the bellows coupling has been proven to be acceptably small. The flow field induced by the wing system was investigated with high-speed PIV measurements. The main interest of these measurements was to achieve a better understanding of the constraints for a successful operation of this wing system. Test series for sudden crosswinds need a sufficiently strong cross-component, and sinusoidal behavior, for this is typical for most crosswind gusts. Hence, the first focus was put on the constraints to obtain a significant sinusoidal v-component. It is found that the induced wavelength in the flow needs to be well above the wings chord length of c=300mm. Consequently, reduced frequencies of fred ≪ 2.8 for a 1:25 model of the NGT HST can be obtained. Nevertheless, for this maximum reduced frequency the Reynolds number requirements are not taken into account. However, with a test setting according to Copley, 1987 and consecutively derived u∞,H ≫17.03 m/s reduced frequencies of around 𝑓𝑟𝑒𝑑 ≈ 2.45 can be realized for the NGT HST models. Moreover, the common length of leading wagons, like the double-deck IC2 used by the Deutsche Bahn is 26.8m, or 28.6m for the new ICE4 and therefore longer than the NGT HST leading wagon. This means, even higher reduced frequencies are achievable for wind tunnel tests on models of existing train coaches. It is known that gust generator devices using wings, flaps or rotating slotted cylinders all have the same disadvantage of inducing additional harmonics to the flow field in common. These harmonics are a product of the interaction of the wings` wakes. Hence, the measurement area was investigated with focus on the spatial distribution of harmonic frequencies in the flow field. By enhancing the spacing between the second and third wing, an area around the centerline occurs that is characterized by an evenly spatial distribution of the frequencies in the flow field. Furthermore, the width of this area is connected to the approaching wind speed, the frequency of the flap and the amplitude of the flap movement. Nevertheless, with this finding it is possible to generate a homogenous flow field suitable for a 1:25 model scale. The next step for the start-up of the wing system, as a gust generator device, is to perform measurements of response forces using well-known geometries. By means of tests including spheres or flat plates the results obtained with this wing system can be compared to literature and theory. Based on these tests the functionality of the wing system will be demonstrated.
4.5. Expansion of Existing Experimental Methods Aerodynamic analysis of freight rail wagons usually consist of two different configurations: stand-alone railcar and multi-car train. Experiments or numerical analysis of stand-alone railcars are the simplest approach to realize the aerodynamic performance. However an installation of any upstream and downstream dummy vehicles to the single wagon could decrease any deficiencies which could rise up by extrapolation of the dependencies from a single car to a multi-car configuration.

G A H2020 – 730617 FR8-WP4-D-DLR-036-02 P a g e 38 | 73
The experimental facility (Figure 32) used for this campaign is the SWG – Seitenwindkanal Göttingen located in Simulation Center of Aerodynamic Research in Transportation (SCART) at Institute of Aerodynamics and Flow Technology - DLR with a test section of 2.4m x 1.6m x 9m (width x height x length). It is a Göttingen-type wind tunnel with a contraction of 3.13 ratio and driven by a 0.5 MW compressor. It can be operated in the flow speed range of 2 m/s < U < 65 m/s and the maximum Mach number that can be achieved is 0.189 (for details on the control of SWG: Fey, 2016).
Figure 32: SWG-SCART facility at DLR-Göttingen
4.5.1. Wind tunnel model This measurement campaign consists of two different experimental configurations in the wind tunnel:
a) Turntable and splitter plate for crosswind measurements (Figure 33): The splitter plate
with a streamwise length of 2380mm is mounted on the turntable in the middle of the
test section. The height of the test section ground for the splitter plate is 250mm in order
to keep the model outside of the boundary layer for all existing speeds in wind tunnel.
The plate can be rotated to measure forces at all considered crosswind angles.
G A H2020 – 730617 FR8-WP4-D-DLR-036-02 P a g e 39 | 73
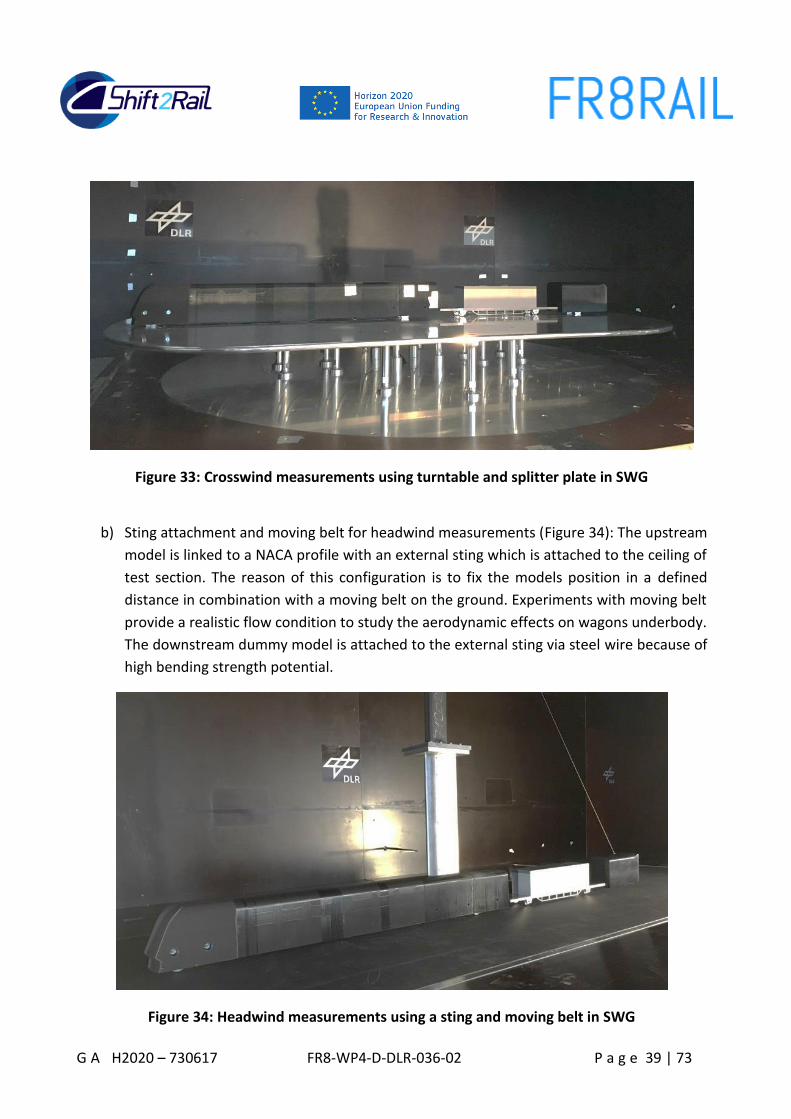
Figure 33: Crosswind measurements using turntable and splitter plate in SWG
b) Sting attachment and moving belt for headwind measurements (Figure 34): The upstream
model is linked to a NACA profile with an external sting which is attached to the ceiling of
test section. The reason of this configuration is to fix the models position in a defined
distance in combination with a moving belt on the ground. Experiments with moving belt
provide a realistic flow condition to study the aerodynamic effects on wagons underbody.
The downstream dummy model is attached to the external sting via steel wire because of
high bending strength potential.
Figure 34: Headwind measurements using a sting and moving belt in SWG

G A H2020 – 730617 FR8-WP4-D-DLR-036-02 P a g e 40 | 73
Figure 35: CAD-overview of wagon as measuring object
4.5.2. Installation of the Decoupled Balance System The aerodynamic force measurements are performed using piezoelectric force transducers located inside the container (Figure 35). These piezo elements are placed between two plates. The top plate is attached to wagon and container. In case of a wind force application on the containers surfaces, the wagon is affected by the container as well (see red dashed lines) and these two components are moving together. It should also be noted that the longitudinal beam is completely decoupled from the wagon (Figure 36) so that any deformation on the wagon and container regarding these forces can be acquired directly. The cables are directed through the underbody to the top of the external sting. The streamwise length of the wagon is also compatible with larger container sizes such as 16m in full scale. There are in total 4 piezoelectric force transducers (Kistler Typ 9317B) placed in two rows which allows to measure 3 orthogonal force components (Figure 37). The abovementioned plates are the contact surfaces that should transfer the forces. By applying a force the quartz elements inside the force links are creating a charge output which is proportional to the applied force and this charge is transferred via connector and cables to the amplifier. Within this procedure the force can be acquired digitally. The experiments mentioned below have been performed at 30m/s corresponding to Re = 235.000.

G A H2020 – 730617 FR8-WP4-D-DLR-036-02 P a g e 41 | 73
Figure 36: Decoupled wagon (both connection sides)
Figure 37: 3-component piezoelectric force transducers by Kistler
4.6. Wind Tunnel Test Campaign
4.6.1. Determination of aerodynamic forces as an input for vehicle dynamics
Containers can be identified as bluff bodies with their conventional cuboid shapes. The flow separations on their sharp edges create a detached flow characteristic which is responsible for a certain drag increase. At the very first step, the wind tunnel measurements at DLR focus on the aerodynamic shape optimization of the freight containers. Instead of changing the existing design of the container some modifications are attached at the rear surface. These objects are acting as passive flow control elements. Any kind of rear extensions bluff bodies’ tail could

G A H2020 – 730617 FR8-WP4-D-DLR-036-02 P a g e 42 | 73
manipulate the flow: the wake region gets smaller, the base pressure increases, thereby the drag can be reduced. Additionally, boat tailing acts also as well-known drag reduction method, however the flow condition is highly dependent on the upstream geometry. Figure and Table 1 show the designed and 3D-printed configurations for wind tunnel campaign at 30m/s. Straight & curved rear extensions (1 and 2), two different boat tailings (partially and full curved versions: 3 and 7), straight & curved lateral flaps (4 and 9), hull- & concave-shaped extensions (6 and 8) and straight & curved spoilers (5 and 10) are used to investigate the tendency of drag coefficient on freight container.
Figure 38: Configurations for aerodynamic optimizations on freight container

G A H2020 – 730617 FR8-WP4-D-DLR-036-02 P a g e 43 | 73
Table 1. Explanations of wind tunnel configurations mentioned in Fig 38
Config. Description
0 Basic configuration 1 Rear extension – straight, 40mm 2 Rear extension – curved, 40mm 3 Boat tailing – curved, 40mm 4 Lateral flaps – straight, 30mm 5 Spoiler – straight, 30mm 6 Hull, 80mm 7 Lateral boat tailing, 120mm 8 Concave extension, 120mm 9 Lateral flaps – curved, 40mm 10 Spoiler – curved, 40mm
Figure 39: Change of drag coefficient (in %) with respect to basic container
The results are summarized in Figure It can be concluded that curved extension (2) and full boat tailing (3) do not show the expected effect. Any other configurations represent a certain drag decrease. Rear extension at all edges (1), lateral flaps (4) and hull geometry (6) deliver similar results (approx. 40%). The straight spoiler on the top of the container (5) is more efficient than curved version (10). The boat tailing version with only lateral curved surface (7) is characterized with its best drag performance (approx. 60%). Regarding these results, 4 most efficient configurations are chosen (1, 4, 6 and 7) and their aerodynamic characteristics are tested in detail with various measures of the best configurations (Figure 40). 1, 4, 6, and 7 illustrates 3D-printed elements for this purpose.

G A H2020 – 730617 FR8-WP4-D-DLR-036-02 P a g e 44 | 73
Figure 40: Various sizes of the best configurations: 1, 4, 6 and 7
Figure 41: Drag coefficient regarding various configurations mentioned in Figure 40: Various sizes of the best configurations: 1, 4, 6 and 7
G A H2020 – 730617 FR8-WP4-D-DLR-036-02 P a g e 45 | 73
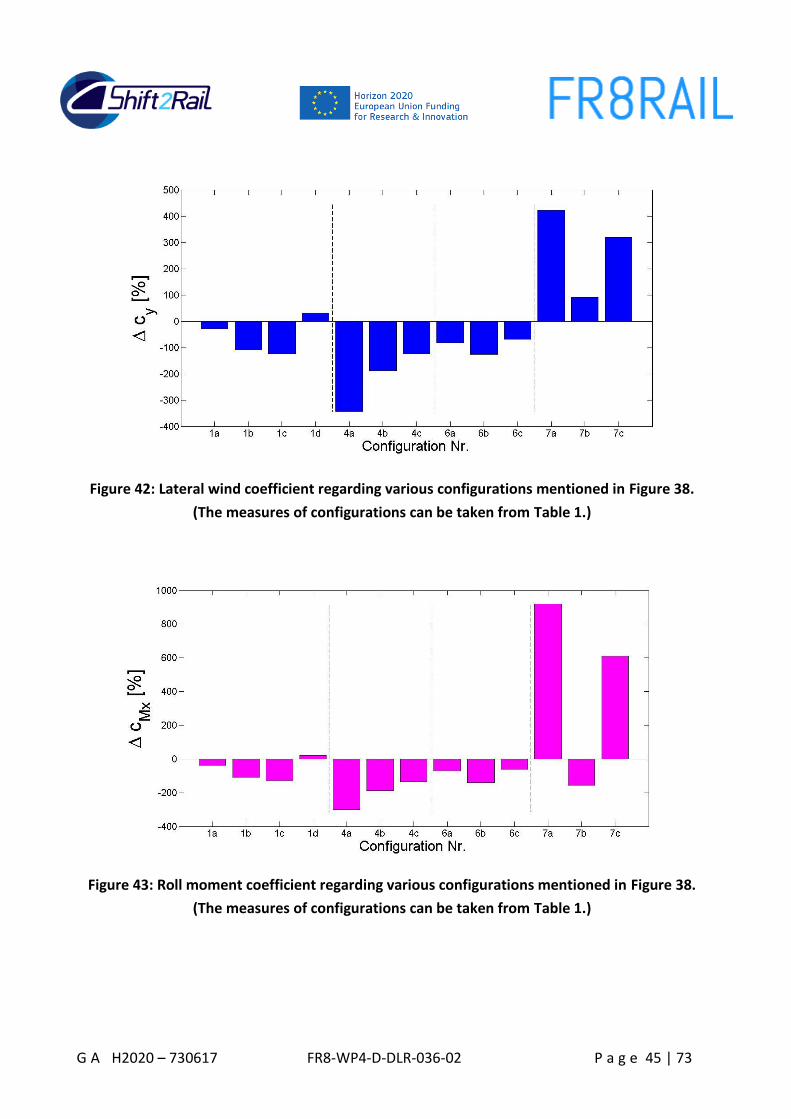
Figure 42: Lateral wind coefficient regarding various configurations mentioned in Figure 38.
(The measures of configurations can be taken from Table 1.)
Figure 43: Roll moment coefficient regarding various configurations mentioned in Figure 38.
(The measures of configurations can be taken from Table 1.)

G A H2020 – 730617 FR8-WP4-D-DLR-036-02 P a g e 46 | 73
Figure 44: Pitch moment coefficient regarding various configurations mentioned in Figure (The
measures of configurations can be taken from Table 1.)
Figure 45: Yaw moment coefficient regarding various configurations mentioned in Figure 38.
(The measures of configurations can be taken from Table 1.)

G A H2020 – 730617 FR8-WP4-D-DLR-036-02 P a g e 47 | 73
Additionally side force, roll and pitch moments are also taken into account beside drag coefficient to evaluate the aerodynamic phenomena (from Figure to Figure 45). In terms of high weight of freight wagons in full scale the lift force is neglected within this study. According to Figure 41, rear extensions (1) and lateral flaps (4) show the same tendency. The drag can be reduced gradually by increasing the longitudinal length of these elements. Hull geometry (6) and lateral boat tailing (7) cause a drag reduction at least with longer versions. As discussed in introduction, these gaps are one of the major aspects for poor aerodynamics of freight trains and mentioned geometries can be used to close the empty slots between the wagons. Lateral forces show a different characteristic than frontal wind resistance within a factor of 1 to 4 (Figure 42). Boat tailing provides high sensitivity for side winds because of its larger lateral surface. Same tendency can be observed for roll and yaw moments as they are dependent each other (Figure 43 and Figure 45). Yaw moments of boat tailing configurations provide an increase of 6 to 9 orders of magnitude which could be critical for container stability during the trip. The pitch moment (Figure 44) presents the highest values with 5 to 20 orders of magnitude for lateral flaps and rear extensions. By reviewing all results it can be concluded that best configurations do not show the same tendency with their different longitudinal lengths. Even the elements with best drag properties may cause extremely high moment values which have to be studied in detail regarding the stability and vehicle dynamics generally. An extreme lateral wind force may blow the containers from their flatbed. To avoid this it is necessary to focus not only on frontal wind characteristics but to consider the lateral forces as well. While it is clear that the application of these elements to freight containers could also be problematic in terms of usability and logistic regulations, the aim of the present study was to investigate the maximum potential energy savings for freight wagons. Based on these results with benchmark characteristics, further, more practical design solutions can be developed. It should also be noted that the drag decrease of 60 % (best performance provided by lateral boat tailing) is based on a configuration with upstream boundary conditions reflecting a short distance to the front of the train. Further investigations will include a thicker boundary layer on the upstream body in order to simulate a more downstream position of the freight wagon. This experimental campaign will be extended by investigating the crosswind characteristics and underbody of the wagon in near future. Next step of the wind tunnel measurement campaign is focused on headwind experiments regarding the interaction between upstream dummy vehicle and container wagon and the interaction between all three models (upstream vehicle, container wagon and downstream vehicle) including abovementioned configurations. During the first part of the campaign it has been observed that the acquired signals were weak due to the shorter vertical dimension of the container wagon in height. Regarding the dimensions, upstream and downstream dummy models were 20mm higher than the wagon with existing container (Figure 46a). This dimension difference may lead to a wake region right behind the upstream wagon and a direct contact of streamlines on the container surface may not be achieved successfully.

G A H2020 – 730617 FR8-WP4-D-DLR-036-02 P a g e 48 | 73
Figure 46: a) dimension difference of the container wagon and dummy models, used in
crosswind measurements, b) resized dummy models, used in headwind measurements.
Figure 47: Configurations used on upstream dummy model for headwind measurements;
corresponding to the configurations 3, 1, 4, 5, 9 and 10 in Table 1, respectively (flow direction
from left to right).

G A H2020 – 730617 FR8-WP4-D-DLR-036-02 P a g e 49 | 73
To avoid this problem the dummy models height is reduced down to the same level as the freight wagon with container (Figure 46b). Within this optimization on wind tunnel models stronger signals are expected. The results of the previous experiments reveal that the curved surfaces as rear extensions cause a drag improvement, but on the other hand their geometric shape is completely directing the flow on the frontal surface of the next vehicle. That means an exterior design optimization with drag improvement of a specific wagon can cause a drag increasement on the wagon behind. In that sense a periodic application of curved rear extensions on every freight wagon may not lead to a reliable solution. The investigated configurations for upstream model – container wagon – interaction can be seen on Figure 47.
Figure 48: Percentage difference of aerodynamic force coefficients of configurations 11-16

G A H2020 – 730617 FR8-WP4-D-DLR-036-02 P a g e 50 | 73
Figure 49: Configurations used for interaction between upstream model, container wagon and
downstream model; for descriptions see Table 2 (flow direction from left to right).
Table 2: Descriptions of wind tunnel configurations mentioned in Figure
Config. Description / Dimension
17 Upstream model: rear extension – straight, 30mm Container: rear extension – straight, 40mm
18 Container – front: rear extension – straight, 40mm Container – back: rear extension – straight, 30mm
19
Upstream model: rear extension – straight, 30mm Container – front: boat tailing – curved, 40mm
Container – back: rear extension – straight, 40mm Downstream model: boat tailing – curved, 40mm
20
Upstream model: rear extension – straight, 30mm Container – front: lateral boat tailing, 120mm
Container – back: rear extension – straight, 40mm Downstream model: lateral boat tailing, 80mm
21
Upstream model: boat tailing – curved, 30mm Container – front: rear extension – straight, 40mm
Container – back: boat tailing – curved, 40mm Downstream model: rear extension – straight, 30mm
22 Container – front: rear extension – straight, 40mm Downstream model: rear extension – straight, 30mm

G A H2020 – 730617 FR8-WP4-D-DLR-036-02 P a g e 51 | 73
Figure 50: Percentage difference of aerodynamic force coefficients of configurations 17-22
The effects of investigated configurations 11-16 applied to the upstream model can be seen on Figure 48. As mentioned previously, a curved surface on the upstream model diverts the streamlines to the frontal surface of the container. Using Configuration 11 an increase of approx. 70% is measured which is not suitable for aerodynamic improvement. Further measurements are based on variations with vertical geometries with sharp edges. Top spoiler configurations (Config.-14: straight & rectangular and Config.-16: curved) deliver the best drag reduction values; but their lateral and lift forces are increased drastically. Among the other experiments, straight rear extension (Config.-12) provides the best characteristics considering all aerodynamic forces although it leads to a drag improvement of only 10%. This modification will be examined within next step in detail. Figure 49 and Table 2 show the configurations measured to study the interaction between the models next to each other; the results can be observed in Figure 50. Rear extensions on upstream body and container (Config.-17) at the same time do not show any drag improvement. The opposite version of Config.-17 is presented in Config.-22. The sharp edges on the frontal surfaces of the container and downstream model reduce also the lift approx. 70%. Config.-19 is an improved version of Config.-17 with a short boat-tailing geometry in front of the container. 45% drag reduction is achieved with a less change of lateral force. If a larger boat-tailing device is applied (Config.-20) the drag is decreased down to approx. 60 %. The opposite version of Config.-19 is presented at Config.-21 and not a significant drag improvement can be observed among the

G A H2020 – 730617 FR8-WP4-D-DLR-036-02 P a g e 52 | 73
other variations. Yaw moments do not deviate too much except Config.-18 and -22. Flow separations on the sharp edges of rectangular extensions are leading to an additional yaw. Abovementioned measurement campaign enlightens the relation of three neighbor vehicles equipped with various aerodynamic kits. In the light of the analyzed results Config.-18, -19 and -20 deliver the best drag improvements. But Config.-19 with rectangular extensions on both sides of the container is characterized with his enormous lateral force increase which could be problematic in case of strong crosswind conditions in the open environment. A boat-tailing in the front with a rectangular extension at the rear surface seems to be the best aerodynamic combination in terms of interaction of connected railway cars. Depending on the geometric details a drag reduction up to 60 % can be achieved. Within this chapter it is aimed at understanding the aerodynamic behavior of freight train wagon with a conventional 40 foot-container in 1:25 scale and optimizing its exterior geometry experimentally. A freight container can be considered as “bluff body” with a high potential for an aerodynamic improvement. Vertical frontal and lateral surfaces with edges and corners are the main reasons for flow separations which are responsible for high drag. The gaps between the wagons & containers cause spontaneous differences in pressure gradient along the train and these aspects lead to additional resistance of container carrying long freight trains.
4.6.2. Investigation of crosswind conditions for next generation freight wagons
As mentioned in previous chapter, two different setups are used during the wind tunnel experiments. In the very first part, the crosswind behavior of the rear extension configurations is tested on a turntable with splitter plate (Figure 33). The splitter plate is integrated into the test section in order to peel off the wind tunnels shear layer. At the leading edge of this plate a new boundary layer is developed which is thinner than the original boundary layer of the facility. The main purpose is to keep the boundary layer as thin as possible in order to provide a feasible flow characteristic underneath the wind tunnel model. Figure shows the investigated configurations in crosswind conditions (for descriptions see: Table 3) with different angles of attack β from 0° to 30°. According to Orellano & Schober, 2006, β = 30° is the highest relevant yaw angle for the passenger trains travelling with a critical wind speed of approx. 30 m/s (corresponding to current high speed of existing freight trains). Eichinger et al. 2015 describes β = 30° as a value in the range of most critical yaw angles for crosswind performance. Recent study (Baker et al. 2013) show that even at lower yaw angles such as β = 1.5° the low speed crosswinds can affect the slipstreams of the trains. With respect to these comments in literature, β = 30° is taken as upper limit and all crosswind measurements have been performed through a range of yaw angles spanning -/+ 30°. Following steps for yaw angles are considered in current crosswind experiments: 0°, ±2.5°, ±5°, ±7.5°, ±15°, ±20°, ±30°.

G A H2020 – 730617 FR8-WP4-D-DLR-036-02 P a g e 53 | 73
Figure 51: Configurations used for crosswind measurements on splitter plate
Table 3: Descriptions of wind tunnel configurations mentioned in Figure
Config. Description / Dimension
0 Basic configuration
1 Rear extension – straight, 40mm
2 Rear extension – curved, 40mm
3 Boat tailing – curved, 40mm
4 Lateral flaps – straight, 30mm
5 Spoiler – straight, 30mm
6 Hull, 80mm
7 Lateral boat tailing, 120mm
8 Concave extension, 120mm
9 Lateral flaps – curved, 40mm
10 Spoiler – curved, 40mm

G A H2020 – 730617 FR8-WP4-D-DLR-036-02 P a g e 54 | 73
At the very first step drag coefficient values are compared at β = 0°. As shown in Figure 52, according to the differences based on the basic configuration (Config.-0), 4 configurations show an obvious drag reduction in headwind condition: 1, 4, 6 and 7 (for descriptions see Figure 40 and Table 1). This leads to a conclusion that a straight rear extension using rectangular flaps directly manipulates the flow at the rear surface of the container. The wake region gets smaller, the base pressure increases, thereby the resistance is reduced. These phenomena confirm the statements on the approaches for reducing the drag in hatchback ground vehicles mentioned in Schütz et al., 2013. The rear vertical surface of a rectangular box-shaped container can also be considered as the rear surface of a bus or truck. In that sense similar modifications can be applied on freight containers as well.
Figure 52: Resistance difference at β=0° (for configurations see Table 3 and Figure )

G A H2020 – 730617 FR8-WP4-D-DLR-036-02 P a g e 55 | 73
Figure 53: Percentage difference of drag force coefficients (cx), for labels in legend see Table 3 and Figure 51
Figures between 53 and 58 show the behavior of configurations using containers rear extension at various yaw angles. Subfigures labeled as (a) contain the results of rear extensions 1 to 5, and (b) 6 to 10 as seen in Figure 51 and Table 3. Drag force coefficients based on Figure 53 show that there is a tendency of drag reduction up to β = 5° and starting from this yaw angle the drag is increasing linearly. Only curved boat-tailing (Config.-3) and concave extensions (Config.-8) do not follow the same linear growth at β > 20°. In comparison to the basic configuration (black dashed line) straight rear extension (Config.-1), rectangular lateral flaps (Config.-4), hull extension (Config.-6) and lateral boat-tailing (Config.-7) show a significant drag reduction at β = 0°. The lateral boat-tailing (Config.-7) is characterized as the best configuration with lowest cx values. At high yaw angles the drag can be increased approx. 30%. Highest drag increase at various yaw angles can be observed on the configurations with sharp edges and corners (Configs-1,-4,-6 and -9). Curved surfaces show a better crosswind behavior at higher yaw angles. Especially the lateral boat-tailing (Config.-7) with lowest drag value at headwind (β = 0°) can be characterized with the best performance with approx. 15% increase of resistance at β = 30° with respect to headwind.

G A H2020 – 730617 FR8-WP4-D-DLR-036-02 P a g e 56 | 73
Figure 54: Percentage difference of lateral force coefficients (cy)
Figure 55: Percentage difference of lift force coefficients (cz)

G A H2020 – 730617 FR8-WP4-D-DLR-036-02 P a g e 57 | 73
Lateral forces (Figure 54) show similar characteristic through the entire range of yaw angles. At β = 30°, cy reaches its top value with an increase of approx. 150%. Boat-tailing configurations (Config.-3 and -7) present a different sensibility than the other variations. Except these two configurations, all rear extensions have similar lateral force coefficients at -7.5° < β < 7.5°. Starting from β > 7.5° (as well as β < -7.5°) the side forces do not follow the same trend and start to deviate from each other. Short boat-tailing (Config.-3) provides less lateral force than the other extensions. Concerning lift forces (Figure 55) no significant change can be observed in the entire yaw angle range. Lift is increased approx. 100% at highest yaw angle and similar trend can be detected in all configurations. Coefficients of pitching and yaw moments (Figure 56 and Figure 58) show as similar characteristics as lateral force coefficients (Figure 54) but with an increase of approx. 50 % at highest yaw angle. Short boat-tailing (Config.-3) has lowest moments among the other rear extensions. An obvious analogy can be seen in rolling moment coefficients trends (Figure 57). At β = ±7.5° lowest rolling moments can be detected as two peaks; until this yaw angle no significant change is visible. β > 7.5° (as well as β < -7.5°) the rolling moment is decreased approx. 10 % and keeps increasing as the yaw angle is increasing. Maximum rolling moment at β = ±30° is around 60 % higher than in headwind condition. Configurations 1, 4, 6 and 7 with improved drag characteristics obtain the highest rolling moments at higher yaw angles ranges.
Figure 56: Percentage difference of pitching moments (cMx)

G A H2020 – 730617 FR8-WP4-D-DLR-036-02 P a g e 58 | 73
Figure 57: Percentage difference of rolling moments (cMy)
Figure 58: Percentage difference of yaw moments (cMz)

G A H2020 – 730617 FR8-WP4-D-DLR-036-02 P a g e 59 | 73
Figure 59: Drag improvements of the best 4 geometries in %. (Config.-0 taken as reference)
Figure 59 shows a comparison of the best 4 geometries with their percentual drag improvements with respect to the basic configuration over the whole yaw angle range: rear extension, lateral flaps, hull and lateral boat-tailing. Lateral flaps (Config.-4) and hull-shaped extension (Config.-6) reduce the drag at β = 0° almost 50% but at 20° < β < 30° they show the same sensibility as the basic configuration. Straight rear extension is characterized with a much better drag improvement at β = 0° and the crosswind sensitivity at higher yaw angles is similar to Config.-4 and -6. Lateral boat-tailing (Config.-7) reduces the drag at β = ±30° approx. 50% and the sensitivity of β = ±5° can easily be monitored in all configurations. By reviewing these results one can state that any rear extension in order to close the gap is beneficial for reducing the drag force which is the primary aspect for energy consumption. Any geometric change with sharp edges and corners may cause higher moments at high yaw angles. Curved surfaces show a reliable improvement considering all aerodynamic coefficients. Config.-1 and Config.-7 will be taken into account while focusing at wagon interactions.

G A H2020 – 730617 FR8-WP4-D-DLR-036-02 P a g e 60 | 73
4.7. A preliminary approach to generate artificial turbulence on model
Figure 60: Boundary layer augmentation devices used in wind tunnel measurements
As mentioned in Chapter 5.5, the wind tunnel model consists of three main parts: the upstream body, the freight wagon with a container and the downstream body. Since we are focusing on the flow characteristics for a single wagon behind the upstream body, similar flow conditions as in full-scale should be provided. In a conventional freight train composition, every wagon with container is travelling in turbulent flow condition due to their bluff shapes. Considering a single wagon configuration, this phenomena should be simulated for wind tunnel model as well. For this purpose the so-called boundary layer augmentation devices (Figure 60) can be implemented to create an artificial turbulent flow. As mentioned in Bell et al., 2017 these augmentation devices can be used to achieve larger length-to-height-ratios for shorter wind tunnel models. Same study additionally claims that the application of this method could be used to model a wake more representative of a larger wind tunnel model and increase the accuracy of slipstream measurements. As preliminary study two boundary layer augmentation devices are used (low spire trip 30mm and high spire trip 70mm in height) and they are placed 200mm from the upstream body’s nose around the circumference of the model (Figure 60). To determine the effect of these devices 2D-Laser Doppler Anemometry (LDA) system is implemented. Within this non-intrusive measurement technique it is possible to measure the flow velocity using Doppler shift in a laser beam (Albrecht et al., 2003). The vertical plane is divided in three different windows: 1) leading part of the upstream body, 2) area between the augmentation device location and sting, 3) behind the sting. Due to the limitations by wind tunnels separated windows and support frames only 80mm behind the upstream body could have been measured (Figure 61).

G A H2020 – 730617 FR8-WP4-D-DLR-036-02 P a g e 61 | 73
Figure 61: Overview of LDA measurements with and without boundary layer augmentation
devices
Figure 62: LDA setup with traverse system placed outside of the SWG wind tunnel

G A H2020 – 730617 FR8-WP4-D-DLR-036-02 P a g e 62 | 73
Figure 63: Crossing laser beams inside the test section
Inside the aforementioned windows in xz-plane several velocity profiles have been measured in
streamwise direction. The upper edge of the upstream body’s rear is taken as coordinate origin
(Figure 63, right image). First two windows (in front of the sting which is holding the model) have
a vertical height of 100mm. For the largest configuration, the height of the third window behind
the sting is increased up to 200mm to detect any possible diversities in z direction by using a
larger tripping device.
In horizontal xy-plane, for basic configuration (without boundary layer augmentation device)
only a single window is taken into account which covers the whole area between the trains nose
and the end of the window 3. For the other cases the window is decreased and the the
measurement started right behind the augmentation devices. All necessary dimensions for
measurements in xy-plane are given in Figure 61. The results in contour plots can be seen in
Figure 64 and Figure 65.
The contour plots (Figure 64 and 65) show an expected velocity distribution in three different
cases. In basic configuration (without any augmentation devices) one can easily recognize the
development of the boundary layer on top of the upstream body in side view. Windows 1 and 2
in front of the sting (the black vertical element) are represented as a merged frame. Predictably
the flow does not remain attached behind the sting and a thicker boundary layer can be
observed in front of the container. The tripping effect of the augmentation devices can be seen
in other configurations. The darker regions in contour plots illustrate the artificially generated
turbulence behind these tripping devices. Especially the largest configuration (h=70mm) creates
a thicker shear layer as presented in top view.

G A H2020 – 730617 FR8-WP4-D-DLR-036-02 P a g e 63 | 73
Figure 64: Contour plots of streamwise velocity for 3 different configurations in side view

G A H2020 – 730617 FR8-WP4-D-DLR-036-02 P a g e 64 | 73
Figure 65: Contour plots of streamwise velocity for 3 different configurations in top view

G A H2020 – 730617 FR8-WP4-D-DLR-036-02 P a g e 65 | 73
Figure 66: Velocity and RMS profiles – basic configuration, without augmentation device

G A H2020 – 730617 FR8-WP4-D-DLR-036-02 P a g e 66 | 73
Figure 67: Velocity and RMS profiles, with small augmentation device: h=30mm

G A H2020 – 730617 FR8-WP4-D-DLR-036-02 P a g e 67 | 73
Figure 68: Velocity and RMS profiles, with large augmentation device: h=70mm

G A H2020 – 730617 FR8-WP4-D-DLR-036-02 P a g e 68 | 73
Figure 69: Comparison of velocity profiles behind the sting (window 3)
Figures 66, 67 and 68 represent the time-averaged mean velocities and root-mean-square (RMS)
of streamwise velocity fluctuations at various locations in aforementioned contour plots. The red
profiles stand for the local velocity 𝑢 normalized by free stream velocity 𝑢∞ in the wind tunnel
and the blue profiles for the RMS values normalized by the same free stream velocity as well.
RMS values symbolize the turbulence strength and a larger 𝑢𝑅𝑀𝑆 would indicate a higher
turbulence level. In basic configuration, velocity profiles in front and behind the sting show a
predicted tendency. But using aforementioned augmentation devices does not produce any
turbulent boundary layer profiles. A direct comparison of window 3 can be seen in Figure 69,
where the green and violet lines at 3 different streamwise locations (x=0mm, x=40mm and
x=80mm) stand for configurations with augmentation devices. The mean velocity at closest
location to the container (x=80mm) with high spire trip (violet line in diagram to the right)
resembles an atmospheric boundary layer profile. An instability generated by shear on the rear
of the upstream body is not achieved. For this reason no turbulent boundary layer profile can be
observed.
This preliminary study leads to the conclusion that the chosen design and lengths of these
augmentation devices are not appropriate for generating the required turbulence. In the next
step alternative designs for the tripping elements will be taken into account.
G A H2020 – 730617 FR8-WP4-D-DLR-036-02 P a g e 69 | 73
5. Conclusions The conclusions reached at this stage based on the results of the wind tunnel measurements at DLR – Institute of Aerodynamics and Flow Technology can be summarized as follows:
Considering the interaction of two wagons, any kind of sharp edged-extension at the
previous models rear surface may lead to a direct drag improvement of the freight
container.
A periodic application of rear extensions on upstream and downstream dummy
models would simulate the flow behavior more reliable.
Short- and long-size boat-tailings on the frontal surface with rectangular extensions
on the rear surface provide the best values.
Corresponding to current high speed of existing freight trains in existing literature β =
±30° is the most critical yaw angle for crosswind performance.
The drag of a basic container at the highest yaw angles measured in the experimental
campaign β = ±30° can be increased by approx. 25 % than at β = 0°.
In terms of drag force, β = ±5° are the most sensitive angles in the entire yaw angle
range. At these angles the drag coefficients are lower than at β = 0° and β > 5°.
Lateral and lift forces seem to behave similar as well as pitching and yaw moments.
β = ±7.5° are identified as sensitive angles in rolling moments.
Best drag values for an aerodynamically optimized container are acquired using 4
configurations: rear extension (1), lateral flaps (4), hull-shaped extension (6) and
lateral boat tailing (7).
For a more reliable turbulent flow condition around the wagon and container various
geometries of boundary layer augmentation devices (to be placed on the upstream
body) should be tested.

G A H2020 – 730617 FR8-WP4-D-DLR-036-02 P a g e 70 | 73
6. References
Albrecht, H.E., Damaschke, N., Borys, M., Tropea, C., Laser Doppler and Phase Doppler Measurement Techniques, Springer, 2003 Andersson, E., Häggström, J., Sima, M., Stichel, S., Assessment of Train-Overturning Risk due to Strong Cross-Winds, Proceedings of the Institution of Mechanical Engineers, Part F: Journal of Rail and Rapid Transit, Vol: 218, 2004, pp. 213-223 ATSB – Australian Transport Safety Bureau, Rail Occurrence Investigation, RO-2008-013, Technical Report Baker, C.J., Sterling, M., Aerodynamic Forces on Multiple Unit Trains in Cross Winds, Journal of Fluids Engineering, 131(10), 2009, 101103 Baker, C.J., The Simulation of Unsteady Aerodynamic Cross Wind Forces on Trains, Journal of Wind Engineering and Industrial Aerodynamics, 98(2), 2010, pp. 88-99 Baker, C.J., Quinn, A., Sima, M., Hoefener, L., Licciardello, R., Full-Scale Measurement and Analysis of Train Slipstreams and Wakes, Part I: Ensemble Averages, Proceedings of the Institution of Mechanical Engineers, Part F: Journal of Rail and Rapid Transit, Vol: 228(5), 2013, pp. 451-467 Beagles, A.E, Fletcher, D.I., The Aerodynamics of Freight: Approaches to Save Fuel by Optimizing the Utilization of Container Trains, Proceedings of the Institution of Mechanical Engineers, Part F: Journal of Rail and Rapid Transit, Vol: 227(6), 2013, pp. 635-643 Bell, J., Burton, D., Thompson, M.C., Herbst, A.H., Sheridan, J., A Wind-Tunnel Methodology for Assessing the Slipstream of High-Speed Trains, Journal of Wind Engineering and Industrial Aerodynamics, 166, 2017, pp. 1-19 Bennett, R.M., Gilman, J. Jr., A Wind-Tunnel Technique for Measuring Frequency-Response Functions of Gust Load Analyses, Journal of Aircraft, Vol: 3, No: 6, 1966, pp. 535-540 Coon, J.D., Visser, K.D., Drag Reduction of a Tractor-Trailer Using Planar Boat Tail Plates, In: The Aerodynamics of Heavy Vehicles: Trucks, Buses and Trains (ed. Ross et al.), Lecture Notes in Applied and Computational Mechanics, Vol: 19, Springer, Berlin-Heidelberg, 2004, pp. 249-275 Cooper, R., The Effect of Cross-Winds on Trains, Journal of Fluids Engineering, Vol. 103(1), 1981, pp. 170-178 Copley, J.M., The Three-Dimensional Flow Around Railway Trains, Journal of Wind Engineering and Industrial Aerodynamics, 26(1), 1987, pp. 21-52

G A H2020 – 730617 FR8-WP4-D-DLR-036-02 P a g e 71 | 73
Dorigatti, F., Sterling, M., Baker, C.J., Quinn, A.D., Crosswind Effects on the Stability of a Model Passenger Train – A Comparison of Static and Moving Experiments, Journal of Wind Engineering and Industrial Aerodynamics, 138, 2015, pp. 36-51 Eichinger, S., Sima, M., Thiele, F., Numerical Simulation of a Regional Train in Cross-Wind, Proceedings of the Institution of Mechanical Engineers, Part F: Journal of Rail and Rapid Transit, Vol: 229(6), 2015, pp. 625-634 Englar, R.J., Pneumatic Heavy Vehicle Aerodynamic Drag Reduction, Safety Enhancement and Performance Improvement, In: The Aerodynamics of Heavy Vehicles: Trucks, Buses and Trains (ed. Ross et al.), Lecture Notes in Applied and Computational Mechanics, Vol: 19, Springer, Berlin-Heidelberg, 2004, pp. 277-302
Eurostat, Railway transport - goods transported, by group of goods - from 2008 onwards based on NST 2007: http://appsso.eurostat.ec.europa.eu/nui/show.do?dataset=rail_go_grpgood&lang=en last access: 16.10.2018 Fey, U., Using Appropriate Boundary Layer Tripping on High-Speed Train Models Used in Wind Tunnel Experiments to Minimize Reynolds Number Effects, 8th International Colloquium on Bluff Body Aerodynamics and Applications, Northeastern University, Boston, Massachusetts, USA, June 7-11, 2016 Gawthorpe, R.G., Wind Effects on Ground Transportation, Journal of Wind Engineering and Industrial Aerodynamics, 52, 1994, pp. 73-92 Gielow, M., Furlong, C., Results of Wind Tunnel and Full-Scale Tests Conducted from 1983 to 1987 in Support of the Association of American Railroads Train Energy Program, Tech. Rep. 1988 Golovanevskiy, V.A., Chmovzh, V.V., Girka, Y.V., On the optimal model configuration for aerodynamic modeling of open cargo railway train, Journal of Wind Engineering and Industrial Aerodynamics, 107-108, 2012, pp. 131-139 Goos, W. F. M., Locomotive Performance: The Result of a Series of Researches Conducted by the Engineering Laboratory of Purdue University, 1907, New York, pp. 377-410 Hemida, H., Baker, C., Large-Eddy Simulation of the Flow Around a Freight Wagon Subjected in Crosswind, Computers & Fluids, 39(10), 2010, pp. 1944-1956 Holmes, D.W., Lift and Measurements in an Airfoil in Unsteady Flow, ASME International Gas Turbine Conference and Products Show, Washington DC, April 8-12, 1973, Paper No. 73-GT-41, pp. V001T01A041

G A H2020 – 730617 FR8-WP4-D-DLR-036-02 P a g e 72 | 73
Khalighi, B., Zhang, S., Koromilas, C., Balkanyi, S.R., Bernal, L.P., Iaccarino, G., Moin, P., Experimental and Computational Study of Unsteady Wake Flow Behind a Bluff Body with a Drag Reduction Device, SAE SP-1600, Warrendale, PA., 2001, pp. 221–234 Lai, Y.-C., Barkan, C.P.L., Options for improving the energy efficiency of intermodal freight trains, Transportation Research Record: Journal of the Transportation Research Board, No. 1916, Transportation Research Board of the National Academies, Washington, D.C., 2005, pp. 47–55 Lai, Y.-C., Barkan, C.P.L., Önal, H., Optimizing the aerodynamic efficiency of intermodal freight trains, Transportation Research Part E 44, 2008, pp. 820-834 Li, C., Kost, M., Burton, D., Sheridan, J., Thompson, M.C., Impact of Gap/Load Spacing on the Aerodynamic Performance of Intermodal Freight Trains, In: H. Chowdhury, & F. Alam (Eds.), Proceedings of the 19th Australasian Fluid Mechanics Conference (AFMC), Melbourne Vic Australia: RMIT University, 2014, pp. 1-4 Michelbach, A., Blumrich, R., Upgrade of the Full-Scale Aeroacoustic Wind Tunnel of Stuttgart University by FKFS, In: Bargende et al. (Hrsg.), 15. Internationales Stuttgarter Symposium: Automobil- und Motorentechnik, 2015, Springer Vieweg Verlag, Wiesbaden, pp. 497-523 Morelli, A., A New Aerodynamic Approach to Advanced Automobile Basic Shapes, SAE SP-1524, Warrendale, PA., 2000, pp. 173–182 Müller, M., Leitner, F., Ehrenfried, K., Wagner, C., System of Oscillating Flaps to Impose Unsteady Aerodynamic Loads on Vehicle Models: Development, Construction and Initial Operation, IFV Bahntechnik e.V. – 3rd International Symposium RAIL-Aerodynamics 2018: Aerodynamics of Trains and Infrastructure, 31. Jan. - 01. Feb. 2018, Berlin Orellano, A., Schober, M., Aerodynamic Performance of a Typical High-Speed Train, Proceedings of the 4th WSEAS International Conference on Fluid Mechanics and Aerodynamics, Elounda, Greece, August 21-23, 2006, pp. 18-25 Öst, J., Krajnovic, S., A study of the aerodynamics of a generic container freight wagon using Large-Eddy Simulation, Journal of Fluids and Structures 44, 2014, pp. 31-51 Paul, J., Johnson, R., Yates, R., Application of CFD to railcar and locomotive aerodynamics, In: Aerodynamics of Heavy Vehicles II: Trucks, Buses and Trains (eds. Browand et al.), Springer, 2009, pp. 259-297 Raghunathan, R.S., Kim, H.D., Setoguchi, T., Aerodynamics of High-Speed Railway Train, Progress in Aerospace Sciences, 38(6), 2002, pp. 469-514

G A H2020 – 730617 FR8-WP4-D-DLR-036-02 P a g e 73 | 73
RAIB – Rail Accident Investigation Branch, Detachment of Containers from Freight Wagons near Cheddington and Hardendale, Rail Accident Report, 2009 Schütz, T. (ed.), Hucho – Aerodynamik des Automobils, 6th edn., Springer, 2013, pp. 277-294 Soper, D., Baker, C.J., Sterling, M., An Experimental Investigation to Assess the Influence of Container Loading Configuration on the Effects of a Crosswind on a Container Train, Journal of Wind Engineering and Industrial Aerodynamics, 145, 2015, pp. 304-317 Tang, D.M., Cizmas, P.G.A., Dowell, E.H., Experiments and Analysis for a Gust Generator in a Wind Tunnel, Journal of Aircraft, Vol: 33, No: 1, 1996, pp. 139-148 TSI – Technical Specifications for Interoperability, EU Law and Publications, Commission Decision of 21 February 2008 concerning a Technical Specification for Interoperability Relating to the ‘Rolling Stock’ Sub-system of the Trans-European High-Speed Rail System (notified under document number C(2008) 648), p. 84/330 Watkins, S., Saunders, J., Kumar, H., Aerodynamic Drag Reduction of Good Trains, Journal of Wind Engineering and Industrial Aerodynamics, 40(2), 1992, pp. 147-178 Wende, D., Fahrdynamik des Schienenverkehrs, Teubner Verlag, Wiesbaden, 2003 Wojciak, J.D., Quantitative Analysis of Vehicle Aerodynamics during Crosswind Gusts, PhD Thesis, TU München, 2012


![Separated Pitch Control at Tip (SePCaT): Innovative Blade ... · Growth in the size of wind turbines since 1985-Courtesy UpWind [1] ... Start with optimized aerodynamic design for](https://img.pdfslide.net/doc/110x75/602f8e80c653846705496c28/separated-pitch-control-at-tip-sepcat-innovative-blade-growth-in-the-size.jpg)