Embed Size (px)
Citation preview

This project has received funding from the European
Union’s Horizon 2020 research and innovation
programme under grant agreement No 727477
Closed Loop Wind Farm Control
DELIVERABLE REPORT
Feasibility analysis, business models, and business
plan industrial partners and large Engineering firms
and Value Proposition
Deliverable No. D5.2 Work Package No. WP5 Task/s No. Tasks
5.2.1/5.2.2/5.2.3
Work Package Title WP5. IPR, Exploitation, Dissemination and Communication of results
Linked Task/s Title Task 5.2.1 Feasibility Analysis and Business Model (LCoE, TCO).
Task 5.2.2 Industrial Detailed Business Plan
Task 5.2.3 Value Proposition
Status Draft Final (Draft/Draft Final/Final)
Dissemination level PU (PU-Public, PP, RE-Restricted, CO-Confidential)
(https://www.iprhelpdesk.eu/kb/522-which-are-
different-levels-confidentiality)
Due date deliverable 2019-10-31 Submission date 2019-10-30
Deliverable version CL-Windcon-D5.2-DraftFinal-Business Models
Ref. Ares(2019)6736605 - 30/10/2019

D5.2. Feasibility analysis, business models, and business plan
industrial partners and large Engineering firms and Value
Proposition
public
Copyright CL-Windcon Contract No. 727477 Page 2
DOCUMENT CONTRIBUTORS
DOCUMENT HISTORY
Deliverable responsible Qi Energy
Contributors Organization Reviewers Organization
Juan de Blas Qi Energy Alessandro Croce POLIMI
Javier Medina Qi Energy Torben Knudsen AAU
Oscar Pires CENER
Sergio Monreal CENER
Version Date Comment
V1 2019-09-30 D5.2 Feasibility Analysis-Draft-V1
V2 2019-10-24 D5.2 Feasibility Analysis-Draft-V2
V3 2019-10-29 D5.2 Feasibility Analysis-Draft Final-V3
DraftFinal 2019-10-30 Draft Final

D5.2. Feasibility analysis, business models, and business plan
industrial partners and large Engineering firms and Value
Proposition
public
Copyright CL-Windcon Contract No. 727477 Page 3
TABLE OF CONTENTS
EXECUTIVE SUMMARY ..................................................................................................................................... 6
1 INTRODUCTION ............................................................................................................................................. 8
2 METHODOLOGY ............................................................................................................................................ 9
3 SENSIBILITY ANALYSIS ................................................................................................................................. 10
3.1 PREAMBLE .................................................................................................................................................. 10
3.2 SENSIBILITY ANALYSIS METHODOLOGY ..................................................................................................... 12
3.3 SENSIBILITY ANALYSIS SINGLE RESULTS ..................................................................................................... 13
3.3.1 Modification of the OPEX costs ........................................................................................................... 13
3.3.2 Modification of the Net Energy Production ........................................................................................ 15
3.3.3 Variation of the WACC......................................................................................................................... 16
3.3.4 Variation of the inflation rate .............................................................................................................. 17
4 PRELIMINAR BUSINESS STRUCTURING ........................................................................................................ 20
4.1 TYPE OF ENTITIES ....................................................................................................................................... 20
4.2 TYPE OF APPLICATIONS .............................................................................................................................. 20
4.3 TYPE OF SERVICES ....................................................................................................................................... 22
5 BUSINESS MODELS ...................................................................................................................................... 25
5.1 INTRODUCTION .......................................................................................................................................... 25
5.2 CANVAS FOR GROUP OF “PURE RESEARCHERS” ........................................................................................ 26
5.3 CANVAS FOR GROUPS OF “MIX ORGANIZATIONS” .................................................................................... 29
5.4 CANVAS FOR GROUPS OF “PURE BUSINESS” ............................................................................................. 33
6 BUSINESS PLANS.......................................................................................................................................... 36
6.1 OVERVIEW OF THE WIND SECTOR.............................................................................................................. 36
6.2 COMPETITIVE POSITION OF THE CL-WINDCON LARGE COMPANIES.......................................................... 40
6.2.1 ENEL GREEN POWER – Competitive Position ...................................................................................... 40
6.2.2 DNV GL – Competitive Position ........................................................................................................... 41
6.2.3 GE – Competitive Position ................................................................................................................... 42
6.2.4 RAMBOLL – Competitive Position ....................................................................................................... 43
6.2.5 DEWI – Competitive Position .............................................................................................................. 44
6.2.6 Global view Serviceable Addressable Market (SAM) large companies ............................................... 45
6.3 MIX ORGANIZATIONS- COMPETITIVE POSITION ........................................................................................ 47
6.4 PURE RESEARCHER ORGANIZATION – COMPETITIVE POSITION ................................................................ 48
6.5 GLOBAL ECONOMIC IMPACT ...................................................................................................................... 48
7 CONCLUSIONS ............................................................................................................................................. 49
8 REFERENCES ................................................................................................................................................ 50

D5.2. Feasibility analysis, business models, and business plan
industrial partners and large Engineering firms and Value
Proposition
public
Copyright CL-Windcon Contract No. 727477 Page 4
LIST OF FIGURES
Figure 1. Windfarm layout..................................................................................................................... 10
Figure 2. Pessimistic and Optimistic scenario when varying OPEX (in Yaw scenario ) over most
probable ................................................................................................................................................ 14
Figure 3. Pessimistic and Optimistic scenario when varying Net Load Factor ...................................... 15
Figure 4. Pessimistic and Optimistic scenario when varying the WACC ............................................... 17
Figure 5. Pessimistic and Optimistic scenario when varying the Inflation Rate.................................... 18
Figure 6. Baseline and yaw differences under a combination of positive and negative effects ........... 19
Figure 7. CANVAS model ....................................................................................................................... 25
Figure 8. Global annual installed wind capacity 2001-2018 .................................................................. 36
Figure 9. Global cumulative installed wind capacity 2001-2018 ........................................................... 37
Figure 10. New installations and total capacity in onshore and offshore in 2018 ................................ 38
Figure 11. Global Cumulative Wind Power Capacity. WEC Outlook 2016. .......................................... 39
Figure 12. EGP Green energy distribution globally ............................................................................... 40
Figure 13. Revenues distribution DNV by sector ................................................................................... 42
Figure 14. Services provided by UL Renewables ................................................................................... 45
LIST OF TABLES
Table 1. Sensibility analysis main results................................................................................................. 6
Table 2. Economic impact of technology in large companies in CL-Windcon ......................................... 7
Table 3. Results of the yaw and base control systems in the most probable scenario ........................ 12
Table 4. Sensibility analysis. Parameters modified ............................................................................... 13
Table 5. Pessimistic and Optimistic scenarios when varying the OPEX costs in the yaw scenarios ..... 14
Table 6. Pessimistic and Optimistic scenario when varying the Net Energy production over most
probable ................................................................................................................................................ 15
Table 7. Pessimistic and Optimistic scenario when varying the WACC over most probable ................ 16
Table 8. Pessimistic and optimistic scenarios when varying the inflation rate ..................................... 17
Table 9. Combination of all negative and positive variables with all effects simultaneously ............... 18
Table 10. Applications for the software developed .............................................................................. 21
Table 11. Market routes for the different software .............................................................................. 22
Table 12. Market potential from the perspective of the Industrial /large Consulting partners ........... 23
Table 13. CANVAS Pure Researcher organizations ................................................................................ 28
Table 14. Mix Organizations CANVAS model ........................................................................................ 32
Table 15. Pure Businesses CANVAS model ............................................................................................ 35
Table 16. Installed and managed Wind Capacity World/ENEL 2017 ..................................................... 41
Table 17. EPG Distribution of capacity managed by country and technology, (EGP web site – April
2018)...................................................................................................................................................... 41
Table 18. TAM and SAM markets .......................................................................................................... 46
Table 19. SOM market for EGP .............................................................................................................. 46
Table 20 SOM market for GE ................................................................................................................. 47
Table 21. SOM market for the Consultancy ad Engineering companies ............................................... 47
Table 22. Global SOM market for large CL-Windcon firms (2026-2030) .............................................. 47

D5.2. Feasibility analysis, business models, and business plan
industrial partners and large Engineering firms and Value
Proposition
public
Copyright CL-Windcon Contract No. 727477 Page 5
LIST OF ABBREVIATIONS
Abbreviation Description
AEP Annual energy production
BOP Balance of Plant
CAPEX Capital Expenditure
EOL End of life
ESC Energy Service Company
KPI Key performance indicator
LCA Life cycle assessment
LCC Life Cycle Costing
LCOE Levelized Cost of Electricity
MO Mixed Organizations (organizations market and research driven)
MW Megawatt
O&M Operation and maintenance
OPEX Operational Expenditure
PB Pure Businesses (organizations business oriented)
PR Pure Researchers (organizations research driven)
RWF Reference Wind Farm
SAAS Software as a Service
SAM Serviceable Available Market or market we can serve
SOM Serviceable Obtainable Market or market quote
TAM Total Addressable Market
TCO Total Cost of Ownership
WACC Weighted average cost of capital

D5.2. Feasibility analysis, business models, and business plan
industrial partners and large Engineering firms and Value
Proposition
public
Copyright CL-Windcon Contract No. 727477 Page 6
EXECUTIVE SUMMARY
Deliverable D5.2 provides an overview of the economic impacts the technology will generate in the
marketplace and is based on the results obtained in an exercise implemented in deliverable D4.6
entitled Cost benefit analysis and some other information collected in the project. The baseline
scenario was compared with the yaw scenario where the wakes were reoriented to improve the
Wind farm performance.
The economic results are not conclusive so far, as they only considered one of the technics the CL-
Windcon project considered “the wake redirection”. Therefore, there is margin for improvement in
case other technics were implemented at same time. Indeed, the methodology to calculate wake
effects was slightly simplified, and some authors differs on results (please check deliverable D4.6
Cost-benefit analysis, for further results). For that reason, to extend the conclusions, the first chapter
of deliverable D5.2 introduces a sensibility analysis to check the evolution of the model in case any of
the main assumptions will vary. The parameters modified were WACC, Inflation Rate, level of O&M
costs and energy generation.
We established a positive, most likely and negative scenarios and the results showed that LCC could
vary out of EUR 30 million up or down making the LCC negative in the worst case but saving around
EUR 46 million in the best case during the whole lifetime.
With the most probably scenario, with extra savings of EUR 27 million at present value in 25 years,
we prepared three CANVAs models to assess the potential business opportunities for three different
groups of partners; those focused on making research (mainly universities), those we called mix
organizations (technological centres and some market driven universities), who look for private
incomes through services but are also research oriented as the first group. Finally, the third group
entitled “Pure Businesses” gathering the large companies involved in CL-Windcon. The Value
Proposition was determined for the three groups and then a business case was prepared for each
large company in the project and the rest of partners.
Table 1. Sensibility analysis main results
D5.2. Feasibility analysis, business models, and business plan
industrial partners and large Engineering firms and Value
Proposition
public
Copyright CL-Windcon Contract No. 727477 Page 7
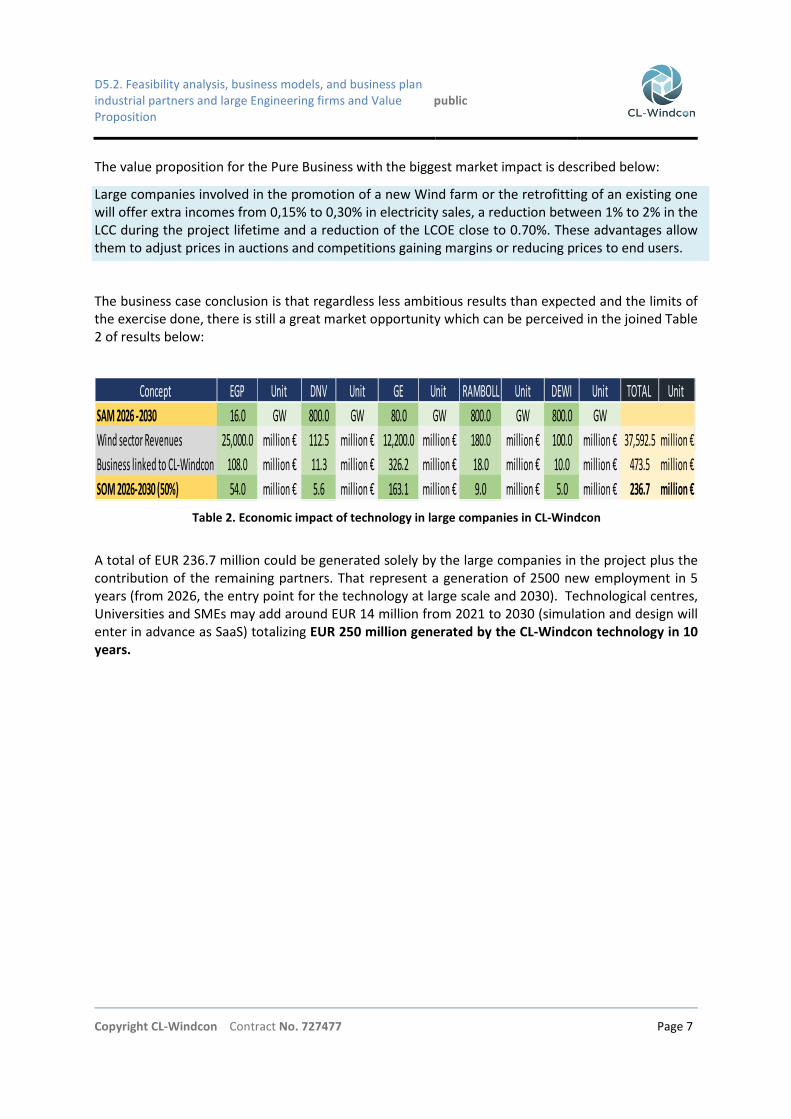
The value proposition for the Pure Business with the biggest market impact is described below:
Large companies involved in the promotion of a new Wind farm or the retrofitting of an existing one
will offer extra incomes from 0,15% to 0,30% in electricity sales, a reduction between 1% to 2% in the
LCC during the project lifetime and a reduction of the LCOE close to 0.70%. These advantages allow
them to adjust prices in auctions and competitions gaining margins or reducing prices to end users.
The business case conclusion is that regardless less ambitious results than expected and the limits of
the exercise done, there is still a great market opportunity which can be perceived in the joined Table
2 of results below:
A total of EUR 236.7 million could be generated solely by the large companies in the project plus the
contribution of the remaining partners. That represent a generation of 2500 new employment in 5
years (from 2026, the entry point for the technology at large scale and 2030). Technological centres,
Universities and SMEs may add around EUR 14 million from 2021 to 2030 (simulation and design will
enter in advance as SaaS) totalizing EUR 250 million generated by the CL-Windcon technology in 10
years.
Concept EGP Unit DNV Unit GE Unit RAMBOLL Unit DEWI Unit TOTAL Unit
SAM 2026 -2030 16.0 GW 800.0 GW 80.0 GW 800.0 GW 800.0 GW
Wind sector Revenues 25,000.0 million € 112.5 million € 12,200.0 million € 180.0 million € 100.0 million € 37,592.5 million €
Business linked to CL-Windcon 108.0 million € 11.3 million € 326.2 million € 18.0 million € 10.0 million € 473.5 million €
SOM 2026-2030 (50%) 54.0 million € 5.6 million € 163.1 million € 9.0 million € 5.0 million € 236.7 million €
Table 2. Economic impact of technology in large companies in CL-Windcon
D5.2. Feasibility analysis, business models, and business plan
industrial partners and large Engineering firms and Value
Proposition
public
Copyright CL-Windcon Contract No. 727477 Page 8
1 INTRODUCTION
This deliverable is addressed to respond to subtasks 5.2.1. “Feasibility Analysis and Business Model”
(LCoE, TCO), subtask 5.2.2. “Industrial Detailed Business Plan” and subtask 5.2.3. “Value Proposition”
in relation to the new Windfarm control software. The analysis is based on results of deliverable D4.6
entitled “Cost benefit analysis” that included a Life Cycle Costing (LCC, economic viewpoint) and a
Life Cycle Analysis (LCA, environmental viewpoint). The analysis is also based in the evolution of the
wind markets which is included in the last innovation management deliverable (D5.3) and the last
version of the IPR updates (deliverable D5.4).
This report will be then organized in four main blocks of information according to the proposal:
• The sensibility analysis prepared to extend the conclusions of the economic analysis when
some assumptions were modified.
• The Feasibility Study reviews main options to determine the best Business Model for the
new control algorithms exploitation. The Business Model will be defined for each company in
the Consortium, describing best ways to generate revenues/cost-effectiveness and make a
profit from operations in terms of time and costs. The model includes the components and
functions of the business, as well as the revenues it generates and the expenses it incurs.
• Value Proposition. A review and analysis of the benefits, costs and value that an organization
can deliver to its customers, prospective customers, and other constituent groups and
outside the organization will be the target. The entities will perceive the operational
profitability that the new control algorithms would bring to them.
• A detailed Business Plan is developed for the main industrial partners (EGP, GE) and large
engineering companies (DNV, RAMBOLL, DEWI), who will be responsible to land the final
products into the marketplace. Product definition, channels for commercialization, main
competitors, prices, marketing tools, economic insights, etc., This analysis is done gathering
the companies by profile as the results were not so promising to deepen inside each of
project partners.
As a final comment, we must insist again that the results from the LCC and LCA cannot be
considered conclusive due to the complexity of simulating the expected failure rates of a turbine
submitted to a different inflow wind compared with greedy conditions (base case). This
simulation affects the Operation and Maintenance (O&M) that increases costs, but at same time
improves the energy output with the result of a slightly better LCOE. The impossibility to prove
the technology in a complete real environment (Sedini wind farm was used partially to simulate
some results in a short period of time) and see what happen during 30 years in the real life,
summed up to the variations of the wind and terrain conditions, the windfarm layout in every
site and the capacity of the engineering team in charge of the windfarm to define the wake
redirections in the appropriate way, provides a great range of uncertainty of results.
For that reasons, we include a sensibility analysis modifying some of the parameters (WACC,
Inflation rate, O&M costs, energy output) to check what happen with the results in such a case. A
very positive or a very negative result will modify the business model and the corresponding
company business plans. However, we will analyse the results focusing on the Base case and
leaving the positive and negative options just for information, without making a deep analysis.

D5.2. Feasibility analysis, business models, and business plan
industrial partners and large Engineering firms and Value
Proposition
public
Copyright CL-Windcon Contract No. 727477 Page 9
2 METHODOLOGY
The methodology to drawing up this deliverable was based on the usage of scientific papers, annual
reports from large sectorial consultancy companies and internal data and previous deliverables
generated within the project. The main purpose of the report is to conduct a quantitative analysis to
determine the impact of the new control algorithms in the marketplace.
Supported by a former intermediate deliverable that reviewed the market trends and opportunities
(D5.9 Innovation management), the final version (D5.3), pointed out the most relevant updated
information on market trends connected to the technology. Deliverable D4.6 Cost benefit analysis,
provided as well a complete LCC and LCA. With this information, we have calculated here the
economic impact in the main project partners as soon as the technology will enter into the market.
The market information developed in deliverables D5.3 was based on qualitative analysis carried out
through the consultation of numerous and updated annual reports of international organizations
such as the Global Wind Energy Council (GWEC), International Renewable Energy Agency (IRENA),
International Energy Agency (IEA), WindEurope, etc. These reports described the current situation of
the wind energy market and the possible future trends, giving a general overview of the potential
growth of the market. Please check references in deliverable D4.6.
The economic-quantitative analysis presented in deliverable D4.6, concerns the calculation of the Life
Cycle Costing (LCC) and the Levelized Cost of Energy (LCOE) and was also supported by scientific and
public literature, such us a Guide to an offshore windfarm, BVGA and Catapult, 2019, Forecasting
Wind Energy Costs and Cost drivers, the view of the world leading experts NREL, 2016, Cost of Wind
Energy Review, NREL, 2015, Floating Offshore Wind: Market and Technology Review, Carbon Trust,
2015, Parametric CAPEX, OPEX, and LCOE expressions for offshore windfarms based on global
deployment parameters, Cranfield University, 2018, among others. Please check the references also
in deliverable D4.6.
Some internal data arising from the pilot experiences (Sedini and wind tunnel) and the company
calculations were also used to elaborate the final conclusions.
These final conclusions can be viewed as the fruit of the analyses conducted by the deliverable
authors according dedicated calculation along with o the findings encountered in the market search.
However, they are not conclusive and should be rather used internally by project partners to initiate
new activities or propose new strategic actions. Thus, the document is divided in three main
chapters.
1. Sensibility analysis
2. Business models (Through CANVAS) including the Value Proposition
3. Business Plans ( for three different groups of partners)

D5.2. Feasibility analysis, business models, and business plan
industrial partners and large Engineering firms and Value
Proposition
public
Copyright CL-Windcon Contract No. 727477 Page 10
3 SENSIBILITY ANALYSIS
3.1 Preamble
Deliverable D4.6 showed the results of an economic and environmental study over an offshore
reference windfarm (Norcowe) where the introduction of a new control system was simulated. The
Project developed advanced control algorithms for induction control and wake redirection to
optimize the operation of the windfarm, making a balance between annual energy production,
lifetime and O&M cost, aimed at minimizing the LCoE. To that end, it has applied techniques as
loads-optimized power curtailment; event triggered Individual Pitch Control (IPC) for loads reduction
under partial wake conditions, fault-tolerant and fast wake recovery techniques.
The Norcowe Windfarm is virtual windfarm used the reference Windfarm or (RWF hereinafter). It is
placed in the North Sea and is located around 80 km west of the German island Sylt and near the met
mast FINO 3. The RWF comprises 80 turbines of the type DTU 10 MW RWT (800 MW) and the layout
of the windfarm can be seen in Figure 1. Positions 26 and 61 in the layout are the positions of
substations. The distance between the rows is 8 rotor diameters and the distance between the
turbines is 7 rotor diameters.
Figure 1. Windfarm layout

D5.2. Feasibility analysis, business models, and business plan
industrial partners and large Engineering firms and Value
Proposition
public
Copyright CL-Windcon Contract No. 727477 Page 11
The main characteristics of the RWF are the following:
Description Value
•••• Rated Power (MW) 10
•••• Rotor Diameter (m) 178.3
•••• Hub height (m) 119
•••• Cut-in speed (m/s) 4
•••• Rated Speed (m/s) 11.4
•••• Cut-out speed (m/s) 25
•••• Cut-in Rotor speed (RPM) 6
•••• Cut-out Rotor speed (RPM) 9.6
The wind turbine is mounted on a jacket structure of which the main parameters can be found in the
next list:
Description Value
•••• Number of legs (units) 4
•••• Base Width (m) 33
•••• Top Width (m) 16
•••• Interface elevation (mMSL) 26
•••• Transition Piece height (m) 8
•••• Jacket legs outer diameter (upper/lower leg mm) 1422/1828
•••• 1st
eigen frequency (1st
bending mode) (Hz) 0.2635
The impact of the wake steering control strategy on power and fatigue load distribution was the
cornerstone of the study. Turbine level load data from wake steering control simulations was used to
estimate damage equivalent loads (DEL) for a range of wind speeds and yaw misalignments. This data
was checked with farm-level wind speed and direction distributions and thereby the distribution of
fatigue loading all along the windfarm was estimated.
According to results of deliverable D4.6, the wake redirection induces an increase in the average
loads of the windfarm. The reduction of the turbulences generated by the wakes in downstream
turbines, improves the wind velocity received and the corresponding loads. So, there is an increase
of failure rates due to this increase in loads. The main effect is therefore the growth of the O&M
costs (more repairing, more transportation, more spare parts) but at same time the energy output of
the windfarm is also increased, slightly improving the LCOE (€/MWh). Some other authors in CL-
Windcon consider that using a more precise simulation tool, the loads are not increased but reduced.
The reason is the consideration that partial wakes in a turbine increase loads much more than the
free wind (with no wakes) and when you yaw the wakes, you reduce failure rates. This is the reason
why we have foreseen a sensibility analysis to measure to what extend the LCOE may vary modifying
some of the assumptions.

D5.2. Feasibility analysis, business models, and business plan
industrial partners and large Engineering firms and Value
Proposition
public
Copyright CL-Windcon Contract No. 727477 Page 12
3.2 Sensibility analysis methodology
We present here the results of an exercise where we consider three scenarios; the optimistic one,
the most likely and the pessimistic, characterized as follows:
Most likely: The most probable scenario was described in deliverable D4.6 and corresponds with the
table below. The WACC was considered 5.12 (calculated by Ramboll in deliverable D4.5), the inflation
rate was 1.5% considering the trends in the last years, the variation between the OPEX from base and
yaw was limited to a 0,32% increase due to the raise of the failure rates an loads (please check
deliverable D4.6 for additional explanations). The net energy production is increased in 0.79% also
because of the average raise in loads. These two effects modify the LCOE with a 0.63% reduction.
The last three rows represent the economic results; increase or decrease of the Life Cycle Costing
considering the modifications of the operations and maintenance activities, increase of the net
energy production (as of the loads’ increase) and the net differences summing up both concepts. The
net difference represents the savings in economic terms comparing the yawed turbines belonging to
the wind farm with the same in greedy conditions (non-controlled).
The table indicates that in the most likely scenario, there will be a reduction of 0.63% in the LCOE
when using the new control algorithms, with a EUR 27.4 million savings (at present value) during the
whole project lifetime (around €1.08 million savings per year). The installation lifetime was
considered 25 years plus one additional year for dismantling.
However, some of the assumptions could be modified. For that reason, the next exercise (a
sensibility analysis) intends to modify some of the assumptions and see what happen with the LCOE.
The next sensibility analysis table identifies the parameters modified in the pessimistic and optimistic
scenarios.
BASE YAW Variation
Lifetime Windfarm Years
Discounted Rate (WACC) %
Inflation rate %
OPEX Costs € 1,286,897,125 1,291,006,916 0.32%
Total Costs (PV) € 2,448,294,807 2,451,886,907 0.15%
Net Energy production (MWh/MW/y) 5,677.80 5,722.40 0.79%
LCOE €/MWh 30.97 30.78 -0.63%
Total Energy Produced (PV) MWh 79,049,256 79,670,200 0.79%
Increase in LCC (Present Value) €
Increase in Net Energy sales (PV,50€) €
Net differences (Present Value) € 27,455,109
PROBABLE
-3,592,100
31,047,208
25+1
5.12
1.50
BASELINE CASE
Table 3. Results of the yaw and base control systems in the most probable scenario

D5.2. Feasibility analysis, business models, and business plan
industrial partners and large Engineering firms and Value
Proposition
public
Copyright CL-Windcon Contract No. 727477 Page 13
The methodology for the sensibility analysis modifies some of the initial assumptions. The effects of
each of these modifications are depicted in successive tables one by one, to prevent distorting that
effect by the accumulation of two or more effects at same time. At the end, all the negative
assumptions are gathered and the positive as well, to reach the extremes in the range of effects by
the combination of all them.
3.3 Sensibility analysis single results
3.3.1 Modification of the OPEX costs
We consider here than for the pessimistic scenario, the yaw calculations could be incorrect and the
real expenditure, when applying the new control algorithm (yaw scenario), might be 5% over the
most likely case. This higher figure could be reached in case we had to add extra gauges for different
windfarm configurations plus the extra expenses to run the control software. A 5% increase in the
OPEX could be possible due to this indetermination and other factors (cost of mobilization of boats,
increase in spare parts, etc.).
For the optimistic scenario, we consider that base and yaw scenarios require the same level of
investment for the Operation and Maintenance activities. This case relies in a more realistic
calculation of turbine loads based on the assumptions of other authors different to those involved in
deliverable D4.5 O&M Cost model (implemented by a team headed by Ramboll). These other authors
consider that the increase in loads when yawing the inflow wind (eliminating turbulences and
increasing the wind speed) could be offset with the reduction of the high partial loads a wake can
infer over the next turbine). Please for further explanations, revise deliverable D4.61.
BASE YAW BASE YAW BASE YAW
Discounted Rate (WACC) %
Inflation rate %
OPEX Costs € OPEX base Opex yaw + 5% OPEX base OPEX yaw OPEX base OPEX base
Net Energy production (MWh/MW/y) NEP base-20% NEP yaw -20% NEP base NEP yaw Net base+5% Net yaw+5%
LCOE €/MWh X1 X1' LCOE base LCOE yaw X2 X2'
Increase in LCC (Present Value) €
Increase in Net Energy sales (PV,50€) €
Net differences (Present Value) €
WACC Probable+4 WACC Probable WACC Probable -1.19
IR Probable-0.5 IR Probable IR Probable + 0.5
SENSIBILITY ANALYSIS PESSIMISTIC PROBABLE OPTIMISTIC
Net Diff pess Net Diff. Probable Net Diff opt
Inc/Dec LCC pess Incr/ Dec LCC Probable Inc / Dec LCC opt
Incr. NES pess Incr. NES Probable Incr. NES opt
Table 4. Sensibility analysis. Parameters modified

D5.2. Feasibility analysis, business models, and business plan
industrial partners and large Engineering firms and Value
Proposition
public
Copyright CL-Windcon Contract No. 727477 Page 14
The results are showed in the next table:
The results show that an underestimation of the OPEX costs in the yaw scenario in just 5% could
significate reduce the Net differences almost in a 40% with savings of €17 million instead of €27
million in present value for the 25 years of operation.
In addition, in the optimistic scenario, if we consider that fatigue loads on the turbines in the base
case and the yaw case are more or less equivalent, then, the O&M expenditure might be also
equivalent, but the energy production will still be higher in the yaw scenario. This situation improves
significantly the net differences reaching EUR 30.1 million instead of EUR 27.4 million.
We add here a summary graph with the main results in the three scenarios:
BASE YAW BASE YAW BASE YAW
OPEX Costs € 1,286,897,125 1,306,884,130 1,286,897,125 1,291,006,916 1,286,897,125 1,286,897,125
Total Costs (PV) € 2,448,294,807 2,462,201,903 2,448,294,807 2,451,886,907 2,448,294,807 2,449,216,887
Net Energy production (MWh/MW/y) 5,677.80 5,722.40 5,677.80 5,722.40 5,677.80 5,722.40
LCOE €/MWh 30.97 30.90 30.97 30.78 30.97 30.74
Total Energy Produced (PV) MWh 79,049,256 79,670,200 79,049,256 79,670,200 79,049,256 79,670,200
Incr. in LCC (Present Value) €
Incr.Net Energy sales (PV,50€) €
Net differences (PV) €
31,047,208 31,047,208 31,047,208
17,140,113 27,455,109 30,125,128
PESSIMISTIC PROBABLE OPTIMISTIC
-13,907,096 -3,592,100 -922,080
VARIATION OF OPEX COSTS
/REST THE SAME
Table 5. Pessimistic and Optimistic scenarios when varying the OPEX costs in the yaw scenarios
Figure 2. Pessimistic and Optimistic scenario when varying OPEX (in Yaw scenario ) over most probable

D5.2. Feasibility analysis, business models, and business plan
industrial partners and large Engineering firms and Value
Proposition
public
Copyright CL-Windcon Contract No. 727477 Page 15
3.3.2 Modification of the Net Energy Production
The most likely scenario has considered Net Load Factors close to 65% which is rather high although
reachable as some offshore recent windfarms has demonstrated2. This chapter modifies the Net Load
Factor to a figure close to 50% (more realistic nowadays). The exercise intends to evaluate the net
economic savings when reducing the wind output by 20% in the pessimistic scenario or increase the
wind output by 5% in the optimistic scenario. Results are in the following table:
Table 6. Pessimistic and Optimistic scenario when varying the Net Energy production over most probable
The results show that the effect is less relevant than in the case of the OPEX reduction. A 20%
reduction in the net load factor reduces the savings in 23%. An increase in 5% increases the savings in
a 5.6%. The LCOE is increased in the pessimistic scenario substantially becoming close to 40 €/MWh.
Below the graph summarizing the results:
BASE YAW BASE YAW BASE YAW
OPEX Costs € 1,286,897,125 1,291,006,916 1,286,897,125 1,291,006,916 1,286,897,125 1,291,006,916
Total Costs (PV) € 2,448,294,807 2,451,886,907 2,448,294,807 2,451,886,907 2,448,294,807 2,451,886,907
Net Energy production (MWh/MW/y) 4,542 4,578 5,677.80 5,722.40 5,962 6,009
LCOE €/MWh 38.71 38.47 31.55 31.35 29.50 29.50
Total Energy Produced (PV) MWh 63,239,405 63,736,160 77,603,141 78,212,726 83,001,719 83,653,710
Increase in LCC (Present Value) €
Incr.Net Energy sales (PV,50€) €
Net differences (PV) €
24,837,767 31,047,208 32,599,569
21,245,667 27,455,109 29,007,469
PESSIMISTIC PROBABLE OPTIMISTIC
-3,592,100 -3,592,100 -3,592,100
VARIATION OF NET ENERGY PRODUCTION
/REST THE SAME
Figure 3. Pessimistic and Optimistic scenario when varying Net Load Factor

D5.2. Feasibility analysis, business models, and business plan
industrial partners and large Engineering firms and Value
Proposition
public
Copyright CL-Windcon Contract No. 727477 Page 16
3.3.3 Variation of the WACC
The WACC has been fixed in 5.12 for the most likely scenario according to D4.5 team. However, some
investors could ask for more or less return, depending on the windfarm circumstances and risk of the
operation. According to the simplified formula below, the WACCreal is linked to the inflation rate but
also depends on the company market capitalization and the cost of the equity and the debt. So, this
factor can easily vary a lot.
�������� � �� ������� – 1 � ������� � ����
������� � ��� ∗ ! " #�$� ∗ �%! ∗ &1 � ()*
Equation 1. Formulation for the WACC
Being:
WACC real = Real Weighted Average Cost of Capital, when discounting inflation rate
WACC nominal = Nominal Weighted Average Cost of Capital
Rinf = Inflation rate
E = market value of the firm’s equity (market cap)
D = market value of the firm’s debt
V = total value of capital (equity plus debt)
E/V = percentage of capital that is equity (30%)
D/V = percentage of capital that is debt (70%)
Re = cost of equity (required rate of return)
Rd = cost of debt (yield to maturity on existing debt)
T = tax rate, considered 25%
The exercise has been proposed with WACC real of 4% (optimistic scenario, low risk) and 8%
(pessimistic, high risk).
VARIATION OF WACC
/ REST THE SAME
PESSIMISTIC PROBABLE OPTIMISTIC
BASE YAW BASE YAW BASE YAW VARIATION
(WACC) % 8.00 5.12 4.00
OPEX Costs € 1,286,897,125 1,291,006,916 1,286,897,125 1,291,006,916 1,286,897,125 1,291,006,916
Total Costs (PV) € 2,192,578,715 2,195,523,970 2,448,294,807 2,451,886,907 2,601,553,366 2,605,517,099
Net Energy
production (MWh/MW/y) 5,677.80 5,722.40 5,677.80 5,722.40 5,677.80 5,722.40
LCOE €/MWh 36.32 36.08 30.97 30.78 29.76 29.58
Total Energy
Produced (PV) MWh 60,373,685 60,847,930 79,049,256 79,670,200 87,404,396 88,090,971
Increase in LCC
(Present Value) € -2,945,256 -3,592,100 -3,963,733
Incr.Net Energy
sales (PV,50€) € 23,712,233 31,047,208 34,328,755
Net differences
(PV) € 20,766,977 27,455,109 30,365,022
Table 7. Pessimistic and Optimistic scenario when varying the WACC over most probable

D5.2. Feasibility analysis, business models, and business plan
industrial partners and large Engineering firms and Value
Proposition
public
Copyright CL-Windcon Contract No. 727477 Page 17
The graph with the main results is depicted below:
The increase in the WACC real from 5.12% to 8% (56%) supposes a reduction of the net differences in
€7 Million from €27 to €20 Million (32%). The reduction of the WACC in almost a point (22%, from
5.12% to 4%) supposes to increase the savings in € 3Million (10%, from €27 Million to €30 Million).
3.3.4 Variation of the inflation rate
The inflation rate will be very apparently low due to the global economy deceleration and especially
the European economy. We have established 1.5% as the most likely scenario with variations up and
down of 0.5%. The results of the LCOE comparing baseline and yaw scenarios for the optimistic and
pessimistic scenarios according to the inflation rate are shown below:
BASE YAW BASE YAW BASE YAW
VARIATION INFLACTION RATE %
OPEX Costs € 1,286,897,125 1,291,006,916 1,286,897,125 1,291,006,916 1,286,897,125 1,286,897,125
Total Costs (PV) € 2,391,003,623 2,394,453,999 2,448,294,807 2,451,886,907 2,510,597,924 2,514,342,349
Net Energy production (MWh/MW/y) 5,677.80 5,722.40 5,677.80 5,722.40 5,677.80 5,722.40
LCOE €/MWh 31.96 31.75 31.55 31.35 30.03 29.84
Total Energy Produced (PV) MWh 74,820,070 75,407,794 79,049,256 79,670,200 83,596,406 84,253,069
Increase in LCC (Present Value) €
Incr.Net Energy sales (PV,50€) €
Net differences (PV) €
PESSIMISTIC PROBABLE OPTIMISTIC
29,386,163 31,047,208 32,833,137
25,935,787 27,455,109 29,088,712
1.0 1.5 2.0
-3,450,376 -3,592,100 -3,744,425
VARIATION OF INFLACTION RATE
/ REST THE SAME
Figure 4. Pessimistic and Optimistic scenario when varying the WACC
Table 8. Pessimistic and optimistic scenarios when varying the inflation rate

D5.2. Feasibility analysis, business models, and business plan
industrial partners and large Engineering firms and Value
Proposition
public
Copyright CL-Windcon Contract No. 727477 Page 18
The impact of the inflation rate is the lowest compared with other variables.
A diagram is also disclosed below:
Finally, we have joined all the variables together, to estimate the most pessimistic scenario and the
most positive to check to potential economic impacts. The results are the following:
The main conclusion of this table is that a combination of pessimistic situations (the OPEX in the yaw
scenario is solely 5% over the calculated, the energy output is 20% less reduced than in the baseline,
the WACC is the highest (8%) and the energy production is reduced 20%), the LCOE moves up far
above 45 €/MWh. In this case, the Yaw control system introduces a deficit of € 15 million in the LCC
during the whole lifetime. So, the yaw control is worst in this case than making no control.
BASE YAW BASE YAW BASE YAW
Discounted Rate (WACC) %
Inflation rate %
OPEX Costs € 1,286,897,125 1,355,557,262 1,286,897,125 1,291,006,916 1,286,897,125 1,286,897,125
Total Costs (PV) € 2,156,198,509 2,189,326,877 2,448,294,807 2,451,886,907 2,678,384,462 2,679,306,542
Net Energy production (MWh/MW/y) 4,542.24 4,577.92 5,678 5,722 5,961.69 6,008.52
LCOE €/MWh 46.85 47.20 30.97 30.78 27.53 27.33
Total Energy Produced (PV) MWh 46,021,401 46,382,907 79,049,256 79,670,200 119,233,800 120,170,400
Increase in LCC (Present Value) €
Incr.Net Energy sales (PV,50€) €
Net differences (PV) €
ALL EFFECTS SIMULTANEOUSLY
-15,053,106 27,455,109 45,907,920
8.00 5.19 4.00
1.0 1.5 2.0
-33,128,368 -3,592,100 -922,080
18,075,262 31,047,208 46,830,000
PESSIMISTIC PROBABLE OPTIMISTIC
Figure 5. Pessimistic and Optimistic scenario when varying the Inflation Rate
Table 9. Combination of all negative and positive variables with all effects simultaneously

D5.2. Feasibility analysis, business models, and business plan
industrial partners and large Engineering firms and Value
Proposition
public
Copyright CL-Windcon Contract No. 727477 Page 19
For the optimistic scenario, if we consider a WACC of 4% (very low, representing a good economic
situation and confidence), inflation rate of 2% (the optimum for the economy), the operational costs
(OPEX) in the yaw scenario are equivalent to the baseline (this means that the calculation of fatigue
loads is not modified with a very realistic simulation) and finally, the energy production is 5% higher
than in the most likely scenario, then, the net difference raises to EUR 45 million positive. Below the
diagram:
Figure 6. Baseline and yaw differences under a combination of positive and negative effects
The main conclusions of the analysis are:
•••• Cost variation of the OPEX is the most affecting factor when comparing the baseline (greedy
control) and the yaw scenario (wake redirection and induction control…)
•••• Inflation rate, WACC and energy output does not modify the net differences to the same
extend than the OPEX.
•••• The new control system in the most likely conditions saves around EUR 27 million from a
total investment of EUR 2.1 billion. However external factors like the IR, the WACC or the
reduction or increase of the energy output, may bring net losses (in the pessimistic
scenario) to EUR -15 million negative or net benefits to EUR 46 million positive. Thus, the
range can move €60 million up or done depending on the circumstances and the windfarm
management.

D5.2. Feasibility analysis, business models, and business plan
industrial partners and large Engineering firms and Value
Proposition
public
Copyright CL-Windcon Contract No. 727477 Page 20
4 PRELIMINAR BUSINESS STRUCTURING
In advance to enter in the business model analysis, it is important to classify and structure the
business environment where the CL-Windcon partners are involved. There are different partners
with different profiles, different business opportunities, different applications, services, etc. In the
next chapter we will try to classify this diversity of business conditions.
4.1 Type of entities
i. Entities “research driven”. We consider inside this group those universities which are not
interested in exploiting commercially their products. They are research teams made of
professors, doctorates, etc. and their main interest is the transference of knowledge, the
training of students and the participation in granted projects to finance the research.
Representatives for this group might be AAU, TUM or USTUFF. These entities usually work in
open source. We will call them hereafter “Pure Researchers or PR”
ii. Mixed organizations “research but also market driven”. We include here Technological
Centres (public or private) plus some special type of universities which work close to the
industry. They are interested in the same activities than group i, but also by means of public-
private foundations or by any other business profiles. They establish long-term relationships
with the Industry. To that end, they set up organizations with fix employed plus some
rotational students that participate in the projects in a case by case basis. Examples in CL-
Windcon of this profile could be IKERLAN, CENER, TNO or TUDELF and POLIMI. These
entities combine open source with tailored services. We will call them “Mixed organizations
or MO”. The two universities provide strong market services like the POLIMI wind tunnel or
the software developed by TUDelft offered as SaaS.
iii. Large Business companies. We must distinguish among windfarm promoters, large
consultancy or engineering companies and components’ manufacturers. Large companies
invest in R&D to a certain extend. They usually prefer to buy the technology and protect it
carefully developing an in-house know-how based on their own discoveries and that they
eventually incorporate from third parties. Examples of these profiles in CL-Windcon are DNV,
RAMBOLL, DEWI, ENEL or GE. We will call them herein “Pure businesses or PB”
iv. Small SMES. They usually provide specialized services to large companies, technological
Centres or universities. Their research capacity is limited due to the lack of resources. An
example could be Qi Energy or Zabala. Hereinafter called as “SMEs”
4.2 Type of applications
Every entity profile usually provides similar services but of course some of them are not prepared to
implement certain type of activities. Within the CL-Windcon project and considering the “group of
products or services” developed, we can distinguish the following applications:
i. Installations’ design. Design means all the activities implemented before the setting up of
the windfarm to assess the business opportunity and plan the future works.

D5.2. Feasibility analysis, business models, and business plan
industrial partners and large Engineering firms and Value
Proposition
public
Copyright CL-Windcon Contract No. 727477 Page 21
ii. Simulations. Simulation is a technical development to advance the potential results a process
will have in the real life through computing. Simulations are possible at the design phase,
during project set up or after project start up. It can be used to visualise a new modification
of the layout or the working conditions in advance to make the investment. Simulations can
be also used to make forecasts of future installation behaviour.
iii. Maintenance. Some software is used to control the maintenance services in the real life. It is
very common nowadays to optimise these processes with feedback and feedforward
information.
iv. Components design. Specific software is also prepared to design, or redesign components of
an equipment based on the experience of the designer.
v. Improve certain aspects. Finally, some software is used to improve certain tasks or activities
where there is more margin of improvement.
In the next table, we describe the software upgraded by the partners and the potential application.
SUPPLIER/? SOFTWARE Design and
installation?
Simulate an
Installation
Maintain an
installation
Design
components?
Improve
certain
aspects
IKERLAN Opendiscon Y Y
DNV WindFarmer/Longsim Y Y Y Y Y
CENER
FLORIS P Y Y
Fast.Farm Y P Y
SOWFA Y Y
AAU SimWindFarm Y Y P Y
TUDELF
SOWFA Y
FLORIS P Y P Y Y
WFSim Y Y Y Y
USTUFF Wake dissipation
model Y
RAMBOLL O3M Software Y Y Y
POLIMI CP-lambda /CP Max Y Y Y
TNO FarmFlow Y Y
TUM FLORIS Y Y P P
Y SOWFA Y
Table 10. Applications for the software developed
“Y “means yes and “P” means partially.
From the table, we can infer that the developed algorithms are mainly oriented to simulations and
the improvement of certain aspects. In general terms, they are not applicable to manage real
installations and only three of them can be used for maintenance purposes or components design
but with some limitations.

D5.2. Feasibility analysis, business models, and business plan
industrial partners and large Engineering firms and Value
Proposition
public
Copyright CL-Windcon Contract No. 727477 Page 22
4.3 Type of services
In deliverable D5.3 IPR activities, a questionnaire was distributed asking for the intention to exploit
and/or protect the results. In the next table, brought from that deliverable, we include their
opinions.
Table 11. Market routes for the different software
Some partners will just use the project results internally. Their profile coincides with the PR group
mentioned in chapter 5.1. A second group is very much enthusiastic with the Software as a Service
(SaaS). They are very much linked to the so-called MO or mixed organizations. Large companies are
not in this questionnaire prepared just for software suppliers, but it is interesting to understand their
opinion about the project results. Except for some specific cases (Super controller from TUDELF) and
the general interest from DNV, most of the discoveries have no or relative interest in the level of
development they are up to now. However, all the large companies insist in the need to continue
improving research results.
SUPPLIER/?Will it be sold as a
lump sum?Will it be licensed?
Will it be for internal
use only?
Will it be exploited for
third parties SaaS
references in
terms of pricing
Difficult to know at
this stage.
IKERLAN Modifications will be
offered
Yes, open l icensing for
modificationsNo Yes Case by case Confidential
DNV Possibly, not decided Possibly, not decided Yes Possibly, not decided Not yet Yes
CENER Floris No No No Maybe No Yes
FastFarm. No No No Maybe No Yes
Sowfa. No No Yes No No No
AAU Sindwindfarm. No No Maybe Don't know No Yes
TUDELF No
No, but could be used
in commercial
applications
No Maybe Free Yes
USTUFF No Open licence No ? Difficult Yes
RAMBOLL No No Yes Engineering solutions Free No
POLIMI No Protected No Yes No comments No comments
TNO Not for sale Generally not Yes Yes Confidential No comments
TUM No No
Yes, extend the
knowledge and get
grants
No No No

D5.2. Feasibility analysis, business models, and business plan
industrial partners and large Engineering firms and Value
Proposition
public
Copyright CL-Windcon Contract No. 727477 Page 23
The main conclusion is that the group of PB (Large companies) are supervising the evolution of the
different solutions and they will pick the best of them in case they appreciate a competitive
advantage. In some cases, they mention that their internal software outpaces the software
developed in CL-Windcon.
According to this vision, we have determined five types of market routes:
i. Software as a Consulting or Engineering Service. The entities will not sell the software
(indeed, this is not possible in most cases, because the original owners offered them in open
sources) but they will provide complex services using the software as technical support. The
MO entities has refined and upgraded the different algorithms and based on them will offer
high-quality services to simulate or design installations. In this case, the supplier receives a
progressive payment against the development of the service solution in selected milestones.
The total amount can be variable, depending on the degree of accomplishment.
ii. ESC. One interesting option is to act as an Energy Service Company that is being paid based
on the savings. This option can be applied to any existing windfarm that introduces the new
control system. The software supplier obtains a fix amount in the signature and a
percentage of the savings when yawing the turbines considering the historical windfarm
behaviour. 1.1% of LCC savings represents around € 27 million € in the total lifetime of an
800 MW windfarm (approximately € 1.1 million per year at present value). If the solution is
implemented with a total cost around €1 million of CAPEX and €0.2 million per year (OPEX),
the payback will be possible in just 2 years. Please revise for further details the Business plan
chapter (Nº7)
iii. Lump Sum. The client pays a lump sum. This is the traditional contract. The customer defines
and asks for a concrete solution. Once developed, the supplier receives the full payment.
iv. Software integrated. This is the option for the large companies (windfarm promoters,
OEMs, large consultancy or engineering companies). These companies usually cover a great
part of the value chain. They participate in the projects from the cradle to the grave and
implement research, consultancy, engineering and/or installations. The upgrade piece of
software (usually an improved algorithm) is integrated with the rest of the software and
used for the project purposes. Large companies use tens of programs in their daily activity
ENTITY/
SOFTWARESOWFA SimWindFarm FLORIS FarmFlow
WindFarmer/
LongsimWFSim Fast.Farm
Data
reduction
technologies
Wake
dissipation
model
0&M
Software
GE
They believe
their expertise
is ahead CL-
Windcon
Don't believe
to use it
Some
engineering
models
interesting
Do not see
reasons to
adopt it
Do not see
reasons to
adopt it
Well , but far
from the real
world
Do not see
reasons to
adopt it
No
applicable to
their
technology
Very specific
model. No
appl ications
for the moment
No data
DNVHigh level of
interest
High level of
interest
High level of
interest
High level
of interest
High level of
interest
High level of
interest
High level
of interest
High level of
interest
High level of
interest No data
DEWI Sti ll in doubt Still in doubt Sti ll in doubt Still in Stil l in doubt Still in doubt Sti ll in Stil l in doubt Still in doubt No data
EGP
TUDELF Super-
controller is
the most
interesting
No opinion No opinion No opinion No opinion No opinion No opinion No opinion No opinion No data
RAMBOLL No data No data No data No data No data No data No data No data No dataInternal
Use
Table 12. Market potential from the perspective of the Industrial /large Consulting partners

D5.2. Feasibility analysis, business models, and business plan
industrial partners and large Engineering firms and Value
Proposition
public
Copyright CL-Windcon Contract No. 727477 Page 24
and it is very difficult to extract an independent price for the software used. The customers
pay for a global solution that incorporates the upgraded software.
v. Licencing. Only those organizations with in-house software are open to licencing. This is for
instance the case of DNV or RAMBOLL, although they are still thinking on the best options
for exploitation.

D5.2. Feasibility analysis, business models, and business plan
industrial partners and large Engineering firms and Value
Proposition
public
Copyright CL-Windcon Contract No. 727477 Page 25
5 BUSINESS MODELS
5.1 Introduction
Hereinafter, we describe all the components of a conventional business model applied to the three
identified profiles (PR, MO and PB).
The CANVAS model developed by the Swiss economic theorist Alexander Osterwalder and the
computer scientist Yves Pigneur in 2005 will be used. With the GANVAS model you get an overview
of what the business model really is. The CANVAS needs to describe the following aspects:
•••• Customer Segments: Who are the customers? What do they think? See? Feel? Do?
•••• Value Propositions: What’s compelling about the proposition? Why do customers buy, use?
•••• Channels: How are these propositions promoted, sold and delivered? Why? Is it working?
•••• Customer Relationships: How do you interact with the customer through their ‘journey’?
•••• Revenue Streams: How does the business earn revenue from the value propositions?
•••• Key Activities: What uniquely strategic things does the business do to deliver its proposition?
•••• Key Resources: What unique strategic assets must the business have to compete?
•••• Key Partnerships: What can the company not do so it can focus on its Key Activities?
•••• Cost Structure: What are the business’ major cost drivers? How are they linked to revenue?
Figure 7. CANVAS model

D5.2. Feasibility analysis, business models, and business plan
industrial partners and large Engineering firms and Value
Proposition
public
Copyright CL-Windcon Contract No. 727477 Page 26
5.2 CANVAS for group of “Pure Researchers”
As mentioned, this group is represented by the Universities which main goal is the transference of
knowledge and not or very reduced interest in the market.
•••• Key Partners.
The main interest of universities is the acquisition of knowledge. The way to do that is through public
funding and the EU grants which represent the best way to connect with cutting-edge technologies.
Thus, key partners for the universities are EU organizations (all types) working in the same strategic
research areas.
•••• Key activities.
PE group needs to attend research conferences, write research papers, specializes in working areas
where the research community identify them and overall, participates in high-level research projects
with low and intermediate TRL (technology readiness level). They also need to collaborate if possible,
with the industry and adapt themselves to the industry requirements (mainly quality, speed and
accomplishment of milestones and expected deliverables).
•••• Key Resources
Resources for this group come from public sources or in some cases private. H2020 or the future
program Horizon Europe is an important way to be a get financing. Universities manage their own
research funds, but they are most times limited and must be complemented with additional sources.
The EU programs finance 100 % in Research activities, being perfect in the follow up of their
interests. The universities need also to set up to-date labs, keeps a stable research team and certain
autonomy and free time to implement research.
•••• Customer relationships
Customers for a University are those entities who pay them for their research services. The main
customers are, therefore, the administrations who provide grants and some private clients if
Universities demonstrate enough level of compromise and quality management. Northern EU
countries are more familiar with the liaison between university and industry. The search of pre and
post PHD students is a very good entry point to set up the initial relationships with the industry.
•••• Business channels.
Attending research conferences, interchange of professors and Pre and post PHD students through
the Erasmus program. Collaboration with industries in their search processes. Attending info days in
Brussels, participation in national opportunities, establishing lobbying groups around local industries
(trusted groups)
•••• Customers segments
Local industries establishing trusted liaisons, national and European funding administrations,
research peers’ group in Europe to launch common RTD projects, International research conferences
to meet European research opportunities.
•••• Cost structure.
Research in the University is complex as the professor must combine the teaching with the research
activities. Publication of research papers is however necessary to flourish. Intermediate organizations
D5.2. Feasibility analysis, business models, and business plan
industrial partners and large Engineering firms and Value
Proposition
public
Copyright CL-Windcon Contract No. 727477 Page 27
Private-Public partnerships like foundations are a good way to mix both activities. Professors are
partially paid by the research projects and also by their teaching activity. A group of researchers is
kept in the organization with a full salary whilst some students are hired for a period associated to
the projects. Cost and revenues must be adapted according to the level of success in national and EU
financing.
•••• Revenues streams
There will be a base contribution from the University funds summed up to the incomes received from
public or private financing from RTD projects. The structure of the working team will rely on the level
of success, the quality of the works implemented and the approach to the Industry (that provides
long-term business relationships). Contribution from € 100000 to € 400000 could be a good order of
magnitude for a 3 to 4 years project lifetime.
•••• Value proposition
Universities or Pure Research groups involved in windfarm optimization through wake redirection,
induction control, etc., working in high-level RTD projects may provide added value in research
activities linked to simulation, windfarm design, etc. or any research activity at low TRL for new
unknown solutions. Universities treasury basic knowledge and are prepared to explore new
disruptive fields at relatively low costs.
In the next CANVAS model, we synthetize the business model for Universities or pure research
groups according to the descriptions already done:

D5.2. Feasibility analysis, business models, and business plan
industrial partners and large Engineering firms and Value
Proposition
public
Copyright CL-Windcon Contract No. 727477 Page 28
Table 13. CANVAS Pure Researcher organizations
Date
CLIENTS*Local industries establishing trusted liaisons
*National and European funding administrations
*Research peers’ group in Europe to launch common
RTD projects
Business Model CanvasDesign by QI EUROPE
KEY PARTNERS KEY ACTIVITIES VALUE PROPOSITION RELATIONS WITH CUSTOMERS
SCENARIO PURE RESEARCHERS
OCTOBER 2019
Attend research conferences, write research papers,
specialize in working areas where the research
community identify them and overall, participates in
high-level research projects with low and
intermediate TRL, collaborate with the industry and
adapt themselves to the industry requirements.
Universities or Pure Research groups involved in Wind
farm optimization through wake redirection, induction
control, etc., working in high-level RTD projects may
provide added value in research activities linked to
simulation, wind farm design, etc. or any research
activity at low TRL for new unknown solutions.
Universities treasury basic knowledge and are
prepared to explore new disruptive fields at relatively
low costs.
*EU organizations working in the same
strategic research areas.
*Long-term agreements with industrial
companies.
*Public sources or in some cases private.
*H2020 or the future program Horizon Europe must be
an important way to be a get financing.
KEY RESOURCES
*Cost and revenues must be adapted according to the level of success in national or EU grants.
COST STRUCTURE REVENUES STREAMS
*Collaboration with industries in their search processes.
*Attending info days in Brussels
*Participation in national opportunities
*Establishing lobbying groups around local industries (trusted
groups)
*Base contribution from the University funds summed up to the incomes received from public or private financing from RTD projects.
*Contribution from € 100000 to € 400000 could be a good order of magnitude for a 3 to 4 years project lifetime.
*Publication of research papers in however necessary to flourish.
*Intermediate organizations Private-Public partnership like foundations are a good way to mix research projects and their teaching
*International research conferences to meet European
research opportunities
*The main customers are: the administrations who provide grants
and some private clients.
*The search of pre and post PHD students is a very good entry point
to set up the initial relationships with the industry.
*Attending research conferences
*Interchange of professors and Pre and post PHD students through
the Erasmus program.
CHANELS FOR DISTRIBUTION

D5.2. Feasibility analysis, business models, and business plan
industrial partners and large Engineering firms and Value
Proposition
public
Copyright CL-Windcon Contract No. 727477 Page 29
5.3 CANVAS for groups of “Mix Organizations”
These organizations combine the activities of the “Pure Research “groups but also offer services to
the market usually under the model “Software as a Service”. The weight of the public and private
funding rounds 50%.
•••• Key partners.
The Mix Organizations combine as main goals the acquisition of knowledge but also the generation of
revenues streams. They are closer to the market in a position between conventional universities and
enterprises. They provide high-added services filling the research gap than conventional companies
cannot reach.
Key partners for them are the same than “Pure Research groups” i.e., EU organizations working in
the same strategic research areas but also industrial companies. The technological centres must be a
reference in their sector and be completely specialized in those activities demanded by the market.
Research will not be in low TRLs but closer to the market with higher TRLs (beyond TRL4).
Technological centres in the wind sector must work with large companies in real projects in cutting-
edge technologies. They must be part of trusted groups and take care of long-term relationships.
Patent offices, certification bureaus or consultancy companies are key partners to find market
opportunities.
•••• Key activities.
The mix organizations may find an equilibrium between the activities implemented by the PE group
like attending research conferences, writing RTD papers, look for specialization in working areas to
be identified and participate in high-level research projects with low, intermediate and close to
market TRLs (technology readiness level), but they also need to collaborate with the industry and
adapt themselves to the industry requirements much more than the PE groups. The private area
must be as strong as the public one looking for long term alliances with well-known industries. In the
CL-Windcon field of activities, they must provide Software as a Service, lump sum services and even
Energy Services if they are financially solvent. If not, strategic agreements can be signed with
financing organizations like risk capital, banks, family offices, etc., to provide a global solution to the
client.
There is an opportunity with the new control software to provide continuous optimization services
with strong entry barriers for third companies as the technology is quite complex to manage, thus
keeping the competitive advantage overtime.
•••• Key Resources
Key resources are; financial backing in case the Energy Service model will be implemented, a strong
research team with capacity to work in pure research but also in applied research, a recognized
research infrastructure (labs, pilot plants, etc.), a good communication policy attending research
events, publishing RTD papers, implementing marketing campaigns, etc. In the field of the CL-
Windcon project, it is important to convince a large industry to use the developed software and
highlight that relationship as a reference. In this complex sector, prestige is transmitted by the word
of mouth. Count with demos in the real life is also important to success.

D5.2. Feasibility analysis, business models, and business plan
industrial partners and large Engineering firms and Value
Proposition
public
Copyright CL-Windcon Contract No. 727477 Page 30
The wind sector is very regulated, and any new discovery must be solidly tested in advance to its use
as investments compromised are very high.
•••• Customer relationships
Customers for the Mix Organizations are the same described for the PO group, plus industries and
other type of large companies (Engineering companies, consultancy companies, etc.).
In one side, administrations providing grants are important to cover at least 50% of expenditure
(base) but also industrial partners are needed. Technological Centres must gain the confidence of
large industries when exploring new fields of activity. Usually, the industrial relationships are long-
term based on confidential agreements that also serve as entry barrier for competitors.
•••• Business channels.
In one side, same as the Pure Research Groups like attending research conferences, interchange of
professors and Pre and post PHD students through the Erasmus program, info days in Brussels,
participation in national opportunities, but also establishing lobbying groups around industries
(preferable big size multinationals). International wind conferences are places to look for clients and
EU projects and long-term relations. The CL-Windcon new control software is quite a narrow niche
with few active actors. The word of mouth is the best way to contact potential clients.
•••• Customers segments
Same actors than PR groups like local industries establishing trusted liaisons, national and European
funding administrations, research peers’ group in Europe to launch common RTD projects,
International research conferences to meet European research opportunities. The segment is
connected to the wind sector where the software is used for design, simulation, maintenance or
improvement of special aspects.
•••• Cost structure.
A combination of public and private resources (ideally 50% each). Public resources must be used as a
sustainability base whilst private resources must be used to pay the variable costs and finance the
entity growth. In the specific case of the CL-Windcon algorithms, if results are confirmed, there is a
great margin of manoeuvre. With an investment of 1 to 2 million €, the payback can be reached in
just one or two years. The software can be sold under the ESC model with a small fix income at the
signature to cover the basic expenses and a large variable fee retained against savings on a yearly
basis. Another possibility is receiving a lump sum for a specific development (pay per product).
Finally, the SaaS model is similar to the ESC but without associating it to the windfarm savings. You
receive a periodic income when providing a service (like maintenance supervision or daily wake
redirection forecast, etc.). ROI must be at least close to 60 to 100.
•••• Revenues streams
Revenues stream are linked to the services provided but it is expected large EBITDAs around 50 to 60
% of revenues. The reason is that the technology will generate important savings but at same time
the technology is difficult to adjust and manage. Only a set of companies will be able to program the
Wind turbines in the appropriate way and that will generate a high demand with a small offer.
Therefore, the negotiation power will be in the hands of the offer with high benefits. In the other
hand, the technology is quite new, unknown by the market and must be refined and proven to be
fully admitted by the market actors.

D5.2. Feasibility analysis, business models, and business plan
industrial partners and large Engineering firms and Value
Proposition
public
Copyright CL-Windcon Contract No. 727477 Page 31
•••• Value proposition
Value Proposition for Mix Organizations is the most promising. We can describe the technology
advantages as follows;
Wake redirection and induction control is a novel technology that substantially increase energy
output in new or existing windfarms with no or very reduced OPEX extra expenditure, generating
between 1% to 2% savings in terms of Life Cycle Costing during the whole project lifetime. The
company can offer payments per measured savings compared to historical data. LCOE is reduced
around 0.60%-0.80%. The technology is easy to implement without the need to installing additional
measurement equipment. Applicable to onshore and offshore wind farms.
In the next CANVAS model, we synthetize the business model for Mix Organizations:

D5.2. Feasibility analysis, business models, and business plan
industrial partners and large Engineering firms and Value
Proposition
public
Copyright CL-Windcon Contract No. 727477 Page 32
Table 14. Mix Organizations CANVAS model
DateBusiness Model CanvasSCENARIO
Design by QI EUROPE
KEY PARTNERS KEY ACTIVITIES VALUE PROPOSITION RELATIONS WITH CUSTOMERS
MIX ORGANIZATIONS
OCTOBER 2019
*International wind conferences.
*The word of mouth is the best way to contact potential clients.
CHANELS FOR DISTRIBUTION
CLIENTS
*Research peers’ group in Europe to launch common
*International research conferences to meet European
research opportunities.
*Large EBITDAs are expected: around 50 to 60 % of revenues. The technology will generate important savings but is difficult to adjust and
manage. We will work with high demand with a small offer. Therefore, the negotiation power will be in the hands of the offer with high benefits.
*Wake redirection and induction control is a novel
technology that substantially increase energy output in
new or exiting wind farms with not or very reduced
*The company can offer payments per measured
savings compared to historical data.
*LCOE is reduced around 0.60%.
*Applicable for onshore and offshore wind farms.
*Easy to implement without the need to installing
additional measurement equipment.
*Administrations providing grants are important to cover at least
50% of expenditure (base)
*Large industrial relationships are long-term based on confidential
agreements that also serve as entry barrier for competitors.
*Local industries establishing trusted liaisons.
*National and European funding administrations
*Infodays in Brussels
*Participation in national opportunities
REVENUES STREAMS
*Attending research conferences
*Interchange of professors and Pre and post PHD students through
the Erasmus program
*Establishing lobbying groups around industries
*Patent offices, certification bureaus or
consultancy companies.
*Large industrial companies in real
projects in cutting-edge technologies.
*A combination of public and private resources (ideally 50% each). Public resources must be used as a sustainability base whilst private
resources must be used to pay the variable costs and finance the entity growth.
*There is a great margin of maneuver. With an investment of 1 to 2 million €, they payback can be obtained in just one or to years.
*The software can be sold under the ESC model with a small fix income at the signature to cover the basic expenses and a large variable
COST STRUCTURE
KEY RESOURCES
*Attending research conferences, writing RTD papers,
look for specialization in working areas, participate in
research projects, collaborate with the industry.
*In the CL-Windcon field of activities, they must
provide SaaS, lump sum services and Energy Services,
provide continuous optimization services for third
companies.
*EU organizations working in the same
strategic research areas.
*Another possibility is receiving a lump sum for a specific development (pay per product).
*SaaS model is similar to the ESC but without associating it to the wind farm savings. You receive a periodic income when providing a
service (like maintenance supervision or daily wake redirection forecast, etc.).
*ROI must be at least close to 60 to 100.
*Financial backing, a strong research team, a recognized
research infrastructure (labs, pilot plants, etc.), a good
communication policy attending research events,
publishing RTD papers, implementing marketing
campaigns, etc.
*It is important to convince a large industry to use the
developed software and highlight that relationship as a
reference. Count with demos in the real life is
important to success.
*The wind sector is very regulated, and any new
discovery must be solidly tested.

D5.2. Feasibility analysis, business models, and business plan
industrial partners and large Engineering firms and Value
Proposition
PUBLIC
Copyright CL-Windcon Contract No. 727477 Page 33
5.4 CANVAS for groups of “Pure Business”
The next CANVAS is linked to the activity of large organizations of different types; windfarm
promoters, OEMs, large consultancy or engineering companies, etc. In the same way than previous
analysis, we describe hereinafter the content of the different CANVAS chapters.
•••• Key Partners.
Large corporations usually work with a group of trusted entities. In case they incorporate the new CL-
Windcon algorithms with the intention to apply in a real installation, all the partners around must be
familiarized with the technology. For instance, a promoter willing to modify the control system of an
existing windfarm, will likely inform the designing company, the company involved in maintenance,
the OEM providing the turbines, etc. All of them need to understand the new challenge and receive
training of the new technology. Thus, key partners are all participants in the deployment of a
windfarm.
•••• Key activities.
Training to all stakeholders (participants) is a key activity. Another one will be to arrange an
agreement with the technology provider. The technology will come from a supplier (research group)
and the conditions for collaboration must be set out. In case the promoter of the technology will be a
consultancy or engineering company, an agreement might be signed also with the windfarm owner.
In all cases, the technology must be transferred horizontally to all the stakeholders.
•••• Key Resources
Large companies can easily support the new technology with their own resources. However, there
will be some limitations with the regulation. Nowadays there is a strict regulation with the turbines
and windfarm behaviour and this technology substantially changes the way the windfarms are
controlled. Internally, the technical operators in charge of the installation, regardless an external
provider will help in the operation, need to receive training. In case, the business model assumes the
ESC option, a business contract of this type must be prepared.
•••• Customer relationships
The customers of a large utility who owns a windfarm are the citizens consuming the energy and the
local, regional or national authorities launching the offer. Citizens will be benefitted from the LCOE
reduction leaving additional margins for the utility or reducing prices to end users to gain
competitiveness.
The customers of an OEM involved in a project with the new control algorithms are the promoter or
windfarm owner who buys the turbines. The OEM will have to be aligned with the promoter desires
when asking for adapted software to allow independent yawing of turbines.
The customers of a large consultancy or engineering company supplying the technology will be the
windfarm owner. The Consultancy or Engineering companies will have to search an alliance with the
OEMs and convince the windfarm owner of the benefits of the technology.

D5.2. Feasibility analysis, business models, and business plan
industrial partners and large Engineering firms and Value
Proposition
PUBLIC
Copyright CL-Windcon Contract No. 727477 Page 34
•••• Business channels.
Large companies are automatically informed on any new contract opportunity. They can use the new
technology to reduce prices in auctions and win the competitions. Any new advance in the LCOE
index is very welcome by the marketplace.
•••• Customers segments
All the clients are in the Wind sector. Customers can be local, regional or national energy authorities
but also outsources companies, OEMS, private wind promoters, all of them working in the renewable
sector.
•••• Cost structure.
From the point of view of the large utilities, they will be able to reduce the overall costs to certain
extent of new windfarm installations or for those recently renewed. They will have to consider
energy savings minus the margin of the technologist providing the technology. Their LCC will be
reduced from 1% to 2% minus the margin of the outsourced supplier.
Large Consultancy or Engineering companies will add the new control algorithms service to the set of
services they provide to the windfarm owner, gaining some margin in the operation.
•••• Revenues streams
Extra revenues are expected from the sales of the extra electricity produced due to the wake
redirection, the induction control and the rest of technologies applied. This extra electricity will be in
the range of 0.15 to 0.30% compared to a greedy control installation.
•••• Value proposition
Large companies involved in the promotion of a new windfarm or the retrofitting of an existing one
will offer extra incomes from 0,15% to 0,30% in electricity sales, a reduction between 1% to 2% in the
LCC during the project lifetime and a reduction of the LCOE close to 0,70%. These advantages allow
them to adjust prices in auctions and competitions gaining margins or reducing prices to end users.
In the next CANVAS model, we synthetize the business model for Large companies (Pure businesses):

D5.2. Feasibility analysis, business models, and business plan
industrial partners and large Engineering firms and Value
Proposition
PUBLIC
Copyright CL-Windcon Contract No. 727477 Page 35
Table 15. Pure Businesses CANVAS model
Date
Training to all stakeholders, arrange an agreement with
the technology provider, agreement with the promoter
of technology and wind farm owner, technology
transferr horizontally to all the stakeholders.
Customers: citizens consuming the energy and authorities
launching the offer.
The customers of a large consultancy or engineering company
supplying the technology will be the Wind farm owner. They will
have to search an alliance with the OEMs and convince the Wind
Farm owner of the benefits of the technology.
*Large corporations, designing company,
the company involved in maintenance, the
OEM providing the turbines, all
participants in the deployment of a Wind
Farm.
KEY RESOURCES
Business Model CanvasSCENARIO PURE BUSINESSES
Design by QI EUROPE OCTOBER 2019
KEY PARTNERS KEY ACTIVITIES VALUE PROPOSITION RELATIONS WITH CUSTOMERS CLIENTS
*All of them need to understand the new
challenge and receive training of the new
technology.
Extra revenues are expected from the sales of the extra electricity produced due to the wake redirection, the induction control and the rest of
technologies applied. This extra electricity will be in the range of 0.15 to 0.30%
*All the clients are in the Wind sector.
*Local, regional or national energy authorities,
suppliers, outsources companies, OEMS.
*Large companies are automatically informed on any new contract
opportunity. They can use the new technology to reduce prices in
auctions and win the competitions.
*Any new advance in the LCOE index in very welcome by the
marketplace.
Large companies involved in the promotion of a new
Wind farm or the retrofitting of an existing one will
offer:
*Extra incomes from 0,15% to 0,30% in electricity sales
*A reduction between 1% to 2% in the LCC during the
project lifetime
*Reduction of the LCOE close to 0.70%.
This advantages allow them to adjust prices in auctions
and competitions gaining margins or reducing prices to
end users.
REVENUES STREAMS
CHANELS FOR DISTRIBUTION
*Large utility: reduce the overall costs, energy savings minus the margin of the technologist providing the technology, LCC wil be
reduced from 1% to 2% minus the margin of the outsourced supplier.
*Consultancy or Engineering companies will add the costs and revenues of the new control algorithms to the set of services they provide
to the Wind Farm owner, gaining some margin.
*Large companies can easily support the new
technology with their own resources.
*Strict regulation with the turbines and wind farm
*The operators in charge of the installation need to
receive training.
*The business model assumes the ESC option, a
business contract of this type must be prepared.
COST STRUCTURE

D5.2. Feasibility analysis, business models, and business plan
industrial partners and large Engineering firms and Value
Proposition
PUBLIC
Copyright CL-Windcon Contract No. 727477 Page 36
6 BUSINESS PLANS
In this chapter, we have included an approach to understand to what extend the new control
algorithms will impact in the partners involved in the proposal. Of course, major impact will be
assigned to the large companies. We must pinpoint that technology is not in a state that can be
transferred to the market in the short term. The project has contributed to move TRL from level 3 to
level 5, although at least five years and the demo of the software in a real installation for a long
period are still needed to approach to the marketplace. In deliverable D5.3 Innovation
management3, we have included the worldwide competitive position of the partners involved in the
proposal. We first review these positions to understand the market opportunities. Then, we will
introduce a draft forecast for each partner or group of partners.
6.1 Overview of the wind sector
An extended review of the Wind sector (on and offshore) was included in deliverable D5.3 Report,
Innovation manager activities (final). We bring here a short summary to prepare the analysis.
According to the Global Wind Energy Council (GWEC4), it's clear that the 2018 market and the
following years, kept staying above 50 GW, reaching record years on the offshore sector.
In fact, the total installations in 2018 were 51,3 GW, bringing the global total to 591 GW.
Figure 8. Global annual installed wind capacity 2001-2018

D5.2. Feasibility analysis, business models, and business plan
industrial partners and large Engineering firms and Value
Proposition
PUBLIC
Copyright CL-Windcon Contract No. 727477 Page 37
In the next diagram (Figure 10) we add a diagram from GWEC where we can see the distribution of
the wind capacity and new installations worldwide. 76 % of the total new capacity belongs to China,
US and Germany in onshore and 91% of total new capacity in offshore is assigned to China, UK and
Germany. Clearly China is the word leader in both markets, increasing the distance with the following
providers every year.
Figure 9. Global cumulative installed wind capacity 2001-2018

D5.2. Feasibility analysis, business models, and business plan
industrial partners and large Engineering firms and Value
Proposition
PUBLIC
Copyright CL-Windcon Contract No. 727477 Page 38
Figure 10. New installations and total capacity in onshore and offshore in 2018
The most important conclusions from these charts is that Europe is losing competitive position
against Asian suppliers (China, India, etc.) except in offshore where Europe is still a reference with
the leadership of UK, Germany and Denmark although China is approaching very fast. However, the
large companies involved in CL-Windcon operate globally and their markets can be global as well.
To measure the Total Addressable Market (TAM) for onshore and offshore, we have made a
simplification considering the trends in the market for the next ten years. According to the symphony
scenario (moderate) showed by the World Energy Council (WEC5) in 2030, around 1600 GW of wind
energy will be operative in the moderate scenario.

D5.2. Feasibility analysis, business models, and business plan
industrial partners and large Engineering firms and Value
Proposition
PUBLIC
Copyright CL-Windcon Contract No. 727477 Page 39
Figure 11. Global Cumulative Wind Power Capacity. WEC Outlook 2016.
In summary, with an average 55 to 65 GW additional GW per year, and starting from the current 600
GW, in ten years-time, there will be around 1600 GW operative. We will consider that time to market
will set 2026 as the starting point for the new technology massive distribution. One of the
advantages of the technology is that it can be applied to new windfarms but also to facilities in
operation. Thus, total addressable market (TAM) between 2026 and 2030 will be around the
mentioned 1600 GW in onshore and offshore. In 2026, 1100 GW will be in operation and additional
500 GW will be installed from 2026 to 2030.
In a rough calculation, the large companies involved in CL-Windcon will not get access to the Asian
territory or the access will be limited. Following Figure 10, the onshore Asian markets represent the
35 % with an increasing tendency (please check D5.3). So, roughly the Serviceable Available Markets
(SAM) in a combination of onshore and offshore, from 2026 to 2030 will be around 50% of TAM, or
800 GW.

D5.2. Feasibility analysis, business models, and business plan
industrial partners and large Engineering firms and Value
Proposition
PUBLIC
Copyright CL-Windcon Contract No. 727477 Page 40
6.2 Competitive position of the CL-Windcon large companies
6.2.1 ENEL GREEN POWER – Competitive Position
Following the discoveries of deliverable D5.3 Innovation management report, the status of EGP
worldwide in 2018 is described through the following figure
Figure 12. EGP Green energy distribution globally
According from the last consolidated report 2018, revenue for 2018 amounted to EUR 75,672 million,
an increase of EUR 1,033 million (+1.4%) compared with 2017. 22% was addressed to wind the wind
sector or EUR 16.6 billion.
The managed capacity for wind reached 10,6 GW. EGP represents one of the strongest leaders in the
energy production from renewable sources worldwide. In the next table it is depicted that EGP
reached the 1,72% of the overall Wind Energy market in 2017, although it was not active in
offshore wind. The company is present in the five continents.
EGP - Data in MW - 2017
Wind Power Global Enel GP Market Share
Onshore 520.767 9250 1,76%
Offshore 18.814 0 0%
Total 539.581 9.250 1,76%

D5.2. Feasibility analysis, business models, and business plan
industrial partners and large Engineering firms and Value
Proposition
PUBLIC
Copyright CL-Windcon Contract No. 727477 Page 41
Table 16. Installed and managed Wind Capacity World/ENEL 20176
The distribution of capacity by continent in April 2018 is as follows, considering the plants operated,
managed and under construction:
Table 17. EPG Distribution of capacity managed by country and technology, (EGP web site – April 2018)
We can estimate that according to company desires to continue growing in this sector, the market
position between 2026 and 2030 could reach 2% of the SAM market. That represents 16 GW of
windfarms worldwide (SAM for EGP) with global revenues of EUR 25.000 million.
6.2.2 DNV GL – Competitive Position
Following deliverable D5.3 Innovation management DNV GL7 is a global quality assurance and risk
management company. Its purpose of safeguarding life, property and the environment allow
enabling customers to advance the safety and sustainability of their business. DNV GL provides
classification, technical assurance, software and independent expert advisory services to the
maritime, oil & gas, power and renewables industries. It also provides certification, supply chain and
data management services to customers across a wide range of industries. With origins stretching
back to 1864 and operations in more than 100 countries, DNV GL's experts are dedicated to helping
customers make the world safer, smarter and greener.
DNV GL is structured into five business areas, a Global Shared Services organization and a Group
Centre, with a Strategic Research unit:
Net Generation CapacityACTUAL 2017 (GW)
Large Hydro ex-Gx Hydro EGP Wind Geothermal Solar Biogass/biomass TOTAL
South America 9.65 0.33 1.36 0.04 1.39 - 12.77
Argentina 1.33 - - - - - 1.33Brazil 1.04 0.23 0.67 - 0.72 - 2.66Chile 3.46 0.09 0.64 0.04 0.49 - 4.72Colombia 3.06 - - - - - 3.06Peru 0.78 - - - 0.18 - 0.96Uruguay - - 0.05 - - - 0.05
Europa & North Africa 15.61 1.59 3.13 0.76 0.55 0.06 21.70
Italy 10.90 1.52 0.77 0.76 0.42 0.06 14.43Spain 4.71 0.04 1.62 - 0.01 0.00 6.38Romania - - 0.50 - 0.04 - 0.53Grecia - 0.02 0.20 - 0.09 - 0.31Bulgaria - - 0.04 - - - 0.04
North/Central Americas - 0.90 4.38 0.07 0.37 - 5.73
Mexico - 0.05 0.68 - 0.12 - 0.84Panama - 0.30 - - 0.05 - 0.35USA - 0.30 3.61 0.07 0.20 - 4.18Canada - - 0.10 - - - 0.10Guatemala - 0.16 - - - - 0.16Costa Rica - 0.08 - - - - 0.08
Subsaharian Africa & Asia - - 0.37 - 0.32 - 0.69
South Africa - - 0.20 - 0.32 - 0.52India - - 0.17 - - - 0.17
TOTAL EGP 25.26 2.81 9.25 0.87 2.64 0.06 40.89

D5.2. Feasibility analysis, business models, and business plan
industrial partners and large Engineering firms and Value
Proposition
PUBLIC
Copyright CL-Windcon Contract No. 727477 Page 42
• MARITIME BUSINESS ASSURANCE SOFTWARE ENERGY - DNV GL helps enhance the safety,
efficiency and sustainability of customers in the global shipping industry, covering all vessel types
and mobile offshore units.
• OIL & GAS - From the drawing board to decommissioning, DNV GL provides technical advice to
enable oil and gas companies to enhance safety, increase reliability and manage costs in projects
and operations.
• ENERGY - DNV GL supports its customers across the electric power value chain in ensuring
reliable, efficient and sustainable energy supply.
• BUSINESS ASSURANCE - DNV GL helps customers in all industry sectors build sustainable
business performance and create stakeholder trust.
• SOFTWARE - DNV GL's software solutions are based on broad domain competence and
developed to improve customers’ operational efficiency and business optimization
In 2016 DNV GL achieved revenues of EUR 2.165 million and earnings before interest and tax of EUR
16.028 million.
Around 18% of the activity is destined to energy and globally around 50% of that amount is focused
in wind. If we consider an average of EUR 2500 million/year total revenues between 2026 and 2030,
in the five years around EUR 1125 million will be addressed to wind services. Software may
represent 10% of such quantity or EUR 112.5 million (SAM in software services for DNV GL
between 2026 and 2030.
6.2.3 GE – Competitive Position
According to a recent report from GWEC8, there were 20,641 wind turbines installed in 2018 from 37
manufacturers with a combined capacity of 50,617 MW. (21,691 wind turbines were installed
globally in 2017 with a combined capacity of 52,150 MW).
The Top 10 leading Wind Energy Companies accounts for around 270GW installed wind power which
is almost three-quarters of the global total. The companies’ turbines range from 20+ year-old
Figure 13. Revenues distribution DNV by sector

D5.2. Feasibility analysis, business models, and business plan
industrial partners and large Engineering firms and Value
Proposition
PUBLIC
Copyright CL-Windcon Contract No. 727477 Page 43
kilowatt machines to brand new megawatt designs.
•••• Vestas held the title as the world’s largest turbine supplier in 2018, due to the Danish
supplier’s wide geographic diversification strategy and strong performance in the US.
•••• Chinese supplier Goldwind moves up one position to the second place in 2018, after its
domestic market share increased by 5.1% in 2018.
•••• Siemens-Gamesa fell one position to third place, primarily due to the lower installation in
the UK, Germany and India in 2018
•••• GE Renewable Energy retained fourth place by taking advantage of stronger performance in
the US market, where it recaptured the title as the Nº 1 supplier
•••• Envision (China) replaced Enercon in the fifth place, mainly due to its strong growth in China
and the sharp drop of installations in Enercon’s domestic German market in 2018.
•••• Chinese suppliers Mingyang, United Power and Sewind moved up to seventh, ninth and
tenth respectively, which can be largely attributed to stable performance in their home
markets.
•••• Suzlon dropped out of the top 10 turbine suppliers ranking in 2018, primarily a result of
reduced installation, by up to one third, in its home market in India.
GE has a strong position on the wind turbine market where they are the fourth largest supplier on
the onshore wind market with a market share of 10%. GE sold 2,825 turbines during 2017 which is a
decrease from the previous year when they sold 3,289 turbines. A strong factor of GE's growth in the
wind turbine sector has been due to the acquisitions of Alstom in 2015 and LM wind power in 2017.
The acquisition of Alstom increased the turbine shipments with 420 that year and increased the
shipped megawatts by 32%. The acquisition of LM brought value in form of external customers
worldwide, new advanced rotor solutions, improved blade efficiency, increased rotor swept area and
a greater reach to the major global markets for wind.
The revenues GE-GP generated from renewables were 10.3 billion dollars during 2017 where 89%
from the revenue was from the wind segment. Please check deliverable D5.3. Innovation
management report. So, revenues in 2017 applied to the wind sector in EUR were around EUR 8000
million with almost 52.1 GW (roughly EUR 153.50 million /GW manufactured).
If we consider that GE-GP keeps the 10% of the market, from the 800 GW, SAM market, GE will take
80 GW in five years (from 2026 to 2030) or EUR 12 280 million. 80 GW represents 100 windfarms of
800 MW each. This is the total SAM market for GE-GP
6.2.4 RAMBOLL – Competitive Position
Ramboll GmbH is a leading consultancy on the international market finding innovative and durable
solutions to the challenges of the physical environment in which life unfolds. This includes natural
resources, infrastructure, buildings and structures, urban spaces and the transition towards a more
resource efficient future. These challenges are met by seven business units – Buildings, Environment
& Health, Transport, Water, Management Consulting, Energy, and Oil and Gas. Since January 2018,

D5.2. Feasibility analysis, business models, and business plan
industrial partners and large Engineering firms and Value
Proposition
PUBLIC
Copyright CL-Windcon Contract No. 727477 Page 44
Oil & Gas is part of the Energy business unit. Ramboll is a Nordic company with Danish roots that is
well represented on the international market especially in Germany, UK and North America
The Energy sector incorporates the Ramboll Wind market, which offers comprehensive expert
services for the different project stages in the wind energy industry from early feasibility, business
case and impact assessment studies to planning, engineering, implementation, commissioning and
the subsequent operation & maintenance. Ramboll is a full-range service provider in wind energy
projects. The service encompasses the entire project cycle from concept to commissioning and the
subsequent operation & maintenance period in onshore wind power projects all over the world. In
the offshore wind industry Ramboll is the world leader within design of offshore foundations, having
a market share of about 65% of the world’s offshore wind turbines on more than 40 offshore wind
farms. Ramboll carries out all the necessary analyses to select the foundation type best suited for the
offshore wind farm project, based on factors such as the choice of turbine and site conditions.
According to our recent investigation in deliverable D5.3 Innovation management, from a total of
EUR 1400 million in 2017 around EUR 120 million corresponds to the energy activities and 75% can
be applied to the wind sector (approximately EUR 90 million for the 65% of 600 GW (390 GW). During
period 2026 to 2030 Ramboll will have direct access to the global SAM market (800 GW), so around
EUR 180 million will be received in wind services. This is the SAM market for Ramboll.
6.2.5 DEWI – Competitive Position
UL Renewables with its entities UL DEWI and UL AWS True Power is part of the UL Company. Both
are global service providers serving the wind energy industry in the areas of Certification, advisory,
testing and inspection with the following service portfolio:
o Certification of Grid Code compliance
o Wind turbine testing
o Forecasting
o Wind measurements
o Energy yield assessment
o Wind mapping
o Due diligence services
o Power curve verification
o Grid integration
o Project certification
o Software
o Type certification
o Component certification
o Research and studies

D5.2. Feasibility analysis, business models, and business plan
industrial partners and large Engineering firms and Value
Proposition
PUBLIC
Copyright CL-Windcon Contract No. 727477 Page 45
Figure 14. Services provided by UL Renewables
UL Renewables conducts these services with more than 500 people in over 134 countries and yields a
global revenue about 56 million US Dollars (around EUR 50 million, 100% wind sector).
DEWI will have access to all the SAM market 800 GW between 2026 and 2030. If it keeps the
revenues EUR 50 million per year, for a current 390 GW market (65% of total current market of 600
GW), the total expected revenues between 2026 and 2030 will be EUR around 100 million (SAM
market).
6.2.6 Global view Serviceable Addressable Market (SAM) large companies
During the previous analysis we have considered that between 2021 and 2030, 1600 GW new
capacity will be installed (Total Addressable Market). From them, CL-Windcon partner might get
access to around half of them. Asian markets access will be limited. That provides a figure of 800 GW
where the new technology could be installed (this is the most optimistic scenario). This is the
Serviceable Available Market or SAM represented in the table below.

D5.2. Feasibility analysis, business models, and business plan
industrial partners and large Engineering firms and Value
Proposition
PUBLIC
Copyright CL-Windcon Contract No. 727477 Page 46
However, how many of these theoretical markets will be accessible for the big companies at CL-
Windcon?
To answer that question, we must consider the competitive position of these large companies
globally and infers their position between 2026 and 2030. To that end, we consider the following
assumptions:
•••• Taking in consideration the results of deliverable D4.6 cost benefit analysis for a 800 MW
offshore windfarm, savings associated to the new algorithms yaw control reached EUR 27
million during the whole project lifetime. Thus, every year, the savings reaches EUR 1.1
million at present value for the windfarm owner/promoter. Then, in the case of EGP, a
windfarm of 800 MW generates EUR 5.5 million in five years. If they manage 16,000 MW, the
savings with the new control will reach EUR 108 million. However, we consider that only 50%
of installations apply the new technology reducing the incomes to EUR 54 million
(Serviceable Obtainable Market or SOM).
•••• For the OEMs (GE) we consider that introducing the modifications in the control software at
turbine level and adding new more refined gauges to determine loads, could be sold at a
price of 10,000 € per turbine. Below the calculations for GE associated to the new
technology. With a ratio of 2.45 MW/turbine, 80 000 MW represents 32 623 turbines and
EUR 326.2 million revenues. The SOM market will be half of it.
FORECAST WIND (2021-2030) Global Unit
TAM. Total Addressable Market (CL-Windcon) 1,600.0 GW
Installed 2020-2025 1,100.0 GW
Installed 2026-2030 500.0 GW
SAM Serviceable AvailableMarket (CL-Windcon ) 800.0 GW
ASSUMPTIOS FOR EGP CALCULATION Data Unit
Results from D4.5 800.0 MW
Savings 27.0 Million €
Savings (5 years) PV 5.4 Million/5 year
Concept EGP Unit
SAM 2026 -2030 16.0 GW
Wind sector Revenues 25,000.0 million €
Business linked to CL-Windcon 108.0 million €
SOM 2026-2030 (50%) 54.0 million €
Table 19. SOM market for EGP
Table 18. TAM and SAM markets
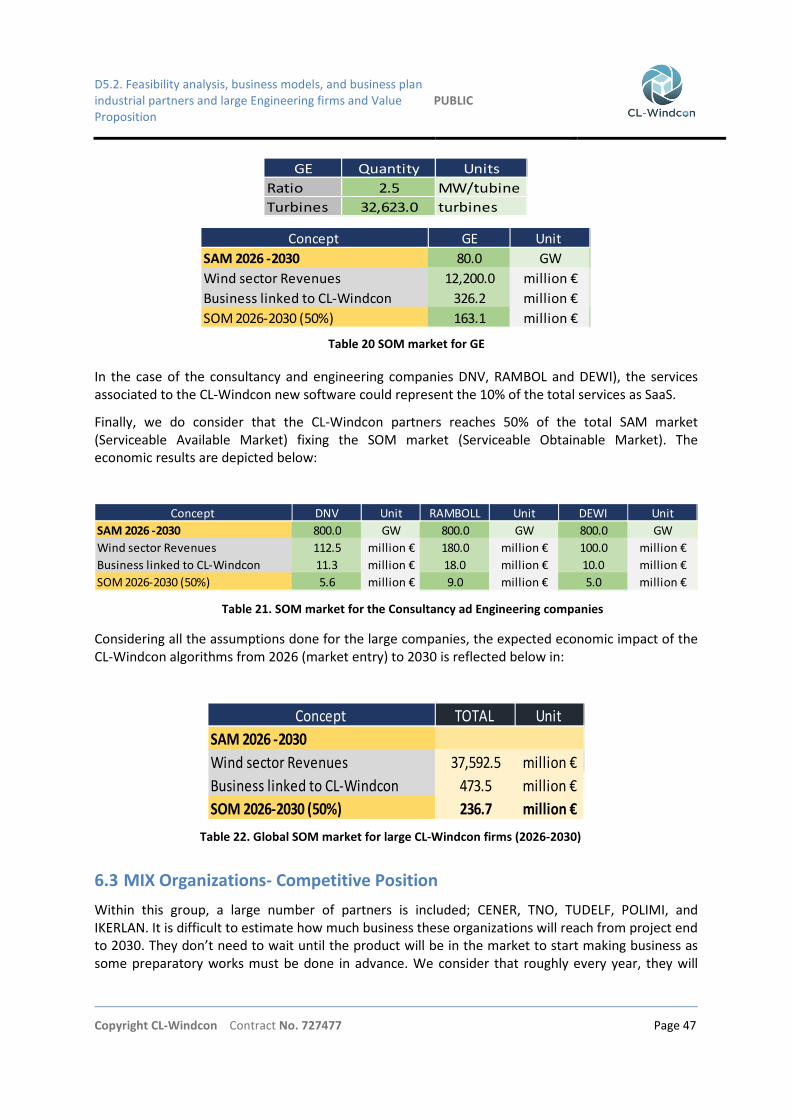
D5.2. Feasibility analysis, business models, and business plan
industrial partners and large Engineering firms and Value
Proposition
PUBLIC
Copyright CL-Windcon Contract No. 727477 Page 47
In the case of the consultancy and engineering companies DNV, RAMBOL and DEWI), the services
associated to the CL-Windcon new software could represent the 10% of the total services as SaaS.
Finally, we do consider that the CL-Windcon partners reaches 50% of the total SAM market
(Serviceable Available Market) fixing the SOM market (Serviceable Obtainable Market). The
economic results are depicted below:
Considering all the assumptions done for the large companies, the expected economic impact of the
CL-Windcon algorithms from 2026 (market entry) to 2030 is reflected below in:
6.3 MIX Organizations- Competitive Position
Within this group, a large number of partners is included; CENER, TNO, TUDELF, POLIMI, and
IKERLAN. It is difficult to estimate how much business these organizations will reach from project end
to 2030. They don’t need to wait until the product will be in the market to start making business as
some preparatory works must be done in advance. We consider that roughly every year, they will
GE Quantity Units
Ratio 2.5 MW/tubine
Turbines 32,623.0 turbines
Concept GE Unit
SAM 2026 -2030 80.0 GW
Wind sector Revenues 12,200.0 million €
Business linked to CL-Windcon 326.2 million €
SOM 2026-2030 (50%) 163.1 million €
Concept DNV Unit RAMBOLL Unit DEWI Unit
SAM 2026 -2030 800.0 GW 800.0 GW 800.0 GW
Wind sector Revenues 112.5 million € 180.0 million € 100.0 million €
Business linked to CL-Windcon 11.3 million € 18.0 million € 10.0 million €
SOM 2026-2030 (50%) 5.6 million € 9.0 million € 5.0 million €
Concept TOTAL Unit
SAM 2026 -2030
Wind sector Revenues 37,592.5 million €
Business linked to CL-Windcon 473.5 million €
SOM 2026-2030 (50%) 236.7 million €
Table 20 SOM market for GE
Table 21. SOM market for the Consultancy ad Engineering companies
Table 22. Global SOM market for large CL-Windcon firms (2026-2030)

D5.2. Feasibility analysis, business models, and business plan
industrial partners and large Engineering firms and Value
Proposition
PUBLIC
Copyright CL-Windcon Contract No. 727477 Page 48
reach EUR 0.25 million/year in services associated to the new technology thorough public or private
customers. That will add in 10 years additional EUR 12.5 million to the global impact.
6.4 Pure Researcher Organization – Competitive Position
TUM, USTUFF and AUU will improve the knowledge transference. As in the previous case, they will
continue working but we less economic expectations in the order of EUR 0.05 million/year. The same
figure can be applied to Zabala and Qi Energy (SMEs). In total revenues for SMEs and PR might reach
EUR 2.5 million.
6.5 Global Economic Impact
In total, approximately EUR 250 million revenues will be generated by the CL-Windcon partners from
2021 to 2030. In 10 years (2021 to 2030) job creation might be around 2500 new direct employment
and 2500 indirect totalizing 5000 new employment.

D5.2. Feasibility analysis, business models, and business plan
industrial partners and large Engineering firms and Value
Proposition
PUBLIC
Copyright CL-Windcon Contract No. 727477 Page 49
7 CONCLUSIONS
The deliverable provides an overview of the economic impacts that the new windfarm control
technology will generate in the marketplace in a period of ten years (from 2021 to 2030) and is based
on the results obtained in an exercise implemented in deliverable D4.6 entitled Cost benefit analysis
and some other information collected in the project and deliverable author own calculations. A
baseline scenario was compared with a yaw scenario where the turbine wakes are reoriented to
improve the global windfarm performance. When considering this simplified methodology to
calculate the loads and OPEX variations between both scenarios, the economic results are interesting
as an average of EUR 27 million savings in the most likely scenario, generated due to the increase of
energy output during the whole lifetime of the project. The sensibility analysis demonstrates that this
figure could vary up or down around EUR 30 million in case some of the external conditions like
WACC, inflation rate or internal performance (less or more O&M costs or additional energy output)
were applied, making difficult to estimate at this stage if the yaw solution could positively modify the
economic result. Besides, the theoretical exercise done in deliverable 4.6 just considered the effects
of the wake redirection without adding other technics to optimize the windfarm behaviour, so there
is a great margin of improvement.
Anyway, with the mentioned gaining between the yaw and the baseline scenarios, the partners in
the project were classified in three different groups; pure researchers (PR), pure businesses (PB) and
mixed organizations (MO), according to their interest for the research, the market or both. Then, a
Canvas model was prepared for these groups and the Value Proposition identified. Later, each large
company was analysed to determine their competitive position and the impact of the new
technology in their accounts. Total results showed EUR 250 million impact for all the partners
between 2021 and 2030, being 2026, the entry point of the technology in the market for the large
companies, whilst SME, Technological Centres and Universities may start exploiting results from early
2021.
The final conclusion is that there has been a great advantage of knowledge during the project
execution, in a very complex problem that will require additional research in the future, but the
exercise in CL-Windcon has proven that the margin to reduce LCOE and generate additional savings is
very high. Another great advantage of the control algorithms is that they can be applied to existing
or new windfarms in onshore and offshore applications and can be used for windfarm design,
simulation, redesign, operation, maintenance or research in specific windfarm elements. It is very
likely, that in the future, most windfarms will use these technics to optimize their performance.

D5.2. Feasibility analysis, business models, and business plan
industrial partners and large Engineering firms and Value
Proposition
PUBLIC
Copyright CL-Windcon Contract No. 727477 Page 50
8 REFERENCES
1 De Blas, J, Schwartz D, Medina, J, Langner, F, Ristow, H, Schwarzkopf, MA., Cosack, N, CL-Windcon Deliverable
D4.6 Cost benefit analysis, October 2019
2 https://www.greentechmedia.com/articles/read/worlds-first-floating-offshore-wind-farm-65-capacity-
factor#gs.3xaq46
3 De Blas, J., Medina, J., Potenza, GC., Calabretta, D., Smolka, U., Schwarzkopf, MA and Elorza, I. CL-Windcon
Deliverable D5.3 Report, Innovation manager activities (final), October 2019
4 GWEC, Global Wind Report 2018, April 2019
5 Accenture Strategy, Paul Scherrer Institute, WEC World Energy Scenarios 2019, Exploring Innovation
Pathways to 2040, 2019
6 QiE Calculation
7 https://www.dnvgl.com/about/index.html
8 GWEC, Global Wind Market Development. Supply Side Data 2018