Embed Size (px)
Citation preview
Demand Analysis Working Group 2019 Revised Transportation Forecast
Approach to Estimate Vehicle Emissions
Elena Giyenko November 14, 2019 California Energy Commission
Why Calculate Vehicle Emissions?
Ch.8: Transportation Energy Demand Forecast Recommendation
Leverage the transportation energy demand forecasting models to assess zero-emission transportation policies
Exploratory Questions
• What are the estimated NOx and GHG emissions in 2023,
2024, and 2030?
– Statewide and locally
• How do changes in fleet compositions impact estimates?
• What are preliminary results/conclusions?
• What is missing or would be of interest?
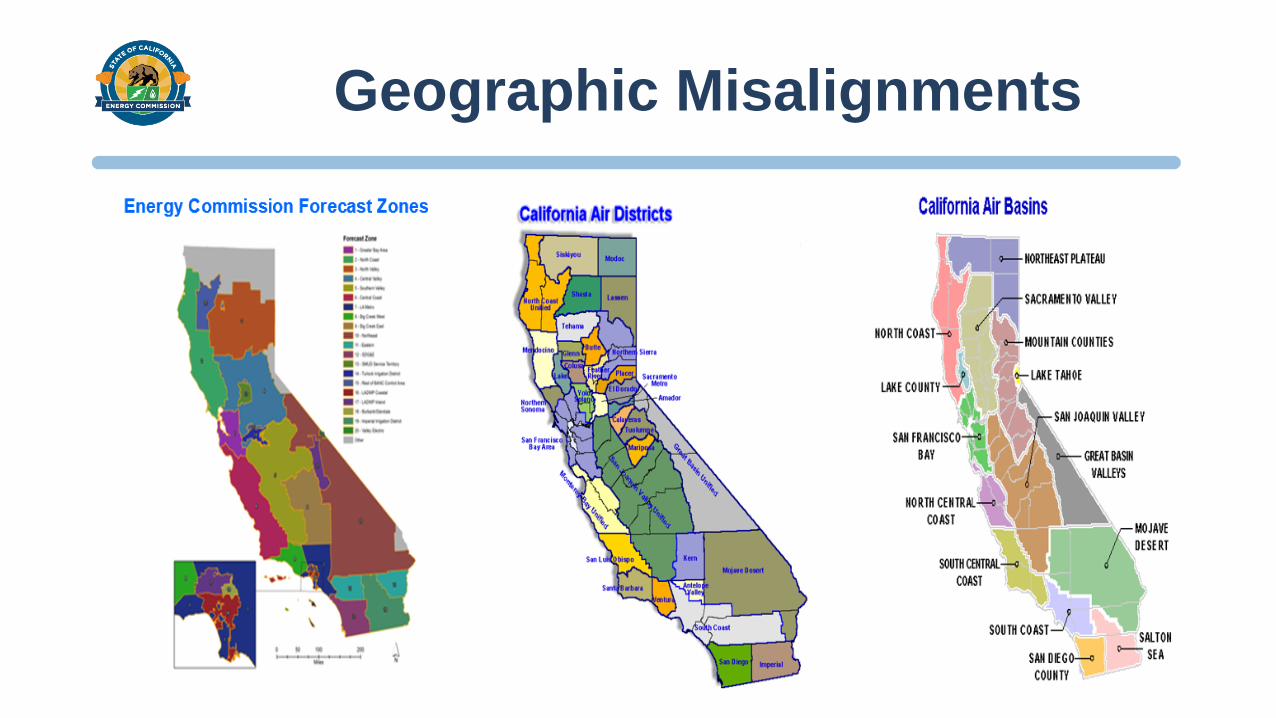
Geographic Misalignments
What Data Sources?
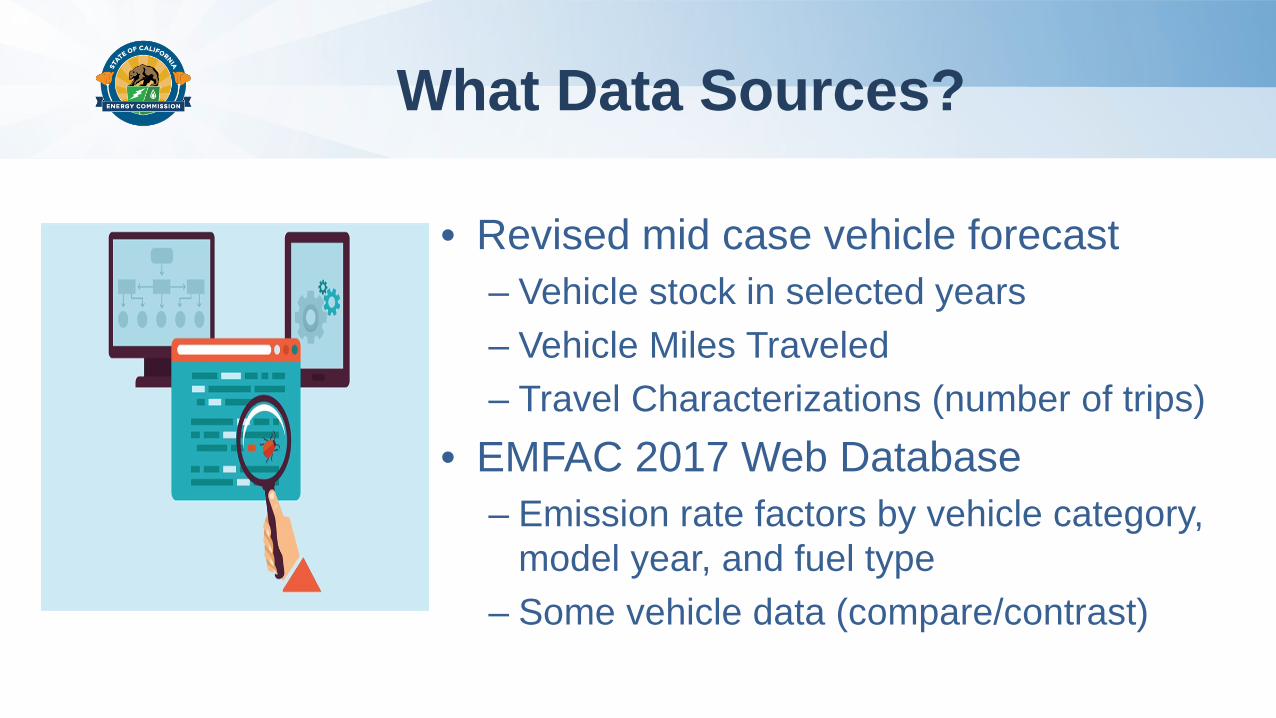
• Revised mid case vehicle forecast – Vehicle stock in selected years – Vehicle Miles Traveled – Travel Characterizations (number of trips)
• EMFAC 2017 Web Database – Emission rate factors by vehicle category, model year, and fuel type
– Some vehicle data (compare/contrast)
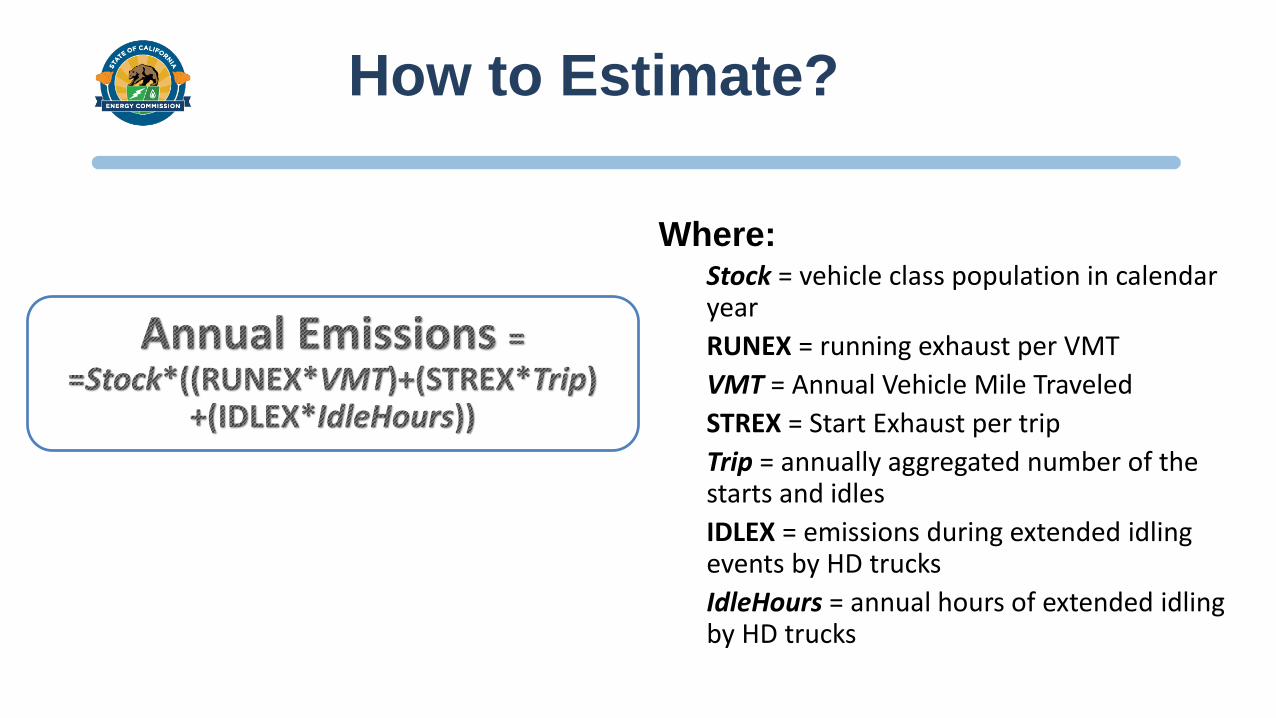
How to Estimate?
Where: Stock = vehicle class population in calendar year RUNEX = running exhaust per VMT VMT = Annual Vehicle Mile Traveled STREX = Start Exhaust per trip Trip = annually aggregated number of the starts and idles IDLEX = emissions during extended idling events by HD trucks IdleHours = annual hours of extended idling by HD trucks

Thousands
Revised School Bus Forecast by Fuel Type
35 30
Diesel 25 Natural Gas 20 Propane
Gasoline 15 Hybrid 10 Electric
5 0
2023 2024 2030
Source: from CEC Revised Transportation Energy Demand Forecast (2019-2030)
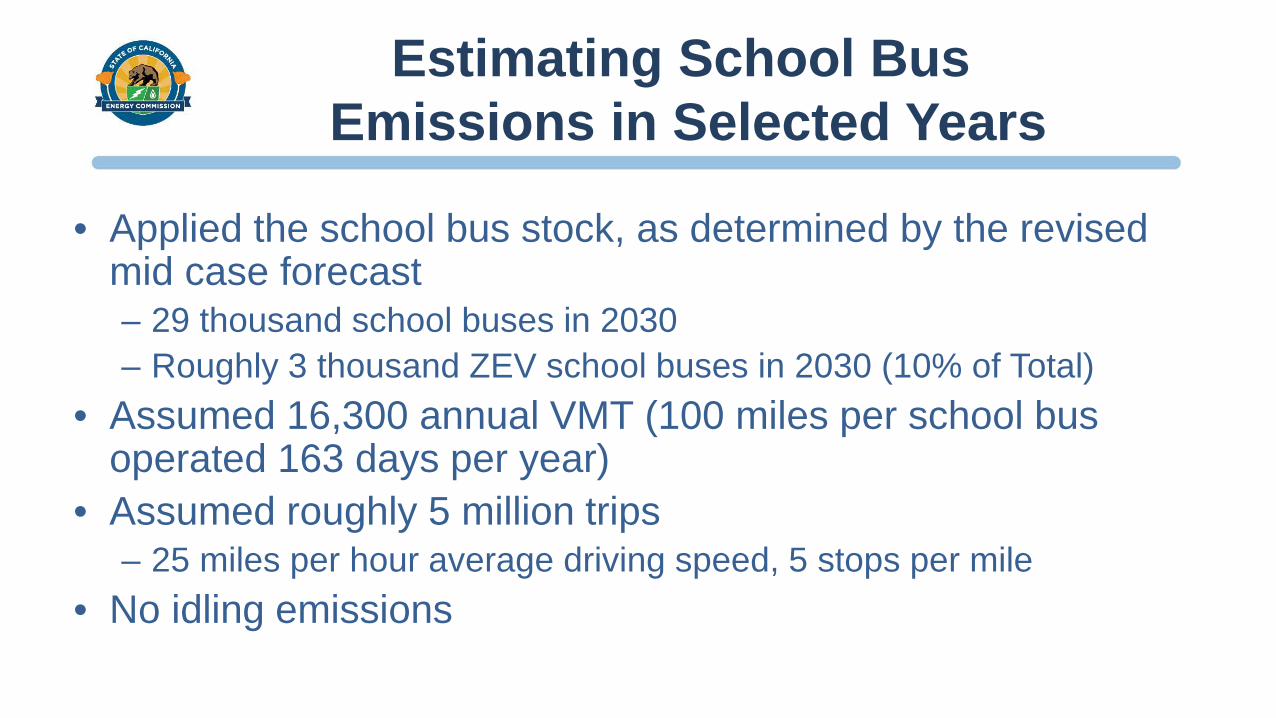
Estimating School Bus Emissions in Selected Years
• Applied the school bus stock, as determined by the revised mid case forecast – 29 thousand school buses in 2030 – Roughly 3 thousand ZEV school buses in 2030 (10% of Total)
• Assumed 16,300 annual VMT (100 miles per school bus operated 163 days per year)
• Assumed roughly 5 million trips – 25 miles per hour average driving speed, 5 stops per mile
• No idling emissions
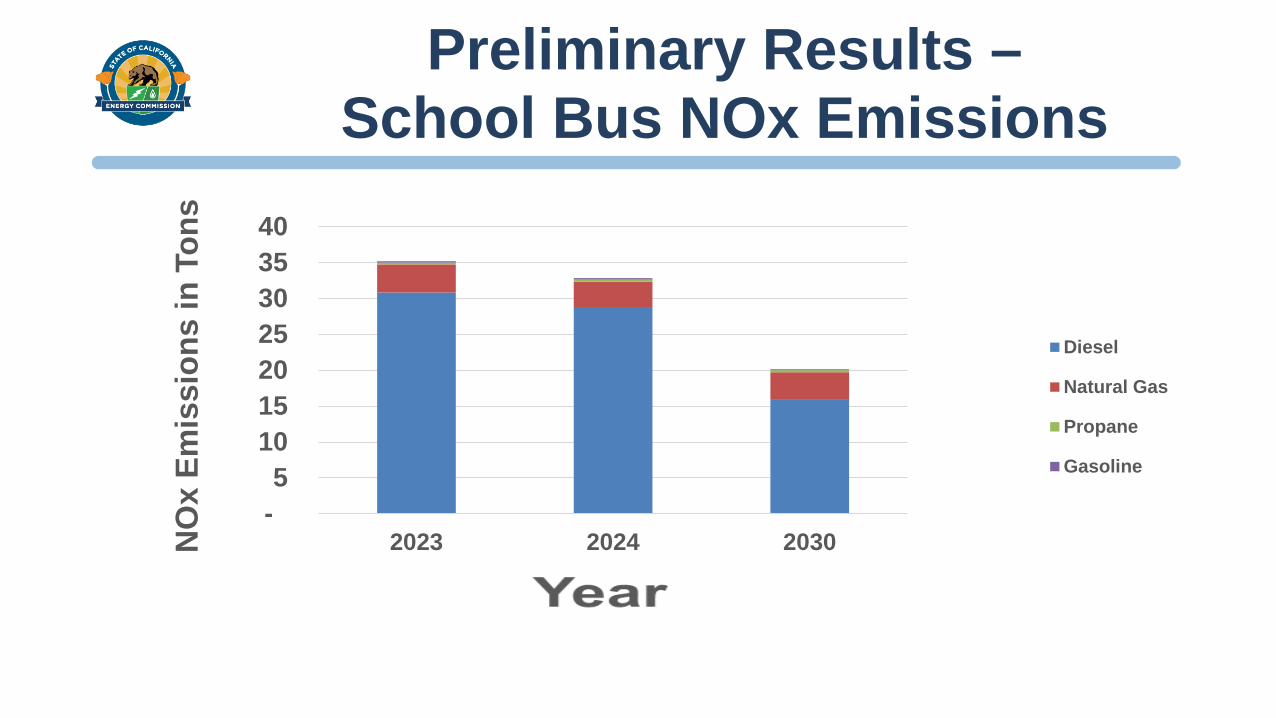
Preliminary Results –School Bus NOx Emissions
NOx Em
issions in Tons 40
35 30 25 Diesel 20
Natural Gas 15
Propane 10 Gasoline 5
-2023 2024 2030
Questions? Contact Info:
Elena Giyenko Transportation Energy Forecasting Unit
Contributors: Heidi Javanbakht