Demand Analysis Working Group 2019 Revised Transportation Forecast
Approach to Estimate Vehicle Emissions
Elena Giyenko November 14, 2019 California Energy Commission
Why Calculate Vehicle Emissions?
Ch.8: Transportation Energy Demand Forecast Recommendation
Leverage the transportation energy demand forecasting models to assess zero-emission transportation policies
Exploratory Questions
• What are the estimated NOx and GHG emissions in 2023,
2024, and 2030?
– Statewide and locally
• How do changes in fleet compositions impact estimates?
• What are preliminary results/conclusions?
• What is missing or would be of interest?
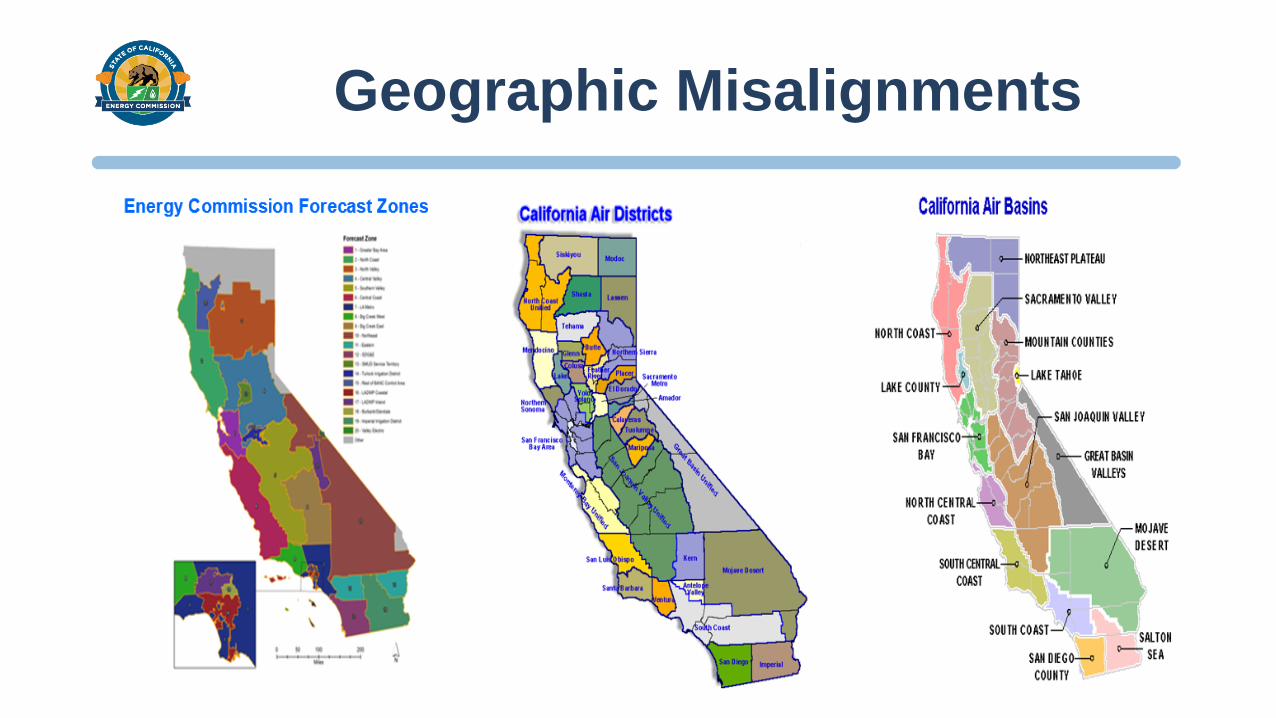
Geographic Misalignments
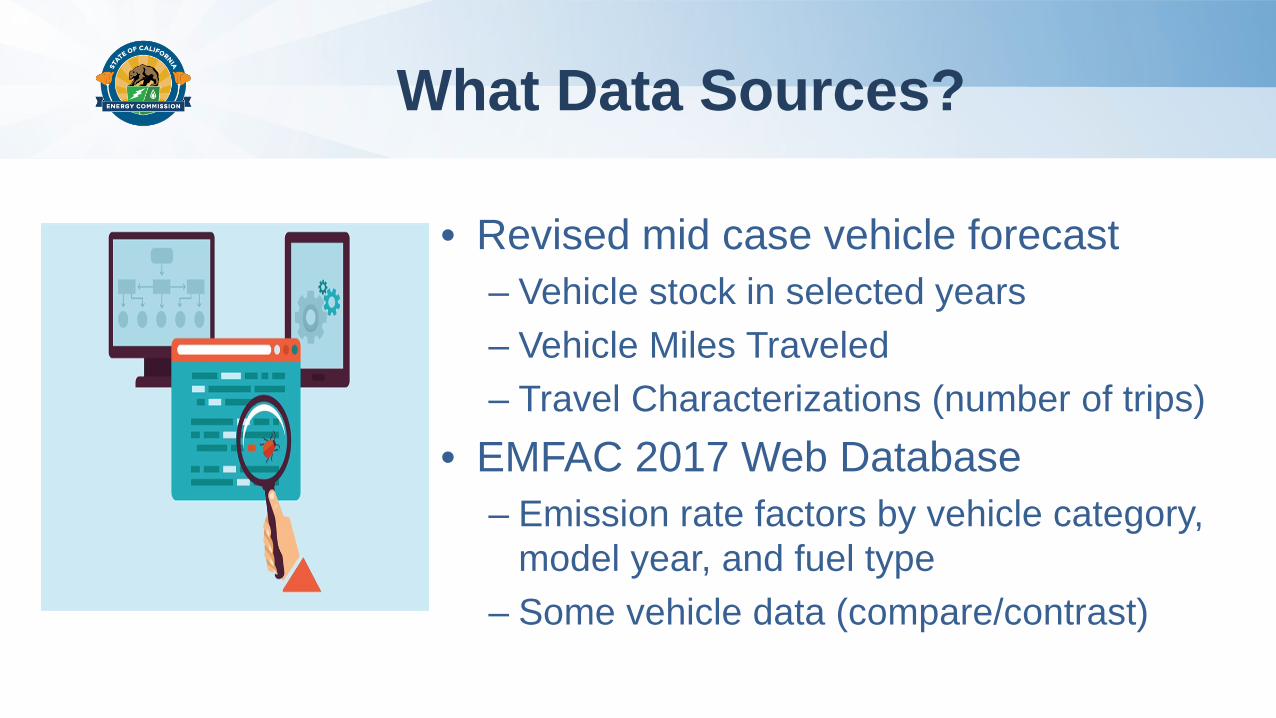
What Data Sources?
• Revised mid case vehicle forecast – Vehicle stock in selected years – Vehicle Miles Traveled – Travel Characterizations (number of trips)
• EMFAC 2017 Web Database – Emission rate factors by vehicle category, model year, and fuel type
– Some vehicle data (compare/contrast)
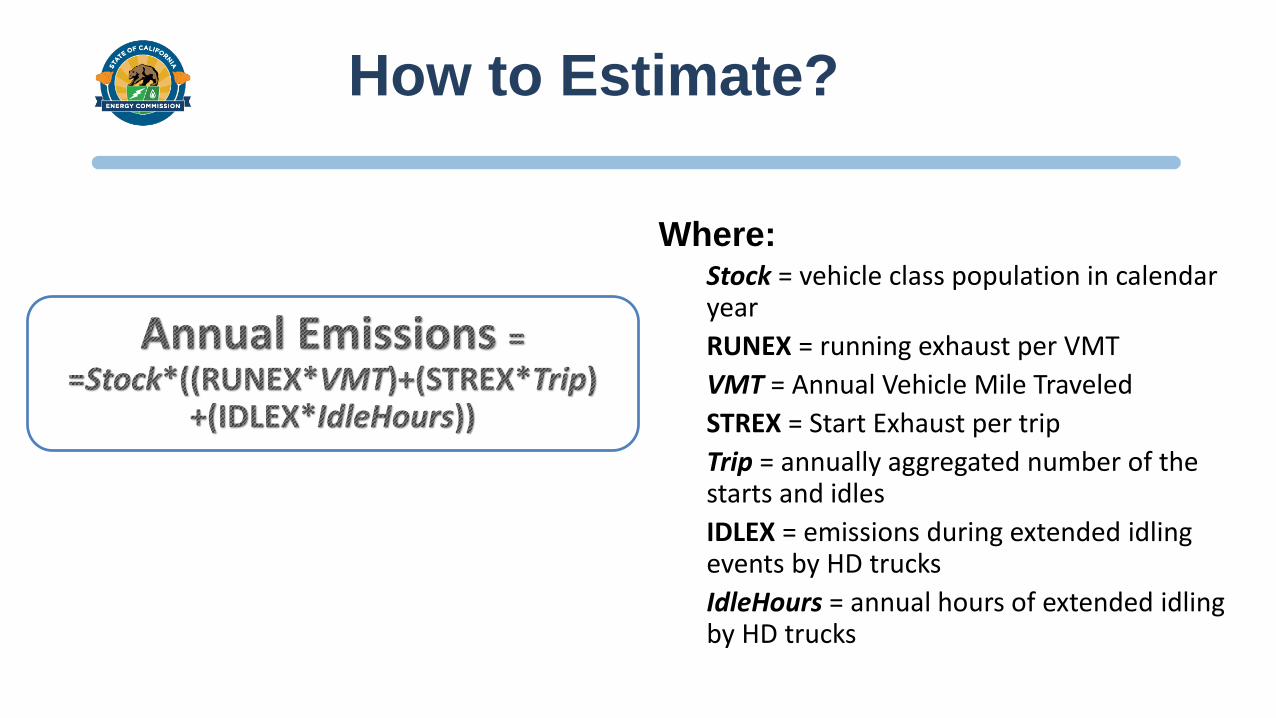
How to Estimate?
Where: Stock = vehicle class population in calendar year RUNEX = running exhaust per VMT VMT = Annual Vehicle Mile Traveled STREX = Start Exhaust per trip Trip = annually aggregated number of the starts and idles IDLEX = emissions during extended idling events by HD trucks IdleHours = annual hours of extended idling by HD trucks

Thousands
Revised School Bus Forecast by Fuel Type
35 30
Diesel 25 Natural Gas 20 Propane
Gasoline 15 Hybrid 10 Electric
5 0
2023 2024 2030
Source: from CEC Revised Transportation Energy Demand Forecast (2019-2030)
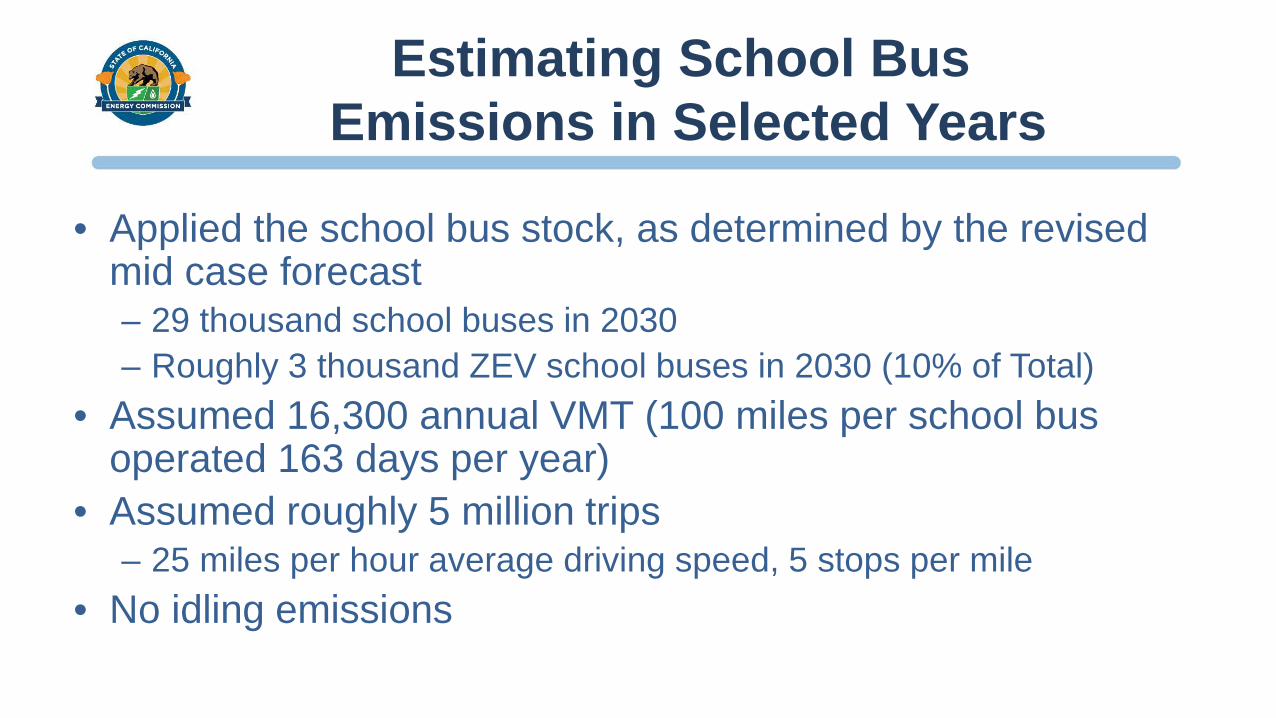
Estimating School Bus Emissions in Selected Years
• Applied the school bus stock, as determined by the revised mid case forecast – 29 thousand school buses in 2030 – Roughly 3 thousand ZEV school buses in 2030 (10% of Total)
• Assumed 16,300 annual VMT (100 miles per school bus operated 163 days per year)
• Assumed roughly 5 million trips – 25 miles per hour average driving speed, 5 stops per mile
• No idling emissions
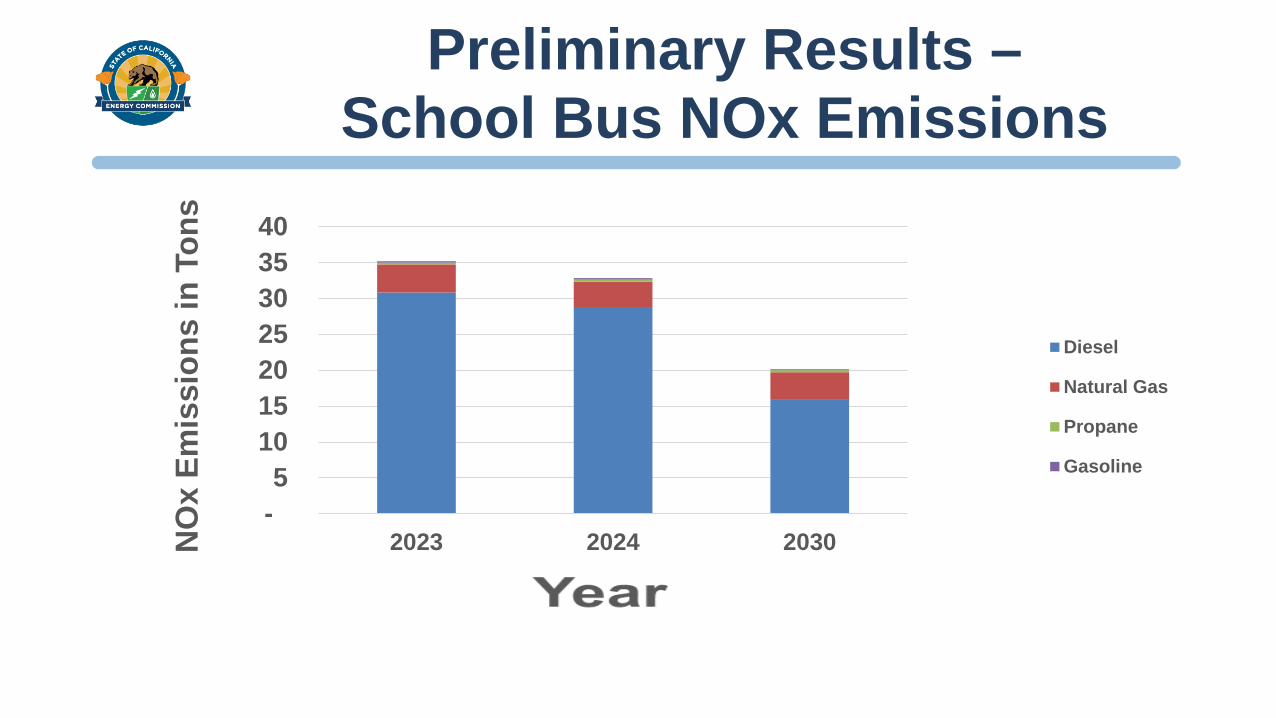
Preliminary Results –School Bus NOx Emissions
NOx Em
issions in Tons 40
35 30 25 Diesel 20
Natural Gas 15
Propane 10 Gasoline 5
-2023 2024 2030
Questions? Contact Info:
Elena Giyenko Transportation Energy Forecasting Unit
Contributors: Heidi Javanbakht
Recommended