Embed Size (px)
Citation preview
1
STUDY UNIT 4
DEMAND AND
SUPPLY
2
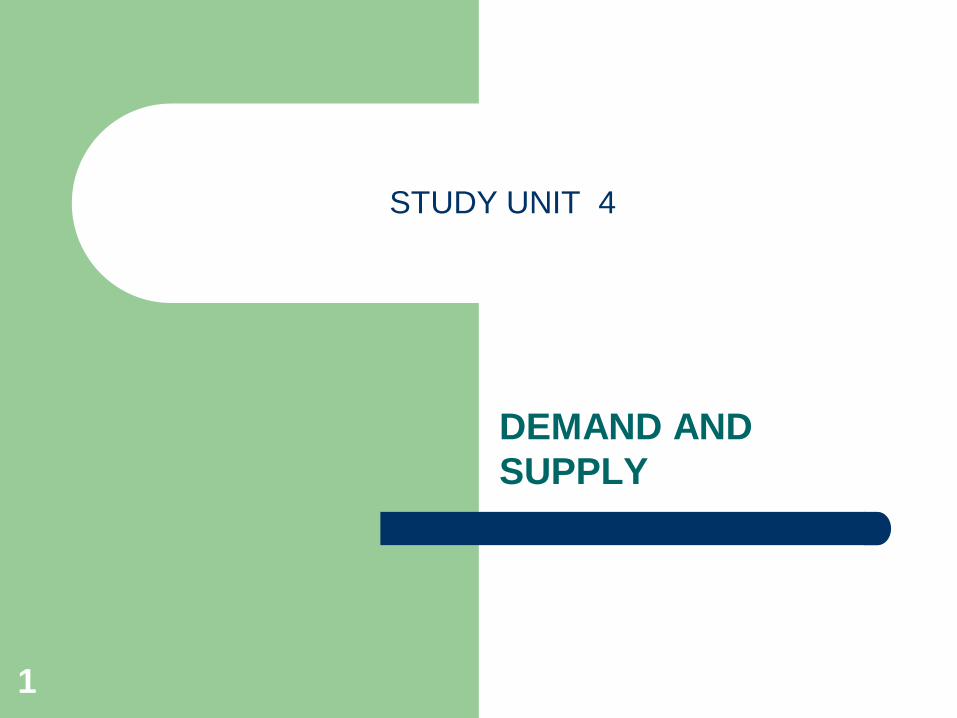
SOME STUDY OBJECTIVES
Draw and read simple graphs
Explain the difference between demand and quantity demanded
Differentiate between a movement along and a shift of a demand
curve
Identify the determinants of demand
Differentiate between a movement along and a shift of a supply
curve
Identify the determinants of supply
Explain how the equilibrium price and equilibrium quantity are
determined
3Chapter 7 Demand, supply and prices
© Van Schaik Publishers 3
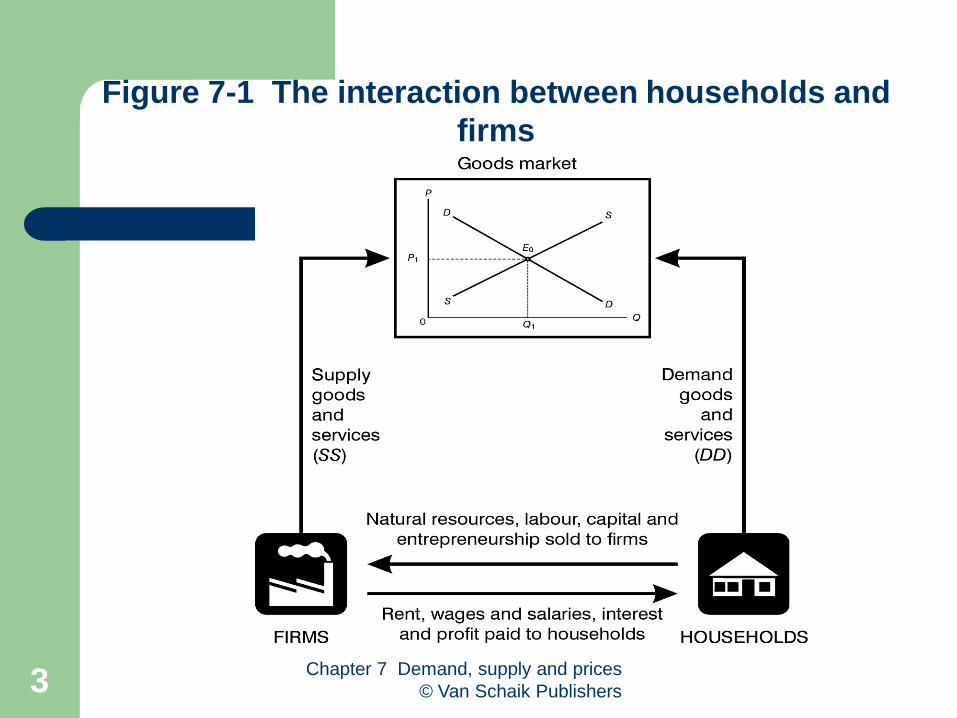
Figure 7-1 The interaction between households and
firms
4
DEMAND - CONSUMERS
DEMAND = QUANTITIES OF A GOOD OR SERVICE THAT THE
POTENTIAL BUYERS ARE WILLING AND ABLE TO BUY
DEMAND IS NOT NEEDS, WANTS, CLAIMS OR REQUESTS
DEMAND IS A FLOW CONCEPT
INDIVIDUAL DEMAND vs. MARKET DEMAND
WHAT DETERMINES INDIVIDUAL DEMAND? Textbook 4th ed. pp
111-112
LAW OF DEMAND
– P → Qd
– P → Qd
DEMAND SCHEDULE
GRAPHIC ILLUSTRATION
5Chapter 7 Demand, supply and prices
© Van Schaik Publishers 5
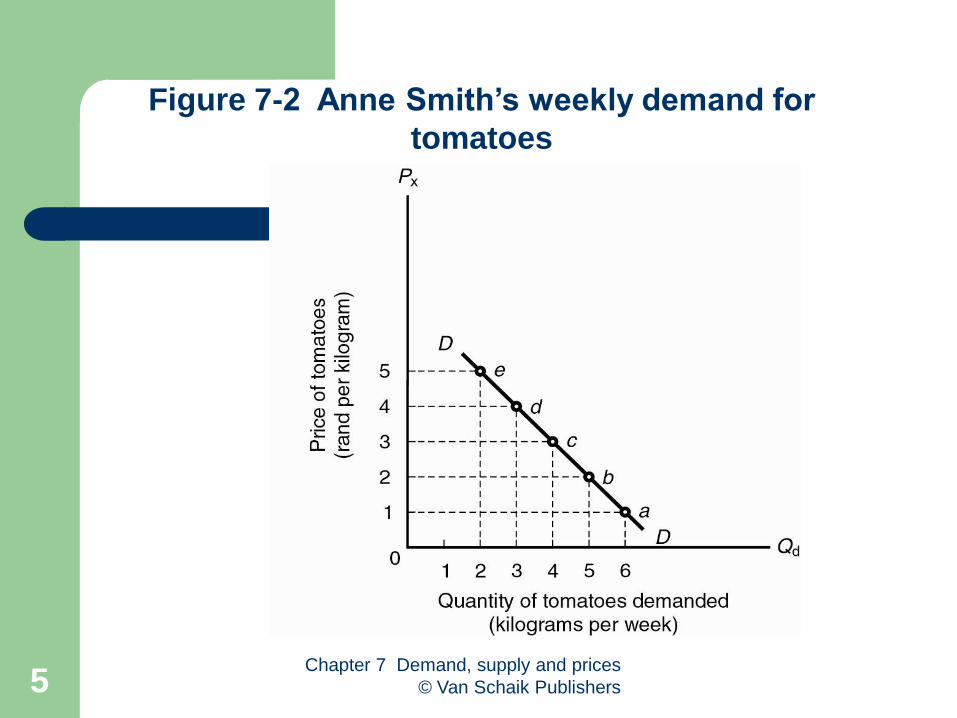
Figure 7-2 Anne Smith’s weekly demand for
tomatoes
6Chapter 7 Demand, supply and prices
© Van Schaik Publishers 6
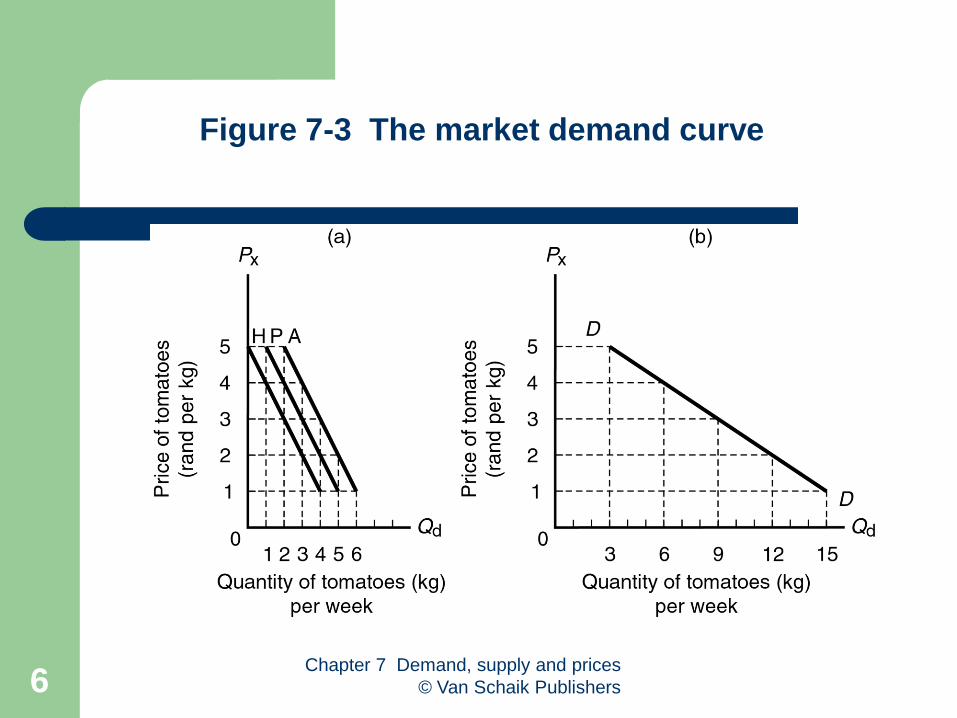
Figure 7-3 The market demand curve
7
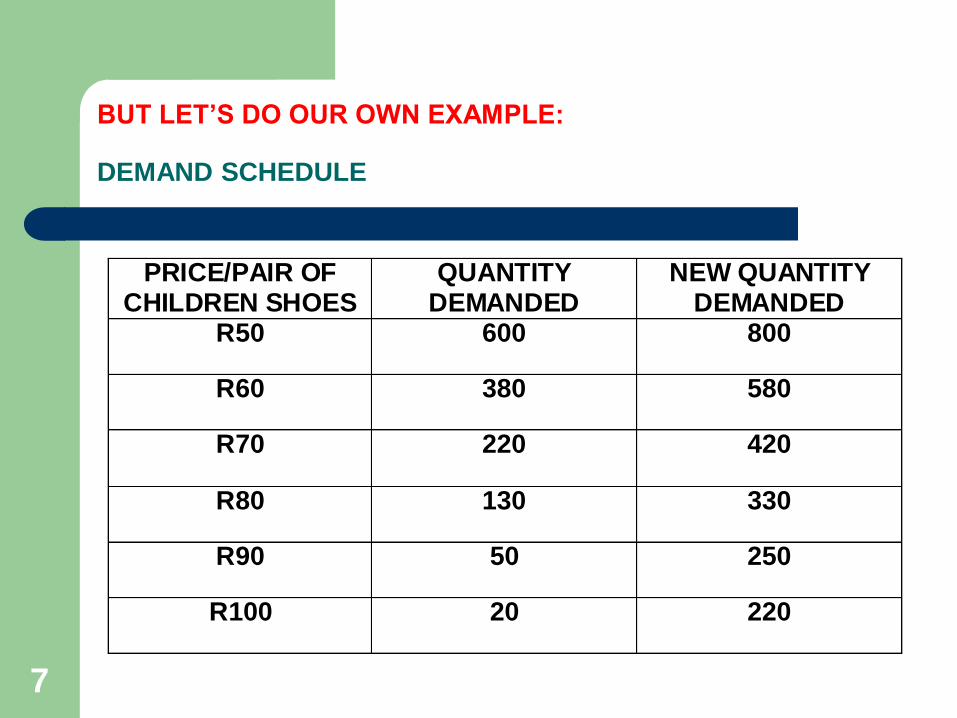
BUT LET’S DO OUR OWN EXAMPLE:
DEMAND SCHEDULE
PRICE/PAIR OF CHILDREN SHOES
QUANTITY DEMANDED
NEW QUANTITY DEMANDED
R50 600 800
R60 380 580
R70 220 420
R80 130 330
R90 50 250
R100 20 220
8
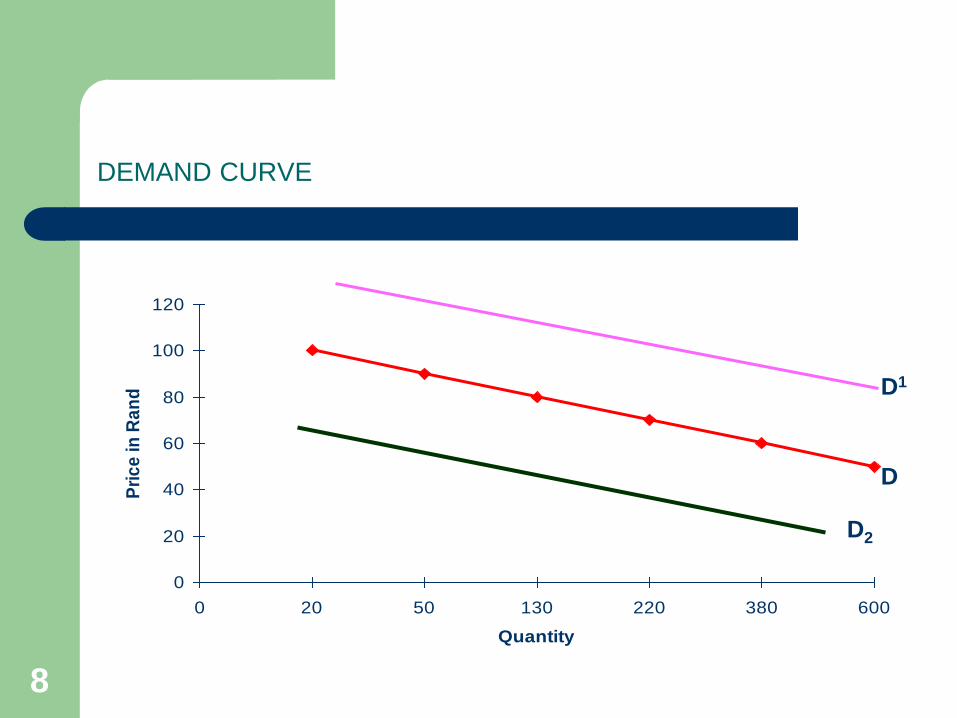
DEMAND CURVE
0
20
40
60
80
100
120
0 20 50 130 220 380 600
Quantity
Pri
ce
in
Ra
nd D1
D2
D
9Chapter 7 Demand, supply and prices
© Van Schaik Publishers 9
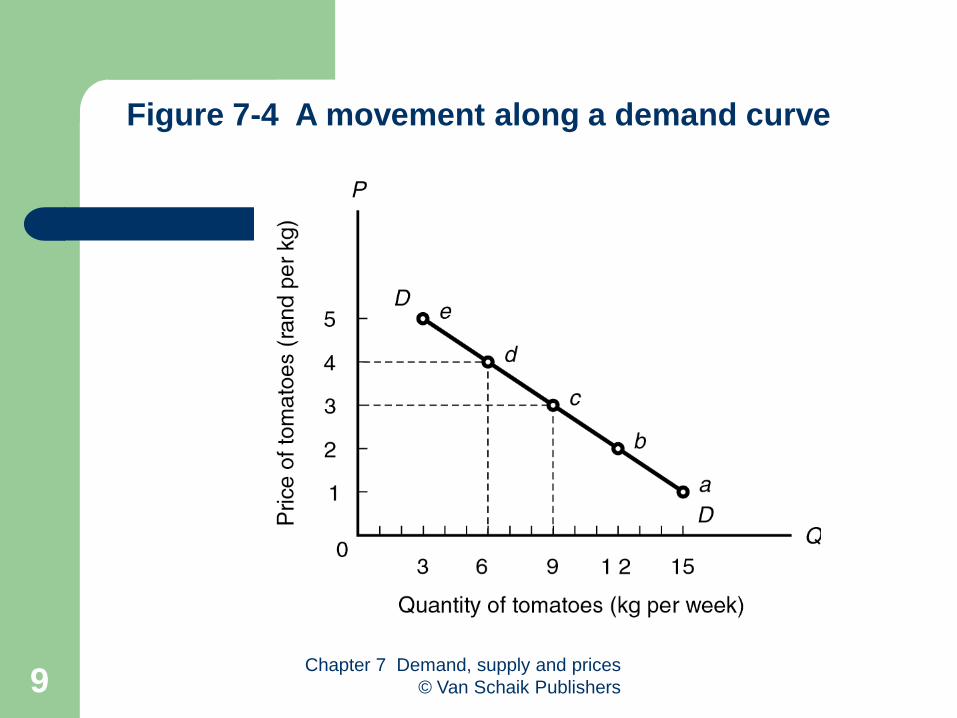
Figure 7-4 A movement along a demand curve
10
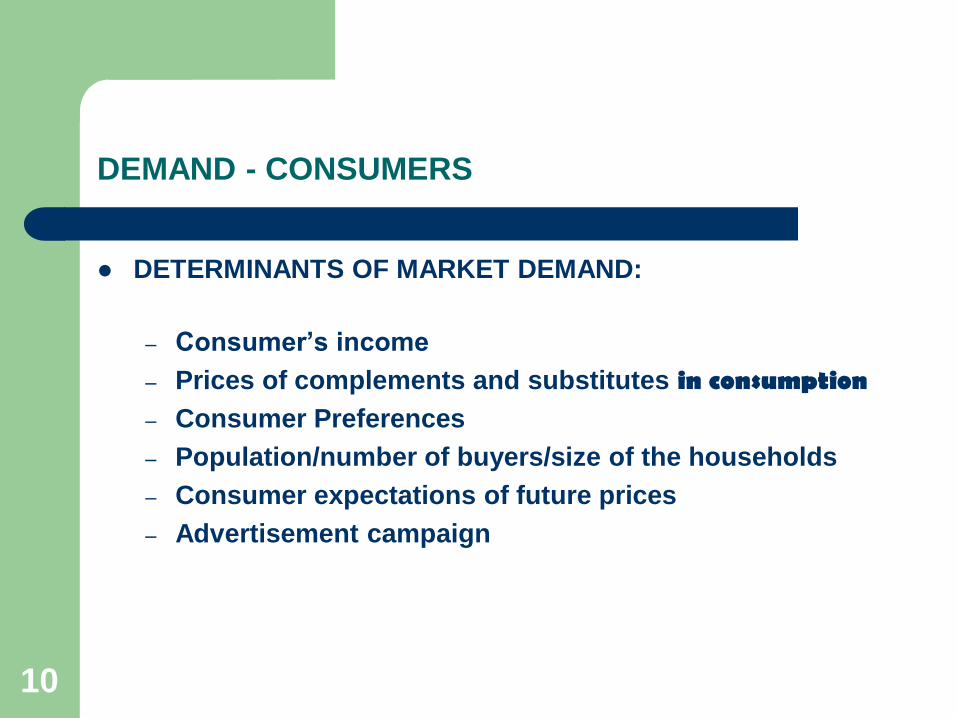
DEMAND - CONSUMERS
DETERMINANTS OF MARKET DEMAND:
– Consumer’s income
– Prices of complements and substitutes in consumption– Consumer Preferences
– Population/number of buyers/size of the households
– Consumer expectations of future prices
– Advertisement campaign
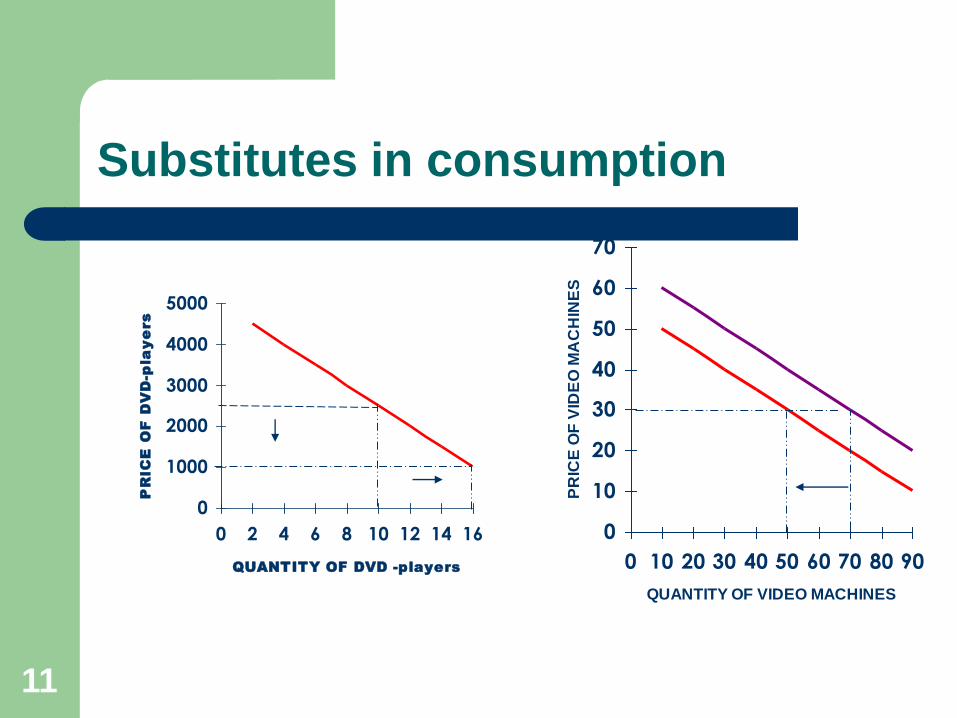
11
Substitutes in consumption
0
1000
2000
3000
4000
5000
0 2 4 6 8 10 12 14 16
QUANTITY OF DVD -players
PR
IC
E O
F D
VD
-p
la
ye
rs
0
10
20
30
40
50
60
70
0 10 20 30 40 50 60 70 80 90
QUANTITY OF VIDEO MACHINES
PR
ICE
OF
VID
EO
MA
CH
INE
S
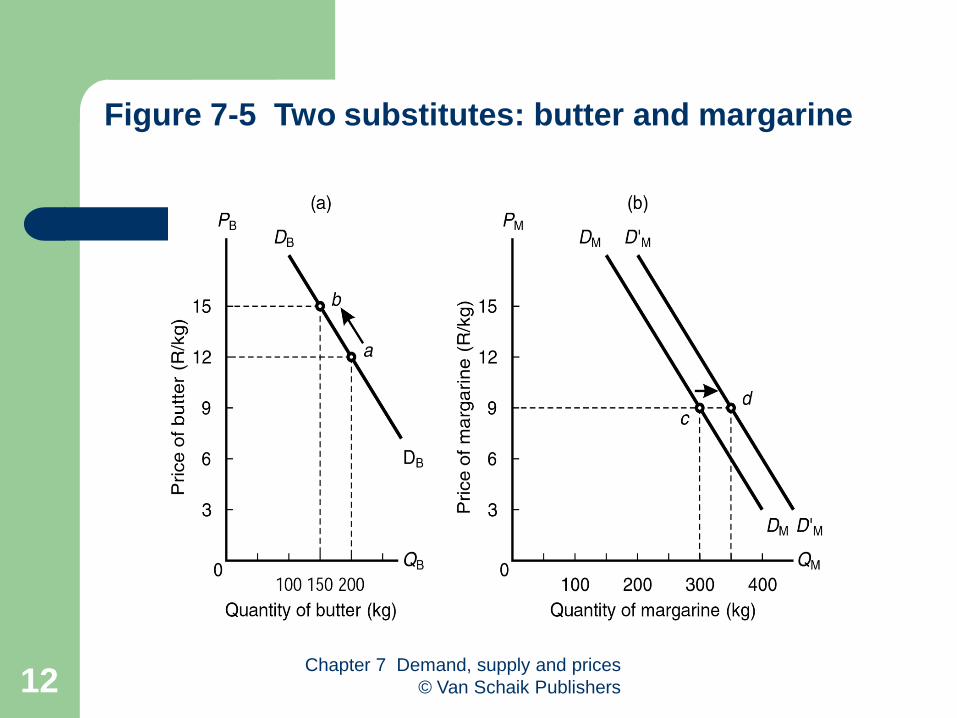
12Chapter 7 Demand, supply and prices
© Van Schaik Publishers 12
Figure 7-5 Two substitutes: butter and margarine
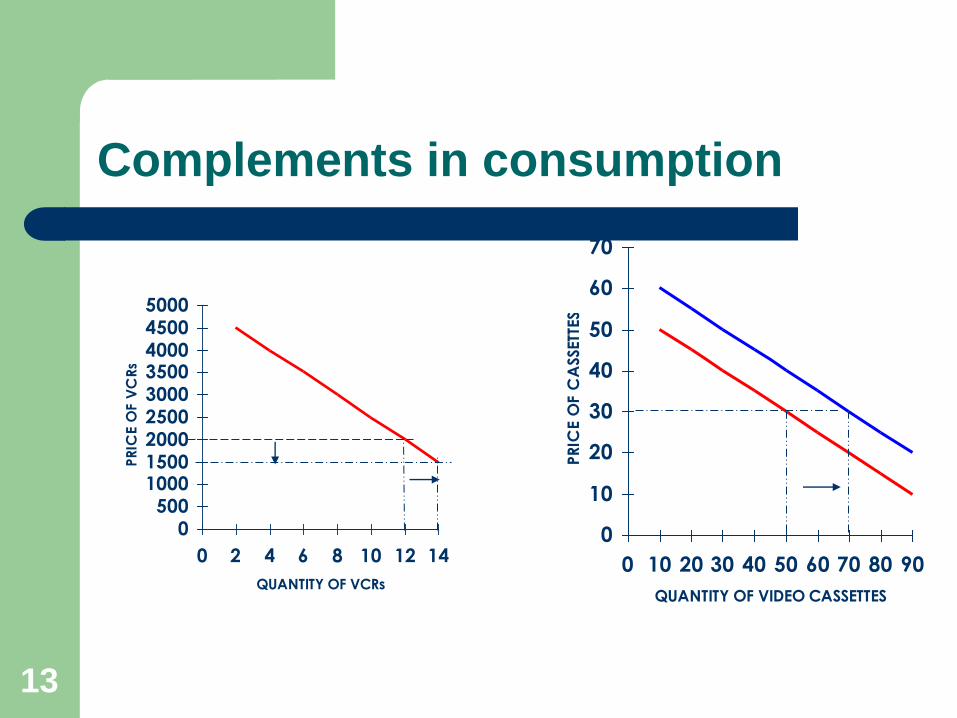
13
Complements in consumption
0500
100015002000250030003500400045005000
0 2 4 6 8 10 12 14
QUANTITY OF VCRs
PR
ICE O
F V
CR
s
0
10
20
30
40
50
60
70
0 10 20 30 40 50 60 70 80 90
QUANTITY OF VIDEO CASSETTES
PR
ICE O
F C
ASSETT
ES
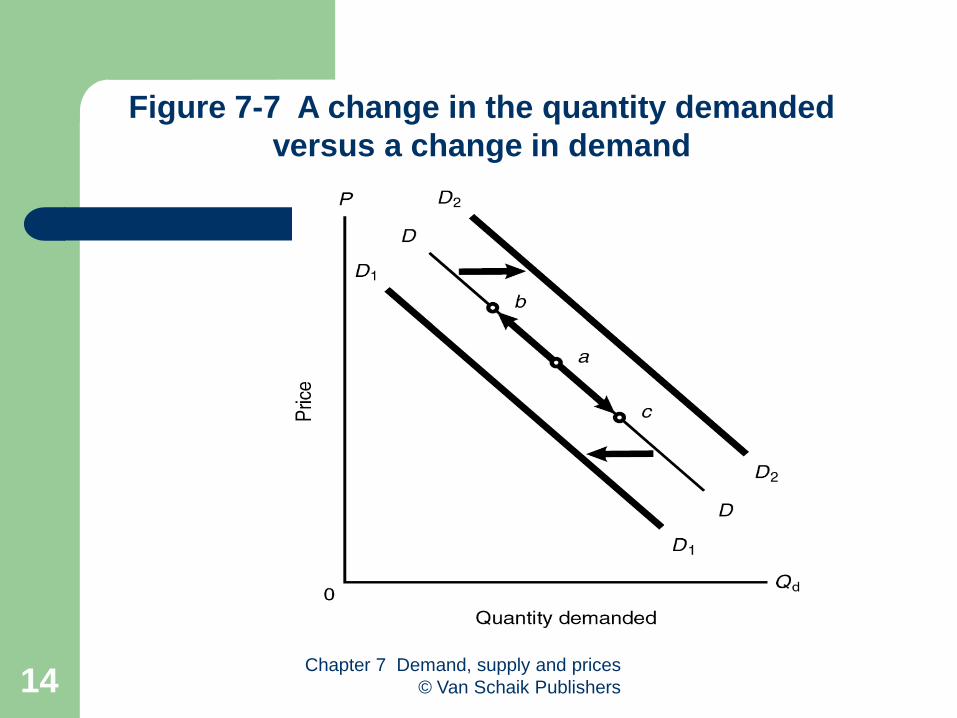
14Chapter 7 Demand, supply and prices
© Van Schaik Publishers 14
Figure 7-7 A change in the quantity demanded
versus a change in demand
15
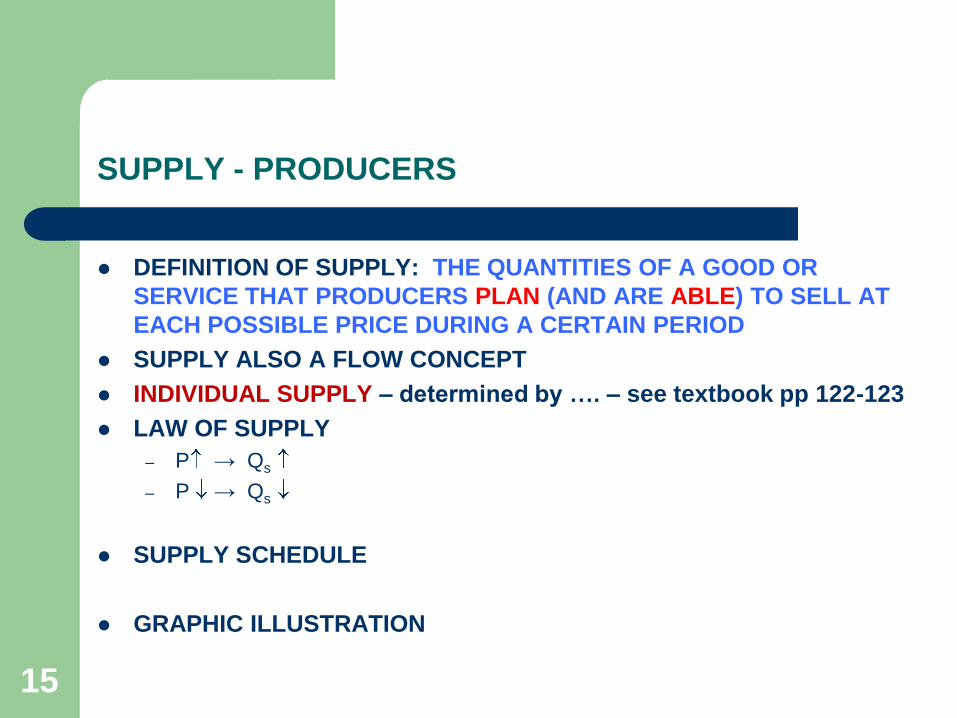
SUPPLY - PRODUCERS
DEFINITION OF SUPPLY: THE QUANTITIES OF A GOOD OR
SERVICE THAT PRODUCERS PLAN (AND ARE ABLE) TO SELL AT
EACH POSSIBLE PRICE DURING A CERTAIN PERIOD
SUPPLY ALSO A FLOW CONCEPT
INDIVIDUAL SUPPLY – determined by …. – see textbook pp 122-123
LAW OF SUPPLY
– P → Qs
– P → Qs
SUPPLY SCHEDULE
GRAPHIC ILLUSTRATION
16Chapter 7 Demand, supply and prices
© Van Schaik Publishers 16
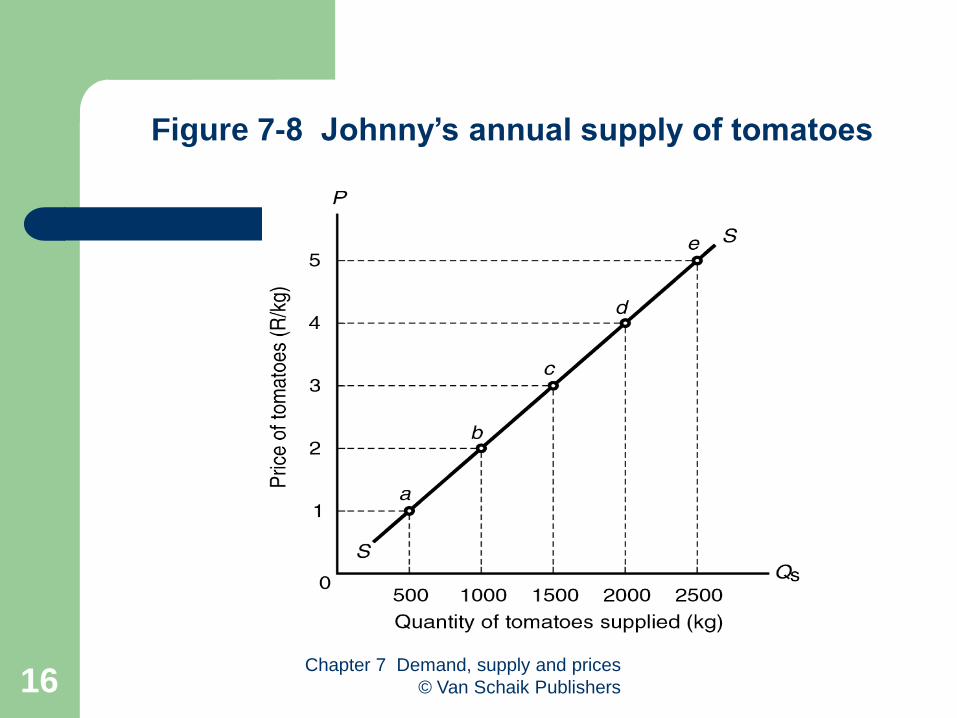
Figure 7-8 Johnny’s annual supply of tomatoes
17
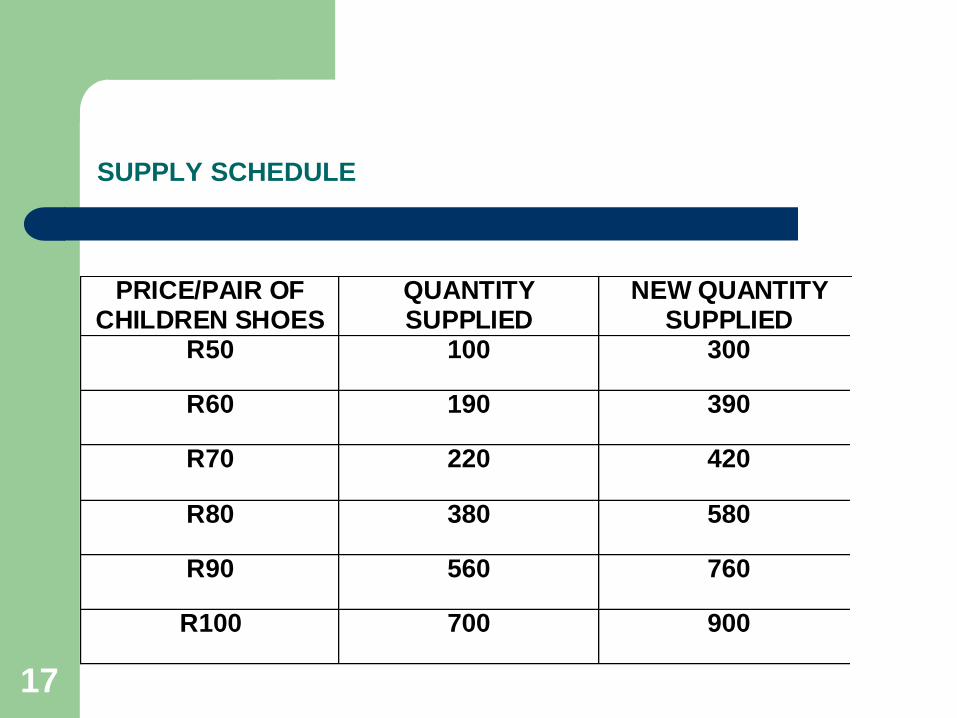
SUPPLY SCHEDULE
PRICE/PAIR OF CHILDREN SHOES
QUANTITY SUPPLIED
NEW QUANTITY SUPPLIED
R50 100 300
R60 190 390
R70 220 420
R80 380 580
R90 560 760
R100 700 900
18
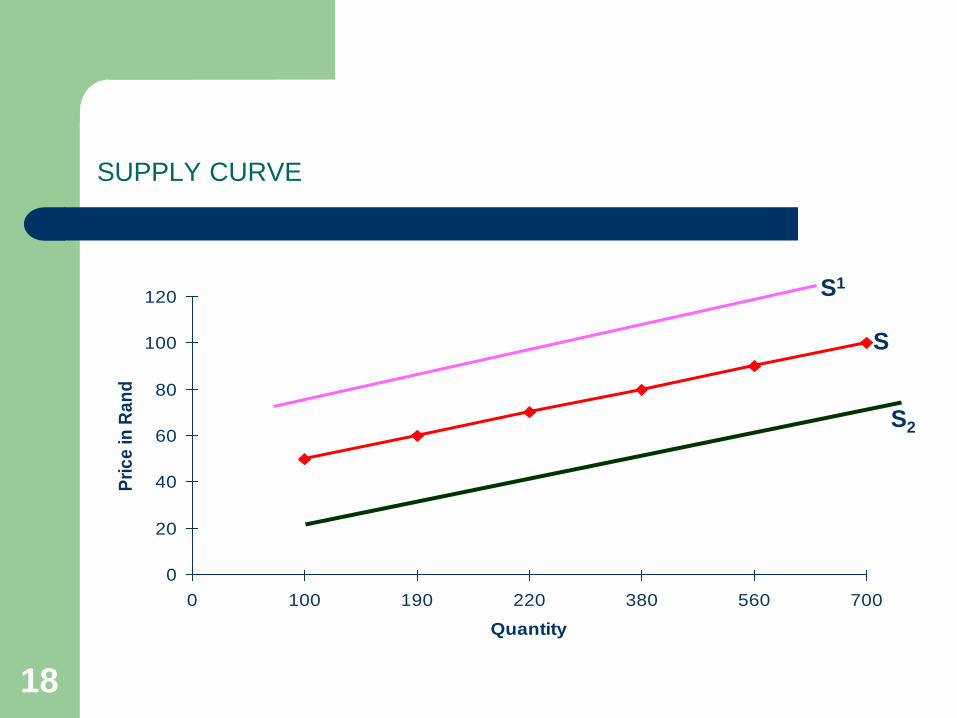
SUPPLY CURVE
0
20
40
60
80
100
120
0 100 190 220 380 560 700
Quantity
Pri
ce
in
Ra
nd
S1
S2
S
19
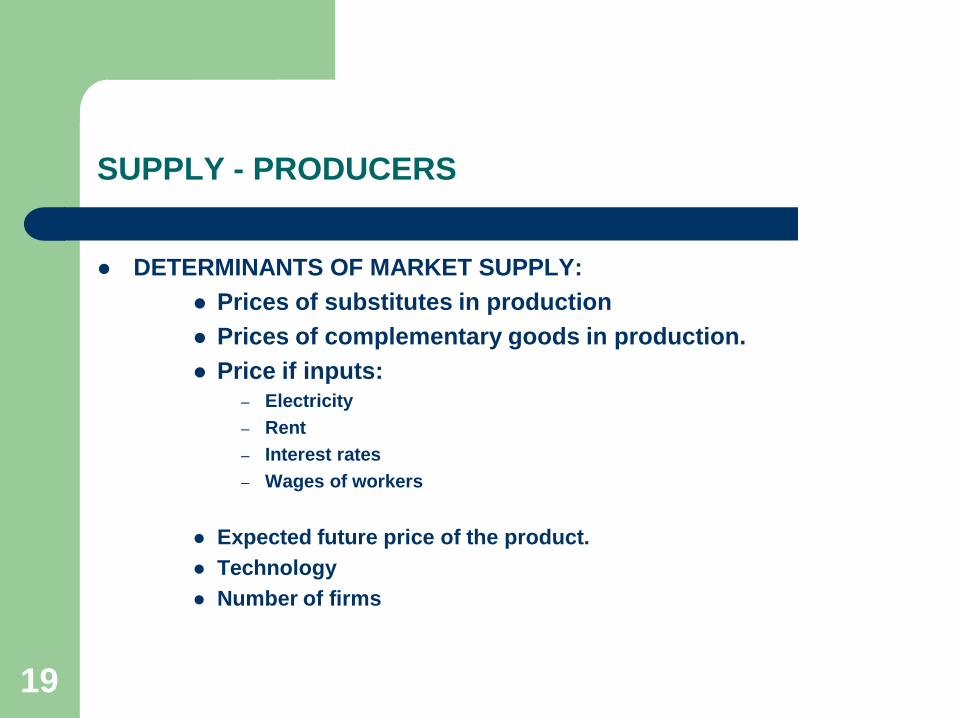
SUPPLY - PRODUCERS
DETERMINANTS OF MARKET SUPPLY:
Prices of substitutes in production
Prices of complementary goods in production.
Price if inputs:
– Electricity
– Rent
– Interest rates
– Wages of workers
Expected future price of the product.
Technology
Number of firms
20
SUPPLY - PRODUCERS
DETERMINANTS OF MARKET SUPPLY:
Government policy (subsidies & taxes)
Climate and natural disasters
Productivity
21Chapter 7 Demand, supply and prices
© Van Schaik Publishers 21
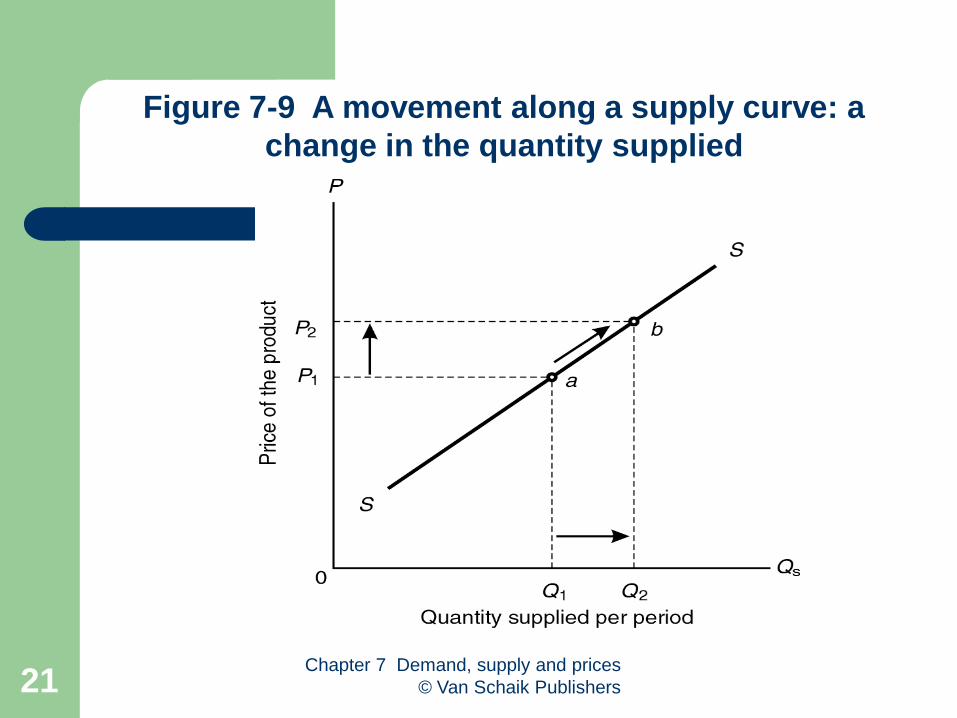
Figure 7-9 A movement along a supply curve: a
change in the quantity supplied
22Chapter 7 Demand, supply and prices
© Van Schaik Publishers 22
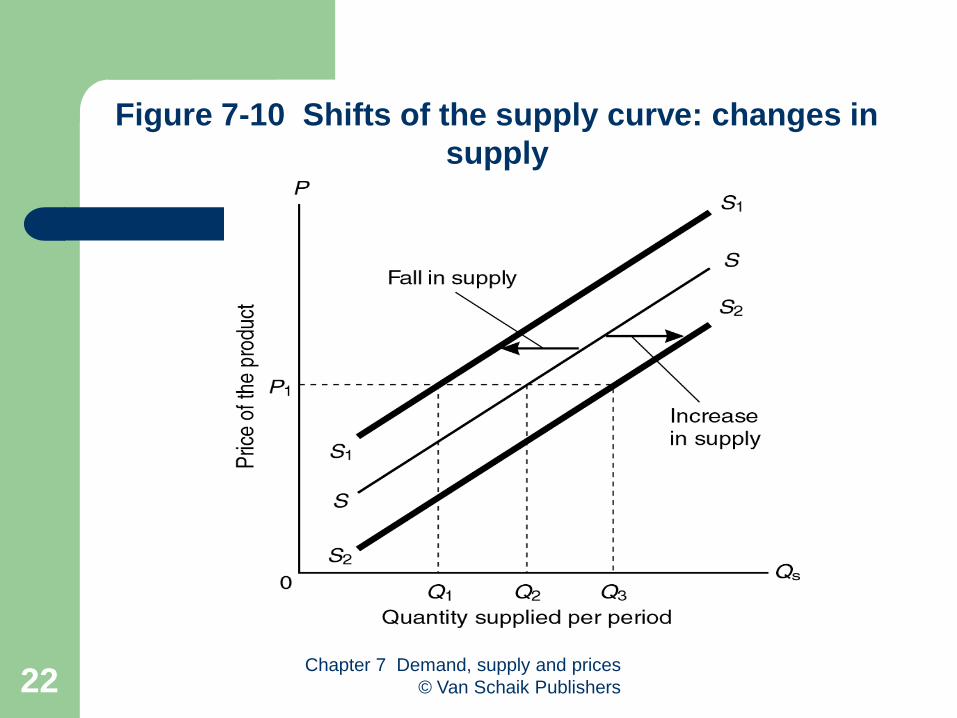
Figure 7-10 Shifts of the supply curve: changes in
supply
THE MARKET SUPPLY CURVE: A SUMMARY
SEE TABLE 7-5
BRIEF DISCUSSION IF TIME ALLOWS
ANY QUESTIONS/DISCUSSION ON DEMAND AND SUPPLY
SO FAR?
AFTER WHICH, WE TURN TO MARKET EQUILIBRIUM
NOTE THE IMPORTANT FUNCTIONS OF PRICES IN A
MARKET ECONOMY – textbook pp 127 - 129
23
24
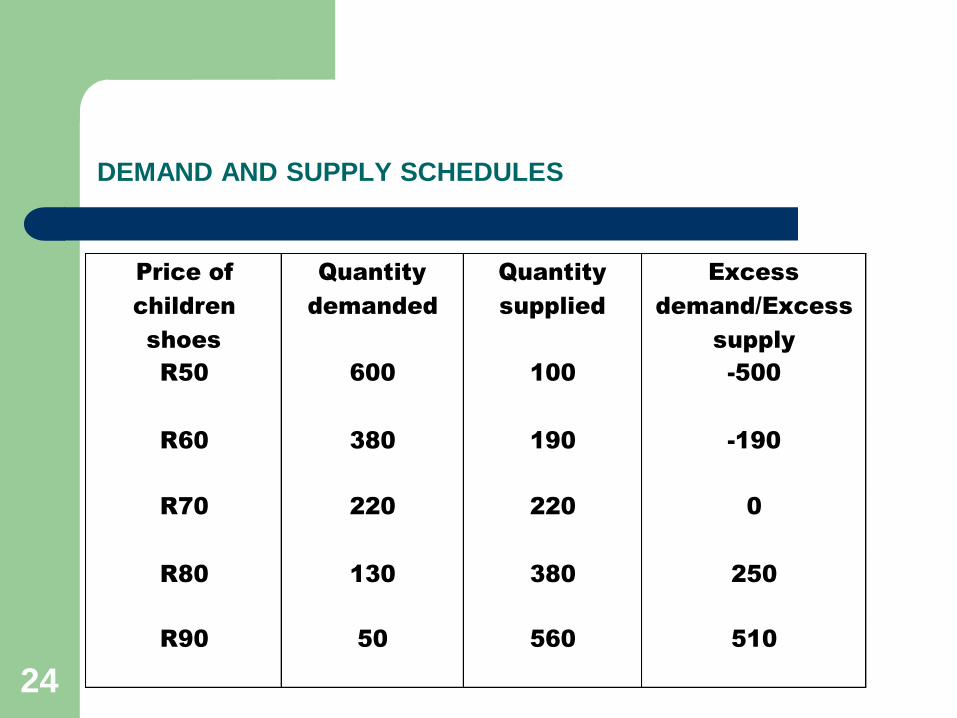
DEMAND AND SUPPLY SCHEDULES
Price of
children
shoes
Quantity
demanded
Quantity
supplied
Excess
demand/Excess
supply
R50
600 100 -500
R60 380 190 -190
R70
220 220 0
R80 130 380 250
R90 50 560 510
25
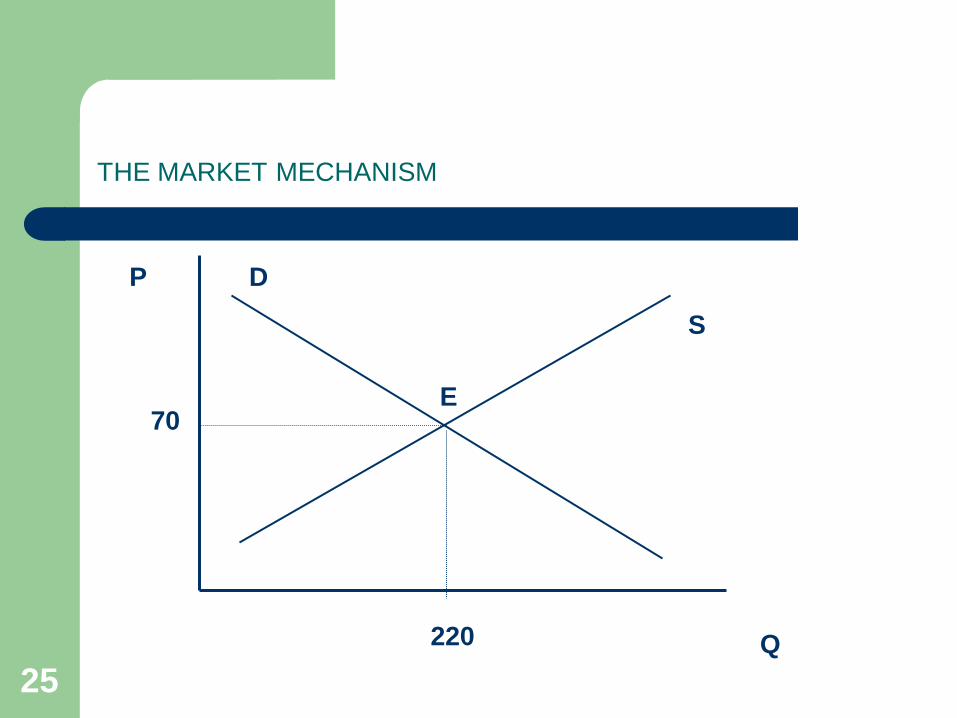
THE MARKET MECHANISM
Q
P
S
D
E
220
70
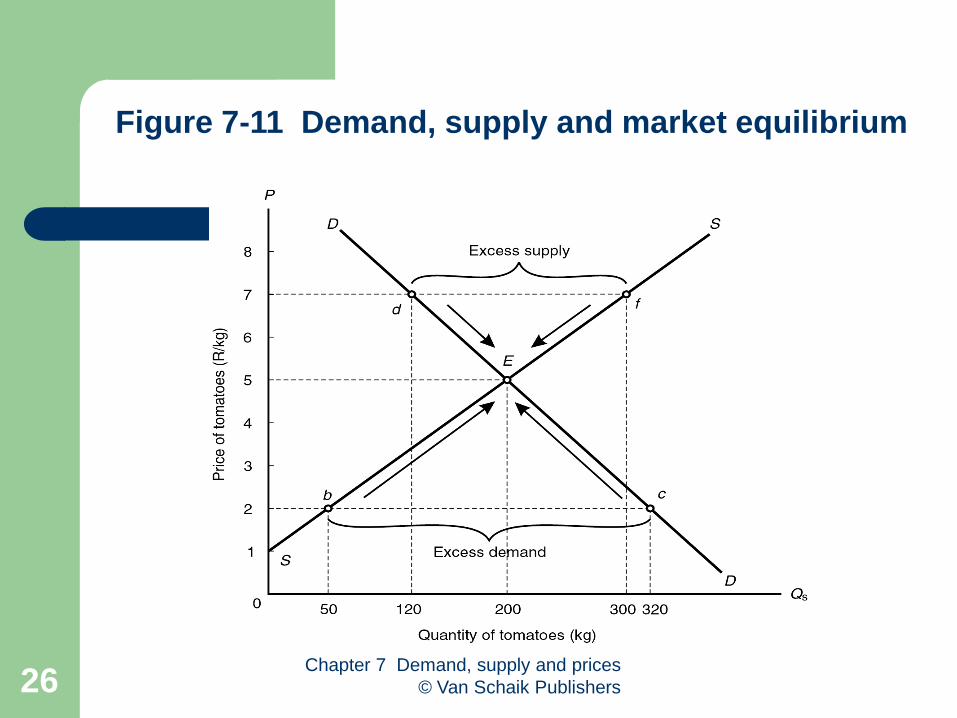
26Chapter 7 Demand, supply and prices
© Van Schaik Publishers 26
Figure 7-11 Demand, supply and market equilibrium
27
ILLUSTRATE THE LAW OF DEMAND GRAPHICALLY
28
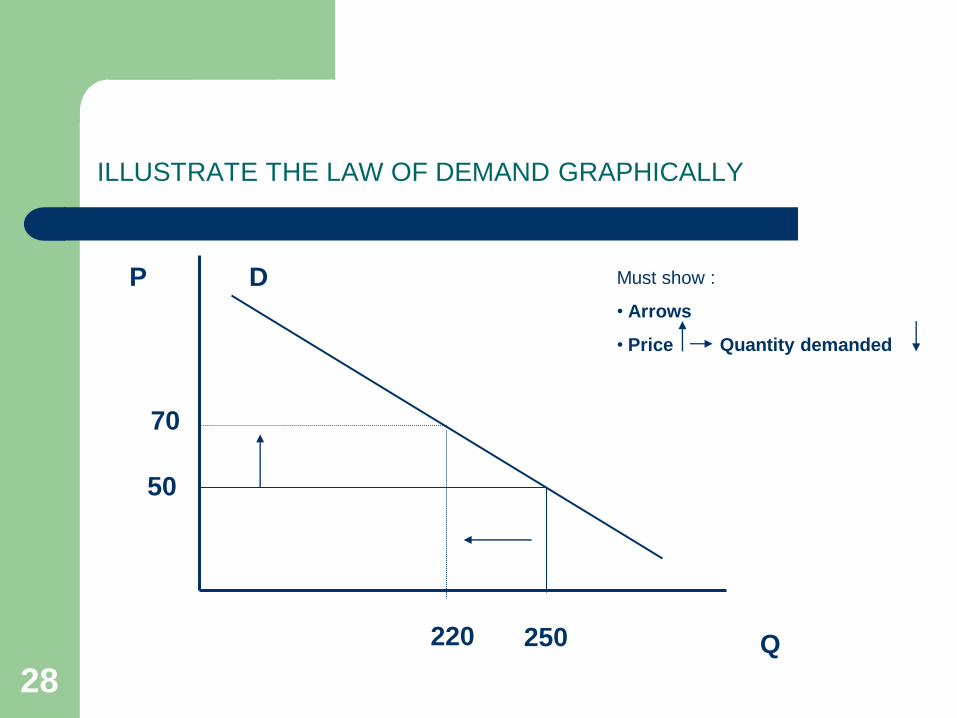
ILLUSTRATE THE LAW OF DEMAND GRAPHICALLY
Q
P D
220
70
250
50
Must show :
• Arrows
• Price Quantity demanded
29
ILLUSTRATE AN INCREASE IN THE PRICE OF BEEF
DEMANDED
30
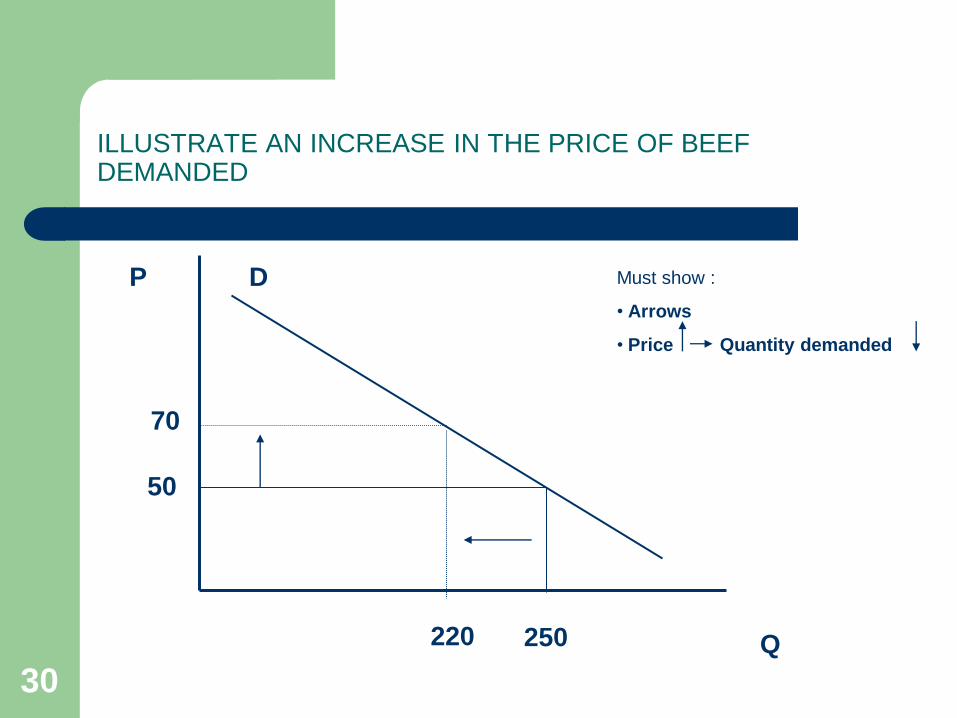
ILLUSTRATE AN INCREASE IN THE PRICE OF BEEF DEMANDED
Q
P D
220
70
250
50
Must show :
• Arrows
• Price Quantity demanded
31
ILLUSTRATE WHAT HAPPENS TO DEMAND OR SUPPLY IF THERE IS
AN INCREASE IN POPULATION
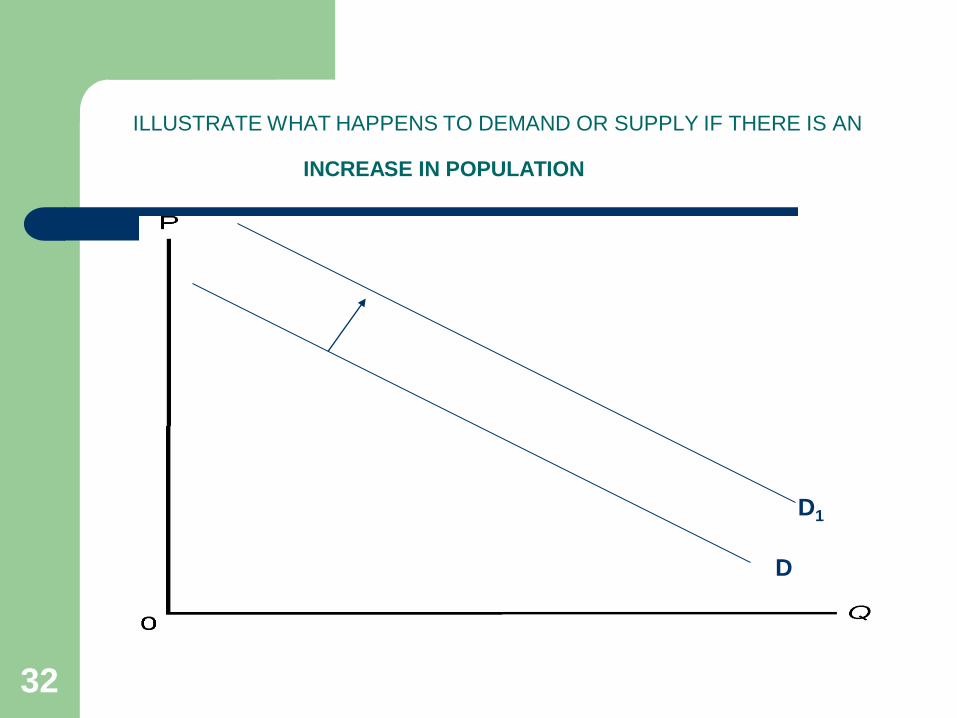
32
ILLUSTRATE WHAT HAPPENS TO DEMAND OR SUPPLY IF THERE IS AN
INCREASE IN POPULATION
D
D1
33
ILLUSTRATE WHAT HAPPENS TO THE SUPPLY CURVE IF THE
PRICE OF THE PRODUCT SUPPLIED INCREASES
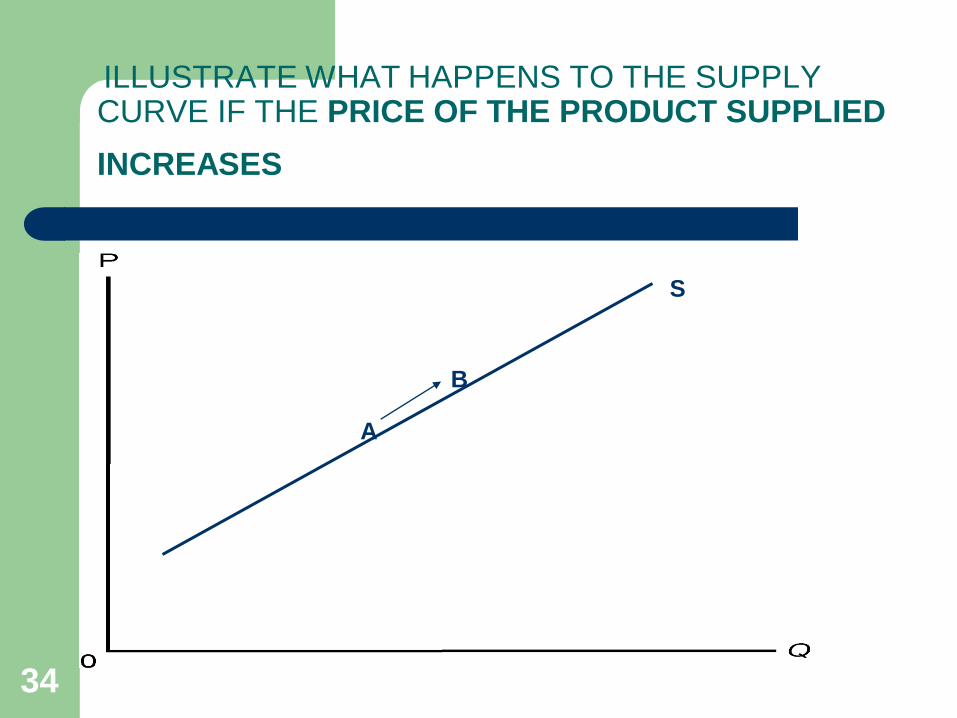
34
ILLUSTRATE WHAT HAPPENS TO THE SUPPLY CURVE IF THE PRICE OF THE PRODUCT SUPPLIED
INCREASES
S
A
B
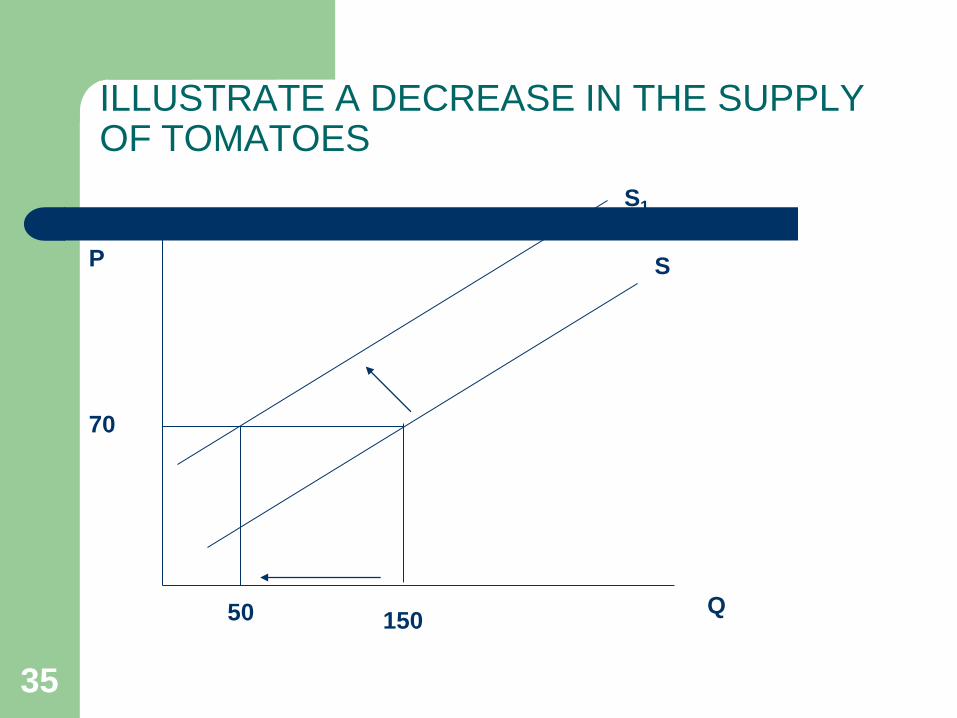
35
ILLUSTRATE A DECREASE IN THE SUPPLY OF TOMATOES
P
Q
S
S1
15050
70
36
ILLUSTRATE WHAT HAPPENS TO THE DEMAND OR SUPPLY CURVES IF THERE IS AN INCREASE IN THE NUMBER OF
FIRMS

37
ILLUSTRATE WHAT HAPPENS TO THE DEMAND OR SUPPLY CURVES IF THERE IS AN INCREASE IN THE NUMBER OF
FIRMS
S
S
S1
38
ILLUSTRATE WHAT HAPPENS TO THE SUPPLY CURVE FOR CAULIFLOWER IF THERE IS AN INCREASE IN THE PRICE OF
TOMATOES A SUBSTITUTE IN PRODUCTION
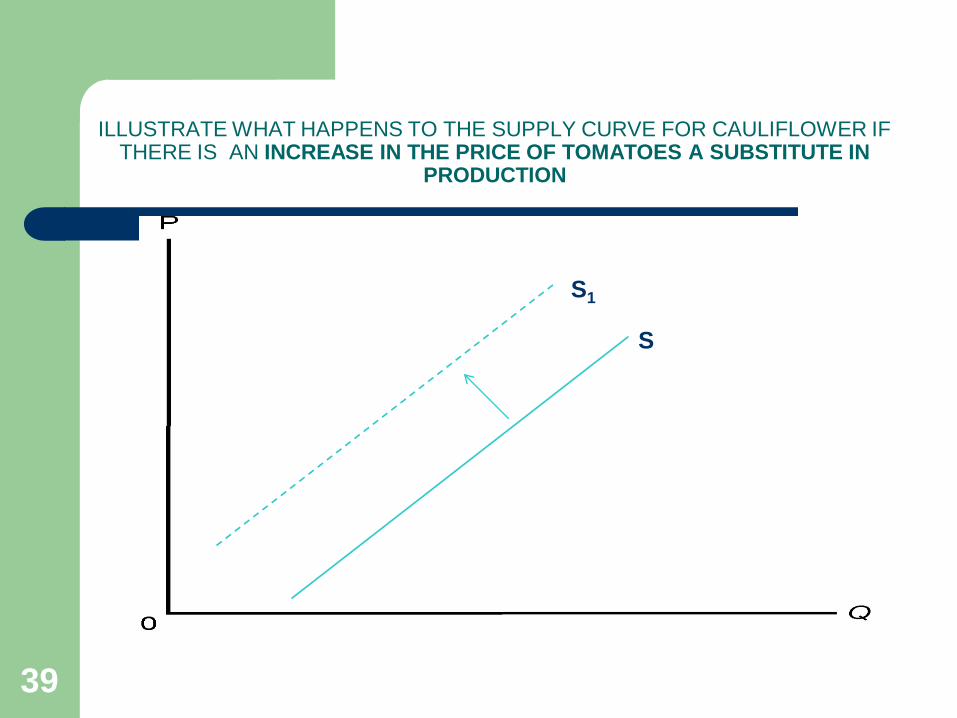
39
ILLUSTRATE WHAT HAPPENS TO THE SUPPLY CURVE FOR CAULIFLOWER IF THERE IS AN INCREASE IN THE PRICE OF TOMATOES A SUBSTITUTE IN
PRODUCTION
S1
S
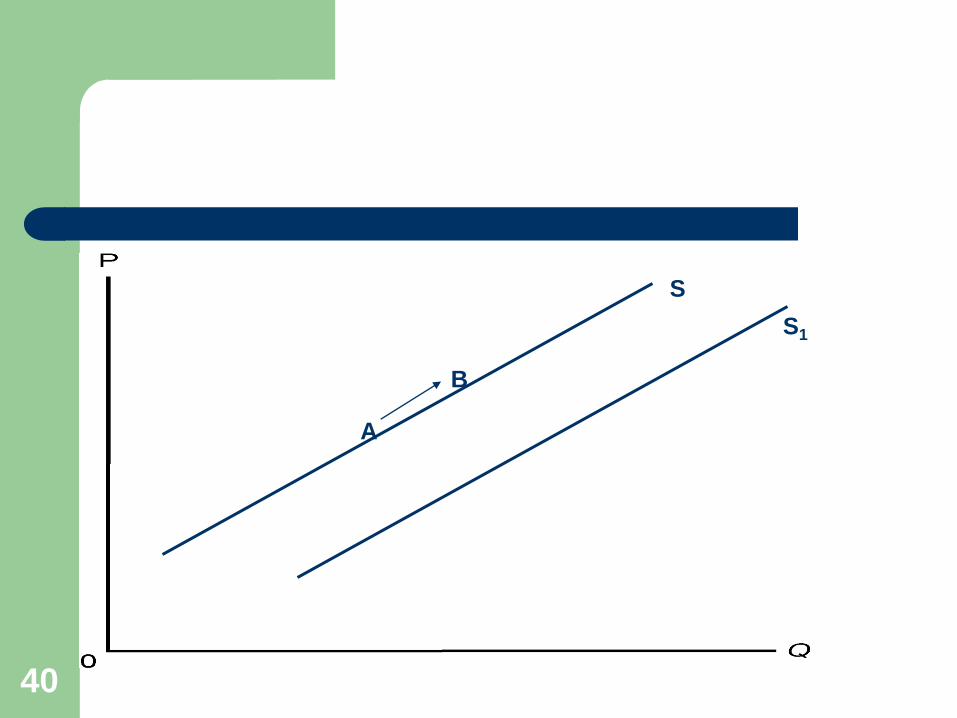
40
S
A
B
S1
41
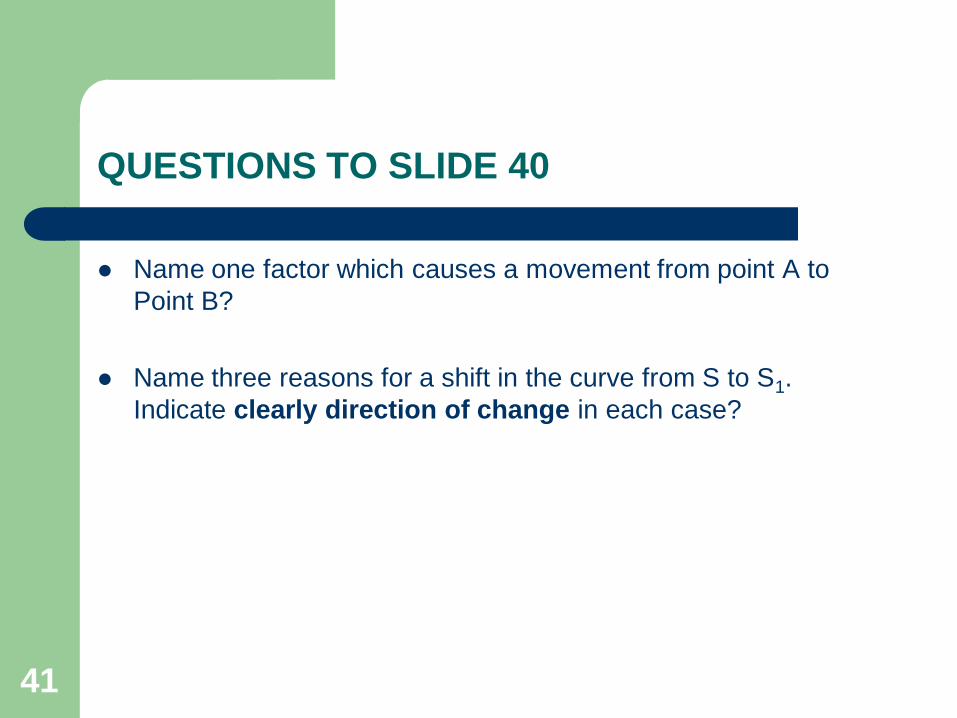
QUESTIONS TO SLIDE 40
Name one factor which causes a movement from point A to
Point B?
Name three reasons for a shift in the curve from S to S1.
Indicate clearly direction of change in each case?
42
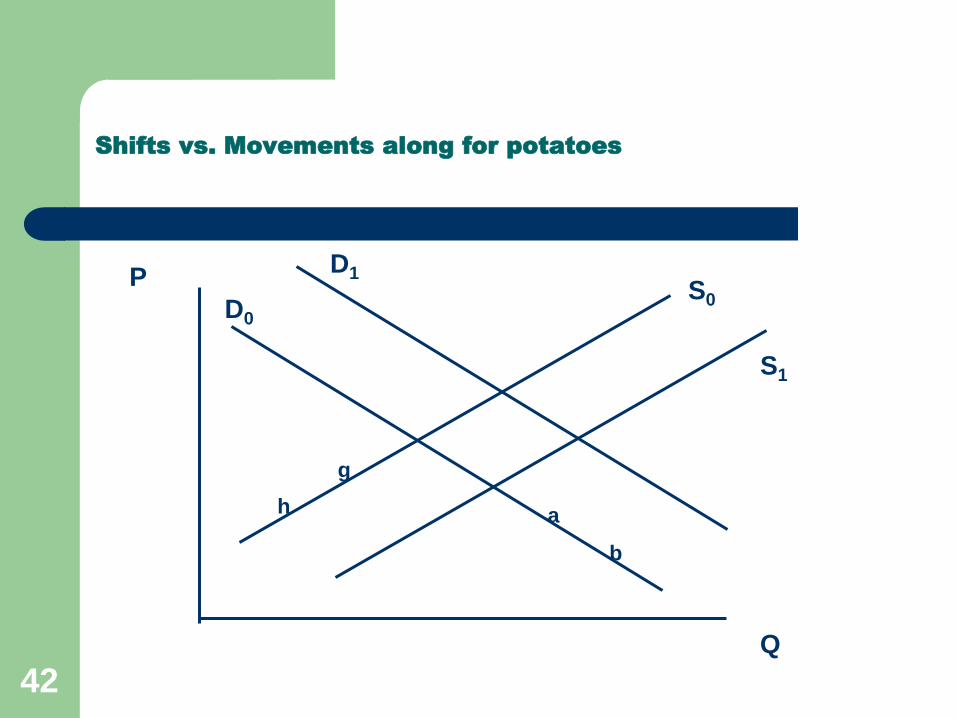
Shifts vs. Movements along for potatoes
Q
PS0D0
a
g
S1
D1
h
b
43
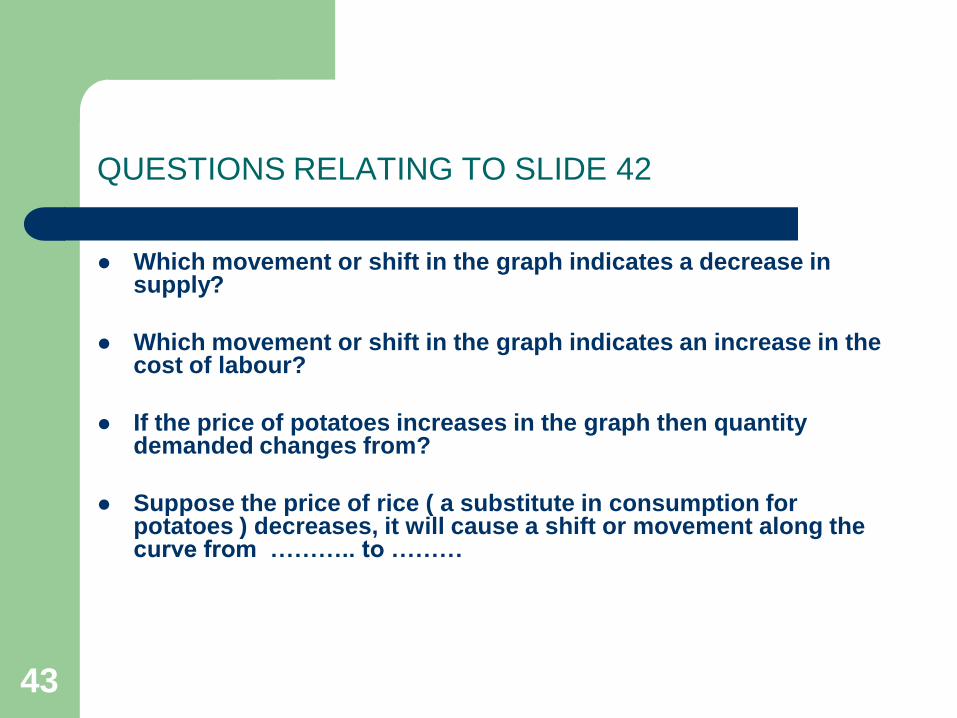
QUESTIONS RELATING TO SLIDE 42
Which movement or shift in the graph indicates a decrease in supply?
Which movement or shift in the graph indicates an increase in the cost of labour?
If the price of potatoes increases in the graph then quantity demanded changes from?
Suppose the price of rice ( a substitute in consumption for potatoes ) decreases, it will cause a shift or movement along the curve from ……….. to ………
44
QUESTIONS RELATING TO SLIDE 42
If consumers expect the price of potatoes to decreases, it will
cause a shift or movement along the curve from ……….. to
………
The impact of a decrease in the price of potatoes on the quantity
supplied is indicated by a shift or movement along the curve from
……….. to ………
Suppose the number of potato producers increase, it is indicated
by a shift or movement along the curve from ……….. to ………
45
QUESTIONS RELATING TO SLIDE 42
If a cost-saving technological improvement in the production of potatoes is discovered, it is indicated by a shift or movement along the curve from ……….. to ………
If government increases it’s subsidy to potato farmers, it is indicated by a shift or movement along the curve from ……….. to ………
Suppose the population which consumes potatoes increases, it is reflected by a shift or movement along the curve from ……….. to ………
46
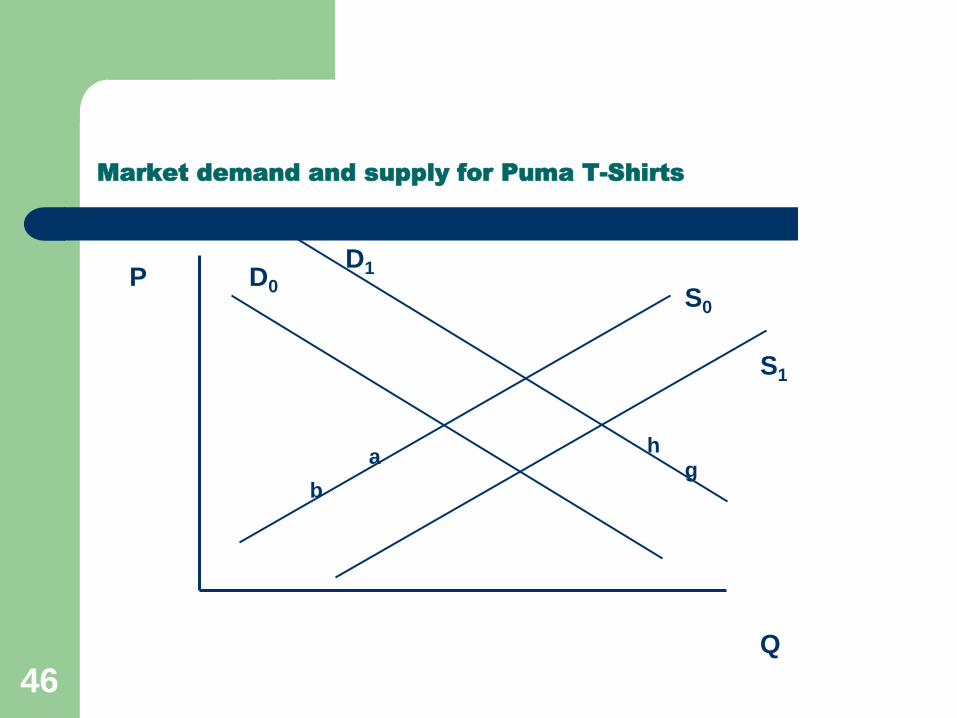
Market demand and supply for Puma T-Shirts
Q
PS0
D0
ag
S1
D1
h
b
47
QUESTIONS RELATING TO SLIDE 46
If the price of Nike T-shirts (a substitute in consumption) increases, how will
curves change?
Which shift or movement represents a cost-saving technological change in the production of Puma T-shirts?
If the price of Puma Track suites (a complement in consumption) increases, indicate the movement on the curves of Puma T-shirts.
Which shift or movement represents an increase in the labour cost of factory workers in the Puma T-shirt factory?
An increase in the price of Puma T-shirts on quantity supplied is reflected by which change in the curves?
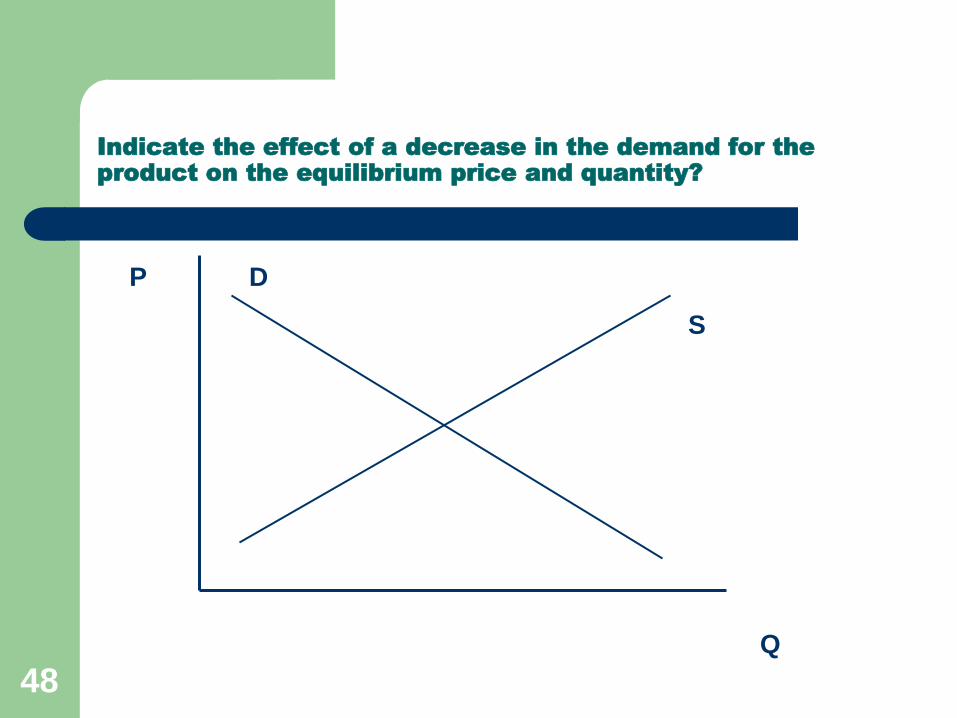
48
Indicate the effect of a decrease in the demand for the
product on the equilibrium price and quantity?
Q
P
S
D
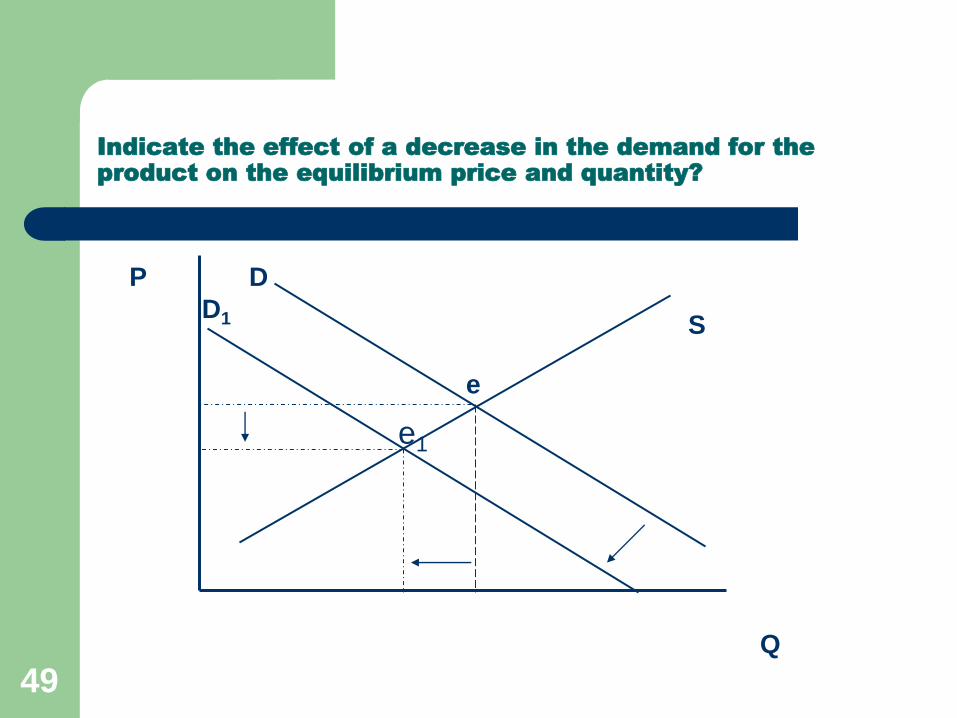
49
Indicate the effect of a decrease in the demand for the
product on the equilibrium price and quantity?
Q
P
S
D
D1
e
e1

50
Make use of the set of axes in the diagram below to illustrate what will happen to the demand and/or supply curve of a consumable good if a cost-improving
change in technology occurs, ceteris paribus.
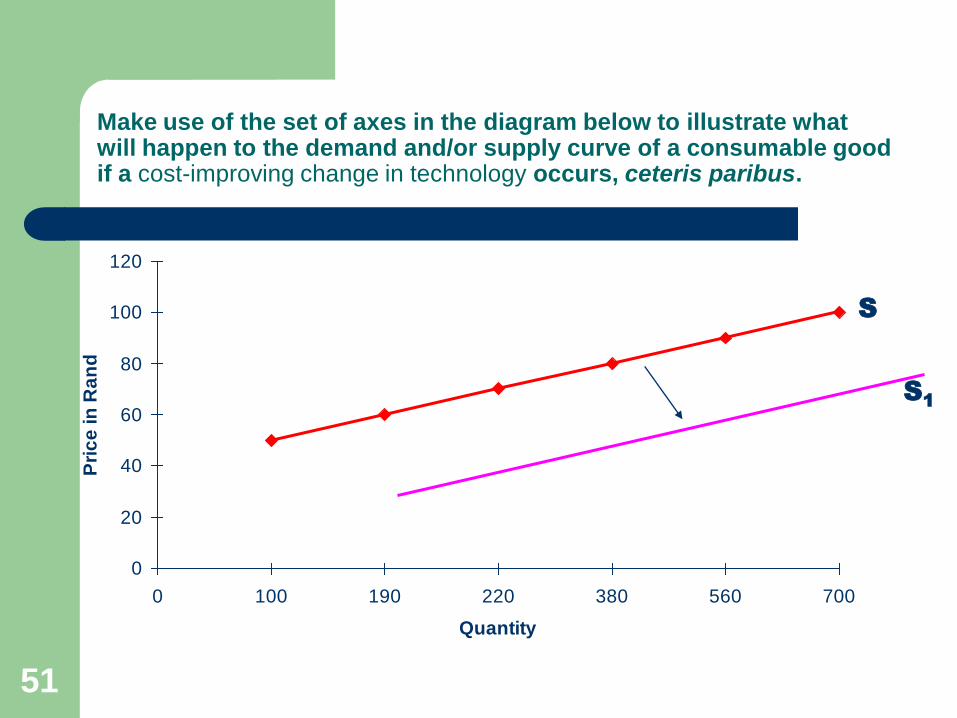
51
Make use of the set of axes in the diagram below to illustrate what will happen to the demand and/or supply curve of a consumable good if a cost-improving change in technology occurs, ceteris paribus.
0
20
40
60
80
100
120
0 100 190 220 380 560 700
Quantity
Pri
ce
in
Ra
nd
S
S1
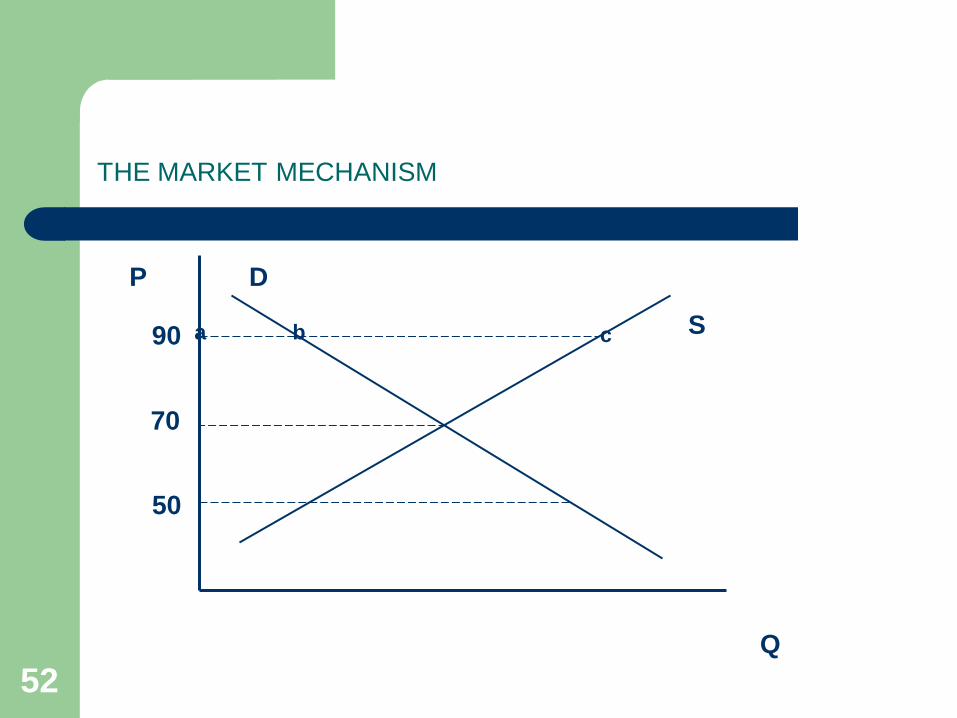
52
THE MARKET MECHANISM
Q
P
S
D
70
50
90 cba
53
QUESTIONS – BASED ON SLIDE 52
At which price level will the market experience excess supply?
What happens at a price level of R50?
Indicate the extend of excess demand on the graph?
Suppose we experience excess supply in the market, what must
happen to restore equilibrium?
What is the extent of excess supply in the market?

54
Illustrate market equilibrium and indicate the equilibrium price
and quantity.
55
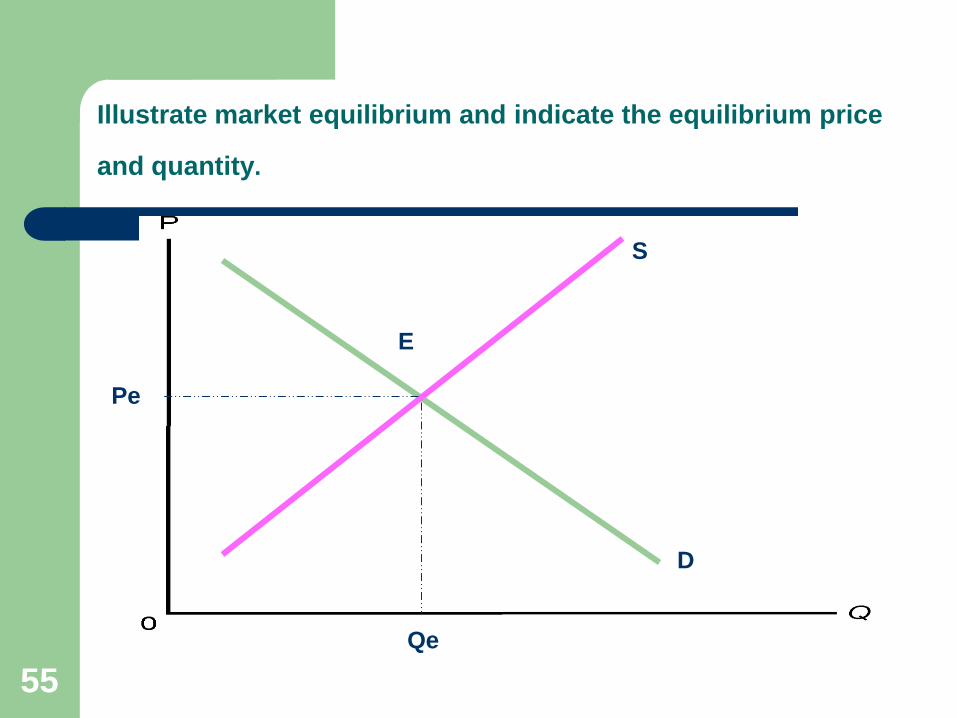
Illustrate market equilibrium and indicate the equilibrium price
and quantity.
E
D
S
Qe
Pe
56
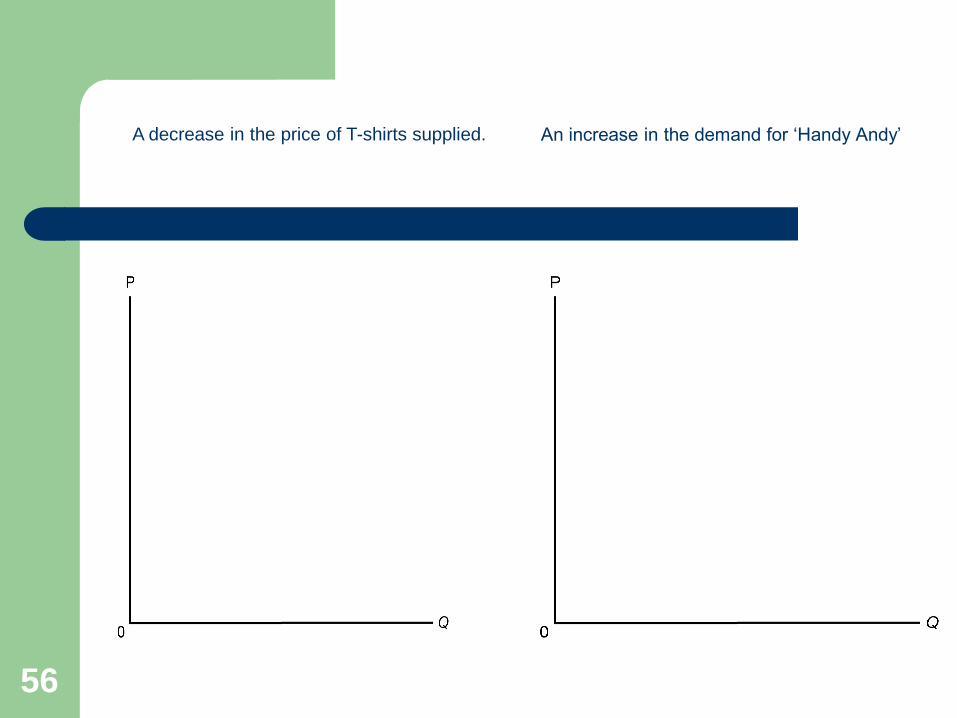
A decrease in the price of T-shirts supplied. An increase in the demand for ‘Handy Andy’
57
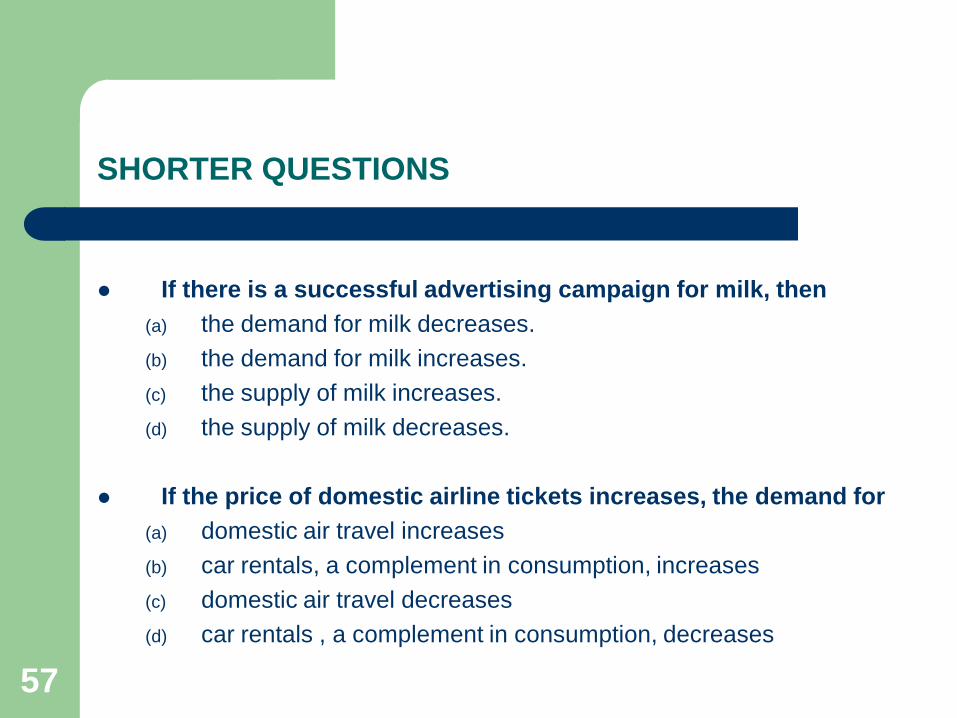
SHORTER QUESTIONS
If there is a successful advertising campaign for milk, then
(a) the demand for milk decreases.
(b) the demand for milk increases.
(c) the supply of milk increases.
(d) the supply of milk decreases.
If the price of domestic airline tickets increases, the demand for
(a) domestic air travel increases
(b) car rentals, a complement in consumption, increases
(c) domestic air travel decreases
(d) car rentals , a complement in consumption, decreases
58
SHORTER QUESTIONS
If there is an increase in the price of broccoli, a substitute in
production for beans, then the
(a) supply curve for broccoli decreases.
(b) supply of beans increases.
(c) demand curve for broccoli increases.
(d) supply curve for beans increases.
If there is a technological breakthrough in the beer manufacturing process, the
(a) supply of beer will decrease.
(b) demand for beer will increase.
(c) supply of beer will increase.
(d) demand for beer decrease.