Embed Size (px)
Citation preview

Demand Forecasting and Gas Flow DataNW GRI Transparency Workshop
Chris Logue – March 2009

2
Contents
Demand Forecasting National Grid Approach
Methodology
Accuracy
Market Significance
Real Time Gas Flow Data
National Grid Approach
Market Significance
3

4
Weather stations11 weather stations feed data to the 13 LDZs
Scotland
Northern
North EastNorthWest
WalesNorth
WalesSouth
WestMidlands
EastMidlands
Eastern
SouthWest
SouthernSouthEast
London
Glasgow
Newcastle
LeedsManchester
Nottingham
Birmingham
Cardiff
Bristol Benson
London
Southampton
5
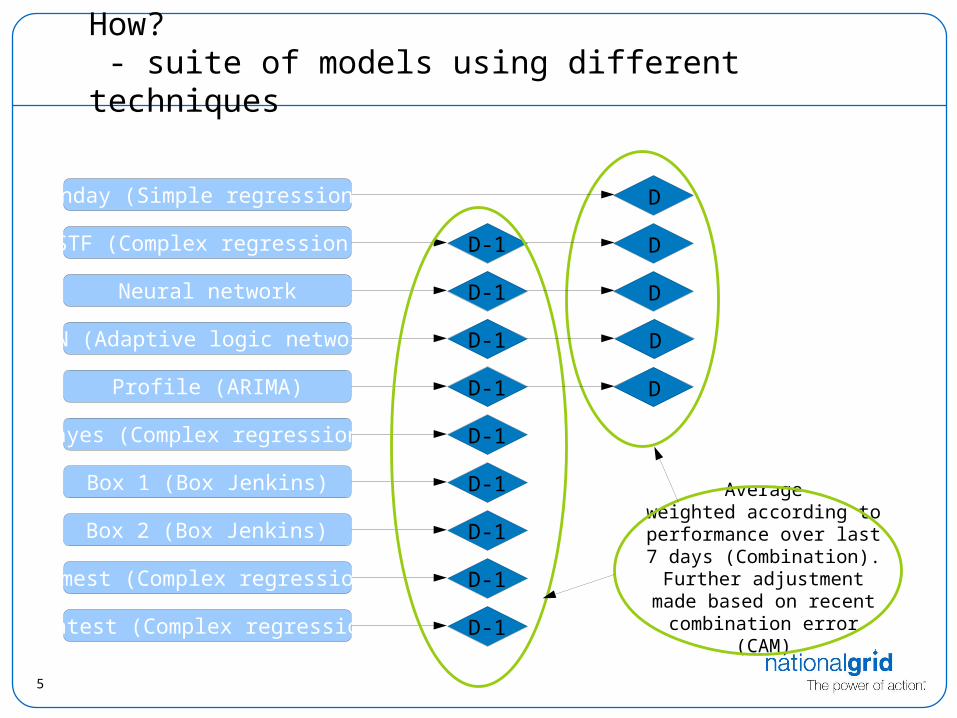
How? - suite of models using different techniques
Profile (ARIMA)
STF (Complex regression)
Neural network
ALN (Adaptive logic network)
Inday (Simple regression)
Bayes (Complex regression)
Box 1 (Box Jenkins)
Box 2 (Box Jenkins)
Sumest (Complex regression)
Wintest (Complex regression)
D-1
D-1
D-1
D-1
D-1
D-1
D-1
D-1
D-1
Averageweighted according to
performance over last 7 days (Combination). Further adjustment made based on
recent combination error (CAM)
D
D
D
D
D

6
Forecasting NTS Direct Connected Loads
Input DataShippers
OPNs/SFNs for NTS direct connected loads, first received at D-1 12:00.
Met OfficeFor D & D-1, forecast temperatures and wind speedFor D-2 to D-7, forecast max and min temperatures
Forecast is produced for each individual siteModels Used
Pass through OPNs where availableProfile model, forecast end of day volume which is then profiled to
hourly offtake regression model, forecast individual hourly offtakeModels are trained every week

7
Demand Forecast Performance
NTS Demand Forecast Performance
0.00%
1.00%
2.00%
3.00%
4.00%
5.00%
6.00%
7.00%
D-7
D-6
D-5
D-4
D-3
D-2
D-1
13:
00hr
s
D-1
16:
00hr
s
D-1
00:
00hr
s
D 1
0:00
hrs
D 1
3:00
hrs
D 1
6:00
hrs
D 2
1:00
hrs
D 0
0:00
hrs
8
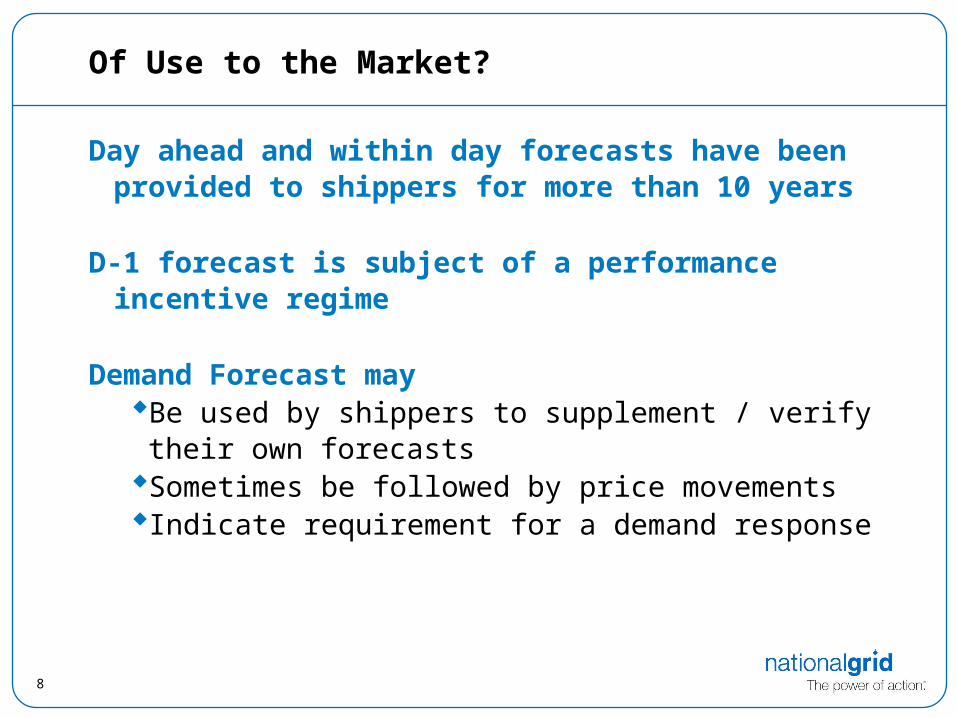
Of Use to the Market?
Day ahead and within day forecasts have been provided to shippers for more than 10 years
D-1 forecast is subject of a performance incentive regime
Demand Forecast mayBe used by shippers to supplement / verify their
own forecastsSometimes be followed by price movementsIndicate requirement for a demand response

9
Conclusions
Demand Forecasting is inherently uncertain due to
uncertainties in weather and prices
Forecasting accuracy improves from 7 days ahead to within
day as more accurate information becomes available
National Grid demand forecast, although robust at present,
faces significant challenges, e.g. increase in wind generation
leading to greater uncertainty from CCGT demand

10
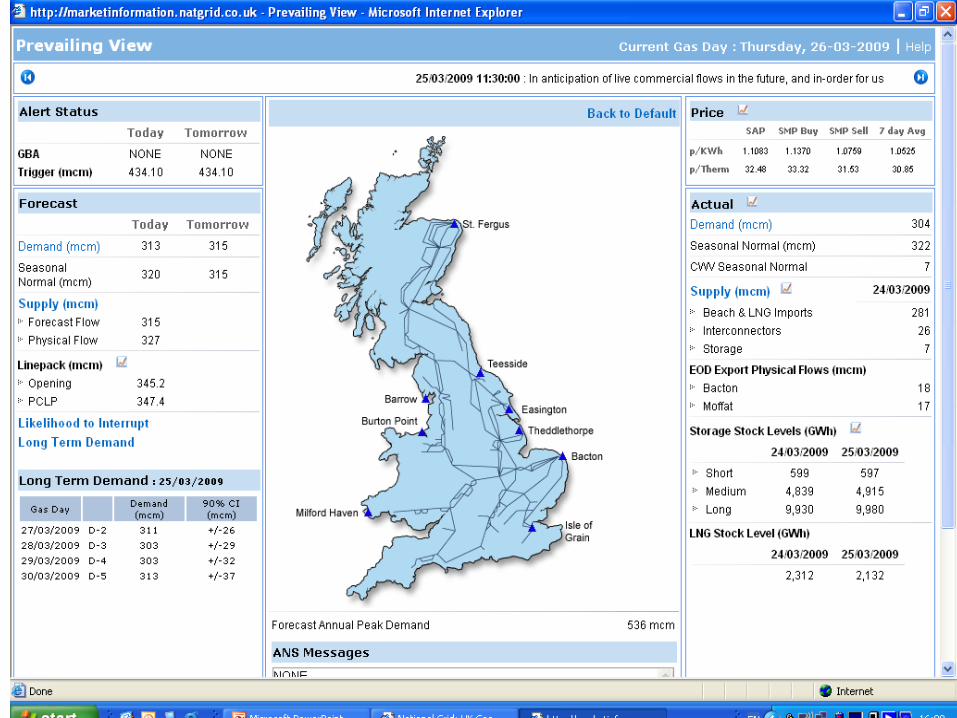
Real Time Flow Data
• National Grid began publishing flow data in 2006 following a lengthy consultation process
• Strong support from downstream players• Reservations from upstream players• Flow rate at every major entry point at 2 minute resolution •Updated every 12 minutes• Available as automated download

11

12
13
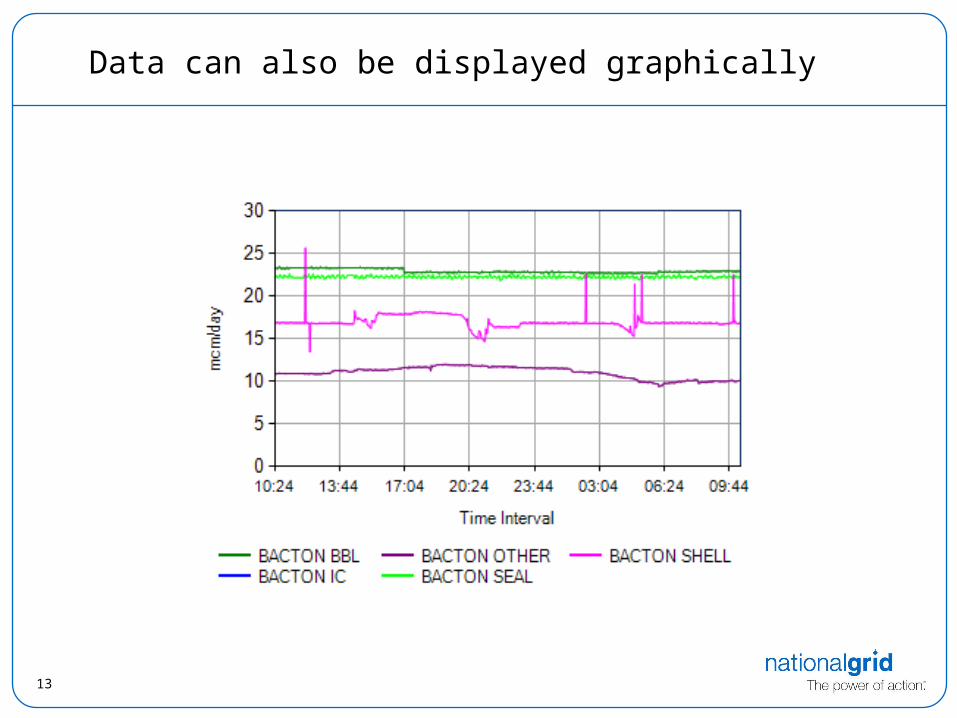
Data can also be displayed graphically
14
Of Use to the Market?
Gas flow data has;
• Biggest hit rate of any National Grid web page
• Been widely reported on and used by the press
• Become accepted and controversy now largely diminished