Embed Size (px)
Citation preview
Demand and Supply Analysis of Farm, Farmer and Farm Family Data
Kenneth Poon
(University of Guelph; [email protected] )
Alfons Weersink
(University of Guelph; [email protected])
and
Brady Deaton
(University of Guelph; [email protected])
Cahier de recherche/Working paper #2011‐8
0
Acknowledgment: The authors wish to acknowledge the helpful comments provided by Ray Bollman, Alessandro Alessia, Lina DiPietro, Linda Kemp, Martin Cloutier, Martin Beaulieu, Bishnu Saha, and Dave Hope. Financial support was provided by the Ontario Ministry of Agriculture, Food and Rural Affairs (OMAFRA) and the Structure and Performance of Agriculture and Agri-products Indusry (SPAA) research network which is one of the five networks funded by Agriculture and Agrifood Canada’s Enabling Research for a Competitive Agriculture (ERCA) program. Abstract: Canadian governments collect data on the agricultural sector through a variety of surveys, income tax filings, and support program applications. The definition of a census farm provides the benchmark to estimate aggregate commodity supply which is most critical to analyze and forecast commodity prices. Prices are also collected and made available, but there is growing concern about the lack of price data for contracted commodities. The farm and rural population characteristics are also adequately portrayed through the linkage of the Census of Agriculture with the long-form Census of Population (up to 2006) and the voluntary National Household Survey in 2011. Agriculture and Agri-Food Canada’s typology captures different size and motivation for units of production, but broad inferences on the sector based on this characterization must recognize that it is only for unincorporated farms. These farms tend to be smaller and represent a shrinking percentage of the sector. In contrast, incorporated farms are becoming common place and produce the majority of farm cash receipts. The growing complexity within agricultural production units extends to the relationships with these units back to input suppliers and forward to processors. These components of the supply chain are becoming intricately linked over time and these linkages cannot be presently described with the publically available data on the sector. As the heterogeneity in the agricultural sector grows, the data and information demanded for various analytical and administrative purposes grows along with it.
The demands for data to determine the need, design, and evaluation of public policy are simultaneously narrower and greater than the broad requirements by private and public users for aggregate production numbers. Farm support programs are meant as a safety net for viable farms in times of unexpected need so the first step involves assessing financial health and identify farms that are “normally competitive” from the ones that are never competitive. Information from an income statement and balance sheet are required along with input and output levels by farm units over time. No single data set supplies all the data necessary to determine need and effect of farm support programs. Performance measures based on tax data are limited to production margin so this data, while detailed in many respects, lacks information on assets/liabilities, inputs /outputs, and demographics. The latter may become important if future support programs are to target “active” farms. The proposal to consider the individuals behind a unit of production in the determination of support eligibility would drive a large gap between data demands and the current supply of publically provided data. The potential change reflects the growing heterogeneity of the agricultural sector. The initial focus on the unit of production was appropriate for all users of the data. The unit of production was the farm and it was generally operated by a single farmer and it supported a single farm family. This no longer generally applies. This growing heterogeneity forces the objectives of agricultural policy to be clearly specified, i.e. efficiency vs. equity, but the political rhetoric has yet to catch up with the changes as the terms farm, farmer, and farm family are interchanged as if they were still one. The growing distinction between them may result in changes in the nature of the data collected on the sector.
1
Résumé : Les gouvernements collectent des données sur le secteur agricole par le biais de différentes enquêtes, le programme de données fiscales et des données recueillies dans le cadre de la gestion de divers programmes. La définition d’une exploitation agricole pour les fins du recensement sert d’encrage pour estimer l’offre agrégée des produits primaires qui joue un rôle critique dans l’analyse et la prédiction des prix des produits primaires. Les prix sont recueillis et rendus publiques mais l’absence de données pour des produits vendus à contrat est de plus en plus inquiétante. Le jumelage du recensement de l’agriculture, du recensement détaillé de la population (jusqu’en 2006) et de l’enquête nationale auprès des ménages de 2011 génère de très bonnes données sur les caractéristiques des résidents ruraux habitant ou non sur une ferme. La typologie mise de l’avant par Agriculture et Agroalimentaire Canada a l’avantage de prendre en compte les différences dans la taille des exploitations et dans le mode de vie de l’exploitant, mais toute inférence à partir de ses données ne s’applique qu’aux exploitations non-incorporées. Ces exploitations sont généralement de moindre envergure et leur poids combiné dans l’ensemble du secteur est en déclin. À l’opposé, on observe de plus en plus d’exploitations incorporées et celles-ci s’accaparent la majorité des recettes monétaires. La complexité grandissante des exploitations agricoles s’amplifie lorsqu’on examine les liens qu’elles développent avec les fournisseurs d’intrants et les transformateurs. Les liens entre les exploitations agricoles et leurs partenaires le long des chaînes d’approvisionnement sont de plus en plus forts mais il est malheureusement impossible de les documenter à partir des données disponibles. Le secteur agricole est de plus en plus hétérogène et les besoins en données pour des fins d’analyse et de gestion ne feront qu’augmenter avec le degré d’hétérogénéité. Les demandes de données pour appuyer l’analyse de politiques publiques (évaluation, élaboration de programmes, validation des besoins) sont à la fois plus pointues et plus ambitieuses que les demandes des utilisateurs privés et gouvernementaux en quête de statistiques agrégées sur la production. Comme les programmes de soutien ont pour but d’aider les exploitations viables confrontées à des difficultés inhabituelles, il est essentiel d’avoir des données pour évaluer la performance financière des exploitations et d’identifier celles qui sont compétitives dans un environnement « normal » et celles qui ne le sont jamais. Pour cela, il est nécessaire d’avoir des bilans, des états financiers et des données sur la production et les intrants utilisés par exploitation et ce pour plusieurs exploitations et plusieurs années. Une banque de données contenant toutes les informations nécessaires pour l’évaluation des besoins et des effets des programmes de soutien n’existe pas. Les mesures de performance obtenues à partir des données fiscales se limitent aux marges; on ne peut rien tirer quant aux actifs, le passif, les intrants, les extrants et les caractéristiques socio-démographiques. Ces informations deviendraient particulièrement utiles si les programmes de soutien devaient éventuellement viser des profils spécifiques d’exploitations. L’utilisation potentielle de caractéristiques de l’exploitant pour déterminer l’éligibilité à divers programmes créerait un énorme fossé entre les besoins en données et l’offre actuelle de données publiques. L’établissement de nouveaux critères basés sur l’exploitant reflète la diversité croissante du secteur. Les critères basés sur l’exploitation étaient justifiés pour tous les utilisateurs de données quand l’unité de production était une exploitation supportant un seul exploitant et sa famille. Cette description ne tient plus. L’hétérogénéité requiert que les objectifs de la politique agricole soient clarifiés (ex., efficience vs équité), mais la rhétorique politique doit s’ajuster car on parle encore de la ferme, du fermier et de la famille résidant sur la ferme comme si ces termes étaient encore interchangeables. Les distinctions entre ces termes deviendront plus prononcées et changeront vraisemblablement la nature des données sur l’agriculture.
2
1. Introduction
Data on the agricultural sector collected by government is used to enhance market
efficiency and to determine the role for public policy to either correct market failures or
redistribute wealth for equity reasons. While the provision of data on agricultural production
and prices is justified on the basis of improving market efficiency, its ability to do so can be
judged by considering the data itself within the context of a market. Both private and public
decision makers value information on farms, farmers and farm families but this demand may
not match the supply provided by public agencies. The existence of a gap in the demand and
supply for data on the agricultural sector indicates a disequilibrium that requires either an
adjustment in the nature of the data collected or an understanding of the limitations imposed
with the available data.
The organization of agricultural information systems from the production, processing
and circulation of information is described by Wolf, Just and Zilberman (2001) in their
examination of the roles of public agencies, commercial firms and collective organizations in
the provision of information. Their system distinguishes between data and information and
this separation is also part of our analysis. Data are the unprocessed measures of facts, such
as historical price or production levels, whereas information processes the raw data so
includes forecasts of price and production. Previous studies have tended to focus on the value
of information from alternative sources for private decisions makers and not the value of the
raw data itself. Examples include the value of weather forecasts (Babcock 1990), pest levels
(Swinton and King 1994), market information (Timko and Lyons 1989) and information
services themselves (Gervais, Lambert and Boutin-Dufresne 2001).
The complete network of agricultural economic information and its demand by
decision makers is modelled by Just et al (2002). The information services differ in three
ways: (1) focus on data or information, (2) publicly or privately supplied; and (3) formal or
3
informal information network. Just et al (2002) find publicly generated data is used primarily
by private information suppliers and their analysis of the raw data is subsequently demanded
by agricultural producers and processors. The separation of roles in the information network
in which the “public sector does wholesale and the private does retail” has been verified
empirically by Wolf, Just and Zilberman (2001) and Just, Wolf and Zilberman (2006) along
with Salin et al (1998) who finds the USDA is the biggest source of data for information
providers. A framework for adding value to this agricultural data by enhancing its
accessibility is proposed by Thornsbury, Davis and Minton (2003). While publicly provided
data does provide value to individual decision making and thus market efficiency through
private information services, the data is also used by researchers to aid in public decision
making. This aspect was not considered in the above studies.
The purpose of this paper is to assess the data collected on the Canadian agricultural
sector with focus on the use of publicly supplied data on financial and production measures
for policy assessment. The paper begins by identifying the demands for data from private and
public decision makers and what type of data are most valuable. Section 3 of the paper
reviews the supply of data in response to these demands. It describes the major datasets and
the types of information compiled within each supply source. Definitional differences across
the datasets in major units of observation (farms, farmers and farm families) are also
examined. The gaps between the demand and supply of data on the agricultural sector are
identified in Section 4. The paper concludes with implications on the inferences that can be
made with current datasets.
2. Demand for Data on Agricultural Sector
Statstics Canada produces agricultural statistics primarily to satisfy two sources of demand.
A description of the sector provided by the data helps in the process of price discovery and
4
trade, as well as providing the basis for generating Gross Domestic Product estimates. Users
of the data for this purpose include individuals or firms who buy and sell goods and services
(including information provision) with farm enterprises. The other primary demand for
agricultural data are policy analysts who wish to understand the distributional impact of any
policy or policy proposal on the agri-food sector. The nature of the demand for both user
groups is discussed further below.
2.1 Sector Description
One of the objectives of government is to provide a description of the agri-food sector in
terms of the total production or supply of food and the total return to resources in agriculture.
Two types of agriculture data are produced in Canada and other developed countries to
achieve this objective: (1) estimates of the forthcoming aggregate supply of food and fibre
commodities; and (2) the number and characteristics of the units producing food and fibre
commodities. Note the use of the term “units of production” rather than farms or farmers;
these distinctions will be elaborated on later in the paper.
Estimates of the forthcoming aggregate supply of food and fibre allow efficient price
discovery in competitive markets. This is, arguably, the major value of an agricultural
statistics system. Estimates of forthcoming supply include estimates of acreage for each crop,
fruit and vegetable commodity, estimates of yield of each crop, fruit and vegetable
commodity and the estimates of cattle, pigs and poultry on farms. The general methodology
includes a quinquennial Census of Agriculture to provide a benchmark and to provide a list-
frame for inter-censal surveys. Also, a Census of Agriculture is the only way to find the level
of production of specialty items (coriander, elk, etc.). Along with data on the aggregate
supply of food commodities, the agricultural statistics program generates estimates of the rate
of return to resources involved in food production.
5
A second major component of an agricultural statistics program is the number and
characteristics of the units producing food and fibre commodities. This is the focus of the
present paper. In almost all cases, the units of observation were defined to enable the
collection of data to generate the aggregate estimates note above. The unit of observation is
often referred to as a farm but many of the data collection points are not farms. As discussed
further in the next section, there is a distinction between farms and farmers; one person can
operate multiple farms and one farm can be operated by multiple farmers. The relevance of
the difference, the appropriate definition for a unit of observation, and its characteristics
depend on the user of the data. The value of the data to the user is determined by the
improvement in their decisions from the information provided by the data1.
Examples of information of value to individuals or firms who sell to farmers include
the response to questions such as:
1. For feed companies, a typical data request is: What is the number, size distribution
and age distribution of farmers in my province with pig farms who purchase more
than $1,000 of feed?
2. For agencies lending money to farmers, a typical data request: What is the number,
distribution by farm type, distribution by level of educational attainment of the
operator and distribution by size of interest paid for farms with more than $1,000
of interest paid?
3. For municipal land use planners, a typical request is: What are the acreages in
crops, in pasture and in “other” land in my watershed and what is the distribution
of each land use type according to the share of the land on the census-farm that is
rented?
1Robinson et al (2009) claim the federal government should abandon their attempt to create public websites, and focus almost entirely on providing data in standard formats for use by private websites.
6
The list continues. The point is that private market decisions and municipal planning
decisions are improved by tabulating the number and characteristics of the various units
enumerated in a census or survey. Just et al (2006) and Salin et al (1998) examine the type
and format of publicly gathered data demanded by the private sector for analysis of
agriculture. The rest of this paper focuses on public policy decisions that are improved by
tabulation and analyzing data on the units of observation in an agricultural statistics program.
2.2 Policy Implementation and Evaluation
A key reason for collecting data on the agri-food sector is to determine performance measures
and the form of assistance if the measures do not meet government goals. Since the goals of
Canadian agricultural policy have evolved, so have the corresponding data necessary for the
public sector to determine if government involvement is required and its nature.
In Canada, a major objective of agricultural policies has been to support and stabilize
the income of farm enterprises – with the hope that the income of farmers and farm families
will also be supported. However, as noted further below, it is farm enterprises and not
farmers which apply for program payments and only farm-level information, not farmer-level
information, that is used to determine eligibility and payouts. Thus, the focus of agricultural
policies, intended or not, is on farm enterprises or the unit of production. The rhetoric would
often suggest that the policies are to support farmers but this objective would require
understanding total income of farmers and most farmers now have other sources of income
aside from the farm.
Farm income support programs began in the 1940’s as a way to extend the social
safety net to all Canadians. The incomes of rural households, which were generally farm
households at that time, were lower than their urban counterparts and so income transfers
were implemented along with measures to improve productive efficiency such as extension
7
programs (Gardner 1992). The Agricultural Stabilization Act (ASA) began in the 1960s in
order to mitigate the risk of income variability since insurance markets were not fully
accessible to many farmers (Schmitz, Furtan and Baylis, 2002). The ASA was commodity
specific and with deficiency payments based on the difference of a moving-average price and
the market price. The data required to implement the program was current and previous
market prices, along with individual production levels of the crop supported.
Changes in the conditions of the agricultural sector change the rhetoric and
justification for agricultural policies. Agricultural prices that had been variable during the
1970s became consistently low during the 1980s, which increased the demand for
compensation but strained government resources in doing so. Globalization also put pressure
on altering trade agreements to enhance the flow of goods, including agricultural products.
The growing focus on international trade of agricultural products placed more importance of
competitiveness. The combination of government fiscal constraints, the need to comply with
international trade agreements, and the increased emphasis on competitiveness led to a
significant shift in agricultural policies. Producers became more responsible for risk
management and government aid had to be non-trade-distorting and leave the agricultural
sector able to adjust production based on market signals (Barichello 1995).
Stabilization program were modified from a ‘commodity-specific’ basis to a ‘whole-
farm’ basis. Instead of providing deficiency payments calculated based on price or
production by individual commodities or specific enterprises, new stabilization payments
became decoupled from production and based on whole-farm production margins. The first
of these programs was the Gross Revenue Insurance Program (GRIP) in 1991, followed by
the Net Income Stabilization Act (NISA) program in 1994, then the Canadian Agricultural
Income Stabilization (CAIS) program in 2003, and most recently the AgriStability and
8
AgriInvest programs in 2007. Although government still provides crop insurance and other
price-stabilization programs, payments are calculated ex-post to avoid trade distortions.
Coupled and decoupled stabilization payments require very different types of
information to implement. Data required to calculate coupled payments need long term price
and production data, whereas whole-farm, decoupled programs like CAIS and AgriStability
require annual whole-farm margin calculations. Because these decoupled programs calculate
the margins at the farm-level, commodity specific information outside of total revenue
generated from each enterprise are not required, and do not require cost to be broken down by
commodities. Inventory data must also be collected to adjust revenue and expense data to
accrual accounting, to prevent operators from triggering payments by incurring large expenses
through input purchases.
Data required for evaluation of these policies are largely influenced by the design of
the program and its stated objectives. The direct fiscal costs of a program are calculated by
summing the total dollars paid out potentially disaggregating it further by farm size and type.
The benefits are less tangible to estimate and more data intensive. If the goal is stabilization,
then fluctuations in farm income with and without government payments need to be
calculated and this requires detailed longitudinal data on revenue and expenses. If the goal is
to provide an extended safety net, then the analysis should needs to determine the income of
the families of farm operators, requiring total family income rather than just net farm income,
and comparing it to regional averages though measures like Low Income Measure (LIM) and
Low Income Cut Off (LICO). If the goal is intended to retain productive resources within the
agricultural sector and enhance its international competitiveness, then the unit of observation
is the unit of production and data requirements shift toward the commercial operations and
their relative productive performance.
9
3. Supply of Data on Agricultural Sector
The major sources of financial data on the Canadian farm sector is summarized in Table 1.
Each source of data are designed to meet a number of information demands outlined in the
previous sections. This section summarizes the type of information gathered and on
whom/what from each source as well as any special characteristics of each dataset.
3.1.Census of Agriculture
The census is conducted every five years with information collected on the productive
activities of the unit. It includes input usage, such as the level of farm work (labour hours),
area of workable land (including information on ownership), and soil and crop management
practices. It also gathers data on output levels such as crop area allocation and livestock
numbers. Some financial information on asset values (land, buildings and machinery) and on
income estimates (operating expenses and gross farm receipts) are also provided by the
respondent. In addition, operator characteristics, such as age and non-farm work hours, are
collected.
The purpose of the census is to provide a statistical portrait of Canada's agricultural
sector. This includes benchmarking aggregate estimates of crop acres, number of livestock on
farms and farm expenses by item. The census also provides a list frame for selecting a sample
for inter-censal surveys. One by-product of the census is that if the Census of Agriculture
questionnaire determines whether the farm has a given characteristic (immigrant farmer or
goat dairy herd or roadside stand), then a follow-on survey can find these specialized farms to
generate more information. The census is also important in providing detailed structural data
of the agricultural sector, in terms of demographic information of the operators, information
on geographical characteristics of production, and provides information on niche or specialty
items for which a survey could never obtain enough observations to publish any information.
10
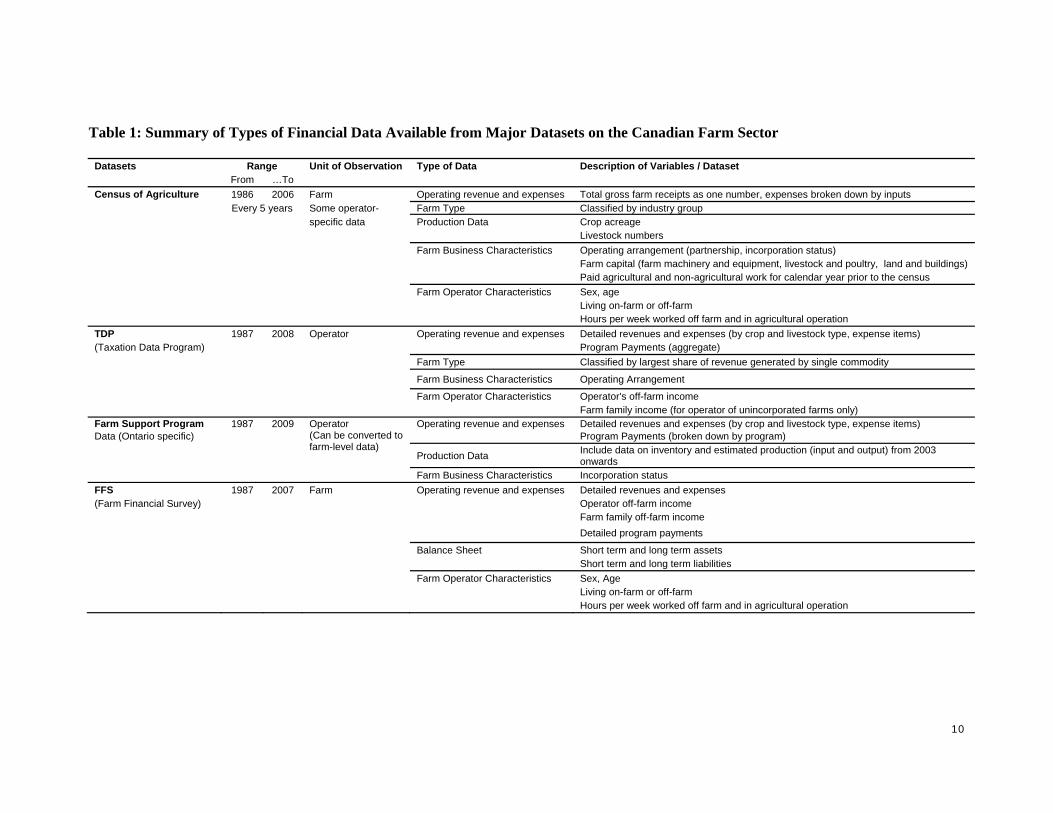
Table 1: Summary of Types of Financial Data Available from Major Datasets on the Canadian Farm Sector
Datasets Range Unit of Observation Type of Data Description of Variables / Dataset From …To
Census of Agriculture 1986 2006 Farm Operating revenue and expenses Total gross farm receipts as one number, expenses broken down by inputs Every 5 years Some operator- Farm Type Classified by industry group specific data Production Data Crop acreage Livestock numbers
Farm Business Characteristics Operating arrangement (partnership, incorporation status) Farm capital (farm machinery and equipment, livestock and poultry, land and buildings) Paid agricultural and non-agricultural work for calendar year prior to the census
Farm Operator Characteristics Sex, age Living on-farm or off-farm Hours per week worked off farm and in agricultural operation
TDP 1987 2008 Operator Operating revenue and expenses Detailed revenues and expenses (by crop and livestock type, expense items) (Taxation Data Program) Program Payments (aggregate)
Farm Type Classified by largest share of revenue generated by single commodity
Farm Business Characteristics Operating Arrangement
Farm Operator Characteristics Operator's off-farm income Farm family income (for operator of unincorporated farms only) Farm Support Program 1987 2009 Operator Operating revenue and expenses Detailed revenues and expenses (by crop and livestock type, expense items) Data (Ontario specific) (Can be converted to
farm-level data) Program Payments (broken down by program)
Production Data Include data on inventory and estimated production (input and output) from 2003 onwards
Farm Business Characteristics Incorporation status
FFS 1987 2007 Farm Operating revenue and expenses Detailed revenues and expenses (Farm Financial Survey) Operator off-farm income Farm family off-farm income
Detailed program payments
Balance Sheet Short term and long term assets Short term and long term liabilities
Farm Operator Characteristics Sex, Age Living on-farm or off-farm Hours per week worked off farm and in agricultural operation
11
3.2. Taxation Data Program (TDP)
Data on farms is collected annually by Canada Revenue Agency for tax purposes. Any
business that earns positive gross farming income to the operation of a farm must file a
farming income statement.2 These forms are filed annually in contrast to the census farm
information obtained every five years. The farm tax claims are divided into two categories on
the basis of business structure: unincorporated and incorporated. The distinction between the
two categories is a legal one that has implications on how taxes are filed but is not determined
by size.
For unincorporated farms, the farm operator and partners of the farm file tax returns.
Tax returns for operators of sole proprietorships or partnerships, also known as T1, report
positive gross farm income or non-zero net farm revenue as net farm income. For
incorporated farms, tax returns, known as T2, are filed by the operations themselves as
separate legal entities. Operators, employers, and shareholders of incorporated farms receive
wages, salaries, rents and/or dividends from the corporation but not farm income. These
wages represent an expense to the incorporated business that lowers its net income on their T2
but it is an income source that must be claimed in the individual income tax form (T1) by the
operators and/or shareholders. In order to obtain information on the individuals associated
with incorporated farms, T1 records of the operators must be linked to the T2 form of the
corporation.3 Therefore, a problem with gathering data from incorporated farms is that it is
2Not all taxfilers report the details. They may report only gross income/total farm revenue, total farm expenses, and net income. Some corporations even use GIFI - Income Statement codes instead of GIFI - Farming Income Statement codes (for example greenhouse operations who often consider themselves as retail operations instead of farming operations). The different forms used in the TDP are listed in publication 21-208 3 The sampling frame for unincorporated farms contains all individuals who report either positive gross farm income or non-zero net farm income from self-employment on their CRA T1 General—Income Tax and Benefit Return. For incorporated farms, the sampling frame is made up of all corporations within the ten provinces and the territories that are classified as farms according to the North American Industry Classification System (NAICS) and that have sales of $25,000 or more. To be classified as a farm in NAICS, 50% or more of sales must come from agricultural activities. The sampling frame does not include unincorporated tax filers in multiple jurisdictions (more than one province), non-Canadian residents or non-resident corporations, because they are
12
difficult to determine who amongst the workers associated with the corporation should be
considered farm operators. Information about the level of involvement an individual has with
an incorporated farm business is not available in the tax files.4,5
The TDP dataset is used to provide annual disaggregated statistics on farm revenues
and expenses at the farm and operator level, and farm family income (for operators of
unincorporated farms). These measures can be aggregated by major farm type, by revenue
class, and by sub-provincial region. It is also used to derive expense estimates from
agriculture for the System of National Accounts.
3.3. Farm Support Program Data
The Agri-Stability/Agri-Invest program, and its predecessor the Canadian Agricultural
Income Stabilization (CAIS) program, is the major form of direct financial support provided
to farms by the federal and provincial governments. CAIS is a whole farm stabilization
program available to eligible farmers regardless of the commodities they produce.
Participants choose a protection level for their farm operation and deposit a fee to secure that
protection with their application. Program payments, which include funds from their account
and a government contribution, are triggered when the margin of the farm business in the
program year falls below their reference margin or average income from previous years.
Because program payment takes into account margin adjustments due to structural changes of
beyond its scope. The frame also includes all communal farming organizations that report either positive gross farm income or non-zero net farm income on their CRA T3 Trust—Income Tax and Information Return. Statistics Canada, Catalogue 21-206, -207 or -208.
4Schedule 50 – related to CORTAX - is to be completed by all private corporations for any shareholder who holds 10% or more of the corporation’s common and/or preferred shares. (Maximum of the top 10 shareholders.) This form contains the following information on shareholders: name, business number (BN) (if shareholder is a registered corporation), social insurance number (SIN), trust number, percentage common shares and percentage preferred shares. In the TDP, we keep the name, SIN, BN and percentage common shares and that for a maximum of 5 shareholders. The off-farm income of the shareholders is included in the series on total income of farm operators (T1T2 series).
5Tax data from communal operations (T3 records) are also collected, but these records are generally left out of the analysis.
13
the business (i.e. expansion), data on inventory information, accounts payable, accounts
receivable, and purchased input also supplement the tax data.
Participants include sole proprietorship, partnerships, corporations and cooperatives
(AAFC, 2010). Generally, entities that derive income from the primary production of
agricultural commodities, as defined by the program, are eligible to participate in CAIS.
Eligibility criteria include: 1) carried on the business of farming in Canada and reported
farming income (or loss) for income tax purposes; 2) completed a minimum six consecutive
months of farming activity; and 3) completed a production cycle. The definition of a farm is
broad with the only major restriction being that it has been active. Since program payment
calculations require tax data from previous years, unique identifiers are assigned to each
operator and each operation, making longitudinal and panel data possible.
3.4. Farm Financial Survey (FFS)
The major data source used to assess the current and long-term viability of farms and the
financial health of farm families is the Farm Financial Survey (FFS). It was created by
AAFC and Statistics Canada in 1993 to replace an ad hoc survey that had been conducted
since 1981 in partnership with the Farm Credit Corporation. In addition to collecting data on
revenues and expenses, which are available from tax files in the TDP data base, the FFS
obtains information on assets, liabilities, capital investments/sales, detailed program payments
and off-farm income. It is the only survey that collects balance sheet information
representative of the Canadian population. Some physical characteristics of the farm (i.e.,
crop area and livestock number) are also collected.
3.5. Other Surveys
14
There are approximately 50 active surveys and statistical programs conducted by Statistics
Canada related to agriculture, categorized into five broad categories: crops and horticulture
(20), farm financial statistics (11, including the FFS), farms and farm operators (the TDP,
which is an administrative data program rather than a survey), land use and environmental
practices (3), and livestock and aquaculture (13). Although there is no direct survey of food
and nutrition within Canadian agricultural statistic sources, the supply and disposition of each
food commodity is computed and divided by the number of residents to estimate the per
capita disappearance. Aside from a few large statistical programs and surveys such as the
FFS, many of these surveys and programs address a lack of information on specific topics not
covered by the Census of Agriculture.
4. Definitional Differences between Supply Sources
The focus of the demand for agricultural statistics by analysts for public policy
decisions and the supply of the statistics is on either the farm, farmer or farm family.
However, the definitions of these units of measure differ depending on the source and these
differences are discussed below.
4.1. Farm
Statistics Canada defines a census farm as a farm, ranch or other agricultural operation
producing agricultural products for sale. Any operation can be classified as a census farm,
regardless of sales volume, as long as there is an intention to sell. While this current
definition of a census farm does not include a minimum sales criterion, there was such a
threshold, albeit small, before the 1991 Census and there remains one in other countries6.
This broad definition is adopted for the census so that it can capture information on all
agricultural activities in Canada.
6In the United States, a census farm is any operation from which $1,000 or more of agricultural products were produced and sold, or normally would have been sold, during the census year (O’Donoghue et al 2009).
15
In contrast to the broad definition of a farm used in the census, farms in the Taxation
Data Program (TDP), which is a subset of farm operators’ tax files, are constrained to have at
least a minimum total farm operating revenue for inclusion. For tax files related to
unincorporated farms, only records with total farm operating revenue over $10,000 are
included in the sample, and for tax files related to incorporated farms, only records with total
farm operating revenue over $25,000 are included in the sample. This does not impact the
usability of these databases for understand and evaluating any forthcoming policy decision.
The taxfiler data are tabulated in order to generate estimates of expenditures by item for the
aggregate series of farm expenses, which is a component of the total net farm income and the
realized net farm income which feed into the national accounts. As these smaller units do not
significantly affect the aggregate estimate, it is not efficient to include these observations in
the sample of records that are edited and tabulated for estimates of aggregate expenses.
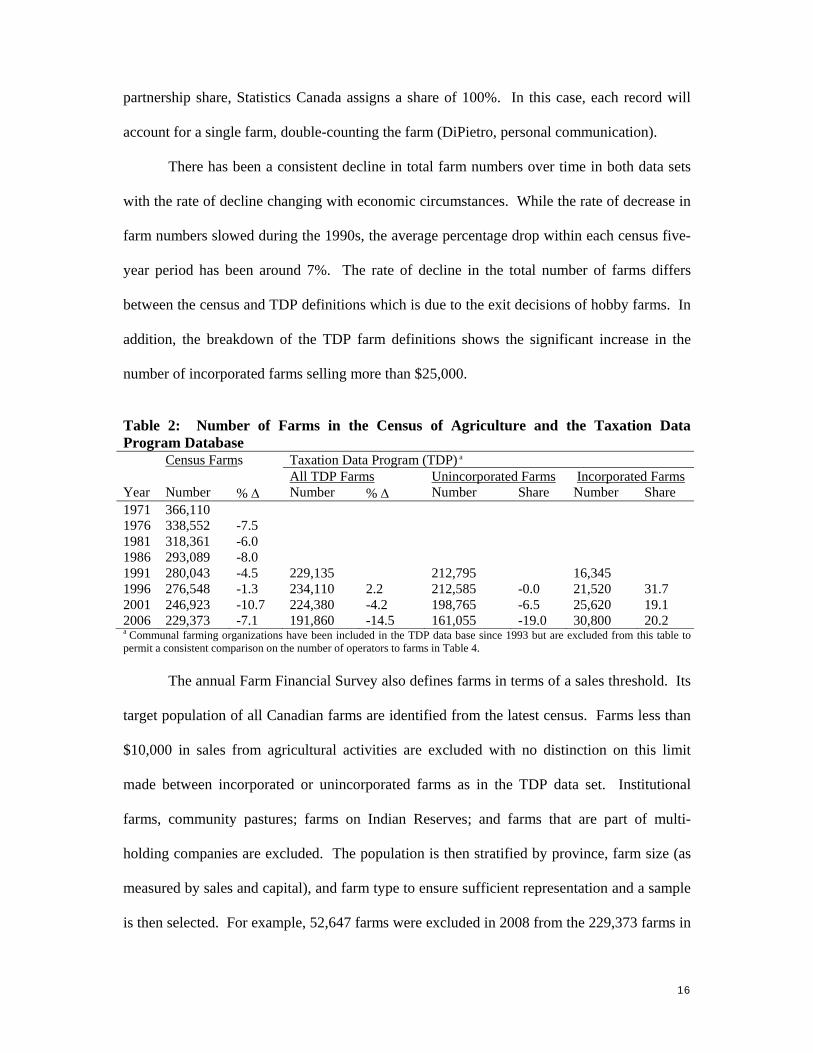
The number of farms in the census and TDP data sets are list in Table 2. The revenue
constraint within the definition reduces the number of farms in the TDP data set compared to
the number in the Agricultural Census. The difference suggests approximately 15%-20% of
the census farms have operating revenues less than $10,000 if unincorporated and less than
$25,000 if incorporated. If we exclude institutional farms, community pastures, farms on
First Nation Reserves, unincorporated farms with less than $10,000 in gross farm receipts and
corporations with less than $25,000 in gross farm receipts from Census 2006, we have
177,173 census farms. This count is lower than the TDP estimated number of 191,860 farms
in 2006. One of the reasons for the higher number of farms in the TDP is that unincorporated
taxfilers may not report their partnership share. Lets suppose a farm is owned by two partners
with an equal share of 50% and both records are selected in the sample and are part of a take-
all stratum. Each record will account for half a farm. When the taxfiler does not provide the
16
partnership share, Statistics Canada assigns a share of 100%. In this case, each record will
account for a single farm, double-counting the farm (DiPietro, personal communication).
There has been a consistent decline in total farm numbers over time in both data sets
with the rate of decline changing with economic circumstances. While the rate of decrease in
farm numbers slowed during the 1990s, the average percentage drop within each census five-
year period has been around 7%. The rate of decline in the total number of farms differs
between the census and TDP definitions which is due to the exit decisions of hobby farms. In
addition, the breakdown of the TDP farm definitions shows the significant increase in the
number of incorporated farms selling more than $25,000.
Table 2: Number of Farms in the Census of Agriculture and the Taxation Data Program Database Census Farms Taxation Data Program (TDP) a All TDP Farms Unincorporated Farms Incorporated Farms Year Number % Number % Number Share Number Share 1971 366,110 1976 338,552 -7.5 1981 318,361 -6.0 1986 293,089 -8.0 1991 280,043 -4.5 229,135 212,795 16,345 1996 276,548 -1.3 234,110 2.2 212,585 -0.0 21,520 31.7 2001 246,923 -10.7 224,380 -4.2 198,765 -6.5 25,620 19.12006 229,373 -7.1 191,860 -14.5 161,055 -19.0 30,800 20.2 a Communal farming organizations have been included in the TDP data base since 1993 but are excluded from this table to permit a consistent comparison on the number of operators to farms in Table 4.
The annual Farm Financial Survey also defines farms in terms of a sales threshold. Its
target population of all Canadian farms are identified from the latest census. Farms less than
$10,000 in sales from agricultural activities are excluded with no distinction on this limit
made between incorporated or unincorporated farms as in the TDP data set. Institutional
farms, community pastures; farms on Indian Reserves; and farms that are part of multi-
holding companies are excluded. The population is then stratified by province, farm size (as
measured by sales and capital), and farm type to ensure sufficient representation and a sample
is then selected. For example, 52,647 farms were excluded in 2008 from the 229,373 farms in
17
the 2006 Census (see Table 2) and the final FFS sample consisted of 13,483 farms. The
number of useable records with operating revenues equal to or greater than $10,000 was 8,499
farms in 2008.
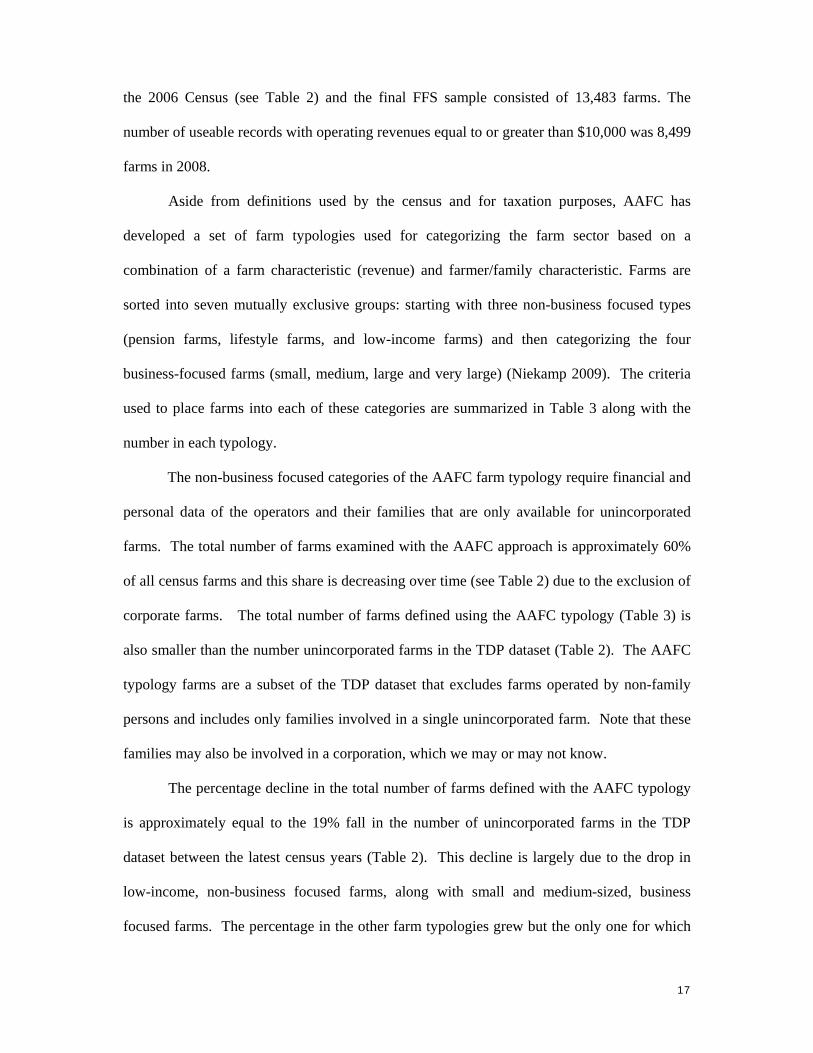
Aside from definitions used by the census and for taxation purposes, AAFC has
developed a set of farm typologies used for categorizing the farm sector based on a
combination of a farm characteristic (revenue) and farmer/family characteristic. Farms are
sorted into seven mutually exclusive groups: starting with three non-business focused types
(pension farms, lifestyle farms, and low-income farms) and then categorizing the four
business-focused farms (small, medium, large and very large) (Niekamp 2009). The criteria
used to place farms into each of these categories are summarized in Table 3 along with the
number in each typology.
The non-business focused categories of the AAFC farm typology require financial and
personal data of the operators and their families that are only available for unincorporated
farms. The total number of farms examined with the AAFC approach is approximately 60%
of all census farms and this share is decreasing over time (see Table 2) due to the exclusion of
corporate farms. The total number of farms defined using the AAFC typology (Table 3) is
also smaller than the number unincorporated farms in the TDP dataset (Table 2). The AAFC
typology farms are a subset of the TDP dataset that excludes farms operated by non-family
persons and includes only families involved in a single unincorporated farm. Note that these
families may also be involved in a corporation, which we may or may not know.
The percentage decline in the total number of farms defined with the AAFC typology
is approximately equal to the 19% fall in the number of unincorporated farms in the TDP
dataset between the latest census years (Table 2). This decline is largely due to the drop in
low-income, non-business focused farms, along with small and medium-sized, business
focused farms. The percentage in the other farm typologies grew but the only one for which
18
there was an absolute increase in numbers was for the very large farms (4,080 in 2001 vs
4,160 in 2006). The change is much smaller than the increase in corporate farms with the
TDP database (Table 2). Focusing only on the AAFC definition of a farm could hide the
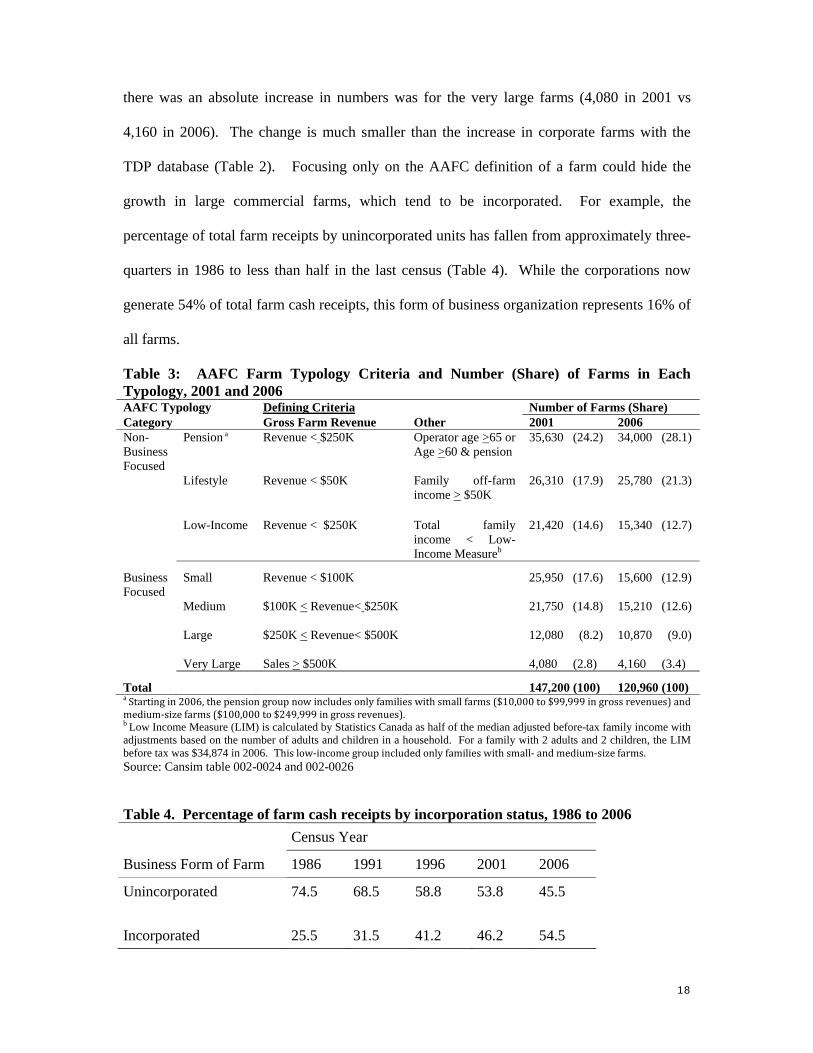
growth in large commercial farms, which tend to be incorporated. For example, the
percentage of total farm receipts by unincorporated units has fallen from approximately three-
quarters in 1986 to less than half in the last census (Table 4). While the corporations now
generate 54% of total farm cash receipts, this form of business organization represents 16% of
all farms.
Table 3: AAFC Farm Typology Criteria and Number (Share) of Farms in Each Typology, 2001 and 2006 AAFC Typology Defining Criteria Number of Farms (Share)Category Gross Farm Revenue Other 2001 2006 Non-Business
Pension a Revenue < $250K Operator age >65 or Age >60 & pension
35,630 (24.2) 34,000 (28.1)
Focused Lifestyle Revenue < $50K Family off-farm
income > $50K 26,310 (17.9) 25,780 (21.3)
Low-Income Revenue < $250K Total family
income < Low-Income Measureb
21,420 (14.6) 15,340 (12.7)
Business Small Revenue < $100K 25,950 (17.6) 15,600 (12.9) Focused Medium $100K < Revenue< $250K 21,750 (14.8) 15,210 (12.6) Large $250K < Revenue< $500K 12,080 (8.2) 10,870 (9.0) Very Large Sales > $500K 4,080 (2.8) 4,160 (3.4)
Total 147,200 (100) 120,960 (100) a Startingin2006,thepensiongroupnowincludesonlyfamilieswithsmallfarms($10,000to$99,999ingrossrevenues)andmedium‐sizefarms($100,000to$249,999ingrossrevenues). b Low Income Measure (LIM) is calculated by Statistics Canada as half of the median adjusted before-tax family income with adjustments based on the number of adults and children in a household. For a family with 2 adults and 2 children, the LIM before tax was $34,874 in 2006. Thislow‐incomegroupincludedonlyfamilieswithsmall‐andmedium‐sizefarms. Source: Cansim table 002-0024 and 002-0026 Table 4. Percentage of farm cash receipts by incorporation status, 1986 to 2006
Census Year
Business Form of Farm 1986 1991 1996 2001 2006
Unincorporated 74.5 68.5 58.8 53.8 45.5
Incorporated 25.5 31.5 41.2 46.2 54.5
19
4.1.Farmers
While the definition of a farm is relatively straightforward based on intent to sell or
filing tax returns with net farm income, the task of identifying farmers from other individuals
associated with the farm is challenging. Individuals can make financial, management, or
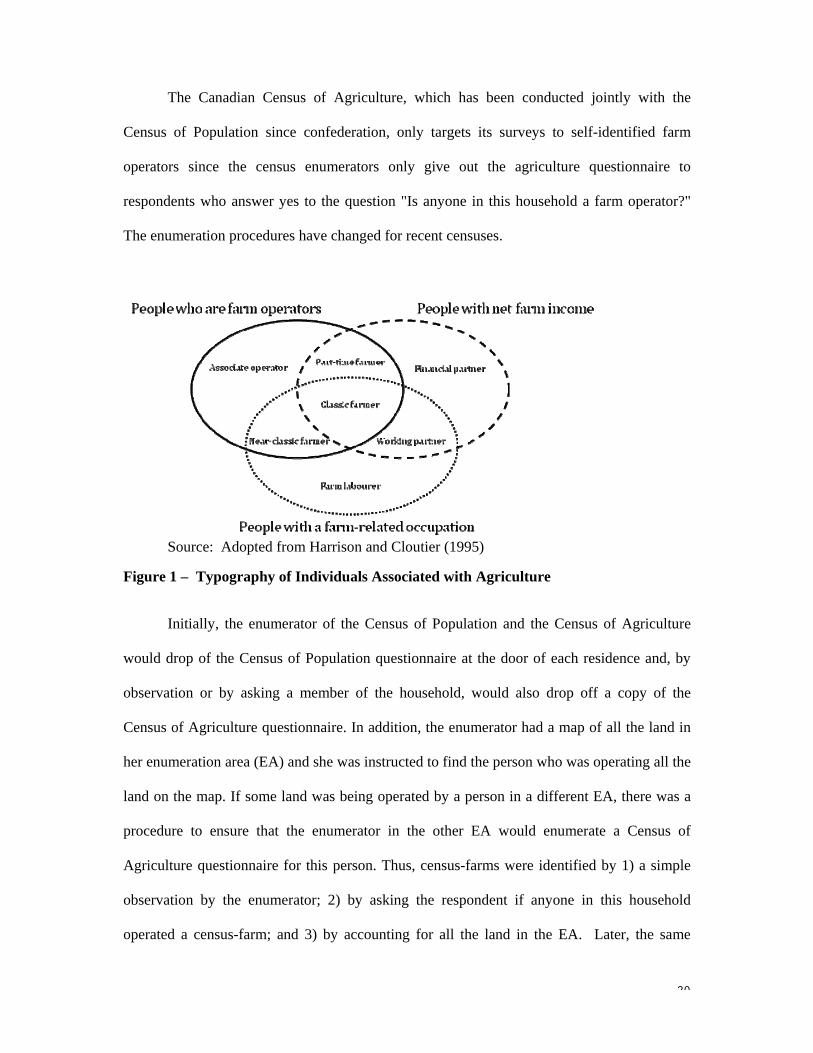
labour contributions to an agricultural operation. Harrison and Cloutier (1995) classified 7
types of individuals associated with agriculture on the basis of 3 criteria: (1) individuals who
are farm operators; (2) individuals who report earnings as net farm income; and (3)
individuals with farm-related occupations. At the intersection of all three criteria are
individuals considered as the classic farmer who owns, operates and works the farm unit
(Figure 1). While this may continue to be the image of agriculture, the array of involvement
is much broader than in the past.
Individuals who are operators but do not get net farm income are classified as either
associate operators, or near-classic farmers if their occupation is considered to be
agriculturally related. Near-classic farmers are operators of incorporated farms so that the
operator’s income is in the form of wages, salary, rent, or dividend paid out by the operation.
Operators with net farm income, but have an occupation that is not associated with
agriculture, are considered as part-time farmers. Operators whose occupation is not related to
agriculture and who do not report their earnings as net farm income are considered to be
associate operators. Associate operators are individuals with other occupations and/or
operators of very small hobby farms. Non-operators who report earnings as net farm income
are considered financial partners if their occupation is not related to agriculture. Finally,
individuals who do not receive net farm income or manage the operation are considered farm
labourers if their occupation is related to agriculture of a working partner of an incorporated
farm. This classification highlights the diverse relationships that exist between farm
operations and people, who are not all operators.
20
The Canadian Census of Agriculture, which has been conducted jointly with the
Census of Population since confederation, only targets its surveys to self-identified farm
operators since the census enumerators only give out the agriculture questionnaire to
respondents who answer yes to the question "Is anyone in this household a farm operator?"
The enumeration procedures have changed for recent censuses.
Source: Adopted from Harrison and Cloutier (1995)
Figure 1 – Typography of Individuals Associated with Agriculture
Initially, the enumerator of the Census of Population and the Census of Agriculture
would drop of the Census of Population questionnaire at the door of each residence and, by
observation or by asking a member of the household, would also drop off a copy of the
Census of Agriculture questionnaire. In addition, the enumerator had a map of all the land in
her enumeration area (EA) and she was instructed to find the person who was operating all the
land on the map. If some land was being operated by a person in a different EA, there was a
procedure to ensure that the enumerator in the other EA would enumerate a Census of
Agriculture questionnaire for this person. Thus, census-farms were identified by 1) a simple
observation by the enumerator; 2) by asking the respondent if anyone in this household
operated a census-farm; and 3) by accounting for all the land in the EA. Later, the same
21
procedure was used – except that the respondent had the option of mailing the question. This
had the advantage that local enumerator (who was typically a member of the community) did
not see the responses of a given census questionnaire (which improved the “perception”
among respondents that the data were confidential). The Census of Population questionnaire
was mailed out to households in larger population centres but the drop off – pick up protocol
remained in rural areas. At this time, a question was added to the Census of Population
questionnaire that asked “Is anyone in this household a farm operator?” which was designed
to compensate for the fact that the enumerator was not at the doorstep to ask a household
member this question.
The 2011 Census of Agriculture is being conducted on the same day as the Census of
Population but now the Census of Agriculture is being mailed to all census-farms on Statistics
Canada’s Central Farm Register. As for past census periods, an intensive effort is being made
to request list of farmers from agencies that deal with farmers to ensure that a questionnaire is
received from all known farmers. Also, the question on the Census of Population that asks “Is
anyone in this household a farm operator?” will also be used to ensure that a Census of
Agriculture questionnaire is enumerated for all census-farms. Due to the broad definition of
census farm operator, aside from the classic and non-classic farmers, part-time farmers and
associate operators are also included in this definition. Up to three individuals can be
reported as an operator per farm provided they are responsible for some management
decisions. Data on financial partners, working partners, and farm labourers are not collected
for census purposes.
One purpose of the Census of Agriculture is to create a list-frame for inter-censal
surveys. Thus, the surveys need to go the person who knows the information on the acreage of
each crop, the yield of each crop and the number of livestock and poultry on the farm. Hence,
the data is collected from the “operator” who is involved in “day-to-day” decisions for the
22
operation. In most cases, this is also the owner of the operation. However, given the long-
standing requirement to identify the person who could respond to subsequent surveys, the
“operator” is not (necessarily) the owner of the farm and not (necessarily) the accountant with
the farm books but rather the person who is in the best position to respond to subsequent crop
and livestock surveys.
Thus, given the purpose of the Census of Agriculture, we find numerous units of
observation (“census-farms”) that are not farms for either a casual conversation or any
participant in a discussion of public policy regarding farm businesses or farmers or farming
families. Specifically, the analyst in each situation must choose the target group that applies
to the discussion at hand. Agricultural statistics programs around the world tend to publish
the count of all units of observation (“census-farms”). This is useful information on the
number of units with some agricultural production but less useful (and perhaps not-at-all
useful) for any subsequent policy analysis, as will be discussed further below.
While the definition of a farmer in the census is based on decision-making, the
definition of an operator in the TDP data set is based on financial association.
Unincorporated operators in the TDP database are individual taxfilers who report positive
gross farm income or non-zero net farm income on their T1 tax form. There are no
prerequisites in terms of operators claiming any part of the gross or net income from the farm
in order to be listed as such on the Census of Agriculture. Thus, two different concepts are
used in the definition of a farmer; the census is based on the operator while the TDP is based
on financial association.
23
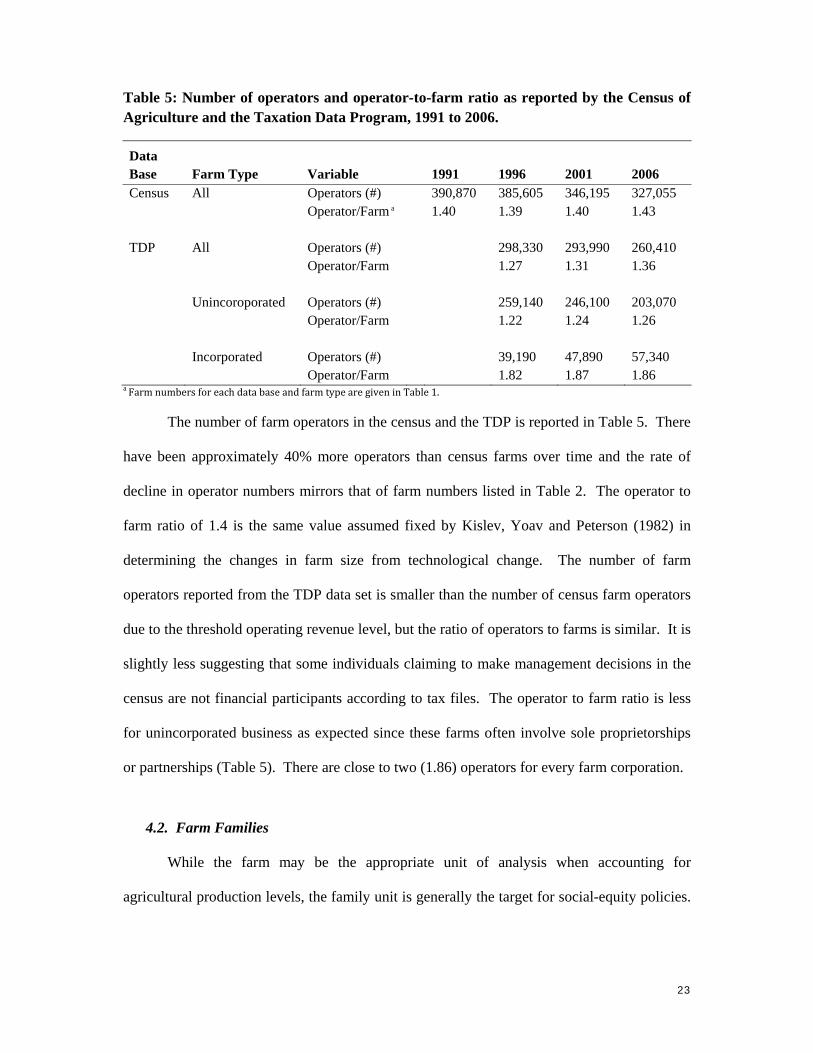
Table 5: Number of operators and operator-to-farm ratio as reported by the Census of Agriculture and the Taxation Data Program, 1991 to 2006.
Data Base Farm Type Variable 1991 1996 2001 2006 Census All Operators (#) 390,870 385,605 346,195 327,055 Operator/Farm a 1.40 1.39 1.40 1.43 TDP All Operators (#) 298,330 293,990 260,410 Operator/Farm 1.27 1.31 1.36 Unincoroporated Operators (#) 259,140 246,100 203,070 Operator/Farm 1.22 1.24 1.26 Incorporated Operators (#) 39,190 47,890 57,340 Operator/Farm 1.82 1.87 1.86
a FarmnumbersforeachdatabaseandfarmtypearegiveninTable1.
The number of farm operators in the census and the TDP is reported in Table 5. There
have been approximately 40% more operators than census farms over time and the rate of
decline in operator numbers mirrors that of farm numbers listed in Table 2. The operator to
farm ratio of 1.4 is the same value assumed fixed by Kislev, Yoav and Peterson (1982) in
determining the changes in farm size from technological change. The number of farm
operators reported from the TDP data set is smaller than the number of census farm operators
due to the threshold operating revenue level, but the ratio of operators to farms is similar. It is
slightly less suggesting that some individuals claiming to make management decisions in the
census are not financial participants according to tax files. The operator to farm ratio is less
for unincorporated business as expected since these farms often involve sole proprietorships
or partnerships (Table 5). There are close to two (1.86) operators for every farm corporation.
4.2. Farm Families
While the farm may be the appropriate unit of analysis when accounting for
agricultural production levels, the family unit is generally the target for social-equity policies.
24
Currently, there is no single definition of a farm family in Canada, but data on the
contribution of net farm income towards farm family income is collected.
According to the Census Dictionary (2008), a census family refers to a married couple
or a couple living common-law (with or without children of either or both partners), or a lone
parent of any marital status with at least one child living in the same dwelling. A couple may
be of the opposite or same sex. 'Children' in a census family include grandchildren living
with their grandparent(s) but with no parents present. A household is broader than a farm
family. It refers to a person or a group of persons who occupy the same dwelling and do not
have a usual place of residence elsewhere in Canada. Every person can only be a member of
one household through the census. A farm census family or household is one in which at least
one family member is a farm operator.
Information on farm families or households is obtained through the Agriculture–
Population Linkage database, which is created by linking the Census of Agriculture with the
Census of Population. While all farms must complete the Census of Agriculture, the long
Census of Population questionnaire is distributed to a random sample of 20% of all
households that complete the agricultural census in Canada. This permits combining the
socio-economic characteristics of farm operators and their families with the agricultural
characteristics of farm operations.
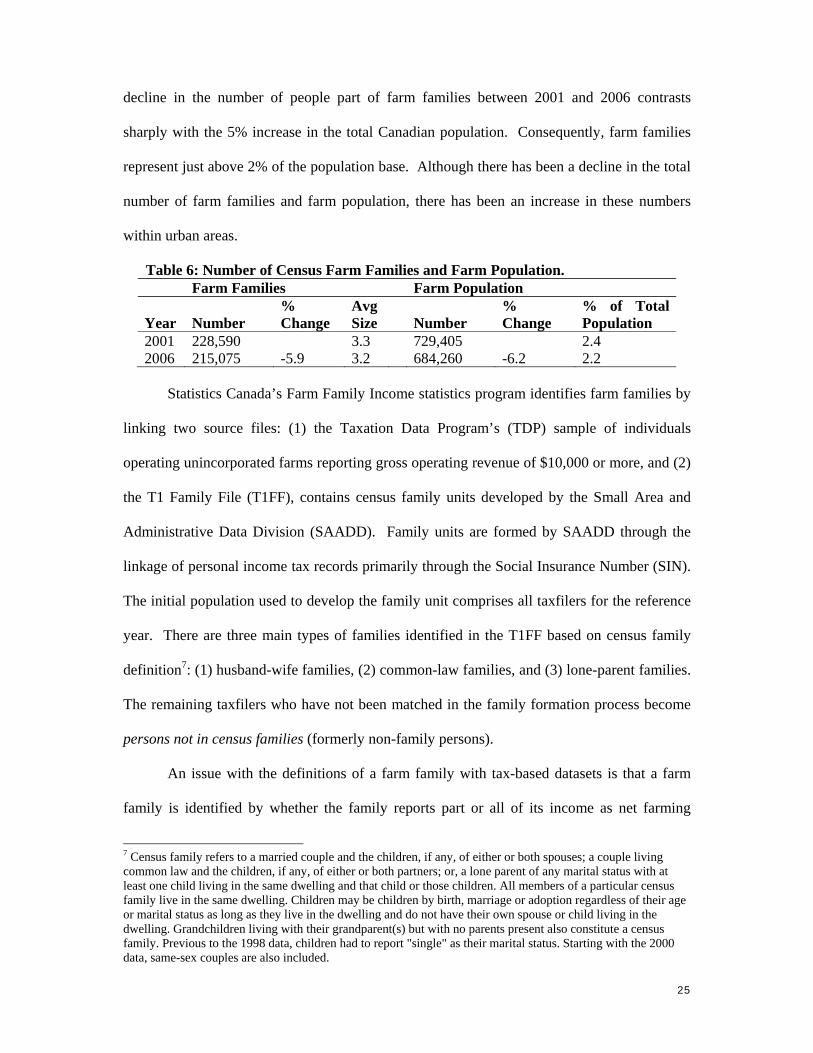
The number of census farm families is listed in Table 6. The total number of farm
families is less than the number of census farms, which is less than the number of farm
operators. Multiple operators of the same farm could be part of the same family and
household. Some farms are run by operators living alone; therefore not counted as part of a
family. Approximately 82% of the farm families are associated with unincorporated farms.
The decline in the number of farm families follows the same trend as for farms and farmers.
The percentage change also mirrors the rate of decline of the farm population. The 6%
25
decline in the number of people part of farm families between 2001 and 2006 contrasts
sharply with the 5% increase in the total Canadian population. Consequently, farm families
represent just above 2% of the population base. Although there has been a decline in the total
number of farm families and farm population, there has been an increase in these numbers
within urban areas.
Table 6: Number of Census Farm Families and Farm Population.
Statistics Canada’s Farm Family Income statistics program identifies farm families by
linking two source files: (1) the Taxation Data Program’s (TDP) sample of individuals
operating unincorporated farms reporting gross operating revenue of $10,000 or more, and (2)
the T1 Family File (T1FF), contains census family units developed by the Small Area and
Administrative Data Division (SAADD). Family units are formed by SAADD through the
linkage of personal income tax records primarily through the Social Insurance Number (SIN).
The initial population used to develop the family unit comprises all taxfilers for the reference
year. There are three main types of families identified in the T1FF based on census family
definition7: (1) husband-wife families, (2) common-law families, and (3) lone-parent families.
The remaining taxfilers who have not been matched in the family formation process become
persons not in census families (formerly non-family persons).
An issue with the definitions of a farm family with tax-based datasets is that a farm
family is identified by whether the family reports part or all of its income as net farming
7 Census family refers to a married couple and the children, if any, of either or both spouses; a couple living common law and the children, if any, of either or both partners; or, a lone parent of any marital status with at least one child living in the same dwelling and that child or those children. All members of a particular census family live in the same dwelling. Children may be children by birth, marriage or adoption regardless of their age or marital status as long as they live in the dwelling and do not have their own spouse or child living in the dwelling. Grandchildren living with their grandparent(s) but with no parents present also constitute a census family. Previous to the 1998 data, children had to report "single" as their marital status. Starting with the 2000 data, same-sex couples are also included.
Farm Families Farm Population
Year Number % Change
Avg Size Number
% Change
% of Total Population
2001 228,590 3.3 729,405 2.4 2006 215,075 -5.9 3.2 684,260 -6.2 2.2
26
income. As outlined earlier in this report, many individuals associated with agriculture, such
as shareholders and employees of incorporated farms, do not earn net farming income. As
such, families of the individuals identified above are not included in the dataset. As with the
census definition of a farm family, the tax filer definition does not distinguish a family’s level
of involvement with agriculture.
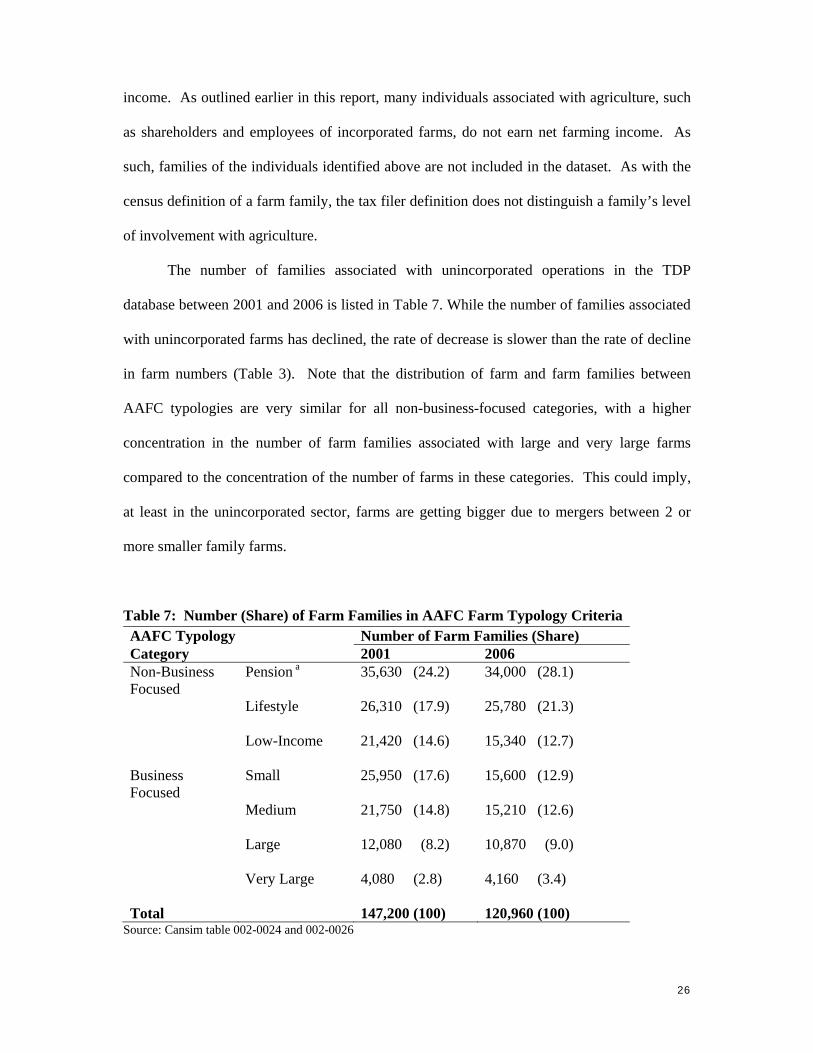
The number of families associated with unincorporated operations in the TDP
database between 2001 and 2006 is listed in Table 7. While the number of families associated
with unincorporated farms has declined, the rate of decrease is slower than the rate of decline
in farm numbers (Table 3). Note that the distribution of farm and farm families between
AAFC typologies are very similar for all non-business-focused categories, with a higher
concentration in the number of farm families associated with large and very large farms
compared to the concentration of the number of farms in these categories. This could imply,
at least in the unincorporated sector, farms are getting bigger due to mergers between 2 or
more smaller family farms.
Table 7: Number (Share) of Farm Families in AAFC Farm Typology Criteria AAFC Typology Number of Farm Families (Share) Category 2001 2006 Non-Business Pension a 35,630 (24.2) 34,000 (28.1) Focused Lifestyle 26,310 (17.9) 25,780 (21.3) Low-Income 21,420 (14.6) 15,340 (12.7) Business Small 25,950 (17.6) 15,600 (12.9) Focused Medium 21,750 (14.8) 15,210 (12.6) Large 12,080 (8.2) 10,870 (9.0) Very Large 4,080 (2.8) 4,160 (3.4) Total 147,200 (100) 120,960 (100)
Source: Cansim table 002-0024 and 002-0026
27
5. Gaps in Demand and Supply
5.1. Sector Description
Statistics Canada (2009) states that their purpose is “to produce statistics that help Canadians
better understand their country—its population, resources, economy, society and culture.”
More specifically, the Agriculture Division collects, compiles, analyses and disseminates
monthly, quarterly, annual and seasonal statistics related to the agriculture industry. Although
the core of the Division’s program remains focused on crop, livestock and economic statistics,
the Agriculture Division is increasingly diverse. The program also produces data and analyses
related to an array of areas including the farm family, the rural economy, environmental
practices, food, nutrition and aquaculture. The resulting data allows users to analyze food
production, determine agriculture industry structure, analyze farm and rural population trends,
examine characteristics of the farm population, monitor the financial performance of farms,
analyze commodity markets, assess food consumption patterns, and monitor crop growth and
help predict yields.
The levels of agricultural output and the means by which it is produced are analysed
with census data that is complemented through annual surveys during the periods in between
censuses. The advantage of an all-encompassing definition of a census farm is that it captures
almost all information on agricultural production conducted in the country by all sizes of
operation. The current broad definition of a farm and the means by which the data are
collected permits the assessment of total food production.
The structure of the agricultural sector is described not only by total numbers but also
by the distribution of its structural parameters. A common measure of change in farm
structure is average farm size, which is typically reported on the basis of census data. The
average values are not likely to reflect the technological advances captured by commercial
operations since the bulk of the farms in the census data are small, part-time operations. The
28
reporting of structural parameters, such as farm size, should account for the growing bi-modal
nature of the sector. This could be done by noting the values for different size categories or
farm typologies, rather reporting a single average value.
The typology of farms created by AAFC recognizes the diversity in farms and the
changing structure of the sector with its categorization of farms into business-focused and
non-business-focused. It highlights the growing importance of farm units that have other
motivations for farming aside from being a financially viable operation. The AAFC
typographies are a useful means of disaggregating the data on farms and farm families in
order to describe the sector. However, its construction involves the use of operator and family
characteristics which are only available from the tax filer data for unincorporated farms that
are sole proprietorships or partnerships. Incorporated farms are excluded, and although these
farms represent around 16% of the total, they produce over half of total farm cash receipts.
Thus, inferences made on productivity and financial trends in the sector using the AAFC
typologies must recognize the impacts of excluding corporations.
The census definitions of farms, farm operators and farm families permits examination
of trends in and characteristics of the farm population. The linkage of the agricultural census
with the population census has provided detailed socio-economic characteristics of a sample
of farm operators and their families. The decline in farm population in rural areas and the
growing importance of non-farm income to farm households are examples of two trends noted
over time with the Ag-Pop database, and are embedded within the AAFC typologies. Future
inferences from this database may be impacted by the decision to replace the long form
population census with the voluntary National Household Survey in 2011.
The final descriptive aspect of the sector involving the use of farm, farmer and farm
family data is monitoring the financial performance of the sector. Tracking the financial
health of the sector is a key determinant of overall competitiveness by farm type and region,
29
and ultimately the need for stabilization or support. The consequences of using different
definitions and associated data bases must be recognized. Census farm information is all-
inclusive and estimates of financial information are provided by the farm operator. In
addition to being aware of biases from reporting average values for all farms as noted above
for other structural parameters, an additional note of caution surrounds the use of self-reported
financial variables. The TDP data base is an excellent source of farm profitability measures
as the revenue and expense items are those reported to Revenue Canada. However, it does
not have information on assets and liabilities for T1 farms (unincorporated farms). The Farm
Financial Survey does gather balance sheet data for a sample of farmers.
Aside from the potential misleading inferences with regards to the distribution of farm
structural parameters with the use of single values, particularly with regard to financial
performance, the current definitions and collection methods for this data can provide a
complete, traditional description of the agricultural sector. However, the traditional measures
do not reveal some of the significant structural changes within the sector.
One important aspect that should be accounted for within the definitions and
collection methods is the role of individuals within corporate farms. Farms are increasingly
operated by multiple individuals, who each bring different levels of management, equity, and
labour to the farm. Currently, farm operators are identified by farming income in the TDP, by
the day-to-day management responsibilities in the census, and by other alternatives, such as
major occupation, in the Agriculture–Population Linkage database. Using this definition can
separate operators from hired labour and family labour in unincorporated farms, but excludes
operators of incorporated farms as they report their earning as dividends and salary. An
alternative approach in farm operator definition may include information on the type of shares
shareholders of an incorporated farm hold. In a corporate business structure, shareholders
may hold shares with or without voting rights attached. As farm operators are people
30
involved with management of the farm and are the target of farm support policies, those with
voting rights in incorporated farms should be considered operators. This would help make the
distinction between operator and hired labour in incorporated operations.
In addition, deciphering the elements along the value chain is an important descriptive
measure not presently captured within current databases. Agricultural goods were typically
homogeneous commodities sold on a spot market but now they are increasingly differentiated
products sold through contracts. This has implications for price discovery but also on the
form of the agricultural supply chain.
5.2. Risk Management Program Design and Evaluation
The goals for using definitions for the purpose of targeting income farm support
require definitions that are different than those for describing the sector. Farm support
programs aim to support and stabilize the income of struggling but active operations. The
programs are meant as a safety-net to aid viable farms in times of unexpected need and
consequently maintain resources within the agricultural sector. As discussed in section 2, the
design of effective policy to achieve these goals demands identifying the target farm group,
assessing the financial health of that target group, and evaluating the consequences of
different levels and forms of stabilization. These three elements demanded by the designers
of effective support policy are examined separately in terms of the available data to conduct
the assessment.
Identifying Target Group for Support
The focus of government funded risk management programs is on the productive unit,
which is the farm rather than the farmer or the farm family. Although farm support policies
are also motivated by stabilizing and supporting farm household income, especially for those
families relying on net farm income, the major emphasis is on the farm because of the more
31
recent mandates to push for competitiveness of the industry. While the range of variables are
thus narrowed in comparison to the number of variables necessary to describe the agri-food
sector in its entirety, the data requirements will be significant beginning with potential criteria
for establishing which farms should be targeted for support.
Enrolment in current (Agri-Stability and Agri-Invest) and recent (CAIS) has been
limited to the criteria that goods be sold within the production cycle along with the
completion of an application. Alternative farm definitions have been proposed by the USDA
(2009) to ensure that only active producers can participate in farm support programs. The
criteria used to define ‘active’ and thus the target group of units for support are defined in
terms of a minimum level of: (1) revenue generated, (2) labour hours worked, (3) share of
household income of the farm operator as farming income; and (4) size in terms of area or
asset base.
A main issue with using a minimum level of revenue generated as an indication of
activity is that it may exclude new operations that produce little to no agricultural products
during the first few years of production (orchards, for example). Another difficulty is how to
define the minimum level of revenue generated in order for a farm to be considered active:
these cut-offs may differ between the types of operation and are dependent on commodity
prices. Because the minimum cut-off value for defining farms does not change annually or in
relation to commodity prices, using a static gross farm revenue to define farm operation may
affect results of analysis that looks at structural changes of commodity groups or the
agricultural sector as a whole. With regards to using minimum labour hours, the current tax
data, basis for many policy analyses, does not collect these types of information for these
definitions to be of use in the policy settings. Labour costs, especially wages paid to other
family members, are also a method for farm operators to increase expenses and reduce tax
burden, and may not be an accurate proxy for labour input. Finally, including family income
32
in the definition of farm is only applicable to unincorporated operations, as data on family
income is not collected for incorporated farms. However, since incorporated operations tend
to be larger farms, it can be assumed that most incorporated farms are actively producing
operations as well.
Another alternative approach to identifying active operations discussed in the USDA
report (2009) is to look at the acres operated. This approach is problematic because, as
identified by the report, different types of operations required different sizes of land bases and
may not be comparable between different types of farms. Yet another alternative maybe to
include assets, liability, and equity into the size measurement, similar to the point system
adopted by the US to identify potential sales. The minimum amount of points in order for an
operation to be considered a farm may be one that is up for future debate: setting the cut-off
too low may include agricultural holdings that are not active in producing agricultural goods,
whereas setting it too high may exclude many smaller or less successful operations from
obtaining government support.
Although determining the target for agricultural support and the financial health of
that target focuses on the definition of a farm, assessing the consequences of the policy
involves understanding the underlying farm operators. Operator level data that focuses on
individuals allows inferences to be made on how policies affect the input and output decisions
made by producers. For example, farm operator data can reveal how the decision to
participate in off-farm employment is impacted by agricultural and/or rural policies and these
off-farm labour decisions can be used as a self-insurance mechanism instead of government
stabilization programs. Re-defining the definition of a farmer to allow for the understanding
of individual roles within a corporation is also important for the analysis of agricultural
support policy. For example, the number of near-classic farmers is increasing as agricultural
operations increasingly become incorporated for various tax and legal reasons suggesting a
33
greater degree of separation between management and ownership for individuals within a
farm unit. Depending upon the transfer efficiency of government programs, the beneficiaries
of government aid may be the farm operators or the owners of assets to which the residual
returns accumulate.
Assessing Financial Health
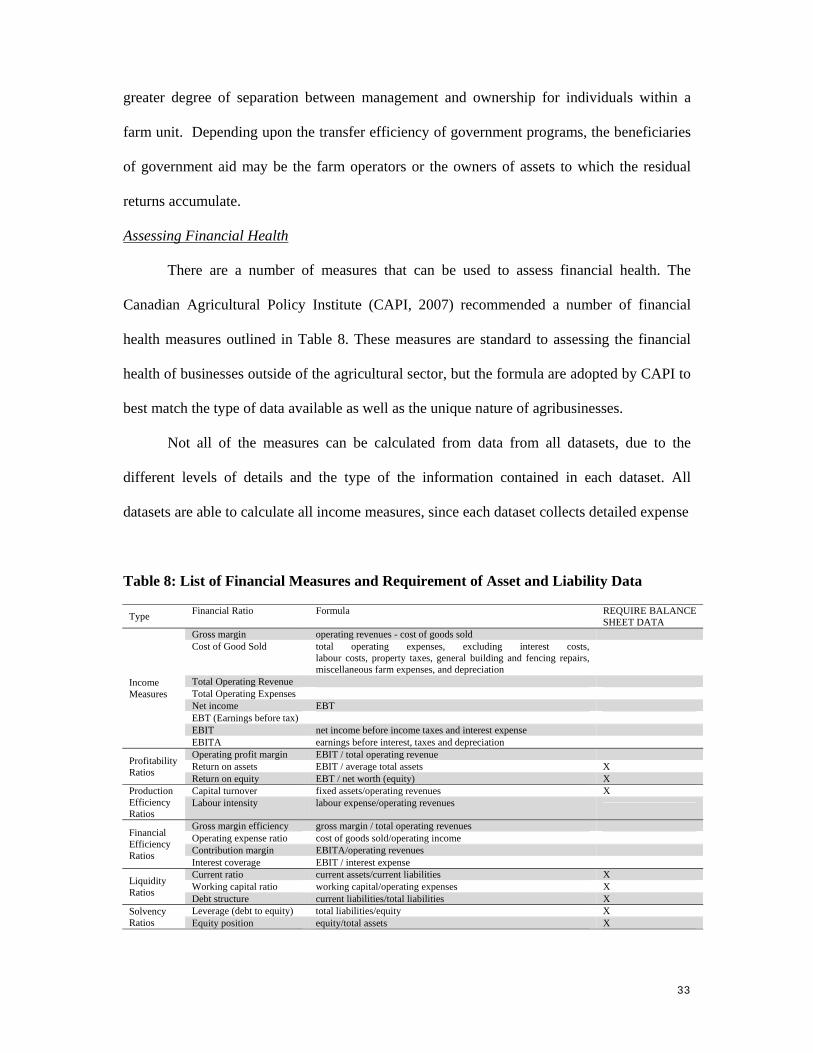
There are a number of measures that can be used to assess financial health. The
Canadian Agricultural Policy Institute (CAPI, 2007) recommended a number of financial
health measures outlined in Table 8. These measures are standard to assessing the financial
health of businesses outside of the agricultural sector, but the formula are adopted by CAPI to
best match the type of data available as well as the unique nature of agribusinesses.
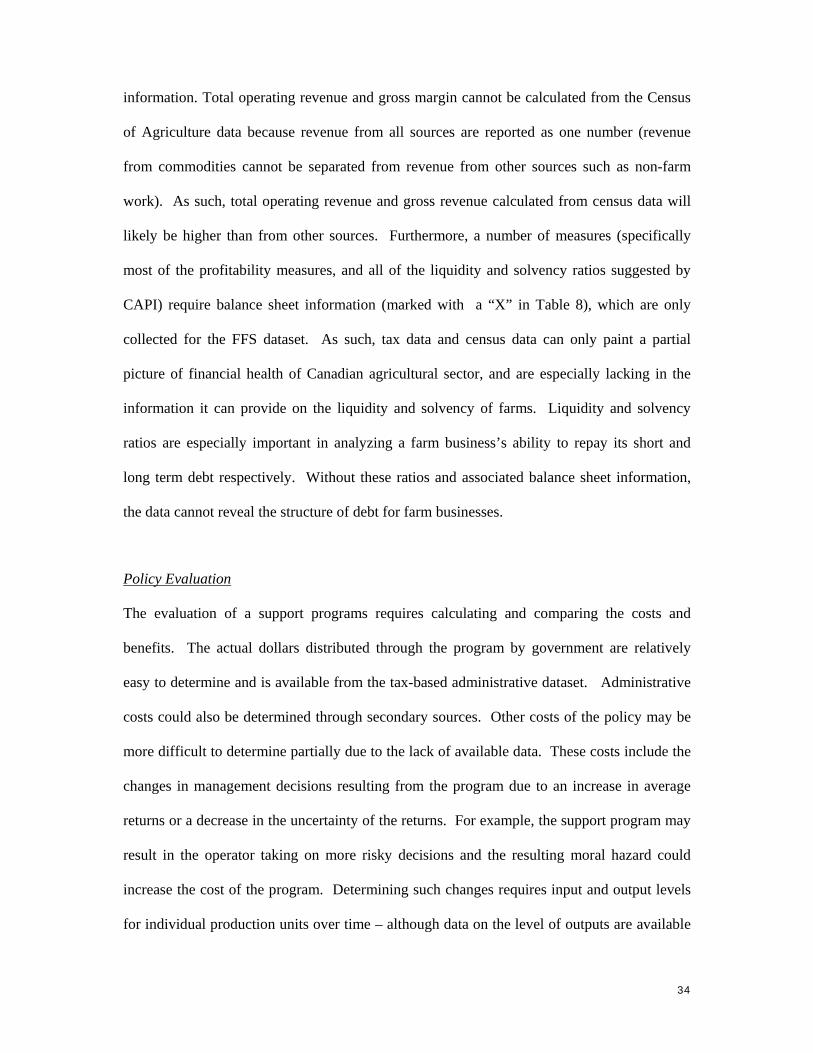
Not all of the measures can be calculated from data from all datasets, due to the
different levels of details and the type of the information contained in each dataset. All
datasets are able to calculate all income measures, since each dataset collects detailed expense
Table 8: List of Financial Measures and Requirement of Asset and Liability Data
Type Financial Ratio Formula REQUIRE BALANCE
SHEET DATA
Income Measures
Gross margin operating revenues - cost of goods sold Cost of Good Sold total operating expenses, excluding interest costs,
labour costs, property taxes, general building and fencing repairs, miscellaneous farm expenses, and depreciation
Total Operating Revenue Total Operating Expenses Net income EBT EBT (Earnings before tax) EBIT net income before income taxes and interest expense EBITA earnings before interest, taxes and depreciation
Profitability Ratios
Operating profit margin EBIT / total operating revenue Return on assets EBIT / average total assets X Return on equity EBT / net worth (equity) X
Production Efficiency Ratios
Capital turnover fixed assets/operating revenues X Labour intensity labour expense/operating revenues
Financial Efficiency Ratios
Gross margin efficiency gross margin / total operating revenues Operating expense ratio cost of goods sold/operating income Contribution margin EBITA/operating revenues Interest coverage EBIT / interest expense
Liquidity Ratios
Current ratio current assets/current liabilities X Working capital ratio working capital/operating expenses X Debt structure current liabilities/total liabilities X
Solvency Ratios
Leverage (debt to equity) total liabilities/equity X Equity position equity/total assets X
34
information. Total operating revenue and gross margin cannot be calculated from the Census
of Agriculture data because revenue from all sources are reported as one number (revenue
from commodities cannot be separated from revenue from other sources such as non-farm
work). As such, total operating revenue and gross revenue calculated from census data will
likely be higher than from other sources. Furthermore, a number of measures (specifically
most of the profitability measures, and all of the liquidity and solvency ratios suggested by
CAPI) require balance sheet information (marked with a “X” in Table 8), which are only
collected for the FFS dataset. As such, tax data and census data can only paint a partial
picture of financial health of Canadian agricultural sector, and are especially lacking in the
information it can provide on the liquidity and solvency of farms. Liquidity and solvency
ratios are especially important in analyzing a farm business’s ability to repay its short and
long term debt respectively. Without these ratios and associated balance sheet information,
the data cannot reveal the structure of debt for farm businesses.
Policy Evaluation
The evaluation of a support programs requires calculating and comparing the costs and
benefits. The actual dollars distributed through the program by government are relatively
easy to determine and is available from the tax-based administrative dataset. Administrative
costs could also be determined through secondary sources. Other costs of the policy may be
more difficult to determine partially due to the lack of available data. These costs include the
changes in management decisions resulting from the program due to an increase in average
returns or a decrease in the uncertainty of the returns. For example, the support program may
result in the operator taking on more risky decisions and the resulting moral hazard could
increase the cost of the program. Determining such changes requires input and output levels
for individual production units over time – although data on the level of outputs are available
35
in provincial-level administrative data, the level of inputs recorded cannot be separated by
farm enterprises (i.e. fed crop input for an operation with both dairy and beef is reported as
one number and not reported by separate enterprises). Data on input output levels for a
continuous sample are also not available at the national level, as neither the FFS nor the
Census of Agriculture generate continuous samples.
The benefits of the support program are more difficult to ascertain than the costs and
also require the use of panel data to calculate. The benefits include the increased level of
investment spurred by the reduction in uncertainty, which can subsequently increase the
efficiency of the unit of production compared to its competitors. Determining whether the
program acted as a true safety net and kept productive units viable during a temporary set-
back or if it kept unproductive units in the sector would be difficult to determine, especially
since the data for operations.
6. Conclusions
Canadian governments collect data on the agricultural sector through a variety of surveys,
income tax filings, and support program applications. The data on the characteristics of the
production units along with the inputs used and outputs generated in aggregate by these units
is publically available for use by private firms and policy makers. Whether the data is of
value to either of these groups depends on the types of decisions being made, the information
required to make the decision, the relationship between data and that required information,
and the improvement in the outcome of the decisions made.
The all-encompassing definition of a census farm provides the benchmark for the
ongoing survey program to generate the estimates of aggregate commodity supply and allow
for efficient price discovery in competitive markets, which is arguably the major value of an
agricultural statistics system. The resulting prices are also collected and made available but
36
there is growing concern about the lack of price data for contracted commodities. The farm
and rural population characteristics are also adequately portrayed through the linkage of the
Census of Agriculture with the long-form Census of Population (up to 2006) and the
voluntary National Household Survey in 2011.
While the data on aggregate production, prices and population provide an accurate
descriptive measure of the agricultural sector for use by the private and public sector, there
are gaps in the demand of decision makers and the supply of data on the units of production
within agriculture. The reporting of aggregate numbers needs to recognize the growing
heterogeneity across production units. The AAFC typology captures different size and
motivation for units of production but broad inferences on the sector based on this
characterization must recognize that it is only for unincorporated farms. These farms tend to
be smaller and represent a shrinking percentage of the sector. While incorporated farms are
becoming common place and produce the majority of farm cash receipts, little is known about
the roles of individuals within these units. The growing complexity within agricultural
production units extends to the relationships with these units back to input suppliers and
forward to processors. These components of the supply chain are becoming intricately linked
over time and these linkages cannot be presently described with the publically available data
on the sector.
The demands for data to determine the need, design, and evaluation of public policy
are narrower than the broad requirements by private and public users for aggregate production
numbers. However, the data requirements are greater. Farm support programs are meant as a
safety net for viable farms in times of unexpected need so the first step involves assessing
financial health, and determining which units are competitive and require only short-term aid.
Information from an income statement and balance sheet are required along with input and
output levels by farm units over time. No single data set supplies all the data necessary to
37
determine need and effect of farm support programs. Performance measures based on tax
data are limited to production margin so this data, while detailed in many respects, lacks
information on assets/liabilities, inputs /outputs, and demographics. The later may become
important if future support programs are targeted to “active” farms as has been proposed in
the US.
The proposal to consider the individuals behind a unit of production in the
determination of support eligibility would drive a large gap between data demands and the
current supply of publically provided data. The potential change reflects the growing
heterogeneity of the agricultural sector. The initial focus on the unit of production was
appropriate for all users of the data. The unit of production was the farm and it was generally
operated by a single farmer and it supported a single farm family. The distinction between the
three components was mute and data gathered on the operational unit provided an adequate
description of the sector including the financial well-being of the farm and the farm
household. However, this homogenous unit of production is no longer; many individuals can
be involved in the operation of a farm and many farms can be operated by a single individual.
Those individuals are also likely to have other sources of income aside from farming. This
growing heterogeneity forces the objectives of agricultural policy to be clearly specified, i.e.
efficiency vs. equity, but the political rhetoric has yet to catch up with the changes as the
terms farm, farmer, and farm family are interchanged as if they were still one. The growing
distinction between them may result in changes in the nature of the data collected on the
sector.
38
References
Babcock, B.A., 1990. “The Value of Weather Information in Market Equilibrium” American Journal of Agricultural Economics, 72(1): 63-72.
Gervais, J.-P., R. Lambert, and F. Boutin-Dufresne. 2001. “On the Demand for Information Services: An Application to Lowbush Blueberry Producers in Eastern Canada” Canadian Journal of Agricultural Economics, 49(2): 217–232
Isengildina-Massa, O., Irwin, S. H., Good, D. L. and Gomez, J. K. 2008. “Impact of WASDE Reports on Implied Volatility in Corn and Soybean Markets” Agribusiness, 24(3): 473–490.
Just, D.R., S.A. Wolf, S. Wu, and D. Zilberman. 2002. “Consumption of Economic Information in Agriculture” American Journal of Agricultural Economics, 84(1): 39-52.
Just, D.R., S.A. Wolf, and D. Zilberman. 2006. “Effect of Information Formats on Information Services: Analysis of Four Selected Agricultural Commodities in the USA” Agricultural Economics, 35(3): 289-301.
Kislev, Y., and W. Peterson. 1982. “Prices, Technology and Farm Size.” Journal of Political Economy, 90(3): 578–595.
Robinson, D., H. Yu, W.P. Zellner, and E.W. Felten. 2009. “Government Data and the Invisible Hand.” Yale Journal of Law and Technology, 11(1): 160-175.
Salin, V., A.P. Thurow, K.R. Smith and N. Elmer. 1998. “Exploring the Market for Agricultural Economics Information: Views of Private Sector Analysts.” Review of Agricultural Economics, 20(1): 114-124.
Swinton, S.M., and R.P. King. 1994. “The Value of Pest Information in a Dynamic Setting: The Case of Weed Control.” American Journal of Agricultural Economics, 76(1): 36-46.
Thornsbury, S., K. Davis, and T. Minton 2003. “Adding Value to Agricultural Data: A Golden Opportunity” Review of Agricultural Economics, 25(2): 550-568.
Timko, M., and R.M.A. Loyns. 1989. “Market Information Needs for Prairie Farmers.”
Canadian Journal of Agricultural Economics, 37(4): 609–627.
Wolf, S., D. Just, and D. Zilberman. 2001. “Between Data and Decisions: The Organization of Agricultural Information Systems.” Research Policy, 30(1): 121-141.