Embed Size (px)
Citation preview

Demographic Analysis
Age and Sex Structure:
Smoothing Techniques to Correct
for Age Misreporting
1

2

Age Misreporting and Smoothing -
Introduction
In this lesson, we consider techniques for smoothing the
population age distribution when there are errors in age
reporting.
What do we hope to accomplish by smoothing?
Reasons to smooth, and not to smooth
Smoothing adjusts for misreporting, not underreporting
Types of smoothing methods:
Light vs. strong
Preserve vs. modify slightly the population size
Tips for deciding whether smoothing is needed and
which method might be most appropriate
3

Why might we want to smooth?
Reasons to smooth:
When ages are genuinely misreported
Planning and policies that require accurate counts
by age may be adversely affected. Examples:
Children entering school system
Young males reaching military draft age
Qualification for older age public benefits
Flawed age-sex structures, when projected into the
future, will also be flawed
Flawed age counts used as denominators in
demographic rates (e.g. child mortality) may bias
those rates
4

Why might we not want to smooth?
Reasons not to smooth:
Sometimes odd-looking fluctuations in population
age distributions are real – not due to misreporting.
The most common features of age misreporting –
digit preference – can be addressed by aggregating
the population across 5-year or 10-year ages groups.
Age misreporting might be confined to a particular
age group.
Smoothing assumes age misreporting, not under-
reporting. If there is age/sex-specific under-
reporting, smoothing inappropriately spreads it out.
5
Methods for Correcting Age Misreporting
Once the decision has been made to use smoothing
to correct for age misreporting, there are several
varieties available to do so.
Most smoothing techniques involve the application of
a formula or function to the original data.
Misreporting involves a shift from one’s actual age to
another age, typically an adjacent age group.
Formulas correct for that bias by using weighted
averages based on counts at each age group as well
as adjacent age groups.
6

Methods for Correcting Age Misreporting -Types
Light or Strong?
Smoothing techniques may be lighter or stronger
depending on the formulas that construct the weighted
averages:
Light Smoothing – formulas that give the greatest
weight to what was reported for the age group in
question and smallest weight to adjacent age groups
Strong Smoothing – formulas that give greater weight
to adjacent age counts and/or over wider age intervals.
Resulting pattern does not follow the contours of
reported data as well as lighter smoothing.
7

8
0
200
400
600
800
1000
1200
5-9 10-14 15-19 20-24 25-29 30-34 35-39
Example of Lighter vs. Stronger Smoothing of Age Data
Reported Data
Lighter smoothing
Stronger Smoothing
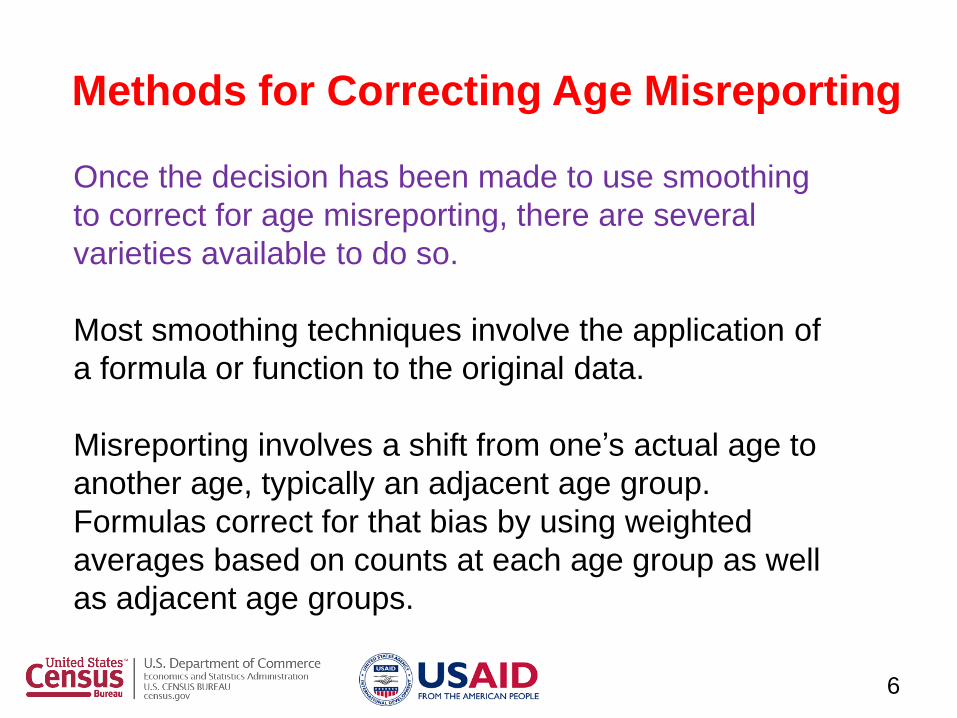
Arriaga’s Strong Smoothing Formula
9

Smoothing Algorithms Compared
10

Smoothing Algorithms Compared
11

Smoothing Algorithms Compared
12

Methods for Correcting Age Misreporting -Types
Modify or Preserve Population Totals?
Most smoothing techniques can also be classified into
two main categories:
Techniques which accept the population in each
10-year age group and separate it into two 5-year
age groups without modifying the total population
size; and
Techniques which smooth the 5-year age groups
and, in the process, modify slightly ( increasing or
decreasing) the population being smoothed.
13
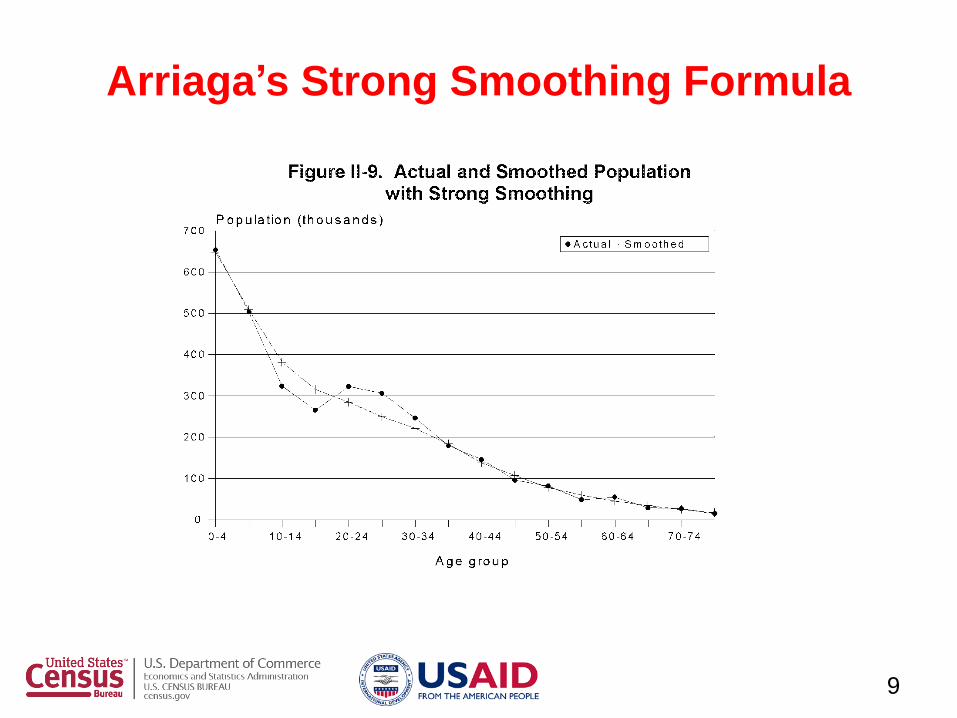
Methods that Do or Do Not Preserve
Population Totals
Methods that preserve the original total:
The Carrier-Farrag and Karup-King-Newton
(Carrier and Farrag, 1959) formulas do not
separate the first or last 10-year age groups.
The Arriaga (1968) formula.
Arriaga’s “strong smoothing” formula doesn’t, but
the results can be adjusted to agree with the total
population over the range that is smoothed.
Methods that alter the total slightly:
The United Nations method (1956, p. 12)
14

15
60
80
100
120
140
160
180
5-9 15-19 25-29 35-39 45-49 55-59 65-69
REP CF KKN ARR UN STR
India - Female Age Ratios by Age: 1961 Census
REPORTED vs. SMOOTHED

16
80
85
90
95
100
105
110
115
120
0-4 10-14 20-24 30-34 40-44 50-54 60-64 70-74
REP CF KKN ARR UN STR
India - Sex Ratios by Age: 1961 Census
REPORTED vs. SMOOTHED (based on Male % Female Pops.)

The Carrier-Farrag Formula
The Carrier-Farrag technique is based on the
assumption that the relationship of a 5-year age
group to its constituent 10-year age group is an
average of similar relationships in three consecutive
10-year age groups.
5Px+5 = 10Px / [1 + (10Px-10 / 10Px+10 )1/4 ] and
5Px = 10Px - 5Px+5
where:
5Px+5 represents the population at ages x+5 to x+9;
10Px represents the population at ages x to x+9; and
5Px represents the population at ages x to x+4.
17
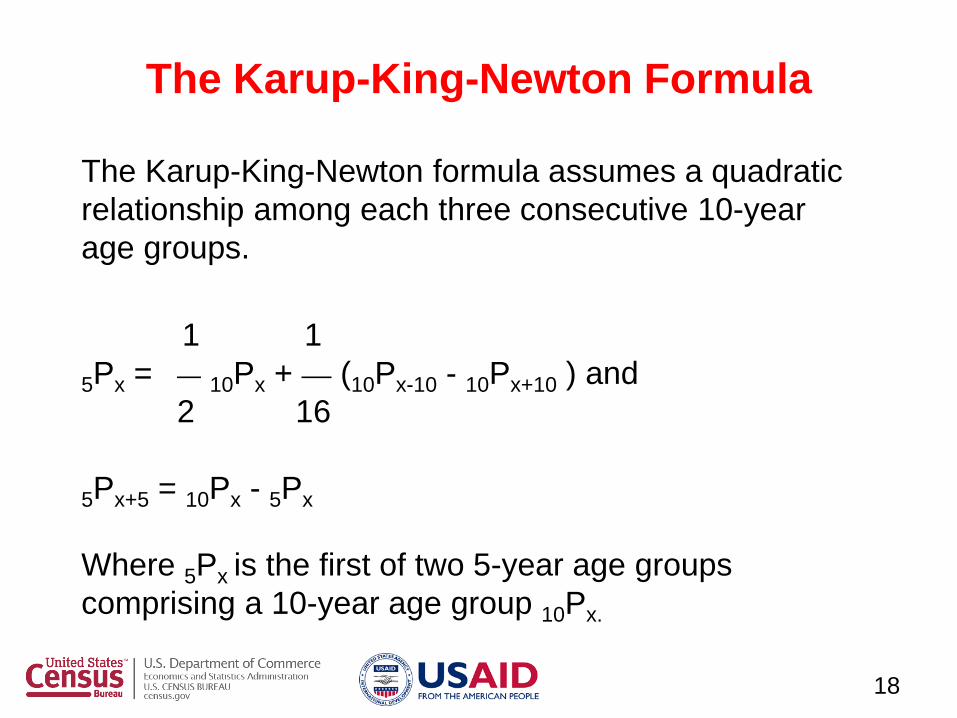
The Karup-King-Newton formula assumes a quadratic
relationship among each three consecutive 10-year
age groups.
1 1
5Px = 10Px + (10Px-10 - 10Px+10 ) and
2 16
5Px+5 = 10Px - 5Px
Where 5Px is the first of two 5-year age groups
comprising a 10-year age group 10Px.
The Karup-King-Newton Formula
18

Arriaga’s Light Smoothing Formula
Arriaga’s formula assumes that a second degree
polynomial passes by the midpoint of each three
consecutive 10-year age groups and then integrates
a 5-year age group.
In the PAS workbook AGESMTH the 10-year age
groups start with age group 10-19. However, if there
is strong age heaping on ages ending in 0, then the
excess 10-year olds will be distributed over the ages
10-19, while in fact some should be distributed to
ages below 10.
The new workbook ARRSM5 does this by smoothing
starting with the 10-year age group 5-14.
19

When the 10-year age group to be separated is the
central group of three, the following formulas (Arriaga,
1968) are used:
5Px+5 = (-10Px-10 + 11 10Px + 2 10Px+10 ) / 24 and
5Px = 10Px - 5Px+5
where:
5Px+5 is the population ages x+5 to x+9;
10Px is the population ages x to x+9; and
5Px represents the population at ages x to x+4.
Arriaga’s Light Smoothing Formula
20

When the 10-year age group to be separated is an
extreme age group (the youngest or the oldest), the
formulas are different. For the youngest age group, the
following formulas are used:
5Px+5 = (8 10Px + 5 10Px+10 - 10Px+20 ) / 24 and
5Px = 10Px - 5Px+5
For the oldest age group, the coefficients are reversed:
5Px = (- 10Px-20 + 5 10Px-10 + 8 10Px) / 24 and
5Px+5 = 10Px - 5Px
Arriaga’s Light Smoothing Formula
21

United Nations (1956, p. 12) developed the following
formula:
5P'x = (- 5Px-10 + 4 5Px-5 + 10 5Px + 4 5Px+5 - 5Px+10 ) /16
where:
5P'x represents the smoothed population ages x to x+4.
The United Nations Formula
22

If a more aggressive smoothing is desired (Arriaga,
1968), this can be achieved with the following
formula:
10P'x = (10Px-10 + 2 10Px + 10Px+10 ) / 4
Where:
10P'x represents the smoothed population
ages x to x+9.
Arriaga’s Strong Smoothing Formula
23

After getting the new smoothed 10-year age groups,
the results can be adjusted to add up to the total for
ages 10-69. These adjusted populations for 10-year
age groups can then be split into 5-year ages using
one of several formulas. AGESMTH uses the Arriaga
quadratic formula.
Arriaga’s Strong Smoothing Formula
24

Smoothing Single Years of Age
• In cases where there is very strong age-
heaping on certain ages (e.g., 0’s and 1’s),
it may make sense to try to smooth the
population by single years of age.
• Alternatively, the smoothed 5-year ages
can be split into single years of age using
various methods.
25

Smoothing Single Years of Age
• The NewPAS workbook POP1SM.xls uses
a weighted moving average to get a
smoothed population by single years of
age.
• The workbook allows the user to input the
desired weights. Different weights will
result in more or less smoothing.
26
Smoothing Single Years of Age
27
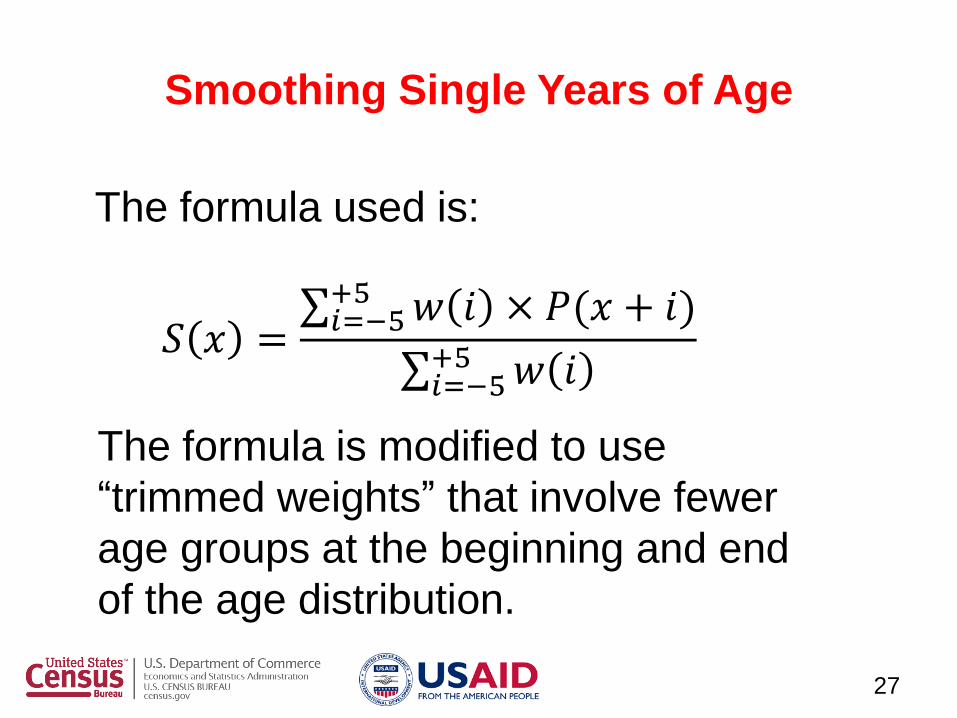
𝑆 𝑥 = 𝑖=−5+5 𝑤 𝑖 × 𝑃(𝑥 + 𝑖)
𝑖=−5+5 𝑤 𝑖
The formula used is:
The formula is modified to use
“trimmed weights” that involve fewer
age groups at the beginning and end
of the age distribution.

Smoothing Single Years of Age
• The default weights, w(i) are:
28
Relative age Weight Trimmed weights
Sum 100.00 100.00 100.00 100.00 100.00
-5 0.00
-4 4.00 4.00
-3 8.00 8.00 6.25
-2 12.00 12.00 12.50 11.11
-1 16.00 16.00 18.75 22.22 25.00
0 20.00 20.00 25.00 33.33 50.00
1 16.00 16.00 18.75 22.22 25.00
2 12.00 12.00 12.50 11.11
3 8.00 8.00 6.25
4 4.00 4.00
5 0.00

Smoothing Single Years of Age
29
Default Weights for Haiti: 2003

Smoothing Single Years of Age
• Alternative weights for Haiti 2003
30
Relative age Weight Trimmed weights
Sum 90.00 90.00 90.00 90.00 90.00
-5 4.50
-4 9.00 10.00
-3 9.00 10.00 12.86
-2 9.00 10.00 12.86 18.00
-1 9.00 10.00 12.86 18.00 30.00
0 9.00 10.00 12.86 18.00 30.00
1 9.00 10.00 12.86 18.00 30.00
2 9.00 10.00 12.86 18.00
3 9.00 10.00 12.86
4 9.00 10.00
5 4.50

Smoothing Single Years of Age
31
Alternative Weights for Haiti: 2003

Smoothing Single Years of Age
32
Default Weights for Haiti: 2003

To Smooth or Not to Smooth, and if So,
How? - Tips
The decision must be made on a case by case basis
given the context at hand.
Step 1 - Look at your data. Graph the age and sex
distributions using programs discussed earlier
(PYRAMID, Pyr2, GRPOP-YB, AGESEX).
In general, a regular saw-tooth pattern across
successive age groups provide a good rationale for
smoothing.
Comparisons across successive censuses and a
knowledge of past trends of mortality, fertility, and
migration will help in appraising the accuracy of the
reported age and sex structure of the population.
33

Caution – Since strong smoothing may erase actual
demographic history, a decision to use it should be
considered very carefully.
Caution – Even if smoothing produces more
plausible age distributions, it may not improve
distortions in sex ratios by age (and vice versa).
Caution - The population age distribution may not
need to be fully smoothed across all age groups if
only part of it is considered problematic.
Caution – If underreporting exists at a particular
age, instead of smoothing one may need “filling.”
34
To Smooth or Not to Smooth? - Cautions

Population Smoothing Software
• PAS
– AGESMTH.xls
• NewPAS
– ARRSM5.xls
– POP1SM.xls
35

Exercises
• Apply the various smoothing methods to
the results of two censuses from your
country (if possible).
• Decide which method (if any) seems to
work best for your data.
• Does your data need smoothing at all
ages?
36