Embed Size (px)
Citation preview

Demographic Trends and the Real InterestRate
Noemie Lisack, Rana Sajedi, and Gregory Thwaites
Discussion by Sebnem Kalemli-Ozcan
1 / 20

What does the paper do?
Quantifies the role of demographic change (aging) on thedecline in global (advanced country) real interest rates
Investigate the effect of aging on house prices, household debt
Main finding: demographics can explain a large part of thedecline in real rates and rise in house prices and householddebt since 1980s.
Projection: trends will persist given the slow movingpersistence process of demographics; global imbalances willget worse
2 / 20

General Impression
I like the paper.
I am very sympathetic to taking demographics seriously as oneof the key reasons behind the decline in real rates.
I am going to highlight some modeling and data issues which,upon dealing with, will help to clarify and strengthen thepaper.
3 / 20

POINT 1: Savings Rate or Wealth Accumulation?
I believe the authors want wealth but they have life cyclesavings
What are the issues with a savings focus?
4 / 20

Shifts in Demand and Supply for Funds
Figure 3.5. Real Interest Rate and Shifts in Demand forand Supply of Funds
Source: IMF staff illustration.
Realrate
(percent)
Funds(U.S. real dollars, bond market)
Supply
Supply'
Demand
Demand'
Source: 2014, IMF WEO
5 / 20

General framework for the global decline in real rates
Investment Decline: The decline in relative price ofinvestment—matches the timing of decline starting in 1980s
Saving Increase: Savings of China—post 2000 period
S = Spriv + Spub Low public saving/high public debt depressprivate saving (OLG with no RE)–role of FP
No role for aging since aging decreases saving in standardPIH/life cycle model so real rates rise
Monetary Policy Easing: Important role since 1980s both forshort and long term rates
Portfolio Shifts: Important role since 2000s given demand forsafe US assets
6 / 20

Investment
18
20
22
24
26
28
30
32
34
1980 85 90 95 2000 05 10 13
Figure 3.6. Investment-to-GDP Ratios(Percent of GDP)
Global nominal investment (saving)-to-GDP ratioAdvanced economy nominal investment-to-GDP ratioEmerging market economy nominal investment-to-GDP ratio
Sources: Haver Analytics; Organization for Economic Cooperation and Development; and IMF staff calculations.
Source: 2014, IMF WEO
7 / 20

Savings
0
5
10
15
20
25
30
35
40
1980 83 86 89 92 95 98 2001 04 07 10 13
10
15
20
25
30
35
40
1980 85 90 95 2000 05 10 13
Figure 3.8. Saving Shifts in Emerging Markets
Advanced economiesEMEs
1. Nominal Saving-to-GDP Ratios(percent of GDP)
2. Saving in Total GDP for Emerging Markets(1980–2013, percent)
EMEsChinaOil exportersOther EMEs
20
25
30
35
40
2001 03 05 07 09 11 1330
35
40
45
50
55
60
2001 03 05 07 09 11 13
Actual Predicted Counterfactual
3. Emerging Markets 4. China
Contribution of Higher Growth to Increased Saving(percent of GDP, 2001–13)
Sources: Organization for Economic Cooperation and Development; World Bank, World Development Indicators database; and IMF staff calculations.Note: EMEs = emerging market economies; Actual = actual saving-to-GDP ratio; Predicted = predicted saving-to-GDP ratio obtained by regressing the EME saving rate on its lagged value and EME real GDP growth; Counterfactual = conditional forecast of the saving rate assuming real GDP growth is constant at the average value of the late 1990s.
Source: 2014, IMF WEO
8 / 20

Savings: Role of Public Savings and AsiaAlfaro et al., 2014 JEEA
Sudan
Senegal
Kenya
Mali
Benin
Ethiopia
Madagascar
Niger
Mozambique
Chad
Mauritius
South Africa
Uganda
Tanzania
Guinea
GhanaRwanda
Malawi
Congo, Rep.
Zambia
Burkina FasoCameroon
Togo
Cote d’Ivoire
Sri Lanka
Philippines
Thailand
Papua New Guinea
Bangladesh
India
Malaysia
Pakistan
Nepal
Indonesia
China
Albania
Poland
Armenia
Romania
Turkey
Bulgaria
Ukraine
LithuaniaBelarus
Latvia
Kyrgyz Republic
Mexico
Honduras
Colombia
Paraguay
Argentina
Costa Rica
Venezuela, RB
Bolivia
Uruguay Chile
El SalvadorBrazil
Ecuador
JamaicaPanama
Peru
Dominican Republic
Guatemala
Egypt, Arab Rep.
Jordan
Yemen, Rep.Morocco
Iran, Islamic Rep.Tunisia
Sri Lanka
Philippines
Thailand
Papua New Guinea
Bangladesh
India
Malaysia
Pakistan
Nepal
Indonesia
China
Sudan
Senegal
Kenya
Mali
Benin
Ethiopia
Madagascar
Niger
Mozambique
Chad
Mauritius
South Africa
Uganda
Tanzania
Guinea
GhanaRwanda
Malawi
Congo, Rep.
Zambia
Burkina FasoCameroon
Togo
Cote d’Ivoire
−10
−5
05
10A
vera
ge G
over
nmen
t Sav
ings
/GD
P (%
), 1
990−
2004
−2 0 2 4 6 8Average per capita GDP Growth (%), 1990−2004
Legend:Red dash line − Developing Countries excluding ChinaRed letters − Developing Countries in AsiaGreen letters − Developing Countries in Africa
9 / 20

Savings: No Role for EM Private SavingAlfaro et al. 2014 JEEA
Sudan
Senegal
Kenya
Mali
Benin
Ethiopia
Madagascar
Niger
Mozambique
Chad
Mauritius
South Africa
Uganda
TanzaniaGuinea
GhanaRwanda
Malawi
Congo, Rep.
Zambia
Burkina FasoCameroon
TogoCote d’Ivoire
Sri LankaPhilippines
Thailand
Papua New Guinea
Bangladesh
IndiaMalaysiaPakistan
Nepal
Indonesia
China
Albania
PolandArmenia
Romania
Turkey
Bulgaria
Ukraine
Lithuania
Belarus
Latvia
Kyrgyz Republic
MexicoHonduras
Colombia
Paraguay
ArgentinaCosta Rica
Venezuela, RB
Bolivia
Uruguay
ChileEl Salvador
Brazil
EcuadorJamaica
PanamaPeru
Dominican RepublicGuatemala
Egypt, Arab Rep.Jordan
Yemen, Rep.MoroccoIran, Islamic Rep.
Tunisia
Sri LankaPhilippines
Thailand
Papua New Guinea
Bangladesh
IndiaMalaysiaPakistan
Nepal
Indonesia
China
Sudan
Senegal
Kenya
Mali
Benin
Ethiopia
Madagascar
Niger
Mozambique
Chad
Mauritius
South Africa
Uganda
TanzaniaGuinea
GhanaRwanda
Malawi
Congo, Rep.
Zambia
Burkina FasoCameroon
TogoCote d’Ivoire
010
2030
40A
vera
ge P
riva
te S
avin
gs/G
DP
(%),
199
0−20
04
−2 0 2 4 6 8Average per capita GDP Growth (%), 1990−2004
Legend:Red dash line − Developing Countries excluding ChinaRed letters − Developing Countries in AsiaGreen letters − Developing Countries in Africa
10 / 20

Public Savings in Asia and Demand for Safe Assets
0.0
0.5
1.0
1.5
2.0
2.5
3.0
3.5
0
5
10
15
20
1990 96 2002 08 14
Figure 3.12. Portfolio Shifts and Relative Demand for Bonds versus Equity
Sources: Beltran and others (2013); and IMF staff calculations.Note: EMEs = emerging market economies.
Change in foreign exchange reserves (left scale)Gross saving(right scale)
1. Percent of Global GDP
0
1
2
3
4
5
6
1984 90 96 2002 08 11
ChinaOther EMEsTotal
2. Foreign Holdings of U.S.Government Securities(trillions of U.S. dollars)
0
1
2
3
4
5
6
1984 90 96 2002 08 11
OfficialTotal
3. Foreign Holdings of U.S.Government Securities(trillions of U.S. dollars)
0
1
2
3
4
5
1984 90 96 2002 08 11
Government securitiesPrivate securitiesTotal
4. Foreign Official Holdings ofU.S. Securities(trillions of U.S. dollars)
Source: 2014, IMF WEO
11 / 20

K/Y Ratio rather than Savings
In a life cycle model, easy to get a rise in K/Y ratio withdemographics and get an associated decline in real rates
Can we add to the model to make wealth accumulationcentral given increases in longevity?
12 / 20

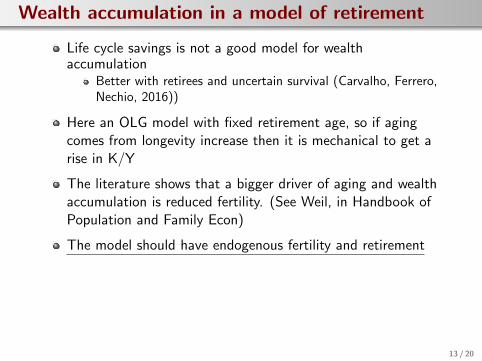
Wealth accumulation in a model of retirement
Life cycle savings is not a good model for wealthaccumulation
Better with retirees and uncertain survival (Carvalho, Ferrero,Nechio, 2016))
Here an OLG model with fixed retirement age, so if agingcomes from longevity increase then it is mechanical to get arise in K/Y
The literature shows that a bigger driver of aging and wealthaccumulation is reduced fertility. (See Weil, in Handbook ofPopulation and Family Econ)
The model should have endogenous fertility and retirement
Then the role of pensions, annuities become importanttogether with the role of baby-boomers: not every country haspay-as-you-go systems
Abel and Blanchard (1983); Cutler et al. (1990); Auerbachand Kotlikoff (1987); Lim and Weil (2003)
13 / 20

POINT 2: Evaluating Model’s Success
Authors are upfront on being not the only explanation butclaim a large fraction of the decline explained.
14 / 20

Calibration
15 / 20
Calibration
Mismatch on timing; demographics is slow moving, reductionin interest rate more sudden–calibrate to 5 year intervals?
Or use US decennial censuses so initial point can be 1940, useonly demographics, no financials and see how muchnon-targeted rates can be explained by the model?
Nothing is NOT targeted it seems–distributions of targetedand non-targeted variables will help
Figure 5 and 6 are all targeted so how do we evaluate modelsuccess?
Open economy dimension is important, maybe calibrationshould focus on that extension, instead of closed economy
Recent data shows global imbalances are narrowing, the modelimplies they will get worse via demographics, important toquantify this effect on real rates.
16 / 20

POINT 3: Measurement—What are the real rates?
17 / 20

What are the real rates?
King and Low (2014) for real rates or Rachel and Smith(2015) for natural interest rate? (not equal unless monetarypolicy is neutral)
Directly observable real rates: yields on inflation-indexedbonds, only available for a handful of countries (countries hereare ok probably)
Approximate real rates: Difference between nominal rates andinflation expectations
At the end what we want is cost of capital
18 / 20

Real Rates and Cost of Capital
–8
–6
–4
–2
0
2
4
68
10
1970 75 80 85 90 95 2000 05 10 12
Figure 3.3. Real Interest Rates, Real Returns on Equity, andCost of Capital(Percent a year)
Three-month real rateTen-year real rateTerm spread
1. Short- and Long-Term Global Real Interest Rates
0
1
2
3
4
5
6
7
8
9
1973 78 83 88 93 98 2003 08 13
2. Expected Real Returns on Equity
United States United Kingdom
0.0
0.5
1.0
1.5
2.0
2.5
3.0
3.54.0
4.5
1991–2000 2001–07 2008–13
3. Global Real Interest Rates and Cost of Capital
Global real interest rateGlobal cost of capital
Sources: Bloomberg, L.P.; Haver Analytics; IMF, International Financial Statistics database; Organization for Economic Cooperation and Development; World Bank, World Development Indicators database; and IMF staff calculations.Note: Term spread is defined as the difference between short- and long-term real rates.
19 / 20

Conclusion
This is a great paper!
It made me really think about these issues, a must read forthose who work on these questions
For the next draft, it will help to make the point sharper ifauthors can clarify these points:
Endogenous retirement: fixed retirement age not veryreasonable when aging is due to longevity
Maybe adding endogenous fertility if the aim is to explain thedecline in real rates via wealth accumulation which goes viadeclining births (more important than housing)
Improve the calibration on non targeted moments
Clarify measurement issues
20 / 20