Embed Size (px)
Citation preview
Demographics and Unemployment
Málstofa í Seðlabanka Íslands
9. desember 2002
Tryggvi Thor HerbertssonIoES, University of Iceland
Edmund S. PhelpsColumbia University
Gylfi ZoegaBirkbeck College, University of London

Introduction
• Current research aims at explaining decade-to-decade movements in average unemployment as well as cross-country variation. A consensus appears to be emerging on the importance of the interaction between shocks and unemployment but less so on the nature of the shocks.
• Potential shocks include:– changes in the rate of productivity growth (Pissarides, 1990, 2000; Hoon
and Phelps, 1997),
– skill-biased technological progress (Wood, 1994; Nickell, 1996),
– the world real interest rate (Phelps, 1994; Blanchard and Wolfers, 2000, Nickell, 1999),
– the price of energy (Bruno and Sachs, 1986; Oswald, 1999),
– changes in share of profits (Blanchard and Wolfers, 2000)
– the state of stock market (Phelps, 1999; Fitoussi, Jestaz, Phelps, and Zoega, 2000).

Introduction• The literature has paid surprisingly little attention to demographic factors, in
particular changes in the age structure of the population. Shimer (1999) is a novel exception.
• This paper investigates some possible channels through which a changing age-structure might affect unemployment, in particular:– Compositional effects:
• When the cohorts suffer different unemployment rates, their relative size affects the aggregate unemployment rate and labor force participation.
– Macroeconomic shocks:• The origins. Generations differ in their saving propensities and possibly creativity, as
innovations may come more frequently at certain stages in life. Thus both investment opportunities and the supply of available savings may depend on the age distribution of the population.
• Responsiveness. When an adverse shock hits the economy, the responsiveness of unemployment depends on labor-market institutions such as the duration and level of unemployment benefits and the organization of labor unions. However, demographics can play a role that has so far not received much attention.

Demographic Structure
0.30
0.35
0.40
0.45
0.50
1950 1960 1970 1980 1990 2000 2010 2020 2030 2040 2050
Canada France Germany
Italy Japan UK
USA
The share of prime-aged workers in the total population (defined as the 25-54 year old/total population ratio) in the G7

Age-structure and UnemploymentUnemployment and age-structure,
France 1968-98
0.35
0.40
0.45
0.50
0 5 10 15
Total male unemployment
Rank correlation = 0.97
Unemployment and age-structure,US 1965-98
0.30
0.35
0.40
0.45
0.50
0 2 4 6 8 10 12
Total male unemployment
Rank correlation = 0.41
Unemployment and age-structure, Germany 1971-98
0.35
0.40
0.45
0.50
0 2 4 6 8 10
Total male unemployment
Rank correlation = 0.70
Unemployment and age-structure, Italy 1977-98
0.35
0.40
0.45
0.50
4 5 6 7 8 9 10Total male unemployment
Rank correlation =0.84

Compositional EffectsWhen the cohorts suffer different unemployment rates, their relative size affects the aggregate unemployment rate and labor force participation.

Compositional Effects
0
5
10
15
20
25
1965 1970 1975 1980 1985 1990 1995
15-19 20-24
25-34 35-44
45-54 55+
• Unemployment differs substantially between cohorts (OECD).
Compositional Effects
• Differences in unemployment across cohorts can to some degree be traced to differences in the level of non-wage income. This has many sources:– Accumulated savings in the form of real wealth are normally monotonically
rising in age. – The income of a spouse increases with age so this form of non-wage income is
also rising in age.– The cost of raising children, which initially rises in their age and then falls. As a
result, non-wage income falls initially and then rises again as the children leave the nest.
– Parental support, which is declining in age. – The expected present value of anticipated inheritance which is rising in one’s
own age (becoming less important due to annuitization of wealth).– Social spending such as health care, public education for children, minimum
income support, state pension, etc. is often an important form of non-wage income and depends on age.
Compositional Effects
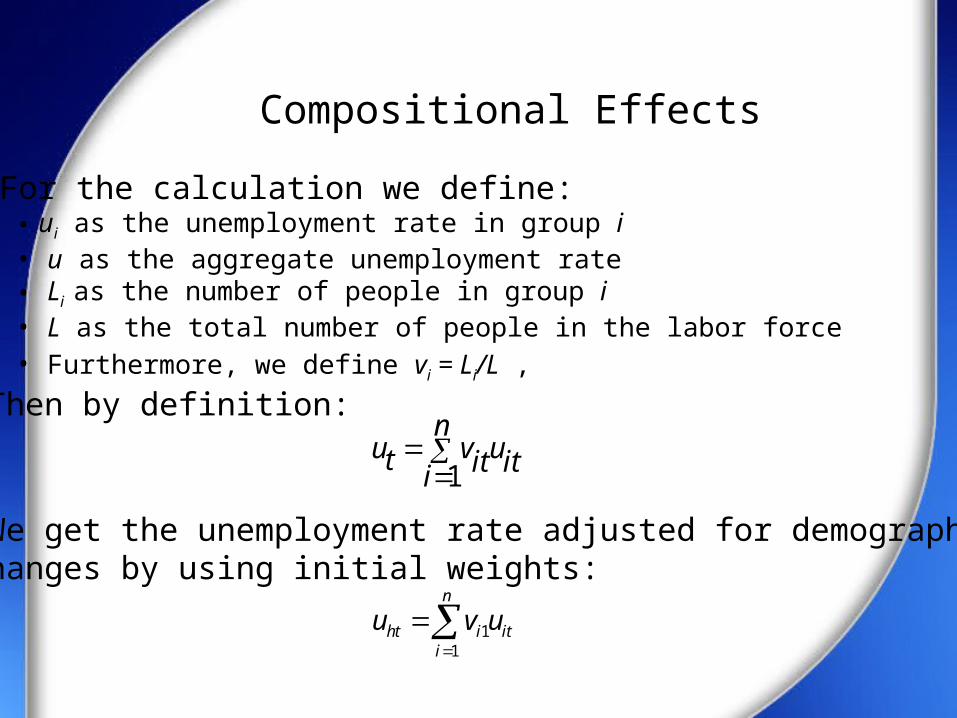
• For the calculation we define:• ui as the unemployment rate in group i• u as the aggregate unemployment rate• Li as the number of people in group i• L as the total number of people in the labor force• Furthermore, we define vi = Li/L ,
•Then by definition:
•We get the unemployment rate adjusted for demographic changes by using initial weights:
1
nu v ut it iti
11
n
ht i iti
u v u
Compositional Effects
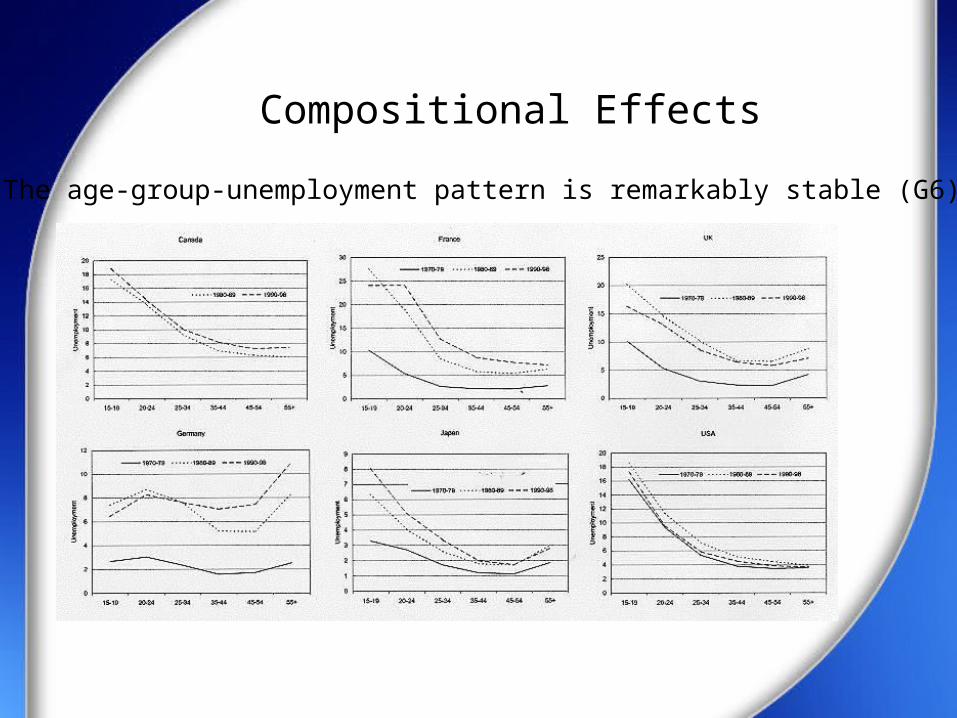
• The age-group-unemployment pattern is remarkably stable (G6):
Compositional Effects
0
1
2
3
4
5
6
7
8
9
10
1965 1970 1975 1980 1985 1990 1995
Un
em
plo
yme
nt
-0.5
-0.4
-0.3
-0.2
-0.1
0.0
0.1
0.2
De
mo
gra
ph
ic Un
em
plo
yme
ntDemographic
Adjusted
Actual
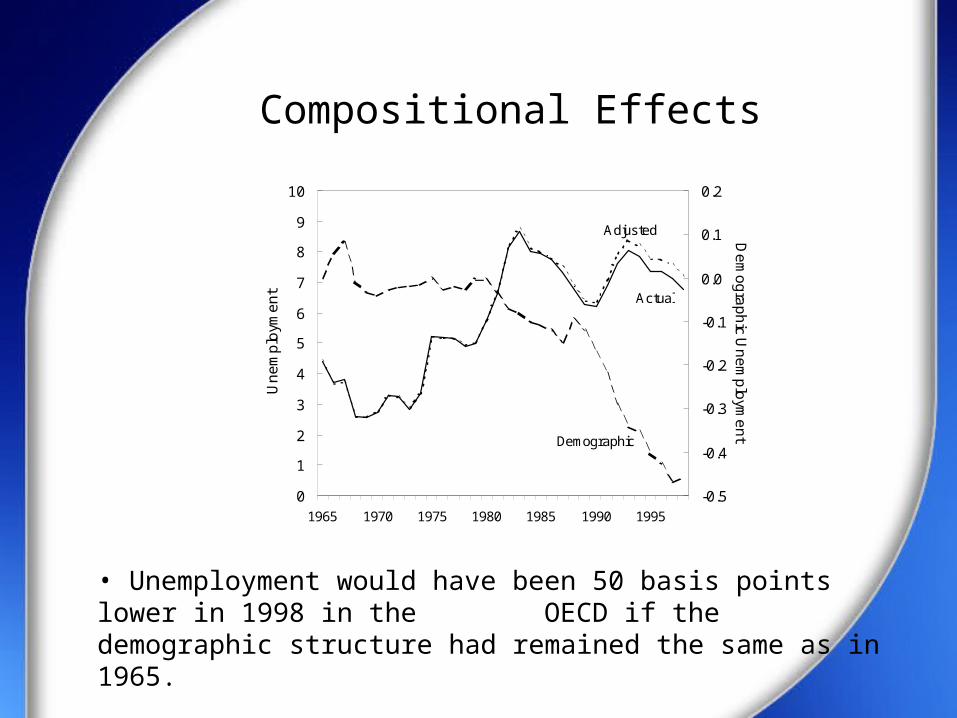
• Unemployment would have been 50 basis points lower in 1998 in the OECD if the demographic structure had remained the same as in 1965.

Participation Rates
– Unemployment is only one side of the coin.
– Changing age structures may also be reflected in changing labor-force participation rather than unemployment.
– In 13 OECD countries, the average labor force participation of 55-64 year-old males fell by more than 12 percentage points between 1979 and 1998.
– The participation rate increased by approximately 5 percentage point for females, resulting in an overall average drop in OECD labor force participation of almost 3 percentage points, cf. Herbertsson and Orszag (2001).

Participation Rates
Cohort nonparticipation rates in Canada
0
20
40
60
80
15-19 20-24 25-34 35-44 45-54 55+
1980-89
1990-98
Cohort nonparticipation rates in France
0
20
40
60
80
100
15-19 20-24 25-34 35-44 45-54 55+
1970-79
1980-89
1990-98
Cohort nonparticipation rates in Germany
0
20
40
60
80
15-19 20-24 25-34 35-44 45-54 55+
1970-79
1980-89
1990-98
Cohort nonparticipation rates in the UK
0
20
40
60
80
15-19 20-24 25-34 35-44 45-54 55+
1970-79
1980-89
1990-98
Cohort nonparticipation rates in the US
0
20
40
60
80
15-19 20-24 25-34 35-44 45-54 55+
1970-79
1980-89
1990-98
Cohort nonparticipation rates in Italy
0
20
40
60
80
100
15-19 20-24 25-39 40-49 50-59 60-64 65+
1970-79
1980-89
1990-98

Participation Rates
Participation rates Canada in 1979-98
70
75
80
85
90
1965 1970 1975 1980 1985 1990 1995
Actual
Adjusted
Participation rates in France 1965-98
65
70
75
80
85
90
1965 1970 1975 1980 1985 1990 1995
Participation rates in Germany 1965-98
70
75
80
85
90
1965 1970 1975 1980 1985 1990 1995
Participation rates Italy in 1965-98
70
75
80
85
90
1965 1970 1975 1980 1985 1990 1995
Participation rates in the UK 1965-98
70
75
80
85
90
1965 1970 1975 1980 1985 1990 1995
Data source: OECD
Participation rates in the US 1965-98
70
75
80
85
90
1965 1970 1975 1980 1985 1990 1995
Participation would have fallen by more if the baby-boom generation had not come of age!

Macroeconomic Shocks: The OriginsGenerations differ in their saving propensities and possibly creativity, as innovations may come more frequently at certain stages in life. Thus both investment opportunities and the supply of available savings may depend on the age distribution of the population and thus create structural booms as well as slumps.
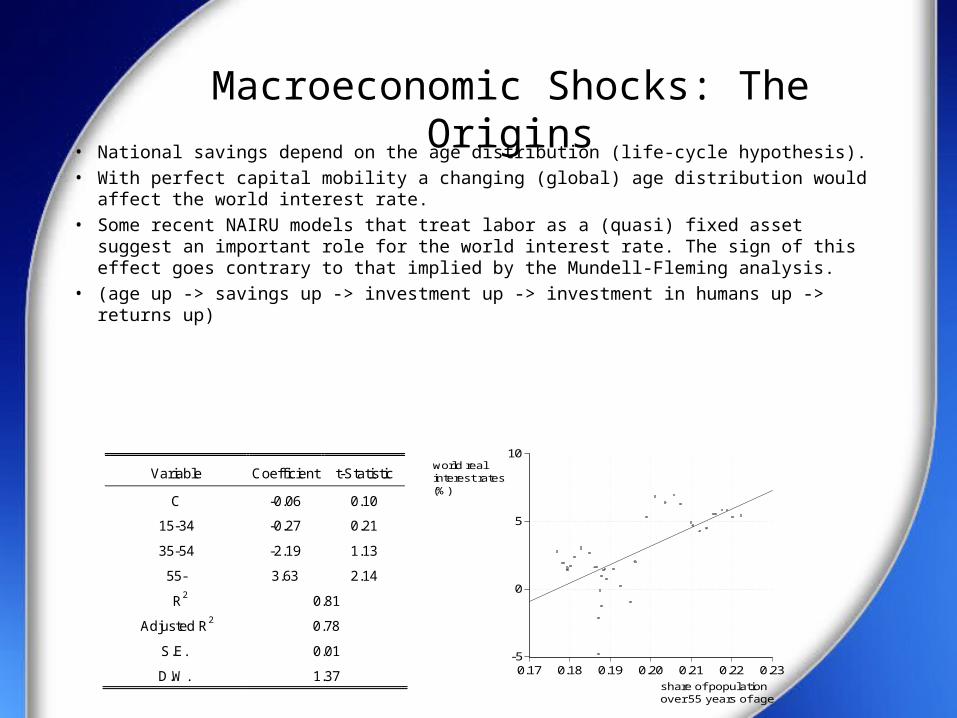
Macroeconomic Shocks: The Origins• National savings depend on the age distribution (life-cycle hypothesis). • With perfect capital mobility a changing (global) age distribution would
affect the world interest rate. • Some recent NAIRU models that treat labor as a (quasi) fixed asset suggest
an important role for the world interest rate. The sign of this effect goes contrary to that implied by the Mundell-Fleming analysis.
• (age up -> savings up -> investment up -> investment in humans up -> returns up)
Variable Coefficient t-Statistic
C -0.06 0.10
15-34 -0.27 0.21
35-54 -2.19 1.13
55- 3.63 2.14
R2 0.81
Adjusted R2 0.78
S.E. 0.01
D.W. 1.37
-5
0
5
10
0.17 0.18 0.19 0.20 0.21 0.22 0.23
world realinterest rates(%)
share of populationover 55 years of age
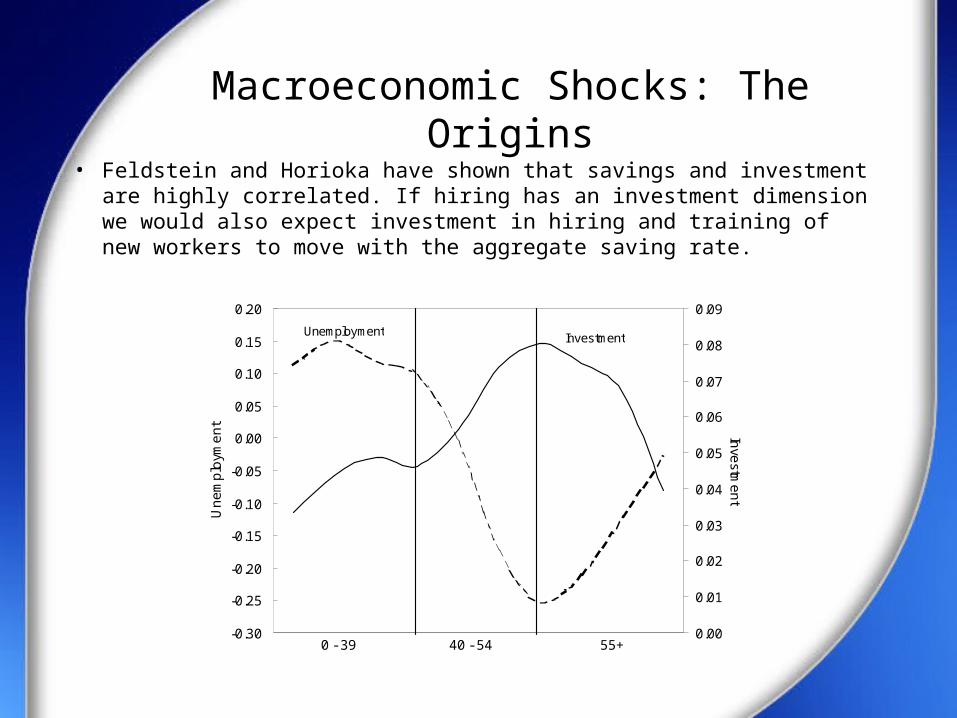
Macroeconomic Shocks: The Origins• Feldstein and Horioka have shown that savings and investment
are highly correlated. If hiring has an investment dimension we would also expect investment in hiring and training of new workers to move with the aggregate saving rate.
-0.30
-0.25
-0.20
-0.15
-0.10
-0.05
0.00
0.05
0.10
0.15
0.20
Un
em
plo
yme
nt
0.00
0.01
0.02
0.03
0.04
0.05
0.06
0.07
0.08
0.09
Inve
stme
nt
0 - 39 40 - 54 55+
InvestmentUnemployment

Macroeconomic Shocks: The Origins
• Recent structural booms (the “new economy”?) can be traced to innovations and creativity of entrepreneurs. Here, the age distribution may come into play.
• Casual observation suggests that people may be most creative in their thirties and early forties (with greatest potential of turning ideas into reality).
• A relatively young population would then have proportionately greater number of entrepreneurs than an older one and hence a faster rate of expected productivity growth and a higher-valued stock market.
• This may induce firms to step up their hiring, driving down the
unemployment rate.
Macroeconomic Shocks: The Origins
0.0
0.5
1.0
1.5
2.0
2.5
0.8 1.0 1.2 1.4 1.6 1.8 2.0
aut
aus
be
ca
de fifr
ge
ir
it
ja
ne
no
sp
sw
uk
usnz
proportionalrise in shareprices 90-97
number of people between 25 and 34in 1990 relative to 1960 level
0.0
0.5
1.0
1.5
2.0
2.5
0.12 0.13 0.14 0.15 0.16 0.17 0.18
proportionalrise in shareprices 90-97
number of people between 25 and 34in 1990 as a proportion of total population
aut
aus
be
ca
defi
fr
geir
it
ja
ne
no
sp
sw
uk
usnz
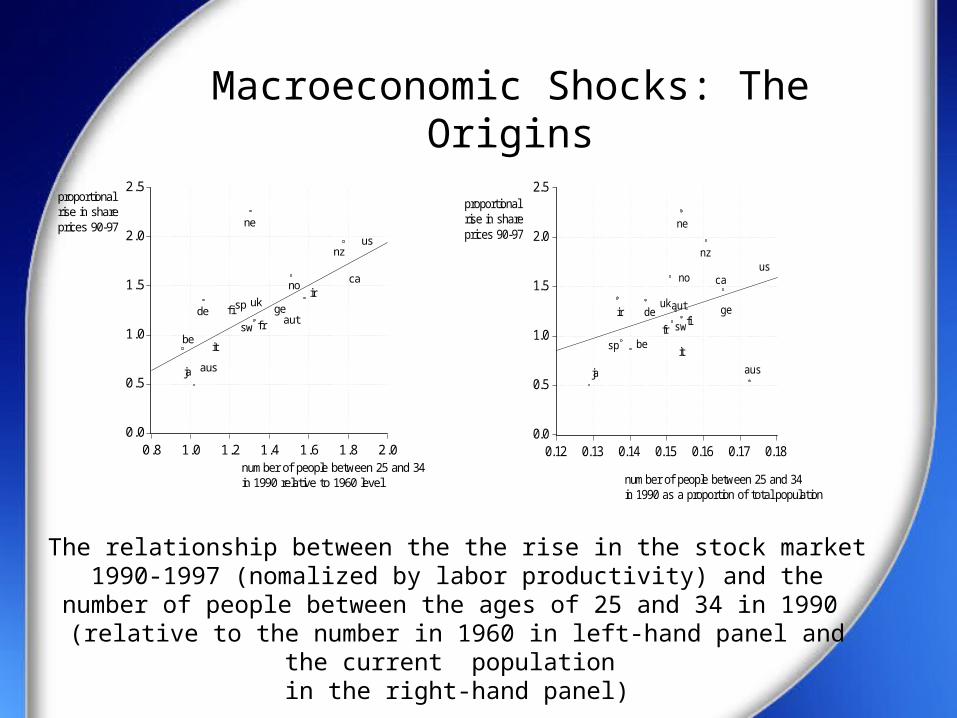
The relationship between the the rise in the stock market 1990-1997 (nomalized by labor productivity) and the number of people between the ages of 25 and 34 in 1990
(relative to the number in 1960 in left-hand panel and the current population in the right-hand panel)

Macroeconomic Shocks: ResponsesWhen an adverse shock hits the economy, the responsiveness of unemployment depends on labor-market institutions such as the duration and level of unemployment benefits and the organisation of labor unions, but also on the age-structure.

Macroeconomic Shocks: Responses
• The interaction of institutions and macroeconomic shocks plays a key role in the emerging consensus on the determination of medium-term unemployment, (Blanchard and Wolfers, 2000).
• Thus certain institutions are likely to mitigate the effect of shocks while others exacerbate them.
• The data appear to suggest that shocks have more serious consequences when:– the unemployment benefit replacement ratio is high, – the duration of such benefits is long, – there is employment-protection legislation, – there is a lack of co-ordination among unions and employers,– a low level of active labor-market spending such as retraining and placement
schemes.

Macroeconomic Shocks: Responses
• How can the age distribution affect the sensitivity of aggregate employment to macroeconomic shocks?– Job security is rising in tenure and hence, ceteris paribus, in age. Since it is more
difficult to dismiss an old worker, the sensitivity of employment to shocks should be a decreasing function of the size of the older cohorts.
– Similarly, the age structure and the institutional framework may interact in affecting employment. Thus employment-protection legislation may be more effective for the older is the average worker. (However, firms may opt for early retirement instead of dismissals which would cause the effect to show up in labor-force participation instead of unemployment.)
– A transitory shock is more likely to lead to the dismissal of an older worker because of his shorter expected post-recession tenure. Thus the level of labor hoarding may be smaller for the older workers due to their shorter remaining worklife. This would make the sensitivity to shocks greater.

Macroeconomic Shocks: Responses
Older workers may find it more difficult to find another job as their remaining tenure is shorter. They are thus more likely to become long-term unemployed. As a result, the higher is the proportion of older workers in the labor force the more likely is a transitory shock to employment to have a persistent effect on employment.
Older workers may be more resistant to real wage moderation as their accumulated wealth reduces the dependence on employment. This raises the possibility that real-wage cuts are less likely the higher the proportion of older workers.
What due the data say (rational: Fitoussi, Jestaz, Phelps, and Zoega, 2000)
itiiitiiit Xuu 1
iii Y10ˆ1ˆ

Macroeconomic Shocks: Responses
(1) (2) (3) (4)
Constant 4.86 47.69 53.16 63.45(2.10) (2.92) (3.12) (3.39)
1.10 0.70 0.66 0.69(2.65) (1.81) (1.65) (1.63)
0.11 0.09 0.08 0.08(2.20) (1.73) (1.50) (1.41)
-2.62 -2.41 -2.18 -2.3(2.34) (2.92) (2.26) (2.22)
-0.13 -0.18 -0.18 -0.18(1.86) (4.30) (4.09) (3.92)
… -135.5 -133.7 -172.1(2.74) (2.69) (2.67)
… … -24.7 14.3(0.52) (0.20)
… … … -84.6 (0.84)
Adj. R2 0.57 0.74 0.74 0.75 S.E. 2.72 2.20 2.27 2.33
Pop. 15-33
Pop. 35-54
Pop 55-64
Duration of benefits
Union density
Union coordination
Active labour market programmes
N o t e : T h e t a b l e s h o w s r e g r e s s i o n s o f t h e f o r m :
iii Y101w h e r e Y i s a v e c t o r o f t h e e x p l a n a t o r y v a r i a b l e s ; r e p l a c e m e n t r a t i o , d u r a t i o no f b e n e f i t s – t h e n u m b e r o f m o n t h s a t w h i c h b e n e f i t s c o n t i n u e a t ar e a s o n a b l e l e v e l – u n i o n c o v e r a g e , u n i o n d e n s i t y , c o o r d i n a t i o n o f u n i o n s a n de m p l o y e r s ( i n d i c e s w h e r e “ 3 ” r e f e r s t o m a x i m u m c o o r d i n a t i o n )e m p l o y m e n t p r o t e c t i o n , a c t i v e l a b o u r m a r k e t s p e n d i n g a n d t h e a g e s t r u c t u r eo f t h e p o p u l a t i o n . W e u s e t h e a v e r a g e v a l u e f o r t h e v a r i a b l e s 1 9 8 3 - 8 8 .
Institutions and the sensitivity of unemployment to shocks
Macroeconomic Shocks: Responses
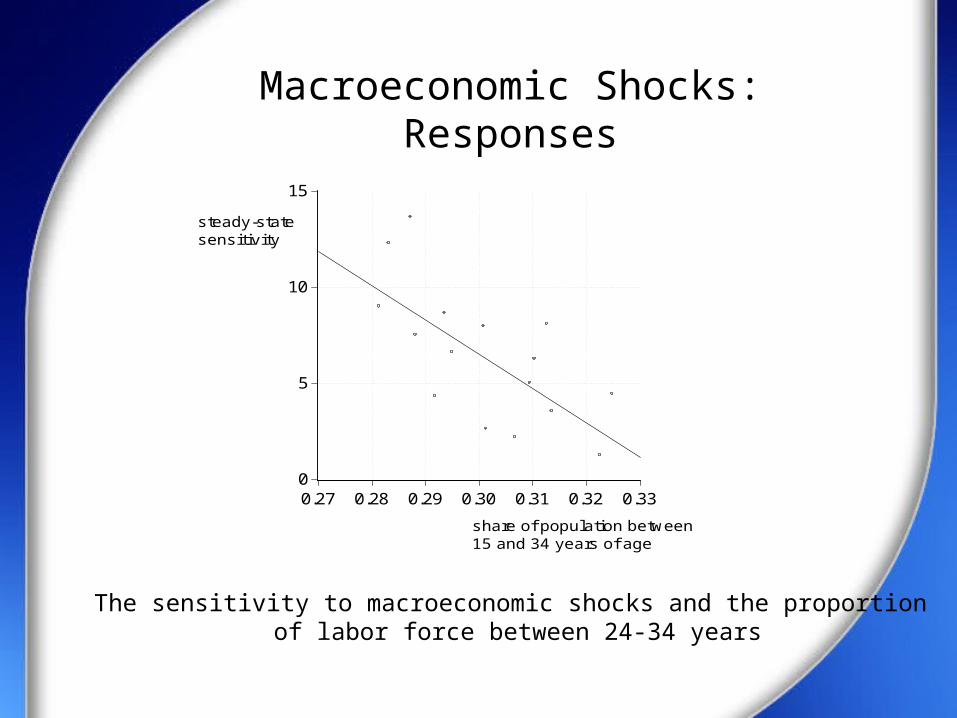
0
5
10
15
0.27 0.28 0.29 0.30 0.31 0.32 0.33
steady-statesensitiv ity
share of population between15 and 34 years of age
The sensitivity to macroeconomic shocks and the proportion of labor force between 24-34 years
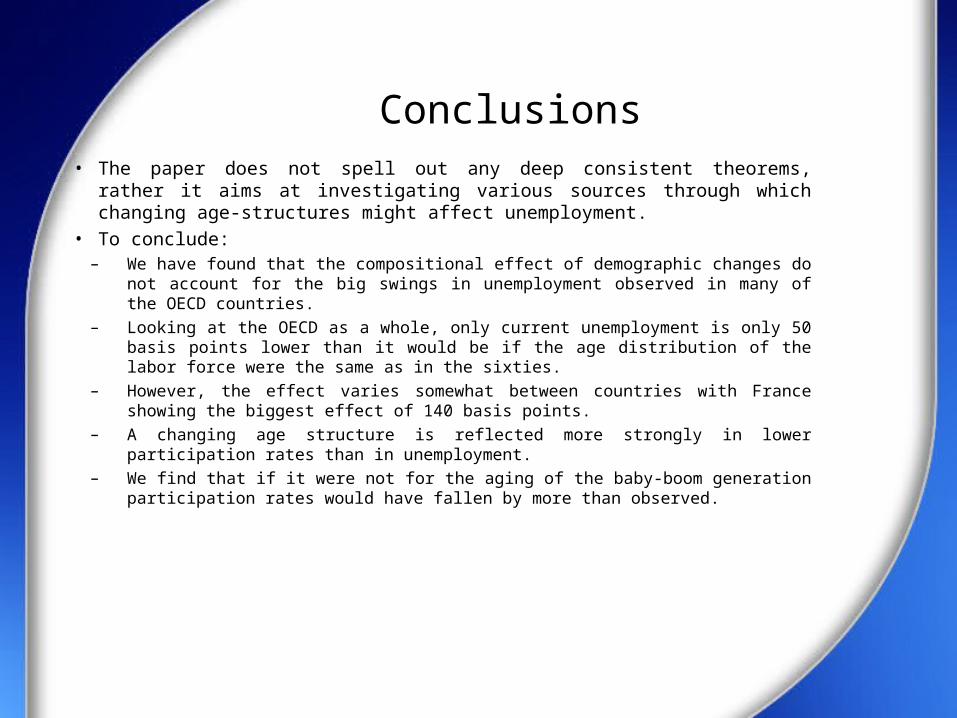
Conclusions• The paper does not spell out any deep consistent theorems, rather it aims at
investigating various sources through which changing age-structures might affect unemployment.
• To conclude:– We have found that the compositional effect of demographic changes do not account for
the big swings in unemployment observed in many of the OECD countries. – Looking at the OECD as a whole, only current unemployment is only 50 basis points lower
than it would be if the age distribution of the labor force were the same as in the sixties. – However, the effect varies somewhat between countries with France showing the biggest
effect of 140 basis points. – A changing age structure is reflected more strongly in lower participation rates than in
unemployment.– We find that if it were not for the aging of the baby-boom generation participation rates
would have fallen by more than observed.
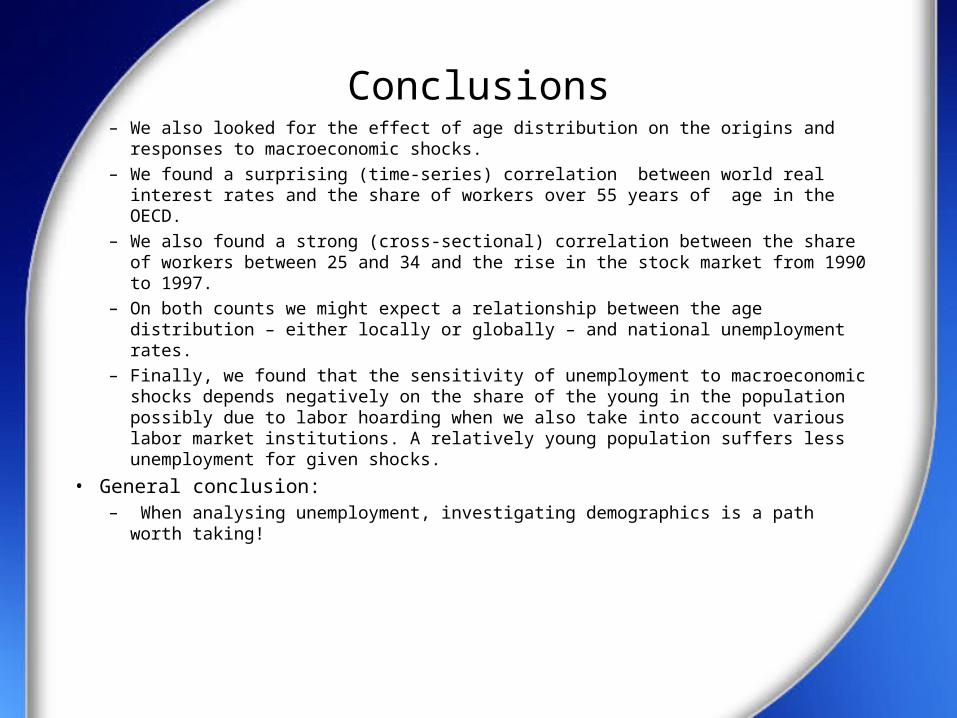
Conclusions– We also looked for the effect of age distribution on the origins and responses to
macroeconomic shocks.
– We found a surprising (time-series) correlation between world real interest rates and the share of workers over 55 years of age in the OECD.
– We also found a strong (cross-sectional) correlation between the share of workers between 25 and 34 and the rise in the stock market from 1990 to 1997.
– On both counts we might expect a relationship between the age distribution – either locally or globally – and national unemployment rates.
– Finally, we found that the sensitivity of unemployment to macroeconomic shocks depends negatively on the share of the young in the population possibly due to labor hoarding when we also take into account various labor market institutions. A relatively young population suffers less unemployment for given shocks.
• General conclusion:– When analysing unemployment, investigating demographics is a path worth
taking!