Embed Size (px)
Citation preview

Section VIII
DemographicsDemographicsDemographics
Demographics
Hampton Roads Benchmarking Study
Figure 8.1 Figure 8.1 Figure 8.1 Population of Hampton Roads and Reference Metro Areas .......................... 81
Figure 8.2 Figure 8.2 Figure 8.2 3-Year Population Growth Rate of Hampton Roads and
Reference Metro Areas .................................................................................... 81
Figure 8.3 Figure 8.3 Figure 8.3 Population Growth Rates in Hampton Roads, Virginia, and the U.S. ........... 82
Figure 8.4 Figure 8.4 Figure 8.4 Projected Hampton Roads Population ........................................................... 82
Figure 8.5 Figure 8.5 Figure 8.5 Components of Population Change in Hampton Roads ................................ 83
Figure 8.6 Figure 8.6 Figure 8.6 Hampton Roads Population ............................................................................ 83
Figure 8.7 Figure 8.7 Figure 8.7 Age Distribution of Hampton Roads Population ........................................... 84
Figure 8.8 Figure 8.8 Figure 8.8 Dependency Ratio in Hampton Roads and the U.S. ...................................... 84
Figure 8.9 Figure 8.9 Figure 8.9 Gender Distribution of the Hampton Roads Population ............................... 85
Figure 8.10 Figure 8.10 Figure 8.10 Race and Ethnicity in Hampton Roads .......................................................... 85
Figure 8.11 Figure 8.11 Figure 8.11 Distribution of Occupations in Hampton Roads ............................................ 86
Figure 8.12 Figure 8.12 Figure 8.12 Comparative Occupation Percentage for Hampton Roads and the U.S. ....... 86
Demographics
Hampton Roads Benchmarking Study
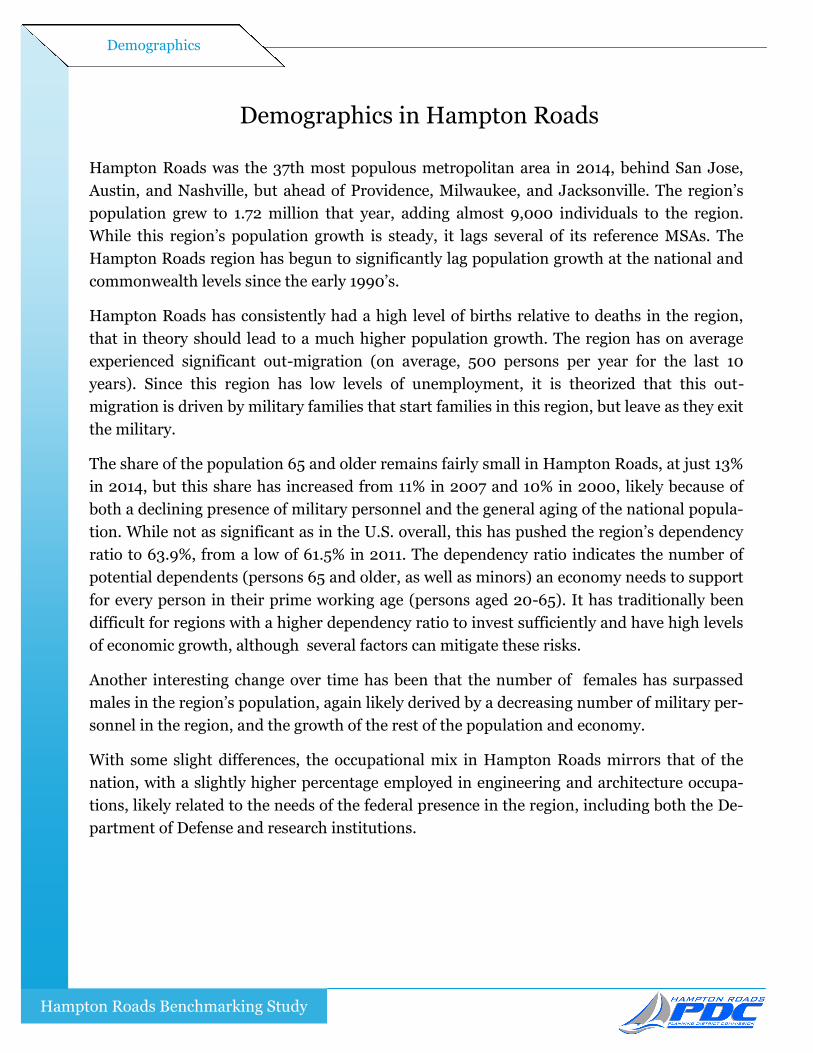
Hampton Roads was the 37th most populous metropolitan area in 2014, behind San Jose,
Austin, and Nashville, but ahead of Providence, Milwaukee, and Jacksonville. The region’s
population grew to 1.72 million that year, adding almost 9,000 individuals to the region.
While this region’s population growth is steady, it lags several of its reference MSAs. The
Hampton Roads region has begun to significantly lag population growth at the national and
commonwealth levels since the early 1990’s.
Hampton Roads has consistently had a high level of births relative to deaths in the region,
that in theory should lead to a much higher population growth. The region has on average
experienced significant out-migration (on average, 500 persons per year for the last 10
years). Since this region has low levels of unemployment, it is theorized that this out-
migration is driven by military families that start families in this region, but leave as they exit
the military.
The share of the population 65 and older remains fairly small in Hampton Roads, at just 13%
in 2014, but this share has increased from 11% in 2007 and 10% in 2000, likely because of
both a declining presence of military personnel and the general aging of the national popula-
tion. While not as significant as in the U.S. overall, this has pushed the region’s dependency
ratio to 63.9%, from a low of 61.5% in 2011. The dependency ratio indicates the number of
potential dependents (persons 65 and older, as well as minors) an economy needs to support
for every person in their prime working age (persons aged 20-65). It has traditionally been
difficult for regions with a higher dependency ratio to invest sufficiently and have high levels
of economic growth, although several factors can mitigate these risks.
Another interesting change over time has been that the number of females has surpassed
males in the region’s population, again likely derived by a decreasing number of military per-
sonnel in the region, and the growth of the rest of the population and economy.
With some slight differences, the occupational mix in Hampton Roads mirrors that of the
nation, with a slightly higher percentage employed in engineering and architecture occupa-
tions, likely related to the needs of the federal presence in the region, including both the De-
partment of Defense and research institutions.
Demographics in Hampton Roads
Demographics
Hampton Roads Benchmarking Study
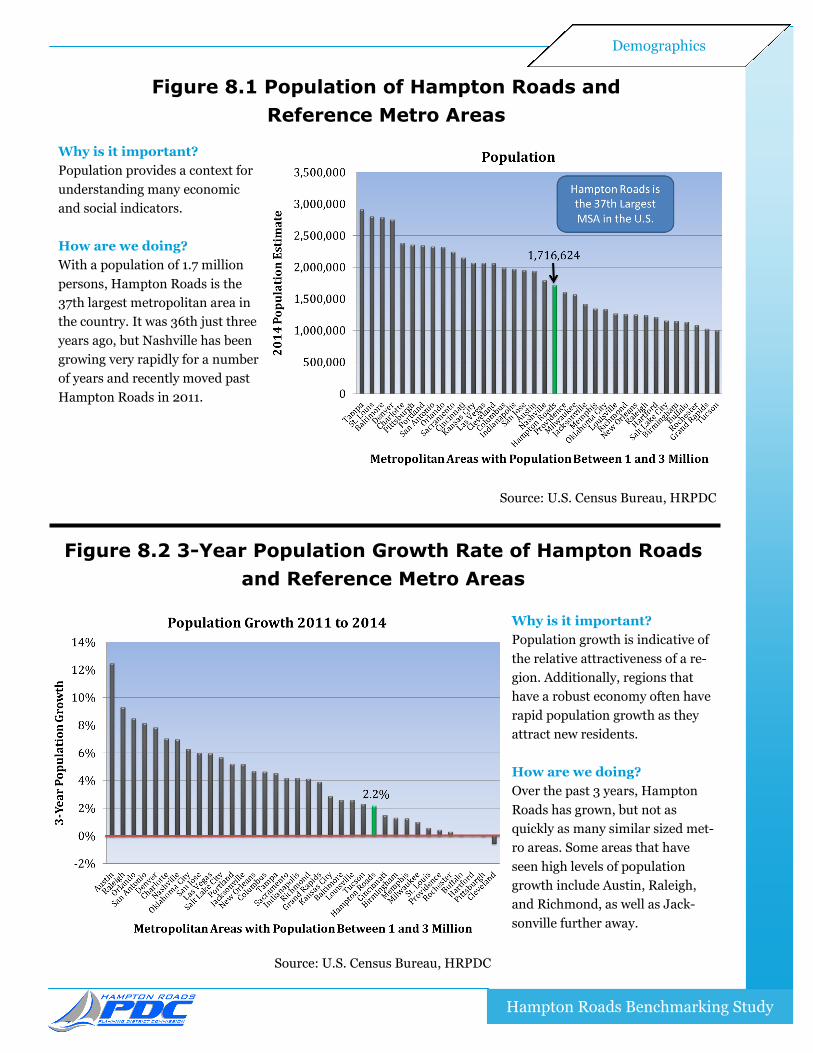
Figure 8.1 Population of Hampton Roads and
Reference Metro Areas
Figure 8.2 3-Year Population Growth Rate of Hampton Roads
and Reference Metro Areas
Why is it important?
Population growth is indicative of
the relative attractiveness of a re-
gion. Additionally, regions that
have a robust economy often have
rapid population growth as they
attract new residents.
How are we doing?
Over the past 3 years, Hampton
Roads has grown, but not as
quickly as many similar sized met-
ro areas. Some areas that have
seen high levels of population
growth include Austin, Raleigh,
and Richmond, as well as Jack-
sonville further away.
Why is it important?
Population provides a context for
understanding many economic
and social indicators.
How are we doing?
With a population of 1.7 million
persons, Hampton Roads is the
37th largest metropolitan area in
the country. It was 36th just three
years ago, but Nashville has been
growing very rapidly for a number
of years and recently moved past
Hampton Roads in 2011.
Source: U.S. Census Bureau, HRPDC
Source: U.S. Census Bureau, HRPDC
Demographics
Hampton Roads Benchmarking Study
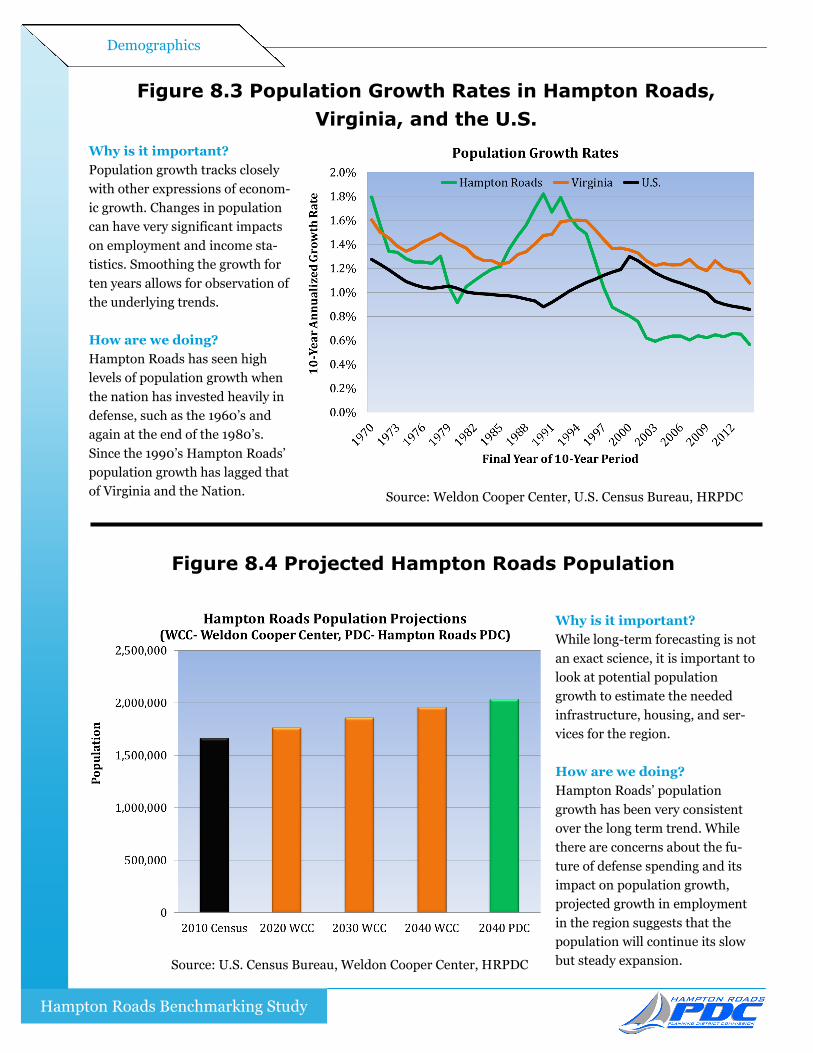
Figure 8.3 Population Growth Rates in Hampton Roads,
Virginia, and the U.S.
Figure 8.4 Projected Hampton Roads Population
Why is it important?
Population growth tracks closely
with other expressions of econom-
ic growth. Changes in population
can have very significant impacts
on employment and income sta-
tistics. Smoothing the growth for
ten years allows for observation of
the underlying trends.
How are we doing?
Hampton Roads has seen high
levels of population growth when
the nation has invested heavily in
defense, such as the 1960’s and
again at the end of the 1980’s.
Since the 1990’s Hampton Roads’
population growth has lagged that
of Virginia and the Nation. Source: Weldon Cooper Center, U.S. Census Bureau, HRPDC
Why is it important?
While long-term forecasting is not
an exact science, it is important to
look at potential population
growth to estimate the needed
infrastructure, housing, and ser-
vices for the region.
How are we doing?
Hampton Roads’ population
growth has been very consistent
over the long term trend. While
there are concerns about the fu-
ture of defense spending and its
impact on population growth,
projected growth in employment
in the region suggests that the
population will continue its slow
but steady expansion. Source: U.S. Census Bureau, Weldon Cooper Center, HRPDC
Demographics
Hampton Roads Benchmarking Study
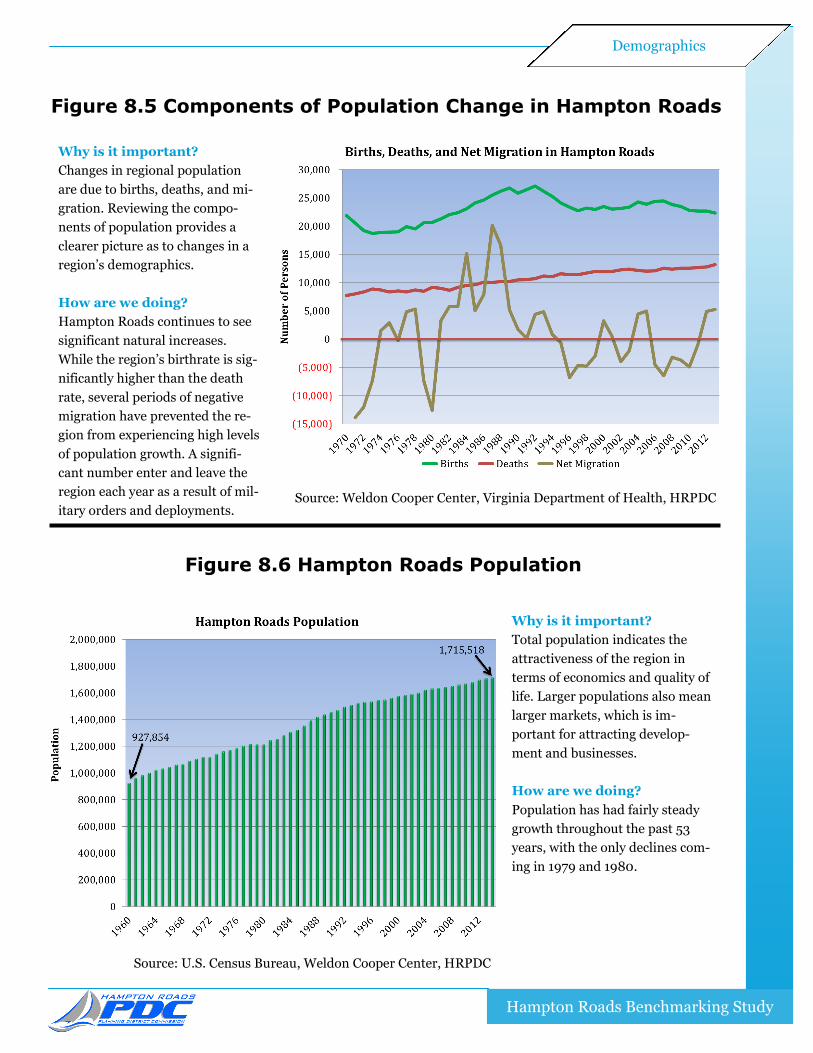
Figure 8.5 Components of Population Change in Hampton Roads
Figure 8.6 Hampton Roads Population
Why is it important?
Total population indicates the
attractiveness of the region in
terms of economics and quality of
life. Larger populations also mean
larger markets, which is im-
portant for attracting develop-
ment and businesses.
How are we doing?
Population has had fairly steady
growth throughout the past 53
years, with the only declines com-
ing in 1979 and 1980.
Why is it important?
Changes in regional population
are due to births, deaths, and mi-
gration. Reviewing the compo-
nents of population provides a
clearer picture as to changes in a
region’s demographics.
How are we doing?
Hampton Roads continues to see
significant natural increases.
While the region’s birthrate is sig-
nificantly higher than the death
rate, several periods of negative
migration have prevented the re-
gion from experiencing high levels
of population growth. A signifi-
cant number enter and leave the
region each year as a result of mil-
itary orders and deployments. Source: Weldon Cooper Center, Virginia Department of Health, HRPDC
Source: U.S. Census Bureau, Weldon Cooper Center, HRPDC

Demographics
Hampton Roads Benchmarking Study
Figure 8.7 Age Distribution of Hampton Roads Population
Figure 8.8 Dependency Ratio in Hampton Roads and the U.S.
Why is it important?
The age distribution of a region’s
population has both social and
economic implications. It pro-
vides insight into the need for
family and senior services, as well
as indicating the availability of
labor. Growing populations have a
histogram that looks like a pyra-
mid.
How are we doing?
Hampton Roads does not have a
rapidly expanding population of
minors, but neither does it have a
large elderly population. The pop-
ulation grows rapidly for the 20-
24 and the 25-29 age groups, and
this is related to military person-
nel stationed in the region. Source: U.S. Census Bureau, HRPDC
Why is it important?
This illustrates the extent to which
the working age population sup-
ports dependents (both children
and adults). The size of the de-
pendency ratio has a causal link to
GDP growth.
How are we doing?
The dependency ratio has in-
creased since the onset of the
great recession, both nationally
and regionally, driven by the baby
boomers moving into retirement
age. While the population shifts
have been small in absolute terms,
increasingly fewer workers are
supporting a larger population of
dependents. Source: Regional Economic Modeling Inc., HRPDC
Demographics
Hampton Roads Benchmarking Study
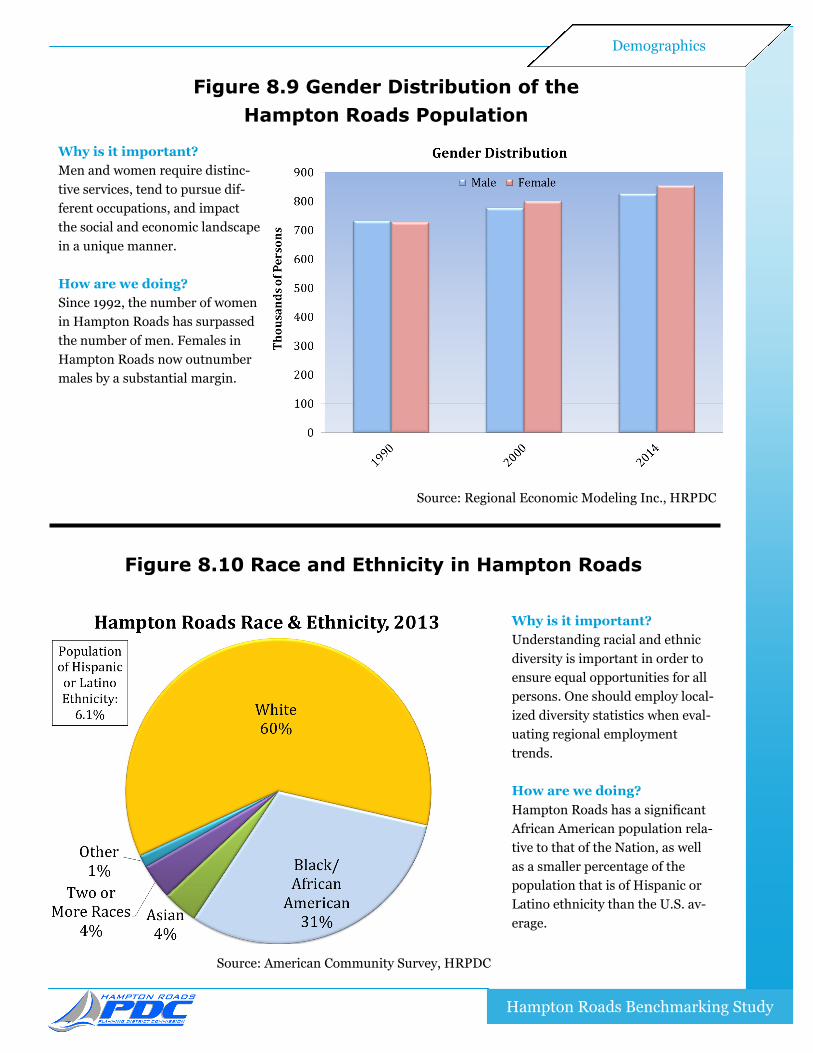
Figure 8.9 Gender Distribution of the
Hampton Roads Population
Figure 8.10 Race and Ethnicity in Hampton Roads
Why is it important?
Understanding racial and ethnic
diversity is important in order to
ensure equal opportunities for all
persons. One should employ local-
ized diversity statistics when eval-
uating regional employment
trends.
How are we doing?
Hampton Roads has a significant
African American population rela-
tive to that of the Nation, as well
as a smaller percentage of the
population that is of Hispanic or
Latino ethnicity than the U.S. av-
erage.
Why is it important?
Men and women require distinc-
tive services, tend to pursue dif-
ferent occupations, and impact
the social and economic landscape
in a unique manner.
How are we doing?
Since 1992, the number of women
in Hampton Roads has surpassed
the number of men. Females in
Hampton Roads now outnumber
males by a substantial margin.
Source: Regional Economic Modeling Inc., HRPDC
Source: American Community Survey, HRPDC

Demographics
Hampton Roads Benchmarking Study
Figure 8.11 Distribution of Occupations in Hampton Roads
Figure 8.12 Comparative Occupation Percentage for
Hampton Roads and the U.S.
Why is it important?
Employment is often classified by
industry, although persons seek-
ing employment typically search
by occupation. A single industry
can capture significant diversity in
workforce needs and potential
incomes. Examining the occupa-
tional distribution allows for a
more precise analysis of the re-
gion’s workforce.
How are we doing?
Hampton Roads has significant
diversity in the occupations avail-
able to its residents, ranging from
office and administrative jobs that
compose 15.4% of the region’s
employment to farming, fishing,
and forestry that composes 0.1% Source: Bureau of Labor Statistics, HRPDC
Why is it important?
The differences between the occu-
pation mix in Hampton Roads
and the U.S. indicate some of the
differences in the underlying
economy. This will also reflect the
underlying education levels and
areas of potential growth for the
Hampton Roads workforce.
How are we doing?
Hampton Roads has a greater per-
centage of its employment con-
centrated in architecture & engi-
neering as well as construction &
extraction than the nation as a
whole.
Source: Bureau of Labor Statistics, HRPDC


![ASME SECTION VIII / API 526 REYCOJ ASME Section VIII Liquid K ASME Section VIII Gas and Vapors L ASME Section VIII Steam (Limited to 2900 psig [200 barg]) M Non Code Liquid N Non Code](https://img.pdfslide.net/doc/110x75/6064747c38b6361e5449728e/asme-section-viii-api-526-reyco-j-asme-section-viii-liquid-k-asme-section-viii.jpg)