Embed Size (px)
Citation preview

Demonstrating BMPs to Protect Surface Water QualityFrom Land Application of Animal Wastes
U.S. Environmental Protection AgencyFY94 Section 319(h) Task #700
Final Report
Submitted To The
Oklahoma Conservation Commission
For The
U.S. Environmental Protection Agency
Faculty and StaffDaniel E. Storm, Associate Professor
Nicholas T. Basta, Associate ProfessorDoug W. Hamilton, Assistant Professor
Michael D. Smolen, ProfessorMark E. Payton, Associate Professor
Joe L. Bullard, Extension Educator, Agriculture/Water QualityMitch J. Fram, Area Extension Water Quality Specialist
StudentsJason M. Peters, Former Graduate Research Assistant
Lori E. Gallimore, Graduate Research Assistant
Oklahoma State UniversityDepartments of
Biosystems and Agricultural EngineeringPlant and Soil Sciences
StatisticsStillwater, Oklahoma
April 29, 1999

ii
TABLE OF CONTENTS
List of Tables..............................................................................................................iv
List of Figures ............................................................................................................v
Executive Summary ...................................................................................................vi
Introduction ................................................................................................................1
Project Area Description ............................................................................................1
Field Materials and Methods ......................................................................................2Site Preparation .................................................................................................2Rainfall Simulator ..............................................................................................2Experimental Design ..........................................................................................3Chemical Characterization of Residuals, Litter, and Soil ...................................4Surface Runoff Collection and Chemical Analysis .............................................4
BMP Results and Discussion ....................................................................................5
Water Treatment Residuals Results and Discussion .................................................6Effect of WTR on Phosphorus in Surface Runoff ...............................................7Effect of WTR on Nitrogen in Surface Runoff.....................................................8Potential Environmental Impacts ........................................................................9Discussion ..........................................................................................................9
Conclusions and Recommendations ...............................................................10Traditional BMPs ..............................................................................................10Water Treatment Residuals .............................................................................11
Education Activities .................................................................................................12
References ..............................................................................................................13
Appendix A - Laboratory Results: Evaluating the Properties of Biosolids ................47
Appendix B - Greenhouse Results: Application of Water Treatment Residuals.......64
Appendix C - Education Materials ............................................................................79Fact Sheets .....................................................................................................80Additional Handouts .........................................................................................90Example Newspaper Clipping ........................................................................100Rainfall Simulator Demonstration Announcements ........................................101
Appendix D - Producer Surveys .............................................................................103

iii
List of Tables
Table 1. Kerr plot slopes for the June rainfall simulator demonstration....................16
Table 2. Kerr plot slopes for the August rainfall simulator demonstration.................17
Table 3. Hudson Farms plot slopes for the June rainfall simulator demonstration ...18
Table 4. Average plot slope by setup for the Kerr and Hudson Farms rainfall simulatordemonstrations.........................................................................................................19
Table 5. Rainfall simulator demonstration treatment summary ...............................20
Table 6. Rainfall simulator demonstration treatments .............................................21
Table 7. Plot number and treatment identification ...................................................22
Table 8. Uncut vegetation heights for 1996 rainfall simulator demonstrations ........25
Table 9. Properties, chemical components and nutrient content of water treatmentresiduals ...................................................................................................................26
Table 10. Soil moisture and chemical properties for 0-6 inch composite soilcores.........................................................................................................................27
Table 11. Poultry litter analysis results .....................................................................28
Table 12. Time to surface runoff by plot number and treatment identification ........29
Table 13. Surface runoff results ...............................................................................32
Table 14. Poultry litter and commercial fertilizer application rates .........................33
Table 15. ANOVA statistical analysis results for BMPs .............................................34
Table 16. ANOVA statistical analysis results for WTRs .............................................36
Table 17. Reduction in NH4 from application of water treatment residuals ..............37
Table 18. Rainfall simulator demonstration survey results summary.......................38

iv
List of Figures
Figure 1. Location of Adair and LeFlore Counties ....................................................39
Figure 2. Setup locations for the Kerr Center for Sustainable Agriculture site .........39
Figure 3. Setup locations for the Hudson Farms Chance Complex Number 8 site ..40
Figure 4. Rainfall simulator with plot layout. Ten booms with staggered nozzles notshown .......................................................................................................................41
Figure 5. Cross-section view of plot area showing position of end plate and collectiontrough .......................................................................................................................41
Figure 6. Soluble and total P in runoff water from plots treated with poultry litter in theAdair county experiment. Treatments are broadcast high application (Br-High, 44.8 Mgha -1 or 72.6 kg plot -1), broadcast low application (Br-Low, 18.5 Mg ha -1 or 18.2 kgplot -1, buffer strip (Buffer, 44.8 Mg ha -1 or 18.2 kg plot -1), and control. ..............42
Figure 7. Soluble and total P in runoff water from plots treated with poultry litter in theLeFlore county experiment. Treatments are broadcast high application (Br-High, 44.8Mg ha -1 or 72.6 kg plot -1), broadcast low application (Br-Low, 18.5 Mg ha -1 or 18.2kg plot -1, buffer strip (Buffer, 44.8 Mg ha -1 or 18.2 kg plot -1), and control. ..........43
Figure 8. Total N and soluble NH4 in runoff water from plots treated with poultry litter inthe Adair county experiment. Treatments are broadcast high application (Br-High, 44.8Mg ha -1 or 72.6 kg plot -1), broadcast low application (Br-Low, 18.5 Mg ha -1 or 18.2kg plot -1, buffer strip (Buffer, 44.8 Mg ha -1 or 18.2 kg plot -1), and control. ..........44
Figure 9. Total N and soluble NH4 in runoff water from plots treated with poultry litter inthe LeFlore county experiment. Treatments are broadcast high application (Br-High,44.8 Mg ha -1 or 72.6 kg plot -1), broadcast low application (Br-Low, 18.5 Mg ha -1 or18.2 kg plot -1, buffer strip (Buffer, 44.8 Mg ha -1 or 18.2 kg plot -1), and control. ..45
Figure 10. Soluble Al in runoff water from plots in the Adair and LeFlore countyexperiments. Treatments are broadcast high application (Br-High, 44.8 Mg ha -1 or 72.6kg plot -1), broadcast low application (Br-Low, 18.5 Mg ha -1 or 18.2 kg plot -1, bufferstrip (Buffer, 44.8 Mg ha -1 or 18.2 kg plot -1), and control. .....................................46

v
EXECUTIVE SUMMARY
Introduction
Poultry, swine and dairy production has grown significantly across the region andrepresents an important economic opportunity. However, this increase in productionhas led to an increase in the potential for surface and ground water contaminationresulting from improper manure application rates, timing and placement. Theimplementation of best management practices (BMPs) for manure managementsystems is critical to water quality protection. For producers and the animal industry toaccept and implement BMPs, their utility must be demonstrated under field conditions.This demonstration project provided the mechanism to disseminate and demonstratestate-of-the-art recommendations and technologies for land application of animalmanure to permanent pastures.
This project demonstrated the effectiveness of BMP recommendations andtechnologies in reducing nitrogen and phosphorus losses in surface runoff from landapplication of animal manure to permanent pastures in two critical watersheds ineastern Oklahoma. Using a portable rainfall simulator, three rainfall simulatordemonstrations were conducted. Two demonstrations were conducted in LeFloreCounty at the Kerr Center for Sustainable Agriculture, Poteau, Oklahoma, one on June18-19, 1996 and the second on August 6-7, 1996. The third demonstration wasconducted in Adair County, at the Hudson Farms Chance Complex Number 8, justoutside Chance, Oklahoma, on July 9-10, 1996. BMP factors demonstrated included:
1) manure application rate2) pasture aeration3) water treatment residual (alum sludge) to reduce P and NH4 surface runofflosses from poultry litter4) vegetation height5) filter/buffer strips6) fertilizer comparison: commercial, poultry, swine, dairy.
Conclusions and Recommendations
The following conclusions and recommendations are based on the demonstratedBMPs that had replicated plots, i.e. manure application rate, pasture aeration, watertreatment residuals (alum sludge), vegetation height, commercial fertilizer and poultrylitter comparison.
Traditional BMPs
For the conditions studied, plot slope had a significant effect for all response variablesexcept solids and organic N. In previous Oklahoma State University rainfall simulatorstudies, slope was found to be insignificant or occasionally marginally significant. In thecurrent and previous studies the effect of slope was found to be very complex. Thuswe do not recommend adjusting BMP recommendations for slope without furtherstudies. We also found that, for the conditions studied, the aeration and vegetation

vi
height treatments does not have a significant effect.
Based on the Kerr-August and Hudson Farms data, as well as previous studies, wefound that increasing litter application rate increases nutrient loss (N and P) in surfacerunoff. When the P and N response variables were normalized by the N or Papplication rate, the high and low litter application rates were not significantly different.This indicates there was a linear response to litter application rate for P and N.
The commercial fertilizer treatment response was different from the litter applicationtreatments. The normalized surface runoff P concentrations for the commercialfertilizer treatments were always significantly higher than the litter applicationtreatments. This indicates that on a per unit application basis commercial fertilizer hassignificantly higher losses to surface runoff than poultry litter. Therefore, poultry litteris the preferred P fertilizer source for permanent pasture.
Nitrogen showed mixed results. For the Hudson Farms demonstration, the normalizedsurface runoff total N, ammonium, and organic N concentrations were significantlyhigher from commercial fertilizer than poultry litter. However, these normalized Nresponse variables were not significantly different for the Kerr-August demonstration,and the normalized mean concentrations were lower for the commercial fertilizertreatment. Therefore we have no recommendation at this time on use of poultry littervs commercial fertilizer (ammonium nitrate) for N losses to surface runoff.
Based on these demonstrations the following conclusions can be made:1. Slope should be considered when developing BMP recommendations.However, additional studies are needed to make specific recommendations.2. Aeration has no significant effect and should not be considered a BMP.3. For the conditions studied, i.e. good vegetation stand with 1.5 to 20 inch height,vegetation height has no significant effect.4. Increasing litter application rate increases nutrient losses. Therefore, litterapplication rates should be minimized to reduce potential off-site water qualityimpacts.5. P from triple super phosphate fertilizer is more mobile than P from poultry litter,and thus the use of tripe super phosphate would result in higher losses in surfacerunoff. Therefore, when P fertilization is recommended for agronomic reasons,poultry litter would be the preferred source of P from a water quality perspective.6. Based on current information, no recommendation can be made at this timebetween commercial N fertilizer (ammonium nitrate) and poultry litter.
Water Treatment Residuals
Two WTRs were used in three treatments: an edge of plot buffer strip and twobroadcast rates. One WTR reduced P and NH4 in surface runoff significantly, whereasthe other WTR did not. No significant difference was found between broadcast andbuffer strip treatments. In addition, soluble Al in surface runoff ranged from 0.02 to0.09 mg/L, and WTR treated plots were not significantly different from the control.Therefore, land application of alum-based WTR does not increase dissolved Al in

vii
surface runoff. Related studies showed that these WTRs did not increase soilextractable Al.
The ability of WTRs to reduce P and NH4 in runoff depends on the Ca content,amorphous Al content and cation exchange capacity of the WTR. Drinking watertreatment plants use different source waters and different treatment chemicals andproduce WTRs with different chemical compositions and properties. Therefore, furtherstudies on specific WTRs are needed to evaluate their potential to reduce nutrients insurface runoff.
The following can be concluded for WTRs from these demonstrations:1. Some WTRs can reduce P and NH4 in surface runoff, and thus have potentialas a BMP.2. Land application of alum-based WTR does not increase dissolved Al in surfacerunoff or extractable Al in soil
Education Activities
For the June19, 1996 demonstration approximately 80 people attended, for the July 10,1996 demonstration approximately 40 people attended, and for the August 7, 1996demonstration approximately 40 people attended. Three facts sheets on animal wastewere developed. As one measure of success, a follow up survey to non-governmentalattendees was conducted, i.e. agricultural producers. The results of the survey werevery encouraging. The producers thought the presented BMPs were very practical andcould be easily implemented. Although we did not completely convince everyone thatthere can be problems with excessive land application of nutrients, all were convincedthat they could effectively use a combination of poultry litter and commercial fertilizer.Quite a few practices were implemented as a result of information obtained at thedemonstrations. Each producer implemented at least one additional BMP following thedemonstration.

-1-
Demonstrating BMPs to Protect Surface Water QualityFrom Land Application of Animal Wastes
INTRODUCTION
Poultry, swine and dairy production has grown significantly across the region andrepresents an important economic opportunity. However, this increase in productionhas led to an increase in the potential for surface and ground water contaminationresulting from improper manure application rates, timing and placement. Theimplementation of best management practices (BMPs) for manure managementsystems is critical to water quality protection. This project demonstrates theeffectiveness of selected BMPs in two critical watersheds in eastern Oklahoma.
Information and recommendations resulting from these and other studies are usefulonly if they are implemented. For producers and the animal industry to accept andimplement these BMPs, their utility must be demonstrated under field conditions. Thisdemonstration project provided the mechanism to disseminate and demonstrate state-of-the-art recommendations and technologies for land application of animal manure topermanent pastures.
Using a portable rainfall simulator, this project demonstrated the effectiveness of BMPrecommendations and technologies in reducing nitrogen and phosphorus losses insurface runoff from land application of animal manure to permanent pastures. Thisproject enhanced the effectiveness of existing water quality programs by the State ofOklahoma, USDA Hydrologic Unit Area (HUA) Projects, and the NRCS-ASCS SpecialWater Quality Improvement Projects and Water Quality Incentive Program (WQIP) inthe Illinois River Basin, Grand Lake Basin, Poteau River Basin, and the Little RiverBasin. BMP factors demonstrated included:
1) manure application rate2) pasture aeration3) water treatment residual (alum sludge) to reduce P and NH4 surface runofflosses from poultry litter4) vegetation height5) filter/buffer strips6) fertilizer comparison: commercial, poultry, swine, dairy.
PROJECT AREA DESCRIPTION
Two demonstration areas were selected reflecting high concentrations of animalfeeding operations that are located in high priority watersheds in northeastern andsoutheastern Oklahoma. During the summer of 1996 one rainfall simulatordemonstration was conducted in Adair County, Oklahoma and two rainfall simulatordemonstrations were conducted in LeFlore County, Oklahoma. The Adair Countydemonstration was located in Planning Basin Number 1 of the Middle Arkansas Riverwhere there were high concentrations of poultry and dairy operations. The LeFloreCounty demonstrations were conducted in Planning Basin Number 2 of the Lower

-2-
Arkansas River or Planning Basin Number 4 of the Lower Red River where highconcentrations of poultry and swine operations were located. The location of Adair andLeFlore Counties are shown in Figure 1.
FIELD MATERIALS AND METHODS
Site Preparation
Rainfall simulator demonstrations were conducted during the summer of 1996 topermanent pastures in a mix of common Bermuda grass and tall fescue. Twodemonstrations were conducted in LeFlore County at the Kerr Center for SustainableAgriculture, Poteau, Oklahoma, one on June 18-19 and the second on August 6-7. Thethird demonstration was conducted in Adair County, at the Hudson Farms ChanceComplex Number 8, just outside Chance, Oklahoma, on July 9-10. The soil at Kerr wasa Bengal-Pirum-Clebit Complex fine sandy loam and the soil at Hudson Farms was aDickson silt loam.
Differential leveling techniques were used to define contour lines to determine suitablelocations for rainfall simulator setups. Plots were located to ensure surface runoff wasparallel to the slope and that they contained no significant surface depressions. Thelayout for the rainfall simulator setups is given in Figures 2 and 3 for Kerr and HudsonFarms, respectively. There were a total of 24 rainfall simulator setups, with 16 setupsat Kerr and 8 setups at Hudson Farms for a total of 96 plots. Plot slopes are given inTables 1 through 3 and summarized by setup in Table 4.
Rainfall Simulator
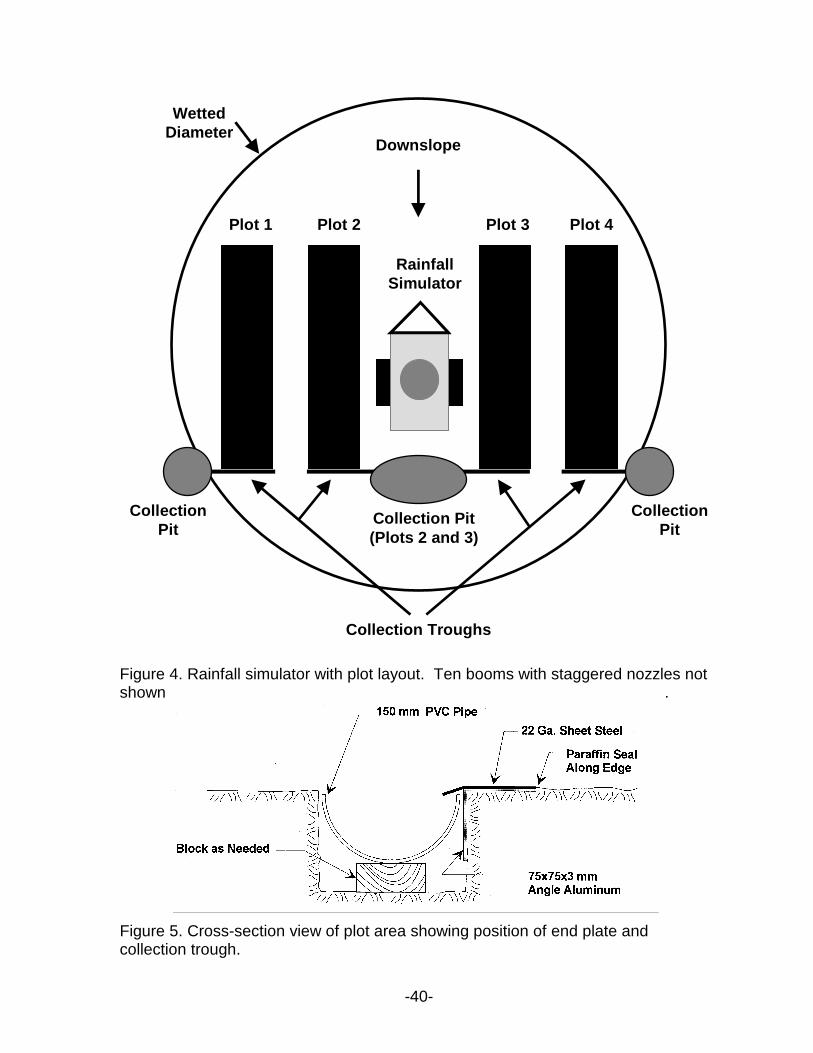
A portable rainfall simulator was used to apply controlled rainfall simultaneously to four1.8 by 9.8 m plots. The rainfall simulator is based on the Nebraska rotating-boomdesign (Swanson, 1979) which wets a 15.2 m diameter area. The nozzles are locatedon a rotating boom 2.7 m above the ground and spray continuously and move in acircular pattern. The rainfall simulator boom was rotated at approximately 7 revolutionsper min. A central alley 3 m wide allowed room for simulator placement between plots2 and 3 with at least a 1.5 m boom overhang at all plot corners to ensure uniformrainfall coverage (Figure 4). Plots were constructed to channel surface runoffdownslope into collection troughs made of 150mm-diameter PVC pipe split length-wise(Cole et al., 1997). A cross-section view of the surface runoff collection system isshown in Figure 5.
The rainfall simulator was set parallel to the land surface with the rotating boom heldat a constant height above the ground. A setup consisted of four plots, with plot pairsseparated by 0.3 m (Figure 4). The rainfall simulator was calibrated before theexperiment; however, as a check three rain gauges were installed in the center alleyat 2.4, 4.0, and 5.5 m from the boom center to measure delivered rainfall. Each rainfallsimulation experiment required approximately 15,000 L of water. A series of gasolineengines with pumps were used to deliver water through a 5 cm diameter high-pressure

-3-
vinyl hose to the rainfall simulator. The pumping system provided a mast pressure of207 kpa at the rainfall simulator, which delivered 2.5 in/hr of rainfall for 75 minutes.Water was obtained from the local Rural Water District for the Hudson Farmsdemonstration, and a pond was the water source for the Kerr demonstrations.
Experimental Design
BMPs and factors demonstrated for the project included poultry litter application rate,alum hydro-solids (alum sludge) application to land applied poultry litter, vegetationheight, pasture aeration (Kerr), commercial fertilizer comparison, vegetative buffers,and dairy (Hudson Farms) and swine (Kerr) manure. We used eight rainfall simulatorsetups per demonstration for a total of 32 plots per demonstration. A summary of thetreatments, average slope by treatment, and number of replications is given in Table5. Additional treatment details are given in Table 6. We used a randomized blockdesign, and for most of the treatments we used four replications. Table 7 identifies thetreatment for each plot.
One of the treatment variables was vegetation height. We used a push mower toobtain a cut vegetation height of 3 inches. Mowing was performed approximately twodays prior to the rainfall event. For the vegetated buffer strip treatment, 24 feet of theup slope portion of the plot was cut to 3 inches, and the lower 8 feet remained in itsnatural uncut state. A summary of the vegetation heights for the high vegetationtreatment and vegetated buffer stip treatment is given in Table 8.
The baseline or standard poultry litter application rate was 3 ton/acre (1.08 Mg/ha).The high litter application rate was 6 ton/acre. For the buffer plots, 4 tons/acre wasapplied to the short grass (3 inch height) non-buffer area and no litter was applied tothe vegetated buffers. This resulted in the same mass of litter being applied as the 3ton/acre plots. For the commercial fertilizer treated plots we applied 280 lbs N/acre(34:0:0 ammonium nitrate) and 80 lbs P2O5/acre or 35 lbs P/acre (0:46:0 triple superphosphate). For the dairy manure treatment plot, we applied 60 gallons of manure atan approximate rate of 180 lbs P2O5/acre.
For each of the two Kerr demonstrations, an aerator was used on four of the standard3 inch vegetation height plots with 3 tons/acre poultry litter. Aeration was conductedprior to applying the poultry litter. For the June demonstration a “home made” aeratorwas used. The aerator was 4 foot diameter drum filled with water, and had a series of5 inch long 0.5 inch diameter spikes on a 6 inch spacing. For the Augustdemonstration, an Aer Way aerator was used. Both pieces of equipment were donatedby J&W Farm Equipment Sales of Poteau, Oklahoma.
The last treatment used was the application of water treatment residuals (WTRs) to 3inch vegetation height plots with 3 ton/acre poultry litter application. To determine whatWTRs to use and at what rates, a laboratory incubation study and a small-scalegreenhouse study was conducted. The details of this results from these two studiesare given in Appendix A and B. Based on these results, different WTRs were used forthe Kerr and Hudson Farm demonstrations. WTRs from the AB Jewell reservoir (ABJ)

-4-
was used at Hudson Farms and Lake Wister WTR (WISTER) was used at Kerr. ThreeWTR treatments were applied over the litter treated plots: 1) high broadcast 44.8 Mgha -1 or 72.6 kg plot -1, 2) low broadcast 18.5 Mg ha -1 or 18.2 kg plot -1, and 3) as abuffer strip of 44.8 Mg ha -1 or 18.2 kg plot -1 to the bottom 8 feet (2.44 m) of the plot.
Chemical Characterization of Residuals, Litter, and Soil
Chemical properties and metal content of the water treatment residuals (WTRs) weredetermined (Table 9). The pH of each WTR was determined using a 1:2 WTR:0.01 MCaCl2. Salinity (EC) was measured in 1:2 WTR:deionized water. Calcium carbonateequivalent (CCE) was measured by back titration of HCl (Peters and Basta, 1996).Cation exchange capacity of WTR was determined by sodium saturation (Rhoades,1982). Organic carbon content and total N of the WTR was determined by drycombustion (Schepers et al., 1989). The Al & Fe oxide content of WTR weredetermined using the acid ammonium oxalate method (Ross and Wang, 1993).Aqueous Al, Ca, Mg and P were determined by shaking 1:2 WTR:deionized water for1 h and Inductively Coupled Plasma Atomic Emission Spectroscopy (ICP) analysis.Plant available N (NO3 and NH4) in KCl extracts of WTR were determined by automatedand colorimetric methods (Mulvaney, 1996). Plant available P was determined usingMehlich-III extraction (Mehlich, 1984) and ICP analysis. Sulfate content of WTR wasdetermined by monocalcium phosphate extraction (Johnson, 1992).
For each setup, approximately 15 0-6 inch soil cores from just outside the plots werecomposited prior to rainfall. Plant available N was determined by automated andcolorimetric methods (Mulvaney, 1996). Plant available P was determined usingMehlich-III extraction (Mehlich, 1984) and ICP analysis. The results are summarizedin Table 10.
A composite poultry litter sample for each rainfall simulator setup was collected andanalyzed for total N, P, and K. Total N was determined by dry combustion (Bremner,1996), total P and K by wet digestion followed by ICP analysis (Kuo, 1996). The resultsare given in Table 11.
Surface Runoff Collection and Chemical Analysis
Experimental plots received simulated rainfall for 75 minutes at a rate of 2.5 inches perhour (6.35 cm/hr). Runoff samples were collected from the plots at intervals of 2.5 or5 minutes. Total runoff volume for each time interval was used to prepare aflow-weighted sample for each plot. Runoff composites were split into two differentsamples, unfiltered and filtered using a 0.45-µm membrane filter.
Total N and P was determined by wet digestion of the unfiltered runoff water samples(APHA, 1992), with measurement of NH4-N performed using the Indophenol bluemethod (Keeney and Nelson, 1982) and total P using the Modified Murphy-Rileyascorbic acid method (Kuo, 1996). Dissolved NH4-N was determined using the filteredrunoff water samples and the Indophenol blue method. Soluble P was determinedusing the filtered water samples and the Modified Murphy-Riley ascorbic acid method.

-5-
Dissolved Al present in the filtered runoff water samples was determined by ICPanalysis.
BMP RESULTS AND DISCUSSION
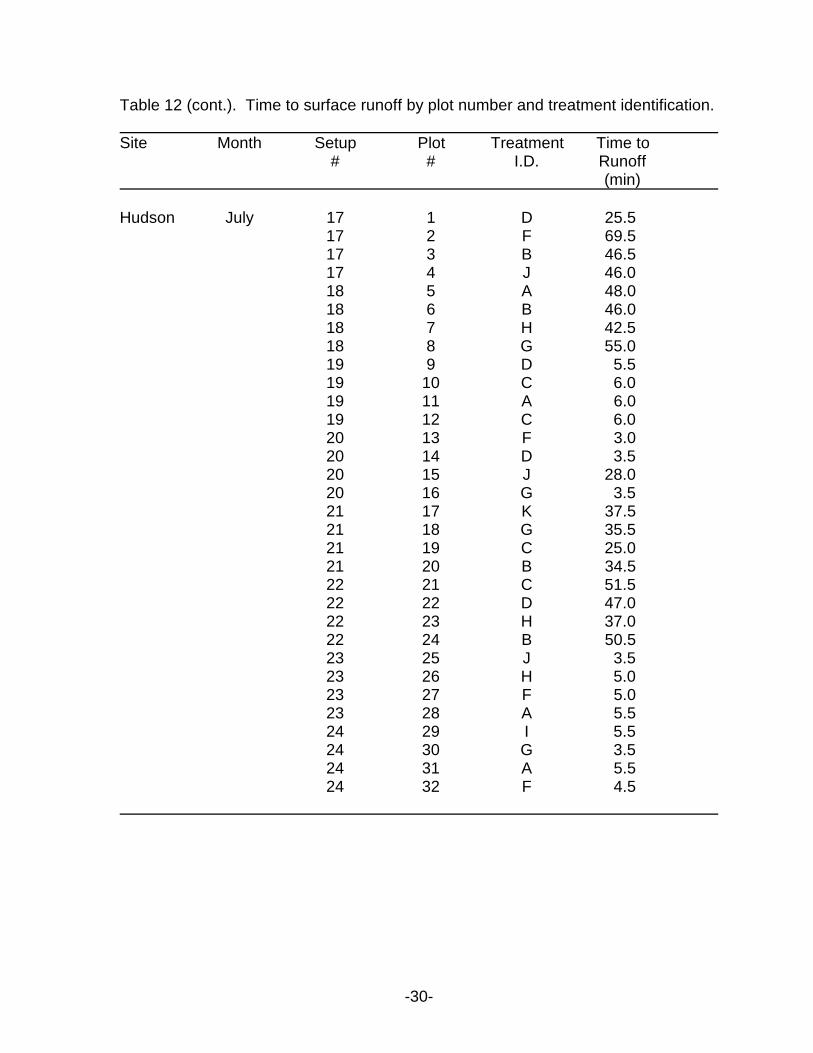
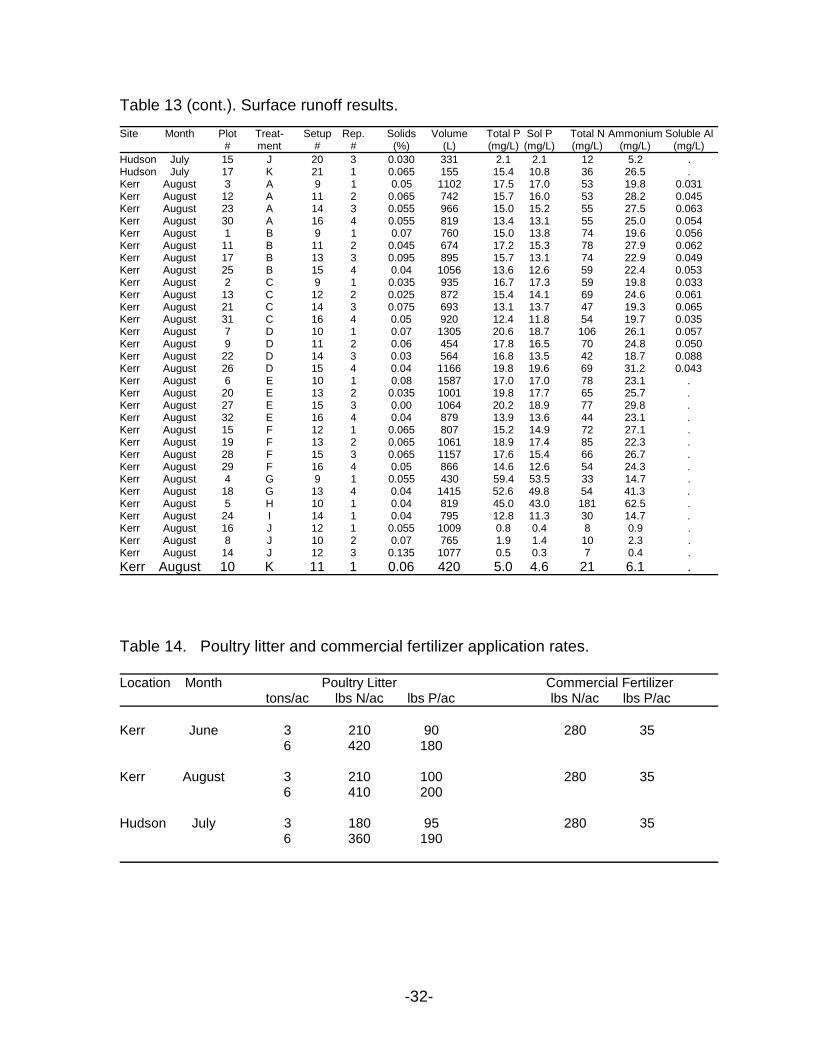
Time to surface runoff is given in Table 12, and Table 13 presents runoff volume,average surface runoff concentrations for percent solids, total P, soluble P, total N,ammonium, and organic N. As shown in Table 14, the actual mass of N and P appliedfor treatments D, E and F (3 tons/acre poultry litter) did not match the commercialfertilizer applied N and P. Therefore, additional response variables were defined toattempt to normalize these differences. Average concentrations response variableswere divided by the amount of either N or P applied to the plot. Total P and soluble Pwere divided by 90, 100, and 95 lbs P/acre for treatments D, E, and F for Kerr-June,Kerr-August, and Hudson Farms, respectively. Total N, ammonium, and organic Nwere divided by 210, 210, and 180 lbs N/acre for treatments D, E, and F for Kerr-June,Kerr-August, and Hudson Farms, respectively. Response variables for treatment H wasdivided by twice these values. Finally, treatment G response variables were divided byeither 280 lbs N/acre or 35 lbs P/acre.
A two-factor factorial (site and treatment) ANOVA in a completely randomized designwas performed. Most response variables were identified as being significantly affectedby slope: runoff volume (ÿ=0.0001), total P (ÿ=0.0032), soluble P (ÿ=0.0124), total N(ÿ=0.0616), and ammonium (ÿ=0.0001). Therefore, the ANOVA was performed usingplot slope as a covariant. Next, we checked interactions and if the interactions weresignificant, we analyzed simple effects of treatment, i.e. the effect of treatment at agiven site. The only non-significant main effects variable was runoff volume. At anÿ=0.05, runoff volumes at Hudson and Kerr-June were the same and Hudson and Kerr-August were the same, but runoff volume at Kerr-June and Kerr-August were different.
Comparison of the response variables (total P, soluble P, total N, ammonium, organicN, solids) and the normalized response variables by treatment and site are given inTable 15. Both means and least square means are provided. The analysis wasperformed at an ÿ=0.05. The Kerr-June data set had high variance and veryinconsistent results (Tables 13 and 15). At this time, we do not know the physical andchemical processes and/or the methodologies that are the source of this high variance.Therefore, we recommend that the inferences drawn from this analysis be based on theKerr-August and Hudson Farms data only.
Percent solids concentrations were the same across all treatments at the Kerrdemonstrations. At the Hudson Farms demonstration, however, the high litterapplication treatment H had significantly higher concentrations than all othertreatments. In addition, at Hudson Farms the control (treatment J), high vegetation withlow litter application rate (treatment F), and low vegetation with low litter application rate(treatment D) were not significantly different.
We had the same response for the soluble P and total P variables, which was expected

-6-
since most of the P was in the soluble form. Treatments D and F (low vs highvegetation height) were not significantly different. Average P concentrations fromTreatment J (control) always had significantly lower concentrations compared to allother treatments. Treatment H (high litter application rate) had significantly higheraverage P concentrations than treatment D (low litter application rate). Treatment G(commercial fertilizer) had significantly higher average P concentrations compared totreatment D and was significantly larger (Hudson Farms) or not significantly different(Kerr-August) from treatment H (high litter application rate). When comparing thenormalized P mean concentrations for the commercial fertilizer treatments, they werealways significantly higher than the litter application treatments. This indicates that ona per unit application basis commercial fertilizer has higher losses to surface runoffcompared to poultry litter.
For total N and ammonium, the more poultry litter applied the higher the averageconcentration, i.e. treatments D, H, and J. This was true for organic N as well, exceptfor the Hudson Farms demonstration. Treatments D and F were not significantlydifferent for all N response variables. The commercial fertilizer treatment had mixedresults for the N concentrations. For the Hudson Farms demonstration, the normalizedtotal N, ammonium, and organic N average concentrations were significantly higher forthe commercial fertilizer treatment compared to the poultry litter treatments. However,these normalized N response variables were not significantly different for the Kerr-August demonstration and the normalized mean concentrations were lower for thecommercial fertilizer treatment.
To judge the effect of treatment E (aeration, 3 ton/ac poultry litter, 3 inch vegetation),contrasts were computed to compare treatment E to treatment D (3 ton/ac poultry litter,3 inch vegetation) without the Hudson Farm site included. The Hudson Farmsdemonstration was excluded from the analysis since it did not have an aerationtreatment. At an ÿ=0.05, there was not a significant difference between treatments Dand E for all response variables, i.e. aeration did not have a significant effect.
WATER TREATMENT RESIDUALS RESULTS AND DISCUSSION
Increased freshwater eutrophication in many regions of the USA has generated muchconcern. Introduction of soluble P in surface water can result in eutrophication whenP is the limiting nutrient (Galarneau and Gehr, 1996). Sources of soluble P includeagricultural non-point source pollution associated with commercial fertilizers ormanures. Poultry litter is a cheap N fertilizer and often applied to pastures withoutincorporation at 10 Mg ha -1 in Oklahoma (Robinson and Sharpley, 1996). Surfaceapplication of poultry litter increases NH4
+ and P concentrations in runoff water (Liu etal., 1997 and Sharpley, 1997).
Several best management practices have potential to reduce nutrient in runoff water.One BMP involves decreasing soluble P in poultry litter by adding chemicalamendments. Moore and Miller (1994) found large reductions with Ca, Al and Feamendments. Soluble P in poultry litter was reduced from >2000 to <1 mg P kg -1 by

-7-
adding the equivalent of 43 g Ca as Calcium oxide to one kg of litter. Poultry littertreated with CaCO3 and alum (17 g Al kg -1) decreased soluble P from >2000 to <1 mgP kg -1. Similar reductions of soluble P were obtained with ferrous sulfate (36 g Fe kg-1). Land application of chemical treated litter (1:5 amendment/litter) had lower solubleP in runoff than untreated litter (Shreve et al., 1995). Alum treatment of poultry litterreduced soluble P from 90 to 10 mg L-1 while FeSO4 treatment reduced P runoff from90 to 20 mg L-1 in runoff water. Another approach to reduce P runoff involves additionof chemical amendments to soil. Addition of 80 g kg -1 fluidized bed combustion fly ash(FBC) to soil reduced Mehlich-III P from >200 to <100 mg kg -1 (Stout et al., 1998).
Water treatment residuals (WTRs), are primarily insoluble aluminum oxides, carbon,polymers, as well as sand, silt and clay particles removed from the raw water (Elliot andDempsey, 1991). Residual by-products from the drinking water treatment processcontain Al oxides and Ca capable of adsorbing or precipitating soluble P. Incorporationof WTRs with soil reduced soluble P and extractable P in soil (Peters and Basta, 1996).Lake Wister WTR (WISTER) at 100 g WTR kg -1 reduced Mehlich-III from 296 to <200mg kg -1 in soil that had excessive levels of available P (Peters and Basta, 1996).Residual from the AB Jewell reservoir (ABJ), at 100 g WTR kg -1 reduced Mehlich-IIIP from 553 to 250 mg kg -1.
Treatment of soil with WTR may reduce soluble P and consequently runoff P butincorporation of WTR into permanent pasture land should be discouraged. For WTRsto be incorporated into pasture the sod must be broken using conventional tillage,which temporarily leaves the soil susceptible to significant erosion. If a surface runoffproducing rainfall event occurs during this period, significant amounts of sediment andP may be transported to receiving water bodies. Surface application of WTR to landtreated with poultry litter may reduce soluble P and nutrient in runoff water. Theobjectives of this work was (i) to determine the ability of WTRs to reduce N and P runofffrom land treated with poultry litter under field conditions, and (ii) to evaluate potentialenvironmental impacts associated with land application of WTR.
Effect of WTR on Phosphorus in Surface Runoff
The high broadcast and buffer strip treatments of WTR applied reduced soluble P (p<0.05) in the runoff water compared to the control plots in the Adair County experiment(Figure 6). Mean soluble P was 88% of the mean total P in the runoff water for theAdair County site. Therefore, total P and soluble P results were similar for alltreatments. Mean concentration of total P was 8.60 mg L -1 (43% reduction comparedto control) in the high broadcast treatment and 8.12 mg L-1 (46% reduction comparedto control) for the buffer strip treatment (Figure 6). Small reductions in soluble P werefound for the low broadcast treatment, but these reductions were not significant (p<0.05). A summary of the statistical analysis is given in Table 16.
Buffer strips were found to be more effective than the broadcast treatments in reducingP in the surface runoff (Figure 6). The buffer strip treatment required 18.2 kg plot-1 ofWTR, which was the same amount that was applied in the low broadcast treatment.However, soluble P in runoff water for buffer strips was lower than results from the low

-8-
broadcast plots. The buffer strip may have provided greater contact between therainfall water and the WTR than the broadcast treatments resulting in more P removedfrom solution. The high broadcast treatments showed similar reductions in soluble Pas the buffer strip treatment, but the high broadcast treatment required four times theamount of WTR (72.6 kg plot-1).
Reductions in soluble P in the runoff water due to WTR application in LeFlore County(Figure 7) was smaller than the results from Adair County (Figure 6). In general, WTRtreatments showed small but significant reductions in soluble P (p <0.05) in the LeFloreCounty experiment. Further reductions in soluble P in the runoff water were not seenwhen higher amounts of WTR were applied to the plots (Figure 7). Mean soluble P is94% of the mean total P in the runoff water from LeFlore County. Therefore reductionsbetween total P and soluble P were similar. Differences in soluble P in runoff betweenlocations can result from different sources of poultry litter, different WTR, or acombination of litter and WTR. The poultry litters used at the two locations were fromdifferent sources. Laboratory analysis showed P content of the two litters were similar(Appendix A). Furthermore, total P concentrations in runoff from the control plots fromAdair County (15.0 mg L-1) and control plots from LeFlore County (18.8 mg L-1) weresimilar. Different WTR was used for each experiment; WISTER was used in LeFloreCounty, while ABJ was used in Adair County. Laboratory P adsorption studies haveshown WISTER removes less P from solution than ABJ WTR (Peters and Basta,1996).Effect of WTR on Nitrogen in Surface Runoff
Nitrogen measured in runoff water included NH4-N, NO3 and total N. The relativeamounts of the three forms of soluble N in runoff water were total N>NH4>>NO3.Therefore only NH4-N and total N values are shown. Significant reductions of solubleNH4-N for the high broadcast treatments and the buffer strip treatments compared tocontrol plots were observed at the Adair County site (Table 17). Total N was notreduced (p <0.05) for any of the treatments as compared to the control plots (Figure 8).Mean soluble NH4-N was 50% of the mean total N indicating that almost half of solubleN was in organic forms in runoff water. The ABJ WTR had a CEC of 54.7 cmol kg -1capable of adsorbing significant amounts of NH4. Soluble NH4-N can be absorbed bythe CEC of the WTR, but NO3 and organic forms of N have less affinity for the WTR.A summary of the statistical analysis is given in Table 16.
WTR treatments did not reduce soluble NH4-N or total N at the LeFlore County location(Figure 9, Table 17). Both locations had similar amounts of soluble NH4-N in the runoffwater from the control plots. However, only 37% for total N in runoff water was NH4-Nindicating most of the soluble N was in organic forms. The WISTER WTR of 16.4 cmolkg -1 is smaller than ABJ 54.7 cmol kg -1. Perhaps, adsorption of NH4 on CEC siteswas limited by WISTER.
Potential Environmental Impacts
Increased solids in surface runoff into nearby water bodies from areas treated withWTR may be a concern. Mean total suspended solids in Adair County for the high

-9-
broadcast, low broadcast and the buffer strip treatments of 0.750, 0.375 and 0.588 gkg -1, respectively, were not different (p <0.05) than the 0.438 g kg -1 from controlplots. Mean total suspended solids in the LeFlore County experiment for the highbroadcast, low broadcast and the buffer treatments of 0.563, 0.625 and 0.463 g kg -1,respectively, were not different than the 0.500 g kg -1 from control plots. Landapplication of WTR did not increase solids present in the surface runoff water.
Because alum-based WTR contains amorphous Al, there is concern that landapplication of WTR will increase Al solubility in soil and may cause Al toxicity to plants.However, most alum residuals are alkaline (pH>7) and most Al occurs as insolubleoxides not as highly soluble aluminum sulfate. Application of 100 g ABJ kg -1 to anacidic Dickson soil (pH 5.3) increased the pH to 7.0 (Peters and Basta, 1996).Similarly, application of WISTER WTR at 100 g kg -1 to the same acidic soil raised thepH to 5.6.. Mean soluble Al (in mg L-1) for the control plots (0.023), the high broadcastplots (0.025), the low broadcast plots (0.027) and the buffered plots (0.029) were notdifferent (P<0.05) for the Adair County experiment (Figure 10). Mean soluble Al inrunoff water in the LeFlore County experiment (in mg L-1) from the control plots (0.060),the high broadcast plots (0.048), the low broadcast plots (0.055), and the buffer stripplots (0.049) were not different (p <0.05). Land application of WTR did not increasesoluble Al in the surface runoff water.
Discussion
The ABJ WTR reduced P and NH4 in the runoff water more than WISTER WTR.Moore and Miller (1994) found that Ca has a tremendous ability to bind P via adsorptionand/or precipitation. The Ca content of ABJ was 21.9 g kg -1 while WISTER was 2.1g kg -1. Furthermore, soluble Ca in ABJ is greater than WISTER WTR (Table 9).Other studies have shown amorphous Al was correlated with the P adsorption capacityof WTR (Elliot, 1990). Amorphous Al content of ABJ was 50.5 g kg -1, which was muchgreater than the WISTER amorphous Al content of 11.7 g kg -1. Our results suggestthat adsorption of soluble P by amorphous Al and/or precipitation of soluble P with Cain WTR were important mechanisms to reduce soluble P in runoff water. SolubleNH4-N can be absorbed by the CEC of the WTR. Larger decreases of soluble NH4 inrunoff water from plots treated with ABJ than plots treated with WISTER suggestadsorption of soluble NH4 by CEC sites in WTR was an important mechanism to reducesoluble NH4 in runoff water (Table 16).
Reductions in N and P were found for the high broadcast and buffer treatments in thisfield study. However, broadcast treatments required four times the amount of WTR tobe as effective as buffer strips. Application of WTR as buffer strips was more effectivethan broadcast in reducing nutrients in runoff water in this study, but larger scaleoperations may produce different results. Our field study used plots with even surfacesand constant slopes. The water was channeled to flow directly through the entire widthof the buffer strip and into the collection troughs. Application of WTR to a much largerfield scale with less homogenous surfaces and slopes may result in "short-circuiting"of runoff water where runoff flows preferentially through only part of the buffer strip.Short-circuiting may result in a large amount of the buffer strip not interacting or

-10-
absorbing nutrients while some of the buffer strip may be saturated with nutrients by thesurface runoff water. In this case, a broadcast application may provide more interactionwith nutrients in runoff water and reduce nutrient runoff more effectively than the bufferstrip.
Land application of alum based WTR does not increase dissolved Al in surface runoff(Peters and Basta, 1996; Elliot et al., 1988) or extractable Al in soil (Peters and Basta,1996). Aluminum in WTR exists as insoluble form of aluminum oxide, in soilenvironments that are not strongly acidic (pH>5). In this study, soil acidity was notincreased by the application of alkaline WTR. Soils typically contain 5 to 10% Al andWTRs contain similar amounts of Al. However, WTRs contain a higher percentage ofamorphous Al, which is more soluble under highly acid conditions (pH<5). If the pHremains greater that 5, both Al in the soil and WTR are insoluble and thus would notbe expected to be associated with Al toxicity. At pH less than 5, differences in Alsolubility between WTR and soil have not been determined.
CONCLUSIONS AND RECOMMENDATIONS
The following conclusions and recommendations are based on the demonstratedBMPs that had replicated plots, i.e. manure application rate, pasture aeration, watertreatment residuals (alum sludge), vegetation height, commercial fertilizer and poultrylitter comparison.
Traditional BMPs
For the conditions studied, plot slope had a significant effect for all response variablesexcept solids and organic N. In previous Oklahoma State University rainfall simulatorstudies, slope was found to be insignificant or occasionally marginally significant. In thecurrent and previous studies the effect of slope was found to be very complex. Thuswe do not recommend adjusting BMP recommendations for slope without furtherstudies. We also found that, for the conditions studied, the aeration and vegetationheight treatments does not have a significant effect.
Based on the Kerr-August and Hudson Farms data, as well as previous studies, wefound that increasing litter application rate increases nutrient loss (N and P) in surfacerunoff. When the P and N response variables were normalized by the N or Papplication rate, the high and low litter application rates were not significantly different.This indicates there was a linear response to litter application rate for P and N.
The commercial fertilizer treatment response was different from the litter applicationtreatments. The normalized surface runoff P concentrations for the commercialfertilizer treatments were always significantly higher than the litter applicationtreatments. This indicates that on a per unit application basis commercial fertilizer hassignificantly higher losses to surface runoff than poultry litter. Therefore, poultry litteris the preferred P fertilizer source for permanent pasture.

-11-
Nitrogen showed mixed results. For the Hudson Farms demonstration, the normalizedsurface runoff total N, ammonium, and organic N concentrations were significantlyhigher from commercial fertilizer than poultry litter. However, these normalized Nresponse variables were not significantly different for the Kerr-August demonstration,and the normalized mean concentrations were lower for the commercial fertilizertreatment. Therefore we have no recommendation at this time on use of poultry littervs commercial fertilizer (ammonium nitrate) for N losses to surface runoff.
Based on these demonstrations the following conclusions can be made:1. Slope should be considered when developing BMP recommendations.However, additional studies are needed to make specific recommendations.2. Aeration has no significant effect and should not be considered a BMP.3. For the conditions studied, i.e. good vegetation stand with 1.5 to 20 inch height,vegetation height has no significant effect.4. Increasing litter application rate increases nutrient losses. Therefore, litterapplication rates should be minimized to reduce potential off-site water qualityimpacts.5. P from triple super phosphate fertilizer is more mobile that poultry litter, andthus has higher losses in surface runoff. Therefore, from a water qualityperspective, poultry litter is the preferred P fertilizer for permanent pasture.6. Based on current information, no recommendation can be made at this timebetween commercial N fertilizer (ammonium nitrate) and poultry litter.
Water Treatment Residuals
Two WTRs were used in three treatments: an edge of plot buffer strip and twobroadcast rates. One WTR reduced P and NH4 in surface runoff significantly, whereasthe other WTR did not. No significant difference was found between broadcast andbuffer strip treatments. In addition, soluble Al in surface runoff ranged from 0.02 to0.09 mg/Lm, and WTR treated plots were not significantly different from the control.Therefore, land application of alum-based WTR does not increase dissolved Al insurface runoff. Related studies showed that these WTRs did not increase soilextractable Al.
The ability of WTRs to reduce P and NH4 in runoff depends on the Ca content,amorphous Al content and cation exchange capacity of the WTR. Drinking watertreatment plants use different source waters and different treatment chemicals andproduce WTRs with different chemical compositions and properties. Therefore, furtherstudies on specific WTRs are needed to evaluate their potential to reduce nutrients insurface runoff.
The following can be concluded for WTRs from these demonstrations:1. Some WTRs can reduce P and NH4 in surface runoff, and thus have potentialas a BMP.2. Land application of alum-based WTR does not increase dissolved Al in surfacerunoff or extractable Al in soil.

-12-
EDUCATION ACTIVITIES
Three rainfall simulator demonstrations were conducted. Two demonstrations wereconducted in LeFlore County at the Kerr Center for Sustainable Agriculture, Poteau,Oklahoma, one on June 18-19 and the second on August 6-7. The third demonstrationwas conducted in Adair County, at the Hudson Farms Chance Complex Number 8, justoutside Chance, Oklahoma, on July 9-10. For the June19, 1996 demonstrationapproximately 80 people attended, for the July 10, 1996 demonstration approximately40 people attended, and for the August 7, 1996 demonstration approximately 40 peopleattended. The agenda for the demonstration programs is given below.
Rainfall Simulator Field Demonstration Program
8:30 Begin Rainfall
9:00 Welcome (Local County Agricultural Extension Agent)
9:10 Experimental Design and Setup (Dan Storm)
9:20 Use of Hydrosolids to Reduce Phosphorus Runoff (Nick Basta)
9:30 How Results of Study Relate to Application of Broiler Litter and Swine LagoonEffluent (Doug Hamilton, Extension Waste Management Specialist)
9:50 Move Audience to Litter Calibration Area
10:00 Calculating Application Rates, Spreader Truck Calibration (Doug Hamilton, and JoeBullard or Mitch Fram)
10:30 Demonstration of Pasture Renovator to Roughen Surface and Distribute Litter (JoeBullard and Jim Ennis) - Poteau Only.
10:55 Move Audience back to Main Area for Refreshments
11:00 Pond Fencing Demonstration at Pond Site (Baker, and Mitch Fram or Joe Bullard)
11:30 Free time to visit equipment displays.
Three facts sheets on animal waste were developed and are given in Appendix C. Alsoincluded in Appendix C are handouts given at the demonstrations, an examplenewspaper clipping, and the demonstration announcements.
As one measure of success, a follow up survey to non-governmental attendees wasconducted, i.e. agricultural producers. Joe Bullard and Mitch Fram conducted thesurveys in March of 1997 by telephone or by a site visit. The surveys are given inAppendix D. A summary of the survey results is given in Table 18. Results from theHudson Farms demonstration were lost in the mail. No backup copies were available,and thus these data are not included.
The results of the survey were very encouraging. The producers thought the presentedBMPs were very practical and could be easily implemented. Although we did not

-13-
completely convince everyone that there can be problems with excessive landapplication of nutrients, all were convinced that they could effectively use a combinationof poultry litter and commercial fertilizer. Quite a few practices were implemented asa result of information obtained at the demonstrations. One example is the use ofbuffer strips, which went from 20% to 60% implementation from before to after thedemonstrations. In addition, each producer implemented at least one additional BMPfollowing the demonstration.
REFERENCES
Bremner, J.M. 1996. Nitrogen-Total. p. 1085-1122 In D.L Sparks, A.L. Page, P.A.Helmke, R.H. Loeppert, P.N. Soltanpour, M.A. Tabatabai, C.T. Johnston and M.E.Sumner (eds.) Methods of Soil Analysis, Part 3, Chemical Methods. SSSA & ASA,Madison, WI.
Cole, J.T., J.H. Baird, N.T. Basta, R.L. Huhnke, D.E. Storm, G.V. Johnson, M.E.Payton, M.D. Smolen, D.L. Martin, and J.C. Cole. 1997. Influence of Buffers onPesticide and Nutrient Runoff from Bermudagrass Turf. J. Environ. Qual.26:1589-1598.
Elliot, H.A., B.A. Dempsey & J. DeWolfe. 1988. Land Disposal of Drinking WaterSludge. ASAE meeting presentation. No. 88-2579:1-13.
Elliot, H.A. and B.A. Dempsey. 1991. Agronomic Effects of Land Application of WaterTreatment Sludges. Journal AWWA 84(3):126-131.
Galarneau, E. and R. Gehr. 1996. Phosphorus Removal from Waste waters:Experimental and Theoretical Support for Alternative Mechanisms. Water ResourcesVol. 31, No. 2:328-338.
Johnson, G.V. 1992. Determination of Sulfate Sulfur by Monocalcium PhosphateExtraction. p. 13-15 In S.J. Donohue (ed.) Soil and Media Diagnostic Procedures forthe Southern Region of the United States. Bulletin No. 374.
Keeney, D.R. and D.W. Nelson. 1982. Nitrogen-Inorganic forms. p. 643-698. In A.L.Page, R.H. Miller and D.R. Keeney (eds.) Methods of Soil Analysis, Part 2, Chemicaland Microbiological Properties, 2nd Edition. SSSA & ASA, Madison, WI.
Kuo, S. 1996. Phosphorus. p. 869-920. In D.L Sparks, A.L. Page, P.A. Helmke, R.H.Loeppert, P.N. Soltanpour, M.A. Tabatabai, C.T. Johnston and M.E. Sumner (eds.)Methods of Soil Analysis, Part 3, Chemical Methods. SSSA & ASA, Madison, WI.
Liu, F, C.C. Mitchell, D.T. Hill, J.W. Odum and E.W. Rochester. 1997.PhosphorusRecovery in Surface Runoff from Swine Lagoon Effluent by Overland Flow. J. Environ.Qual. 26:995-1001.

-14-
Mehlich, A. 1984. Mehlich III Soil Test Extractant: A modification of Mehlich IIextractant. Comm. Soil Sci. Plant Anal. 15:1409-1416.
Moore, P.A., and D.M. Miller. 1994. Decreasing phosphorus solubility in poultry litterwith aluminum, calcium, and iron amendments. J. Environ. Qual.23:325-330.
Mulvaney, R.L. 1996. Nitrogen-Inorganic Forms. p. 1123-1184. In D.L Sparks, A.L.Page, P.A. Helmke, R.H. Loeppert, P.N. Soltanpour, M.A. Tabatabai, C.T. Johnstonand M.E. Sumner (eds.) Methods of Soil Analysis, Part 3, Chemical Methods. SSSA& ASA, Madison, WI.
Peters, J.M. and N.T. Basta. 1996. Reduction of Excessive Bioavailable Phosphorusin Soils by Using Municipal and Industrial Wastes. J. Environ. Qual. 25:1236-1241.
Rhoades, J.D. 1982. Cation Exchange Capacity. p. 149-157. In A.L. Page, R.H.Millerand, D.R. Keeney (eds.) Methods of Soil Analysis, Part 2, Chemical andMicrobiological Properties, 2nd Edition. SSSA& ASA, Madison, WI.
Robinson, J.S. and A.N. Sharpley. 1996. Reaction in Soil of Phosphorus Releasedfrom Poultry Litter. Soil Sci. Soc. Am. J. 60:1583-1588.
Ross, G.J. and C. Wang. 1993. Acid Ammonium Oxalate Method. In M.R. Carter (ed.)Soil Sampling and Methods of Analysis. Ann Arbor, MI.
Schepers, J.S., D.D. Francis, and M.T. Thompson. 1989. Simultaneous determinationof total C, total N, and 15N on soil and plant material. Commun. in Soil. Sci. Plant Anal.20(9&10):949-959.
Sharpley, A.N. 1997. Rainfall Frequency and Nitrogen and Phosphorus Runoff fromSoil Amended with Poultry Litter. J. Environ. Qual. 26:1127-1132.
Shreve, B.R., P.A. Moore, Jr., T.C. Daniel, D.R. Edwards, and D.M. Miller. 1995.Reduction of Phosphorus in Runoff from Field-Applied Poultry Litter Using ChemicalAmendments. J. Environ. Qual. 24:106-111.
Standard Methods for the Examination of Water and Wastewater. 1992a.4500-NorgC. Semi-Micro-Kjeldahl Method. p. 4-96-4-98. In A.E. Greenberg, L.S.Clesceri and A.D. Eaton (eds.) 18th ed. American Public Health Assoc. Washington,DC.
Standard Methods for the Examination of Water and Wastewater. 1992b. 4500-PPhosphorus. p. 4-108-4-113. In A.E. Greenberg, L.S. Clesceri and A.D. Eaton (eds.)18th ed. American Public Health Assoc. Washington, DC.
Stout, W.L., A.N. Sharpley and H.B. Pionke. 1998. Reducing Soil PhosphorusSolubility with Coal Combustion By-Products. J. Environ. Qual. 27:111-118.

-15-
Table 1. Kerr plot slopes for the June rainfall simulator demonstration.
Setup Plot Plot AverageNumber Number Number Slope
(LUH)1 (%)1 1 1 7.31 2 2 7.31 3 3 7.81 4 4 7.52 1 5 6.32 2 6 5.72 3 7 5.72 4 8 5.53 1 9 6.43 2 10 6.63 3 11 6.43 4 12 6.44 1 13 6.64 2 14 6.34 3 15 6.84 4 16 7.65 1 17 8.65 2 18 9.35 3 19 9.15 4 20 9.06 1 21 8.56 2 22 8.66 3 23 8.56 4 24 8.67 1 25 6.27 2 26 6.37 3 27 6.67 4 28 6.78 1 29 7.88 2 30 8.18 3 31 4.18 4 32 6.9
1 Left to right looking uphill.

-16-
Table 2. Kerr plot slopes for the August rainfall simulator demonstration.
Setup Plot Plot AverageNumber Number Number Slope
(LUH)1 (%)9 1 1 4.69 2 2 4.49 3 3 3.89 4 4 3.7
10 1 5 9.610 2 6 9.410 3 7 7.910 4 8 7.411 1 9 7.411 2 10 7.311 3 11 6.511 4 12 6.512 1 13 9.612 2 14 9.612 3 15 4.812 4 16 9.213 1 17 8.313 2 18 8.513 3 19 9.013 4 20 9.814 1 21 9.114 2 22 9.614 3 23 9.914 4 24 9.915 1 25 5.215 2 26 5.315 3 27 5.615 4 28 6.015 1 29 5.716 2 30 5.616 3 31 5.016 4 32 4.9
1 Left to right looking uphill.

-17-
Table 3. Hudson Farms plot slopes for the June rainfall simulator demonstration.
Setup Plot Plot AverageNumber Number Number Slope
(LUH)1 (%)17 1 1 2.917 2 2 2.917 3 3 3.117 4 4 3.018 1 5 3.518 2 6 3.218 3 7 2.918 4 8 3.119 1 9 3.619 2 10 3.519 3 11 3.319 4 12 3.020 1 13 3.020 2 14 3.520 3 15 4.020 4 16 3.921 1 17 4.421 2 18 4.221 3 19 3.821 4 20 3.822 1 21 3.222 2 22 3.122 3 23 3.922 4 24 3.823 1 25 4.523 2 26 3.923 3 27 4.323 4 28 4.524 1 29 4.824 2 30 4.724 3 31 4.224 4 32 3.7
1 Left to right looking uphill.

-18-
Table 4. Average plot slope by setup for the Kerr and Hudson Farms rainfall simulatordemonstrations.
Location Month Setup Number Average Slope(%)
Kerr June 1 7.52 5.83 6.54 6.85 9.06 8.67 6.58 6.7
Average 7.2
August 9 4.110 8.611 6.912 8.313 8.914 9.615 5.516 5.3
Average 7.2
Hudson Farms July 17 3.018 3.219 3.420 3.621 4.122 3.523 4.324 4.4
Average 3.7

-19-
Table 5. Rainfall simulator demonstration treatment summary.
Site Month I.D. Plots Average TreatmentSlope
Kerr June A 4 6.9 High Application Rate Alum - BroadcastB 4 7.3 Low Application Rate Alum - BroadcastC 4 6.5 Low Equivalent Application Rate Alum - BufferD 4 7.4 Standard Poultry Litter Application Rate - Low VegetationE 4 7.8 Treatment D with AerationF 4 7.2 Standard Poultry Litter Application Rate - High VegetationG 4 7.3 Commercial Fertilizer - Low VegetationH 2 6.8 High Poultry Litter Application Rate - Low VegetationI 1 6.7 Eq. Standard Poultry Litter Application Rate - Buffer StipJ 1 7.6 Control - No Nutrient Additions - Low Vegetation
Kerr August A 4 6.5 High Application Rate Alum - BroadcastB 4 6.2 Low Application Rate Alum - BroadcastC 4 7.0 Low Equivalent Application Rate Alum - BufferD 4 7.6 Standard Poultry Litter Application Rate - Low VegetationE 4 7.4 Treatment D with AerationF 4 6.4 Standard Poultry Litter Application Rate - High VegetationG 2 6.1 Commercial Fertilizer - Low VegetationH 1 9.6 High Poultry Litter Application Rate - Low VegetationI 1 9.9 Eq. Standard Poultry Litter Application Rate - Buffer StipJ 3 8.7 Control - No Nutrient Additions - Low VegetationK 1 7.3 Swine Manure - Low Vegetation
Hudson July A 4 3.9 High Application Rate Alum - BroadcastB 4 3.5 Low Application Rate Alum - BroadcastC 4 3.4 Low Equivalent Application Rate Alum - BufferD 4 3.3 Standard Poultry Litter Application Rate - Low VegetationF 4 3.5 Standard Poultry Litter Application Rate - High VegetationG 4 4.0 Commercial Fertilizer - Low VegetationH 3 3.6 High Poultry Litter Application Rate - Low VegetationI 1 4.8 Eq. Standard Poultry Litter Application Rate - Buffer StipJ 3 3.8 Control - No Nutrient Additions - Low VegetationK 1 4.4 Dairy Manure - Low Vegetation

-20-
Table 6. Rainfall simulator demonstration treatments.
Location I.D. Plots Amend- Amend- Amend- Nutrient Nutrient Veget- Buffer Aera-(Month) ment ment ment Source Rate ation Length tion
Area Rate Height(ft) (Mg/ha) (tons/ac) (in) (ft)
Kerr A 4 Alum 32 10 Poultry 3 3 0 None(June) B 4 Alum 32 5 Poultry 3 3 0 None
C 4 Alum 8 20 Poultry 3 3 0 NoneD 4 None 0 0 Poultry 3 3 0 NoneE 4 None 0 0 Poultry 3 3 0 YesF 4 None 0 0 Poultry 3 eq. 6+ 0 NoneG 4 None 0 0 Com. Fert. 3 eq. 3 0 NoneH 2 None 0 0 Poultry 6 3 0 NoneI 1 None 0 0 Poultry 4 3 8 NoneJ 1 None 0 0 None 0 3 0 None
Kerr A 4 Alum 32 45 Poultry 3 3 0 None(August) B 4 Alum 32 11 Poultry 3 3 0 None
C 4 Alum 8 90 Poultry 3 3 0 NoneD 4 None 0 0 Poultry 3 3 0 NoneE 4 None 0 0 Poultry 3 3 0 YesF 4 None 0 0 Poultry 3 eq. 6+ 0 NoneG 2 None 0 0 Com. Fert. 3 eq. 3 0 NoneH 1 None 0 0 Poultry 6 3 0 NoneI 1 None 0 0 Poultry 4 3 8 NoneJ 3 None 0 0 None 0 3 0 NoneK 1 None 0 0 Swine ? 3 0 None
Hudson A 4 Alum 32 45 Poultry 3 3 0 None(July) B 4 Alum 32 11 Poultry 3 3 0 None
C 4 Alum 8 90 Poultry 3 3 0 NoneD 4 None 0 0 Poultry 3 3 0 NoneF 4 None 0 0 Poultry 3 eq. 6+ 0 NoneG 4 None 0 0 Com. Fert. 3 eq. 3 0 NoneH 3 None 0 0 Poultry 6 3 0 NoneI 1 None 0 0 Poultry 4 3 8 NoneJ 3 None 0 0 None 0 3 0 NoneK 1 None 0 0 Dairy ? 3 0 None

-21-
Table 7. Plot number and treatment identification.
Site Month Setup Plot Treatment# # I.D.
Kerr June 1 1 B1 2 C1 3 H1 4 E2 5 G2 6 H2 7 A2 8 C3 9 E3 10 C3 11 D3 12 F4 13 C4 14 F4 15 A4 16 J5 17 E5 18 F5 19 D5 20 B6 21 G6 22 E6 23 A6 24 B7 25 D7 26 G7 27 A7 28 I8 29 D8 30 G8 31 B8 32 F

-22-
Table 7 (cont.). Plot number and treatment identification.
Site Month Setup Plot Treatment# # I.D.
Kerr August 9 1 B9 2 C9 3 A9 4 G
10 5 H10 6 E10 7 D10 8 J11 9 D11 10 K11 11 B11 12 A12 13 C12 14 J12 15 F12 16 J13 17 B13 18 G13 19 F13 20 E14 21 C14 22 D14 23 A14 24 I15 25 B15 26 D15 27 E15 28 F16 29 F16 30 A16 31 C16 32 E

-23-
Table 7 (cont.). Plot number and treatment identification.
Site Month Setup Plot Treatment# # I.D.
Hudson July 17 1 D17 2 F17 3 B17 4 J18 5 A18 6 B18 7 H18 8 G19 9 D19 10 C19 11 A19 12 C20 13 F20 14 D20 15 J20 16 G21 17 K21 18 G21 19 C21 20 B22 21 C22 22 D22 23 H22 24 B23 25 J23 26 H23 27 F23 28 A24 29 I24 30 G24 31 A24 32 F

-24-
Table 8. Uncut vegetation heights for 1996 rainfall simulator demonstrations.
Location Month Treatment Plot Setup Vegetation# # Height
(in)
Kerr June F 4 3 6-8F 2 4 5F 2 5 6-8F 4 8 6I 4 7 5
Kerr August F 3 12 12-20F 3 13 12-16F 4 15 12-18F 1 16 10-16I 4 14 8-14
Hudson July F 2 17 7F 1 20 6F 3 23 6F 4 24 6I 1 24 6

-25-
Table 9. Properties, chemical components and nutrient content of water treatmentresiduals.
Water Treatment ResidualProperties AB Jewell WisterpH 7.6 7.0EC, dS m -1 0.58 0.31CCE, g kg -1 148 18.7CEC, cmol kg -1 54.7 16.4OC, g kg –1 66.8 39.3
Chemical ComponentsAl oxide, g kg -1 50.5 11.7Fe oxide, g kg -1 4.2 5.0Total N, g kg –1 8.98 4.53Aqueous Components, mg L-1
Al 0.08 0.10Ca 375 60.0Mg 4.70 7.65P 0.27 0.10
Nutrients, mg kg -1
NH4-N 58.4 31.2NO3-N 240 34.2P 11.9 16.8SO4-S 143 165

-26-
Table 10. Soil moisture and chemical properties for 0-6 inch composite soil cores.
Site Month Setup Soil Moisture Soil Available Mehlich MehlichDry Basis pH N P K
(%) (lbs/ac) (lbs/ac) (lbs/ac)
Kerr June 1 21 5.1 6 11 2332 13 4.9 6 19 3473 . 5.0 9 39 3934 . 5.0 25 25 2525 23 4.6 8 21 2326 14 5.0 12 17 2177 30 5.2 28 31 2058 29 5.3 22 36 235
Kerr August 9 32 5.3 20 24 26610 36 5.1 10 19 16111 35 5.0 18 36 41912 . 4.8 15 22 26813 37 4.7 12 21 16914 22 4.6 9 29 27715 29 5.4 8 13 21716 24 5.3 7 12 314
Hudson July 17 14 5.6 17 38 15818 12 5.4 8 42 18219 15 5.2 5 35 26720 15 5.6 19 38 32821 14 5.1 6 34 15422 17 5.3 18 51 29723 17 5.3 5 31 14924 14 5.2 5 33 133

-27-
Table 11. Poultry litter analysis results.
Site Month Moisture N P KDry Basis
(%) (%) (%) (%)
Kerr June 18 3.5 1.5 2.6
Kerr August 19 3.5 1.7 3.1
Hudson July 14 3.0 1.6 2.8

-28-
Table 12. Time to surface runoff by plot number and treatment identification.
Site Month Setup Plot Treatment Time to# # I.D. Runoff
(min)
Kerr June 1 1 B 30.51 2 C 28.51 3 H 22.51 4 E 24.02 5 G 28.52 6 H 44.52 7 A 46.02 8 C 52.03 9 E 42.53 10 C 45.03 11 D 44.53 12 F 48.04 13 C 30.04 14 F 32.04 15 A 5.54 16 J 9.55 17 E 8.05 18 F 4.05 19 D 6.55 20 B 8.56 21 G 12.06 22 E 4.06 23 A 22.56 24 B 25.07 25 D 23.07 26 G 28.57 27 A 27.57 28 I 39.08 29 D 41.58 30 G 41.58 31 B 46.08 32 F 51.5

-29-
Table 12 (cont.). Time to surface runoff by plot number and treatment identification.
Site Month Setup Plot Treatment Time to# # I.D. Runoff
(min)
Kerr August 9 1 B 21.09 2 C 22.59 3 A 22.59 4 G 23.5
10 5 H 12.010 6 E 12.010 7 D 11.010 8 J 11.511 9 D 25.511 10 K 32.011 11 B 26.011 12 A 25.012 13 C 14.012 14 J 12.012 15 F 21.012 16 J 13.513 17 B 13.513 18 G 10.513 19 F 14.513 20 E 10.514 21 C 21.014 22 D 23.014 23 A 6.514 24 I 14.515 25 B 16.015 26 D 12.015 27 E 15.015 28 F 13.516 29 F 21.516 30 A 24.516 31 C 22.516 32 E 19.5
-30-
Table 12 (cont.). Time to surface runoff by plot number and treatment identification.
Site Month Setup Plot Treatment Time to# # I.D. Runoff
(min)
Hudson July 17 1 D 25.517 2 F 69.517 3 B 46.517 4 J 46.018 5 A 48.018 6 B 46.018 7 H 42.518 8 G 55.019 9 D 5.519 10 C 6.019 11 A 6.019 12 C 6.020 13 F 3.020 14 D 3.520 15 J 28.020 16 G 3.521 17 K 37.521 18 G 35.521 19 C 25.021 20 B 34.522 21 C 51.522 22 D 47.022 23 H 37.022 24 B 50.523 25 J 3.523 26 H 5.023 27 F 5.023 28 A 5.524 29 I 5.524 30 G 3.524 31 A 5.524 32 F 4.5

-31-
Table 13. Surface runoff results.
Site Month Plot Treat- Setup Rep. Solids Volume Total P Sol P Total N Amm Sol. Al# ment # # (%) (L) (mg/L) (mg/L) (mg/L) (mg/L) (mg/L)
Kerr June 7 A 2 1 0.035 233 8.4 9.3 45 8.7 0.072Kerr June 15 A 4 2 0.040 791 10.2 12.3 68 16.9 0.061Kerr June 23 A 6 3 0.070 846 5.8 6.9 42 13.4 0.037Kerr June 27 A 7 4 0.065 578 8.1 8.9 52 17.8 0.051Kerr June 1 B 1 1 0.030 644 6.2 7.0 31 3.6 0.050Kerr June 20 B 5 2 0.045 647 6.0 6.3 24 7.0 0.044Kerr June 24 B 6 3 0.060 709 5.8 6.7 48 13.3 0.037Kerr June 31 B 8 4 0.075 156 6.0 6.7 48 13.7 0.060Kerr June 2 C 1 1 0.075 1026 4.7 5.6 24 3.1 0.039Kerr June 8 C 2 2 0.025 60 5.6 6.7 31 9.0 0.062Kerr June 10 C 3 3 0.020 818 4.8 6.3 12 8.9 0.038Kerr June 13 C 4 4 0.060 373 8.1 10.4 51 18.9 0.051Kerr June 11 D 3 1 0.010 202 5.6 5.0 14 6.8 0.041Kerr June 19 D 5 2 0.050 709 4.5 5.8 27 6.5 0.035Kerr June 25 D 7 3 0.055 819 6.7 6.9 56 15.8 0.044Kerr June 29 D 8 4 0.055 276 6.9 8.7 49 13.7 0.040Kerr June 4 E 1 1 0.055 1228 3.8 4.3 19 15.3 .Kerr June 9 E 3 2 0.025 283 4.0 5.1 14 5.0 .Kerr June 17 E 5 3 0.025 677 4.6 5.7 23 5.8 .Kerr June 22 E 6 4 0.045 834 8.2 9.2 55 14.6 .Kerr June 12 F 3 1 0.045 94 4.4 4.4 27 5.2 .Kerr June 14 F 4 2 0.035 441 11.1 12.7 56 17.8 .Kerr June 18 F 5 3 0.025 987 3.4 3.9 17 5.5 .Kerr June 32 F 8 4 0.055 113 9.1 11.1 59 17.1 .Kerr June 5 G 2 1 0.020 356 15.3 20.0 34 18.5 .Kerr June 21 G 6 2 0.065 865 14.1 13.4 50 14.1 .Kerr June 26 G 7 3 0.055 928 23.5 27.4 67 23.5 .Kerr June 30 G 8 4 0.050 357 20.8 24.7 53 20.8 .Kerr June 3 H 1 1 0.080 938 14.5 16.3 72 19.5 .Kerr June 6 H 2 2 0.075 308 18.5 22.7 77 26.2 .Kerr June 28 I 7 1 0.065 383 6.3 6.9 52 13.6 .Kerr June 16 J 4 1 0.020 468 0.5 0.7 6 0.3 .Hudson July 5 A 18 1 0.045 16 4.6 4.4 26 10.6 0.024Hudson July 11 A 19 2 0.045 114 2.9 2.4 29 5.9 0.025Hudson July 28 A 23 3 0.045 544 11.7 7.3 56 17.8 .Hudson July 31 A 24 4 0.165 588 15.2 11.4 29 11.1 0.026Hudson July 3 B 17 1 0.025 80 12.6 12.5 75 30.4 0.027Hudson July 6 B 18 2 0.040 59 12.4 11.2 47 27.4 0.028Hudson July 20 B 21 3 0.050 304 13.2 11.4 55 27.7 0.022Hudson July 24 B 22 4 0.035 108 12.3 11.1 38 27.1 0.030Hudson July 10 C 19 1 0.060 237 6.4 6.1 51 14.8 0.035Hudson July 12 C 19 2 0.070 163 7.0 6.0 22 14.7 0.022Hudson July 19 C 21 3 0.055 530 10.0 9.2 55 22.5 0.028Hudson July 21 C 22 4 0.050 848 9.2 8.1 45 19.7 0.029Hudson July 1 D 17 1 0.045 292 11.9 11.1 47 27.1 0.022Hudson July 9 D 19 2 0.050 163 14.1 13.9 43 33.9 0.021Hudson July 14 D 20 3 0.035 156 15.0 13.9 64 33.8 0.021Hudson July 22 D 22 4 0.045 228 19.0 16.5 48 40.1 0.028Hudson July 2 F 17 1 0.050 2 8.7 8.3 32 20.3 .Hudson July 13 F 20 2 0.035 320 10.9 10.4 85 25.4 .Hudson July 27 F 23 3 0.045 637 11.6 11.0 53 26.7 .Hudson July 32 F 24 4 0.040 665 15.7 15.2 68 37.1 .Hudson July 8 G 18 1 0.050 21 36.0 34.6 164 84.4 .Hudson July 16 G 20 2 0.065 118 19.8 19.5 52 47.6 .Hudson July 18 G 21 3 0.045 103 46.7 42.1 207 102.5 .Hudson July 30 G 24 4 0.060 681 44.9 43.0 229 104.7 .Hudson July 7 H 18 1 0.110 104 28.9 27.7 101 67.6 .Hudson July 23 H 22 3 0.060 215 25.0 23.0 82 56.0 .Hudson July 26 H 23 4 0.080 746 25.8 23.6 105 57.5 .Hudson July 29 I 24 1 0.055 701 12.1 11.4 61 27.8 .Hudson July 4 J 17 1 0.010 254 2.1 1.8 8 4.4 .Hudson July 25 J 23 2 0.015 677 0.5 0.5 7 1.2 .
-32-
Table 13 (cont.). Surface runoff results.
Site Month Plot Treat- Setup Rep. Solids Volume Total P Sol P Total N Ammonium Soluble Al# ment # # (%) (L) (mg/L) (mg/L) (mg/L) (mg/L) (mg/L)
Hudson July 15 J 20 3 0.030 331 2.1 2.1 12 5.2 .Hudson July 17 K 21 1 0.065 155 15.4 10.8 36 26.5 .Kerr August 3 A 9 1 0.05 1102 17.5 17.0 53 19.8 0.031Kerr August 12 A 11 2 0.065 742 15.7 16.0 53 28.2 0.045Kerr August 23 A 14 3 0.055 966 15.0 15.2 55 27.5 0.063Kerr August 30 A 16 4 0.055 819 13.4 13.1 55 25.0 0.054Kerr August 1 B 9 1 0.07 760 15.0 13.8 74 19.6 0.056Kerr August 11 B 11 2 0.045 674 17.2 15.3 78 27.9 0.062Kerr August 17 B 13 3 0.095 895 15.7 13.1 74 22.9 0.049Kerr August 25 B 15 4 0.04 1056 13.6 12.6 59 22.4 0.053Kerr August 2 C 9 1 0.035 935 16.7 17.3 59 19.8 0.033Kerr August 13 C 12 2 0.025 872 15.4 14.1 69 24.6 0.061Kerr August 21 C 14 3 0.075 693 13.1 13.7 47 19.3 0.065Kerr August 31 C 16 4 0.05 920 12.4 11.8 54 19.7 0.035Kerr August 7 D 10 1 0.07 1305 20.6 18.7 106 26.1 0.057Kerr August 9 D 11 2 0.06 454 17.8 16.5 70 24.8 0.050Kerr August 22 D 14 3 0.03 564 16.8 13.5 42 18.7 0.088Kerr August 26 D 15 4 0.04 1166 19.8 19.6 69 31.2 0.043Kerr August 6 E 10 1 0.08 1587 17.0 17.0 78 23.1 .Kerr August 20 E 13 2 0.035 1001 19.8 17.7 65 25.7 .Kerr August 27 E 15 3 0.00 1064 20.2 18.9 77 29.8 .Kerr August 32 E 16 4 0.04 879 13.9 13.6 44 23.1 .Kerr August 15 F 12 1 0.065 807 15.2 14.9 72 27.1 .Kerr August 19 F 13 2 0.065 1061 18.9 17.4 85 22.3 .Kerr August 28 F 15 3 0.065 1157 17.6 15.4 66 26.7 .Kerr August 29 F 16 4 0.05 866 14.6 12.6 54 24.3 .Kerr August 4 G 9 1 0.055 430 59.4 53.5 33 14.7 .Kerr August 18 G 13 4 0.04 1415 52.6 49.8 54 41.3 .Kerr August 5 H 10 1 0.04 819 45.0 43.0 181 62.5 .Kerr August 24 I 14 1 0.04 795 12.8 11.3 30 14.7 .Kerr August 16 J 12 1 0.055 1009 0.8 0.4 8 0.9 .Kerr August 8 J 10 2 0.07 765 1.9 1.4 10 2.3 .Kerr August 14 J 12 3 0.135 1077 0.5 0.3 7 0.4 .Kerr August 10 K 11 1 0.06 420 5.0 4.6 21 6.1 .
Table 14. Poultry litter and commercial fertilizer application rates.
Location Month Poultry Litter Commercial Fertilizertons/ac lbs N/ac lbs P/ac lbs N/ac lbs P/ac
Kerr June 3 210 90 280 356 420 180
Kerr August 3 210 100 280 356 410 200
Hudson July 3 180 95 280 356 360 190

-33-
Table 15. ANOVA statistical analysis results.
Variable1 Kerr-June Kerr-August Hudson FarmsTreatment ------------------------------------ --------------------------- --------------------------------
Mean Least Compar- Mean Least Compar- Mean Least Compar-Square ison2 Square ison2 Square ison2
Mean Mean MeanTotal P
D 5.9 6.6 a 19. 20. b 15. 14. bF 7.0 7.6 a 17. 17. b 12. 11. bG 18. 19. b 56. 56. c 37. 36. dH 17. 17. b 45. 47. c 27. 26. cJ 0.5 1.3 a 1.1 2.4 a 1.6 0.6 a
Norm. Total PD 0.066 0.079 a 0.19 0.20 a 0.16 0.14 aF 0.078 0.089 a 0.17 0.17 a 0.12 0.10 aG 0.53 0.54 b 1.60 1.60 b 1.05 1.03 bH 0.092 0.099 a 0.23 0.26 a 0.14 0.12 a
Soluble PD 6.6 7.5 a 17. 18. b 14. 12. bF 8.1 8.9 a 15. 15. b 11. 9.7 bG 21. 22. b 52. 52. c 35. 34. dH 20. 20. b 43. 45. c 25. 23. cJ 0.7 1.7 a 0.7 2.4 a 1.5 0.2 a
Norm. Sol. PD 0.073 0.089 a 0.17 0.19 a 0.15 0.12 aF 0.089 0.10 a 0.15 0.16 a 0.12 0.096 aG 0.61 0.63 b 1.47 1.48 b 1.00 0.98 bH 0.11 0.12 a 0.22 0.25 a 0.13 0.11 a
Total ND 36. 35. a 72. 70. b 51. 53. abF 40. 39. a 69. 69. b 60. 61. bG 51. 50. a 44. 44. ab 163. 165. cH 75. 74. a 181. 178. c 96. 98. bJ 6.1 4.9 a 8.4 6.3 a 9.0 11. a
Norm.Total ND 0.17 0.17 a 0.34 0.34 a 0.28 0.29 aF 0.19 0.19 a 0.33 0.33 a 0.33 0.34 aG 0.18 0.18 a 0.16 0.16 a 0.58 0.59 bH 0.18 0.18 a 0.43 0.42 a 0.27 0.27 a
Amm.D 11. 11. a 25. 25. b 34. 34. bF 11. 11. a 25. 25. b 27. 28. bG 19. 19. a 28. 28. b 85. 85. dH 23. 23. a 63. 62. c 60. 61. cJ 0.3 0.1 a 1.2 0.9 a 3.6 3.8 a
1Total P and soluble P are in units of mg/L and normalized P variables are in units of mg/L/lbsP/acre.2Equal letters are not significantly different at an ÿ=0.05.

-34-
Table 15 (cont.). ANOVA statistical analysis results.
Variable1 Kerr-June Kerr-August Hudson FarmsTreatment ---------------------------------- -------------------------------------- --------------------------------
Mean Least Compar- Mean Least Compar- Mean Least Compar-Square ison2 Square ison2 Square ison2
Mean Mean MeanNorm. Amm.
D 0.05 0.05 a 0.12 0.12 a 0.19 0.19 aF 0.05 0.05 a 0.12 0.12 a 0.15 0.15 aG 0.07 0.07 a 0.10 0.10 a 0.30 0.30 bH 0.05 0.05 a 0.15 0.15 a 0.17 0.17 a
Organic ND 25. 25. a 46. 45. b 17. 19. aF 28. 27. a 44. 44. b 32. 34. aG 32. 31. a 16. 16. ab 78. 80. bH 52. 51. a 119. 116. c 36. 37. aJ 5.8 4.8 a 7.2 5.4 a 5.4 6.7 a
Norm.Organ. ND 0.12 0.12 a 0.22 0.22 a 0.10 0.10 aF 0.13 0.13 a 0.21 0.21 a 0.18 0.18 abG 0.11 0.11 a 0.06 0.06 a 0.28 0.28 bH 0.12 0.12 a 0.28 0.28 a 0.10 0.10 a
Solids (%)D 0.043 0.041 a 0.050 0.049 a 0.044 0.046 abF 0.040 0.039 a 0.061 0.061 a 0.043 0.044 abG 0.048 0.046 a 0.048 0.047 a 0.055 0.057 bH 0.078 0.077 a 0.040 0.037 a 0.083 0.085 cJ 0.020 0.019 a 0.087 0.084 a 0.018 0.020 a
1Organic N is in units of mg/L and normalized Organic N is in units of mg/L/lbs N/acre.2Equal letters are not significantly different at an ÿ=0.05.3Total N and ammonium are in units of mg/L and normalized N variables are in units ofmg/L/lbs N/acre.
4Equal letters are not significantly different at an ÿ=0.05.

-35-
Table 16. ANOVA statistical analysis results for WTRs.
Site/ NH4 Total N Dissolved P Total PTreatment Mean Compar- Mean Compar- Mean Compar- Mean Compar-
(mg/L) ison1 (mg/L) ison1 (mg/L) ison1 (mg/L) ison1
Hudson - July
Broadcast - High A 11 b 35 a 6.4 b 8.6 b
Broadcast - Low B 28 a 54 a 12 a 13 a
Buffer C 18 b 43 a 7.4 b 8.1 b
Control D 34 a 51 a 14 a 15 a
Kerr - August
Broadcast - High A 25 a 54 a 15.3 a 15 b
Broadcast - Low B 23 a 71 a 13.7 b 15 b
Buffer C 21 a 57 a 14.2 a 14 b
Control D 25 a 72 a 17.1 a 19 a
1Equal letters are not significantly different at an ÿ=0.05.

-36-
Table 17. Reduction in NH4 from application of water treatment residuals.
NH4 NH4 NH4
Site Month Treatment Average Reduction(mg/L) (mg/L) (%)
Hudson July A 11A 6A 18A 11 11 -66B 30B 27B 28B 27 28 -17C 15C 15C 23C 20 18 -47D 27D 34D 34D 40 34 0
Kerr August A 20A 28A 27A 25 25 -0.4B 20B 28B 23B 22 23 -8C 20C 25C 19C 20 21 -17D 26D 25D 19D 31 25 0

-37-
Table 18. Rainfall simulator demonstration survey results summary.
Question Number of ResponseResponses
1) How practical do you rate thefollowing practices:
a) Manure Spreader Calibration 4 Very Practical1 Very Practical to Practical
b) Floating Fence for Limiting Pond 2 Very Practical to PracticalAccess 3 Practical
c)Vegetative Buffer Strips 4 Very Practical1 Very Practical to Practical
d) Soil Testing for Nutrient Management 5 Very Practical
2) Do you think high rates of fertilizer or 4 Yesmanure application can cause off-site 1 No (not with proper management)water quality problems?
3) Do you think balancing nutrient 5 Yesapplication of poultry litter with commercialfertilizer is a viable option?
4) Since the rainfall simulator 1 Soil Testingdemonstration during the summer of 1996, 1 Buffer Stripswhat changes in management have you 1 More Frequent Soil Testingconsidered? 1 Soil Testing
1 Use Commercial N to Balance Nutrients1 Pond Exclusion1 Floating Fence
5) Which have you implemented on your 2 Buffer Stripsfarm? 1 Soil Testing
1 Freeze Proof Water System for LivestockExclusion
1 Buffer Strips (Already in Use)
6) What do you recall learning from the 1 Excess rates of litter or fertilizer increasesummer of 1996 field day? runoff losses
1 Buffer strips have value1 soil testing to determine litter application1 rainfall simulator results1 aeration was not valuable (for water quality)
7) Do you have any suggestions or 1 Need more producers at demonstrationscomments? 1 Good
1 More demonstrations like this

-38-
Adair County
LeFlore County
Figure 1. Location of Adair and LeFlore Counties.
Figure 2. Setup locations for the Kerr Center for Sustainable Agriculture site.

-39-
Hudson FarmsChance #8
North
Slope
Road
17
20
191821
22
23
24
Figure 3. Setup locations for the Hudson Farms Chance Complex Number 8 site.
-40-
RainfallSimulator
Plot 1 Plot 2 Plot 3 Plot 4
Collection Pit(Plots 2 and 3)
CollectionPit
CollectionPit
Downslope
Collection Troughs
WettedDiameter
Figure 4. Rainfall simulator with plot layout. Ten booms with staggered nozzles notshown .
Figure 5. Cross-section view of plot area showing position of end plate andcollection trough.

-41-
Br-High
Dis
solv
edan
dT
otal
P(m
gL
-1)
0
2
4
6
8
10
12
14
16dissolved Ptotal P
Br-Low Buffer Control
Treatment
***
*
Figure 6. Soluble and total P in runoff water from plots treated with poultry litter in theAdair county experiment. Treatments are broadcast high application (Br-High, 44.8 Mgha -1 or 72.6 kg plot -1), broadcast low application (Br-Low, 18.5 Mg ha -1 or 18.2 kgplot -1, buffer strip (Buffer, 44.8 Mg ha -1 or 18.2 kg plot -1), and control.

-42-
Control
Dis
solv
edan
dT
otal
P(m
gL
-1)
0
2
4
6
8
10
12
14
16
18
20dissolved Ptotal P
Treatment
Br-High BufferBr-Low
* ***
Figure 7. Soluble and total P in runoff water from plots treated with poultry litter in theLeFlore county experiment. Treatments are broadcast high application (Br-High, 44.8Mg ha -1 or 72.6 kg plot -1), broadcast low application (Br-Low, 18.5 Mg ha -1 or 18.2kg plot -1, buffer strip (Buffer, 44.8 Mg ha -1 or 18.2 kg plot -1), and control.

-43-
Dis
solv
edN
H4-
Nan
dT
otal
N(m
gL
-1)
0
10
20
30
40
50
60soluble NH4-Ntotal N
ControlBufferBr-Low
**
Br-High
Treatments
Figure 8. Total N and soluble NH4 in runoff water from plots treated with poultry litter inthe Adair county experiment. Treatments are broadcast high application (Br-High, 44.8Mg ha -1 or 72.6 kg plot -1), broadcast low application (Br-Low, 18.5 Mg ha -1 or 18.2kg plot -1, buffer strip (Buffer, 44.8 Mg ha -1 or 18.2 kg plot -1), and control.

-44-
Br-High
Dis
solv
edN
H4-
Nan
dT
otal
N(m
gL
-1)
0
10
20
30
40
50
60
70
80soluble NH4-N
total N
TreatmentBr-Low Buffer Control
Figure 9. Total N and soluble NH4 in runoff water from plots treated with poultry litter inthe LeFlore county experiment. Treatments are broadcast high application (Br-High,44.8 Mg ha -1 or 72.6 kg plot -1), broadcast low application (Br-Low, 18.5 Mg ha -1 or18.2 kg plot -1, buffer strip (Buffer, 44.8 Mg ha -1 or 18.2 kg plot -1), and control.

-45-
Br-High
Sol
uble
Al(
mg
L-1
)
0.00
0.01
0.02
0.03
0.04
0.05
0.06
Adair CountyLeFlore County
Br-Low ControlBuffer
Treatment
Figure 10. Soluble Al in runoff water from plots in the Adair and LeFlore countyexperiments. Treatments are broadcast high application (Br-High, 44.8 Mg ha -1 or 72.6kg plot -1), broadcast low application (Br-Low, 18.5 Mg ha -1 or 18.2 kg plot -1, bufferstrip (Buffer, 44.8 Mg ha -1 or 18.2 kg plot -1), and control.

-46-
APPENDIX ALaboratory Results: Evaluating the Properties of Biosolids
SUMMARY
Poultry and swine production has created both economic growth in Oklahoma andconcern over the effect of excessive land application of animal manure on water quality.The objectives of this study were to evaluate the ability of municipal and industrialwastes to reduce excessive amounts of bioavailable P in soil and to determine potentialenvironmental impacts from these waste treatments. The ability of two drinking watertreatment alum hydrosolids (HS1, HS2), cement kiln dust (CKD), and treated bauxitered mud (RM) to reduce bioavailable P in soil was evaluated in a laboratory incubationstudy. Two soils that contained 553 and 296 mg kg-1 Mehlich III extractable P, as aresult of prior treatment with poultry litter or dairy manure, were mixed withamendments at the rate of 30 and 100 g kg-1 soil and incubated at 25°C for 9 weeks.Reductions in Mehlich III extractable P from 553 mg kg-1 to 250 mg kg-1 followed thetrend HS2, CKD ³ HS1 ³ RM in the slightly acidic Dickson soil. Reductions in MehlichIII extractable P from 296 mg kg-1 to 110 mg kg-1 followed the trend HS2 > HS1 > RM> CKD in the calcareous Keokuk soil. Reduction of soluble P followed similar trends.In general, increasing amendment rates from 30 to 100 g kg-1 decreased Mehlich IIIP and soluble P. Most treatments did not result in excessive soil pH or increases in soilsalinity, in extractable Al, or in heavy metals in soils. Alum hydrosolid is currently beinglandfilled at great expense to municipalities. Application of alum hydrosolids to soilswith excessive amounts of bioavailable P in sensitive watersheds may improve drinkingwater quality and provide financial savings for municipalities.
INTRODUCTION
Growing poultry and swine production has contributed to an increase in economicgrowth for Oklahoma agriculture (Sharpley et al., 1991). Along with economic benefits,producers are faced with disposal of large amounts of animal manure generated frompoultry and swine production. Land application of animal manure increases soilavailable P and has raised concerns about P runoff from agricultural land (Field et al.,1985; Reddy et al., 1980; Sharpley et al., 1991; Singh and Jones, 1976).
Recent benchmark Conservation Practice Standard and Waste Utilization guidelinesset by the Oklahoma Natural Resource Conservation Service (NRCS) limit animalmanure applications to soils with excessive amounts of Mehlich III (M3) P (NRCS,1994). These guidelines were designed to determine the application rate of animalmanure beneficial to soils in sensitive watersheds. Application rate is based on soil testP determination by M3 extraction, field slope, soil depth, soil erodibility, flood plain, andother factors that minimize non point source (NPS) P pollution.
Recently, U.S. EPA Region VI promulgated Concentrated Animal Feeding Operation(CAFO) regulations and the Oklahoma Feed Yard Act have utilized Oklahoma NRCSguidelines that limit application of animal manures to P-sensitive watersheds. Theseguidelines limit animal manure applications to land with excessive amounts of available

-47-
P. Reduction of bioavailable P in soils that exceed CAFO levels would reduce the NPSthreat to sensitive watersheds. Land application of nonhazardous waste materials thatreduce P solubility may be a feasible approach to reduce bioavailable P in soils.
Soluble forms of phosphorus are readily adsorbed and precipitated by soil or sedimentcomponents that contain aluminum, iron, and calcium (Hsu, 1964; Hsu, 1976). Iron andaluminum oxides (hydrous oxides) strongly adsorb and precipitate P from solution innatural water and soil systems (Stumm and Morgan, 1981; Tisdale et al., 1985).Calcium reacts with soluble P to form insoluble phosphorus compounds (Lindsay,1979).
Alum sludge, or alum hydrosolid, is a waste by-product generated from drinking waterpretreatment. Alum hydrosolids contain aluminum oxides capable of adsorbing andprecipitating soluble phosphorus. Alum hydrosolids were investigated as a soilamendment to improve the physical properties of potting media and plant growth byBugbee and Frink (1985). Alum hydrosolids improved water-holding capacity andserved as a liming material, but higher application rates of alum hydrosolids causedsevere P deficiency and decreased lettuce yield (Bugbee and Frink, 1985). Alumhydrosolid additions to soil improved soil structure and plant growth, but highapplication rates (>2 MT ha-1) induced P deficiencies and reduced corn yields(Rengasamy et al., 1980). Land application of alum hydrosolids have induced similarP deficiencies in other studies (Heil and Barbarick, 1989). The ability of commercialalum to reduce P solubility in poultry litter (Moore and Miller, 1994) and reduce solubleP in field runoff water (Shreve at al., 1995) has recently been reported. Acidity derivedfrom alum is neutralized by ammonia from poultry litter resulting in production ofamorphous aluminum oxides in alum-treated poultry litter (Moore et al., 1995).Similarly, Al in alum hydrosolids from water treatment plants exists as insolublealuminum oxides. Untreated alum (aluminum sulfate) is a very soluble salt thatreleases toxic aluminum and produces acidity when dissolved in water. Landapplication of alum may result in undesirable soil acidification and phytotoxic levels ofAl3+. However, alum-treated litter or alum hydrosolids have neutral or alkaline pH andAl exists as insoluble aluminum oxides which should not release toxic aluminum orproduce acidity in soil or aqueous systems.
Bauxite red mud, which contains large amounts of aluminum and iron oxides andcalcium, is a waste product of the aluminum industry (Shiao and Akashi, 1977).Shannon and Verghese (1976) suggested that bauxite red mud could be economicallyused as a phosphorus removal amendment by precipitation. After treatment with acids,bauxite red mud is an effective adsorbent for the removal of P (Barrow, 1982; Shiaoand Akashi, 1977; and Weaver and Ritchie, 1987). However, bauxite red mud hasundesirable properties. Bauxite red mud contains lye and has a high pH (9-12), largeelectrical conductivity (60-350 dS m-1), and large amounts of soluble sodium (9 meq100g-1) and aluminate. Bauxite red mud is corrosive and is classified as a hazardouswaste (Thompson, 1987). Land application of bauxite red mud results in saline andalkaline conditions and poor soil physical structure (Wong and Ho, 1991). Theseundesirable properties have prevented use of bauxite red mud in natural water and soilsystems (Vachon et al., 1994). Most studies have focused on reclamation of soils

-48-
rendered infertile by bauxite red mud (Thompson, 1987). In a study by Vlahos et al.(1989) on the effects of P reduction on sandy soils, bauxite red mud was found to bean extremely effective material in removal of total P in leachate after application ofsuperphosphate fertilizer. Water retention, pH, calcium, and total soluble salt increasedafter application of the bauxite red mud amendment to soil.
The ability of calcium to "fix" phosphorus into relatively insoluble forms is well known(Ford, 1933). Calcium reacts with soluble P to form insoluble calcium phosphates insoils at moderate to high pH (pH >6). Reagent-grade CaO and Ca(OH)2 were the bestamendments in reducing soluble P in chicken litter (Moore and Miller, 1994). Cementkiln dust (CKD) is a waste product generated during production of cement. Cement kilndust is rich in calcium and potassium oxides.
Land application of nonhazardous waste materials has the potential to reduceexcessive amounts of bioavailable P in soil but more information is needed. Wastematerials that contain hydrous oxides (e.g., alum sludge, bauxite red mud) or calcium(cement kiln dust) are readily available. Additional information is needed to assess theability of waste amendments to reduce bioavailable P and not cause any potentialadverse environmental impacts. The objectives of this study were (1) to evaluate theability of two drinking water treatment alum hydrosolids, cement kiln dust, and treatedbauxite red mud to reduce bioavailable P in soils, and (2) to determine potentialenvironmental impacts including excessive pH, salinity, available Al, and heavy metalavailability associated with application of these waste materials to soil.
MATERIALS AND METHODS
Amendments
The effect of soil amendments to reduce bioavailable P was evaluated in a laboratoryincubation study. Four amendments used in this study were two alum hydrosolids(HS1, HS2) collected from two water treatment facilities, cement kiln dust, and treatedbauxite red mud. Both alum hydrosolid materials were alum sludges. Untreatedbauxite red mud (21 kg) was treated with gypsum (4.1 kg) and leached with deionizedwater to remove excess lye and sodium before analysis and use in this incubationstudy.
All amendments were analyzed for pH, salinity, calcium carbonate equivalent (CCE),total metal content, and extractable heavy metals by U.S. Environmental ProtectionAgency Toxicity Characteristic Leaching Procedure (TCLP; U.S. EPA, 1990).
Amendment pH was analyzed in 1:2 amendment:0.01 M CaCl2 solution using a glasselectrode (McLean, 1982). Electrical conductivity (EC) of each amendment wasanalyzed in 1:2 amendment:deionized water solution (Rhoades, 1982). Calciumcarbonate equivalent (CCE) was determined by reaction with HCl and backtitration asdescribed by Rund (1984).

-49-
Total metal content of amendments was determined by wet digestion with HNO3 andHClO4 (Burau, 1982) and subsequent determination of Al, Ca, Cd, Cu, Fe, K, Mg, Mn,Mo, Na, Ni, Pb, and Zn by inductively coupled plasma atomic emission spectroscopy(ICP). Metals were extracted from amendments according to the U.S. EPA TCLPmethod (U.S. EPA, 1990). The samples were filtered using 0.45 mm membrane filtersand analyzed by ICP instrumentation for Ba, Cd, Cu, Mo, Ni, Pb, and Zn.
Soils
Two soils with a history of animal manure application and contained large amounts ofM3 P were selected for the incubation study. Surface (<10 cm) soil samples werecollected, air dried, and sieved (<2 mm). Mehlich III extractable P levels were 553 and296 mg P kg-1 soil and soil pH were 5.3 and 8.2 for Dickson silt loam (fine-silty,siliceous, Thermic Glossic Fragiudult) and Keokuk very fine sandy loam (coarse-silty,mixed, Thermic Fluventic Haplustoll), respectively. The Dickson soil received >10 yearsof poultry litter and the Keokuk soil received >10 years of dairy manure.
Cation exchange capacity of the soils was determined by using BaCl2 as described byRhoades (1982). The citrate-bicarbonate-dithionite procedure described by Olsen andEllis (1982) was used to measure free iron oxides. A modified Mebius method wasused to determine the soil organic carbon content of each soil (Yeomans and Bremner,1988).
Soils were incubated with amendments in a growth chamber for a nine week period.Incubation temperature was 26°C during the day (16 h) and 24°C during the night (8h). The incubator was maintained at approximately 60% humidity. Soil (250 g) wasmixed with amendment rates of 30 g kg-1 and 100 g kg-1 in plastic pots. Theexperimental design was a completely randomized block with three replications andcontrols (no amendment) for each soil. Soils were maintained at field capacity (-0.3bar) moisture content. Triumph 64 wheat (Triticum spp.) was planted on the amendedsoils as a qualitative indicator of potential impact of amendments on crop growth.
The ability of amendments to reduce plant available P was determined by measuringphosphorus extracted by the Mehlich III procedure from amended soils at 3, 5, and 9weeks of incubation (Mehlich, 1984). Soils were sampled by thoroughly mixing theentire volume of treated soil and removing a subsample (10 g). Twenty milliliters of M3extractant was added to 2 g of soil from each sample and placed on a rotary shaker for5 min. The samples were then filtered using Whatman #2 filter paper. Phosphorusextracted by the M3 P procedure was measured by the Modified Murphy-Riley method(Murphy and Riley, 1962). Soluble P in amended soils was determined after 9 weeksof incubation. Ten milliliters of 0.01 M CaCl2 was added to soil (5 g) and placed on ashaker for 15 h. The Modified Murphy-Riley method was used to analyze soluble P infiltered soil solution. Extractable aluminum was determined using potassium chloride(KCl) extraction (Barnhisel and Bertsch, 1982). Aluminum in KCl extracts wasmeasured by ICP.

-50-
Treatment effects on measured parameters were evaluated by using multiplecomparison of means by Duncan's Multiple Range Test (Steele and Torrie, 1980).Statistical analysis of data was performed using appropriate procedures given by theSAS Institute (SAS, 1988).
RESULTS AND DISCUSSION
Reduction of Bioavailable P
The greatest changes in Mehlich III (M3) P and pH occurred in the first three weeks ofincubation for the Dickson (Fig. 1) and Keokuk soils (data not shown). Chemicalreactions between the soils and amendments were assumed to be essentially completeafter nine weeks of incubation. Therefore, only results after nine weeks of incubationwill be presented.
Both soils showed significant (P < 0.05) decreases in M3 P for all amendmenttreatments after nine weeks of incubation (Fig. 2). Reduction of M3 P followed thetrend HS2, CKD ³ HS1 ³ RM for the slightly acidic Dickson soil. A different trend for thecalcareous Keokuk soil was found: HS2 > HS1 > RM > CKD. The alum hydrosolidsfollowed the same general trend in both the slightly acidic and the calcareous soils:HS2 ³ HS1. Greater reduction of M3 P by alum hydrosolids than CKD or RM is likelydue to highly reactive amorphous Al oxides (Elliott et al., 1988; Young et al., 1988).Because drinking water treatment may involve adjustment of water pH with limingmaterials, some alum hydrosolids may contain significant amounts of calcium. Thelarger total calcium in HS2 compared to HS1 (Table 2) suggests larger reductions in M3P may be partly due to formation of calcium precipitates. The ability of CKD to reduceP in the calcareous soil is significantly less than P reductions in slightly acidic soil.Although CKD does not contain large amounts of aluminum oxides it does containsignificant amounts of calcium (Table 2). Large amounts of calcium in CKD mayreduce P bioavailability in soil by forming Ca-P precipitates. The ability of CKD toreduce bioavailable P in the calcareous soil was significantly less than in the slightlyacidic soil. These differences may be related to relative contribution of CKD to changesin soil pH of the treated soils (Table 2). Treatment of soil with CKD may have resultedin formation of greater amounts of Ca-P precipitates in the Dickson soil than in theKeokuk soil. In general, increasing rates of all amendments from 30 to 100 g kg-1decreased soil M3 P.
None of the amendments reduced the M3 P to <200 mg kg-1, the severe non pointsource (NPS) P pollution level guideline of the Oklahoma Natural ResourceConservation Service (NRCS, 1994), in the Dickson soil. However, the HS2 100 g kg-1rate lowered the M3 P from 553 to 250 mg kg-1 in the Dickson soil. In the Keokuk soil,the HS1, HS2, and RM 100 g kg-1 rate lowered the M3 P from 296 to <200 mg kg-1.The addition of these amendments should decrease the NPS runoff threat ofbioavailable phosphorus in soil to sensitive surface waters.
The M3 P procedure extracts both readily soluble and insoluble P minerals that may notbe immediately bioavailable in aquatic environments (Fixen and Grove, 1990).

-51-
Although M3 P is related to potential P availability and Oklahoma NRCS guidelines arebased on M3 P, soluble P may be a better environmental indicator of bioavailability andimpact on aquatic life. All amendments reduced soluble P in soils (Fig. 2). Reductionof soluble P in Dickson and Keokuk soils followed the trend HS2 ³ HS1 > CKD, RM.Soluble P reduction was similar to M3 P reduction results. A greater reduction insoluble P was found in the slightly acidic Dickson soil than in the calcareous Keokuksoil. Similar to M3 P reduction, increasing the amendment rates from 30 to 100 g kg-1reduced soluble P in all treatments except for HS2 in the Keokuk soil.
Potential Environmental Impact
Soil pH, salinity (EC), extractable aluminum, and heavy metal content and extractabilitywere determined in amendments and soils to ensure the addition of amendments to soildid not result in undesirable potential environmental impacts.
The Triumph 64 wheat (Triticum spp.) that was planted in the treated soils as aqualitative indicator showed no indications of nutrient problems unlike other studieswhich found P deficiencies in sorghum-sudangrass (Heil and Barbarick, 1989), inlettuce (Bugbee and Frink, 1985), and in tomatoes (Elliott and Singer, 1988; Elliott etal., 1990; Young et al., 1988) induced by alum sludge. Plant available P in the Dicksonand Keokuk soils treated with alum hydrosolids were well above P requirements forwheat production (Allen and Johnson, 1993).
The slightly acidic Dickson soil showed significant increases in pH from 5.7 to 8.0 afterthe addition of CKD at the 100 g kg-1 rate (Fig. 3). Cement kiln dust, a known limingmaterial, can easily increase soil pH >7.0 (Gelderman et al., 1992). In general,increasing the amendment rate from 30 to 100 g kg-1 significantly increased pH for allamendments in the Dickson soil. Amendments had little effect on soil pH in the Keokuksoil. Final pH <8.3 of all treated soils is not considered excessive and is not typicallyassociated with potential environmental hazards.
Several amendments (CKD, RM) have significant amounts of soluble salts (Table 1)and might increase soil salinity. The alum hydrosolids did not increase soil salinity (Fig.3). However, 100 g kg-1 rates of CKD and RM resulted in small but significant (P <0.05) changes in EC that may affect salt-sensitive plants (Rhoades and Miyamito,1990).
The effect of alum hydrosolids and other amendments on extractable aluminum in soilis shown in Fig. 3. None of the amendments significantly increased extractable Al inthe Dickson soil. Only the 100 g kg-1 rate of HS1 showed a significant increase inextractable Al in the Keokuk soil. Amendments did not increase extractable aluminumin incubated soils >5 mg Al kg-1. Adverse affects are associated with much higherlevels of extractable Al (>60 mg Al kg-1) for wheat (Sloan et al., 1995). Therefore,slight increases in available aluminum from application of amendments should not haveadverse effects on soils or plants.

-52-
Total metal and TCLP extractable metal of the amendments are presented in Table 3.With the exception of total Cd in CKD and total Cd and Pb in RM, all amendment totalmetal contents were within the range of typical soil total metal contents. Alumhydrosolid heavy metal contents were similar to those reported in other water treatmentsludges (Elliott et al., 1990). Alum hydrosolids used in this study do not containelevated levels of Ni which have been reported for ferric coagulant water-treatmentsludges from steel pickling or bauxite extraction wastes (Elliott et al., 1990; Heil andBarbarick, 1989). Therefore, land application of alum hydrosolids should not increaseheavy metal concentration in soil. Heavy metals extracted by TCLP were below U.S.EPA regulatory levels and showed the amendments are not hazardous wastes.Comparison of TCLP and total metal values show most heavy metal is not inbioavailable forms (Table 3). Amendment TCLP levels were similar to heavy metalsdetermined by TCLP in typical baseline soils (Scott, 1994). Therefore, land applicationof alum hydrosolids should not increase heavy metal availability in soil. Similarly, Elliottet al. (1990) found most heavy metals in alum hydrosolids were strongly bound byaluminum and iron oxides in forms that do not have potential adverse environmentalimpacts.
CONCLUSIONS
The addition of alum hydrosolids, cement kiln dust, and treated bauxite red mud reduceexcessive amounts of bioavailable P in soil. Increasing the rate of amendment will, inmost cases, decrease the amount of bioavailable P. Adverse potential environmentalimpacts from salinity, pH, aluminum, and total and extractable metals on application ofthese municipal and industrial amendments should be insignificant. Most soiltreatments did not result in excessive soil pH or increased soil salinity. However, highrates of cement kiln dust and bauxite red mud may increase soil salinity in the amendedsoil, which may affect salt-sensitive crops. Alum hydrosolid applications had little or noeffect on extractable Al in soil. Land application of alum hydrosolids used in this studyshould not increase content or availability of heavy metals in soils. Alum hydrosolidwastes are currently being landfilled at great expense to municipalities. Also, severalmunicipal water- treatment plants producing alum hydrosolids in Oklahoma may havesource water degraded by non point source P pollution. Alum hydrosolid applicationto soils in sensitive watersheds that have soils with excessive amounts of bioavailableP has the potential to improve drinking water quality and provide financial savings formunicipalities.
REFERENCES
Allen, E.R., and G. V. Johnson. 1993. OSU Soil Test Interpretations. OSU ExtensionFacts no. 2225. Coop. Ext. Serv., Stillwater, OK.
Alloway, B.J. 1990. Appendices. p. 322-325. In B.J. Alloway et al. (ed.) Heavy metalsin soils. John Wiley and Sons, Inc., New York.

-53-
Barnhisel, R., and P. M. Bertsch. 1982. Aluminum. p. 275-300. In A.L. Page et al.(ed.) Methods of soil analysis, Part 2. 2nd ed. Soil Science Society of America andAmerican Society of Agronomy, Madison, WI.
Barrow, N.J. 1982. Possibility of using caustic residue from bauxite for improving thechemical and physical properties of sandy soils. Aust. J. Agric. Res. 33:275-285.
Bugbee, G.J., and C.R. Frink. 1985. Alum sludge as a soil amendment: Effects onsoil properties and plant growth. Conn. Agric. Exp. Stn. Bull. 827, New Haven, CT. 7pp.
Burau, R.G. 1982. Lead. p. 347-365. In A.L. Page et al. (ed.) Methods of soilanalysis, Part 2. 2nd ed. Soil Science Society of America and American Society ofAgronomy, Madison, WI.
Elliott, H.A., and L.M. Singer. 1988. Effect of water treatment sludge on growth andelemental composition of tomato shoots. Commun. Soil Sci. Plant Anal. 19(3):345-354.
Elliott, H.A., B.A. Dempsey, and J. DeWolfe. 1988. Land disposal of drinking watersludge. Presented at the International Winter Meeting of the American Society ofAgricultural Engineers, December 13-16. Paper no. 88-2579. 13 pp.
Elliott, H.A., B.A. Dempsey, D.W. Hamilton, and J.R. DeWolfe. 1990. Land applicationof water treatment sludges: Impacts and management. AWWA Research Foundationand American Water Works Association, Denver, CO. 100 pp.
Field, J.A., R.B. Renau, and W. Kroontje. 1985. Effects of anaerobically digestedpoultry manure on soil phosphorus adsorption and extractability. J. Environ. Qual.14:105-107.
Fixen, P.E., and J.H. Grove. 1990. Testing soils for phosphorus. p. 141-180. In R.L.Westerman et al. (ed.) Soil Testing and Plant Analysis. 3rd ed. Soil Science Societyof America and American Society of Agronomy, Madison, WI.
Ford, M.C. 1933. The nature of phosphate fixation in soils. J. Am. Soc. Agron.25(2):134-144.Gelderman, R., S. Drymalski, and J. Gerwing. 1992. Influence of cement kiln dust oncrop yield and soil pH. South Dakota Exp. Stn. Progress Report 92-14, Brookings, SD.6 pp.
Heil, D.M., and K.A. Barbarick. 1989. Water treatment sludge influence on the growthof sorghum-sudangrass. J. Environ. Qual. 18:292-298.
Holmgren, G.G.S., M.W. Meyer, R.L. Chaney, and R.B. Daniels. 1993. Cadmium,lead, zinc, copper, and nickel in agricultural soils of the United States of America. J.Environ. Qual. 22:335-348.

-54-
Hsu, P.H. 1964. Adsorption of phosphate by aluminum and iron in soils. Soil Sci. Soc.Am. Proc. 28:474-478.
Hsu, P.H. 1976. Comparison of iron(III) and aluminum in precipitation of phosphatefrom solution. Water Res. 10:903-907.
Isaac, R.A., and J.D. Kerber. 1971. Atomic absorption and flame photometry:Techniques and uses in soil, plant, and water analysis. p. 17-37. In L.M. Welsh et al.(ed.) Instrumental methods for analysis of soils and plant tissue. Soil Science Societyof America, Madison, WI.
Lindsay, W.L. 1979. Chemical equilibria in soils. John Wiley and Sons, New York.
McLean, E.O. 1982. Soil pH and lime requirement. p. 199-223. In A.L. Page et al.(ed.) Methods of soil analysis, Part 2. 2nd ed. Soil Science Society of America andAmerican Society of Agronomy, Madison, WI.
Mehlich, A. 1984. Mehlich 3 soil test extractant: A modification of Mehlich 2extractant. Comm. Soil Sci. Plant Anal. 15:1409-1416.
Murphy, J., and J.P. Riley. 1962. A modified single solution method for determinationof phosphate in natural waters. Anal. Chim. Acta. 27:31-36.
Moore, P.A., and D.M. Miller. 1994. Decreasing phosphorus solubility in poultry litterwith aluminum, calcium, and iron amendments. J. Environ. Qual. 23:325-330.
Moore, P.A., T.C. Daniel, D.R. Edwards, and D.M. Miller. 1995. Effect of chemicalamendments on ammonia volatilization from poultry litter. J. Environ. Qual.24:293-300.
Natural Resource Conservation Service. 1994. Conservation practice standard wasteutilization. Code 633. Oklahoma Natural Resource Conservation Service, Stillwater,OK. 8 pp.
Olsen, R.V., and R. Ellis. 1982. Iron. p. 963-973. In A.L. Page et al. (ed.) Methodsof soil analysis, Part 2. 2nd ed. Soil Science Society of America and American Societyof Agronomy, Madison, WI.
Reddy, K.R., M.R. Overcash, R. Kahled, and P.W. Westerman. 1980. Phosphorusadsorption-desorption characteristics of two soils utilized for disposal of animalmanures. J. Environ. Qual. 9:86-92.
Rengasamy, P., J.M. Oades, and T.W. Hancock. 1980. Improvement of soil structureand plant growth by addition of alum sludge. Commun. Soil Sci. Plant Anal.11(6):533-545.

-55-
Rhoades, J.D. 1982. Cation exchange capacity. p. 891-900. In A.L. Page et al. (ed.)Methods of soil analysis, Part 2. 2nd ed. Soil Science Society of America andAmerican Society of Agronomy, Madison, WI.
Rhoades, J.D., and S. Miyamito. 1990. Testing soils for salinity and sodicity. p.299-333. In R.L. Westerman et al. (ed.) Soil testing and plant analysis. 3rd ed. SoilScience Society of America and American Society of Agronomy, Madison, WI.
Rund, R.C. 1984. Agricultural liming materials. p. 1. In S. Williams (ed.) OfficialMethods of Analysis of the Association of Official Analytical Chemists. 14th ed.Arlington, VA.
SAS Institute. 1988. SAS/STATÔ user's guide. Release 6.03 edition. SAS Inst., Inc.,Cary, NC.
Scott, T.D. 1994. Distribution, speciation, and bioavailability of heavy metals in soilsof Oklahoma. M.S. Thesis, Oklahoma State University, Stillwater, OK.
Shannon, E.E., and K.I. Verghese. 1976. Utilization of alumized red mud solids forphosphorus removal. J. Water Pollut. Control Fed. 48(8):1948-1954.
Sharpley, A.N., B.J. Carter, B.J. Wagner, S.J. Smith, E.L. Cole, and G.A. Sample.1991. Impact of long-term swine and poultry manure application on soil and waterresources in eastern Oklahoma. Oklahoma Agric. Exp. Stn. Tech. Bull. T-169.Stillwater, OK. 50 pp.
Shiao, S.J., and K. Akashi. 1977. Phosphate removal from aqueous solution fromactivated red mud. J. Water Pollut. Control Fed. 49:280-285.
Shreve, B.R., P.A. Moore, Jr., T.C. Daniel, D.R. Edwards, and D.M. Miller. 1995.Reduction of phosphorus in runoff from field-applied poultry litter using chemicalamendments. J. Environ. Qual. 24:106-111.
Singh, B.B., and J.P. Jones. 1976. Phosphorus sorption and desorptioncharacteristics of soils as affected by organic residues. Soil Sci. Soc. Am. J.40:389-394.
Sloan, J.J., N.T. Basta, and R.L. Westerman. 1995. Aluminum transformations andsolution equilibria induced by banded phosphorus fertilizer in acid soil. Soil. Sci. Soc.Am. J. 59:357-364.
Steele, R.G.D. and J.H. Torrie. 1980. Duncan's new multiple-range test. p. 187-188.In Principles and procedures of statistics. McGraw-Hill, Inc.
Stumm, W., and J.J. Morgan. 1981. Aquatic chemistry. John Wiley and Sons, NY.

-56-
Thompson, T. 1987. The effects of drainage and amendments on the physical andchemical properties of bauxite residues. M.S. Thesis, Texas A&M University, CollegeStation, TX. 141 pp.
Tisdale, S.L., W.L. Nelson, and J.D. Beaton. 1985. Soil fertility and fertilizers. 4th ed.MacMillan Publishing Company, NY.
U.S. Environmental Protection Agency. 1990. U.S. EPA method 1311: Toxicitycharacteristic leaching procedure. Federal Register 55(61):11862-11875.
Vachon, P., R.D. Tyagi, J.C. Auclair, and K.J. Wilkinson. 1994. Chemical andbiological leaching of aluminum from red mud. Environ. Sci. Tech. 28:26-30.
Vlahos, S., K.J. Summers, D.T. Bell, and R.J. Gilkes. 1989. Reducing phosphorusleaching from sandy soils with red mud bauxite processing residues. Aust. J. Soil Res.27:651-662.
Weaver, D.M., and G.S.P. Ritchie. 1987. The effectiveness of lime-basedamendments and bauxite residues at removing phosphorus from piggery effluent.Environ. Pollut. 46:163-175.
Wong, J.W.C., and G.E. Ho. 1991. Effects of gypsum and sewage sludge amendmenton physical properties of fine bauxite refining residue. Soil Sci. 152(5):326-332.
Yeomans, J.C., and J.M. Bremner. 1988. A rapid and precise method fordetermination of organic carbon in soil. Commun. Soil Sci. Plant Anal. 19:1467-1476.
Young, T.C., A.G. Collins, and R.A. Armstrong. 1988. A pilot-scale evaluation of alumtreatments to reduce lake sediment phosphorus release. J. Environ. Qual.17(4):673-676.

-57-
Table 1. Soil chemical properties and characteristicsSoil
Parameter Dickson Keokuk
Soil texture silt loam sandy loamMehlich III P (mg kg-1) 553. 296.Soluble P (mg kg-1) 13.5 4.1pH 5.3 8.0Electrical conductivity
(dS m-1)0.18 0.37
Cation exchange capacity(cmolc kg-1)
9.3 13.7
Free iron oxides (g Fe kg-1) 0.15 0.10Soil organic C (g kg-1) 17.2 13.1

-58-
Table 2. Chemical properties and total metal content of amendments.Amendments †
Property HS1 HS2 CKD RM
pH 7.0 7.6 12.6 8.1EC‡ 0.31 0.58 17.8 2.63
CCE§ 1.87 14.8 87.5 24.2
TotalMetal
Normal metal content in soil¶
--------------------------------- g kg-1 -----------------------------------------Al 141 147 17.6 111 11-79Ca 2.1 21.9 205 65.0 1-18Fe 35.8 29.6 - 209 0.7-56K 0.79 1.2 - - 0.8-33
Mg 3.26 7.2 7.2 0.79 0.6-12Mn 11.0 0.82 0.13 0.03 0-4Na 0.09 0.38 1.65 9.25 0.7-22
† HS1 = hydrosolids 1; HS2 = hydrosolid 2;CKD = cement kiln dust; RM = bauxite red mud.‡ Electrical conductivity (dS m-1)§ Calcium carbonate equivalent expressed in percent¶ From Isaac and Kerber, 1971
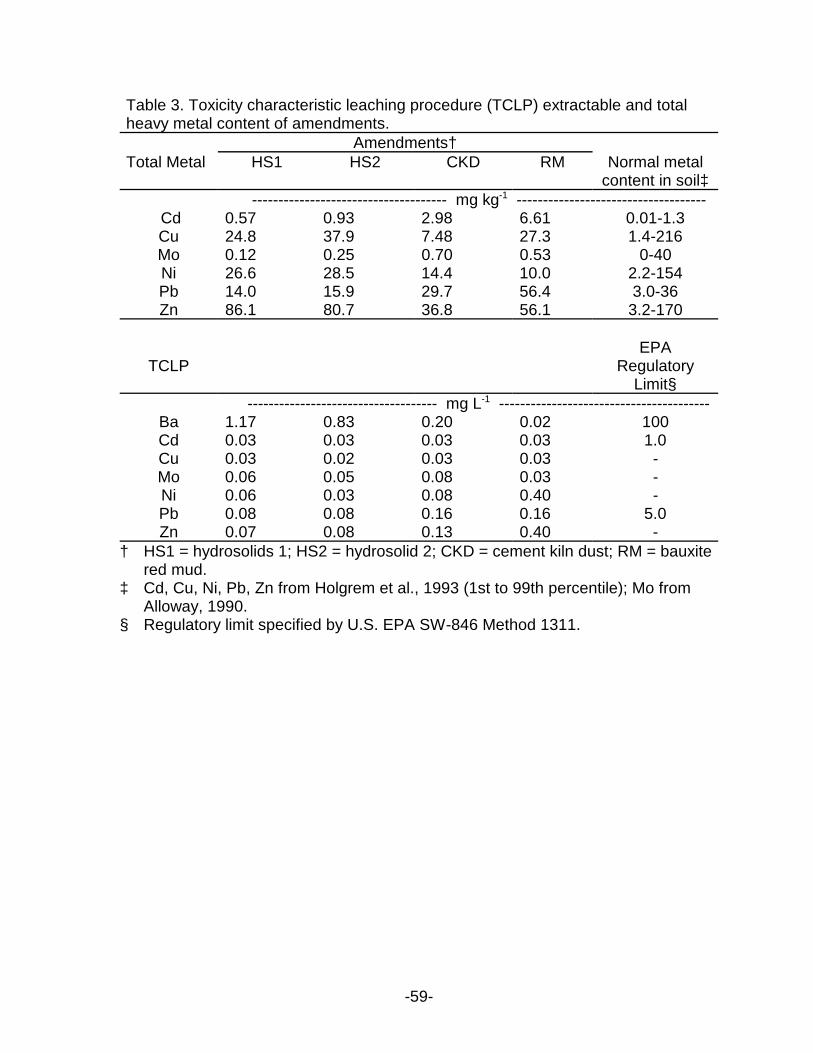
-59-
Table 3. Toxicity characteristic leaching procedure (TCLP) extractable and totalheavy metal content of amendments.
Amendments†Total Metal HS1 HS2 CKD RM Normal metal
content in soil‡------------------------------------- mg kg-1 ------------------------------------
Cd 0.57 0.93 2.98 6.61 0.01-1.3Cu 24.8 37.9 7.48 27.3 1.4-216Mo 0.12 0.25 0.70 0.53 0-40Ni 26.6 28.5 14.4 10.0 2.2-154Pb 14.0 15.9 29.7 56.4 3.0-36Zn 86.1 80.7 36.8 56.1 3.2-170
TCLPEPA
RegulatoryLimit§
------------------------------------ mg L-1 ----------------------------------------Ba 1.17 0.83 0.20 0.02 100Cd 0.03 0.03 0.03 0.03 1.0Cu 0.03 0.02 0.03 0.03 -Mo 0.06 0.05 0.08 0.03 -Ni 0.06 0.03 0.08 0.40 -Pb 0.08 0.08 0.16 0.16 5.0Zn 0.07 0.08 0.13 0.40 -
† HS1 = hydrosolids 1; HS2 = hydrosolid 2; CKD = cement kiln dust; RM = bauxitered mud.
‡ Cd, Cu, Ni, Pb, Zn from Holgrem et al., 1993 (1st to 99th percentile); Mo fromAlloway, 1990.
§ Regulatory limit specified by U.S. EPA SW-846 Method 1311.

-60-
Time (Weeks)0 2 4 6 8 10
Meh
lich
IIIP
(mg
kg-1
)
200
250
300
350
400
450
500
550
600
Time (Weeks)0 2 4 6 8 10
Soi
lpH
5
6
7
8
9
Control (no amendment)
Alum Hydrosolid #1
Alum Hydrosolid #2
Cement Kiln Dust
Bauxite Red Mud
Figure 1. Effect of amendments on Mehlich III extractable P and soil pH treatmentmeans with time in the Dickson soil.

-61-
CHS1
RMCKD
HS2
Sol
uble
P(m
gkg
-1)
0
2
4
6
8
1 0
1 2
1 4
1 6a
cd e
b
cd
e
bc
A m en d m en t
CHS1
RMCKD
HS2
D ick so n S o il
Meh
lich
IIIS
oilP
(mg
kg-1
)
0
1 0 0
2 0 0
3 0 0
4 0 0
5 0 0
6 0 0 a
c
d dd
d
e
b
d
C o n tro l 3 0 g k g -1 1 0 0 g k g -1
CHS1
RMCKD
HS2
K eok u k S o il
ac
e
bc c
f
cd
CHS1
RMCKD
HS2
a
d e f
cd e ef d e
bd
Figure 2. Mehlich III extractable P and 0.01 M CaCl2-soluble P in amended soilsafter 9 weeks of incubation. Columns with the same letter are not different at P <0.05 within each soil. C = control; HS1 = alum hydrosolids #1; CKD = cement kilndust; HS2 = alum hydrosolid #2; RM = bauxite red mud.

-62-
Soi
lEC
(dS
m-1
)
0 .0
0 .2
0 .4
0 .6
0 .8
1 .0
CH
S1RM
CK D
HS2
b cb
a
b cc
b c b c
b c b c
CHS1
RM
CKDHS2
D ic k s o n S o i l
Soi
lpH
4
6
8
g
b
f f
a
e
cd
b
K e o k u k S o i l
c d e f fb a
d e d e d e cE
xtra
ctab
leA
l(m
gkg
-1)
0
1
2
3
4
5
a b
a b
a b a b a b
a
a b
b
a b
A m e n d m e n t
cd
cb
a
c dc
b
a
b cc
b c b c
a
cb c
a b
a
C o n t r o l 3 0 g k g - 1 1 0 0 g k g - 1
Figure 3. Effects of amendments on soil pH, soil EC, and KCl-extractable aluminumin amended soils after 9 weeks of incubation. Columns with the same letter are notdifferent at P < 0.05 within each soil. C = control; HS1 = alum hydrosolids #1; CKD= cement kiln dust; HS2 = alum hydrosolid #2; RM = bauxite red mud.

-63-
APPENDIX BGreenhouse Results: Application of Water Treatment Residuals
SUMMARY
Phosphorus losses in runoff water from land receiving surface application of poultrylitter is becoming a non-point source (NPS) problem to sensitive watersheds and mayresult in eutrophication of surface waters. The beneficial use of two drinking watertreatment alum sludges (hydrosolids) to reduce P in runoff water from land treated withpoultry litter was evaluated. Poultry litter (6.5 Mg ha-1) was applied to box plotscontaining fescue (Festuca arundinacea) to simulate permanent pasture typical of theSoutheastern U.S. Hydrosolid treatments were a completely randomized design withthree replications. Treatments included two types of hydrosolids (HS1, HS2) withbroadcast and buffer strip application methods. Simulated rainfall from a singleoscillating nozzle was applied to fescue boxes at a rate of 3.8 cm h-1 for 84 minutes.Concentration and total mass of soluble phosphorus (P), total P, and total aluminum(Al) in runoff samples were determined. Hydrosolid application significantly reducedthe concentration and total mass of soluble P and total P in runoff water (P < 0.05).Only slight or no increases in total Al concentration and mass in runoff water was found.The buffer strip application appears to be more effective than the broadcast applicationin reducing the concentration (Table 2) and mass (Table 3) of cumulative soluble andtotal P in runoff water. Perhaps better contact between P in the runoff water and thehydrosolid particles occurred in the buffer strip than the broadcast application. Bothhydrosolids reduced P similarly for the contact times of the runoff study. Crushing ofhydrosolids to finer (<0.2 mm) particles will increase surface area and P adsorptioncapacity, thus increasing the ability of the hydrosolids to reduce P in runoff water. Landapplication of hydrosolids may provide a safe and inexpensive solution to controlphosphorus runoff from agricultural land. Hydrosolid application to agricultural landtreated with animal manure in sensitive watersheds may improve drinking water quality andprovide financial savings for municipalities.
INTRODUCTION
The land application of poultry litter and swine manure to agricultural lands provides aneconomical means of supplying beneficial nutrients to crops. However, fieldapplications of poultry litter and swine manure at rates to meet forage nitrogenrequirements normally exceeds phosphorus (P) crop requirements and results inexcessive levels of soil P (Shreve et al., 1995). Phosphorus losses in runoff water fromland receiving surface application of poultry litter is becoming a non-point source (NPS)problem to sensitive watersheds (Edwards and Daniel, 1993; Sharpley and Menzel,1987) and may result in eutrophication of surface waters.
Recent benchmark Conservation Practice Standard and Waste Utilization guidelinespassed by the Oklahoma Natural Resource Conservation Service (NRCS) limit animalmanure applications to soils with excessive amounts of bioavailable P (NRCS, 1994).These guidelines were designed to determine the application rate of animal manurebeneficial to soils in sensitive watersheds. Application rate is based on preventing

-64-
excessive accumulation of P in soil. The Concentrated Animal Feeding Operations(CAFO) regulations in U.S. EPA Region VI have adopted the use of NRCS guidelinesthat limit application of animal manures to P sensitive watersheds. Runoff P willincrease with an increase in bioavailable P in soils (Sharpley, 1992). Reduction ofbioavailable P in soils that exceed CAFO levels would reduce the NPS threat tosensitive watersheds.
Land application of alum (aluminum sulfate) has long since been used to reduce lakesediment P release (Kennedy and Cooke, 1982; Knauer and Garrison, 1981; Welch etal., 1982; and Young et al., 1988). Litter amended with alum to reduce P solubility inrunoff water on agricultural lands with excessive P has also been investigated (Shreveet al., 1995). They found that soluble and total P were significantly reduced. Coale etal. (1994) mixed municipal drinking water purification facility waste material (alumsludge) with soil in a column and reduced P concentration in drainage water.
Surface application of nonhazardous alum sludges (hydrosolids) that reduce P solubilitythrough precipitation and/or adsorption reactions to agricultural lands treated withpoultry litter would effectively reduce the potential for P loss in runoff. The beneficialuse of two drinking water treatment hydrosolids (HS1, HS2) to reduce P in runoff waterwere evaluated in this study.
MATERIALS AND METHODS
Small-scale plots (fescue boxes) in a controlled greenhouse environment were usedin the runoff study. Eighteen boxes which measured 1.0 meter square by 0.33 meterdeep were used with a perforated bottom to hold soil and grow fescue in an effort tosimulate permanent pasture typical of much of the Southeastern U.S. Boxes wereconstructed to determine the effects of rainfall, slope, and vegetation height on runoffwater quality from fescue plots treated with poultry litter (Olson, 1995). The descriptionof the boxes used in this study as constructed by Olson is as follows.
The fescue (Festuca arundinacea) boxes were constructed from a supporting frame ofheavy angle iron with treated plywood attached as the sides of the box. Four steel rodsprovided the support for the bottom of the box. The steel rods also supported a sectionof expanded metal (4.76 mm) on which a piece of fine mesh polyethylene screeningwas then attached. The boxes were filled to a depth of 5 cm with a gravel/sand mixture(Fig. 1). The gravel/sand layer was covered with 2.5 cm of coarse sand. Theremaining volume was filled with a Baxter silt loam (clayey, mixed, mesic, TypicPaleudult) from Delaware County, Oklahoma. The plywood side on the front of the boxwas cut 2.5 cm lower than the other three sides so runoff could leave the plot. A flumemade of galvanized metal was attached to the lower side to direct runoff. To make thefescue boxes retrievable, four 10 cm X 10 cm wooden blocks were bolted on the bottomof each box at the corners to allow access by a floor dolly and forklift.
The fescue used in this study was maintained by watering with a soaker hose. One dayprior to the rainfall event, the fescue was trimmed to 7.6 cm to simulate typical fieldconditions for poultry litter application. Poultry litter was applied by hand to the box

-65-
surface with special attention devoted to the uniformity of application. One applicationrate of 6.5 Mg ha-1 was used in this experiment.
The experimental design was a completely randomized design with three replications.Two types of hydrosolids (HS1 and HS2) were investigated. Both hydrosolids werealum sludges from municipal drinking water treatment plants and are described inChapter 1 of this thesis. Due to lack of uniformity in hydrosolid size, both hydrosolidswere crushed to <6 mm size. Hydrosolids were applied to box plots by broadcastingor as a buffer strip (Fig. 2). The buffer strip was approximately 7.6 cm from the runoffflume and 10.2 cm wide. Broadcast amendments were applied generously across thebox starting 7.6 cm from the runoff flume being careful to give equal application overthe fescue.
Surface residue and fescue cover measurements were conducted to show uniformityof boxes. Percent of blade, debris, and ground cover on the box surface wereevaluated by using a simple point measurement system where a pointed rod wasplaced downward toward the soil surface. The rod was guided by a ridge frame thathad 10 sets of holes. The frame was set on the box surface and rods were slowlypushed through the guides toward the soil surface. The first material that the tip of therod touched was the measured recording for that sampling point. The three possibletypes of material to characterize the cover of the plots are defined as follows:
BLADE - any living green material such as a leaf or stemDEBRIS - any nonliving material such as leaf litterGROUND - bare uncovered soil
Once the first ten measurements were taken, the frame was rotated on the vertical axis90° and another ten measurements were taken in the same manner. The 20 samplingpoints were used to determine the percentage of blade, debris, and ground.
The quantity of forage on each box before the treatments were applied was alsodetermined by clipping all the forage from a small area of each box. The area clippedwas defined by a square frame with inside dimensions measuring 10 cm X 10 cm. Thesquare was tossed on the box surface and all of the forage that was rooted inside theframe was harvested, bagged, and oven dried at 95°C for 24 h.
Four boxes were used in a preliminary study to determine the hydrosolid amendmentrate. Hydrosolid #2 (HS2) was used for the preliminary study at 5.0 Mg ha-1 and 10 Mgha-1 rates with 6.5 Mg ha-1 poultry litter. Poultry litter samples were collected andanalyzed for total Kjedahl nitrogen (TKN), total P (TP), and percent moisture. TKN, ona dry basis, was 55.0 g kg-1, TP dry was 15.7 g kg-1, and percent moisture was 215 gkg-1. The hydrosolid was tested as a buffer strip and as a broadcast application.Runoff was collected and analyzed for soluble P reduction.
Hydrosolid #1 (HS1) was applied at a 15 Mg ha-1 rate and HS2 was applied at a 10 Mgha-1 rate. It was noted after the selection of amendment rates that HS2 causedsignificant damming of runoff water. A 10 Mg ha-1 rate was later selected to allow therunoff to pass through the buffer strip. Amendment rates were determined from thepreliminary study.

-66-
The rainfall simulator was constructed and described by Olson (1995). The rainfallsimulator used is a modified design of the Kentucky Rainfall Simulator described byMoore et al. (1983). The rainfall simulator was designed to allow fescue boxes to tiltand accommodate different slope settings. The simulator used in this study consistsof a single oscillating nozzle which travels back and forth across the fescue boxes andbetween two return pans. The simulator utilizes a Veejet 80100 nozzle with anoperating pressure at the nozzle of 41 kPa to achieve the drop size and kinetic energytypical of natural rainfall (Meyer and Harmon, 1979).
Runoff collection was similar to that described by Olson (1995). Runoff was collectedin a tank that rested on a balance with two strain gauges, one on either side. The straingauges are electronic sensors that measure weight (in kg) of runoff in the collectiontank. A data-logger recorded the strain gauge readings every 15 seconds for theduration of the storm event. This information was then downloaded to a personalcomputer and later summarized as a mass flow rate runoff hydrograph.
The rain simulator was electronically programmed to deliver 3.8 cm h-1 over an 84minute rainfall duration (Olson, 1995). The experiment was conducted in a greenhousewhere temperatures ranged from 27 to 35°C. Boxes were saturated with water andallowed to drain for 72 hours prior to simulated rainfall. Poultry litter and amendmentswere applied to the fescue boxes and placed in the rainfall simulator by a forklift.Boxes were tilted at a 5% slope. A plastic tarp was attached to the front of the fescuebox and extended over the runoff weighing system to shield it from stray rainfall.Simulated rainfall rate was calibrated daily.
Runoff from fescue boxes was collected in a galvanized metal container. After 84minutes of rainfall, the runoff was stirred vigorously for 2 to 3 minutes followed bycollection of a 0.5 liter composite sample. Runoff samples were stored at -10°C. Allchemical analysis were conducted within one week after sampling.
Soluble phosphorus (P), total P, and total aluminum (Al) in runoff samples weredetermined. Soluble P was measured on filtered (0.45 µm) runoff samples (Greenburget al., 1992). Soluble P was measured by Murphy-Riley colorimetric method based onformation of phospho-molybdenum blue complex (Murphy and Riley, 1962).
Total P and total Al in unfiltered runoff samples were determined by wet digestion withHNO3. Runoff samples (25 mL) were digested with 5 mL of HNO3 for 1.5 h and 150°Cand diluted to volume (25 mL) with distilled water. Total P was measured by theMurphy-Riley Method (1962) and total Al by inductively coupled plasma atomicemission spectroscopy (ICP) instrumentation.
RESULTS AND DISCUSSION
Uniformity of vegetation and debris distribution was determined by measuring surfacecoverage of blade, debris, ground, and forage density in randomly selected fescueboxes (Table 1). In general, the green living fescue (blade), the non-living fescue

-67-
(debris), the uncovered soil (ground), and the forage density were similar (P < 0.05) andindicated vegetation was uniform among boxes.
Treatment means of cumulative runoff flow volumes were determined from hydrographs(Fig. 3). Total runoff volumes appeared larger for broadcast vs. buffer applications forHS2, but not HS1. These trends suggest that the HS2 buffer strip application may haveslowed water runoff from the box plots compared to the broadcast application.However, large amounts of variation were found in runoff volumes between box plots(LSD0.10 = 17.5) making interpretation of the HS2 trend difficult.
The effects of hydrosolid application on concentration of soluble phosphorus (P), totalP, and total aluminum (Al) in runoff water were determined (Table 2). Hydrosolidapplication significantly reduced the concentration of soluble P and total P (P < 0.05).In general, buffer strip applications reduced the concentration of soluble P and total Pmore than broadcast application (P < 0.10). Total Al, determined by wet digestion withHNO3, was determined in runoff to ensure precipitated Al in the hydrosolid did notdissolve and result in undesirable potential environmental impacts. In general, onlyslight or no increase in total Al concentration in runoff water was found (Table 3). Thelargest observed Al concentration of 1.71 mg L-1 was well below levels of >50 mg L-1
associated with adverse effects of dissolved Al on plant growth (Sloan et al., 1995).Therefore, slight increases in total Al in runoff water should not result in adversepotential environmental impacts.
The effect of hydrosolid application on cumulative runoff losses of soluble P, total P,and total Al were determined (Table 3). Hydrosolid applications significantly reducedcumulative losses of soluble and total P compared to untreated plots (P < 0.05).Similarly, Shreve et al. (1995) found that alum amended litter, with chemical propertiessimilar to a hydrosolid, decreased soluble and total P load in runoff from fields treatedwith poultry litter. However, no information is available on alum sludge (hydrosolid) andP reduction in runoff. Buffer strip application of hydrosolids significantly decreasedrunoff loss of soluble P and total P compared to broadcast application for HS2 (P <0.10) and HS1 (P ≅ 0.10). Cumulative runoff of total Al was not increased (P < 0.10) byhydrosolid application suggesting potentially adverse environmental impact fromdissolved Al in runoff water is unlikely.
The buffer strip application appears to be more effective than the broadcast applicationin reduction of concentration (Table 2) and mass (Table 3) of cumulative soluble andtotal P in runoff water. Less runoff water was associated with the buffer strip comparedto the broadcast application for HS2 (Fig. 3) suggesting buffer strip application mayhave resulted in greater infiltration of water in the plots. However, little difference inrunoff water volumes between buffer strip and broadcast applications were found forHS1 (Fig. 3). Most of the runoff water passed through the buffer strips on the box plots(Fig. 2). Perhaps better contact between P in the runoff water and the hydrosolidparticles occurred in the buffer strip than the broadcast application.
In Chapter 1, results from soil incubated with hydrosolids for nine weeks showed HS2reduced greater amounts of soluble P than HS1. Evidently the HS2 contained more

-68-
calcium than HS1 and may have resulted in greater amounts of calcium phosphateprecipitation. A batch equilibration study where 150 mg L-1 of soluble P was shakenwith 1 g of hydrosolid was conducted to study the kinetics of the phosphate adsorptionand/or precipitation. Although HS2 reduced more soluble P than HS1 at equilibrationtimes exceeding 10 minutes, HS1 and HS2 reduced the same amount of soluble P forequilibration times less than 5 minutes (Fig. 4). Soluble P in runoff water was in contactfor less than 2 minutes in the box plot study. These results suggest little difference insoluble P reduction was due to reaction kinetics. However, cumulative rainfall eventsmay result in cumulative times that exceed 10 minutes. Therefore, with time, HS2would more likely adsorb more P than HS1.
The particle size distribution affects surface area and should influence the adsorptionproperties of the hydrosolids. Adsorption of soluble P by both coarse (87% greater than0.2 mm) and fine (100% less than 0.2 mm) forms of HS2 was studied to determine theimportance of hydrosolid particle size (Fig. 5). The fine HS2 adsorbed more soluble Pfaster than coarse HS2. Crushing of hydrosolids to finer (<0.2 mm) particles willincrease surface area and P adsorption capacity, thus increasing the ability of thehydrosolids to reduce P in runoff water.
CONCLUSIONS
Non-point source phosphorus pollution from agricultural land treated with animalmanures may be reduced by using municipal alum sludge (hydrosolids). Landapplication of hydrosolids may provide a safe and inexpensive solution to controlphosphorus runoff from agricultural land. Hydrosolids should be surface applied whenpoultry litter is not incorporated into the soil. Hydrosolids can be broadcasted or appliedas a buffer strip at the edge of the field. Buffer strips should be more effective thanbroadcasting in reduction of phosphorus in runoff water. Potential adverseenvironmental impacts from land application of hydrosolids are unlikely. However, potentialenvironmental impacts from repeated application of hydrosolids are not addressed by thiswork.
Results from this study were completed on a small scale and may not be transferable toa large scale production. Other variables under field conditions (i.e. circulated flow) arescale dependent and may effect the ability of hydrosolids to reduce NPS. Further researchis needed to evaluate the use of hydrosolids to reduce NPS phosphorus under fieldconditions.
Hydrosolid wastes are currently being landfilled at great expense to municipalities. Also,several municipal water treatment plants producing hydrosolids may have source waterdegraded by non-point source P pollution. Hydrosolid application to agricultural landtreated with animal manure in sensitive watersheds may improve drinking water quality andprovide financial savings for municipalities.
REFERENCES

-69-
Coale, F.J., P.S. Porter, and W. Davis. 1994. Soil amendments for reducing phosphorusconcentration of drainage water from histosols. Soil Sci. Soc. Am. J. 58:1470-1475.
Edwards, D.R., and T.C. Daniel. 1993. Effects of poultry litter application rate and rainfallintensity on quality of runoff from fescue grass plots. J. Environ. Qual. 22:361-365.
Greenburg, A.E., L.S. Clesceri, and A.D. Eaton. 1992. Standard methods for examinationof water and wastewater, 18th ed. American Public Health Association, Washington, D.C.
Kennedy, R.H., and G.D. Cooke. 1982. Control of lake phosphorus with aluminum sulfate:Dose determination and application techniques. Water Resour. Bull. 18(3):389-395.
Knauer, D.R., and P.J. Garrison. 1981. A comparison of two alum treated lakes inWisconsin. p. 412-416. In U.S. EPA Restoration of Lakes and Inland Waters. EPA 440/5-81-010.
Meyer, L.D., and W.C. Harmon. 1979. Multiple-intensity rainfall simulator for erosionresearch on row sideslopes. Trans. ASAE 22:100-103.
Moore, I.D., M.C. Hirschi, and B.J. Barfield. 1983. Kentucky rainfall simulator. Trans.ASAE 26(4):1085-1089.
Murphey, J., and J.P. Riley. 1962. A modified single solution method for determination ofphosphate in natural waters. Anal. Chim. Acta. 27:31-36.
Natural Resource Conservation Service. 1994. Conservation practice standard: Wasteutilization, Code 633, Stillwater, Oklahoma.
Olson, C.H. 1995. Effects of rainfall, slope, and vegetation height on runoff water qualityfrom fescue plots treated with poultry litter. M.S. Thesis, Biosystems and AgriculturalEngineering, Oklahoma State University, Stillwater, OK.
Sharpley, A.N., and R.G. Menzel. 1987. The impact of soil and fertilizer phosphorus onthe environment. Adv. Agron. 41:297-324.
Sharpley, A.N., S.J. Smith, O.R. Jones, W.A. Berg, and G.A. Coleman. 1992. Thetransport of bioavailable phosphorus in agricultural runoff. J. Environ. Qual. 21:30-35.
Shreve, B.R., P.A. Moore, T.C. Daniel, D.R. Edwards, and D.M. Miller. 1995. Reductionof phosphorus in runoff from field-applied poultry litter using chemical amendments. J.Environ. Qual. 24:106-111.
Sloan, J.J., N.T. Basta, and R.L. Westerman. 1995. Aluminum transformations andsolution equilibria induced by banded phosphorus fertilizer in acid soil. Soil Sci. Soc. Am.J. 59:357-364.

-70-
Welch, E.B., J.P. Michaud, and M.A. Perkins. 1982. Alum control of internal phosphorusloading in a shallow lake. Water Resour. Bull. 18(6):929-936.
Young, T.C., A.G. Collins, and R.A. Armstrong. 1988. A pilot-scale evaluation of alumtreatments to reduce lake sediment phosphorus release. J. Environ. Qual. 17:673-676.

-71-
Table 1. Mean Percent Cover and Forage Density of the Fescue Boxes.
Hydrosolid Application Blade Debris Ground Forage
--------------- % ---------------- kg ha-1
HS1 Buffer 35.0 30.0 35.0 3352HS1 Broadcast 17.5 45.0 37.5 3430HS2 Buffer 25.0 55.0 20.0 4185HS2 Broadcast 27.5 42.5 30.0 2659
LSD (α=0.05) 26.4 16.7 24.1 3804LSD (α=0.10) 20.7 13.1 18.9 2982
Table 2. The Effect of Hydrosolid Application on Mean Concentration of Soluble P,Total P, and Total Al in Runoff Water.
Hydrosolid Application Soluble P Total P Total Al
-------------------------- mg L-1 -------------------------HS1 Buffer Strip bc 8.99 c bc 8.77 c ab 1.42 b
Broadcast b 13.0 b b 12.9 b bc 1.23 bHS2 Buffer Strip c 4.93 d c 5.20 d a 1.71 a
Broadcast bc 9.83 bc b 9.87 bc bc 1.22 bcControl 6.5 Mg ha-1
poultry manurea 22.3 a a 20.8 a c 0.96 c
LSD (α=0.05) 4.94 4.19 0.32LSD (α=0.10) 4.02 3.41 0.26
Letters to the left of application means represent LSD α = 0.05.Letters to the right of application means represent LSD α = 0.10.

-72-
Table 3. The Effect of Hydrosolid Application on Mean Cumulative Runoff Lossesfor Soluble P, Total P, and Total Al
Hydrosolid Application Soluble P Total P Total Al
------------------------- mg box-1 -----------------------HS1 Buffer Strip b 142 bc b 141 bc a 25.3 a
Broadcast b 278 b ab 279 b a 30.7 aHS2 Buffer Strip b 8.2 c b 103 c a 27.7 a
Broadcast b 285 b ab 284 b a 35.0 aControl 6.5 Mg ha-1
poultry littera 485 a a 455 a a 21.2 a
LSD (α=0.05) 197 193 28.7LSD (α=0.10) 159 156 23.3
Letters to the left of application means represent LSD α = 0.05.Letters to the right of application means represent LSD α = 0.10.

-73-
23 cm
2.5 cm
5 cm
2.5 cm
33 cm
100 cm
Baxter silt loam
Coarse sand
Gravel/sand mixture
Fine polyethylene screen
Runoff flume
Figure 1. Box plot dimensions. (Not drawn to scale).

-74-
Figure 2. Buffer strip vs. broadcast application.

-75-
Time (min.)
0 10 20 30 40 50 60 70 80 90 100
Run
off(
L)
0
5
10
15
20
25
30
35
HS1 BufferHS1 BroadcastHS2 BufferHS2 Broadcast
28.6 L
17.8 L
15.6 L
16.9 L
Figure 3. Mean cumulative runoff volume with time.

-76-
Time (min.)
0 10 20 30 40 50 60
Sol
uble
P(m
gL-1
)
60
80
100
120
140HS1HS2
Figure 4. Soluble P reduction for HS1 and HS2 over time.

-77-
Time (min.)
0 20 40 60
Sol
uble
P(m
gL-1
)
0
20
40
60
80
100
120
140 HS2 CourseHS2 Fine
Figure 5. Amendment size effect on soluble P reduction of Hydrosolid #2 coarse andfine over time.

-78-
APPENDIX CEducation Materials
Fact Sheets
What Is A Waste Management System? Hamilton, D.W. OSU Extension Facts F-1734.Oklahoma State University, Division of Agricultural Sciences and Natural Resources,Oklahoma Cooperative Extension Service, Stillwater, Oklahoma.
Using Lagoon Effluent as Fertilizer. Zhang, H. and D.W. Hamilton. OSU Extension FactsF-2245. Oklahoma State University, Division of Agricultural Sciences and NaturalResources, Oklahoma Cooperative Extension Service, Stillwater, Oklahoma.
Using Poultry Litter as Fertilizer. Zhang, H., D.W. Hamilton, and J.G. Britton. OSUExtension Facts F-1734. Oklahoma State University, Division of Agricultural Sciences andNatural Resources, Oklahoma Cooperative Extension Service, Stillwater, Oklahoma.
Additional Handouts
Selecting Forages for Nutrient Recycling. Redmon, L.A. OSU Production Technology -Forages, PT 96-36, June 1996, Vol 8, No. 36. Oklahoma State University, Plant and SoilSciences, Division of Agricultural Sciences and Natural Resources, Stillwater, Oklahoma.
Calibration of Litter Spreading Trucks. Hamilton, D.W., G.L. Bullard, M.J. Fram. OklahomaState University, Division of Agricultural Sciences and Natural Resources, OklahomaCooperative Extension Service, Stillwater, Oklahoma.
Application Rates for Broiler Litter Applied to Pasture and Hay Crops. Hamilton, D.W.Oklahoma State University, Division of Agricultural Sciences and Natural Resources,Oklahoma Cooperative Extension Service, Stillwater, Oklahoma.
Soil Fertility Demonstration, Jimmy Thomas Ranch, Pontotoc County. Results of FirstClipping 7/13/95. Oklahoma State University, Division of Agricultural Sciences and NaturalResources, Oklahoma Cooperative Extension Service, Stillwater, Oklahoma.
Example Newspaper Clipping
Experts Seek Pollution Solution. Ken Milam. Poteau Daily News & Sun, Poteau,Oklahoma. 895, Volume 100, Number 255, Thursday, June 20, 1996.
Rainfall Simulator Demonstration Announcements

-79-

-80-

-81-

-82-

-83-

-84-

-85-

-86-

-87-

-88-

-89-

-90-
-91-

-92-

-93-

-94-

-95-

-96-

-97-

-98-

-99-

-100-

-101-
APPENDIX D
Producer Surveys

-102-

-103-

-104-

-105-

-106-

-107-