Embed Size (px)
Citation preview

1
DenizBank Economic Update
September, 2011
Economy
Financial Markets
Banking Sector
Focus
Almost Investment Grade
Economic Research and Strategy
Saruhan Özel, Ph.D.
Ercan Ergüzel
Berke Gümüş
Doğukan Ulusoy
2
Economy (I)
DenizBank Economic Update
Sept, 2011
Gro
wth
E
xte
rna
l S
ec
tor
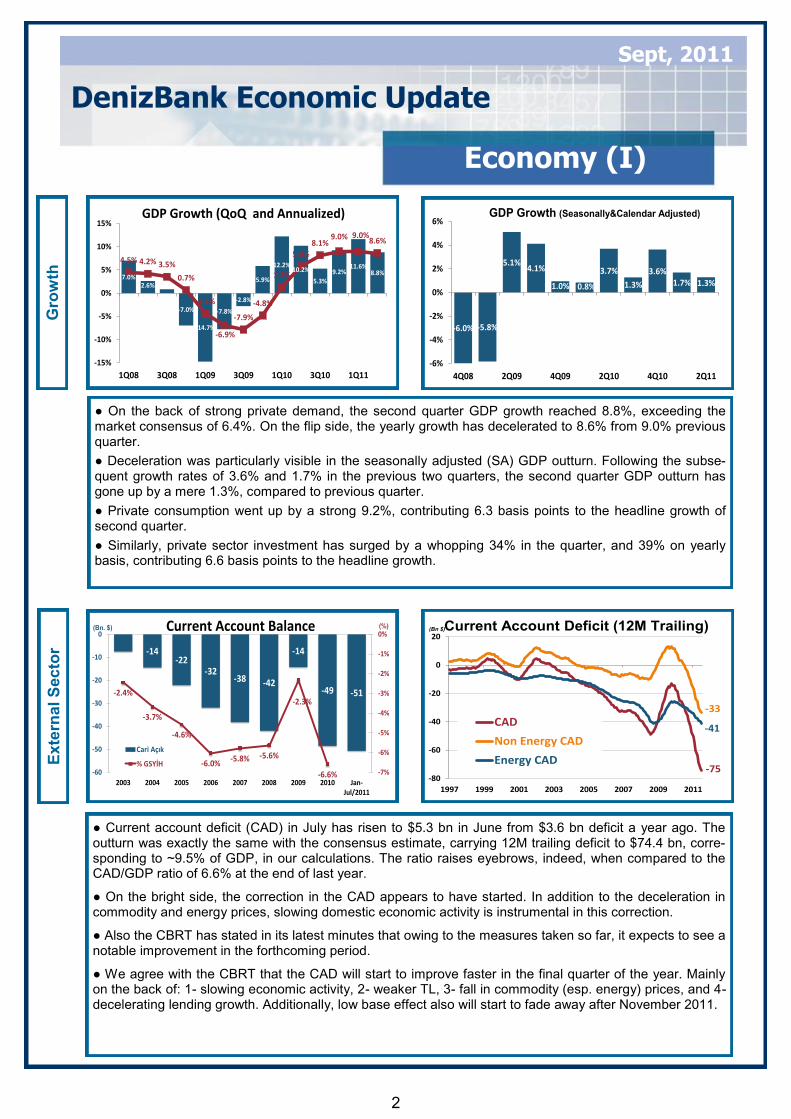
● On the back of strong private demand, the second quarter GDP growth reached 8.8%, exceeding the market consensus of 6.4%. On the flip side, the yearly growth has decelerated to 8.6% from 9.0% previous quarter.
● Deceleration was particularly visible in the seasonally adjusted (SA) GDP outturn. Following the subse-quent growth rates of 3.6% and 1.7% in the previous two quarters, the second quarter GDP outturn has gone up by a mere 1.3%, compared to previous quarter.
● Private consumption went up by a strong 9.2%, contributing 6.3 basis points to the headline growth of second quarter.
● Similarly, private sector investment has surged by a whopping 34% in the quarter, and 39% on yearly basis, contributing 6.6 basis points to the headline growth.
● Current account deficit (CAD) in July has risen to $5.3 bn in June from $3.6 bn deficit a year ago. The outturn was exactly the same with the consensus estimate, carrying 12M trailing deficit to $74.4 bn, corre-sponding to ~9.5% of GDP, in our calculations. The ratio raises eyebrows, indeed, when compared to the CAD/GDP ratio of 6.6% at the end of last year.
● On the bright side, the correction in the CAD appears to have started. In addition to the deceleration in commodity and energy prices, slowing domestic economic activity is instrumental in this correction.
● Also the CBRT has stated in its latest minutes that owing to the measures taken so far, it expects to see a notable improvement in the forthcoming period.
● We agree with the CBRT that the CAD will start to improve faster in the final quarter of the year. Mainly on the back of: 1- slowing economic activity, 2- weaker TL, 3- fall in commodity (esp. energy) prices, and 4- decelerating lending growth. Additionally, low base effect also will start to fade away after November 2011.
7.0%2.6% 0.9%
-7.0%
-14.7%
-7.8%
-2.8%
5.9%
12.2%10.2%
5.3%
9.2%11.6%
8.8%
4.5% 4.2% 3.5%
0.7%
-4.4%
-6.9%
-7.9%
-4.8%
1.3%
5.8%8.1%
9.0% 9.0%8.6%
-15%
-10%
-5%
0%
5%
10%
15%
1Q08 3Q08 1Q09 3Q09 1Q10 3Q10 1Q11
GDP Growth (QoQ and Annualized)
-6.0% -5.8%
5.1%4.1%
1.0% 0.8%
3.7%
1.3%
3.6%1.7% 1.3%
-6%
-4%
-2%
0%
2%
4%
6%
4Q08 2Q09 4Q09 2Q10 4Q10 2Q11
GDP Growth (Seasonally&Calendar Adjusted)
-14-22
-32-38 -42
-14
-49 -51-2.4%
-3.7%
-4.6%
-6.0%-5.8% -5.6%
-2.3%
-6.6% -7%
-6%
-5%
-4%
-3%
-2%
-1%
0%
-60
-50
-40
-30
-20
-10
0
2003 2004 2005 2006 2007 2008 2009 2010 Jan-Jul/2011
Cari Açık
% GSYİH
(Bn. $) (%)Current Account Balance
-33
-75
-41
-80
-60
-40
-20
0
20
1997 1999 2001 2003 2005 2007 2009 2011
CAD
Non Energy CAD
Energy CAD
(Bn $)Current Account Deficit (12M Trailing)

3
Economy (II)
DenizBank Economic Update
Sept, 2011
Infl
ati
on
P
ub
lic
Se
cto
r
● Annual CPI inflation has risen slightly to 6.7% in August from 6.3% a month before but İt is not too distant from the year-end target band of 5.5% +-2%. On the other hand, the core CPI is rising faster recently hav-ing reached 6.2% in August from as low as 2.5% 10 months ago.
● Weaker TL on the cost side and strong domestic consumption on the demand side were instrumental for the rise in core indices and we are likely to see further pass-through from weaker TL to the CPI in the forth-coming period. On the bright side it will be balanced by the fall in domestic demand.
● Yet, the CBRT is cautious about rising inflation and changed its dovish rhetoric recently, emphasizing the second round effects of weaker TL more often than before in its latest announcements.
● For this reason, it looks as though the Bank is in the wait and see phase for the policy rate, which is cur-rently 5.75%.
● The central government budget yielded a surplus of TL2.8 bn in June. Thus, the year-to-date “surplus” has risen to TL2.1 bn from the “deficit” of TL14 bn last year in between January and July.
● The stellar performance was mainly due to 22% surge in tax revenues since year to date. Additionally, interest expense was down 10% at the same period, on the back of falling government bond yields.
● While total tax revenues went up by 27% in August compared to that in August last year, the VAT levied on imports increased by only 17%, signaling that the strong rise in imports would start to lose pace starting from August, confirming the CBRT’s expectations.
● All in all, the 2011 budget “deficit” target of TL34 bn as per the Medium Term Programme, appears quite
achievable given the performance in the first half of the year. Yet, the new Medium Term Programme to be released
in a few weeks’ time, is expected to set more ambitious budget targets for 2011 and 2012.
6.65%
6.19%
2%
4%
6%
8%
10%
12%
2004 2005 2006 2007 2008 2009 2010 2011
Headline CPI
Core CPI
Headline and Core Inflation
6.83%
6.65%
0%
4%
8%
12%
2007 2008 2009 2010 2011
CPI and CPI Expectation (12M Fw)
CB Survey Expectations
-27-21
-5 -3 -11 -13
-34-26
1.3
-8.8%
-5.2%
-1.1%
-0.6%
-1.6%-1.8% -5.5%
-3.6%
-10%
-8%
-6%
-4%
-2%
0%
-40
-30
-20
-10
0
10
2003 2004 2005 2006 2007 2008 2009 2010 Jan-Aug 11
$ bn % GDP
Budget Balance (12M Trailing)
1219
27 29 27 29
1 6
21
4.0%
4.9%
6.0%5.4%
4.2%
3.5%
0.1%0.8%
0%
1%
2%
3%
4%
5%
6%
7%
0
5
10
15
20
25
30
35
2003 2004 2005 2006 2007 2008 2009 2010 Jan-Aug11
$ bn
% GDP
Primary Budget Balance(Budget Balance Exc. Interest Payments)
4
Financial Markets
DenizBank Economic Update
Sept, 2011
Deb
t M
ark
et
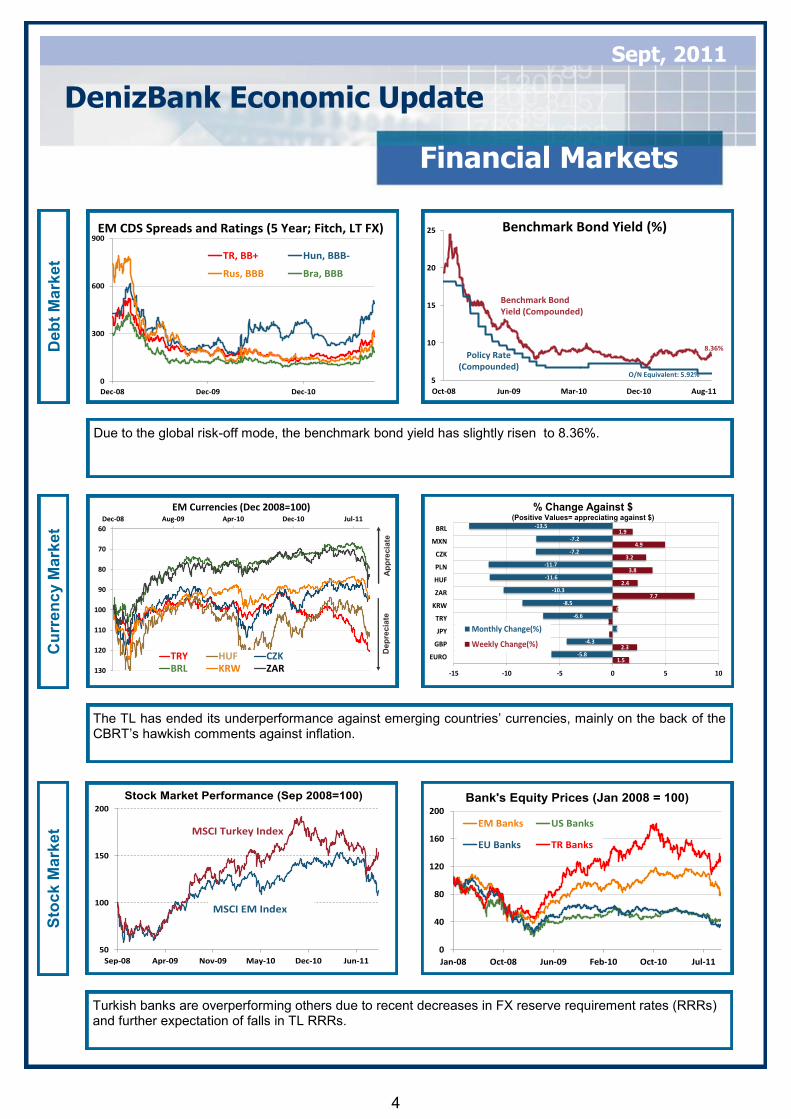
Due to the global risk-off mode, the benchmark bond yield has slightly risen to 8.36%.
Cu
rre
nc
y M
ark
et
Sto
ck
Mark
et
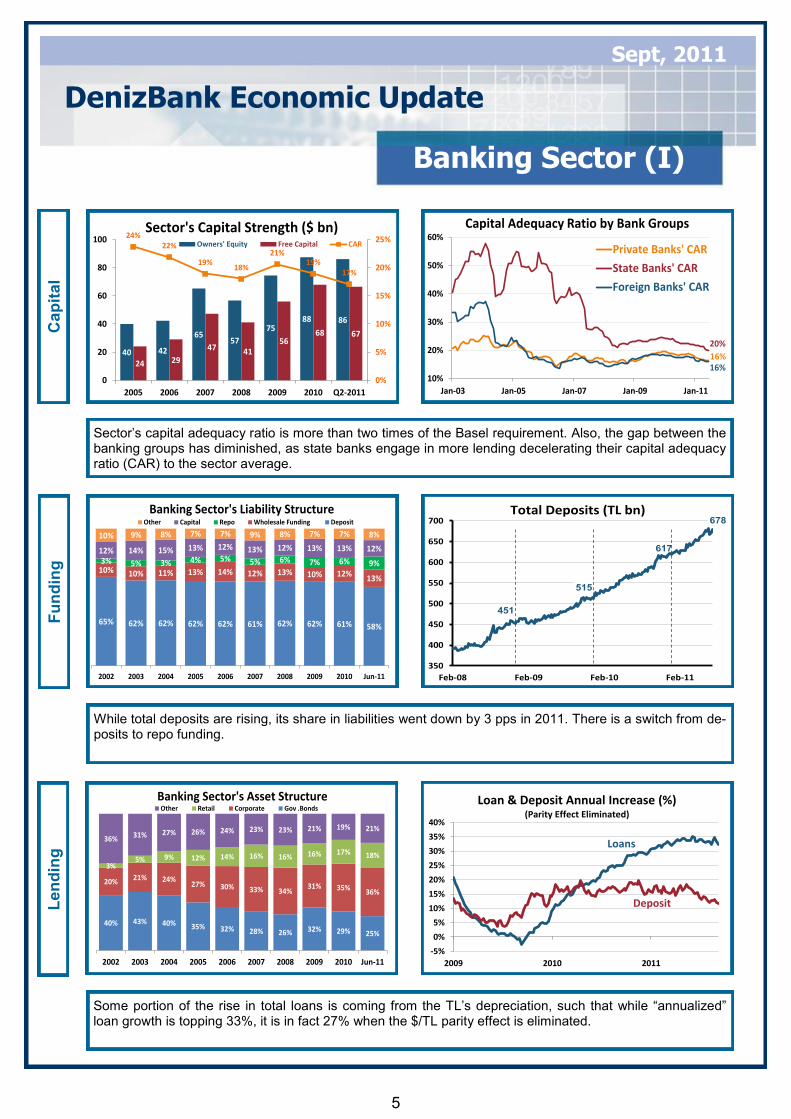
The TL has ended its underperformance against emerging countries’ currencies, mainly on the back of the CBRT’s hawkish comments against inflation.
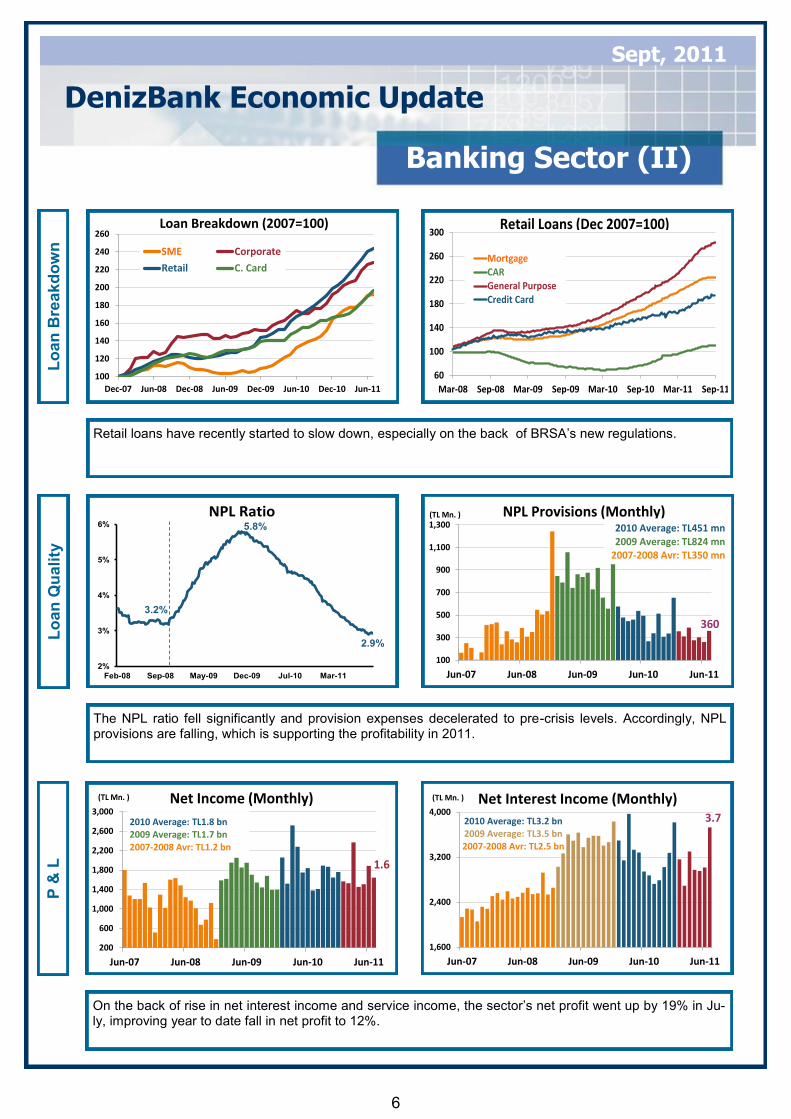
Turkish banks are overperforming others due to recent decreases in FX reserve requirement rates (RRRs) and further expectation of falls in TL RRRs.
0
300
600
900
Dec-08 Dec-09 Dec-10
TR, BB+ Hun, BBB-
Rus, BBB Bra, BBB
EM CDS Spreads and Ratings (5 Year; Fitch, LT FX)
5
10
15
20
25
Oct-08 Jun-09 Mar-10 Dec-10 Aug-11
Benchmark Bond Yield (%)
Policy Rate (Compounded)
Benchmark Bond Yield (Compounded)
O/N Equivalent: 5.92%
8.36%
60
70
80
90
100
110
120
130
Dec-08 Aug-09 Apr-10 Dec-10 Jul-11
EM Currencies (Dec 2008=100)
TRY HUF CZKBRL KRW ZAR
Ap
pre
cia
teD
ep
rec
iate
1.5
2.3
-0.3
-0.4
0.5
7.7
2.4
3.8
3.2
4.9
1.9
-5.8
-4.3
0.4
-6.6
-8.5
-10.3
-11.6
-11.7
-7.2
-7.2
-13.5
-15 -10 -5 0 5 10
EURO
GBP
JPY
TRY
KRW
ZAR
HUF
PLN
CZK
MXN
BRL
Monthly Change(%)
Weekly Change(%)
% Change Against $ (Positive Values= appreciating against $)
50
100
150
200
Sep-08 Apr-09 Nov-09 May-10 Dec-10 Jun-11
Stock Market Performance (Sep 2008=100)
MSCI Turkey Index
MSCI EM Index
0
40
80
120
160
200
Jan-08 Oct-08 Jun-09 Feb-10 Oct-10 Jul-11
EM Banks US Banks
EU Banks TR Banks
Bank's Equity Prices (Jan 2008 = 100)
5
Banking Sector (I)
DenizBank Economic Update
Sept, 2011
Cap
ital
Sector’s capital adequacy ratio is more than two times of the Basel requirement. Also, the gap between the banking groups has diminished, as state banks engage in more lending decelerating their capital adequacy ratio (CAR) to the sector average.
Fu
nd
ing
While total deposits are rising, its share in liabilities went down by 3 pps in 2011. There is a switch from de-posits to repo funding.
Len
din
g
Some portion of the rise in total loans is coming from the TL’s depreciation, such that while “annualized” loan growth is topping 33%, it is in fact 27% when the $/TL parity effect is eliminated.
65% 62% 62% 62% 62% 61% 62% 62% 61% 58%
10% 10% 11% 13% 14% 12% 13% 10% 12%13%
3% 5% 3% 4% 5% 5% 6% 7% 6% 9%
12% 14% 15% 13% 12% 13% 12% 13% 13% 12%
10% 9% 8% 7% 7% 9% 8% 7% 7% 8%
2002 2003 2004 2005 2006 2007 2008 2009 2010 Jun-11
Other Capital Repo Wholesale Funding Deposit
Banking Sector's Liability Structure
40% 43% 40% 35% 32% 28% 26% 32% 29% 25%
20%21% 24%
27% 30% 33% 34%31% 35%
36%
3%5% 9% 12% 14% 16% 16% 16% 17% 18%
36% 31% 27% 26% 24% 23% 23% 21% 19% 21%
2002 2003 2004 2005 2006 2007 2008 2009 2010 Jun-11
Other Retail Corporate Gov .Bonds
Banking Sector's Asset Structure
40 42
6557
7588 86
24 29
47 4156
68 67
24%22%
19%18%
21%19%
17%
0%
5%
10%
15%
20%
25%
0
20
40
60
80
100
2005 2006 2007 2008 2009 2010 Q2-2011
Owners' Equity Free Capital CAR
Sector's Capital Strength ($ bn)
16%
20%
16%10%
20%
30%
40%
50%
60%
Jan-03 Jan-05 Jan-07 Jan-09 Jan-11
Private Banks' CAR
State Banks' CAR
Foreign Banks' CAR
Capital Adequacy Ratio by Bank Groups
451
678
515
617
350
400
450
500
550
600
650
700
Feb-08 Feb-09 Feb-10 Feb-11
Total Deposits (TL bn)
-5%
0%
5%
10%
15%
20%
25%
30%
35%
40%
2009 2010 2011
Loan & Deposit Annual Increase (%)(Parity Effect Eliminated)
Loans
Deposit
6
Banking Sector (II)
DenizBank Economic Update
Sept, 2011
Lo
an
Bre
ak
do
wn
Retail loans have recently started to slow down, especially on the back of BRSA’s new regulations.
Lo
an
Qu
ali
ty
The NPL ratio fell significantly and provision expenses decelerated to pre-crisis levels. Accordingly, NPL provisions are falling, which is supporting the profitability in 2011.
P &
L
On the back of rise in net interest income and service income, the sector’s net profit went up by 19% in Ju-ly, improving year to date fall in net profit to 12%.
100
120
140
160
180
200
220
240
260
Dec-07 Jun-08 Dec-08 Jun-09 Dec-09 Jun-10 Dec-10 Jun-11
SME Corporate
Retail C. Card
Loan Breakdown (2007=100)
60
100
140
180
220
260
300
Mar-08 Sep-08 Mar-09 Sep-09 Mar-10 Sep-10 Mar-11 Sep-11
MortgageCARGeneral PurposeCredit Card
Retail Loans (Dec 2007=100)
3.2%
2.9%
5.8%
2%
3%
4%
5%
6%
Feb-08 Sep-08 May-09 Dec-09 Jul-10 Mar-11
NPL Ratio
360
100
300
500
700
900
1,100
1,300
Jun-07 Jun-08 Jun-09 Jun-10 Jun-11
(TL Mn. ) NPL Provisions (Monthly)2010 Average: TL451 mn2009 Average: TL824 mn
2007-2008 Avr: TL350 mn
1.6
200
600
1,000
1,400
1,800
2,200
2,600
3,000
Jun-07 Jun-08 Jun-09 Jun-10 Jun-11
(TL Mn. ) Net Income (Monthly)
2010 Average: TL1.8 bn2009 Average: TL1.7 bn2007-2008 Avr: TL1.2 bn
3.7
1,600
2,400
3,200
4,000
Jun-07 Jun-08 Jun-09 Jun-10 Jun-11
(TL Mn. ) Net Interest Income (Monthly)
2010 Average: TL3.2 bn2009 Average: TL3.5 bn2007-2008 Avr: TL2.5 bn
7
Focus
DenizBank Economic Update
Sept, 2011
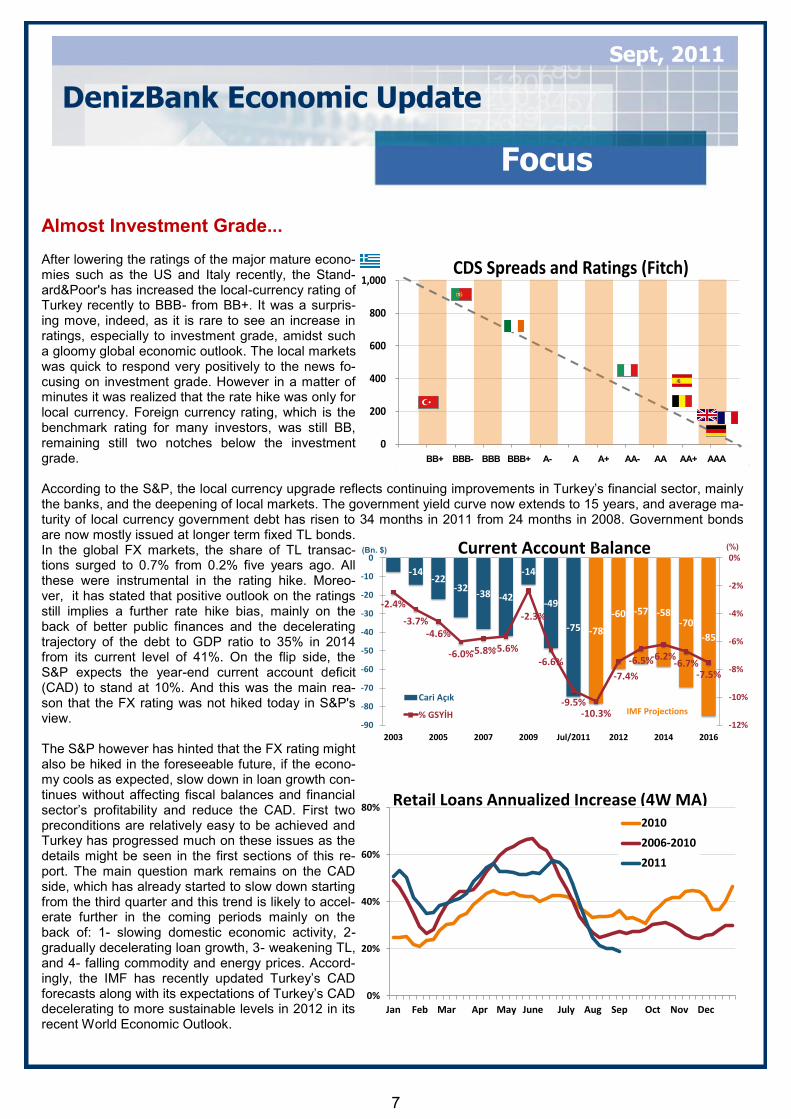
Almost Investment Grade... After lowering the ratings of the major mature econo-mies such as the US and Italy recently, the Stand-ard&Poor's has increased the local-currency rating of Turkey recently to BBB- from BB+. It was a surpris-ing move, indeed, as it is rare to see an increase in ratings, especially to investment grade, amidst such a gloomy global economic outlook. The local markets was quick to respond very positively to the news fo-cusing on investment grade. However in a matter of minutes it was realized that the rate hike was only for local currency. Foreign currency rating, which is the benchmark rating for many investors, was still BB, remaining still two notches below the investment grade. According to the S&P, the local currency upgrade reflects continuing improvements in Turkey’s financial sector, mainly the banks, and the deepening of local markets. The government yield curve now extends to 15 years, and average ma-turity of local currency government debt has risen to 34 months in 2011 from 24 months in 2008. Government bonds are now mostly issued at longer term fixed TL bonds. In the global FX markets, the share of TL transac-tions surged to 0.7% from 0.2% five years ago. All these were instrumental in the rating hike. Moreo-ver, it has stated that positive outlook on the ratings still implies a further rate hike bias, mainly on the back of better public finances and the decelerating trajectory of the debt to GDP ratio to 35% in 2014 from its current level of 41%. On the flip side, the S&P expects the year-end current account deficit (CAD) to stand at 10%. And this was the main rea-son that the FX rating was not hiked today in S&P's view. The S&P however has hinted that the FX rating might also be hiked in the foreseeable future, if the econo-my cools as expected, slow down in loan growth con-tinues without affecting fiscal balances and financial sector’s profitability and reduce the CAD. First two preconditions are relatively easy to be achieved and Turkey has progressed much on these issues as the details might be seen in the first sections of this re-port. The main question mark remains on the CAD side, which has already started to slow down starting from the third quarter and this trend is likely to accel-erate further in the coming periods mainly on the back of: 1- slowing domestic economic activity, 2- gradually decelerating loan growth, 3- weakening TL, and 4- falling commodity and energy prices. Accord-ingly, the IMF has recently updated Turkey’s CAD forecasts along with its expectations of Turkey’s CAD decelerating to more sustainable levels in 2012 in its recent World Economic Outlook.
-14-22
-32-38 -42
-14
-49
-75 -78
-60 -57 -58-70
-85
-2.4%
-3.7%-4.6%
-6.0%-5.8%-5.6%
-2.3%
-6.6%
-9.5%-10.3%
-7.4%
-6.5%-6.2%-6.7%
-7.5%
-12%
-10%
-8%
-6%
-4%
-2%
0%
-90
-80
-70
-60
-50
-40
-30
-20
-10
0
2003 2005 2007 2009 Jul/2011 2012 2014 2016
Cari Açık
% GSYİH
(Bn. $) (%)Current Account Balance
IMF Projections
0
200
400
600
800
1,000
0 1 2 3 4 5 6 7 8 9 10 11 12
CDS Spreads and Ratings (Fitch)
BB+ BBB- BBB BBB+ A- A A+ AA- AA AA+ AAA
0%
20%
40%
60%
80%
Jan Feb Mar Apr May June July Aug Sep Oct Nov Dec
2010
2006-2010
2011
Retail Loans Annualized Increase (4W MA)

8
Focus
DenizBank Economic Update
Sept, 2011
All in all, it seems that Turkey is half way through to invest-ment grade. In terms of long-term FX rating, Turkey is al-ready one notch below invest-ment grade by Fitch, and two by the S&P and Moody’s, all with positive outlook. An ex-pectation therefore of an up-grade to investment grade on the fx side as well, bears the question of what happened in the emerging countries’ finan-cial markets following a rate hike in the past. To see this, we have chosen benchmark countries whose currency and equity markets performance could signal a path for Turkey as well. The details are shown in the following table. Accordingly, equity markets of the investment grade EMs overperform the MSCI Emerging Markets Index both three years before and after the rate hike. The overperformance was more pronounced especially before the rate hike. On the other hand, over performance was more visible in currency markets (against USD) two years prior to the rate hike. For the remaining years, no significant correlation. In that respect, it is not wrong to assume that the TL and the ISE (Istanbul Stock Exchange) are likely to over perform emerging peers in the next couple of years.
Country Investment Grade (t)* t-2 t-1 t t+1 t+2 t+3
Brazil 29.05.2008 Stock Market 9% 32% 4% -47% 5% -7%
Currency 1% 12% 13% 3% 7% 2%
India 01.08.2006 Stock Market 18% 5% 17% -5% -1% 28%
Currency -5% -1% -10% 8% -13% 13%
S. Korea 19.01.1999 Stock Market -24% 0% 39% -21% -7% 29%
Currency 3% -77% 89% 12% -5% 9%
Mexico 15.01.2002 Stock Market 28% 13% 19% 2% -6% 24%
Currency 14% 5% 22% -14% -11% -13%
Poland 07.06.1996 Stock Market 0% -4% 61% 14% 25% -8%
Currency -5% 37% -4% -11% 12% 47%
Russia 18.11.2004 Stock Market 52% 0% 24% 15% 32% -24%
Currency 0% -1% -2% -2% 4% 0%
S. Africa 27.06.2000 Stock Market 33% -15% 5% 48% 18% -27%
Currency -23% 64% -6% -13% -23% 26%
Average Stock Market 17% 4% 24% 1% 10% 2%
Currency -2% 6% 14% -3% -4% 12%
* As per Fitch Rating
Relative Performance to the Benchmarks After Investment Grade