Embed Size (px)
Citation preview

DEPARTMENT OF ECONOMICS
Working Paper
UNIVERSITY OF MASSACHUSETTS AMHERST
Macroeconomic implications of financialization
by
Peter Skott and Soon Ryoo
Working Paper 2007-08

Macroeconomic implications of �nancialization
Peter Skott� and Soon Ryooy
March 23, 2007
Abstract
A growing literature suggests that ��nancialization� may weaken theperformance of non-�nancial corporations and constrain the growth of ag-gregate demand. This paper evaluates (some of) the claims that have beenmade using two alternative approaches (one derived from Skott (1981,1988, 1989) and one from Lavoie and Godley (2001-2002)) and two di¤er-ent settings (a labor-constrained setting and a dual-economy setting). Allmodels are in a structuralist / post Keynesian tradition and pay explicitattention to �nancial stock-�ow relations. The results are insensitive tothe precise speci�cation of household saving behavior but depend criti-cally on the labor market assumptions (labor-constrained vs dual) andthe speci�cation of the investment function (Harrodian vs stagnationist).
JEL classi�cation: E12, E21, E44Key words: �nancialization, stock-�ow consistency, retention rate, ex-
ternal �nance, new issue.
�Department of Economics, University of Massachusetts, Amherst, MA 01003, USA; email:[email protected].
yDepartment of Economics, University of Massachusetts, Amherst, MA 01003, USA; email:[email protected].

1 Introduction
Along with neoliberalism and globalization, �nancialization has become a buzz-word in recent years. The precise de�nition is not always clear but in a broadsense the term refers to �the increasing role of �nancial motives, �nancial mar-kets, �nancial actors and �nancial institutions in the operation of the domesticand international economies�(Epstein 2005, p. 3). More speci�cally, �nancial-ization has been associated with a number of developments.1 These develop-ments include shifts in central bank policy toward a near-exclusive focus on pricestability, large increases in �nancial �ows both internationally and in domestic�nancial markets, improved �nancing for households and elements of consump-tion / credit driven growth, changes in corporate governance and attempts toalign managerial incentives with shareholder interests via stock option plans,and an increased in�uence of �nancial institutions and institutional investors.Financial pressures, it is argued, have induced changes in management strategyfrom �retain and invest" to �downsize and distribute" (Lazonick & O�Sullivan(2000, p. 18)) and have a¤ected �rms�dividend, new issue and debt �nancepolicies. In some accounts non-�nancial corporations �were forced to fund mostof their capital investment externally in the neoliberal era" (Crotty 2005, p. 99).These various changes associated with �nancialization may have implications
for macroeconomic performance. Crotty (2005) has argued that �nancializationweakens non-�nancial corporations and constrains the growth of aggregate de-mand. In a similar vein, Duménil and Lévy (2001) suggest that �nancializationleads to instability and undermines growth and employment. Meanwhile, mostof mainstream economics has been praising the potential bene�ts of �nancialliberalization, and some non-mainstream contributors have also seen �nancial-ization as a spur to growth. Thus, Boyer (2000) has suggested the potential for�nance-led growth regimes as an alternative to the defunct Fordist regime.Although most of the existing literature on �nancialization has been descrip-
tive and empirical, more precise analytical treatments of some of the macroeco-nomic linkages have been presented by Boyer (2000), Aglietta and Breton (2001),Dutt (2005) and Stockhammer (2004, 2006).According to Aglietta and Breton (2001) �[g]rowing �nancial liberalization
has profoundly changed the connections between �nance and the rest of theeconomy". Their analysis, however, is hard to follow, and the formal model doeslittle to elucidate the mechanisms that could support the claims that are beingmade in the paper.2 Boyer�s (2000) model of �nance-led growth basically boils
1Eatwell and Taylor (2000), Blecker (1999), Crotty (2005), Stockhammer (2004, 2006),Duménil and Lévy (2001), Boyer (2000), Aglietta and Breton (2001) and Froud et al (2000)are among the contributions to the growing literature on �nancialization. An InternationalWorking Group on Financialisation has also been set up with the aim of bringing together�an interdisciplinary network of researchers and practitioners interested in �nancializationand all the issues around relations between the capital market, �rms and households."(http://www.iwgf.org/Events.htm).
2 It is di¢ cult, for instance, to justify their assumption of an exogenously given and constant(average) net rate of return (E(�)). The �rm�s credit constraint, second, is peculiar, as is theassumption that a risk premium is added to the risk-free interest rate only if the quantity
1

down to pro�t-led / exhilirationist regimes with a pro�t-wealth-consumptionnexus as a driving force. Given the centrality of this nexus, however, a morecareful modeling of the stock-�ow relations and of the e¤ects of �nancializationon wage formation would have been desirable. Boyer, for instance, assumes anexogenously given, constant q�ratio. This constancy assumption with respectto a key �nancial variable seems particularly unsatisfactory in a model that ad-dresses the e¤ects of �nancialization. The mechanism through which an increasein the �pro�tability norm�generates a decline in the wage bill (for given valuesof output and the capital stock) is also unclear, as is the determination of the"pro�tability norm".3
The Stockhammer and Dutt papers do not su¤er from weaknesses of the samekind. Stockhammer�s 2004 analysis, however, is partial and his 2006 model isrudimentary in its treatment of the �nancial system; Dutt�s analysis focuses ex-clusively on the relaxation of households�credit constraint and considers neithercapital gains nor �rms��nancial decisions and balance sheets.In this paper we explore the macroeconomic implications of changes in �rms�
�nancial decisions (retention rate, new equity issues, debt �nance), �animal spir-its�(shifts in the investment function), household �nancial behavior (saving andportfolio decisions), and the level of interest rates. These changes are amongthe ones that have been highlighted by the �nancialization literature but clearlymake up only a small subset of the issues that have been raised.Three further limitations should be emphasized at the outset: (i) we limit
ourselves to a closed economy, (ii) the emphasis is on the medium- and long-rune¤ects with little or no attention to questions of short-run stability, and (iii)we ignore �scal policy altogether and our treatment of monetary policy is keptalmost embarrassingly simple. We limit the analysis in this way partly to keepit tractable, but also because many of the arguments advanced by the �nan-cialization literature concern the medium- and long-run e¤ects of the changesin �nancial behavior and appear to be unrelated to open-economy complica-tions or government policy. Thus, our simpli�cations may be justi�ed by thelimited objective of our analysis: to examine the logic underlying some of theclaims that have been made in the �nancialization literature. It should be noted,however, that �nancialization may a¤ect the properties of cyclical �uctuations,leading perhaps to an increase in the amplitude of �uctuations, and our analy-sis is clearly incomplete since we ignore these medium- and long-run e¤ects on
constraint is binding. This problem has implications for the analysis of the �rm�s optimizationproblem. In this analysis, the crucial �rst order condition with respect to the debt ratio doverlooks the dependence of the interest rate r on the debt ratio. Intuitively, why wouldany �rm ever want to choose d = dmax if by reducing its debt ratio marginally the interestrate on its debt drops by a �nite amount? The calculation of solutions for r and dmax inthe constrained regime is also wrong since it overlooks the fact that the default probabilityis itself a function of r (aside from this important point, the expressions for r and dmax alsocontain a minor error).
3 Is this norm �xed without any feedback from actual pro�t rates? On p. 124 it is suggestedthat, as an extension, the norm could be determined �using an adaptive process taking intoaccount the past record of the achieved rate of pro�t", but this extension is not pursued inthe paper and it would seem to undermine the exogenous ��nancialization�argument.
2

the higher moments of the variables. A more radical perspective, �nally, mayregard increasing �nancialization as merely a phase in a long cycle of endoge-nous changes in �nancial behavior and Minskian fragility. From this Minskianperspective our neglect of the dynamic interactions underlying the observedchanges in �nancial behavior represents a major limitation.4
Two di¤erent settings are examined. The economy may be �mature� inKaldor�s (1966) terminology and have a growth rate that is constrained bythe available labor force. Alternatively, in the �dual-economy�setting, the laborsupply to the modern / capitalist sector of the economy is perfectly elastic. Bothof these settings are analyzed using two alternative models: one is derived fromSkott (1981, 1988, 1989) and the other from Lavoie and Godley (2001-2002).Both of the models are in a broadly structuralist/ post Keynesian tradition andboth pay explicit attention to balance sheets and �nancial stock-�ow relations.The two models di¤er in a number of respects. Interestingly, however, the di¤er-ences with respect to the speci�cation of �nancing, saving and portfolio decisionshave little e¤ect on the qualitative results. By contrast, the e¤ects of �nancial-ization depend critically on the labor market assumptions (labor-constrained vsdual) and the speci�cation of the investment function (Harrodian vs Kaleckian).The rest of the paper is structured as follows. In section 2 we discuss some
of the stylized facts relating to �nancialization and comment on the dangers of apurely partial analysis. Section 3 outlines our general framework, and Sections4 and 5 consider the implications of changes in key �nancial variables in thecontext of the di¤erent models. Section 6, �nally, discusses the main resultsand o¤ers a few concluding comments and suggestions for further research.
2 Evidence
2.1 Some stylized facts
The stylized facts are largely well-known, and we con�ne ourselves to a briefdescription of some US data. The retention rate, �rst, has declined from around85% in the 1970s to about 73% (Figure 1). It is worth pointing out that thischange marks a return to retention rates that are at or below the levels of the1950s. Looking at the whole period since 1950, the aberration may have beenthe high retention rates of the 1970s and 1980s.The behavior of non-�nancial corporations with respect to new equity issues
shows a clearer picture. Whether measured in terms of the value of new issuesdivided by the market value of outstanding equities (Figure 2) or, alternatively,by the share of new investment �nanced by new equity (Figure 3), there hasbeen a signi�cant decline in new issues. In the 1950s-1970s a small positivefraction of gross investment - on average about 5 percent - was �nanced by newissues. Since 1980, however, the rate of net issues has been negative in most
4Minskian models of endogenous movements in �nancial fragility have been presented by,among others, Taylor and O�Connell (1986), Lavoie (1986/87), Delli Gati and Gallegati (1990),Semmler (1987), Skott (1994).
3

years, and on average non-�nancial corporations have spent an amount equal toabout 12 percent of their gross �xed investment to buy back equity.Debt �nance has become increasingly important. As shown in Figure 4,
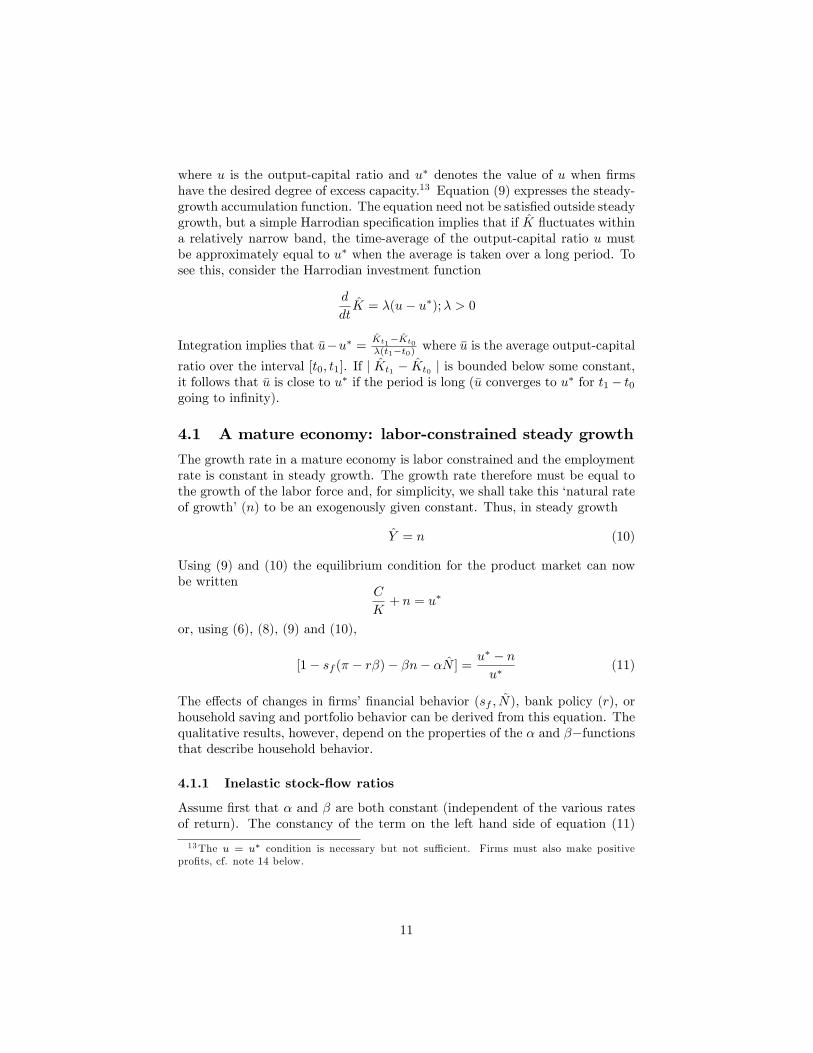
the ratio of debt to the replacement value of capital has increased from a leveljust above 30 percent in the 1950s to about 60 percent. The ratio increasedsteadily in the 1950s and 1960s reaching about 50 percent in the early 1970sbefore dropping back to about 35 percent around 1980. Thus, the increase hasbeen very steep over the last 25 years. It should be noted, however, that Figure4 depicts gross debt. Insofar as non-�nancial �rms hold increasing amounts of�nancial assets, the movements in net debt could be very di¤erent. Data issuesmake it di¢ cult to get a clear picture of changes in net debt.Real rates of interest have �uctuated substantially (Figure 5). The early
1980s saw historically very high interest rate, but rates gradually decrease inthe late 1980s and early 1990s and, after another increase in the mid 1990s, arenow at, and in some cases below, their historical average. Thus, there is littlesupport for common view that �nancialization has led to persistently high realrates of interest.Turning now to household behavior, the well-known rise in the ratio of per-
sonal consumption to disposable personal income comes out clearly in Figure6. The ratio of households�net �nancial wealth to disposable income, however,has shown much more stability (Figure 7). The stock market boom of the 1990sshows up in this ratio, but the value of the ratio is now back at the level thatcharacterized the �golden age" of the 1950s and 1960s. The e¤ects of stockmarket �uctuations, �nally, show up strongly in the ratio of capital gains todisposable income in Figure 8. The distribution of these gains has been veryunequal, but as an average for the household sector the capital gains (and losses)on �nancial assets have been very signi�cant in some periods.
2.2 Dangers of a partial analysis
While the stylized facts of changes in �nancial variables are (relatively) clear,the interpretation and importance of these changes for the performance of theeconomy may not be obvious, and many of the arguments that have been ad-vanced by the �nancialization literature have a partial �avor. As a case inpoint we may consider Stockhammer (2004). This paper, with its combinationof theoretical argument and econometric work, presents a clear and interestinganalysis. The partial nature of the analysis, however, is a limitation.Financialization, Stockhammer argues, has generated a shift in �rms�be-
havior from growth objectives toward shareholder interests. He formalizes thisargument by assuming that the representative �rm faces a growth-pro�t trade-o¤. Managers pick some point on this g� r frontier, and an increased emphasison shareholder interests (partly because of increased takeover threats and partlybecause of changes in managerial pay structures) moves the optimal position inthe direction of higher pro�t rates and lower growth.The macroeconomic implications of this microeconomic analysis are not as
straightforward as they may seem. Stockhammer does not specify �rms��nance
4

constraint or discuss �rms��nancing decisions in any detail. Presumably, how-ever, the movements along a g � r frontier must be re�ected - via the �nanceconstraint - in changes in retention rates, external �nance or the rate of newshare issues. The changes in investment and �rms��nancial decisions interactwith household and government behavior, and these macroeconomic interac-tions - equilibrium conditions for �nancial and goods markets - are ignored inthe analysis. Putting it di¤erently, an individual �rm may face a perceived g�rtradeo¤ but this perceived tradeo¤ does not extend to the macroeconomic level:changes in accumulation and �nancial behavior a¤ect aggregate demand andthereby the position of the g � r frontier. Thus, the micro tradeo¤ may not bestable.Stockhammer tests the theory by estimating an investment function that
includes �rentiers�share of the non-�nancial business sector" as an explanatoryvariable. It is unclear, however, how one should interpret the results. One mighthave thought, �rst, that a shift in �rms�accumulation behavior would implychanges in the parameters of the investment function. Stockhammer does notconsider this possibility. Instead, he argues, the behavioral shift is captured byan increase in the �rentiers�share", and a negative coe¢ cient on this variable isseen as lending support to the theoretical argument. Even assuming, however,that an increase in the �rentiers� share" captures �nancial implications of abehavioral shift, a negative coe¢ cient on this variable in the empirical workdoes not necessarily imply that the changes in �nancial behavior have had anegative e¤ect on accumulation.5 Aggregate demand and thereby the valuesof other explanatory variables in the regression may have been a¤ected by thechanges in �nancial behavior, and these indirect e¤ects need to be taken intoaccount.Unlike in the 2004 paper, the macroeconomic dimension of shareholder-
induced shifts in �rms�investment behavior is analyzed by Stockhammer (2006)but this happens in a setting without di¤erentiated �nancial assets and explicitstock-�ow relations.
3 General framework
3.1 Firms, banks and households
This section presents our general framework. The framework leaves out openeconomy issues, there is no analysis of the short run and stability issues, and
5 In fact the coe¢ cient on rentiers� share is not negative in all speci�cations and it isinsigni�cant in many. Moreover, there may be several explanations for a negative coe¢ cient.Net �nancial income, �rst, is included in the gross pro�t share and for any given pro�t share,an increase in �nancial income implies a reduction in operating pro�ts which presumablyreduces the incentive to accumulate �xed capital. As noted by Stockhammer, second, anincrease in gross �nancial income may mirror an increase in the cost of capital. Firms haveboth �nancial assets and liabilities and if the return on these move together, a rise in thecost of capital will be associated with an increase in gross �nancial income. This correlationbecomes particularly important if the cost-of-capital variable that is included in the analysisprovides a poor approximation to the actual cost of capital.
5

very limited attention to government policy. The purpose is to look at the inter-action between �rms and households across labor, goods and �nancial markets.Firms, it is assumed, make decisions concerning pricing / output, accumulation,and �nancing; households receive a return on their �nancial assets as well aswage income, and they make consumption and portfolio decisions; banks acceptdeposits and make loans. There are only two types of �nancial assets, equityand bank deposits, and banks are the only �nancial institution in the model.6
This framework - which generalizes the one in Skott (1988, 1989) - coversa number of special cases, including Harrodian speci�cations with or withoutlabor constraints and Kaleckian models.
3.1.1 Firms
Finance constraint Consider �rst the �nance constraint facing a single �rm.The �rm invests in real capital and pays out dividends and interest on its debt(bank loans). These expenses have to be matched by income �ows and the pro-ceeds from new issues of equity and new debt. As argued by the �nancializationliterature, the �rm may hold equity in other �rms and own other �nancial assets(bank deposits). Income �ows therefore include both pro�ts and the interestand dividend income from the �rm�s current holdings of �nancial assets. Alge-braically, the �nance constraint can be written
pIj +DivLj + iM
Lj + v
_NAj +
_MAj = �j + v
_NLj + _ML
j + iMAj +Div
Aj
where I;�; Div;M and N denote real investment, nominal pro�ts, dividends,bank loans / deposits and the number of shares. Subscripts j indicate �rm,and superscripts denote assets (A) and liabilities (L); thus MA
j is �rm j�s bankdeposits andML
j the �rm�s bank loans. Bank loans and deposits carry the sameinterest rate (i), the price of investment goods (p) equals the general price ofoutput in this one-sector model and, for simplicity, it is assumed that all shareshave the same price, v.If we aggregate across �rms, the cross holdings of �nancial assets net out,
and the aggregate �nance constraint for the �rm sector simpli�es to:
pI +Div + iM = �+ v _N + _M
where I;�; Div;M and N without sub- and superscripts - denote aggregateinvestment and aggregate pro�t, net dividend payments from �rms to othersectors, net debt to other sectors, and the aggregate number of shares held byother sectors.We assume that dividends are related to retained earnings
Div = (1� sf )(�� rM) (1)
6The liquid asset could also be interpreted as a short bond.
6

where r is the real rate of interest, r = i� p. Thus, the �nance constraint canalso be rewritten
pI = sf (�� rM) + vNN +M(M � p) (2)
The �nance constraint (2) shows that, given the levels of investment andpro�ts and the inherited debt, �rms cannot choose the retention rate, the rateof new issues and the amount of new debt independently. One of these threevariables will have to accommodate so as to ensure that the �nance constraintis being met. In reality, of course, there may be dynamic feedback e¤ects: anunexpected need for external �nance in one period, for instance, may in�uence�rm�s retention and/or new issue policies in subsequent periods.Our purpose in this paper is to examine the comparative statics of changes
in �nancial behavior and from this perspective it does not matter much which�nancial variable is designated as residual. In the analysis below we describe�rms��nancial behavior in terms of their retention rate (sf ). New issue policiescan be captured by the growth of the number of shares (N) or by the shareof investment that is being �nanced by new issues. Skott uses the former andLavoie-Godley the latter parameterization, and we follow these di¤erent para-meterizations in the respective versions of the model.7
Pricing / output: the growth function It is often assumed that �rmsset prices and that output adjusts instantaneously and costlessly to match de-mand. The empirical evidence in favour of signi�cant price rigidity is quiteweak, however.8 The real question, moreover, is not whether there is stickinessin prices but whether prices are more sticky than output. Production is subjectto a production lag, and increases in production and employment give rise tosubstantial search, hiring and training costs; �ring or layo¤s also involve costs,both explicit costs like redundancy payments and hidden costs in the form ofdeteriorating industrial relations and morale. In a continuous-time setting onemay approximate the e¤ects of lags and adjustment costs by assuming that out-put is predetermined at each moment, that �rms choose the rate of growth ofoutput at each moment, rather than the level of output, and that this choiceis made so as to balance the costs of changes against the bene�ts of movingtoward a preferred level of output and employment. These costs and bene�ts
7One could also, following Eichner (1976) and Wood (1975) - assume that �rms set theshares of investment that are to be �nanced by the three di¤erent sources, with both sf andN varying in response to changes in accumulation. This case is considered in Skott (1989,chapter 7).
8The study by Levy et al. (1997) of menu costs in �ve supermarkets, for instance, is oftencited in support of menu costs and price stickiness (e.g. Romer 2001, pp. 315-316). This studyfound that on average 16 percent of all prices were changed each week. These frequent changesin prices were not costless but the �nding that menu costs constitute a signi�cant proportionof net pro�ts is largely irrelevant for an evaluation of price �exibility. With prohibitivelyhigh menu costs, for instance, there would be no price changes and the share of menu costin revenue would be zero; negligible menu costs on the other hand may allow �rms to changeprices frequently as part of their marketing strategies, and the observed share of menu costsin net pro�ts could be very high in this case.
7

are determined by demand signals from output markets and cost signals frominput markets.If prices are �exible, the demand signal can be captured by the prevailing
pro�t share. The level of output is predetermined at any moment, and a risein demand leads to an increase in the price of output. Wage contracts are castin terms of money wages, and there is neither perfect foresight nor instanta-neous feedbacks from output prices to money-wage rates. The real wage rateand the share of pro�ts in income therefore respond to unanticipated move-ments in prices: a positive demand shock generates a rise in the pro�t share.Demand signals could also be re�ected in inventories. For the aggregate econ-omy, however, movements in inventories tend to amplify �uctuations in otherdemand components over the cycle and thus do not obviate the need for priceadjustments. For simplicity, we disregard movements in inventories.Turning to the signals from input markets, we leave out intermediate inputs
and take labour to be the only input that is variable in the short run; changesin the capital stock take longer to implement and, partly because of that, �rmstypically maintain excess capital capacity. As far as production decisions areconcerned, the labour market therefore provides the relevant signal, and we usethe employment rate as the indicator of the state of the labour market. The rateof employment in�uences the costs of changing output through its e¤ects on theavailability of labour with the desired quali�cations. High rates of employmentincrease the costs of recruitment, and since the quit rate tends to rise whenlabour markets are tight, the gross recruitment needs associated with any givenrate of expansion increase at a time when low unemployment makes it di¢ cult toattract new workers. High employment and high turnover of the labour force, onthe other hand, may allow �rms to contract production and employment morerapidly without signi�cant redundancy costs. These standard microeconomice¤ects may be reinforced by broader Marxian e¤ects on the social relations ofproduction. A high rate of employment may have a negative impact on �rms�growth plans because it strengthens workers vis-a-vis management and may leadto increased shop-�oor militancy.The analysis suggests that the rate of growth of production will be positively
related to the pro�t share (�) and negatively related to the employment rate (e).Thus, the pricing / output decisions can be described by the following �growthfunction�9
Y = h(�; e);h� > 0; he < 0: (3)
The case of unlimited labor supplies can be obtained by setting he = 0; and thegrowth function yields the standard Kaleckian assumption of a �xed pro�t share�� (a �xed markup on wage cost) if we have both he = 0 and h� =1 at � = ��.One may note also that a static counterpart to equation (3) can be obtainedby setting Y = 0. The equation then de�nes the pro�t share as an increasingfunction of the employment rate. A short-run equilibrium relation of this kind
9Or �output expansion function�, using the terminology in Skott (1989, 1989a). The be-havioral foundations of the function are discussed in greater detail in Skott (1989, chapter4).
8
could be derived from pro�t maximization if �rms have monopsony power andthe perceived elasticity of labor supply to the individual �rm is inversely relatedto the aggregate rate of employment.10
Accumulation As a general speci�cation we may assume that the rate ofaccumulation depends on the rate of utilization of capital, the pro�t share, and�nancial variables like the real rate of interest, the valuation ratio (Tobin�s q),and the ratios of debt and retained earnings to the value of the capital stock.Algebraically,
I
K= f(u; �; r; q;m; c) (4)
where u is utilization, q the valuation ratio (q = M+vNpK ), and m and c the ratios
of debt and retained earnings to capital (m = MpK ; c =
sf (��rM)pK ).
There is no consensus in the structuralist / post Keynesian literature con-cerning the long-run sensitivity of the accumulation rate to changes in thevarious arguments.11 In the analysis below, we explore both Harrodian andKaleckian speci�cations.
3.1.2 Banks
Banks give loans to �rms and accept deposits from households. Neither �rmsnor households hold cash. When banks provide a loan to a �rm, the moneytherefore returns to the bank immediately, either as deposits from householdsor because other �rms use their increased revenues to reduce their debt. Theloan and deposit rates are equal and there are no costs involved in banking.Thus, banks make neither pro�ts nor losses,12 and the �rm sector has a netdebt (M) that must equal the total deposits of the household sector (=moneydemand, MH):
M =MH
Banks determine the nominal interest rate. This nominal rate, however, willtypically depend on in�ation and to simplify the exposition, we treat the realrate of interest r (= i� p) as the variable that is set by the banking system (andkept constant in steady growth).
10A positive relation between employment and the pro�t share could also arise from aninverse relation between the perceived demand elasticity and aggregate employment or as aresult of a �xed markup on variable cost in a setting with overhead labor.11See, among others, Auerbach and Skott (1988), Dutt (1997), Kurz (1986), Lavoie (1995)
and Flaschel and Skott (2006).12The share valuation of banks therefore is zero, and this simple version of the model does
not capture the increasing share of the �nancial sector in GDP and of �nancial-sector pro�tsin total pro�ts.
9

3.1.3 Households
In analogy with �rms, households face a budget (or �nance) constraint. For thehousehold sector as a whole it takes the form
pC + v _NH + _MH =W +DivH + iMH (5)
where C is consumption, W wage income, NH ;MH indicate household holdingsof shares and deposits (money), and DivH is dividend payments received by thehousehold sector.The steady-growth implications of household consumption and saving behav-
ior can be described in terms of stock-�ow ratios of assets to income. Speci�cally,let
MH = �(i; r; re; �; :::)pY (6)
vNH = �(i; r; re; �; :::)pY (7)
where the stock-�ow ratios � and � may depend on a number of variables,including the real rates of return on deposits (r) and equity (re). Theoriesdi¤er with respect to the determination of the (steady-growth) values of thesestock-�ow ratios, and in sections 4-5 we examine di¤erent speci�cations. Sometheories are cast in terms of �ow-�ow relations (e.g. consumption as a function ofdistributed incomes and capital gains, as in the Lavoie-Godley model) but evenwhen this is the case, the speci�cation of the �ow-�ow relations have implicationsfor the steady-growth values of the stock-�ow ratios, and the implied stock-�owratios provide a clearer picture of the mechanisms behind the e¤ects of changesin �nancial behavior.The relation between the stock-�ow ratios and consumption is straightfor-
ward. Using the budget constraint (5) and the dividend equation (1), the stock-�ow relations (6)-(7) imply the following consumption function:
C
K= u[1� sf (� � r�) + �(p� M)� �N ] (8)
4 Harrodian accumulation
In this section we follow the Harrodian tradition and assume that the degreeof excess capital capacity is at (or near) where �rms want it to be. Firms willtypically want a reserve of excess capacity, but if the degree of excess capacitypersistently exceeds the desired reserve, they reduce their accumulation rate;conversely, if they �nd themselves with less than the desired excess capacity,they will gradually increase their rate of accumulation. Thus, a steady growthpath with a constant accumulation rate requires the consistency of desired andactual degrees of excess capacity, that is,
u = u� (9)
10
where u is the output-capital ratio and u� denotes the value of u when �rmshave the desired degree of excess capacity.13 Equation (9) expresses the steady-growth accumulation function. The equation need not be satis�ed outside steadygrowth, but a simple Harrodian speci�cation implies that if K �uctuates withina relatively narrow band, the time-average of the output-capital ratio u mustbe approximately equal to u� when the average is taken over a long period. Tosee this, consider the Harrodian investment function
d
dtK = �(u� u�);� > 0
Integration implies that �u�u� = Kt1�Kt0
�(t1�t0) where �u is the average output-capital
ratio over the interval [t0; t1]. If j Kt1 � Kt0 j is bounded below some constant,it follows that �u is close to u� if the period is long (�u converges to u� for t1� t0going to in�nity).
4.1 A mature economy: labor-constrained steady growth
The growth rate in a mature economy is labor constrained and the employmentrate is constant in steady growth. The growth rate therefore must be equal tothe growth of the labor force and, for simplicity, we shall take this �natural rateof growth�(n) to be an exogenously given constant. Thus, in steady growth
Y = n (10)
Using (9) and (10) the equilibrium condition for the product market can nowbe written
C
K+ n = u�
or, using (6), (8), (9) and (10),
[1� sf (� � r�)� �n� �N ] =u� � nu�
(11)
The e¤ects of changes in �rms��nancial behavior (sf ; N), bank policy (r), orhousehold saving and portfolio behavior can be derived from this equation. Thequalitative results, however, depend on the properties of the � and ��functionsthat describe household behavior.
4.1.1 Inelastic stock-�ow ratios
Assume �rst that � and � are both constant (independent of the various ratesof return). The constancy of the term on the left hand side of equation (11)
13The u = u� condition is necessary but not su¢ cient. Firms must also make positivepro�ts, cf. note 14 below.
11

implies that
@�
@sf= �� � �r
sf< 0 (12)
@�
@N= � �
sf< 0 (13)
@�
@r= � > 0 (14)
@�
@�= � N
sf@�
@�=
sfr � nsf
The signs of the e¤ects of changes in sf ; N and r are unambiguous. If �rms raisethe retention rate or increase the rate of new issues, this will depress pro�tability,while an increase in the real interest rate raises the pro�t share.14 The intuitionis simple. An increase in sf increases aggregate saving, given the share ofpro�ts, and to bring saving back into line with the steady-growth requirement,a reduction in the pro�t share is needed. An increase in the real interest rate(r) has the opposite e¤ect since it reduces retained earnings and thus saving atany given share of pro�ts. An increase in new issues (N); like increases in theretention rate, raises aggregate saving but the mechanism may be a little lesstransparent. Saving goes up because the rise in N induces households to raisetheir saving. Share prices adjust so as to maintain a constant ratio (= �) ofthe value of shares to income. The growth of real income is given, and if therate of new issues has gone up, this means that real share prices will increaseat a lower rate. Capital gains therefore are smaller and as a result householdschoose to save a larger proportion of their wage, dividend and interest income.Financialization has been associated primarily with increased dividends (a
decline in sf ), a decrease in the rate of new issues (N) and an increase in thereal rate of interest (although, as shown in section 2, the evidence for interestrates is questionable). Strikingly, in this model all of these changes unambigu-ously generate a rise in the steady-growth pro�t share and the steady-growthemployment rate. The employment e¤ect follows immediately from the growthfunction (3): whenever the pro�t share goes up, the employment rate must dothe same in order to keep the growth rate unchanged.15
So far we have taken � and � to be constant. Even leaving aside the func-tional dependence of these ratios on, inter alia, the rates of return, �nancializa-tion might generate a shift in the levels of � and �: Thus, it could be arguedthat �nancialization increases the availability of consumer credit and thereby14A capitalist economy would not be viable if the steady growth path implied that pro�ts
fall short of real interest payments on the debt. Thus, the condition � � �r > 0 must hold,otherwise accumulation would collapse.15 In this paper we do not consider nominal wage formation and in�ation explicitly. The
NAIRU literature is enormous; one of us has analysed reasons for the absence of a NAIRU inearlier work (Skott 1997, 1999, 2005).
12

tends to reduce the ratio �: A reduction in � has two e¤ects: it increases re-tained earnings (which tends to increase consumption) but if the growth rateof income is positive it also reduces the amount of saving that households needto carry out in order to maintain the money-income ratio at the desired value.Depending on parameter values, the balance of these two e¤ects can be positiveor negative.16
Changes in the � ratio are not usually seen as a key mechanism behindchanges in economic performance.17 Moreover, in this model the e¤ects ofautonomous shifts in � depend on the values of N . This result is quite intuitive.The value of the equity-income ratio (�) simply does not a¤ect saving if thereare no new issues. Households can only save in the form of shares if other sectors(�rms) are willing to sell shares. If that is not the case then an increase in thedesire to own shares will simply generate higher share prices, and the desire willbe met without any extra saving. With positive new issues, a higher valuationof shares (a higher �) implies an increase in household saving; with negative newissues, on the other hand, a higher valuation of shares implies that householdsreceive higher revenues from their net sale of shares, and their saving out ofwages, dividends and interest income is reduced.In addition to the changes in �nancial behavior, �nancialization may have
been associated with a downward shift in the investment function. In thisHarrodian setting, such a shift would be re�ected in a rise in the desired output-capital ratio u�. This kind of change has the consequences that one wouldexpect. Equation (11) implies that a rise in u� leads to a decline in the pro�tshare and, using the growth function (3), a fall a employment. Thus, accordingto this model the changes associated with neoliberalism and �nancialization havecontradictory e¤ects. The net e¤ect may have been a deterioration of economicperformance, but the negative impact comes from the shift in the investmentfunction, rather than from the changes in �nancial behavior that have beenhighlighted in the literature.
16Our results for changes in � are closely related to those of Dutt�s (2005) analysis ofchanges in consumer debt. Using a Kaleckian (stagnationist) model, Dutt shows that theshort-run e¤ect of an increase in households�debt-income ratio (corresponding to a decreasein � in this model) is unambiguously positive. This short-run result is not surprising sincethe the transition to a higher debt ratio is associated with extra consumption. The long-rune¤ects on growth are ambiguous, however. In the long run, the debt ratio has increased (�has decreased), and this increase in the debt ratio implies a shift of disposable income fromlow-saving workers to high-saving capitalists. This contractionary e¤ect may or may not beo¤set by a positive e¤ect. Consumer debt grows at the same rate as output (and the capitalstock) and this expansionary e¤ect - consumers being allowed to increase their debt whenoutput grows - depends on the growth rate. Thus, in Dutt�s model, an increase in consumerdebt will raise the growth rate if the initial growth rate is high while if output grows slowly,the increase in debt will reduce the growth rate. In this version of our model, the growth rateis exogenous but the analogous result in our model is that a decrease in � raises the pro�tshare if the growth rate is high but reduces the pro�t share if the growth rate is small is low.17One might consider the possibility that u� depend on the valuation ratio (Tobin�s q) and
thereby on � and �. A high valuation ratio indicates a rate of pro�t that exceeds the cost of�nance. The desired output-capital ratio may therefore be inversely related to the valuationrate. This expansionary impact of an increase and � and � is considered by Skott (1988,1989).
13

How general are these conclusions? The assumption of exogenous �� and�� ratios is clearly restrictive, but the qualitative results survive as long as �and � are relatively insensitive to changes in the �nancial parameters (sf ; N ; r)and the pro�t share (�).Di¤erentiating equation (11) totally, we get
�sfd� � �dsf + (sfr � n)d� + �(sfdr + rdsf )� �dN � Nd� = 0 (15)
where
d� =@�
@sfdsf +
@�
@NdN +
@�
@rdr +
@�
@�d� (16)
d� =@�
@sfdsf +
@�
@NdN +
@�
@rdr +
@�
@�d� (17)
sf ; N ; r and � may not in�uence � and � directly but they will do so indirectlyvia their e¤ects on the various rates of return. Thus, the partial @�
@sfincludes
the indirect e¤ect on � of changes in rates of return generated by the change insf . The rate of return on equity, for instance, is given by re =
(1�sf )(��r�)pYvN +
v � p = (1�sf )(��r�)� + n� N and an increase in sf reduces re18
Using (15)-(17) we get
@�
@sf= �
� � �r � (sfr � n) @�@sf + N@�@sf
sf � (sfr � n)@�@� + N@�@�
(18)
@�
@N= �
�� (sfr � n) @�@N + N@�@N
sf � (sfr � n)@�@� + N@�@�
(19)
@�
@r=
sf� + (sfr � n)@�@r � N@�@r
sf � (sfr � n)@�@� + N@�@�
(20)
The signs of the partials of the pro�t share with respect to these three�nancial parameters are the same as in (12)-(14) as long as
� � �r > (sfr � n)@�
@sf� N @�
@sf
� > (sfr � n)@�
@N� N @�
@N
sf� > �(sfr � n)@�
@r+ N
@�
@r
sf > (sfr � n)@�
@�� N @�
@�
These �inelasticity conditions� will automatically be satis�ed if (sfr � n) =
N = 0, irrespective how sensitive are � and � to variations in their arguments.18Mathematically, perverse results are possible in which a rise in sf increases the return.
This could happen, for instance, if there is a strong inverse relation between � and re. Theconditions that would give these perverse results can be ruled out on economic grounds.
14

Empirically, both sfr�n and N are close to zero, having at times been positiveand at times negative. In fact, setting (sfr�n) = N = 0 is arguably a reasonableempirical benchmark. Thus, the qualitative results in (12)-(14) survive - at leastas an outcome that holds for a range of empirically very plausible parametervalues - in a more general model in which the stock-�ow ratios are determinedendogenously. It should be noted also that the di¤erent speci�cations used inSkott (1981, 1988, 1989) are special cases of the general model with endogenous� and � ratios;19 all of these special cases satisfy the inelasticity conditions forany reasonable set of parameters, as does the �ow-�ow speci�cation used byLavoie and Godley (2001-2002) (see below).Overall, then, while the implications of assuming elastic stock-�ow ratios are
clear - the comparative statics will be reversed - inelastic ratios appear to bethe more interesting and empirically relevant case.20
4.1.2 The Lavoie-Godley speci�cation of consumption
In the Lavoie-Godley model, consumption is a function of distributed incomeand capital gains. Thus, the consumption function is speci�ed as a �ow-�owrelation. Using our notation, a general version of their consumption functioncan be written as:
C
K= (y; ); y > 0; > 0 (21)
where y is households�distributed income and is capital gains, both variablesas ratios of the capital stock (y = [1 � sf (� � r�) + p�]u and = vN(v�p)
pK ).The proportion of the investment expenditure that is �nanced by equity issuesis denoted as x. Lavoie and Godley take this proportion as the parameterdescribing new issue policies (instead of N ). By de�nition
vN
pKN = x
I
K= xg
where g is the accumulation rate. Thus, the ratio of capital gains to capital canbe written
= �ug � xg
The equilibrium condition (11) is general and still holds in the Lavoie-Godleyspeci�cation and - using the de�nition of x - the equation can be written
u� � n = u�h1� sf (� � r�)� �n�
xn
u�
i= (y; ) (22)
19Skott (1989), for instance, assumes that � is exogenous and that vN = �(�; u; r; �)pY =(� � �
u� r�)pY where � is the rate of depreciation; thus, share valuation is proportional to
pro�ts net of depreciation and real interest payments.20We use the terms �inelastic�and �elastic�to denote the cases when the conditions hold and
fail to hold, respectively. Intermediate cases in which some but not all of the conditions holdare clearly possible; in these cases only some of the signs of the partials in (12)-(14) will bepreserved.
15

The steady growth value of � (and �) is a¤ected by the consumption / savingfunction (21) and household portfolio decisions. In the Lavoie-Godley modelthese portfolio decisions are described by
M
M + vN� �
�+ �= z(r; re; y); zr > 0; zre < 0; zy > 0 (23)
where re is the rate of return on equities (re = (1�sf )(���r)u+n(�u�x)�u ).
For some functional forms of in (22) and z in (23), it may be possibleto obtain analytical expressions for � and �; as in our general representationfor the stock-�ow ratios, (6) and (7); other speci�cations - including the onesused by Lavoie and Godley - may preclude explicit analytical expressions butthe stock-�ow implications can still be evaluated numerically.With the relevant de�nitions, (22) and (23) determine the equilibrium values
of �, � and �. Each exogenous variable (sf , x, r, among others) a¤ects theequilibrium stock-�ow ratios � and � as well as the pro�t share �; and we getexpressions that are analogous to (18)-(20):
@�
@sf= �
� � �r � (sfr � n) @�@sfsf � (sfr � n)@�@�
@�
@x= �
n� (sfr � n)u� @�@xsfu� � (sfr � n)u� @�@�
@�
@r=
sf� + (sfr � n)@�@rsf � (sfr � n)@�@�
The total e¤ect on the pro�t share of each parameter can be decomposed intothe e¤ect for a given � and �, and the derived e¤ect via changes in � and �.The �rst e¤ect is clear and straightforward as shown in section 4.1.1. Our mainconcern here is whether �the inelasticity conditions�for stock-�ow ratios hold inthe Lavoie-Godley speci�cation.Using Lavoie and Godley�s values for the parameters,21 we �nd that in the
Harrodian mature economy, the indirect e¤ects via changes in � and � arequite small, with the direct e¤ects corresponding to constant stock-�ow ratiosexplaining most of the total e¤ects. Table 1 shows the numerical results. Thenumbers in Table 1 indicate the derivatives of the pro�t share with respect toeach exogenous parameter, evaluated at the equilibrium associated with Lavoieand Godley�s original values of parameters.22
21Lavoie and Godley (2001-2002) did not report parameter values but have provided thevalues in private correspondence. These parameter values and our procedure of decompositionare given in the Appendix.22 In this paper we simply use Lavoie and Godley�s parameter values, leaving for future
research a more careful examination of whether our �inelasticity conditions�are robust withrespect to reasonable variations in these parameter values.
16

4.2 Dual economies: endogenous growth
We now turn to the case of dual economies, that is, economies in which thelabor force does not constrain the rate of growth. This case may correspondto economies with large amounts of hidden unemployment in backward, non-capitalist sectors, or it could depict the case where the labor supply to thecapitalist sector is perfectly elastic for other reasons (immigration, women�sparticipation rate, endogenous fertility, or technical progress).The growth function needs to be modi�ed in a dual economy of this kind.
The employment rate no longer serves as a relevant signal and therefore dropsout of the growth function. Hence,
Y = h(�);h0 > 0
In steady growth we still have g = Y = K and u = u�, and the equilibriumcondition for the product market takes the form
[1� sf (� � r�)� �h(�)� �N ] = 1�1
u�h(�) (24)
4.2.1 Inelastic stock-�ow ratios
In the case with exogenous � and � ratios, equation (24) gives the followingcomparative statics:
@�
@sf= � � � r�
sf + (� � 1u� )h
0(�)< 0
@�
@N= � �
sf + (� � 1u� )h
0(�)< 0
@�
@r=
�sf
sf + (� � 1u� )h
0(�)
@�
@�= � N
sf + (� � 1u� )h
0(�)
@�
@�=
sfr � nsf + (� � 1
u� )h0(�)
The signs of these partials depend on the magnitude of h0(�): The expression� � 1
u� =M�pKpY is negative for any empirically reasonable speci�cation, and it
follows that compared to the labor constrained case, the comparative statics areunchanged if h0 is �small�but reversed if h0 is �large�. The standard Kaleckianformulation with � = �� corresponds to the limiting case with h0 !1. This maybe an extreme case, but in the absence of labor constraints one would expecta high sensitivity of growth to variations in pro�tability. Thus, the large-h0
case with the reversal of comparative statics for the pro�t share seems the mostreasonable.
17

Changes in the pro�t share in�uence the growth rate in a dual economy,rather than the employment rate as in the labor-constrained economy. Expres-sions for the growth rate e¤ects are readily obtained in the limiting case witha constant markup formulation (h0(�) ! 1 at � = ��). In this limiting caseequation (24) can be rewritten
[1� sf (�� � r�)� �g � �N ] = 1�1
u�g
and
@g
@sf=
(�� � r�)u�1� �u� > 0
@g
@N=
�u�
1� �u� > 0
@g
@r= � sf�u
�
1� �u� < 0
@g
@�=
Nu�
1� �u�@g
@�=
(g � sfr)u�1� �u�
The signs of the e¤ects of changes in sf ; N and r are clear. If �rms raisethe retention rate or increase the rate of new issues, this will increase the rateof capital accumulation, while an increase in the real interest rate slows downaccumulation. The intuition is simple. Since u� and �� are una¤ected by changesin sf ; N and r, the e¤ects on accumulation of changes in sf ; N and r deriveexclusively from their direct impacts on saving and the amount of available�nance. Given that u = u� and � = ��, an increase in sf or N must increasethe amount of �nancial resources available to �rms - raising the rate of capitalaccumulation - while a rise in r has the opposite e¤ect on accumulation since itreduces the amount of retained earnings.23
4.2.2 The Lavoie-Godley speci�cation of consumption
As we have seen in section 4.1.2, households�consumption/saving and portfoliodecisions in Lavoie-Godley (2001-2002) implicitly de�ne the stock-�ow ratios, �and �, as functions of a number of variables, and the accumulation rate becomesan additional in�uence on � and � in the dual economy. Analogously to theanalysis in section 4.1.2, we obtain the following comparative statics.
23 It is easy to understand these comparative statics by looking at the closed-form solution
for the rate of capital accumulation, i.e. g =[sf (���r�)+�N ]u�
1��u� .
18

@g
@sf=
�� � r� � (sfr � g) @�@sf1u� (1� �u� � x) + (sfr � g)
@�@g
@g
@x=
1u� g � (sfr � g)
@�@x
1u� (1� �u� � x) + (sfr � g)
@�@g
@g
@r= �
sf� + (sfr � g)@�@r1u� (1� �u� � x) + (sfr � g)
@�@g
We follow a decomposition procedure that is similar to the one in 4.1.1in order to check if the inelasticity conditions for the stock-�ow ratios holdin Harrodian dual economies. Table 2 reports the numerical results based onLavoie and Godley�s parameter values.The signs of the derivatives of g with respect to the parameters are the same
in the variable � and � regime as in the constant � and � regime, that is, our�inelasticity conditions�hold in Harrodian dual economies with a Lavoie-Godleyspeci�cation of consumption and portfolio behavior. However, the absolutevalues of the derivatives in the case of constant � and � are much greater thanthose in the case of variable � and �. Thus, the adjustment of � and � causedby changes in the parameters produce signi�cant and partially o¤setting e¤ectson accumulation.
5 A Kaleckian model
Our Kaleckian model di¤ers from Harrodian models with respect to the speci�-cation of accumulation. Unlike in the Harrodian framework, the utilization rateu becomes an accommodating variable, and a shift in aggregate demand maygenerate a permanent change in utilization. The pro�t share, by contrast, istreated as exogenous, � = ��; and the labor supply is taken be perfectly elastic(that is, the model describes the dual-economy case). The Kaleckian model,�nally, often imposes �stagnationist�assumptions which ensure that an increasein the pro�t share will reduce utilization; most of our results for the compara-tive statics of changes in �nancial behavior do not depend on these additionalassumptions.
5.1 Inelastic stock-�ow ratios
By using the de�nition of � and �, Tobin�s q, the debt-capital ratio, and theratio of retained earnings to capital can be written as:
q = (�+ �)u
m = �u
c = sf (� � r�)u
19

Thus, for given values of ��; � and �, the accumulation function (4) becomes afunction of utilization only:
I
K= f(u; ��; r; q;m; c) = f(u; ��; r; (�+�)u; �u; sf (���r�)u) � �(u;�; �; r; ��; sf )
From (8) and the product market equilibrium condition, we now have
�(u;�; �; r; ��; sf ) = [sf (�� � r�) + ��(u) + �N ]u (25)
We may interpret the terms in the bracket on the right hand side of (25) asthe average saving rate. Following the Kaleckian tradition, we assume that thetraditional Keynesian short-run stability assumption holds in the long run, too,that is, we assume that saving is more responsive than investment to changesin the utilization rate. If the �� and ��ratios are exogenous, we then have
sf (�� � r�) + �(�0u+ g) + �N � �0 > 0 (26)
and - assuming positive autonomous investment, �(0;�; �; r; ��; sf ) > 0 - it canbe shown that there is a unique positive solution for u in the interval (0; 1� ).For empirically reasonable magnitudes of the negative e¤ect on capital ac-
cumulation of debt-capital ratio, accumulation is increasing in the utilizationrate, i.e. �0(u) > 0;24 and we have the following comparative statics for theutilization rate:
@u
@�=
(1� �u)f� + usff(1� �u)fc � 1gsf (�� � r�) + �(�0u+ g) + �N � �0
(27)
@u
@sf=
(�� � r�)uf(1� �u)fc � 1gsf (�� � r�) + �(�0u+ g) + �N � �0
< 0 (28)
@u
@N= � �u
sf (�� � r�) + �(�0u+ g) + �N � �0< 0
@u
@r=
(1� �u)(fr � fcsf�u) + sf�usf (�� � r�) + �(�0u+ g) + �N � �0
du
d�=
fq(1� �u)u� Nusf (�� � r�) + �(�0u+ g) + �N � �0
du
d�=
(sfr � g)u+ (1� �u)(fq + fm � fcsfr)usf (�� � r�) + �(�0u+ g) + �N � �0
The stagnationist case is obtained if an increase in the pro�t share generatesa decline in utilization. Comparing (27) and (28) it is readily seen that in thisstagnationist case an increase in the retention rate must depress the rate ofutilization: it follows from (26) and (27) that (1 � �u)fc < 1 is a necessarycondition for @u
@� < 0. However, the determinate sign of the partial derivativeof the utilization rate with respect to the retention ratio can also be justi�ed
24The mathematical condition for �0(u) > 0 is �jfmj < fu + fq(�+ �) + fcsf (�� � r�).
20

directly by the empirically mild assumption that (1 � �u)fc < 1.25 Giventhis assumption, an increase in sf lowers the utilization rate since, for a givenu, saving rises more sharply than investment, and the utilization rate mustdecrease in order to restore the product market equilibrium. Analogously - andindependently of whether @u
@� < 0 - the average saving rate rises as N increasessince more household income goes to purchasing equities rather than buyingconsumer goods. This depresses the level of e¤ective demand and results in alower rate of utilization.The increase in the real interest rate has a negative impact on both saving
and investment. It lowers the amount of corporate saving, and the decrease inretained earnings depresses accumulation for a given rate of utilization. Savingfalls more sharply than investment if the direct negative impact on investmentof changes in r is not too large, i.e. (1� �u)(fr � fcsf�u) + sf�u > 0. Underthis assumption, to restore the product market equilibrium, a higher utilizationrate is required. However, if (1� �u)(fr � fcsf�u) + sf�u < 0, the higher realinterest rate requires a lower utilization rate for the product market equilibrium.The e¤ects of changes in a and �; again, are ambiguous.The e¤ects on accumulation of changes in the �nancial variables are given
by:
@g
@�= f� + sfufc + �
0 @u
@�(29)
@g
@sf= fc(�� � r�)u+ �0
@u
@sf(30)
@g
@N= �0
@u
@N< 0 (31)
@g
@r= fr � fcsf�u+ �0
@u
@r(32)
The result for @g@� in equation (29) is parallel to Marglin and Bhaduri�s (1990)
analysis of wage and pro�t led growth in a stagnationist regime. The direct andpositive e¤ect on accumulation of an increase in the pro�t share may or may notbe dominated by the e¤ect of a decline in utilization. A rise in the retentionrate - equation (30) - also produces con�icting e¤ects on accumulation. The�rst term in (30), fc(���r�)u, captures a direct positive impact on accumulationfrom an increase in the amount of internal funds, but an increase in the retentionrate also has a negative e¤ect on accumulation by lowering the utilization rate(the second term in (30), �0 @u@sf , is negative). Which e¤ect dominates is an
empirical matter but - using the expressions for @u@� and
@u@sf
- it follows that in
25 It is di¢ cult to see how an increase in retained earnings - keeping constant u; �; r; q;m -can lead to a more than one-for-one increase in investment, that is, one would expect fc � 1.
21

this model @g@sf
> 0 is a su¢ cient condition for growth to be pro�t led.26
The e¤ect on capital accumulation of an increase in the rate of equity issuesis more clear-cut. An increase in N leads to a lower rate of utilization, and thelower utilization rate depresses capital accumulation.Real interest rates have ambiguous e¤ects. The direct e¤ect on accumula-
tion of a rise in the real rate of interest is negative but the derived e¤ect onaccumulation via changes in the utilization may be positive: fr�fcsf�u in (32)is negative, but the sign of �0 @u@r in (32) can be positive or negative, leavingunclear the sign of the total e¤ect. The ambiguity that characterizes the e¤ectsof changes in � and � on utilization also carry over to the e¤ects on the growthrate.Financialization, �nally, may have been associated with a downward shift
in the accumulation function, f (or �). A downward shift of this kind leadsto a lower utilization rate, and this fall in utilization exacerbates the decline inaccumulation.Strikingly, the comparative static results for a stagnationist dual economy
resemble those for the mature Harrodian economy. A fall in the rate of newequity issues is expansionary in both models. In the stagnationist model itleads to a higher utilization rate and a higher accumulation rate; in the Harro-dian model pro�ts and employment both increase. A decrease in the retentionrate, moreover, may (but need not) increase both the utilization rate and thecapital accumulation rate in the stagnationist model and it raises pro�ts andemployment in the Harrodian case.
5.2 The Lavoie-Godley speci�cation of consumption andaccumulation
In Lavoie and Godley (2001-2002), the accumulation function is given by
g = 0 + 1sf ( ��u� rm)� 2rm+ 3q + 4u
where 0, 1, 2, 3, and 4 are positive constants. Using the de�nitions of q,m, � and �, this accumulation function can be rewritten:
26We have
@g
@�= f� + sfufc + �
0 @u
@�
= f� + sfufc + �0 (1� �u)f� + usff(1� �u)fc � 1gsf (�� � r�) + �(�0u+ g) + �N � �0
= f� + �0 (1� �u)f�sf (�� � r�) + �(�0u+ g) + �N � �0
+sf
�� � r�[(�� � r�)ufc + �0
(�� � r�)uf(1� �u)fc � 1gsf (�� � r�) + �(�0u+ g) + �N � �0
]
= f� + �0 (1� �u)f�sf (�� � r�) + �(�0u+ g) + �N � �0
+sf
�� � r�@g
@sf
22

g = 0 + [ 1sf ( �� � r�)� 2r� + 3(�+ �) + 4]u (33)
If the � and � ratios are constant, we have a special linear version of our function�(u) in the previous section, and the sensitivity of investment to the utilizationrate depends on the various parameters, including � and �. The Lavoie-Godleyspeci�cation of consumption and portfolio behavior, however, implies that the� and � ratios are endogenous and that the response of investment to changesin u will be a¤ected by the endogenous adjustment of the stock-�ow ratios �and �.The consumption function and households�portfolio choice have been de-
scribed already in section 4.1.2. For convenience we reproduce the key equations(22)-(23) here:
u� g = uh1� sf (�� � r�)� �g �
xg
u
i= (y; ) (34)
�
�+ �= z(r; re; y) (35)
where = �ug�xg, y = [1�sf (���r�)+ p�]u, and re = (1�sf )(����r)u+g(�u�x)�u .
Unlike in section 4.1.2, g and u are endogenously determined while � is a para-meter.The system (33)-(35) determines four endogenous variables, g, u, � and �
((34) contains two equations). This system is equivalent to the steady-growthsystem in Lavoie and Godley (2000-2001).27 It can be compared to one in whichaccumulation is described by (33), but in which � and � are assumed constant(that is, in which we drop (35) and the last equation in (34)).Analytical solutions are hard to obtain, but using the original parameter val-
ues in Lavoie and Godley (2001-2002) our inelasticity conditions for stock-�owratios survive in this stagnationist Lavoie-Godley system. Table 3 describes thenumerical results. Qualitatively, the macroeconomic e¤ects of �nancializationon the steady state are the same in the �xed �; � system and the Lavoie-Godleymodel. In both models, the e¤ects of an increase in the retention rate are neg-ative for both utilization and accumulation. Thus, given the parameter con�g-uration, the direct positive impact of a rise in sf on accumulation is dominatedby its negative utilization e¤ect on accumulation. A rise in the share of invest-ment �nanced by new issues has a contractionary e¤ect on both utilization andaccumulation. An increase in the real interest rate on the utilization rate has anpositive e¤ect on the utilization rate, but this positive utilization e¤ect is o¤setby the negative e¤ect of the higher interest rate on accumulation: accumulationslows down in the face of the higher real rate of interest.The similarity between the systems with constant and endogenous � and �
ratios is not just qualitative. The derivatives of u and g with respect to the
27The only small di¤erence between Lavoie and Godley steady-state system and ours liesin the lag structure of variables. In our analysis, we make all level variables in each equationcontemporaneous.
23

various parameters are also similar in magnitudes. Thus, the e¤ects on u and gof induced adjustments of � and � are quantitatively small.28 This result is notsurprising since, as indicated by Table 4, the values of the � and � ratios appearto be rather insensitive to variations in the �nancial parameters (the parameterchanges in the table are very substantial).
6 Conclusion
Financialization is a short-hand expression for a number of developments overthe last 30 years. The term is convenient but these developments may not havethe coherence and unity suggested by the term and they may not signal thetransition to some new �regime�.This paper is an attempt to show how the macroeconomic e¤ects of some of
the observed changes in �nancial behavior can be analyzed using existing the-oretical frameworks . The models in sections 4-5 di¤er along three dimensions:(i) the role of labor constraints (mature vs dual economies), (ii) accumulationregimes (Harrodian vs stagnationist speci�cations), and (iii) the speci�cation ofhousehold behavior (elastic vs inelastic stock-�ow ratios). All three dimensionsare important when it comes to evaluate the e¤ects of the behavioral changesthat have been associated with �nancialization.Looking �rst at the third dimension, the comparative statics in the elastic
stock-�ow case are reversed compared to the case with inelastic stock-�ow ratios.Phrased in this way, however, the result is not interesting since reversal of theresults formed the basis for the de�nition of elastic stock-�ow ratios. Moreinteresting is the �nding that all our speci�cations fall into the category ofinelastic stock-�ow ratios. We may not be able to conclude from this that allreasonable speci�cations are inelastic. We have shown, however, that a rangeof empirically plausible speci�cations will be stock-�ow inelastic; it is striking,in particular, that models like that of Lavoie-Godley which have been built upfrom �ow-�ow relations also generate stock-�ow ratios that are inelastic.Assuming inelastic stock-�ow ratio, some of the main results for the other two
dimensions are summarized in Table 5. Consider a change in new issue policies.29
A decrease in new issues will be expansionary in the mature Harrodian economyas well in the stagnationist dual economy. Expansionary means di¤erent thingsin the two regimes: the growth rate is exogenously given in the mature economyand expansionary refers to an increase in the rate of employment; in the dualeconomy, on the other hand, the labor supply is in�nitely elastic (and the rateof employment ill-de�ned), and an expansionary e¤ect is one that raises thegrowth rate.
28There is one possible exception: the quantitative e¤ect of the real interest rate on utiliza-tion di¤ers substantially in the two systems. Our numerical exercises, however, show that thedi¤erence tends to decrease if we consider non-marginal, discrete changes in the interest rate.29The e¤ects of changes in retention rates are a little less clear in that - essentially for
Marglin-Bhaduri reasons - the growth e¤ects are ambiguous in the stagnationist dual-economycase.
24

The Harrodian dual economy produces the opposite result: a decrease innew issues reduces the growth rate.30 Intuitively, the growth rate (along thesteady growth path) is constrained by the saving in the Harrodian dual economy,and a decrease in new issues reduces saving and thereby the growth rate. Thisargument is a straightforward generalization of what happens in the textbookversion of Harrod�s model. Once we move to a mature economy, however, thegrowth rate of output and the rate of accumulation will adjust to the naturalrate. A decrease in new issues tends to reduce saving, and an increase in pro�ts isneeded to compensate for this reduction and maintain the rate of accumulationat the natural rate. An increase in pro�tability, in turn, must be o¤set by arise in employment in order to keep the growth rate of output at the naturalrate. Basically, moving from a mature to an dual-economy setting turns anexpansionary change into a contractionary change.Moving from a Harrodian to a stagnationist economy also tends to reverse
the comparative statics. This, again, generalizes results that are well-knownfrom comparisons of the textbook Harrod model with standard stagnationistformulations (e.g. Rowthorn (1981) and Dutt (1984)). The only di¤erence isthat here we have expanded the models to include �nancial factors that areusually left out.These comparisons between mature and dual-economy versions of the Har-
rodian model and between Harrodian and stagnationist versions of the dualeconomy provide some intuition for the similarity between the mature Harro-dian economy and the stagnationist dual economy: these latter economies di¤erin two dimensions and the two reversals of the comparative statics o¤set eachother.Of course, the dependence of the comparative statics on the speci�cation
of the model is not surprising. One contribution of this paper, however, isto clarify the conditions under which the di¤erent results obtain. Moreover,most studies of advanced capitalist economies by heterodox economists seemto be informed by either a Harrodian mature-economy perspective or by thestagnationist dual-economy framework (our own preference lies with the former,but the majority view probably favors the latter). The two perspectives arequite di¤erent, but our results in this paper show that when it comes to anevaluation of the e¤ects of the changes in �nancial behavior over the last 30years, the qualitative conclusions are rather similar. A downward shift of theaccumulation will be contractionary; decreases in retained earnings, a declinein new issues of equity and increased reliance on external �nance, on the otherhand, will tend to be expansionary in both frameworks.Financialization involves broader issues that go beyond the questions dis-
cussed in this paper. One set of issues concerns international capital �ows andthe constraints implied by these �ows on the policy options of nation states.Leaving aside the international dimension, issues of power provide an anotherexample. It is often claimed that �nancialization is associated with the increased30The Harrodian dual economy could be split into two cases, depending on the sensitivity
of the growth function with respect to changes in the pro�t share. We focus on the high-sensitivity case, cf. section 4.1.2.
25

power of �nancial institutions. Auerbach (1988), however, presents the case foran alternative view:
The present relationships between banks and �rms, far from sig-nalling the growing dominance of �nancial institutions represent aprecisely contrary development. They result from the e¤orts of �-nancial institutions to accommodate themselves to a far more inse-cure environment, one made insecure by the activities of �nancialinstitutions in competition with each other and by the ever morestringent demands made upon them by their clients, especially theirbusiness customers. (p.)
Disregarding power issues, an increase in competition and insecurity may haveimplications for �nancial stability as well as for the time horizons used by both�rms and �nancial institutions. A relatively recent but now largely forgottenliterature questioned the relative merits of competitive, market-based Anglo-Saxon �nancial systems compared to German-Japanese systems. The latter,it was argued, might help to alleviate a short-termist bias (e.g. Cosh et al1990). More generally, a competitive �nancial system would not necessarily -even if it were fully �e¢ cient�- produce good macroeconomic results if the in-vestment in physical and/ or human capital gives rise to signi�cant externalities(as suggested by traditional development theory, post Keynesians like Kaldor,and recent endogenous growth theory). In the case of positive externalities,�arti�cially low�interest rates may be desirable (Auerbach and Skott 1992).31
One may note, �nally, that concerns over the excesses and questionablebene�ts of the �nancial system have been voiced before and that even the extentof resources that are put into the �nancial system may cause concern. Thus,Tobin (1984; reprinted 1987) confessed
to an uneasy Physiocratic suspicion, perhaps unbecoming in an aca-demic, that we are throwing more and more of our resources, includ-ing the cream of our youth, into �nancial activities remote from theproduction of goods and services, into activities that generate highprivate rewards disproportionate to their social productivity. (1987,p. 294)
Tobin�s conclusion was motivated in part by the fact that 16 out of an elitegroup of 46 executives whose earnings exceeded one million dollars in 1983 wereo¢ cers of �nancial companies. He also noted that graduates from the Schoolof Organization and Management at Yale who took jobs in �nance had startingsalaries four times the poverty threshold for four-person families, and observed
31The relatively strong German and Japanese economic performance during the Golden Agecould be explained, of course, by other factors, unrelated to the �nancial systems. Likewise,the relatively poor performance by the two economies in the more recent years may not re�ecta need for reforms of the �nancial and/or labor market systems, as claimed by OECD andother international organisations. See Nakatani and Skott (2006) for discussion of the Japanesecase.
26

that the average holding period for shares was only 19 months and that theDepartment of Finance categories of Finance and Insurance generate 4.5-5 percent of GNP (1987, p. 282). These numbers seem almost quaint by today�sstandards,32 and developments over the last 20 years can only reinforce onesPhysiocratic suspicions.
7 Appendix: The Numerical Results in Tables1, 2 and 3
In 4.1.2, 4.2.2, and 5.2 we used numerical methods to examine the comparativestatics of two models: one with constant stock-�ow ratios, � and �, and theother with Lavoie-Godley speci�cations on consumption and portfolio choiceand induced variations in the stock-�ows ratios. The analysis was conducted inthe context of Harrodian mature economies (4.1.2), Harrodian dual economies(4.2.2), and Stagnationist dual economies (5.2) and the results summarized inTables 1,2 and 3. In this appendix, we present the procedure that was used to�nd the values of the derivatives of the endogenous variables with respect to�nancial and other parameters. We do this in the context of Stagnationist dualeconomies (see Table 3 in 5.2) where the model with variable stock-�ow ratiosis the same as the one in Lavoie and Godley (2001-2002). The procedure in theother cases is similar and, in fact, less complicated.
The stagnationist dual economies with the variable � and � � Lavoieand Godley (2001-2002)
g = sf (�u� rm) +mg + xg (36)
g = 0 + 1sf ( �u� rm)� 2rm+ 3q + 4u (37)
u� g = a1fu� sf (�u� rm)g+a1a2 (38)
m = (1� �0 + �1r � �2re)q + �3fu� sf (�u� rm)g (39)
where re = (1�sf )(�u�rm)+ q�m and = g(q �m)� xg.
The symbols used here are the same as the ones in the main text of this paper.The in�ation rate is assumed to be zero. (36) describes �rms��nance constraint,
32 In 2005, among CEO�s in the top 189 e¢ cient �rms classi�ed by Forbes, 164 earned morethan $2 million (or approximately $1 million in 1983 dollars) and 46 of them belonged to �-nancial companies (diversi�ed �nancials, banking, and insurance). The average compensationof those 46 CEO�s in �nancial companies was $9.6 million or about 170 times the median U.S.family income in 2004 (see The State of Working America 2006/2007 published by EconomicPolicy Institute). In 2004, the average holding period for shares had dropped to 12.1 months(NYSE Historical Statistics, http://www.nysedata.com). Finance and Insurance, as catego-rized by the Department of Commerce, accounted for 5.5% of employee compensation, about5% of the employed labor force, 7.5% of after-tax corporate pro�ts, and about 3% of personalconsumption in 1983; in 2005 those corresponding �gures were 7.6%, 4.3%, 11.1% and 5.9%in 2005, respectively (calculated from U.S. Department of Commerce, Bureau of EconomicAnalysis, National Income and Product Account ).
27

(37) is the investment function, (38) describes the equilibrium condition for theproduct market where the right-hand side speci�es households consumptionbehavior as a function of household distributed income and capital gains. (39)shows households�demand for money (portfolio choice). The following valuesare used by Lavoie and Godley (2001-2002).
0 = 0:0075 1 = 0:5 2 = 0:5 3 = 0:02 4 = 0:125
sf = 0:75 x = 0:05 � = 0:2498
a1 = 0:8 a2 = 4:5
�0 = 0:45 �1 = 0:2 �2 = 0:0133 �3 = 0:0001 r = 0:0275
Given these parameter, (36)-(39) determines the steady-state values of u,g, q and m. The system has multiple solutions due to nonlinearities of someequations. The number of solutions is six but �ve of them can be discarded oneconomic grounds since at least one of the variables � including re � is negative.The positive numerical solution is:
u� = 0:188 g� = 0:0545 q� = 0:8789 m� = 0:487 (40)
The partial derivatives of the solutions for u and g with respect to sf , x, r,�, and �0 are evaluated at (u�, g�, q�, m�). The obtained values were reportedin the third and �fth columns of Table 3.Using the de�nitions of � and �, we obtain the following equilibrium values
for � and �:
�� =q� �m�
u�= 2:07936 �� =
m�
u�= 2:58914
Using these steady-state values of stock-�ow ratios, we can transform thevariable � and � regime to the constant � and � regime by dropping the con-sumption and portfolio choice functions.
Constant � and � regime
g = sf (�u� rm) +mg + xgg = 0 + 1sf ( �u� rm)� 2rm+ 3q + 4uq = (�� + ��)u
m = ��u
By construction, the above four equations must yield the same steady statevalues as in (40). Then, the partial derivatives of the solutions for u and g withrespect to sf , x, r, �, and �0, again, are evaluated at (u�, g�, q�, m�). Thesecond and forth columns of Table 3 report these values.
28

References
[1] Aglietta, M. and Breton, R. (2001) �Financial Systems, Corporate Controland Capital Accumulation.�Economy and Society, 30 (4), pp. 433-466.
[2] Auerbach, P. (1988) Competition. Oxford: Blackwell.
[3] Auerbach, P. and Skott, P. (1988) �Concentration, competition and distri-bution." International Review of Applied Economics, 2, pp. 42-61.
[4] Auerbach, P. and Skott, P. (1992) �Financial Innovation and Planning ina Capitalist Economy." Metroeconomica, Vol. 43 (1-2), pp. 75-102.
[5] Blecker, R. (1999) Taming global �nance. Washington, DC: Economic Pol-icy Institute.
[6] Boyer, R. (2000) �Is a Finance-led Growth Regime a Viable Alternativeto Fordism? A Preliminary Analysis.�Economy and Society, 29 (1), pp.111-145.
[7] Cosh, A., Hughes, A, and Singh, A. (1990) �Analytical and Policy Issuesin the UK economy." In Takeovers and Short-termism in the UK. London:Institute for Public Policy Research.
[8] Crotty, J. (2005) �The Neoliberal Paradox: The Impact of DestructiveProduct Market Competition and �Modern�Financial Markets on Non�-nancial Corporation Performance in the Neoliberal Era.�In G.A. Epstein(ed.) Financialization and the World Economy. Northampton, MA: Elgar.
[9] Delli Gati, F. and Gallegati, M. (1990) �Financial Instability, Income Dis-tribution and the Stock Market." Journal of Post Keynesian Economics,pp. 356-374.
[10] Duménil, G. and Lévy, D. (2001) �Costs and Bene�ts of Neoliberalism:A Class Analysis.�Review of International Political Economy, 8 (4), pp.578-607.
[11] Dutt, A.K. (1984)�Stagnation, income distribution and monopoly power."Cambridge Journal of Economics, 8 (1), pp. 25-40.
[12] Dutt, A.K. (1997) �Equilibrium, path dependence and hysteresis in post-Keynesian models.�In P. Arestis, G. Palma and M. Sawyer (eds) Capi-tal Controversy, Post-Keynesian Economics and the History of EconomicThought: Essays in Honour of Geo¤ Harcourt. London: Routledge.
[13] Dutt, A.K. (2005)�Consumption, debt and growth.�In M. Setter�eld (ed.)Interactions in Analytical Political Economy. M.E. Sharpe.
[14] Eatwell, J. and Taylor, L. (2000) Global �nance at risk. New York: TheNew Press.
29

[15] Eichner, A. (1976) The Megacorp and Oligopoly. Cambridge: CambridgeUniversity Press.
[16] Epstein, G. A. (2005) �Introduction.�In G.A. Epstein (ed.) Financializationand the World Economy. Northampton, MA: Elgar.
[17] Flaschel, P. and Skott, P. (2006) �Steindlian models of growth and stagna-tion." Metroeconomica, 57 (3), pp. 303-338.
[18] Froud, J., Haslam, C., Johal, S. and Williams, K. (2000) �Shareholdervalue and �nancialization: Consultancy promises, management moves."Economy and Society, 29 (1), pp. 80-110.
[19] Kaldor, N. (1966) Causes of the slow rate of economic growth in the UnitedKingdom. Cambridge: Cambridge University Press.
[20] Kurz, H. (1986) �Normal positions and capital utilization.�Political Econ-omy, 2 (1), pp. 37-54.
[21] Lavoie, M. (1986/87) �Systemic Fragility: A Simpli�ed View." Journal ofPost Keynesian Economics, 9(2), pp. 258-266.
[22] Lavoie, M. (1995) �The Kaleckian model of growth and distribution andits neo-Ricardian and neo-Marxian critiques.�Cambridge Journal of Eco-nomics, 19, pp. 789-818.
[23] Lavoie, M. and Godley, W. (2001-2002) �Kaleckian models of growth ina coherent stock-�ow monetary framework: a Kaldorian view." Journal ofPost Keynesian Economics, 24 (2), pp. 277-311.
[24] Lazonick, W. and O�Sullivan, M. (2000) �Maximising shareholder value: anew ideology for corporate governance." Economy and Society, 29 (1), pp.13-35.
[25] Levy, D., Bergen, M., Dutta, S. and Venable, R. (1997) �The magnitude ofmenu costs: direct evidence from large U.S. supermarket chains.�QuarterlyJournal of Economics, 112, pp. 791-825.
[26] Marglin, S. and Bhaduri, A. (1990) �Pro�t Squeeze and Keynesian The-ory." In: S. Marglin and J. Schor (eds). The Golden Age of Capitalism -Reinterpreting the Postwar Experience. Oxford: Clarendon.
[27] Nakatani, T. and Skott, P. (2006) �Japanese growth and stagnation." Work-ing Paper 2006-04, Department of Economics, University of Massachusettsat Amherst. Forthcoming in Structural Change and Economic Dynamics.
[28] Romer, D. (2001) Advanced Macroeconomics. McGrawHill.
[29] Rowthorn, B. (1981) �Demand, real wages and economic growth." ThamesPapers in Political Economy.
30

[30] Semmler, W. (1987) �A Macroeconomic Limit Cycle with Financial Per-turbations." Journal of Economic Behavior and Organization
[31] Skott, P. (1981) �On the �Kaldorian Saving Function�." Kyklos, 34, pp.563-81.
[32] Skott, P. (1988) �Finance, Accumulation and the Choice of Technique."Cambridge Journal of Economics, 12, pp. 339-354.
[33] Skott, P. (1989) Con�ict and E¤ective Demand in Economic Growth. Cam-bridge: Cambridge University Press.
[34] Skott, P. (1989a) �E¤ective demand, class struggle and cyclical growth."International Economic Review, 30, pp. 231-247.
[35] Skott, P. (1994) �On the Modelling of Systemic Financial Fragility." InA.K. Dutt (ed) New Directions in Analytical Political Economy, EdwardElgar, 1994, pp. 49-76.
[36] Skott, P. (1997) �Stag�ationary Consequences of �Prudent�Monetary Pol-icy in a Unionized Economy." Oxford Economic Papers, 49, pp. 609-622.
[37] Skott, P. (1999) �Wage Formation and the (non-) existence of the NAIRU".Economic Issues, March, pp. 77-92.
[38] Skott, P. (2005) �Fairness as a Source of Hysteresis in Employment andRelative Wages�. Journal of Economic Behavior and Organization, Vol 57,2005, pp. 305-331.
[39] Stockhammer, E. (2004) �Financialisation and the Slowdown of Accumu-lation.�Cambridge Journal of Economics, 28, pp. 719-741.
[40] Stockhammer, E. (2006) �Shareholder value orientation and theinvestment-pro�t puzzle." Journal of Post Keynesian Economics, Winter2005-6, Vol 28 (2),pp. 193-215.
[41] Taylor, L. (2004) Reconstructuring Macroeconomics. Cambridge: HarvardUniversity Press
[42] Taylor, L. and O�Connell, S.A (1985) �A Minsky Crisis." Quarterly Journalof Economics, 100 (5), pp. 871-85
[43] Tobin, J. (1984) �On the E¢ ciency of the Financial System." Lloyds BankReview, No. 153, July 1984, pp. 1-15. Reprinted in P.M. Jackson (ed.)(1987) Polices for Prosperity: Essays in a Keynesian Mode. WheatsheafBooks.
[44] Wood, A. (1975) A Theory of Pro�t. Cambridge: Cambridge UniversityPress.
31

Graphs and Tables
0.66
0.68
0.70
0.72
0.74
0.76
0.78
0.80
0.82
0.84
0.86
0.88
1952-59 1960-69 1970-79 1980-89 1990-99 2000-05
Figure 1: The Retention Rate (1952-2005)Notes: The retention rate adjusted for inflation = 1−{ Net Dividends ÷ (U.S.Internal Funds + Net Dividends + Inflation rate × Net Liabilities)}. The infla-tion rates are based on the CPI and Net Liabilities refer to nonfarm nonfinancialcorporate net liabilities. U.S internal funds = Profit (before taxes and after netinterest payments) − Taxes on corporate income − Net dividends + Consump-tion of fixed capital + capital consumption adjustment.Sources: Federal Reserve Board, Flow of Funds Accounts of the United States,Table F.102 and Table B.102; Bureau of Labor Statistics, The Consumer PriceIndex
1

-0.030
-0.025
-0.020
-0.015
-0.010
-0.005
0.000
0.005
0.010
0.015
1952-59 1960-69 1970-79 1980-89 1990-99 2000-05
Figure 2: The Rate of Net Issues of Equities (1952-2005)Notes: Net issues of nonfinancial corporate equities divided by the market valueof nonfinancial corporate equities outstandingSources: Calculated from Federal Reserve Board, Flow of Funds Accounts ofthe United States, Table F.213 and Table B.102
2

-0.20
-0.15
-0.10
-0.05
0.00
0.05
0.10
1952-59 1960-69 1970-79 1980-89 1990-99 2000-06
Figure 3: The Ratio of Net Issues of Equities to Fixed Investment(1952-2005)Notes: Net issues of nonfinancial corporate equities divided by nonfarm nonfi-nancial corporate (gross) fixed investment Quarterly data.Sources: Calculated from Federal Reserve Board, Flow of Funds Accounts ofthe United States, Table F.213 and Table F.102
3

0.00
0.10
0.20
0.30
0.40
0.50
0.60
0.70
1952 1957 1962 1967 1972 1977 1982 1987 1992 1997 2002
Ratio of External Debt to Capital Ratio of Corporate Bonds to Capital
Figure 4: The Ratio of Gross Debt to Capital: Nonfarm NonfinancialCorporations (1952-2005)Notes: Gross debt = commercial paper + municipal securities + corporatebonds + bank loans + other loans and advances + mortgages. Capital = re-placement cost of structures + replacement cost of equipment and software.Sources: Calculated from Federal Reserve Board, Flow of Funds Accounts ofthe United States, Table B.102
4
-6.00
-4.00
-2.00
0.00
2.00
4.00
6.00
8.00
10.00
1952 1958 1964 1970 1976 1982 1988 1994 2000 2006
3-Month Treasury Bill Rate 10-year Constant Maturity Treasury
Corporate Bond Rate
Figure 5: Real Rates of Interest (1952-2006)Notes: Nominal rates minus inflation rates using the CPISources: Calculated from Federal Reserve Board, Federal Reserve StatisticalRelease; Bureau of Labor Statistics, The Consumer Price Index
5
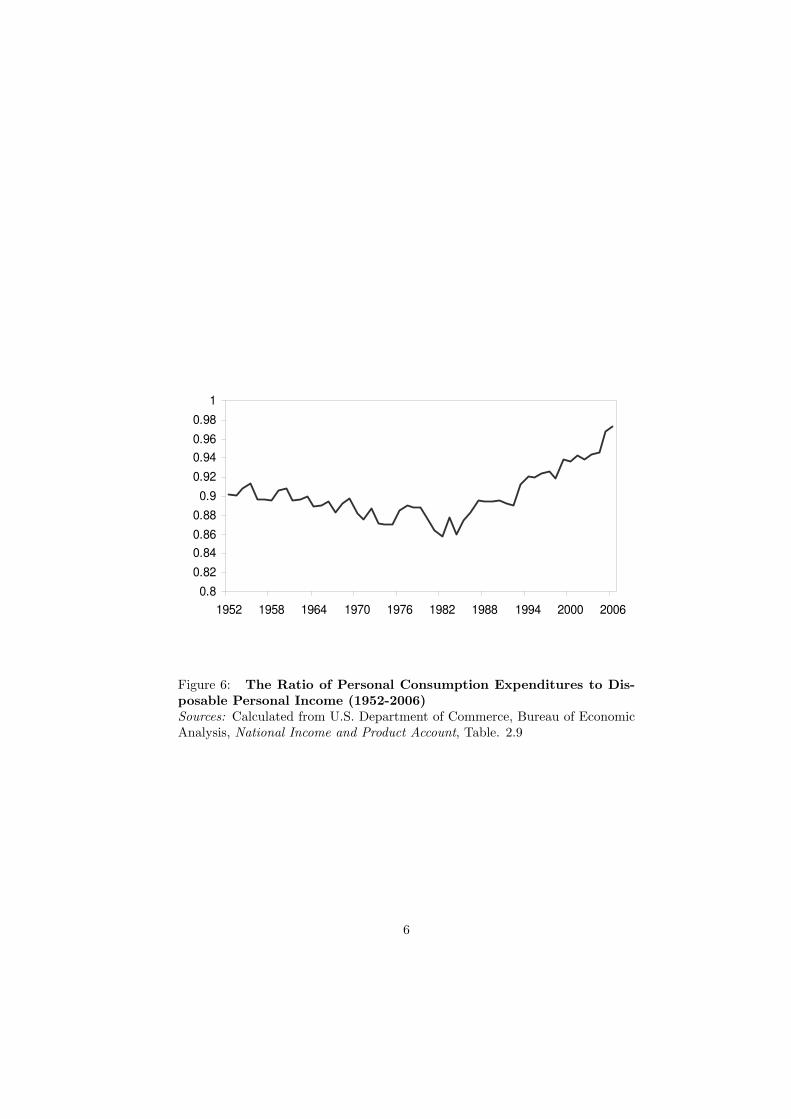
0.8
0.82
0.84
0.86
0.88
0.9
0.92
0.94
0.96
0.98
1
1952 1958 1964 1970 1976 1982 1988 1994 2000 2006
Figure 6: The Ratio of Personal Consumption Expenditures to Dis-posable Personal Income (1952-2006)Sources: Calculated from U.S. Department of Commerce, Bureau of EconomicAnalysis, National Income and Product Account, Table. 2.9
6

0
1
2
3
4
5
6
7
1952 1958 1964 1970 1976 1982 1988 1994 2000 2006
Ratio of Net worth to Disposable Personal Income
Ratio of Net Finanical Worth to Dispoable Personal Income
Figure 7: The Ratio of Households’ Net Financial Worth to DisposablePersonal Income (1952-2006)Notes: Net Financial Worth = Households’ Net Worth − Households’ Tangi-ble Assets. In other words, the gap between two graphs shown in the figurerepresents households’ tangible assets divided by disposable person incomeSources: Federal Reserve Board, Flow of Funds Accounts of the United States,Table B.100
7

-0.100
-0.050
0.000
0.050
0.100
0.150
0.200
1952-59 1960-69 1970-79 1980-89 1990-99 2000-05
Capital Gains on Corporate Equities Capital Gains on Financial Assets
Figure 8: The Ratio of Capital Gains on Financial Assets to DisposablePersonal Income: Households and Nonprofit Organizations (1952-2005)Notes: Capital Gains on Corporate Equities = (Holding gains on corporate eq-uities − inflation rate using the CPI × corporate equities outstanding held byhouseholds and nonprofit organizations)/ disposable personal income. CapitalGains on Financial Assets =(Holding gains on all financial assets − inflationrate using the CPI × all financial assets held by households and nonprofit or-ganizations)/ disposable personal income.Sources: Calculated from Federal Reserve Board, Flow of Funds Accounts of theUnited States, Table B.100 and Table R.100; Bureau of Labor Statistics, TheConsumer Price Index
8

Table 1: Effects of changes in parameters on the profit share in aHarrodian mature economy
Constant α and βregime
Variable α and βregime
The retention ratio -0.238 -0.238
Equity issues -0.386 -0.228
Real interest rate 2.589 2.575
Utilization -1.948 -1.634
Propensity to hold equity - 0.0717
Notes: Calculated based on parameter values in Lavoie and Godley (2001-2002)
Table 2: Effects of changes in parameters on the accumulation rate ina Harrodian dual economy
Constant α and βregime
Variable α and βregime
The retention ratio 0.073 0.037
Equity issues 0.118 0.021
Real interest rate -0.790 -0.396
Utilization 0.595 0.348
Profit share 0.305 0.154
Propensity to hold equity - -0.011
Notes: Calculated based on parameter values in Lavoie and Godley (2001-2002)
Table 3: Effects of changes in parameters on the rates of utilizationand accumulation in a stagnationist dual economy
Utilization Accumulation
RegimesConstantα and βregime
Variableα and βregime
Constantα and βregime
Variableα and βregime
The retention ratio -0.162 -0.186 -0.024 -0.028
Equity issues -0.342 -0.352 -0.085 -0.087
Real interest rate 1.055 0.197 -0.163 -0.327
Profit share -0.680 -0.780 -0.099 -0.118
Propensity to hold equity - 0.296 - 0.092
Notes: Calculated based on parameter values in Lavoie and Godley (2001-2002)
9

Table 4: Effects of Changes in Financial Variables on Stock-Flow Ra-tios
sf x r
0.55 0.75 0.95 -0.05 0.05 0.15 0.01 0.0275 0.05
α 1.951 2.079 2.179 2.040 2.079 2.075 1.814 2.079 2.660
β 2.426 2.589 2.717 2.537 2.589 2.587 2.226 2.589 3.377
Notes: 0.75(sf ), 0.05(x), 0.0275(r), and the values for the parameters other than sf ,x, and r are the same as those used in Lavoie and Godley (2001-2002).
Table 5: The Effects of a Decrease in the Retention Ratio or the Rateof Net Issues of Equities in Different Regimes
Mature Economies Dual Economies
HarrodianProfit share: IncreaseEmployment: Increase
Growth: Decrease
StagnationistUtilization: Increase
Growth: Ambiguous when sf ↓Growth: Increase when N ↓
10