Embed Size (px)
Citation preview

Kansas Annual Summary of
Vital Statistics, 2017
Kansas Department of Health and Environment Division of Public Health
Bureau of Epidemiology and Public Health Informatics Curtis State Office Building – 1000 SW Jackson, Topeka, KS, 66612-1354
http://www.kdheks.gov/bephi/ November 2018
Department of Healthand Environment

This Report Was Prepared by:
Jeff Andersen, Secretary
Division of Public Health Bureau of Epidemiology and Public Health Informatics
Elizabeth W. Saadi, Ph.D., State Registrar and Director Farah Ahmed, MPH, PhD, State Epidemiologist
Authors: David Oakley, MA Greg Crawford, BA Cathryn Savage, PhD
Layout and desktop publishing by: Jeanne Jones, BA
Data for this report were collected by:
Office of Vital Statistics Kay Haug, Director
“Remember to see the faces in the numbers.” ---Anonymous
Our Vision – Healthy Kansans living in safe and sustainable environments Our Mission – To protect and improve the health and environment of all Kansans

ANNUAL SUMMARY OF VITAL
STATISTICS KANSAS, 2017
Jeff Colyer, M.D., Governor
Jeff Andersen, Secretary Department of Health and Environment
Prepared by the: Division of Public Health
Bureau of Epidemiology and Public Health Informatics November 2018

This page intentionally left blank.

LIST OF TABLES AND FIGURES A. VITAL EVENTS
Table A1 Selected Vital Events and Percent Change, Kansas, 2017, 2016, and 1998
Figure A1 Every Day During 2017
Figure A2 Kansas Vital Statistics for 2017
Table A2 Selected Vital Event Percents, Rates and Ratios, Kansas, 1998-2017
Figure A3 Selected Vital Event Rates, Kansas, 1998-2017
Table A3 Selected Vital Events by Population Group, Kansas, 2017
B. POPULATION
Table B1 Population by Year and Sex, Kansas Residents 1968 - 2017
Figure B1 Total Population, Kansas 1998-2017 (in Thousands)
Figure B2 Rate of Natural Increase, Kansas, 1998-2017
Figure B3 Median Age, Kansas, 1998-2017
Figure B4 Population Density, Kansas and the U.S., 1997-2017
Table B2 Population by Nine Selected Age-Groups and Sex, Kansas, 1997-2017 (in Thousands)
Table B3 Population by 11 Selected Age-Groups, by Population Group and Sex, Kansas 2017
Figure B5 Percent Change in Age-Group Population, Both Sexes, Kansas, 1998-2017
Table B4 Population by County and Peer Group, Kansas, 2013-2017
Figure B6 Population Density, by County of Residence, Kansas, 2017
Table B5 Population by County of Residence and Peer Group, by Population Group, Kansas 2017
Table B6 City Population, Kansas, 2013-2017
C. LIVE BIRTHS AND FERTILITY
Table C1 Birth Rates, Kansas and the U.S. 1912-2017
Figure C1 Birth Rates, Kansas and the U.S., 1912-2017
Figure C2 Fertility Rates, Kansas and the U.S., 1998-2017
Figure C3 Age-Specific Fertility Rates by Year by Age-Group of Mother, Kansas, 2013-2017
Table C2 Age-Specific Fertility Rates by Age-Group of Mother, Kansas, 1998-2017
Table C3 Live Births by Age-Group of Mother by Sex of Infant, Kansas, 2017
Table C4 Live Births by Age-Group of Father by Age-Group of Mother, Kansas, 2017
Table C5 Live Births by Age-Group of Mother by Birth Weight in Grams, Kansas, 2017
Figure C4 Live Births by Birth Order, Kansas, 2017
Table C6 Live Births by Birth Order by Age-Group of Mother, Kansas, 2017
Table C7 Live Births by Population Group of Mother, by Trimester Prenatal Care Began, Kansas, 2017
Table C8 Live Births by Population Group of Mother by Birth Weight in Grams, Kansas, 2017

Table C9 Live Births by Population Group of Mother by Final Route of Delivery, Kansas, 2017
Table C10 Live Births by County of Residence and Peer Group by Number and Rate, Kansas, 2013-2017
Figure C5 Birth Rates by County of Residence, Kansas, 2017
Table C11 Live Births by County of Residence and Peer Group by Age-Group of Mother, Kansas, 2017
Table C12 Live Births by County of Residence and Peer Group by Weeks Gestation, Kansas, 2017
Table C13 Live Births by County of Residence and Peer Group by Month Prenatal Care Began, Kansas, 2017
Table C14 Live Births by County of Residence and Peer Group by Adequacy of Prenatal Care Utilization (APNCU) Index, Kansas, 2017
Table C15 Live Births by County of Residence and Peer Group by Birth Weight in Grams, Kansas, 2017
Table C16 Live Births by County of Residence and Peer Group by Initiation of Breastfeeding, Kansas, 2017
Table C17 Live Births by County of Residence and Peer Group by Mother’s Reported Cigarette Use, Kansas, 2017
Figure C6 Percent of Maternal Cigarette Use During Pregnancy by County of Residence, Kansas, 2017
Table C18 Live Births by County of Residence and Peer Group by Birth Weight Category for Gestational Age, Kansas, 2017
Table C19 Mother’s Weight Gain in Pregnancy for Singleton Births, by County of Residence and Peer Group, Kansas, 2017
Table C20 Live Births by County of Residence and Peer Group by Population Group of Mother, Kansas, 2017
Table C21 Live Births by Selected City of Residence, by Number and Rate, Kansas, 2013-2017
Figure C7 Percent of Births to Unmarried Mothers, Kansas and the U.S.,1919-2017
Table C22 Births to Unmarried Mothers by County of Residence and Peer Group by Age-Group and Population Group of Mother, Kansas, 2017
Table C23 Teenage Pregnancy Numbers and Rates by Year, by Selected Age-Groups, Kansas, 1998-2017
Figure C8 Teenage Pregnancy Rates by Age-Group, Kansas,1998-2017
Figure C9 Teen and Non-teen Live Births: Percent Distribution by Month Prenatal Care Began, Kansas, 2017
Figure C10 Teenage Live Births by Population Group, Kansas, 2017
Table C24 Teenage Pregnancy Numbers and Rates by Year for Selected Population Group and Age-Groups, Kansas, 2013-2017
Table C25 Teenage Pregnancies by County of Residence and Peer Group, by Age-Group and Component, Kansas, 2017
Table C26 Teenage Pregnancies for 10-17 Year Olds by County of Residence and Peer Group by Component, Kansas, 2017

D. FETAL AND INFANT MORTALITY
Table D1 Number of Stillbirths by Cause of Death and Weeks Gestation, Kansas, 2017
Figure D1 Number of Stillbirths by Selected Characteristics, Kansas, 2017
Table D2 Stillbirths by County of Residence and Peer Group by Age-Group of Mother, Kansas, 2017
Table D3 Total Reported Abortions and Ratios of Abortions to Live Births, Kansas, 1971-2017
Figure D2 Ratios of Abortions to Live Births by Year, Kansas 1972-2017
Figure D3 Ratios of Abortions to Live Births by Age-Group of Patient, Kansas, 1997 and 2017
Table D4 Total Reported Abortions by Selected Characteristics by Age-Group of Patient, Kansas, 2017
Table D5 Kansas Resident Abortions by Selected Characteristics by Age-Group of Patient, Kansas 2017
Figure D4 Reported Abortions by Selected Characteristics, Kansas, 2017
Table D6 Total Reported Abortions by Population Group by Marital Status, Kansas, 2017
Table D7 Total Reported Abortions by Population Group by Weeks Gestation, Kansas, 2017
Figure D5 Total Reported Abortions: Percent Distribution by Weeks Gestation, Kansas, 2017
Table D8 Total Reported Abortions by Termination Procedure by Weeks Gestation, Kansas, 2017
Table D9 Abortions by County of Residence and Peer Group by Age-Group of Patient, Kansas, 2017
Table D10 Perinatal Period III Deaths by Component, Kansas, 1998-2017
Table D11 Perinatal Period III Deaths by County of Residence by Component, Kansas, 2017
Table D12 Infant Mortality Rates by Population Group, Kansas, 1998-2017
Figure D6 Infant Mortality Rates by Population Group, Kansas, Five Year Rolling Averages, 1993-2017
Table D13 Infant Deaths by Cause of Death by Age-Group of Infant, Kansas, 2017
Figure D7 Infant Deaths for Three Age Subgroups, Kansas, 1998-2017
Figure D8 Pregnancy Associated Deaths, Kansas, 2013-2017
Table D14 Infant Deaths by County of Residence and Peer Group by Year of Death, Kansas, 2013-2017
Table D15 Infant Deaths by County of Residence and Peer Group by Component Kansas, 2017
E. GENERAL MORTALITY
Table E1 Resident Death by Year and by Population Group, By Number, Crude and Age-Adjusted Rates, Kansas, 2013-2017
Figure E1 Crude Death Rates, Kansas and the U.S., 1912-2017
Table E2 Age-Specific Death Rates by Sex, Kansas, 1998-2017
Figure E2 Age-Adjusted Death Rates, Kansas and the U.S., 1998-2017
Table E3 Age-Adjusted Death Rates by Sex, Kansas and the U.S., 199-2017
Table E4 Deaths by Population Group and Sex, by Age-Group and Average Age at Death, Kansas, 2017

Table E5 Ten Leading Causes of Death by Population Group and sex of Decedent, Kansas, 2017
Table E6 Selected Causes of Death by Age-Group and Average Age at Death, Kansas, 2017
Table E7 Ten Leading Causes of Death, Number, Rate and Average Age at Death by Sex, Kansas, 2017
Table E8 Death Rates, Age-Adjusted Death Rates and 95% Confidence Intervals for Selected Leading Causes of Death, Kansas, 2016-2017
Figure E3 Death Rates for Selected Leading Causes of Death, Kansas, 1998-2017
Figure E4 Leading Causes of Death by Age-Group, Kansas, 2017
Table E9 Pneumonia and Influenza Mortality Number and Age-Adjusted Rates, Kansas Resident, 1999-2017
Figure E5 Pneumonia and Influenza Deaths by Month and by Five-Year Median for Month, Kansas Residents, 2017
Table E10 Heart Disease Deaths by Component and Sex of Decedent, by Age-Group of Decedent, Kansas, 2017
Table E11 Malignant Neoplasm Deaths by Site of Lesion and Sex of Decedent by Age-Group of Decedent, Kansas, 2017
Table E12 Cerebrovascular Disease Deaths by Component and Sex of Decedent by Age-Group of Decedent, Kansas, 2017
Table E13 Unintentional Injury Deaths by Component and Sex of Decedent, by Age-Group of Decedent, Kansas, 2017
Table E14 Selected External Cause of Death by Injury Matrix Groups and Intent, Kansas, 2017
Table E15 Work-related Injury Deaths by Industry of Decedent’s Occupation by Year, Kansas, 2008-2017
Table E16 Selected Chronic Disease Deaths by Component and Sex of Decedent, by Age-Group of Decedent, Kansas, 2017
Table E17 Diabetes mellitus as an Underlying and Contributing Cause of Death Kansas, 2017
Table E18 Deaths by Occupation of Decedent by Selected Causes of Death, Kansas, 2017
Table E19 Deaths by Industry of Decedent’s Occupation by Selected Causes of Death, Kansas, 2017
Table E20 Selected Causes of Death and Years of Potential Life Lost (YPLL) Before Age 75, Kansas, 2017
Figure E6 Percent Years of Potential Life Lost Before Age 75
Table E21 Deaths from 39 Selected Causes by Number and Percent and Sex of Decedent Related to Tobacco, Kansas, 2017
Table E22 Deaths from 39 Selected Causes by Sex by Age-Group of Decedent, Kansas, 2017
Table E23 Deaths by County of Residence and Peer Group, by Number, Crude and Age-Adjusted Rate, Kansas, 2013-2017
Figure E7 Age-Adjusted Death Rates by County of Residence, Kansas, 2017
Table E24 Deaths by County of Residence and Peer Group, by Age-Group and Average Age at Death, Kansas, 2017

Table E25 Deaths by County of Residence and Peer Group, by Population Group, Kansas, 2017
Table E26 Deaths by County of Residence and Peer Group, by Number and Percent Related to Tobacco, Kansas, 2017
Table E27 Selected Causes of Death by County of Residence and Peer Group Kansas, 2017
Table E28 Life-Expectancy at Birth by County of Residence and Peer Group, Kansas, 2013-2017
Table E29 Deaths by Selected City of Residence, by Number and Crude Rate, Kansas, 2013-2017
F. MARRIAGES & MARRIAGE DISSOLUTIONS
Table F1 Marriages and Marriage Dissolutions by Number and Rate, Kansas Occurrence, 1968-2017
Figure F1 Marriage Rates, Kansas and the U.S. 1913-2017
Figure F2 Marriage Dissolution Rates, Kansas and the U.S. 1951-2017
Table F2 Marriages by Population Group of Groom by Population Group of Bride, Kansas, 2017
Table F3 Marriage Dissolutions by Population Group of Husband by Population Group of Wife, Kansas, 2017
Figure F3 Number of Marriages by Month, Kansas, 2017
Table F4 Marriages by Premarital Status of Groom by Premarital Status of Bride, Kansas, 2017
Table F5 Marriages by Age-Group of Groom by Age-Group of Bride, Kansas, 2017
Figure F4 Average Age at Marriage, Kansas, 1998-2017
Table F6 Marriage Dissolutions by Age-Group of Husband by Age-Group of Wife, Kansas, 2017
Figure F5 Average Age at Marriage Dissolution, Kansas, 1998-2017
Table F7 Marriage Dissolutions by Duration of Marriage in Years, Kansas, 2017
Figure F6 Marriage Dissolutions Percent Distribution by Number of Minor Children Kansas, 2017
Table F8 Marriage Dissolutions by Number of Minor Children Reported and Number of Minor Children Affected, Kansas, 2017
Table F9 Marriages by County of Marriage and by Peer Group by Number and Rate, Kansas, 2013-2017
Table F10 Marriage Dissolutions by County of Action and Peer Group, by Number and Rate, Kansas, 2013-2017
Figure F7 Marriage Rates by County of Occurrence, Kansas, 2017
Figure F8 Marriage Dissolution Rates by County of Occurrence, Kansas, 2017

Annual Summary 2017
Introduction The 2017 Kansas Annual Summary of Vital Statistics is a general summary of data compiled from vital event records during calendar year 2017. Content includes statistics from live births, still-births, abortions, deaths, marriages, and marriage dissolutions based on certificates and reports filed with the Office of Vital Statistics in the Bureau of Epidemiology and Public Health Informatics. Tables and figures presented for births, stillbirths, and deaths are residence data unless otherwise indicated. Occurrence data are presented for marriage and marriage dissolution tables and figures. Reported abortions include both residence and occurrence events. This report, available only electronically, provides an overview of the events contributing to the health status of Kansans. Report statistics are essential to governmental agencies, businesses, industries, and citizens for effective health policy decisions and program planning. A PDF version of the Annual Summary is at http://www.kdheks.gov/hci/annsumm.html. The 2017 annual summary continues a series of comparisons of selected Kansas vital statistics to national targets set by the Healthy People 2020 project [1] and by the Winnable Battles targets es-tablished by the Centers for Disease Control and Prevention.[2] Comments concerning the format or content of this report may be directed to the Bureau of Epide-miology and Public Health Informatics (785-296-1531) or e-mail [email protected]. ADA Statement: If you desire a copy of this publication in alternative form because of a disability, contact the Kansas Department of Health and Environment, Division of Public Health, Bureau of Epidemiology and Public Health Informatics, 1000 SW Jackson, Suite 130, Topeka, KS 66612-1354, (785) 296-8627, or 1-800-332-6262 (TDD/TT).
Population In early 2018, the United States Census Bureau (USCB) released its first population estimates for July 1, 2017. Kansas total population was estimated at 2,913,123, an increase of 5,834 (0.2%) from the estimate of Kansas total population for July 1, 2016 (2,907,289) released in 2017. (Table B4). Population Density and Peer Groups The population density of Kansas was 35.6 inhabitants per square mile in 2017, a 10.9 percent in-crease from 32.1 persons per square mile in 1998. For comparison, the population density of the U.S. increased from 72.4 to 92.2 persons per square mile from 1998 to 2017, a 27.3 percent in-crease (Figure B4). In 2017, 36 of the state’s 105 counties had population densities of less than 6.0 persons per square mile. The most sparsely populated county was Greeley, with a density of 1.6 persons per square mile. The most densely populated county was Johnson, with 1,248.8 persons per square mile (Figure B6). Kansas counties are assigned to peer groups based on population density. (See the Technical Notes, Appendix 2 for peer group composition.) During the 2013-2017 period, the population of the 1. Healthy People 2020 [Internet]. Washington: U.S. Department of Health and Human Services; [updated 2018 Aug 31; cited 2018 Aug 30] Available from: http://www.healthypeople.gov/2020/default.aspx. 2. Winnable Battles [Internet]. Atlanta: Centers for Disease Control and Prevention; [updated 2018 May 02; cited 2018 Aug 31] Available from: http://www.cdc.gov/winnablebattles/.

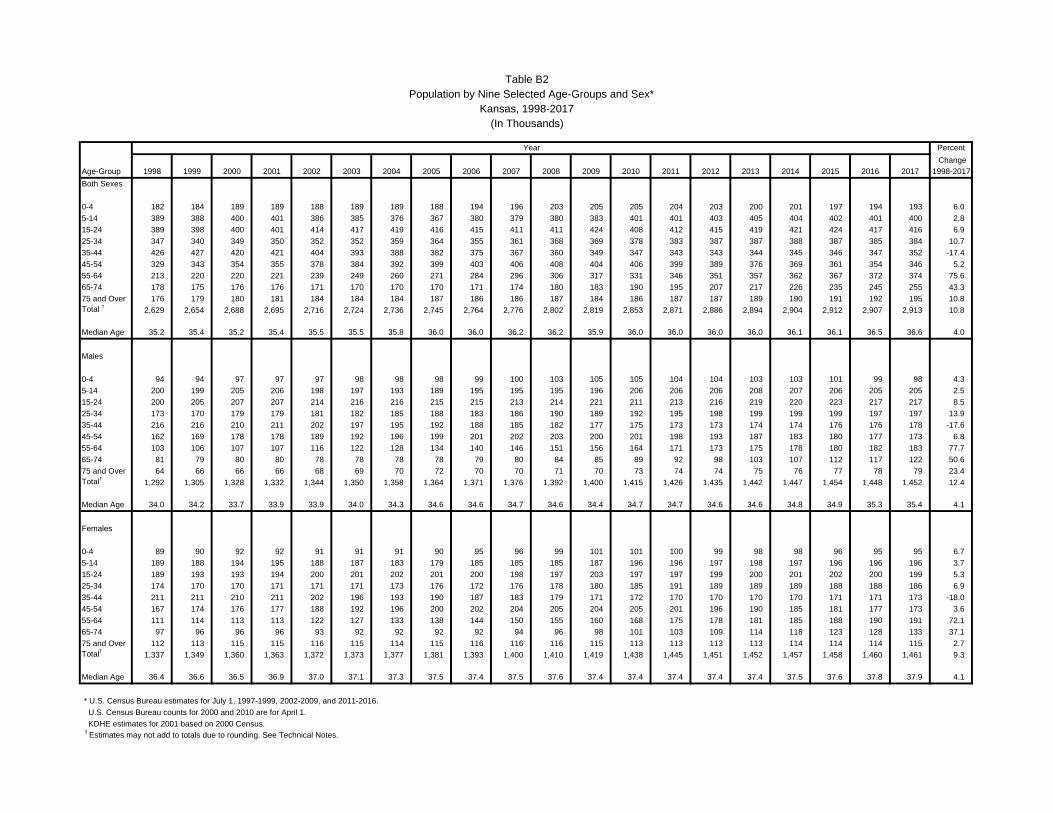
urban peer group increased by 2.9 percent, while the frontier, rural, densely-settled rural, and semi-urban peer groups decreased by 3.7, 2.8, 1.8, and 1.7 percent, respectively (Table B4). Natural Increase In 2017, the rate of natural increase (the birth rate minus the death rate) was 3.3 persons per 1,000 population, a decrease of 19.5 percent from 4.1 per 1,000 population in 2016, and the lowest rate of natural increase in the past twenty years. Over the past 20 years (1998-2017), the rate of natural increase has fluctuated between a maximum of 6.3 persons per 1,000 population (2007) and a minimum of 3.3 persons per 1,000 population (2017) (Figure B2). The population of Kansas increased about 211,000 from the 1990 Census to the 2000 Census, and by about 165,000 from the 2000 Census to the 2010 Census. Natural increase accounted for about 68 percent (144,000) of the increase in population in the 1990s, but it accounted for almost 96 percent (158,000) of the increase in population in the 2000s. Net in-migration accounted for about 32 percent (67,000) of the population increase in the 1990s, but it accounted for only about 4 percent (7,000) in the 2000s. (From 2011 Kansas Annual Summary of Vital Statistics, will be up-dated after the 2020 Census.) Median Age The median age of Kansans in 2017 was 36.6 years, a 4.0 percent increase from the median age of 35.2 in 1998. The median ages of Kansas males and females in 2017 were 35.4 and 37.9 re-spectively (Figure B3, Table B2). Population Characteristics The percent increase in the Kansas total population from 1998-2017 was 10.8 percent, including a 12.4 percent increase for Kansas males and a 9.3 percent increase for Kansas females. Shifts in the Kansas population distribution by age from 1998 to 2017 included a decrease in the 35-44 age group of 17.4 percent. This decrease, and increases of 5.2 percent in residents 45-54 years of age, 75.6 percent in residents 55-64 years of age, and 43.3 percent in residents 65-74 years of age re-flected the aging of the baby boomers.3 Furthermore, there were 6.0, 2.8, 6.9, 10.7, and 10.8 per-cent increases in the 0-4, 5-14, 15-24, 25-34, and 75 and over age-groups respectively (Figure B5, Table B2). According to the 2017 Census Bureau estimates, 75.9 percent of Kansans were White non-Hispanic and 5.8 percent were Black non-Hispanic. Hispanics made up 11.9 percent of Kansas’ population (Tables B3 and B5).
Live Births and Fertility During 2017, there were 36,464 live births to residents of Kansas. This was a decrease of 4.2 per-cent from the 38,048 births reported in 2016. The birth rate decreased 4.6 percent, from 13.1 births per 1,000 population in 2016 to 12.5 births per 1,000 population in 2017 (Table C10). The 2017 birth rate (12.5) is the lowest Kansas birth rate in the period from 1912 to date (the entire period in which KDHE and its predecessors have maintained the Kansas Vital Records System). The only years with comparable birth rates were 2016 (13.1), 2013 and 2015 (13.4), and 2014 (13.5) (Figure C1). Over the past 20 years (1998-2017), the Kansas birth rate has fluctuated between a peak of 15.1 births per 1,000 population (reported in 2007) and a low of 12.5 births per 1,000 population (re-
3. The common definition of 1946-1964 for the baby boom years implies that in 2017, baby boomers were between 53 and 71 years of age.

ported in 2017) (Figure A). Recent low birth rates continue a sustained decline that began in 2008 (Table C1, Figure C1).
Population Group Statistics In 2017, there were 25,431 births to resident White non-Hispanic mothers, a decrease of 5.1 per-cent from the 26,786 births reported in 2016. The birth rate for White non-Hispanic mothers de-creased 5.0 percent, from 12.1 births per 1,000 population in 2016 to 11.5 births per 1,000 popula-tion in 2017 (Table A3, Table C20). There were 5,945 births to Hispanic mothers in 2017, a decrease of 5.6 percent from the 6,300 births reported in 2016. The birth rate for Hispanic mothers decreased 8.1 percent, from 18.6 births per 1,000 population in 2016 to 17.1 births per 1,000 population in 2017. There were 2,463 births to Black non-Hispanic mothers in 2017, a decrease of 1.2 percent from the 2,494 births reported in 2016. The birth rate for Black non-Hispanic mothers decreased 1.4 per-cent, from 14.8 births per 1,000 population in 2016 to 14.6 births per 1,000 population in 2017 (Ta-ble A3, Table C20). Fertility Rates The number of Kansas females in the main child-bearing age bracket (ages 15-44) was 558,606 in 2017, down 2.8 percent from 574,617 in 1999 (the peak in the 1998–2017 period). The Kansas fertility rate in 2017 was 65.3 livebirths per female population in the 15-44 age bracket, 13.5 per-cent below the period high (75.5 in 2007), and the lowest rate for the 1998–2017 period (Table C2, Figure C2). Of the 36,464 resident births in 2017, there were 18,860 males and 17,604 females, for a natal sex ratio of 107.1 male births to 100.0 female births. In most populations, this ratio is in the range of 104-106, although some populations experience ratios as low as 103 or as high as 107, even in the absence of deliberate sex selection [4] (Table C3).
4. United Nations Population Fund [Internet] UNFPA Guidance Note on Prenatal Sex Selection, p. 11; [cited 2017 Aug 16]. Available from: http://www.unfpa.org/sites/default/files/resource-pdf/guidenote_prenatal_sexselection.pdf
02468
101214161820
1998 2001 2004 2007 2010 2013 2016Liv
ebir
ths
per
1,0
00 p
op
ula
tio
n
Year
Figure A. Birth RatesKansas Residents, 1998-2017

Low Birth Weight During 2017, low birth weight (under 2,500 grams) infants accounted for 2,697 or 7.4 percent of births to Kansas resident mothers. Low birth weights were more common for Black non-Hispanic mothers (14.3%) than for White non-Hispanic (6.7%) or Hispanic (6.9%) mothers. High birth weight (4,000 grams and over) infants accounted for 3,175, or 8.7 percent of births to Kansas resident mothers. High birth weights were more common for White non-Hispanic mothers (9.6%) than for Hispanic (7.6%) or Black non-Hispanic (4.8%) mothers (Table C8).
Small for Gestational Age Infants born at birth weights less than the 10th percentile of all other infants at the same gestation-al age (lowest 9.9 percent) are considered small for gestational age (SGA). Table C18 uses birth weights from 2017 births for the state of Kansas as a whole as the reference in establishing the cutoff point. The table enables a county to compare its SGA rate to that of the state. While a num-ber of counties have high SGA rates, they are based on a relatively low number of births.
Mother’s Age Of the 36,464 resident births in 2017, 5.7 percent (2,066) were to mothers under the age of 20; 53.4 percent (19,480) were to mothers 20-29 years of age; 38.8 percent (14,162) were to mothers 30-39 years of age; and 2.1 percent (755) were to mothers aged 40 or over (Table C6).
Of the 25,431 resident births to White non-Hispanic mothers, 1,110 (4.4%) were to mothers under the age of twenty. Of the 2,463 births to Black non-Hispanic mothers, 227 (9.2%) were to mothers under the age of 20. Of the 5,945 births to Hispanic mothers, 586 (9.9%) births were to mothers under the age of 20 (Table A3).
First Trimester Care Prenatal care data was provided for 35,965 out of 36,464 (99.1%) live births in 2017. Prenatal care began in the first trimester for 29,473 live births (81.2 percent of live births where prenatal care da-ta was available), in the second trimester for 5,379 live births (14.8%), and in the third trimester for 1,113 live births (3.1%). No prenatal care was indicated for 342 live births (0.9%).
White non-Hispanic mothers started prenatal care in the first trimester in 85.0 percent of live births (21,532). Black non-Hispanic mothers started prenatal care in the first trimester in 72.1 percent of live births (1,767). Hispanic mothers started prenatal care in the first trimester in 70.5 percent of live births (4,170) (Table C7).
Prenatal Care Status Of the 35,999 Kansas resident live births in 2017 for which the adequacy of prenatal care utilization (APNCU) category could be determined, 83.4 percent received adequate or better prenatal care, including 31.4 percent with adequate-plus care. Seventeen percent (16.7) received less than ade-quate prenatal care, including 10.6 percent with inadequate care (Table C14).
Mother’s Weight Gain Among singleton Kansas live births, 21.2 percent of mothers gained less than the recommended weight during pregnancy, 32.0 percent gained the recommended weight, and 46.9 percent gained more than the recommended amount (Table C19).

Marital Status During 2017, 12,990 (35.6%) of the 36,464 resident live births in Kansas were to unmarried moth-ers. There were 7,481 (29.4%) births to unmarried White non-Hispanic mothers; 1,680 (68.2%) to unmarried Black non-Hispanic mothers; and 3,018 (50.8%) to unmarriedHispanic mothers (Table C22). The percentage of births to unmarried mothers in Kansas decreased from 36.0 percent in 2016 to 35.6 percent in 2017. However, these births were 28.1 percent higher than the 27.8 percent of live births reported in 1998 (Figure C7). Delivery Method Vaginal delivery was the most common final route of delivery for most Kansas resident live births in 2017 (25,539 live births, or 70.0% of all live births for which the final route of delivery was known). Most vaginal deliveries were “spontaneous,” meaning no mechanical procedures like forceps or vacuum extraction were required (24,565 deliveries, or 67.4% of live births for which the final route was stated). Other vaginal deliveries (forceps assisted or vacuum extraction) accounted for 974 live births (2.7%). Cesarean deliveries accounted for 10,922 live births (30.0%). White non-Hispanic mothers delivered via cesarean section in 7,680 live births (30.2%), Black non-Hispanic mothers in 855 live births (34.7%), and Hispanic mothers in 1,632 live births (27.5%). There were three deliveries for which the final route of delivery was not recorded (Table C9). Tobacco Use Tobacco use at any time during pregnancy was reported for 3,680 births in 2017, amounting to 10.1 percent of births for which tobacco usage was reported. Tobacco use was known for 36,3741 of the 36,464 births (99.8%) in 2017. Reported tobacco usage was highest in the three months immediately prior to pregnancy (4,221, or 11.6%) and decreased gradually with each trimester: to 3,632, or 10.0 percent in the first trimester; then to 3,259, or 9.0 percent in the second trimester; and finally to 3,129, or 8.6 percent in the third trimester (Table C17). Teen Pregnancy It is important to look at all reported pregnancies to analyze fertility. The number of pregnancies is the sum of live births, reported stillbirths, and reported induced abortions. The total number of pregnancies for mothers under 20 years of age in 2017 was 2,469, down 1.9 percent from 2,518 pregnancies in 2016. The pregnancy rate for mothers under 20 years of age in 2017 was 12.7 pregnancies per 1,000 female age-group population, a decline of 1.6 percent from a rate of 12.9 pregnancies per 1,000 female age-group population in 2016. This was the lowest pregnancy rate for this age-group in the past twenty years (1998-2017), down from a peak of 32.4 pregnancies per 1,000 female age-group population in 1998 (Table C23, Figure C8). The pregnancy rate for females aged 15-17 years in 2017 was 9.5 per 1,000 female age-group population. This surpasses the Healthy People 2020 target (FP 8.1) of 36.2 pregnancies per 1,000 adolescent females aged 15 to 17 years by 2020. The pregnancy rate for females aged 18-19 years in 2017 was 48.9 per 1,000 female age-group population. This surpasses the Healthy People 2020 target (FP 8.2) of 105.9 pregnancies per 1,000 females ages 18-19 years by 2020. The birth rate for females aged 15-19 years in 2017 was 21.2 per 1,000 female age group popula-tion (Table C25). This surpasses the CDC Winnable Battles target for 2015 of 30.3 births per 1,000 females aged 15 to 19 years.

Fetal and Infant Mortality Stillbirths Reporting standards for stillbirths changed mid-year 2014. During the first half of the year, report-ing was mandatory for stillbirths with delivery weight greater than 350 grams. During the second half of the year, reporting was mandatory for stillbirths at 20 weeks or longer clinical estimate of gestation. Thus, rates for 2015, 2016, and 2017 are not strictly comparable to those of previous years. While some physicians still report stillbirths at less than 20 weeks gestation, those events are no longer included in the Annual Summary of Vital Statistics. Multi-year tables with data for 2015 and 2016 have been amended to remove those events. During 2017, there were 184 stillbirths reported for Kansas resident mothers, a decrease of 27.0 percent from the 252 stillbirths reported in 2016. The stillbirth rate was 5.0 per 1,000 live births and stillbirths, a decrease of 24.2 percent from the rate of 6.6 stillbirths per 1,000 live births and still-births in 2016 (Tables D1, A3). In 2017, the stillbirth rate (per 1,000 live births plus stillbirths) was 5.1 for White non-Hispanics, 7.7 for Black non-Hispanics, and 4.2 for Hispanics (Table A3).
Over the past 20 years (1998-2017), annual stillbirth rates have fluctuated, but Poisson regression (calculated with the Joinpoint program) indicates that the general trend was downward, but not sta-tistically significant, for 1998-2011, and upwards but not statistically significant for 2011-2017. The latter period can be discounted, since it includes the years where the stillbirth definition changed (Figure B). Of all stillbirths in 2017, 89.7 percent (165 out of 184) were attributed to conditions originating in the perinatal period and 9.8 percent (18 out of 184) to congenital anomalies (Table D1).
0
1
2
3
4
5
6
7
8
1998 2001 2004 2007 2010 2013 2016Rat
e pe
r 1,
000
birt
hs a
nd s
tillb
irths
Year
Figure B. Stillbirth RatesKansas Residents, 1998-2017

Abortions In 2017, there were 3,450 abortions performed on Kansas residents, of which 3,371 were per-formed in Kansas, and 79 were performed out-of-state (Table D5). There were also 3,376 abor-tions performed in Kansas for non-residents (Table D4). Abortion Ratios The abortion ratio for Kansas residents in 2017 increased 4.2 percentage points (94.6 per 1,000 live births) from 90.4 in 2016. The abortion ratio declined by 43.6 percent from 1998 to 2017, from a peak ratio of 167.8 abortions per 1,000 live births in 1998 to 94.6 abortions per 1,000 live births in 2017 (Figure C) (Table D3, Figure D2).
The abortion ratio for Kansas residents in 2017 varied substantially by age-group of the mother. The highest ratio (769.2 per 1,000 live births) was recorded for mothers under 15 years of age, while the lowest (59.7 per 1,000 live births) was recorded for mothers in the 30-34 age group (Fig-ure D3). The abortion ratio for White non-Hispanics was 76.8 abortions per 1,000 live births (1,953 resident abortions); for Black non-Hispanics it was 224.1 (552 resident abortions); and for Hispanics it was 109.8 (629 resident abortions) (Table C20, Table D5). Gestation at Termination In 2017, 70.2 percent of Kansas resident abortions occurred prior to nine completed weeks of ges-tational age. About 90.2 percent were performed prior to the 13th week of gestation and 4.1 percent of Kansas resident women obtained an abortion after 16 weeks gestation. (Table D5). Marital Status More than 80 percent (84.5) of all reported abortions in 2017 were to unmarried women. Among Black non-Hispanic women in this group, 91.6 percent were unmarried, while 83.2 percent of White non-Hispanic women and 86.8 percent of Hispanic women were unmarried (Table D6).
0
30
60
90
120
150
180
1998 2001 2004 2007 2010 2013 2016
Nu
mb
er o
f A
bo
rtio
ns
per
1,00
0 L
ive
Bir
ths
Year
Figure C. Abortion RatiosKansas Residents, 1998-2017

Infant Mortality There were 217 infant deaths to Kansas residents in 2017, a decrease of 2.7 percent from 223 in-fant deaths in 2016 (Table D14).
The infant mortality rate for Kansas residents in 2017 was 6.0 infant deaths per 1,000 live births, up 1.7 percent from 5.9 infant deaths per 1,000 live births in 2016. This meets the Healthy People 2020 target for infant deaths, 6.0 infant deaths per 1,000 live births (MICH-1.3).
The rate for White non-Hispanic mothers in 2017 was 4.7 deaths per 1,000 live births, a decrease of 9.6 percent from the rate of 5.2 in 2016. The rate for Black non-Hispanic mothers was 11.8 deaths per 1,000 live births, a decrease of 22.4 percent from the rate of 15.2 in 2016. The rate for Hispanic mothers was 7.2 deaths per 1,000 live births, an increase of 41.2 percent from the rate of 5.1 in 2016. Caution should be used in interpreting these changes due to the relatively small num-ber of occurrences and yearly fluctuations (Tables D12, A3).
Infant death rates for Black non-Hispanic mothers have consistently remained higher than those of White non-Hispanic and Hispanic mothers for the past twenty years (1998-2017). Rates for Hispan-ic mothers have sometimes been higher and sometimes lower than those for White non-Hispanic mothers (Figure D).
Infant Age at Death Infant deaths are most likely to occur within the first month of life. In 2017, 47.0 percent of all infant deaths occurred in the first day of life, 59.0 percent occurred within the first seven days of life (the hebdomadal period), and 71.0 percent occurred within the first 28 days of life (the neonatal period) (Table D13).
The components of perinatal period III mortality (see definition in Technical Notes) both changed from 2016 to 2017; stillbirths decreased by 27.0 percent, hebdomadal deaths increased by 7.0 percent. There were 312 perinatal period III deaths in 2017, for a death rate of 8.5 deaths per 1,000 live births plus stillbirths, a decrease of 1.2 percent from the 1998 rate of 8.6 (Table D10).
0
5
10
15
20
25
1998 2001 2004 2007 2010 2013 2016
Dea
ths
per
1,0
00 L
ive
Bir
ths
Year
Figure D. Infant Death Rates for Selected Population Groups, Kansas Residents, 1998-2017
White NH
Black NH
Hispanic
Of all infant deaths in 2017, 49.3 percent were attributed to conditions originating in the perinatal period, 24.4 percent to congenital anomalies, 6.0 percent to sudden infant death syndrome (SIDS), and 20.3 percent to all other causes (Table D13). Maternal Mortality In the 2008 report, Kansas adopted the definition of “maternal death” used by the National Center for Health Statistics (NCHS), and introduced a new category called “other pregnancy associated deaths.” Please see the Technical Notes for full definitions. The new categories were applied ret-roactively to 2005; before 2005 the Kansas death certificate lacked an important field needed to identify pregnancy associated deaths. In 2017, there were eight maternal deaths and nine other pregnancy associated deaths, an overall decrease from 2016, when there were eight maternal deaths and twelve other pregnancy associated deaths (Figure D8).
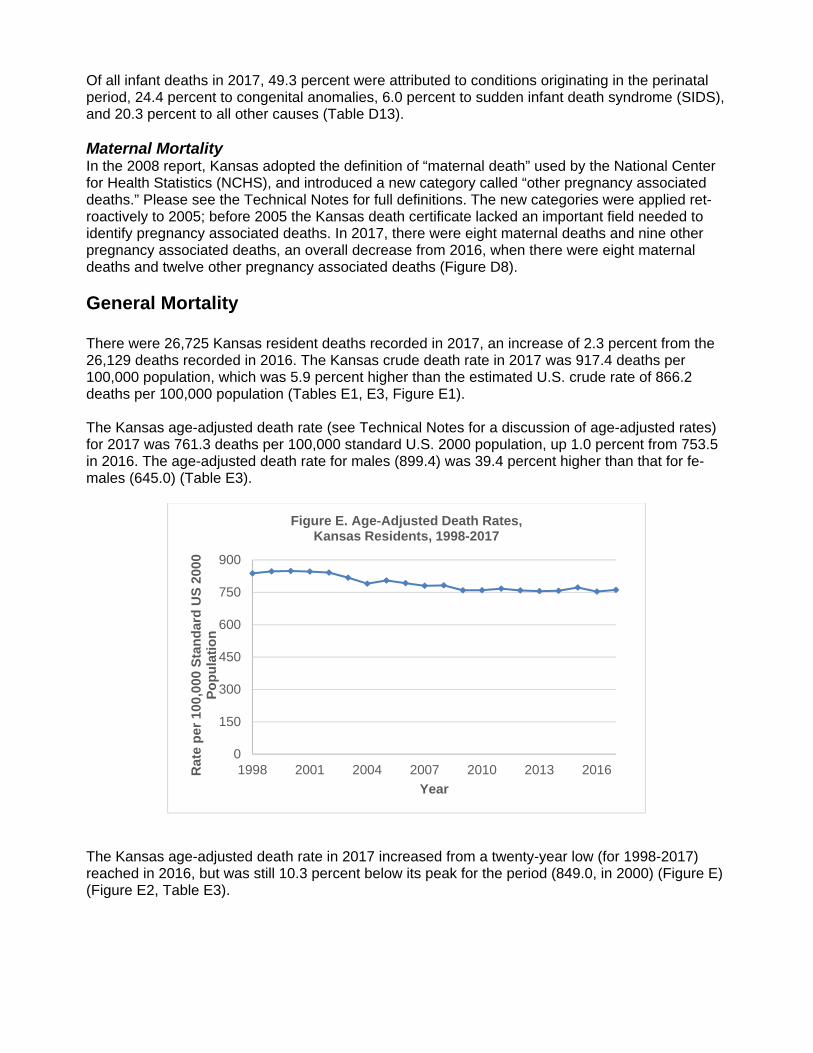
General Mortality There were 26,725 Kansas resident deaths recorded in 2017, an increase of 2.3 percent from the 26,129 deaths recorded in 2016. The Kansas crude death rate in 2017 was 917.4 deaths per 100,000 population, which was 5.9 percent higher than the estimated U.S. crude rate of 866.2 deaths per 100,000 population (Tables E1, E3, Figure E1). The Kansas age-adjusted death rate (see Technical Notes for a discussion of age-adjusted rates) for 2017 was 761.3 deaths per 100,000 standard U.S. 2000 population, up 1.0 percent from 753.5 in 2016. The age-adjusted death rate for males (899.4) was 39.4 percent higher than that for fe-males (645.0) (Table E3).
The Kansas age-adjusted death rate in 2017 increased from a twenty-year low (for 1998-2017) reached in 2016, but was still 10.3 percent below its peak for the period (849.0, in 2000) (Figure E) (Figure E2, Table E3).
0
150
300
450
600
750
900
1998 2001 2004 2007 2010 2013 2016Rat
e p
er 1
00,0
00 S
tan
dar
d U
S 2
000
Po
pu
lati
on
Year
Figure E. Age-Adjusted Death Rates,Kansas Residents, 1998-2017

Age at Death The average age at death of Kansas residents in 2017 was 74.2 years, unchanged from 2016 (Ta-ble E4). Average age at death varied by sex and population group. In 2017, males died 6.4 years younger than females (71.1 versus 77.5 years). The average age at death for the White non-Hispanic popu-lation was 75.7 years, 11.0 years higher than that of the Black non-Hispanic population (64.7 years), and 15.7 years higher than that of the Hispanic population (60.0 years) (Table E4). Over 60 percent (60.4) of White non-Hispanic Kansas residents who died in 2017 were 75 years of age or older, while only 34.6 percent of deceased Black non-Hispanic residents and 36.9 percent of deceased Hispanic residents had reached the age of 75 (Table E4). Leading Causes of Death The 10 leading causes of death in Kansas remained unchanged from 2016 to 2017, though their order changed in some cases. Suicide and nephritis, nephrotic syndrome and nephrosis changed places as 8th and 10th leading causes (suicide ranked 8th in 2017) but all other rankings in the ten leading causes remained unchanged. The ten leading causes of death accounted for 71.5 percent of all Kansas resident deaths in 2017. Diabetes mellitus was the only leading cause for which the change in age-adjusted rate from 2016 was statistically significant: it rose from 21.1 per 100,000 population in 2016 to 24.9 in 2017. Kansas recorded 544 resident suicide deaths in 2017 compared to 512 in 2016 and 477 in 2015. The suicide age-adjusted death rate increased from 17.8 deaths per 100,000 population in 2016 to 18.8 deaths per 100,000 population in 2017, but the change was not statistically significant (Table E8). Historical cause-specific (crude) death rates over the past twenty years illustrate the convergence of heart disease and malignant neoplasms (cancer) mortality (Figure F). Mortality due to both dis-eases has declined, but heart disease deaths have declined much more rapidly than cancer deaths. In 2017, the heart disease death rate was 193.5 deaths per 100,000 population, while the cancer death rate was 185.1 per 100,000 population (Table E8, Figure E3).
0
50
100
150
200
250
300
1998 2001 2004 2007 2010 2013 2016Dea
th r
ate
per
100
,000
po
pu
lati
on
Year
Figure F. Cause Specific Death Rates of Two Leading Causes, Kansas Residents, 1998-2017
Heart Disease
Cancer

Age at Death for Leading Causes For any given cause of death, there can be wide variations in average age of death by sex of de-cedent. Males and females who died from malignant neoplasms did so at about the same ages (72.0 and 71.8 years, respectively), but males who died from heart disease did so at younger ages than did females (75.4 and 82.4 years, respectively). Males and females dying from chronic lower respiratory disease did so at about the same ages (76.6 and 77.2 years, respectively), but males dying of cerebrovascular disease did so at younger ages than did females (77.8 and 82.6 years, respectively). Males who died from suicide were older than females who died of that cause (44.5 and 41.3 years, respectively), but males died from unintentional injuries at much younger ages than females (55.4 and 67.1 years, respectively). Alzheimer’s disease killed at the highest average ages for males and females (85.2 and 87.5 years respectively) (Table E7). The leading causes of death also varied by age-group. In 2017, the leading cause of death for in-fants (up to one year of age) was congenital anomalies. For age-groups 1-4, 5-14, 15-24, and 25-44 the leading cause of death was unintentional injuries. For age-groups 45-64 and 65-84 the lead-ing cause of death was cancer, and for ages 85 and above the leading cause of death was heart disease (Figure E4). For the 15-24 age-group, unintentional injuries were followed by suicide and homicide as leading causes of death. These three causes accounted for 82.1 percent of deaths in this age-group (Table E6). Infectious Disease Five hundred forty (540) Kansas residents died of pneumonia or influenza in 2017, for an age-adjusted death rate of 14.8 per 100,000 population, the second lowest rate in the 1999-2017 period (Table E9). Since 1999, the yearly count of resident pneumonia and influenza deaths has varied from a high of 740 to a low of 518. The age-adjusted pneumonia and influenza death rate in the period has varied from a high of 24.1 to a low of 14.3 deaths per 100,000 population. These num-bers are not strictly comparable to the influenza and pneumonia statistics posted on the KDHE website, as they are based on a calendar year, while the latter are based on a September-May flu season. Furthermore, the rates reported on the KDHE website are crude rates, while the rates re-ported here are age-adjusted rates. Twenty-two (22) Kansas residents died of HIV/AIDS in 2017, for an age-adjusted death rate of 0.7 per 100,000 population (Table E6). This surpasses the Healthy People 2020 target (HIV-12) of re-ducing the rate to 3.3 HIV/AIDS deaths per 100,000 population. Cancer Cancer was responsible for 5,391 Kansas resident deaths in 2017, for an age-adjusted death rate of 154.2 per 100,000 population (Table E8). This surpasses the Healthy People 2020 target for cancer deaths (C-1) of 160.6 per 100,000 population. Ischemic Heart Disease Ischemic heart disease was responsible for 3,299 Kansas resident deaths in 2017, for an age-adjusted death rate of 91.4 per 100,000 population (Table E10). This surpasses the Healthy Peo-ple 2020 target for reducing coronary heart disease deaths (HDS-2, which has the same definition as used here for ischemic heart disease), to 100.8 per 100,000 population. Cerebrovascular Disease Kansas age-adjusted death rates from cerebrovascular disease decreased to 36.9 per 100,000 population in 2017, down 3.9 percent from a rate of 38.4 per 100,000 population in 2015. Since

1998, death rates due to cerebrovascular disease have declined by 34.2 percent (Table E8, Figure E3).
Healthy People 2020 uses the word “stroke” to include all the ICD-10 codes included in this report in the cerebrovascular disease category. The Healthy People 2020 target for stroke (HDS-3) is to reduce deaths to 33.8 deaths per 100,000 population. To meet this target, Kansas resident cere-brovascular disease deaths would have to decline from 1,327 in 2017 to about 1,207 by 2020 (Ta-ble E12). (The exact number would depend on decedent age distributions and on future changes to the Kansas population.)
External Causes In 2017, the age-adjusted unintentional injury death rate was 49.3 deaths per 100,000 population, an increase of 6.3 percent from the rate of 46.4 in 2016. The 2017 rate was the highest uninten-tional injury death rate in the past twenty years (Table E8, Figure E3).
Motor-vehicle injuries resulted in 447 deaths in 2017 (427 traffic and 20 non-traffic), accounting for 28.4 percent of 1,573 unintentional injury deaths. This was an increase of 4.4 percent from 428 motor-vehicle injury deaths in 2016 (Table E13).
The motor-vehicle traffic injury death rate in 2017 was 15.1 deaths per 100,000 population (age-adjusted). This falls short of the Healthy People 2020 target (IVP-13.1) of 12.4 deaths per 100,000 population. Meeting the CDC Winnable Battles target of 9.5 deaths per 100,000 population by 2015 would have required a reduction in motor-vehicle traffic injury deaths to about 277.
Unintentional falls were responsible for 469 Kansas resident deaths in 2017 for an age-adjusted death rate of 12.6 per 100,000 population. The Healthy People 2020 target for fall related deaths (IVP-23.1) is 7.0 per 100,000 population. Meeting this target would require a reduction to about 270 unintentional fall deaths by 2020. The exact number would depend on decedent age distribu-tions and on future changes to the Kansas population.
Suicide In 2017, 544 Kansas residents died due to suicide, up 6.3 percent from 512 suicide deaths in 2016. Almost four-fifths (78.3%) of suicide victims were male. The three age groups with the largest number of suicides were 25-34 (101 deaths), 35-44 (91 deaths), and 45-54 (91 deaths). The three most common methods of suicide were firearms (309 deaths), suffocation (150 deaths), and poi-soning (64 deaths) (Tables E8, E14, E22).
YPLL 75 Statistics Mortality in Kansas was responsible for 196,255 years of potential life lost before age 75 in 2017 (see Technical Notes – Years of Potential Life Lost). Cancer, unintentional injury, and heart dis-ease accounted for the most years of potential life lost (37,642, 30,129, and 25,245 years lost, re-spectively). Men lost more than twice the potential years of life to unintentional injuries than did women (20,568 years and 9,561 years, respectively) (Table E20).
Tobacco and Mortality Tobacco use contributed to 4,715 deaths in Kansas in 2017 (25.3 percent of the deaths where the tobacco contribution was known and reported on the death certificate). Tobacco use was a con-tributing factor in 31.5 percent of male deaths, and in 19.3 percent of female deaths. The causes of death showing the largest tobacco contribution were cancer of the trachea, bronchus and lung (86.1%), chronic lower respiratory disease (84.3%), cancer of the urinary tract (33.3%), and is-chemic heart disease (33.2%). (Table E21) Physicians and coroners can state on the death certifi-cate whether tobacco contributed to the death. Because information may not be available at the

time the death certificate is completed, tobacco’s contribution may be subject to some under-reporting.
Marriages
In 2017, 17,274 marriages occurred in Kansas, a decrease of 3.8 percent from the 2016 total of 17,948 marriages (Table F1).
The Kansas marriage rate in 2017 was 5.9 marriages per 1,000 population. This rate was 4.8 per-cent lower than the 6.2 percent rate recorded in 2016, and was the lowest rate recorded for the state of Kansas in the last twenty years (1998–2017) (Figure G). For the entire period, Kansas marriage rates have been lower than U.S. marriage rates (Table F1, Figure F1).
Marriage Characteristics First-time marriages made up more than half of the marriages in Kansas for the fifteenth consecu-tive year. In 2017, 59.1 percent of all marriages involved first-time partners (Table F4).
More marriages occurred in September (11.7%) than any other month in 2017. October and June were the second and third most popular months (Figure F3).
Age at Marriage Kansas couples are delaying marriage. In 1998, 11.4 percent of the brides and 4.6 percent of the grooms were under 20 years of age. In 2017, however, only 4.7 percent of the brides and 2.2 per-cent of the grooms were under 20 (Table F5).
The average age of all brides in 2017 was 31.5 years and that of grooms was 33.5 years. Women marrying for the first time averaged 26.6 years while first time grooms averaged 28.4 years. Of those persons who remarried in 2017, women were, on average, 42.2 years old and men were 45.0 years of age (Figure F4).
0
1
2
3
4
5
6
7
8
9
10
1998 2001 2004 2007 2010 2013 2016Mar
riag
es p
er 1
,000
po
pu
lati
on
Year
Figure G. Marriage RatesKansas and the U.S., 1998-2017
Kansas
U.S.

Marriage Dissolutions
In 2017, 6,494 marriage dissolutions (6,402 divorces and 92 annulments) occurred in Kansas, a decline of 9.8 percent from the 2016 total of 7,198 (Table F1, Table F7).
The Kansas marriage dissolution rate in 2017 was 2.2 per 1,000 population, which was 43.6 per-cent lower than the 1997 rate of 3.9 (Figure H). Kansas reported a higher marriage dissolution rate than the U.S. from 1952 to 1994. However, in 1995, the state’s rate (4.3) dropped below the U.S. rate (4.4) and remained below the national rate until 2008. Since 2008 Kansas rates have some-times been higher and sometimes lower than the U.S. rates. U.S. rates for 2017 have not been re-leased at the time this summary was written (Table F1, Figure F2). The ratio of marriages to divorces in Kansas in 2017 was 2.7:1 (Table F1). Age at Marriage Dissolution The most common age-group of husbands involved in marriage dissolutions in 2017 was 30-34; the most common age-group of wives involved in marriage dissolutions was 30-34. For couples of the same age-group, the most common age-group was 30-34 (Table F6). The average age at marriage dissolution in 2017 was 38.6 years for wives and 40.7 years for hus-bands, as compared to 35.2 years for wives and 37.5 years for husbands in 1998 (Figure F5). Marriage Dissolution Characteristics In 2017, 32.5 percent of marriages ending in divorce or annulment lasted four years or less (Table F7). There were 5,885 minor children affected as a result of marriage dissolutions in 2017. At least one minor child was reported to be involved in almost half (47.9%) of the marriage dissolutions (Table F8, Figure F6).
0
1
2
3
4
5
6
1998 2001 2004 2007 2010 2013 2016
Mar
riag
e D
isso
luti
on
s p
er 1
,000
p
op
ula
tio
n
Year
Figure H. Marriage Dissolution RatesKansas and the U.S., 1998-2017
Kansas
U.S.

A. VITAL EVENTS

Vital Event 2017 2016 1998
Live Births 36,464 38,048 38,372
Out-of-Wedlock Births 12,990 13,705 10,657
Stillbirths 184 252 199
Hebdomadal Deaths 128 119 132
Perinatal Period lll Deaths 312 371 331
Neonatal Deaths 154 145 172
Infant Deaths 217 223 263
Maternal Deaths 8 8 3
Deaths 26,725 26,129 23,928
Marriages 17,274 17,948 20,403
Marriage Dissolutions 6,494 7,198 10,363
Abortions 3,450 3,439 6,440
Residence data are presented for births, deaths, abortions Occurrence data are presented for marriages and marriage dissolutions
Each day Kansas residentsexperienced approximately
100 Live births 36 Out-of wedlock births 6 Live births to teenagers Each day in Kansas there 7 Low birthweight live births occurred approximately <1 Infant death
73 Deaths 47 Marriages 15 Cancer 18 Marriage dissolutions 15 Heart disease 18 Abortions 5 Chronic lower respiratory disease 4 Unintentional injuries 4 Cerebrovascular disease 2 Alzheimer's disease 2 Diabetes 1 Pneumonia and influenza 1 Nephritis, nephrotic syndrome, nephrosis 1 Suicide
* based on 365 days in 2017Figure A1
-15.9
EVERY DAY DURING 2017*
-9.8
0.3
-2.7
0.0
2.3
-17.5
166.7
6.2
Table A1Selected Vital Events and Percent Change
Kansas, 2017, 2016 and 1998
PercentChange
1998-2017
-5.0
21.9
11.7
PercentChange
2016-2017
-4.2
-5.2
7.6
-46.4
-15.3
-37.3
-3.8
-7.5
-3.0
-5.7
-27.0
-10.5

* Residence Data† Occurrence Data
Kansas Vital Statistics for 2017
Figure A2
Other Causes 12,309
Cancer 5,391
Unintent.. Injuries1,573
Chronic Lower Resp. 1,816
Heart Disease 5,636
Deaths*Total 26,725
First for Groom Bride Prev.
Marr. 1,768
First for Bride Groom Prev.
Marr. 1,723
First Marriage for Both 10,205
Remarriage for Both 3,576
Marriages† by Marriage OrderTotal 17,274
(2 N.S.)
Stillbirth 184
Abortions 3,450
Live Births 36,464
Pregnancy Outcomes*
>5 Years3,822
1-5 Years2,256
<1 Year 211
Marriage Dissolutions†
By Duration of MarriageTotal 6,494(205 N.S.)
<1 217
1-24419 25-44
1,12945-541,375
55-643,443
65-744,780
≥75 15,361
Deaths by Age-Group* (Years) (1 n.s.)
2,913,123

Vital Event 1998 1999 2000 2001 2002 2003 2004 2005 2006 2007 2008 2009 2010 2011 2012 2013 2014 2015 2016 2017
Live Births Number 38,372 38,748 39,654 38,832 39,338 39,353 39,553 39,701 40,896 41,951 41,815 41,388 40,439 39,628 40,304 38,805 39,193 39,126 38,048 36,464 Rate* 14.6 14.6 14.7 14.4 14.5 14.4 14.5 14.5 14.8 15.1 14.9 14.7 14.2 13.8 14.0 13.4 13.5 13.4 13.1 12.5Out-of-Wedlock Births Number 10,657 11,068 11,491 11,592 12,129 12,345 12,897 13,492 14,376 15,252 15,754 15,572 15,241 14,749 14,805 14,053 14,285 14,108 13,705 12,990
Percent† 27.8 28.6 29.0 29.9 30.8 31.4 32.6 34.0 35.2 36.4 37.7 37.6 37.7 37.2 36.7 36.2 36.4 36.1 36.0 35.6Stillbirths Number 199 175 177 209 146 206 186 194 192 186 182 213 168 188 195 173 199 233 252 184
Rate‡ 5.2 4.5 4.4 5.4 3.7 5.2 4.7 4.9 4.7 4.4 4.3 5.1 4.1 4.7 4.8 4.4 5.1 5.9 6.6 5.0Hebdomadal Deaths Number 132 159 146 148 155 138 144 153 137 163 160 144 143 121 142 140 138 132 119 128
Rate§ 3.4 4.1 3.7 3.8 3.9 3.5 3.6 3.9 3.3 3.9 3.8 3.5 3.5 3.1 3.5 3.6 3.5 3.4 3.1 3.5Perinatal Period III Deaths Number 331 334 323 357 301 344 330 347 329 349 342 357 311 309 337 313 337 365 371 312
Rate‡ 8.6 8.6 8.1 9.1 7.6 8.7 8.3 8.7 8.0 8.3 8.1 8.6 7.7 7.8 8.3 8.0 8.6 9.3 9.7 8.5Neonatal Deaths Number 172 189 174 178 192 177 176 196 176 211 193 176 170 157 173 166 175 160 145 154
Rate§ 4.5 4.9 4.4 4.6 4.9 4.5 4.4 4.9 4.3 5.0 4.6 4.3 4.2 4.0 4.3 4.3 4.5 4.1 3.8 4.2Infant Deaths Number 263 281 266 285 282 262 284 297 293 333 303 290 253 247 254 248 246 230 223 217
Rate§ 6.9 7.3 6.7 7.3 7.2 6.7 7.2 7.5 7.2 7.9 7.2 7.0 6.3 6.2 6.3 6.4 6.3 5.9 5.9 6.0
Maternal Deaths ¶
Number 3 4 4 1 2 0 2 6 4 3 7 8 7 4 4 10 5 5 8 8
Rate# 7.8 10.3 10.1 2.6 5.1 0.0 5.1 15.1 9.8 7.2 16.7 19.3 17.3 10.1 9.9 25.8 12.8 12.8 21.0 21.9Deaths Number 23,928 24,380 24,676 24,590 24,968 24,417 23,720 24,632 24,489 24,413 24,896 23,997 24,428 25,114 25,084 25,347 25,731 26,611 26,129 26,725 Rate** 899.3 910.3 916.4 910.3 920.3 896.5 867.1 897.4 886.0 879.4 888.5 851.3 856.2 874.6 869.2 875.9 886.0 914.0 898.7 917.4Marriages Number 20,403 20,905 20,426 20,457 19,783 18,722 19,174 18,745 18,836 18,910 18,717 18,268 18,150 17,897 18,154 17,328 17,655 17,595 17,948 17,274 Rate* 7.8 7.9 7.6 7.6 7.3 6.9 7.0 6.8 6.8 6.8 6.7 6.5 6.4 6.2 6.3 6.0 6.1 6.0 6.2 5.9Marriage Dissolutions Number 10,363 9,926 10,105 9,885 9,654 8,644 8,759 8,476 8,145 9,347 9,818 10,333 10,579 10,445 9,782 9,085 8,441 8,036 7,198 6,494 Rate* 3.9 3.7 3.8 3.7 3.6 3.2 3.2 3.1 3.3 3.4 3.5 3.7 3.7 3.6 3.4 3.1 2.9 2.8 2.5 2.2Abortions Number 6,440 6,416 6,356 6,419 6,298 6,163 5,971 5,629 5,886 5,679 5,512 4,780 4,223 3,946 3,802 3,763 3,716 3,579 3,439 3,450 Ratio§
167.8 165.6 160.3 165.3 160.1 156.6 151.0 141.8 143.9 135.4 131.8 115.5 104.4 99.6 94.3 97.0 94.8 91.5 90.4 94.6
Residence data are presented for births, deaths, abortions Occurrence data are presented for marriages and marriage dissolutions* Per 1,000 total population† Per 100 live births‡ Per 1,000 (live births + still births)§ Per 1,000 live births¶ See Technical Notes for Information on updated definition of Maternal Mortality# Per 100,000 live births
** Per 100,000 population
Table A2Selected Vital Event Percents, Rates, and Ratios
Kansas, 1998-2017

* Stillbirth rates are per 1,000 Livebirths + Stillbirths; Infant death and Neonatal death rates are per 1,000 Livebirths.
Figure A3
Selected Vital Event RatesKansas, 1998-2017
0.0
2.0
4.0
6.0
8.0
10.0
12.0
14.0
16.0
18.0
Rat
e pe
r 1,
000
popu
latio
n
Year
Birth and Death Rates Kansas, 1998-2017
Birth
Death
0.0
2.0
4.0
6.0
8.0
10.0
Rat
e*
Year
Stillbirth*, Infant, and Neonatal Death RatesKansas, 1998-2017
Stillbirth
Infant Death
Neonatal Death
0.0
2.0
4.0
6.0
8.0
10.0
Rat
e pe
r 1,
000
popu
latio
n
Year
Marriage and Marriage Dissolution RatesKansas, 1998-2017
Marriage Marriage Diss.

Births and Birth RatesWhite Black Native American Asian/Pacific Other Hispanic
Total Non-Hispanic Non-Hispanic Non-Hispanic Non-Hispanic Non-Hispanic* Any Race n.s.Births 36,464 25,431 2,463 168 1,255 1,177 5,945 25Birth Rates†
12.5 11.5 14.6 7.2 13.9 15.9 17.1 n/a
Maternal Characteristics
White Black Native American Asian/Pacific Other HispanicTotal Non-Hispanic Non-Hispanic Non-Hispanic Non-Hispanic Non-Hispanic* Any Race n.s.
Births to mother <18 years of age 471 209 66 3 5 30 158 0Births to mother <20 years of age 2,066 1,110 227 14 20 109 586 0Births to mother with < HS diploma 4,321 1,720 343 30 107 178 1,941 2 or GEDOut-of-wedlock births 12,990 7,481 1,680 103 154 547 3,018 7Fourth and higher birth order#
5,366 3,314 505 48 106 155 1,234 4
Birth Outcomes
White Black Native American Asian/Pacific Other HispanicTotal Non-Hispanic Non-Hispanic Non-Hispanic Non-Hispanic Non-Hispanic* Any Race n.s.
Low birth weight infants 2,697 1,698 352 11 100 127 408 1 (<2500 grams)Very low birth weight infants 490 306 77 5 9 25 68 0 (<1500 grams)Births with gestational age 3,492 2,320 352 19 114 132 554 1 < 37 weeks
White Black Native American Asian/Pacific Other HispanicTotal Non-Hispanic Non-Hispanic Non-Hispanic Non-Hispanic Non-Hispanic* Any Race n.s.
Infant deaths‡ 6.0 4.7 11.8 11.9 4.8 12.7 7.2 n/aNeonatal deaths‡ 4.2 3.4 8.1 6.0 3.2 10.2 4.9 n/aPostneonatal deaths‡ 1.7 1.3 3.7 6.0 1.6 2.5 2.4 n/aStillbirths§ 5.0 5.1 7.7 5.9 2.4 3.4 4.2 n/aPerinatal§ 8.5 7.9 14.9 11.8 4.8 9.3 11.4 n/a
Pregnancy Characteristics
White Black Native American Asian/Pacific Other HispanicTotal Non-Hispanic Non-Hispanic Non-Hispanic Non-Hispanic Non-Hispanic* Any Race n.s.
Births to women with prenatal 29,473 21,532 1,767 110 997 887 4,170 10 care in first trimesterBirths to women with late 1,455 720 169 14 52 59 438 3 (3rd trimester) or no prenatal carePlural births**
1,230 890 124 4 36 47 129 0
Deaths and Death RatesWhite Black Native American Asian/Pacific Other Hispanic
Total Non-Hispanic Non-Hispanic Non-Hispanic Non-Hispanic Non-Hispanic* Any Race n.s.Deaths 26,725 23,557 1,421 194 232 340 918 63Death Rates ¶ 917.4 1,066.0 843.6 836.4 257.3 458.7 264.2 n/aAge-Adjusted death rates ¶
761.3 757.6 992.5 1,109.5 395.5 1,089.6 547.2 n/a
* Includes selection of two or more races or other non-specified race† Rate per 1,000 population‡ Rate per 1,000 live births§ Rate per 1,000 live births + Stillbirths¶ Rate per 100,000 standard U.S. 2000 population# Number of infants born to mothers who had at least three prior births.** Number of infants who were twins or higher order multiple.
Number
Table A3
Selected Vital Events by Population Group
Kansas, 2017
Number
Number
Rate

B. POPULATION

Years Total Male Female
1968 2,265,170 * *
1969 2,287,302 * *
1970 2,248,359 1,102,665 1,145,6941971 2,246,461 1,102,241 1,144,220
1972 2,255,791 1,107,579 1,148,212
1973 2,264,585 1,111,492 1,153,093
1974 2,268,075 1,112,236 1,155,839
1975 2,278,947 1,116,451 1,162,496
1976 2,298,892 1,126,226 1,172,666
1977 2,318,147 1,136,129 1,182,018
1978 2,333,141 1,142,360 1,190,781
1979 2,347,705 1,149,744 1,197,961
1980 2,369,039 1,159,759 1,209,280
1981 2,384,853 1,167,837 1,217,016
1982 2,401,208 1,175,216 1,225,992
1983 2,415,543 1,182,451 1,233,092
1984 2,424,080 1,185,429 1,238,651
1985 2,427,417 1,187,608 1,239,809
1986 2,432,621 1,190,343 1,242,278
1987 2,445,386 1,196,494 1,248,892
1988 2,461,992 1,205,541 1,256,451
1989 2,472,849 1,211,709 1,261,140
1990 2,480,683 1,216,391 1,264,292
1991 2,495,209 1,224,854 1,270,355
1992 2,526,042 1,240,410 1,285,632
1993 2,547,605 1,251,310 1,296,295
1994 2,569,118 1,262,797 1,306,321
1995 2,586,942 1,271,694 1,315,248
1996 2,598,266 1,276,063 1,322,203
1997 2,616,339 1,285,217 1,331,122
1998 2,638,667 1,297,126 1,341,541
1999 2,654,052 1,305,408 1,348,644
2000 2,692,557 1,330,705 1,361,852
2001 2,702,125 1,336,438 1,365,687
2002 2,715,884 1,343,815 1,372,069
2003 2,723,508 1,350,243 1,373,265
2004 2,735,502 1,358,381 1,377,121
2005 2,744,687 1,363,613 1,381,074
2006 2,764,075 1,371,446 1,392,629
2007 2,775,997 1,376,311 1,399,686
2008 2,802,134 1,391,821 1,410,313
2009 2,818,747 1,399,823 1,418,924
2010 2,853,118 1,415,408 1,437,710
2011 2,871,238 1,425,802 1,445,436
2012 2,885,905 1,435,281 1,450,624
2013 2,893,957 1,441,948 1,452,009
2014 2,904,021 1,447,355 1,456,666
2015 2,911,641 1,453,633 1,458,008
2016 2,907,289 1,447,759 1,459,530
2017 2,913,123 1,451,956 1,461,167
* All population counts are from US Census Bureau population estimates.
Population counts from 1999 to present are of the vintage of first release.
Population counts from 1990-1998 are of the 1999 vintage.
Population counts from 1970-1989 are intercensal estimates.
Population counts from 1968-1969 are from the Annual Summary of the year,
which did not break down by male and female.
Table B1Population by Year and Sex
Kansas Residents, 1968-2017

0.0
5.0
10.0
15.0
20.0
25.0
1998 2000 2002 2004 2006 2008 2010 2012 2014 2016
Rate of Natural IncreaseKansas, 1998-2017
Rate of Natural Increase
Rat
e pe
r 1,
000
popu
latio
n
Year
Birth Rate
Death Rate
Figure B2
2,000
2,200
2,400
2,600
2,800
3,000
1998 2000 2002 2004 2006 2008 2010 2012 2014 2016
Pop
ulat
ion
Year
Total PopulationKansas, 1998-2017* (in Thousands)
*U.S. Census Bureau Estimates2000, 2010 Actual Counts
Figure B1
0

Population Density
Source: Kansas and U.S. Statistical
Abstracts and U.S. Census Bureau Figure B4
Kansas and the U.S., 1998-2017
28
29
30
31
32
33
34
35
36
37
38
1998 2000 2002 2004 2006 2008 2010 2012 2014 2016
Ag
e in
Yea
rs
Year
Median AgeKansas, 1998-2017
Female
Male
Both Sexes
Figure B3
0
0.0
20.0
40.0
60.0
80.0
100.0
1998 2000 2002 2004 2006 2008 2010 2012 2014 2016
Per
sons
Per
Sq
Mile
Year
Kansas
U.S.
Percent
Change
Age-Group 1998 1999 2000 2001 2002 2003 2004 2005 2006 2007 2008 2009 2010 2011 2012 2013 2014 2015 2016 2017 1998-2017
Both Sexes
0-4 182 184 189 189 188 189 189 188 194 196 203 205 205 204 203 200 201 197 194 193 6.0
5-14 389 388 400 401 386 385 376 367 380 379 380 383 401 401 403 405 404 402 401 400 2.8
15-24 389 398 400 401 414 417 419 416 415 411 411 424 408 412 415 419 421 424 417 416 6.9
25-34 347 340 349 350 352 352 359 364 355 361 368 369 378 383 387 387 388 387 385 384 10.7
35-44 426 427 420 421 404 393 388 382 375 367 360 349 347 343 343 344 345 346 347 352 -17.4
45-54 329 343 354 355 378 384 392 399 403 406 408 404 406 399 389 376 369 361 354 346 5.2
55-64 213 220 220 221 239 249 260 271 284 296 306 317 331 346 351 357 362 367 372 374 75.6
65-74 178 175 176 176 171 170 170 170 171 174 180 183 190 195 207 217 226 235 245 255 43.3
75 and Over 176 179 180 181 184 184 184 187 186 186 187 184 186 187 187 189 190 191 192 195 10.8Total † 2,629 2,654 2,688 2,695 2,716 2,724 2,736 2,745 2,764 2,776 2,802 2,819 2,853 2,871 2,886 2,894 2,904 2,912 2,907 2,913 10.8
Median Age 35.2 35.4 35.2 35.4 35.5 35.5 35.8 36.0 36.0 36.2 36.2 35.9 36.0 36.0 36.0 36.0 36.1 36.1 36.5 36.6 4.0
Males
0-4 94 94 97 97 97 98 98 98 99 100 103 105 105 104 104 103 103 101 99 98 4.3
5-14 200 199 205 206 198 197 193 189 195 195 195 196 206 206 206 208 207 206 205 205 2.5
15-24 200 205 207 207 214 216 216 215 215 213 214 221 211 213 216 219 220 223 217 217 8.5
25-34 173 170 179 179 181 182 185 188 183 186 190 189 192 195 198 199 199 199 197 197 13.9
35-44 216 216 210 211 202 197 195 192 188 185 182 177 175 173 173 174 174 176 176 178 -17.6
45-54 162 169 178 178 189 192 196 199 201 202 203 200 201 198 193 187 183 180 177 173 6.8
55-64 103 106 107 107 116 122 128 134 140 146 151 156 164 171 173 175 178 180 182 183 77.7
65-74 81 79 80 80 78 78 78 78 79 80 84 85 89 92 98 103 107 112 117 122 50.6
75 and Over 64 66 66 66 68 69 70 72 70 70 71 70 73 74 74 75 76 77 78 79 23.4Total† 1,292 1,305 1,328 1,332 1,344 1,350 1,358 1,364 1,371 1,376 1,392 1,400 1,415 1,426 1,435 1,442 1,447 1,454 1,448 1,452 12.4
Median Age 34.0 34.2 33.7 33.9 33.9 34.0 34.3 34.6 34.6 34.7 34.6 34.4 34.7 34.7 34.6 34.6 34.8 34.9 35.3 35.4 4.1
Females
0-4 89 90 92 92 91 91 91 90 95 96 99 101 101 100 99 98 98 96 95 95 6.7
5-14 189 188 194 195 188 187 183 179 185 185 185 187 196 196 197 198 197 196 196 196 3.7
15-24 189 193 193 194 200 201 202 201 200 198 197 203 197 197 199 200 201 202 200 199 5.3
25-34 174 170 170 171 171 171 173 176 172 176 178 180 185 191 189 189 189 188 188 186 6.9
35-44 211 211 210 211 202 196 193 190 187 183 179 171 172 170 170 170 170 171 171 173 -18.0
45-54 167 174 176 177 188 192 196 200 202 204 205 204 205 201 196 190 185 181 177 173 3.6
55-64 111 114 113 113 122 127 133 138 144 150 155 160 168 175 178 181 185 188 190 191 72.1
65-74 97 96 96 96 93 92 92 92 92 94 96 98 101 103 109 114 118 123 128 133 37.1
75 and Over 112 113 115 115 116 115 114 115 116 116 116 115 113 113 113 113 114 114 114 115 2.7Total† 1,337 1,349 1,360 1,363 1,372 1,373 1,377 1,381 1,393 1,400 1,410 1,419 1,438 1,445 1,451 1,452 1,457 1,458 1,460 1,461 9.3
Median Age 36.4 36.6 36.5 36.9 37.0 37.1 37.3 37.5 37.4 37.5 37.6 37.4 37.4 37.4 37.4 37.4 37.5 37.6 37.8 37.9 4.1
* U.S. Census Bureau estimates for July 1, 1997-1999, 2002-2009, and 2011-2016.
U.S. Census Bureau counts for 2000 and 2010 are for April 1.
KDHE estimates for 2001 based on 2000 Census. † Estimates may not add to totals due to rounding. See Technical Notes.
Table B2 Population by Nine Selected Age-Groups and Sex*
Kansas, 1998-2017(In Thousands)
Year

Native American
Total Male Female Male Female Male Female Male Female Male Female Male Female
Total 2,913,123 1,092,453 1,117,295 87,246 81,196 11,484 11,710 43,901 46,252 36,980 37,147 179,892 167,567
<1 38,059 12,626 11,987 1,265 1,230 166 159 631 601 1,197 1,147 3,586 3,464
1-4 155,080 52,393 50,348 5,149 5,005 522 495 2,401 2,158 4,006 3,924 14,488 14,191
5-14 400,089 135,345 129,224 12,487 12,318 1,454 1,394 5,858 5,410 10,605 10,331 38,786 36,877
15-24 415,579 148,534 137,195 15,410 12,522 2,184 1,974 8,286 8,273 8,485 7,967 33,853 30,896
25-34 383,787 139,767 135,030 14,826 11,995 1,817 1,760 8,870 8,249 4,443 4,612 27,643 24,775
35-44 351,767 131,318 129,430 11,266 9,929 1,527 1,451 6,456 7,536 2,873 3,069 24,969 21,943
45-54 345,555 135,915 137,279 10,248 9,183 1,444 1,628 5,073 5,868 2,053 2,234 18,044 16,586
55-64 373,644 155,540 163,779 9,432 9,479 1,325 1,561 3,358 4,134 1,868 2,048 10,993 10,127
65-74 255,057 108,873 117,722 4,729 5,520 719 860 1,896 2,559 949 1,068 4,885 5,277
75-84 129,564 51,161 66,064 1,859 2,768 285 346 871 1,059 371 516 1,968 2,29685+ 64,942 20,981 39,237 575 1,247 41 82 201 405 130 231 677 1,135
Abstracts and U.S. Census Bureau Figure 8
Non-Hispanic
Table B3 Population by 11 Selected Age-Groups, by Population Group and Sex*
White Asian/Pacific
Kansas, 2017
*U.S. Census Bureau estimates for 2017.
Multiple Race Hispanic Non-Hispanic
Black
Non-Hispanic
Age-Group
Non-Hispanic Any Race Non-Hispanic
6.0
2.86.9 10.7
-17.4
5.2
75.6
43.3
10.8 10.8
-25
-5
15
35
55
75
0-4 5-14 15-24 25-34 35-44 45-54 55-64 65-74 75 &Over
Total
Per
cent
Age-Group(years)
Percent Change in Age-Group PopulationBoth Sexes, Kansas, 1998-2017
Figure B5

Table B4Population by County and Peer Group*
Kansas, 2013-2017
Percent
County of ChangeResidence 2013 2014 2015 2016 2017 2013-2017
Year
Kansas 2,893,957 2,904,021 2,911,641 2,907,289 2,913,123 0.7
Allen 13,124 12,909 12,717 12,714 12,519 -4.6Anderson 7,897 7,883 7,808 7,827 7,833 -0.8Atchison 16,749 16,513 16,398 16,380 16,332 -2.5Barber 4,947 4,897 4,823 4,688 4,586 -7.3Barton 27,509 27,385 27,103 26,775 26,476 -3.8
Bourbon 14,852 14,772 14,712 14,617 14,754 -0.7Brown 9,997 9,815 9,776 9,684 9,641 -3.6Butler 65,803 66,227 66,741 67,025 66,878 1.6Chase 2,700 2,692 2,679 2,669 2,683 -0.6Chautauqua 3,552 3,481 3,402 3,374 3,363 -5.3
Cherokee 20,978 20,787 20,533 20,246 20,115 -4.1Cheyenne 2,694 2,693 2,679 2,661 2,683 -0.4Clark 2,193 2,144 2,096 2,072 2,004 -8.6Clay 8,406 8,317 8,347 8,143 7,958 -5.3Cloud 9,292 9,385 9,219 9,150 8,991 -3.2
Coffey 8,412 8,433 8,384 8,433 8,224 -2.2Comanche 1,955 1,954 1,843 1,862 1,790 -8.4Cowley 36,204 35,963 35,788 35,753 35,361 -2.3Crawford 39,278 39,290 39,217 39,164 39,034 -0.6Decatur 2,930 2,908 2,932 2,832 2,885 -1.5
Dickinson 19,609 19,394 19,303 19,064 18,902 -3.6Doniphan 7,851 7,874 7,797 7,664 7,727 -1.6Douglas 114,322 116,585 118,053 119,440 120,793 5.7Edwards 2,945 3,030 2,968 2,938 2,893 -1.8Elk 2,655 2,694 2,605 2,547 2,498 -5.9
Ellis 29,061 29,013 29,029 28,893 28,689 -1.3Ellsworth 6,398 6,392 6,343 6,328 6,330 -1.1Finney 37,098 37,184 37,118 36,722 37,084 0.0Ford 34,819 34,795 34,536 33,971 34,381 -1.3Franklin 25,740 25,611 25,609 25,560 25,733 0.0
Geary 37,384 36,713 37,030 35,586 33,855 -9.4Gove 2,769 2,727 2,640 2,589 2,631 -5.0Graham 2,593 2,566 2,591 2,564 2,495 -3.8Grant 7,950 7,816 7,733 7,646 7,526 -5.3Gray 6,009 6,082 6,133 6,034 5,958 -0.8
Greeley 1,290 1,301 1,330 1,296 1,249 -3.2Greenwood 6,424 6,328 6,244 6,151 6,123 -4.7Hamilton 2,609 2,603 2,474 2,536 2,640 1.2Harper 5,860 5,818 5,817 5,685 5,590 -4.6Harvey 34,741 34,820 35,073 34,913 34,544 -0.6
Haskell 4,141 4,106 4,064 4,006 4,053 -2.1Hodgeman 1,950 1,916 1,893 1,870 1,842 -5.5Jackson 13,366 13,539 13,338 13,291 13,318 -0.4Jefferson 18,813 18,855 18,930 18,897 18,998 1.0Jewell 3,046 3,043 2,970 2,901 2,850 -6.4
Johnson 566,933 574,272 580,159 584,451 591,178 4.3Kearny 3,923 3,915 3,956 3,917 3,960 0.9Kingman 7,844 7,698 7,687 7,467 7,360 -6.2Kiowa 2,523 2,513 2,564 2,483 2,485 -1.5Labette 20,916 20,960 20,803 20,444 20,145 -3.7
Lane 1,720 1,687 1,670 1,636 1,559 -9.4Leavenworth 78,185 78,797 79,315 80,204 81,095 3.7Lincoln 3,147 3,167 3,105 3,073 3,043 -3.3Linn 9,516 9,502 9,536 9,558 9,726 2.2Logan 2,798 2,794 2,825 2,831 2,821 0.8

Table B4Population by County and Peer Group*
Kansas, 2013-2017
Percent
County of ChangeResidence 2013 2014 2015 2016 2017 2013-2017
Year
Lyon 33,510 33,212 33,339 33,510 33,392 -0.4McPherson 29,569 29,241 28,941 28,804 28,708 -2.9Marion 12,219 12,208 12,103 12,112 11,986 -1.9Marshall 10,002 10,006 9,936 9,836 9,745 -2.6Meade 4,343 4,357 4,330 4,216 4,303 -0.9
Miami 32,835 32,822 32,553 32,964 33,461 1.9Mitchell 6,378 6,284 6,282 6,243 6,128 -3.9Montgomery 34,292 34,065 33,314 32,746 32,556 -5.1Morris 5,741 5,698 5,645 5,573 5,455 -5.0Morton 3,143 3,110 3,007 2,848 2,740 -12.8
Nemaha 10,161 10,148 10,227 10,241 10,118 -0.4Neosho 16,430 16,416 16,346 16,146 16,015 -2.5Ness 3,073 3,105 3,005 2,962 2,869 -6.6Norton 5,622 5,560 5,550 5,493 5,441 -3.2Osage 16,142 15,936 15,847 15,843 15,772 -2.3
Osborne 3,818 3,756 3,683 3,642 3,610 -5.4Ottawa 6,042 6,065 5,975 5,920 5,863 -3.0Pawnee 6,971 6,916 6,838 6,743 6,680 -4.2Phillips 5,540 5,533 5,428 5,428 5,370 -3.1Pottawatomie 22,691 22,897 23,298 23,661 23,908 5.4
Pratt 9,878 9,850 9,691 9,584 9,547 -3.4Rawlins 2,589 2,584 2,506 2,549 2,497 -3.6Reno 64,190 63,794 63,718 63,220 62,510 -2.6Republic 4,820 4,803 4,725 4,699 4,691 -2.7Rice 10,011 10,015 9,977 9,831 9,660 -3.5
Riley 75,394 75,194 75,247 73,343 74,172 -1.6Rooks 5,190 5,155 5,174 5,076 5,043 -2.8Rush 3,186 3,197 3,130 3,058 3,103 -2.6Russell 6,933 6,956 7,039 6,988 6,915 -0.3Saline 55,740 55,755 55,691 55,142 54,734 -1.8
Scott 5,035 5,080 4,964 5,032 4,961 -1.5Sedgwick 505,415 508,803 511,574 511,995 513,687 1.6Seward 23,390 23,465 23,152 22,709 22,159 -5.3Shawnee 178,831 178,406 178,725 178,146 178,187 -0.4Sheridan 2,553 2,539 2,512 2,509 2,527 -1.0
Sherman 6,115 6,110 5,983 5,965 5,930 -3.0Smith 3,706 3,769 3,704 3,632 3,668 -1.0Stafford 4,359 4,297 4,236 4,208 4,207 -3.5Stanton 2,194 2,111 2,072 2,062 2,060 -6.1Stevens 5,816 5,801 5,806 5,584 5,612 -3.5
Sumner 23,591 23,528 23,535 23,272 23,159 -1.8Thomas 7,948 7,891 7,904 7,892 7,788 -2.0Trego 2,980 2,902 2,927 2,872 2,884 -3.2Wabaunsee 7,051 7,022 6,951 6,891 6,874 -2.5Wallace 1,569 1,506 1,518 1,497 1,524 -2.9
Washington 5,629 5,598 5,598 5,546 5,485 -2.6Wichita 2,192 2,176 2,157 2,112 2,125 -3.1Wilson 9,105 9,028 8,856 8,723 8,675 -4.7Woodson 3,221 3,157 3,115 3,165 3,147 -2.3Wyandotte 160,384 161,636 163,369 163,831 165,288 3.1
Peer GroupFrontier 112,373 111,727 110,233 108,698 108,173 -3.7Rural 235,845 234,866 233,457 231,485 229,331 -2.8Densely -Settled Rural 476,272 474,638 472,563 469,376 467,914 -1.8Semi-Urban 465,397 464,291 464,193 459,663 457,477 -1.7Urban 1,604,070 1,618,499 1,631,195 1,638,067 1,650,228 2.9
Source: U.S. Bureau of the Census* See Technical Notes for Peer Group definition. Several counties changed groups as of the 2010 Census.


County of White Black Native American Asian/Pacific Islander Multiple Race HispanicResidence Total Non-Hispanic Non-Hispanic Non-Hispanic Non-Hispanic Non-Hispanic Any Race
Kansas 2,913,123 2,209,748 168,442 23,194 90,153 74,127 347,459
Allen 12,519 11,306 249 98 105 328 433
Anderson 7,833 7,435 45 45 50 106 152
Atchison 16,332 14,435 790 103 113 387 504
Barber 4,586 4,189 35 44 26 87 205
Barton 26,476 21,520 368 123 70 413 3,982
Bourbon 14,754 13,294 424 116 189 358 373
Brown 9,641 8,004 110 770 50 255 452
Butler 66,878 59,440 1,261 595 936 1,446 3,200
Chase 2,683 2,444 33 16 7 52 131
Chautauqua 3,363 2,897 24 159 5 147 131
Cherokee 20,115 17,694 161 799 151 788 522
Cheyenne 2,683 2,417 5 8 46 23 184
Clark 2,004 1,678 9 19 27 50 221
Clay 7,958 7,486 76 42 42 118 194
Cloud 8,991 8,338 77 43 109 143 281
Coffey 8,224 7,660 73 69 71 127 224
Comanche 1,790 1,601 6 6 8 33 136
Cowley 35,361 28,052 957 601 794 1,037 3,920
Crawford 39,034 33,882 854 383 778 974 2,163
Decatur 2,885 2,710 24 13 7 40 91
Dickinson 18,902 17,118 172 107 145 457 903
Doniphan 7,727 6,955 250 90 43 167 222
Douglas 120,793 94,626 5,175 2,681 6,145 4,420 7,746
Edwards 2,893 2,210 13 24 7 43 596
Elk 2,498 2,260 3 37 13 85 100
Ellis 28,689 25,696 327 75 550 409 1,632
Ellsworth 6,330 5,435 324 43 37 105 386
Finney 37,084 15,174 1,127 163 1,579 397 18,644
Ford 34,381 13,664 744 136 533 341 18,963
Franklin 25,733 23,407 306 180 145 589 1,106
Geary 33,855 18,864 5,870 283 1,323 1,794 5,721
Gove 2,631 2,490 9 4 22 31 75
Graham 2,495 2,212 86 12 35 69 81
Grant 7,526 3,780 36 28 29 87 3,566
Gray 5,958 4,890 32 21 24 55 936
Greeley 1,249 984 3 6 5 9 242
Greenwood 6,123 5,637 30 67 22 129 238
Hamilton 2,640 1,628 14 20 10 35 933
Harper 5,590 5,051 27 66 21 79 346
Harvey 34,544 28,507 600 201 332 714 4,190
Haskell 4,053 2,688 12 17 50 42 1,244
Hodgeman 1,842 1,596 21 10 45 25 145
Jackson 13,318 11,201 93 944 81 416 583
Jefferson 18,998 17,761 113 158 67 363 536
Jewell 2,850 2,718 7 16 11 28 70
Johnson 591,178 472,840 28,155 1,657 29,921 13,331 45,274
Kearny 3,960 2,523 27 46 20 82 1,262
Kingman 7,360 6,865 27 55 40 114 259
Kiowa 2,485 2,197 26 18 34 41 169
Labette 20,145 17,198 805 382 101 746 913
Lane 1,559 1,375 19 11 5 35 114
Leavenworth 81,095 63,959 7,376 554 1,298 2,311 5,597
Lincoln 3,043 2,857 18 18 17 30 103
Linn 9,726 9,096 72 67 39 169 283
Logan 2,821 2,541 20 12 22 48 178
Population Group
Table B5Population by County of Residence and Peer Group†, by Population Group*
Kansas, 2017

County of White Black Native American Asian/Pacific Islander Multiple Race HispanicResidence Total Non-Hispanic Non-Hispanic Non-Hispanic Non-Hispanic Non-Hispanic Any Race
Population Group
Table B5Population by County of Residence and Peer Group†, by Population Group*
Kansas, 2017
Lyon 33,392 23,574 728 208 886 855 7,141
McPherson 28,708 26,302 321 129 296 471 1,189
Marion 11,986 11,110 116 73 53 188 446
Marshall 9,745 9,219 44 35 40 157 250
Meade 4,303 3,378 47 34 32 50 762
Miami 33,461 30,978 425 207 169 587 1,095
Mitchell 6,128 5,817 14 25 52 62 158
Montgomery 32,556 25,935 1,712 988 339 1,522 2,060
Morris 5,455 4,976 30 31 32 104 282
Morton 2,740 1,936 26 32 42 37 667
Nemaha 10,118 9,635 63 53 43 125 199
Neosho 16,015 14,431 207 151 102 297 827
Ness 2,869 2,515 22 7 6 33 286
Norton 5,441 4,842 172 17 41 81 288
Osage 15,772 14,678 101 104 82 290 517
Osborne 3,610 3,410 11 19 53 36 81
Ottawa 5,863 5,500 67 28 17 85 166
Pawnee 6,680 5,609 355 44 32 113 527
Phillips 5,370 5,039 25 18 44 61 183
Pottawatomie 23,908 21,456 253 163 242 522 1,272
Pratt 9,547 8,453 135 48 63 164 684
Rawlins 2,497 2,260 14 6 11 30 176
Reno 62,510 52,698 1,907 389 348 1,321 5,847
Republic 4,691 4,484 22 14 23 58 90
Rice 9,660 8,074 125 66 87 187 1,121
Riley 74,172 56,885 4,781 378 3,767 2,194 6,167
Rooks 5,043 4,735 36 17 43 75 137
Rush 3,103 2,896 11 21 10 40 125
Russell 6,915 6,390 86 60 47 105 227
Saline 54,734 43,881 1,748 267 1,270 1,393 6,175
Scott 4,961 3,883 30 34 63 47 904
Sedgwick 513,687 349,616 45,075 4,178 23,316 16,356 75,146
Seward 22,159 6,656 866 89 617 272 13,659
Shawnee 178,187 131,706 14,013 1,614 2,726 5,992 22,136
Sheridan 2,527 2,352 11 6 9 22 127
Sherman 5,930 5,004 48 20 32 98 728
Smith 3,668 3,475 11 15 15 70 82
Stafford 4,207 3,498 16 32 18 73 570
Stanton 2,060 1,204 16 19 2 34 785
Stevens 5,612 3,406 30 51 24 64 2,037
Sumner 23,159 20,762 258 250 120 508 1,261
Thomas 7,788 7,007 68 39 70 102 502
Trego 2,884 2,731 19 10 17 43 64
Wabaunsee 6,874 6,363 48 50 21 140 252
Wallace 1,524 1,361 6 9 1 18 129
Washington 5,485 5,146 31 8 36 75 189
Wichita 2,125 1,446 19 3 4 22 631
Wilson 8,675 7,978 49 98 63 213 274
Woodson 3,147 2,920 15 36 4 72 100
Wyandotte 165,288 67,653 36,689 740 8,368 3,955 47,883
Peer Group†Frontier 108,173 93,365 745 816 689 1,803 10,755
Rural 229,331 202,579 2,436 2,094 1,417 3,603 17,202
Densely -Settled Rural 467,914 358,927 9,314 4,989 6,866 9,822 77,996
Semi-Urban 457,477 374,477 19,464 3,871 9,407 12,534 37,724
Urban 1,650,228 1,180,400 136,483 11,424 71,774 46,365 203,782
* U.S. Census Bureau 2017 population estimates.
† See Technical Notes for Peer Group definition.

Percent
City of ChangeResidence 2013 2014 2015 2016 2017 2013-2017
Abilene 6,665 6,590 6,558 6,469 6,380 -4.3Andover 12,265 12,509 12,745 12,980 13,111 6.9Arkansas City 12,305 12,205 12,136 12,063 11,866 -3.6Atchison 10,925 10,771 10,712 10,679 10,636 -2.6
Augusta 9,203 9,242 9,299 9,321 9,389 2.0Baldwin City 4,540 4,585 4,669 4,677 4,644 2.3Basehor 4,898 5,119 5,402 5,651 6,015 22.8Baxter Springs 4,124 4,073 4,028 3,963 3,958 -4.0
Bel Aire 6,916 7,284 7,435 7,661 7,914 14.4Beloit 3,846 3,792 3,790 3,769 3,710 -3.5Bonner Springs 7,480 7,553 7,606 7,665 7,784 4.1Burlington 2,630 2,635 2,615 2,610 2,553 -2.9
Chanute 9,255 9,295 9,252 9,139 9,054 -2.2Clay Center 4,239 4,177 4,173 4,069 3,980 -6.1Coffeyville 9,949 9,876 9,669 9,539 9,481 -4.7Colby 5,416 5,388 5,417 5,419 5,361 -1.0
Columbus 3,223 3,186 3,146 3,104 3,096 -3.9Concordia 5,261 5,311 5,218 5,179 5,099 -3.1Derby 23,047 23,234 23,509 23,633 23,673 2.7De Soto 5,911 6,038 6,074 6,071 6,107 3.3
Dodge City 28,159 28,117 27,912 27,453 27,720 -1.6Edwardsville 4,355 4,380 4,390 4,390 4,498 3.3El Dorado 12,852 12,879 12,931 13,141 12,993 1.1Ellsworth 3,077 3,076 3,057 3,047 3,054 -0.7
Emporia 24,799 24,560 24,649 24,816 24,724 -0.3Eudora 6,211 6,303 6,378 6,379 6,329 1.9Eureka 2,527 2,485 2,450 2,410 2,401 -5.0Fairway 3,963 3,969 3,970 3,972 3,957 -0.2
Fort Scott 7,934 7,874 7,838 7,773 7,813 -1.5Frontenac 3,432 3,444 3,422 3,414 3,413 -0.6Galena 2,994 2,966 2,930 2,886 2,900 -3.1Garden City 26,966 27,004 27,005 26,747 26,895 -0.3
Gardner 20,473 20,667 20,868 21,110 21,583 5.4Garnett 3,307 3,295 3,258 3,264 3,253 -1.6Girard 2,779 2,773 2,760 2,748 2,706 -2.6Goddard 4,582 4,692 4,719 4,710 4,746 3.6
Goodland 4,557 4,554 4,457 4,441 4,411 -3.2Great Bend 15,901 15,840 15,717 15,535 15,344 -3.5Hays 21,038 21,044 21,092 21,027 20,845 -0.9Haysville 11,004 11,112 11,212 11,245 11,278 2.5
Herington 2,449 2,413 2,396 2,362 2,332 -4.8Hesston 3,736 3,734 3,813 3,803 3,782 1.2Hiawatha 3,178 3,108 3,095 3,065 3,147 -1.0Hillsboro 2,903 2,893 2,869 2,887 2,850 -1.8
Hoisington 2,685 2,664 2,623 2,586 2,559 -4.7Holton 3,278 3,316 3,263 3,285 3,266 -0.4Hugoton 3,979 3,966 3,964 3,835 3,831 -3.7Hutchinson 41,889 41,642 41,569 41,310 40,772 -2.7
Independence 9,230 9,162 8,958 8,799 8,729 -5.4Iola 5,613 5,553 5,470 5,454 5,354 -4.6Junction City 25,388 24,665 24,621 24,180 22,988 -9.5Kansas City 148,483 149,636 151,306 151,709 152,938 3.0
Table B6City Population*
Kansas, 2013-2017
Year

Percent
City of ChangeResidence 2013 2014 2015 2016 2017 2013-2017
Table B6City Population*
Kansas, 2013-2017
Year
Kingman 3,158 3,094 3,086 3,000 2,929 -7.3Lansing 11,642 11,713 11,767 11,849 11,947 2.6Larned 4,046 4,023 3,967 3,900 3,855 -4.7Lawrence 90,811 92,763 93,917 95,358 96,892 6.7
Leavenworth 35,891 36,000 35,980 36,154 36,210 0.9Leawood 32,991 34,395 34,579 34,565 34,659 5.1Lenexa 50,344 51,042 52,490 52,903 53,553 6.4Liberal 20,956 21,012 20,746 20,350 19,826 -5.4
Lindsborg 3,481 3,438 3,383 3,338 3,268 -6.1Louisburg 4,299 4,322 4,276 4,382 4,487 4.4Lyons 3,737 3,737 3,725 3,671 3,565 -4.6McPherson 13,322 13,189 13,144 13,164 13,201 -0.9
Maize 3,823 4,073 4,362 4,438 4,557 19.2Manhattan 56,143 56,078 56,308 54,983 54,832 -2.3Marysville 3,295 3,295 3,323 3,294 3,271 -0.7Merriam 11,281 11,290 11,288 11,245 11,212 -0.6
Mission 9,516 9,501 9,491 9,443 9,409 -1.1Mission Hills 3,582 3,597 3,601 3,600 3,573 -0.3Mulvane 6,287 6,289 6,314 6,316 6,359 1.1Newton 19,117 19,120 19,216 19,105 18,869 -1.3
Norton 2,880 2,846 2,841 2,812 2,775 -3.6Olathe 131,885 133,062 134,305 135,473 137,472 4.2Osage City 2,899 2,862 2,844 2,837 2,796 -3.6Osawatomie 4,385 4,357 4,297 4,308 4,298 -2.0
Ottawa 12,482 12,403 12,387 12,356 12,342 -1.1Overland Park 181,260 184,525 186,515 188,966 191,278 5.5Paola 5,630 5,593 5,527 5,568 5,580 -0.9Park City 7,499 7,556 7,618 7,632 7,729 3.1
Parsons 10,164 10,174 10,090 9,906 9,761 -4.0Phillipsburg 2,541 2,556 2,524 2,543 2,512 -1.1Pittsburg 20,398 20,394 20,409 20,366 20,216 -0.9Prairie Village 21,892 21,877 21,877 21,805 22,368 2.2
Pratt 6,986 6,963 6,849 6,771 6,748 -3.4Roeland Park 6,845 6,840 6,827 6,786 6,772 -1.1Rose Hill 3,942 3,960 3,995 4,015 3,980 1.0Russell 4,475 4,484 4,534 4,500 4,463 -0.3
Sabetha 2,568 2,564 2,585 2,584 2,569 0.0St Marys 2,677 2,664 2,662 2,664 2,645 -1.2Salina 47,846 47,867 47,813 47,336 46,994 -1.8Scott City 3,889 3,927 3,838 3,890 3,851 -1.0
Shawnee 64,323 64,599 65,046 65,194 65,513 1.9Spring Hill 5,730 5,896 5,981 6,166 6,618 15.5Tonganoxie 5,165 5,192 5,248 5,326 5,444 5.4Topeka 127,679 127,215 127,265 126,808 126,587 -0.9
Ulysses 6,274 6,160 6,097 6,035 5,912 -5.8Valley Center 7,011 7,057 7,222 7,343 7,300 4.1Wamego 4,603 4,578 4,627 4,715 4,703 2.2
Wellington 7,967 7,942 7,987 7,889 7,822 -1.8Wichita 386,552 388,413 389,965 389,902 390,591 1.0Winfield 12,333 12,258 12,204 12,284 12,104 -1.9
* Includes cities with populations of 2,500 or more as reported by the 2010 U.S. Census. Source: U.S. Bureau of the Census.

C. LIVE BIRTHS AND FERTILITY

Year Kansas U.S. Year Kansas
1912 22.8 29.8 1965 17.8 19.4
1913 21.0 29.5 1966 16.3 18.4
1914 21.2 29.9 1967 15.6 17.8
1915 22.2 29.5 1968 15.7 17.6
1916 24.0 29.1 1969 16.3 17.9
1917 22.2 28.5 1970 17.0 18.4
1918 22.1 28.2 1971 16.0 17.2
1919 20.4 26.1 1972 14.6 15.6
1920 22.7 27.7 1973 13.9 14.8
1921 23.7 28.1 1974 14.2 14.8
1922 21.9 26.2 1975 14.6 14.6
1923 21.8 26.0 1976 15.2 14.6
1924 20.9 26.1 1977 15.7 15.1
1925 20.8 25.1 1978 15.5 15.0
1926 19.6 24.2 1979 16.5 15.6
1927 19.2 23.5 1980 17.2 15.9
1928 18.4 22.2 1981 17.3 15.8
1929 17.7 21.2 1982 16.9 15.9
1930 18.4 21.3 1983 16.6 15.6
1931 18.2 20.2 1984 16.4 15.6
1932 17.5 19.5 1985 16.1 15.8
1933 17.0 18.4 1986 15.9 15.6
1934 17.8 19.0 1987 15.5 15.7
1935 16.5 18.7 1988 15.5 16.0
1936 16.3 18.4 1989 15.4 16.4
1937 16.0 18.7 1990 15.7 16.7
1938 16.4 19.2 1991 15.1 16.3
1939 16.2 18.8 1992 15.0 15.9
1940 16.2 19.4 1993 14.7 15.5
1941 17.3 20.3 1994 14.6 15.2
1942 19.4 22.2 1995 14.5 14.8
1943 20.0 22.7 1996 14.2 14.7
1944 19.4 21.2 1997 14.3 14.5
1945 17.5 20.4 1998 14.6 14.6
1946 21.7 24.1 1999 14.6 14.5
1947 24.3 26.6 2000 14.7 14.7
1948 22.7 24.9 2001 14.4 14.1
1949 22.9 24.5 2002 14.5 13.9
1950 23.1 24.1 2003 14.4 14.1
1951 24.4 24.9 2004 14.5 14.0
1952 25.2 25.1 2005 14.5 14.0
1953 26.4 25.1 2006 14.8 14.2
1954 26.8 25.3 2007 15.1 14.3
1955 25.8 25.0 2008 14.9 13.9
1956 25.5 25.2 2009 14.7 13.5
1957 25.5 25.3 2010 14.2 13.0
1958 24.6 24.5 2011 13.8 12.7
1959 24.8 24.2 2012 14.0 12.6
1960 23.8 23.7 2013 13.4 12.5
1961 23.3 23.3 2014 13.5 12.5
1962 22.5 22.4 2015 13.4 12.4
1963 21.2 21.7 2016 13.1 12.2
1964 19.9 21.1 2017 12.5
*Rate per 1,000 population†1912-1933 Occurrence data
1934-2017 Residence data
U.S.
Table C1Birth Rates*
Kansas† and the U.S., 1912-2017
Birth Rates Birth Rates

*1912-1934 Occurrence data
1935-2017 Residence data
Figure C1
Figure C2
0
5
10
15
20
25
30
1912 1922 1932 1942 1952 1962 1972 1982 1992 2002 2012
Ra
te p
er
1,0
00
po
pu
latio
n
Year
Birth RatesKansas and the U.S., 1912-2017
Kansas *
U.S.
0
20
40
60
80
100
120
1998 2001 2004 2007 2010 2013 2016
Ra
te p
er
1,0
00
fem
ale
s 1
5-4
4
Year
Fertility Rates*Kansas and the U.S., 1998-2017
Kansas
U.S.

Percent
Change
Age-Group 1998 1999 2000 2001 2002 2003 2004 2005 2006 2007 2008 2009 2010 2011 2012 2013 2014 2015 2016 2017 1998-2017
Total 67.0 67.4 69.1 67.7 68.6 69.2 69.6 70.0 73.2 75.5 75.4 74.6 72.7 71.2 72.2 69.5 69.9 69.9 68.1 65.3 -2.5
15-24 79.5 80.0 82.5 79.1 77.2 75.2 74.9 76.6 78.4 80.2 81.0 76.1 74.0 69.3 68.0 62.2 59.8 58.2 54.1 50.5 -36.5
25-34 108.8 111.2 113.3 111.9 114.2 115.5 115.2 112.5 119.8 121.7 121.7 120.4 115.4 115.0 117.5 115.8 119.5 120.2 118.8 115.3 6.0
35-44 20.4 20.4 20.8 20.2 21.1 22.3 22.8 23.2 24.1 24.9 24.9 24.7 25.2 24.6 26.4 26.1 26.6 27.7 28.5 28.1 37.7
*Rate per 1,000 female age-group population
Table C2Age-Specific Fertility Rates*
by Age-Group of MotherKansas, 1998-2017
Year
0.0
20.0
40.0
60.0
80.0
100.0
120.0
140.0
15-24 25-34 35-44
Rat
e pe
r 1,
000
fem
ale
age-
grou
p po
pula
tion
Age-Group
Age-Specific Fertility Rates by Year by Age-Group of Mother*Kansas, 2013-2017
2013
2014
2015
2016
2017
Figure C3

Age-Group
of Mother Number Percent Male Female
Total* 36,464 100 18,860 17,604
Under 15 13 0.0 4 9
15-17 458 1.3 229 229
18-19 1,595 4.4 851 744
20-24 7,984 21.9 4,120 3,864
25-29 11,496 31.5 5,926 5,570
30-34 10,003 27.4 5,200 4,803
35-39 4,159 11.4 2,155 2,004
40-44 711 1.9 355 356
45 & Over 44 0.1 20 24
n.s. 1 n/a 0 1
Age-Group Under 45 &
of Father Total 18 10-14 15-19 20-24 25-29 30-34 35-39 40-44 Over n.s.
Total.. 36,464 471 13 2,053 7,984 11,496 10,003 4,159 711 44 1
Under 18..... 175 105 4 157 14 0 0 0 0 0 0
10-14 2 2 0 2 0 0 0 0 0 0 0
15-19 806 227 5 605 177 15 3 1 0 0 0
20-24 4,853 67 0 789 3,322 623 92 25 2 0 0
25-29 9,168 11 1 136 2,497 5,422 958 144 9 1 0
30-34 10,002 3 0 41 647 3,362 5,175 717 59 1 0
35-39 5,681 0 0 8 177 845 2,525 1,976 145 4 1
40-44 1,880 1 0 5 56 192 574 778 269 6 0
45 & Over 847 0 0 7 34 105 203 291 176 31 0
n.s. 3,225 160 7 460 1,074 932 473 227 51 1 0
Table C3Live Births by Age-Group of Mother by Sex of Infant
Kansas, 2017
Total Sex
Age-Group of Mother
Table C4Live Births by Age-Group of Father by Age-Group of Mother
Kansas, 2017

500 1,000 % Under 1,500 2,000 % Under 2,500 3,000 3,500 4,000 4,500 5,000
Age-Group Under - - 1500 gr - - 2500 gr - - - - - &
of Mother Total 500 999 1,499 (VLBW) 1,999 2,499 (LBW) 2,999 3,499 3,999 4,499 4,999 Over n.s.
Total 36,464 75 164 251 1.3 542 1,665 7.4 6,256 13,923 10,404 2,775 355 45 9
10-14 13 0 0 0 0.0 3 0 23.1 2 6 2 0 0 0 0
15-19 2,053 7 17 25 2.4 44 110 9.9 462 819 463 95 9 1 1
20-24 7,984 12 36 51 1.2 110 404 7.7 1622 3,212 2,031 452 49 5 0
25-29 11,496 32 49 72 1.3 164 493 7.0 1897 4,467 3,374 832 102 10 4
30-34 10,003 16 35 55 1.1 128 405 6.4 1490 3663 3144 936 116 15 0
35-39 4,159 5 23 43 1.7 81 199 8.4 640 1488 1197 403 66 12 2
40-44 711 3 3 4 1.4 11 46 9.4 133 257 187 51 13 1 2
45 & Over 44 0 1 1 4.5 1 8 25.0 10 11 6 5 0 1 0
n.s. 1 0 0 0 n/a 0 0 n/a 0 0 0 1 0 0 0
Birth Weight in Grams
Table C5Live Births by Age-Group of Mother by Birth Weight in Grams
Kansas, 2017

* Sum of prior live births plus current birth.
Figure C4
Age-Group of Mother
Under 45 &
Birth Order Total 18 10-14 15-19 20-24 25-29 30-34 35-39 40-44 Over n.s.
Total 36,464 471 13 2,053 7,984 11,496 10,003 4,159 711 44 1
First 12,848 437 12 1,685 3,938 4,070 2,346 681 106 10 0
Second 11,382 34 1 322 2,685 3,711 3,339 1,147 171 6 0
Third 6,867 0 0 41 1,009 2,221 2,361 1,093 135 6 1
Fourth 3,154 0 0 2 280 970 1,150 645 99 8 0
Fifth 1,201 0 0 1 54 340 439 286 78 3 0
Sixth 567 0 0 0 11 123 216 172 43 2 0
Seventh 216 0 0 1 6 45 75 65 24 0 0
Eighth 114 0 0 0 1 10 47 36 18 2 0
Ninth 64 0 0 0 0 3 23 18 16 4 0
Tenth & Over 50 0 0 0 0 3 7 16 21 3 0
n.s. 1 0 0 1 0 0 0 0 0 0 0
Live Births by Birth Order*Kansas, 2017
Table C6Live Births by Birth Order by Age-Group of Mother
Kansas, 2017
12,848
11,382
6,867
3,154
1,201567
216 114 64 50 10
2,000
4,000
6,000
8,000
10,000
12,000
14,000
1st 2nd 3rd 4th 5th 6th 7th 8th 9th 10th &Over
n.s.
Nu
mbe
r
Birth Order

Population
Group of Mother Total Number Percent Number Percent Number Percent Number Percent n.s.
Total 36,464 29,473 81.2 5,379 14.8 1,113 3.1 342 0.9 157
White Non-Hispanic 25,431 21,532 85.0 3,085 12.2 551 2.2 169 0.7 94
Black Non-Hispanic 2,463 1,767 72.1 516 21.0 124 5.1 45 1.8 11
Native American Non-Hispanic 168 110 65.5 44 26.2 6 3.6 8 4.8 0
Asian/Pacific Islander Non-Hispanic 1,255 997 79.8 201 16.1 40 3.2 12 1.0 5
Other/Multi-Race Non-Hispanic 1,177 887 76.3 217 18.7 50 4.3 9 0.8 14
Hispanic 5,945 4,170 70.5 1,308 22.1 339 5.7 99 1.7 29
n.s. 25 10 47.6 8 38.1 3 14.3 0 0.0 4
None
Table C7Live Births by Population Group of Mother
by Trimester Prenatal Care BeganKansas, 2017
1st 2nd 3rd
Trimester Care Began

500 1,000 % Under 1,500 2,000 % Under 2,500 3,000 3,500 4,000 4,500 5,000
Population Group Under - - 1500 gr - - 2500 gr - - - - - &of Mother Total 500 999 1,499 (VLBW) 1,999 2,499 (LBW) 2,999 3,499 3,999 4,499 4,999 Over n.s.
Total 36,464 75 164 251 1.3 542 1,665 7.4 6,256 13,923 10,404 2,775 355 45 9
White Non-Hispanic 25,431 34 107 165 1.2 340 1,052 6.7 3,956 9,535 7,801 2,128 275 32 6
Black Non-Hispanic 2,463 19 24 34 3.1 70 205 14.3 672 915 405 105 13 1 0
Native American Non-Hispanic 168 1 0 4 3.0 0 6 6.5 24 59 52 18 4 0 0
Asian/Pacific Islander Non-Hispanic 1,255 2 6 1 0.7 18 73 8.0 289 535 269 55 5 2 0
Other/Multi-Race Non-Hispanic 1,177 2 5 18 2.1 32 70 10.8 237 430 300 74 9 0 0
Hispanic 5,945 17 22 29 1.1 82 258 6.9 1,076 2,437 1,572 393 49 10 0
n.s. 25 0 0 0 0.0 0 1 4.5 2 12 5 2 0 0 3
Live Births by Population Group of Mother by Birth Weight in GramsKansas, 2017
Birth Weight in Grams
Table C8

Percent
Population Group Vaginal, Vaginal, Vaginal, Percent Cesarean, Cesarean, no Cesarean, Percent Cesareanof Mother Total Spontaneous Forceps Vacuum Vaginal Trial of Labor Trial of Labor Trial N.S. Cesarean w/ Trial n.s.
Total 36,464 24,565 227 747 70.0 3,383 7,538 1 30.0 31.0 3
White Non-Hispanic 25,431 17,050 177 524 69.8 2,351 5,328 1 30.2 30.6 0
Black Non-Hispanic 2,463 1,560 8 40 65.3 309 546 0 34.7 36.1 0
Native American Non-Hispanic 168 110 1 3 67.9 11 43 0 32.1 20.4 0
Asian/Pacific Islander Non-Hispanic 1,255 836 7 44 70.7 128 240 0 29.3 34.8 0
Other/Multi-Race Non-Hispanic 1,177 817 6 29 72.4 93 232 0 27.6 28.6 0
Hispanic 5,945 4,179 27 107 72.5 487 1,145 0 27.5 29.8 0
n.s. 25 13 1 0 63.6 4 4 0 36.4 50.0 3
Table C9Live Births by Population Group of Mother by Final Route of Delivery
Kansas, 2017
Final Route of Delivery

County of 5-Year
Residence Number Rate Number Rate Number Rate Number Rate Number Rate Rate
Kansas 38,805 13.4 39,193 13.5 39,126 13.4 38,048 13.1 36,464 12.5 13.2
Allen 143 10.9 157 12.2 144 11.3 137 10.8 140 11.2 11.3
Anderson 94 11.9 104 13.2 84 10.8 111 14.2 104 13.3 12.7
Atchison 191 11.4 205 12.4 208 12.7 203 12.4 174 10.7 11.9
Barber 60 12.1 63 12.9 59 12.2 56 11.9 55 12.0 12.2
Barton 350 12.7 340 12.4 362 13.4 331 12.4 284 10.7 12.3
Bourbon 218 14.7 228 15.4 211 14.3 194 13.3 180 12.2 14.0
Brown 139 13.9 119 12.1 133 13.6 112 11.6 130 13.5 12.9
Butler 751 11.4 749 11.3 744 11.1 757 11.3 763 11.4 11.3
Chase 26 9.6 30 11.1 24 9.0 32 12.0 19 7.1 9.8
Chautauqua 34 9.6 32 9.2 42 12.3 28 8.3 30 8.9 9.7
Cherokee 219 10.4 239 11.5 252 12.3 217 10.7 212 10.5 11.1
Cheyenne 27 10.0 30 11.1 39 14.6 39 14.7 30 11.2 12.3
Clark 20 9.1 18 8.4 25 11.9 24 11.6 22 11.0 10.4
Clay 113 13.4 108 13.0 89 10.7 117 14.4 91 11.4 12.6
Cloud 103 11.1 102 10.9 127 13.8 91 9.9 109 12.1 11.6
Coffey 94 11.2 87 10.3 76 9.1 95 11.3 94 11.4 10.6
Comanche 21 10.7 24 12.3 21 11.4 13 7.0 18 10.1 10.3
Cowley 456 12.6 459 12.8 445 12.4 397 11.1 415 11.7 12.1
Crawford 489 12.4 560 14.3 477 12.2 480 12.3 460 11.8 12.6
Decatur 33 11.3 36 12.4 34 11.6 31 10.9 33 11.4 11.5
Dickinson 218 11.1 222 11.4 236 12.2 225 11.8 208 11.0 11.5
Doniphan 81 10.3 63 8.0 97 12.4 74 9.7 69 8.9 9.9
Douglas 1,219 10.7 1,216 10.4 1,327 11.2 1,177 9.9 1,134 9.4 10.3
Edwards 32 10.9 39 12.9 29 9.8 31 10.6 23 8.0 10.4
Elk 27 10.2 33 12.2 21 8.1 35 13.7 24 9.6 10.8
Ellis 360 12.4 336 11.6 364 12.5 357 12.4 299 10.4 11.9
Ellsworth 52 8.1 55 8.6 65 10.2 63 10.0 58 9.2 9.2
Finney 656 17.7 690 18.6 725 19.5 655 17.8 625 16.9 18.1
Ford 681 19.6 663 19.1 649 18.8 646 19.0 589 17.1 18.7
Franklin 332 12.9 313 12.2 320 12.5 298 11.7 305 11.9 12.2
Geary 1,029 27.5 1,052 28.7 1,118 30.2 967 27.2 890 26.3 28.0
Gove 30 10.8 42 15.4 37 14.0 40 15.4 31 11.8 13.5
Graham 24 9.3 24 9.4 21 8.1 20 7.8 21 8.4 8.6
Grant 123 15.5 132 16.9 121 15.6 123 16.1 113 15.0 15.8
Gray 103 17.1 81 13.3 81 13.2 86 14.3 88 14.8 14.5
Greeley 25 19.4 19 14.6 16 12.0 15 11.6 25 20.0 15.5
Greenwood 62 9.7 66 10.4 69 11.1 67 10.9 57 9.3 10.3
Hamilton 37 14.2 43 16.5 34 13.7 37 14.6 31 11.7 14.2
Harper 83 14.2 86 14.8 80 13.8 65 11.4 64 11.4 13.1
Harvey 445 12.8 414 11.9 411 11.7 379 10.9 379 11.0 11.6
Haskell 52 12.6 49 11.9 56 13.8 55 13.7 46 11.3 12.7
Hodgeman 21 10.8 25 13.0 14 7.4 23 12.3 17 9.2 10.6
Jackson 156 11.7 171 12.6 172 12.9 169 12.7 180 13.5 12.7
Jefferson 195 10.4 177 9.4 184 9.7 202 10.7 178 9.4 9.9
Jewell 27 8.9 33 10.8 31 10.4 36 12.4 31 10.9 10.7
Johnson 7,320 12.9 7,394 12.9 7,528 13.0 7,350 12.6 7,207 12.2 12.7
Kearny 63 16.1 62 15.8 63 15.9 61 15.6 65 16.4 16.0
Kingman 90 11.5 73 9.5 98 12.7 74 9.9 72 9.8 10.7
Kiowa 39 15.5 28 11.1 37 14.4 37 14.9 32 12.9 13.8
Labette 270 12.9 264 12.6 257 12.4 293 14.3 260 12.9 13.0
Lane 23 13.4 19 11.3 13 7.8 16 9.8 15 9.6 10.4
Leavenworth 955 12.2 987 12.5 1,013 12.8 999 12.5 951 11.7 12.3
Lincoln 25 7.9 34 10.7 28 9.0 37 12.0 22 7.2 9.4
Linn 91 9.6 111 11.7 109 11.4 95 9.9 99 10.2 10.6
Logan 33 11.8 37 13.2 43 15.2 54 19.1 39 13.8 14.6
2014 20162013
Year
2017
Table C10
Live Births by County of Residence and Peer Group*
by Number and Rate†
2015
Kansas, 2013-2017

County of 5-Year
Residence Number Rate Number Rate Number Rate Number Rate Number Rate Rate
2014 20162013
Year
2017
Table C10
Live Births by County of Residence and Peer Group*
by Number and Rate†
2015
Kansas, 2013-2017
Lyon 419 12.5 406 12.2 416 12.5 417 12.4 393 11.8 12.3
McPherson 320 10.8 343 11.7 336 11.6 308 10.7 324 11.3 11.2
Marion 109 8.9 130 10.6 109 9.0 118 9.7 113 9.4 9.6
Marshall 125 12.5 123 12.3 138 13.9 112 11.4 121 12.4 12.5
Meade 69 15.9 56 12.9 68 15.7 54 12.8 44 10.2 13.5
Miami 297 9.0 410 12.5 354 10.9 345 10.5 387 11.6 10.9
Mitchell 72 11.3 92 14.6 77 12.3 84 13.5 74 12.1 12.7
Montgomery 427 12.5 453 13.3 447 13.4 385 11.8 350 10.8 12.3
Morris 59 10.3 62 10.9 54 9.6 63 11.3 72 13.2 11.0
Morton 37 11.8 40 12.9 24 8.0 25 8.8 45 16.4 11.5
Nemaha 154 15.2 157 15.5 146 14.3 140 13.7 151 14.9 14.7
Neosho 204 12.4 218 13.3 189 11.6 217 13.4 196 12.2 12.6
Ness 33 10.7 38 12.2 33 11.0 37 12.5 15 5.2 10.4
Norton 51 9.1 57 10.3 61 11.0 66 12.0 50 9.2 10.3
Osage 150 9.3 174 10.9 158 10.0 183 11.6 171 10.8 10.5
Osborne 50 13.1 46 12.2 49 13.3 40 11.0 45 12.5 12.4
Ottawa 58 9.6 50 8.2 60 10.0 61 10.3 44 7.5 9.1
Pawnee 63 9.0 64 9.3 67 9.8 64 9.5 81 12.1 9.9
Phillips 65 11.7 73 13.2 50 9.2 68 12.5 49 9.1 11.2
Pottawatomie 353 15.6 345 15.1 362 15.5 394 16.7 355 14.8 15.5
Pratt 122 12.4 147 14.9 142 14.7 126 13.1 104 10.9 13.2
Rawlins 22 8.5 34 13.2 26 10.4 34 13.3 33 13.2 11.7
Reno 743 11.6 737 11.6 683 10.7 683 10.8 693 11.1 11.1
Republic 49 10.2 52 10.8 49 10.4 43 9.2 60 12.8 10.7
Rice 128 12.8 125 12.5 132 13.2 110 11.2 103 10.7 12.1
Riley 999 13.3 1,073 14.3 1,017 13.5 976 13.3 883 11.9 13.3
Rooks 60 11.6 59 11.4 58 11.2 68 13.4 52 10.3 11.6
Rush 30 9.4 21 6.6 37 11.8 40 13.1 31 10.0 10.1
Russell 94 13.6 82 11.8 74 10.5 81 11.6 73 10.6 11.6
Saline 772 13.9 752 13.5 729 13.1 662 12.0 702 12.8 13.1
Scott 61 12.1 73 14.4 51 10.3 63 12.5 57 11.5 12.2
Sedgwick 7,487 14.8 7,358 14.5 7,284 14.2 7,309 14.3 6,907 13.4 14.2
Seward 441 18.9 444 18.9 428 18.5 429 18.9 419 18.9 18.8
Shawnee 2,352 13.2 2,340 13.1 2,269 12.7 2,189 12.3 2,065 11.6 12.6
Sheridan 31 12.1 24 9.5 28 11.1 33 13.2 29 11.5 11.5
Sherman 80 13.1 82 13.4 84 14.0 73 12.2 73 12.3 13.0
Smith 28 7.6 28 7.4 50 13.5 40 11.0 43 11.7 10.2
Stafford 49 11.2 54 12.6 55 13.0 53 12.6 54 12.8 12.4
Stanton 38 17.3 26 12.3 39 18.8 25 12.1 28 13.6 14.9
Stevens 99 17.0 67 11.5 77 13.3 74 13.3 69 12.3 13.5
Sumner 272 11.5 252 10.7 290 12.3 255 11.0 262 11.3 11.4
Thomas 98 12.3 138 17.5 107 13.5 119 15.1 120 15.4 14.8
Trego 33 11.1 36 12.4 46 15.7 28 9.7 27 9.4 11.7
Wabaunsee 98 13.9 70 10.0 90 12.9 67 9.7 77 11.2 11.6
Wallace 23 14.7 16 10.6 20 13.2 23 15.4 18 11.8 13.1
Washington 79 14.0 66 11.8 86 15.4 67 12.1 76 13.9 13.4
Wichita 25 11.4 28 12.9 20 9.3 21 9.9 30 14.1 11.5
Wilson 109 12.0 109 12.1 98 11.1 114 13.1 113 13.0 12.2
Woodson 29 9.0 35 11.1 31 10.0 38 12.0 34 10.8 10.6
Wyandotte 2,678 16.7 2,785 17.2 2,763 16.9 2,694 16.4 2,539 15.4 16.5
n.s. 1 N/A 0 N/A 2 N/A 4 N/A 0 N/A N/A
Peer Group
Frontier 1,297 11.5 1,325 11.9 1,337 12.1 1,326 12.2 1,207 11.2 11.8
Rural 2,859 12.1 2,879 12.3 2,818 12.1 2,765 11.9 2,709 11.8 12.0
Densely -Settled Rural 6,353 13.3 6,396 13.5 6,485 13.7 6,303 13.4 5,933 12.7 13.3
Semi-Urban 6,284 13.5 6,513 14.0 6,300 13.6 5,932 12.9 5,812 12.7 13.3
Urban 22,011 13.7 22,080 13.6 22,184 13.6 21,718 13.3 20,803 12.6 13.4
* See Technical Notes for Peer Group definition.† Rate per 1,000 population.


County of 45 &
Residence Total 10-14 15-19 20-24 25-29 30-34 35-39 40-44 Over n.s.
Kansas 36,464 13 2,053 7,984 11,496 10,003 4,159 711 44 1
Allen 140 0 12 37 64 21 6 0 0 0
Anderson 104 0 7 24 37 21 12 3 0 0
Atchison 174 0 12 50 54 38 19 1 0 0
Barber 55 0 2 13 24 10 5 1 0 0
Barton 284 0 22 72 103 56 28 3 0 0
Bourbon 180 0 15 56 68 28 12 1 0 0
Brown 130 0 14 31 46 36 3 0 0 0
Butler 763 0 50 146 257 223 80 6 1 0
Chase 19 0 0 7 3 6 1 2 0 0
Chautauqua 30 0 2 8 13 5 2 0 0 0
Cherokee 212 0 18 83 52 40 17 2 0 0
Cheyenne 30 0 0 7 14 6 3 0 0 0
Clark 22 0 1 3 8 3 5 2 0 0
Clay 91 0 3 20 30 31 7 0 0 0
Cloud 109 0 10 38 38 14 9 0 0 0
Coffey 94 0 5 17 44 22 5 1 0 0
Comanche 18 0 1 5 5 6 1 0 0 0
Cowley 415 0 34 129 139 82 25 6 0 0
Crawford. 460 0 27 126 150 101 45 11 0 0
Decatur 33 0 2 10 9 10 2 0 0 0
Dickinson 208 0 8 53 68 57 20 2 0 0
Doniphan 69 0 1 19 26 17 6 0 0 0
Douglas 1,134 0 50 176 336 359 189 22 2 0
Edwards 23 0 1 8 4 6 2 2 0 0
Elk 24 0 1 8 5 9 1 0 0 0
Ellis 299 0 17 61 103 89 28 1 0 0
Ellsworth 58 0 2 14 21 17 3 1 0 0
Finney 625 3 48 177 188 129 69 9 2 0
Ford 589 0 63 160 165 136 53 12 0 0
Franklin 305 0 29 82 106 57 26 5 0 0
Geary 890 0 63 293 295 166 64 9 0 0
Gove 31 0 0 6 14 7 3 1 0 0
Graham 21 0 0 11 5 4 1 0 0 0
Grant 113 0 9 23 45 24 10 2 0 0
Gray 88 0 2 17 33 21 14 1 0 0
Greeley 25 0 3 6 5 7 3 1 0 0
Greenwood 57 0 4 23 8 16 6 0 0 0
Hamilton 31 0 1 13 9 5 2 1 0 0
Harper 64 0 8 16 20 16 3 1 0 0
Harvey 379 0 32 75 141 87 37 7 0 0
Haskell 46 0 2 17 11 11 4 1 0 0
Hodgeman 17 0 0 5 7 5 0 0 0 0
Jackson 180 0 14 52 63 32 17 2 0 0
Jefferson 178 0 12 43 68 39 15 1 0 0
Jewell 31 0 0 6 12 9 4 0 0 0
Johnson 7,207 0 134 754 1,990 2,830 1,283 202 14 0
Kearny 65 0 2 14 29 12 7 1 0 0
Kingman 72 0 2 20 25 13 9 3 0 0
Kiowa 32 0 2 4 17 9 0 0 0 0
Labette 260 0 21 74 89 58 14 4 0 0
Lane 15 0 0 2 9 4 0 0 0 0
Leavenworth 951 0 47 203 280 295 105 21 0 0
Lincoln 22 0 0 6 7 6 3 0 0 0
Linn 99 0 6 24 36 22 9 2 0 0
Logan 39 0 1 14 13 8 3 0 0 0
Age-Group of Mother
Table C11Live Births by County of Residence and Peer Group*
by Age-Group of MotherKansas, 2017

County of 45 &
Residence Total 10-14 15-19 20-24 25-29 30-34 35-39 40-44 Over n.s.
Age-Group of Mother
Table C11Live Births by County of Residence and Peer Group*
by Age-Group of MotherKansas, 2017
Lyon 393 0 25 109 123 88 40 7 1 0
McPherson 324 0 10 77 119 91 22 4 1 0
Marion 113 0 5 28 36 31 10 3 0 0
Marshall 121 0 1 28 43 35 10 3 1 0
Meade 44 0 1 11 10 13 8 1 0 0
Miami 387 0 30 87 124 101 38 6 1 0
Mitchell 74 0 2 11 27 22 8 4 0 0
Montgomery 350 0 22 112 122 70 21 3 0 0
Morris 72 0 3 17 24 19 7 2 0 0
Morton 45 1 5 10 13 13 3 0 0 0
Nemaha 151 0 7 26 64 40 9 5 0 0
Neosho 196 0 16 74 46 43 15 1 1 0
Ness 15 0 0 6 4 3 2 0 0 0
Norton 50 0 2 19 23 3 3 0 0 0
Osage 171 0 11 42 57 43 14 4 0 0
Osborne 45 0 2 9 14 15 4 1 0 0
Ottawa 44 0 0 6 17 16 3 2 0 0
Pawnee 81 0 6 22 25 21 6 1 0 0
Phillips 49 0 1 10 15 18 4 1 0 0
Pottawatomie 355 0 8 46 127 114 46 12 2 0
Pratt 104 0 7 25 37 24 11 0 0 0
Rawlins 33 0 1 9 10 8 4 0 1 0
Reno 693 0 54 173 242 151 59 12 2 0
Republic 60 0 2 17 21 17 2 1 0 0
Rice 103 0 9 29 34 23 8 0 0 0
Riley 883 0 44 216 267 257 81 16 2 0
Rooks 52 0 4 8 19 13 8 0 0 0
Rush 31 0 1 8 11 8 3 0 0 0
Russell 73 0 3 17 24 23 4 2 0 0
Saline 702 0 41 174 240 179 57 11 0 0
Scott 57 0 2 15 20 17 3 0 0 0
Sedgwick 6,907 5 474 1,611 2,197 1,720 743 148 8 1
Seward 419 0 36 134 122 80 41 6 0 0
Shawnee 2,065 0 133 512 638 526 218 37 1 0
Sheridan 29 0 2 2 13 7 4 1 0 0
Sherman 73 0 4 17 24 19 9 0 0 0
Smith 43 0 3 7 17 10 5 1 0 0
Stafford 54 0 1 12 27 9 4 1 0 0
Stanton 28 0 2 8 6 9 2 1 0 0
Stevens 69 0 3 19 23 13 10 1 0 0
Sumner 262 0 14 73 96 62 15 1 1 0
Thomas 120 0 6 27 47 30 9 1 0 0
Trego 27 0 3 7 7 8 2 0 0 0
Wabaunsee 77 0 3 17 22 24 10 1 0 0
Wallace 18 0 0 3 10 3 1 1 0 0
Washington 76 0 1 12 26 25 11 1 0 0
Wichita 30 0 1 4 19 6 0 0 0 0
Wilson. 113 0 9 33 33 27 7 4 0 0
Woodson 34 0 4 11 7 9 2 1 0 0
Wyandotte 2,539 4 207 673 793 556 253 50 3 0
n.s. 0 0 0 0 0 0 0 0 0 0
Peer Group
Frontier 1,207 1 53 300 424 297 113 18 1 0
Rural 2,709 0 146 650 954 685 225 48 1 0
Densely -Settled Rural 5,933 3 417 1,621 1,940 1,343 522 79 8 0
Semi-Urban 5,812 0 392 1,484 1,944 1,392 508 86 6 0
Urban 20,803 9 1,045 3,929 6,234 6,286 2,791 480 28 1

County of 19 & 42 &Residence Total Under 20-22 23-27 28-31 32-35 36 37-38 39 40-41 Over n.s.
Kansas 36,464 25 37 189 331 1,498 1,412 9,345 14,406 9,104 93 24 9.6
Allen 140 0 0 0 1 4 5 41 54 34 1 0 7.1
Anderson 104 0 0 1 0 9 1 26 41 26 0 0 10.6
Atchison 174 0 0 0 0 7 6 43 73 44 1 0 7.5
Barber 55 0 0 0 2 0 3 12 24 14 0 0 9.1
Barton 284 0 0 1 2 10 6 85 131 49 0 0 6.7
Bourbon 180 0 0 1 2 2 10 54 82 28 1 0 8.3
Brown 130 0 2 1 0 2 4 34 51 36 0 0 6.9
Butler 763 0 1 6 7 35 24 198 304 185 2 1 9.6
Chase 19 0 0 0 0 0 1 6 8 4 0 0 5.3
Chautauqua 30 0 0 0 0 2 2 14 6 6 0 0 13.3
Cherokee 212 0 0 1 2 12 12 56 91 38 0 0 12.7
Cheyenne 30 0 0 0 0 0 4 7 12 6 1 0 13.3
Clark 22 0 0 0 0 0 0 5 9 8 0 0 0.0
Clay 91 0 0 0 1 1 3 21 47 18 0 0 5.5
Cloud 109 0 0 0 1 2 6 33 36 29 2 0 8.3
Coffey 94 0 0 0 1 5 3 19 45 21 0 0 9.6
Comanche 18 0 0 0 0 0 2 4 6 6 0 0 11.1
Cowley 415 1 2 4 3 27 22 130 141 83 2 0 14.2
Crawford 460 0 1 5 1 27 12 160 174 79 1 0 10.0
Decatur 33 0 0 0 0 0 1 5 18 9 0 0 3.0
Dickinson 208 0 2 0 2 9 7 50 96 42 0 0 9.6
Doniphan 69 0 0 2 0 1 1 14 26 25 0 0 5.8
Douglas 1,134 2 0 2 16 39 59 265 466 281 3 1 10.4
Edwards 23 0 0 0 0 1 0 5 14 3 0 0 4.3
Elk 24 0 0 0 0 2 1 4 11 6 0 0 12.5
Ellis 299 0 0 0 6 11 9 74 123 76 0 0 8.7
Ellsworth 58 0 1 0 0 0 2 20 24 10 1 0 5.2
Finney 625 0 1 3 1 30 21 157 265 145 2 0 9.0
Ford 589 0 0 2 3 21 10 122 328 99 4 0 6.1
Franklin 305 0 0 1 4 11 7 64 129 89 0 0 7.5
Geary 890 0 1 8 8 39 32 231 326 242 3 0 9.9
Gove 31 0 0 0 1 0 2 10 11 7 0 0 9.7
Graham 21 0 0 0 0 1 0 9 6 5 0 0 4.8
Grant 113 0 0 0 0 3 3 30 53 24 0 0 5.3
Gray 88 0 0 0 0 3 2 17 48 18 0 0 5.7
Greeley 25 0 0 1 0 0 1 4 10 9 0 0 8.0
Greenwood 57 0 0 0 0 1 2 17 27 10 0 0 5.3
Hamilton 31 0 0 1 0 1 0 8 13 8 0 0 6.5
Harper 64 0 0 0 0 2 4 16 26 16 0 0 9.4
Harvey 379 0 1 1 4 22 8 116 143 84 0 0 9.5
Haskell 46 0 0 0 0 4 1 9 22 10 0 0 10.9
Hodgeman 17 0 0 0 0 0 1 4 9 3 0 0 5.9
Jackson 180 0 0 0 2 8 7 46 73 43 0 1 9.5
Jefferson 178 0 0 1 3 7 7 43 71 46 0 0 10.1
Jewell 31 0 0 0 0 3 0 10 9 9 0 0 9.7
Johnson 7,207 3 6 22 51 277 284 1,726 2,713 2,106 13 6 8.9
Kearny 65 0 0 0 5 1 0 16 28 15 0 0 9.2
Kingman 72 0 0 0 0 3 1 21 34 13 0 0 5.6
Kiowa 32 0 0 0 0 2 0 8 12 10 0 0 6.3Labette 260 0 0 0 1 6 11 58 119 63 0 2 7.0
Lane 15 0 0 0 0 0 0 6 4 5 0 0 0.0
Leavenworth 951 1 2 2 3 31 41 278 363 228 2 0 8.4
Lincoln 22 0 0 0 0 0 1 7 7 6 0 1 4.8
Linn 99 0 0 0 0 0 4 30 49 16 0 0 4.0
Logan 39 0 0 0 3 0 3 9 14 10 0 0 15.4
Percent Premature <37 weeks
Weeks Gestation
Table C12Live Births by County of Residence and Peer Group*
By Weeks GestationKansas, 2017

County of 19 & 42 &Residence Total Under 20-22 23-27 28-31 32-35 36 37-38 39 40-41 Over n.s.
Percent Premature <37 weeks
Weeks Gestation
Table C12Live Births by County of Residence and Peer Group*
By Weeks GestationKansas, 2017
Lyon 393 0 0 1 4 19 10 108 147 101 2 1 8.7
McPherson 324 0 0 1 2 12 19 72 130 87 1 0 10.5
Marion 113 0 0 0 0 4 1 29 50 29 0 0 4.4
Marshall 121 0 1 0 0 1 3 28 57 31 0 0 4.1
Meade 44 0 0 1 0 2 0 8 22 11 0 0 6.8
Miami 387 0 0 0 4 7 12 99 165 99 1 0 5.9
Mitchell 74 1 0 0 0 0 1 19 30 23 0 0 2.7
Montgomery 350 0 0 3 4 5 15 91 152 78 1 1 7.7
Morris 72 0 0 0 0 2 3 20 31 16 0 0 6.9
Morton 45 0 0 0 0 5 1 15 15 9 0 0 13.3
Nemaha 151 0 0 2 0 4 4 24 74 42 1 0 6.6
Neosho 196 0 0 1 3 9 8 51 79 42 2 1 10.8
Ness 15 0 0 0 0 0 0 4 6 5 0 0 0.0
Norton 50 0 0 0 0 0 0 13 22 13 2 0 0.0
Osage 171 0 0 0 2 7 3 31 93 34 0 1 7.1
Osborne 45 0 0 0 0 1 4 12 19 9 0 0 11.1
Ottawa 44 0 0 0 0 1 2 12 19 10 0 0 6.8
Pawnee 81 0 0 0 2 8 2 19 33 16 1 0 14.8
Phillips 49 0 0 0 0 1 1 10 20 16 1 0 4.1
Pottawatomie 355 0 0 2 5 15 8 76 135 114 0 0 8.5
Pratt 104 0 0 2 2 2 0 23 39 34 2 0 5.8
Rawlins 33 0 0 0 3 0 1 11 11 7 0 0 12.1
Reno 693 1 2 4 5 32 27 195 274 149 3 1 10.3
Republic 60 0 0 0 0 0 1 10 26 23 0 0 1.7
Rice 103 1 0 0 1 7 4 26 37 26 1 0 12.6
Riley 883 2 0 2 8 37 30 208 347 243 6 0 8.9
Rooks 52 0 0 1 0 0 2 16 22 11 0 0 5.8
Rush 31 0 0 0 0 3 1 9 11 7 0 0 12.9
Russell 73 0 0 0 0 4 2 17 35 15 0 0 8.2
Saline 702 0 0 13 6 23 39 148 265 204 4 0 11.5
Scott 57 0 0 0 1 3 1 16 25 11 0 0 8.8
Sedgwick 6,907 9 7 58 74 337 298 1,858 2,637 1,613 16 0 11.3
Seward 419 0 0 3 3 16 13 122 158 96 3 5 8.5
Shawnee 2,065 4 5 14 25 93 82 553 846 437 5 1 10.8
Sheridan 29 0 0 0 1 1 2 8 11 6 0 0 13.8
Sherman 73 0 0 0 0 3 6 21 21 22 0 0 12.3
Smith 43 0 0 0 0 2 1 11 17 12 0 0 7.0
Stafford 54 0 0 0 0 1 5 7 29 12 0 0 11.1
Stanton 28 0 0 0 0 3 1 6 14 4 0 0 14.3
Stevens 69 0 0 0 0 1 4 20 25 19 0 0 7.2
Sumner 262 0 0 0 3 8 19 61 122 49 0 0 11.5
Thomas 120 0 0 0 0 6 4 30 52 28 0 0 8.3
Trego 27 0 0 0 0 1 0 9 9 8 0 0 3.7
Wabaunsee 77 0 0 0 1 0 1 17 33 25 0 0 2.6
Wallace 18 0 0 0 0 0 1 2 7 8 0 0 5.6
Washington 76 0 0 0 1 3 2 25 26 19 0 0 7.9
Wichita 30 0 0 1 2 0 0 11 9 7 0 0 10.0
Wilson 113 0 0 2 2 2 4 28 58 17 0 0 8.8
Woodson 34 0 0 0 0 1 0 9 18 5 0 1 3.0
Wyandotte 2,539 0 2 12 31 122 105 670 898 697 2 0 10.7
n.s. 0 0 0 0 0 0 0 0 0 0 0 0 n/a
Peer GroupFrontier 1,207 0 0 5 17 36 49 320 481 297 1 1 8.9Rural 2,709 2 4 8 13 84 74 671 1,186 655 11 1 6.8Densely -Settled Rural 5,933 1 5 23 50 241 214 1,494 2,537 1,338 19 11 9.0Semi-Urban 5,812 3 6 43 51 238 206 1,510 2,279 1,452 21 3 9.4Urban 20,803 19 22 110 200 899 869 5,350 7,923 5,362 41 8 10.2

Month Care Began
% Care 9th
County of in 1st or
Residence Total 1st 2nd 3rd Trimester 4th 5th 6th 7th 8th Later None n.s.
Kansas 36,464 982 14,109 14,382 81.2 3,190 1,413 776 537 375 201 342 157
Allen 140 3 44 63 78.6 14 10 4 0 1 0 1 0
Anderson 104 2 37 45 80.8 11 7 1 1 0 0 0 0
Atchison 174 7 61 66 77.0 20 10 5 2 2 1 0 0
Barber 55 0 21 23 81.5 6 2 1 0 0 1 0 1
Barton 284 10 80 130 77.5 29 12 6 7 3 5 2 0
Bourbon 180 3 75 60 77.1 10 12 5 4 7 2 1 1
Brown 130 4 37 62 79.2 17 6 1 1 2 0 0 0
Butler 763 9 362 269 84.1 62 16 13 15 5 2 8 2
Chase 19 0 7 6 68.4 3 2 1 0 0 0 0 0
Chautauqua 30 4 11 8 76.7 4 0 0 1 1 1 0 0
Cherokee 212 6 68 93 78.8 25 10 2 7 0 0 1 0
Cheyenne 30 3 9 11 76.7 5 1 0 0 1 0 0 0
Clark 22 1 8 8 77.3 3 1 0 0 1 0 0 0
Clay 91 1 18 50 75.8 9 1 2 4 4 1 1 0
Cloud 109 0 39 54 85.3 8 2 4 0 2 0 0 0
Coffey 94 1 41 34 80.9 10 4 1 1 1 1 0 0
Comanche 18 0 0 17 94.4 1 0 0 0 0 0 0 0
Cowley 415 12 199 103 75.8 42 21 8 12 7 5 5 1
Crawford 460 20 158 166 75.3 64 20 13 7 3 3 3 3
Decatur 33 1 12 16 87.9 3 0 1 0 0 0 0 0
Dickinson 208 4 81 88 84.4 14 7 3 3 3 2 0 3
Doniphan 69 6 30 20 82.4 5 4 2 1 0 0 0 1
Douglas 1,134 17 392 488 79.2 124 50 23 15 12 8 3 2
Edwards 23 1 4 12 77.3 2 1 0 0 1 0 1 1
Elk 24 0 12 9 87.5 2 1 0 0 0 0 0 0
Ellis 299 1 48 215 88.6 15 7 3 5 2 1 1 1
Ellsworth 58 0 21 29 86.2 6 0 1 1 0 0 0 0
Finney 625 25 135 216 60.6 105 60 28 15 12 13 11 5
Ford 589 58 173 159 66.4 73 44 27 11 11 7 24 2
Franklin 305 12 131 98 79.8 22 17 11 6 0 1 4 3
Geary 890 21 271 387 76.4 78 40 28 12 29 17 6 1
Gove 31 0 10 16 83.9 3 1 0 1 0 0 0 0
Graham 21 1 6 9 76.2 1 1 1 1 1 0 0 0
Grant 113 2 26 41 61.1 18 9 3 6 4 3 1 0
Gray 88 2 35 33 80.5 9 4 3 1 0 0 0 1
Greeley 25 0 5 10 62.5 4 0 1 1 2 1 0 1
Greenwood 57 1 22 23 80.7 4 2 2 0 1 1 1 0
Hamilton 31 0 7 13 64.5 4 1 1 4 1 0 0 0
Harper 64 3 40 13 87.5 4 0 1 1 0 1 1 0
Harvey 379 4 116 199 84.2 38 12 8 1 0 1 0 0
Haskell 46 1 14 15 65.2 10 4 0 1 0 1 0 0
Hodgeman 17 3 3 10 94.1 0 0 0 0 0 0 1 0
Jackson 180 5 28 99 73.3 21 7 6 2 5 1 6 0
Jefferson 178 2 41 107 85.2 18 5 2 0 0 1 0 2
Jewell 31 2 9 14 80.6 5 0 0 0 0 1 0 0
Johnson 7,207 270 3,286 2,764 88.2 506 173 68 36 27 7 32 38
Kearny 65 1 13 24 58.5 17 3 2 2 1 2 0 0
Kingman 72 0 30 31 84.7 6 2 2 0 1 0 0 0
Kiowa 32 0 4 20 75.0 4 2 0 2 0 0 0 0
Labette 260 10 106 62 69.3 23 17 14 9 8 3 5 3
Lane 15 0 5 7 80.0 3 0 0 0 0 0 0 0
Leavenworth 951 16 406 381 84.4 61 27 19 15 4 6 16 0
Lincoln 22 0 13 8 95.5 0 0 0 1 0 0 0 0
Linn 99 4 36 29 69.7 15 7 4 2 0 0 2 0
Logan 39 2 14 12 71.8 4 4 1 1 0 0 1 0
Table C13Live Births by County of Residence and Peer Group*
by Month Prenatal Care BeganKansas, 2017

Month Care Began
% Care 9th
County of in 1st or
Residence Total 1st 2nd 3rd Trimester 4th 5th 6th 7th 8th Later None n.s.
Table C13Live Births by County of Residence and Peer Group*
by Month Prenatal Care BeganKansas, 2017
Lyon 393 12 204 106 82.4 27 19 9 6 3 4 1 2
McPherson 324 9 119 136 81.7 19 12 8 11 4 2 3 1
Marion 113 1 29 65 84.8 8 3 4 2 0 0 0 1
Marshall 121 2 37 56 78.5 15 5 3 2 1 0 0 0
Meade 44 1 20 12 75.0 6 2 1 1 0 0 1 0
Miami 387 15 165 147 84.7 27 13 6 5 2 2 4 1
Mitchell 74 1 25 41 90.5 7 0 0 0 0 0 0 0
Montgomery 350 19 129 109 75.1 39 15 9 7 8 4 3 8
Morris 72 2 19 41 86.1 6 3 1 0 0 0 0 0
Morton 45 3 16 12 68.9 4 4 2 2 1 0 1 0
Nemaha 151 3 41 84 84.8 9 7 2 3 2 0 0 0
Neosho 196 11 63 83 81.8 7 11 5 6 3 1 2 4
Ness 15 0 6 6 80.0 2 1 0 0 0 0 0 0
Norton 50 0 13 28 82.0 3 0 3 0 2 1 0 0
Osage 171 4 36 93 78.2 20 7 4 1 2 1 2 1
Osborne 45 1 14 24 86.7 4 0 0 0 1 1 0 0
Ottawa 44 0 15 27 97.7 0 1 0 0 0 0 0 1
Pawnee 81 1 16 46 77.8 4 3 1 4 3 1 2 0
Phillips 49 0 11 28 79.6 4 3 1 2 0 0 0 0
Pottawatomie 355 7 62 212 79.6 32 18 4 5 5 3 5 2
Pratt 104 0 15 68 79.8 12 7 2 0 0 0 0 0
Rawlins 33 0 9 18 81.8 2 1 1 1 0 1 0 0
Reno 693 16 327 196 77.9 59 42 13 17 12 4 6 1
Republic 60 2 22 26 83.3 5 2 1 2 0 0 0 0
Rice 103 1 42 38 78.6 6 5 6 1 2 0 2 0
Riley 883 15 217 473 80.0 56 35 28 17 21 13 6 2
Rooks 52 0 7 34 78.8 8 1 1 0 0 1 0 0
Rush 31 1 6 17 77.4 2 2 0 1 2 0 0 0
Russell 73 1 7 55 86.3 5 3 2 0 0 0 0 0
Saline 702 6 289 290 84.1 48 29 17 6 6 2 3 6
Scott 57 2 16 24 77.8 4 1 4 1 1 0 1 3
Sedgwick 6,907 128 3,536 2,113 83.7 518 223 127 90 59 30 75 8
Seward 419 6 147 115 65.2 48 40 19 17 8 5 6 8
Shawnee 2,065 46 331 1,253 79.2 196 74 52 42 24 8 31 8
Sheridan 29 0 8 16 82.8 4 0 0 1 0 0 0 0
Sherman 73 7 29 20 78.9 4 3 1 4 1 2 0 2
Smith 43 0 13 24 86.0 3 1 1 0 0 0 1 0
Stafford 54 1 17 28 85.2 2 3 1 0 1 1 0 0
Stanton 28 1 8 12 75.0 5 2 0 0 0 0 0 0
Stevens 69 0 27 18 67.2 9 3 6 2 1 0 1 2
Sumner 262 4 131 92 86.6 13 9 7 2 2 1 1 0
Thomas 120 4 37 59 84.0 10 3 2 2 1 1 0 1
Trego 27 1 7 18 96.3 0 0 0 1 0 0 0 0
Wabaunsee 77 1 6 54 79.2 8 3 2 3 0 0 0 0
Wallace 18 0 6 5 64.7 3 1 0 0 0 2 0 1
Washington 76 3 21 38 82.7 8 1 2 2 0 0 0 1
Wichita 30 1 10 13 80.0 3 1 1 1 0 0 0 0
Wilson 113 2 42 50 83.2 11 7 0 1 0 0 0 0
Woodson 34 3 12 13 82.4 2 1 1 0 1 0 1 0
Wyandotte 2,539 77 864 901 73.2 323 134 84 48 31 10 46 21
n.s. 0 0 0 0 n/a 0 0 0 0 0 0 0 0
Peer Group
Frontier 1,207 37 371 535 78.5 130 44 20 26 16 15 7 6
Rural 2,709 49 827 1,295 80.4 259 107 66 46 28 10 12 10
Densely -Settled Rural 5,933 205 1,931 2,318 75.5 580 342 171 126 88 58 77 37
Semi-Urban 5,812 137 2,165 2,334 80.1 493 239 146 93 86 49 43 27
Urban 20,803 554 8,815 7,900 83.3 1,728 681 373 246 157 69 203 77

APNCU Category‡
County of Live
Residence Births Number Percent Number Percent Number Percent Number Percent n.s.
Kansas 36,464 11,380 31.4 18,906 52.1 2,149 5.9 3,864 10.6 165
Allen 140 57 40.7 58 41.4 7 5.0 18 12.9 0
Anderson 104 41 39.4 50 48.1 4 3.8 9 8.7 0
Atchison 174 50 28.7 89 51.1 13 7.5 22 12.6 0
Barber 55 10 18.5 35 64.8 4 7.4 5 9.3 1
Barton 284 124 43.7 106 37.3 18 6.3 36 12.7 0
Bourbon 180 88 48.9 57 31.7 3 1.7 32 17.8 0
Brown 130 35 26.9 73 56.2 11 8.5 11 8.5 0
Butler 763 166 21.8 506 66.5 27 3.5 62 8.1 2
Chase 19 9 47.4 7 36.8 0 0.0 3 15.8 0
Chautauqua 30 19 63.3 7 23.3 1 3.3 3 10.0 0
Cherokee 212 74 34.9 99 46.7 15 7.1 24 11.3 0
Cheyenne 30 7 23.3 16 53.3 5 16.7 2 6.7 0
Clark 22 2 9.1 16 72.7 2 9.1 2 9.1 0
Clay 91 29 31.9 42 46.2 7 7.7 13 14.3 0
Cloud 109 23 21.1 68 62.4 7 6.4 11 10.1 0
Coffey 94 37 39.4 46 48.9 2 2.1 9 9.6 0
Comanche 18 6 33.3 10 55.6 2 11.1 0 0.0 0
Cowley 415 184 44.3 150 36.1 21 5.1 60 14.5 0
Crawford 460 170 37.1 201 43.9 32 7.0 55 12.0 2
Decatur 33 6 18.2 23 69.7 3 9.1 1 3.0 0
Dickinson 208 68 33.2 109 53.2 9 4.4 19 9.3 3
Doniphan 69 23 33.8 35 51.5 3 4.4 7 10.3 1
Douglas 1,134 488 43.1 490 43.3 36 3.2 118 10.4 2
Edwards 23 6 26.1 12 52.2 0 0.0 5 21.7 0
Elk 24 5 20.8 18 75.0 0 0.0 1 4.2 0
Ellis 299 79 26.5 187 62.8 12 4.0 20 6.7 1
Ellsworth 58 15 25.9 35 60.3 6 10.3 2 3.4 0
Finney 625 161 26.0 255 41.2 55 8.9 148 23.9 6
Ford 589 88 15.0 278 47.4 93 15.8 128 21.8 2
Franklin 305 92 30.5 160 53.0 11 3.6 39 12.9 3
Geary 890 219 24.8 406 46.0 126 14.3 132 14.9 7
Gove 31 8 25.8 18 58.1 3 9.7 2 6.5 0
Graham 21 4 19.0 10 47.6 3 14.3 4 19.0 0
Grant 113 19 16.8 54 47.8 12 10.6 28 24.8 0
Gray 88 20 23.0 49 56.3 10 11.5 8 9.2 1
Greeley 25 6 24.0 9 36.0 3 12.0 7 28.0 0
Greenwood 57 21 36.8 28 49.1 0 0.0 8 14.0 0
Hamilton 31 7 22.6 11 35.5 5 16.1 8 25.8 0
Harper 64 6 9.4 51 79.7 3 4.7 4 6.3 0
Harvey 379 159 42.0 184 48.5 12 3.2 24 6.3 0
Haskell 46 8 17.4 30 65.2 2 4.3 6 13.0 0
Hodgeman 17 2 11.8 11 64.7 3 17.6 1 5.9 0
Jackson 180 62 34.4 83 46.1 6 3.3 29 16.1 0
Jefferson 178 76 43.4 90 51.4 2 1.1 7 4.0 3
Jewell 31 10 32.3 15 48.4 5 16.1 1 3.2 0
Johnson 7,207 2,893 40.4 3,543 49.5 360 5.0 361 5.0 50
Kearny 65 18 27.7 32 49.2 5 7.7 10 15.4 0
Kingman 72 14 19.4 49 68.1 3 4.2 6 8.3 0
Kiowa 32 7 21.9 21 65.6 0 0.0 4 12.5 0
Labette 260 65 25.4 115 44.9 19 7.4 57 22.3 4
Lane 15 6 40.0 7 46.7 1 6.7 1 6.7 0
Leavenworth 951 308 32.4 514 54.1 40 4.2 88 9.3 1
Lincoln 22 4 18.2 15 68.2 2 9.1 1 4.5 0
Linn 99 39 39.4 44 44.4 1 1.0 15 15.2 0
Logan 39 7 17.9 23 59.0 2 5.1 7 17.9 0
Table C14Live Births by County of Residence and Peer Group*
by Adequacy of Prenatal Care Utilization (APNCU) Index†Kansas, 2017
Adequate Plus Adequate Intermediate Inadequate
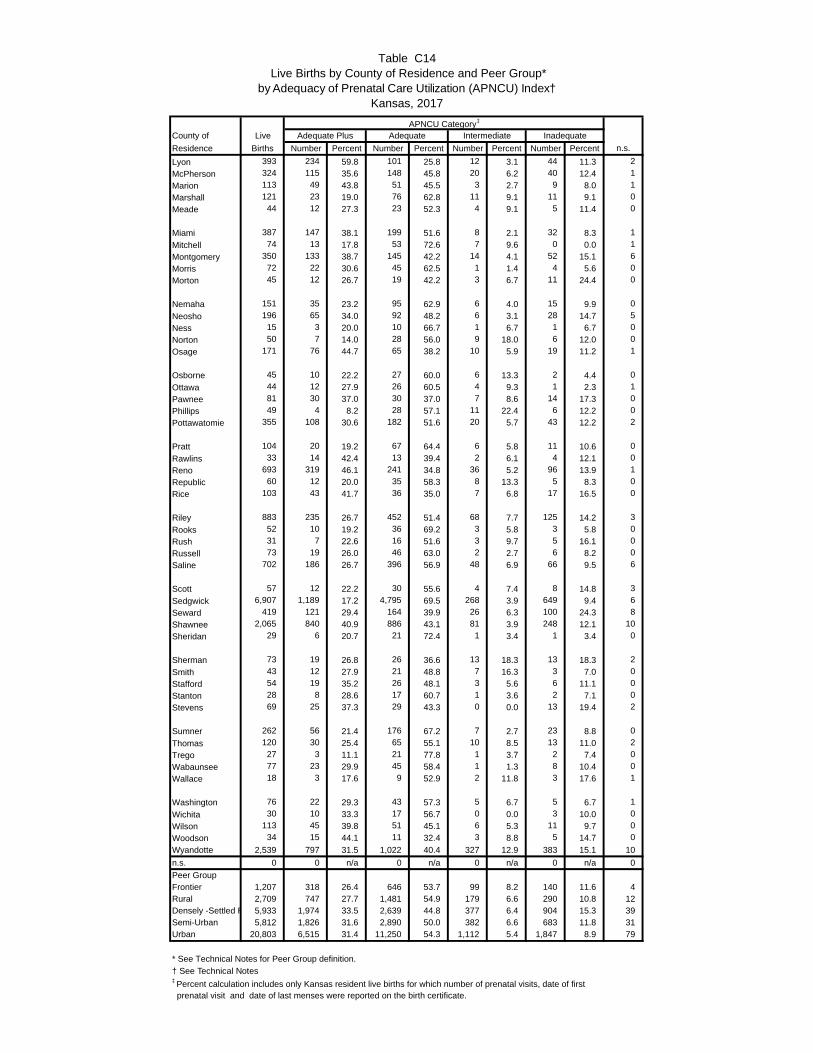
APNCU Category‡
County of Live
Residence Births Number Percent Number Percent Number Percent Number Percent n.s.
Table C14Live Births by County of Residence and Peer Group*
by Adequacy of Prenatal Care Utilization (APNCU) Index†Kansas, 2017
Adequate Plus Adequate Intermediate Inadequate
Lyon 393 234 59.8 101 25.8 12 3.1 44 11.3 2
McPherson 324 115 35.6 148 45.8 20 6.2 40 12.4 1
Marion 113 49 43.8 51 45.5 3 2.7 9 8.0 1
Marshall 121 23 19.0 76 62.8 11 9.1 11 9.1 0
Meade 44 12 27.3 23 52.3 4 9.1 5 11.4 0
Miami 387 147 38.1 199 51.6 8 2.1 32 8.3 1
Mitchell 74 13 17.8 53 72.6 7 9.6 0 0.0 1
Montgomery 350 133 38.7 145 42.2 14 4.1 52 15.1 6
Morris 72 22 30.6 45 62.5 1 1.4 4 5.6 0
Morton 45 12 26.7 19 42.2 3 6.7 11 24.4 0
Nemaha 151 35 23.2 95 62.9 6 4.0 15 9.9 0
Neosho 196 65 34.0 92 48.2 6 3.1 28 14.7 5
Ness 15 3 20.0 10 66.7 1 6.7 1 6.7 0
Norton 50 7 14.0 28 56.0 9 18.0 6 12.0 0
Osage 171 76 44.7 65 38.2 10 5.9 19 11.2 1
Osborne 45 10 22.2 27 60.0 6 13.3 2 4.4 0
Ottawa 44 12 27.9 26 60.5 4 9.3 1 2.3 1
Pawnee 81 30 37.0 30 37.0 7 8.6 14 17.3 0
Phillips 49 4 8.2 28 57.1 11 22.4 6 12.2 0
Pottawatomie 355 108 30.6 182 51.6 20 5.7 43 12.2 2
Pratt 104 20 19.2 67 64.4 6 5.8 11 10.6 0
Rawlins 33 14 42.4 13 39.4 2 6.1 4 12.1 0
Reno 693 319 46.1 241 34.8 36 5.2 96 13.9 1
Republic 60 12 20.0 35 58.3 8 13.3 5 8.3 0
Rice 103 43 41.7 36 35.0 7 6.8 17 16.5 0
Riley 883 235 26.7 452 51.4 68 7.7 125 14.2 3
Rooks 52 10 19.2 36 69.2 3 5.8 3 5.8 0
Rush 31 7 22.6 16 51.6 3 9.7 5 16.1 0
Russell 73 19 26.0 46 63.0 2 2.7 6 8.2 0
Saline 702 186 26.7 396 56.9 48 6.9 66 9.5 6
Scott 57 12 22.2 30 55.6 4 7.4 8 14.8 3
Sedgwick 6,907 1,189 17.2 4,795 69.5 268 3.9 649 9.4 6
Seward 419 121 29.4 164 39.9 26 6.3 100 24.3 8
Shawnee 2,065 840 40.9 886 43.1 81 3.9 248 12.1 10
Sheridan 29 6 20.7 21 72.4 1 3.4 1 3.4 0
Sherman 73 19 26.8 26 36.6 13 18.3 13 18.3 2
Smith 43 12 27.9 21 48.8 7 16.3 3 7.0 0
Stafford 54 19 35.2 26 48.1 3 5.6 6 11.1 0
Stanton 28 8 28.6 17 60.7 1 3.6 2 7.1 0
Stevens 69 25 37.3 29 43.3 0 0.0 13 19.4 2
Sumner 262 56 21.4 176 67.2 7 2.7 23 8.8 0
Thomas 120 30 25.4 65 55.1 10 8.5 13 11.0 2
Trego 27 3 11.1 21 77.8 1 3.7 2 7.4 0
Wabaunsee 77 23 29.9 45 58.4 1 1.3 8 10.4 0
Wallace 18 3 17.6 9 52.9 2 11.8 3 17.6 1
Washington 76 22 29.3 43 57.3 5 6.7 5 6.7 1
Wichita 30 10 33.3 17 56.7 0 0.0 3 10.0 0
Wilson 113 45 39.8 51 45.1 6 5.3 11 9.7 0
Woodson 34 15 44.1 11 32.4 3 8.8 5 14.7 0
Wyandotte 2,539 797 31.5 1,022 40.4 327 12.9 383 15.1 10
n.s. 0 0 n/a 0 n/a 0 n/a 0 n/a 0
Peer GroupFrontier 1,207 318 26.4 646 53.7 99 8.2 140 11.6 4Rural 2,709 747 27.7 1,481 54.9 179 6.6 290 10.8 12Densely -Settled R 5,933 1,974 33.5 2,639 44.8 377 6.4 904 15.3 39Semi-Urban 5,812 1,826 31.6 2,890 50.0 382 6.6 683 11.8 31Urban 20,803 6,515 31.4 11,250 54.3 1,112 5.4 1,847 8.9 79
* See Technical Notes for Peer Group definition.
† See Technical Notes‡ Percent calculation includes only Kansas resident live births for which number of prenatal visits, date of first prenatal visit and date of last menses were reported on the birth certificate.

Birth Weight in Grams
500 1000 % Under 1500 2000 % Under 2500 3000 3500 4000 4500 5000
County of Under - - 1500 gr - - 2500 gr - - - - - &
Residence Total 500 999 1499 (VLBW) 1999 2499 (LBW) 2999 3499 3999 4499 4999 Over n.s.
Kansas 36,464 75 164 251 1.3 542 1,665 7.4 6,256 13,923 10,404 2,775 355 45 9
Allen 140 0 0 0 0.0 1 4 3.6 28 53 44 9 0 1 0
Anderson 104 0 1 0 1.0 0 6 6.7 15 36 36 8 2 0 0
Atchison 174 0 0 0 0.0 0 8 4.6 33 61 55 16 1 0 0
Barber 55 0 1 1 3.6 0 2 7.3 9 17 15 9 1 0 0
Barton 284 0 0 1 0.4 5 11 6.0 43 134 75 15 0 0 0
Bourbon 180 0 0 2 1.1 0 3 2.8 39 76 50 9 1 0 0
Brown 130 3 0 0 2.3 0 7 7.7 22 40 46 10 2 0 0
Butler 763 2 5 6 1.7 16 22 6.7 124 267 242 68 10 1 0
Chase 19 0 0 0 0.0 0 1 5.3 2 6 5 4 1 0 0
Chautauqua 30 0 0 0 0.0 0 3 10.0 5 12 9 1 0 0 0
Cherokee 212 0 0 3 1.4 3 16 10.4 35 89 58 8 0 0 0
Cheyenne 30 0 0 0 0.0 0 0 0.0 4 16 7 2 0 1 0
Clark 22 0 0 0 0.0 0 1 4.5 1 6 10 4 0 0 0
Clay 91 0 0 1 1.1 0 1 2.2 6 49 26 8 0 0 0
Cloud 109 0 0 0 0.0 1 8 8.3 23 41 22 11 1 2 0
Coffey 94 0 0 1 1.1 1 7 9.6 15 36 26 7 1 0 0
Comanche 18 0 0 0 0.0 0 3 16.7 5 5 4 1 0 0 0
Cowley 415 2 5 4 2.7 5 19 8.4 72 163 114 29 2 0 0
Crawford 460 1 3 2 1.3 5 28 8.5 82 180 134 23 2 0 0
Decatur 33 0 0 0 0.0 0 0 0.0 6 12 13 2 0 0 0
Dickinson 208 2 0 2 1.9 1 11 7.7 33 84 57 16 1 1 0
Doniphan 69 0 2 0 2.9 0 1 4.3 9 22 29 6 0 0 0
Douglas 1,134 2 2 7 1.0 18 59 7.8 195 401 342 96 11 1 0
Edwards 23 0 0 0 0.0 0 1 4.3 4 10 7 1 0 0 0
Elk 24 0 0 0 0.0 0 2 8.3 3 8 7 4 0 0 0
Ellis 299 0 0 4 1.3 7 15 8.7 47 127 77 21 1 0 0
Ellsworth 58 0 1 0 1.7 0 1 3.4 7 22 20 6 1 0 0
Finney 625 1 2 3 1.0 9 30 7.2 145 259 137 34 4 1 0
Ford 589 0 0 2 0.3 10 25 6.3 99 252 160 34 5 0 2
Franklin 305 0 1 3 1.3 2 19 8.2 52 108 92 22 5 1 0
Geary 890 2 4 7 1.5 13 38 7.2 157 359 243 58 8 1 0
Gove 31 0 1 0 3.2 0 0 3.2 12 9 6 3 0 0 0
Graham 21 0 0 0 0.0 1 2 14.3 3 8 7 0 0 0 0
Grant 113 0 0 0 0.0 1 4 4.4 21 52 25 9 1 0 0
Gray 88 0 0 0 0.0 1 3 4.5 8 37 33 6 0 0 0
Greeley 25 1 0 0 4.0 0 0 4.0 7 13 4 0 0 0 0
Greenwood 57 0 0 0 0.0 1 1 3.5 14 24 14 3 0 0 0
Hamilton 31 0 1 0 3.2 0 1 6.5 7 16 6 0 0 0 0
Harper 64 0 0 0 0.0 1 6 10.9 10 22 18 7 0 0 0
Harvey 379 1 1 3 1.3 6 23 9.0 55 134 125 24 5 1 1
Haskell 46 0 0 0 0.0 3 1 8.7 12 16 8 6 0 0 0
Hodgeman 17 0 0 0 0.0 0 1 5.9 2 5 6 3 0 0 0
Jackson 180 0 0 1 0.6 2 8 6.1 27 69 54 17 2 0 0
Jefferson 178 0 1 3 2.2 4 4 6.7 29 68 55 11 2 1 0
Jewell 31 0 0 0 0.0 0 2 6.5 3 14 8 4 0 0 0
Johnson 7,207 11 17 43 1.0 97 333 7.0 1,117 2,650 2,217 632 79 9 2
Kearny 65 0 0 3 4.6 2 2 10.8 11 25 18 4 0 0 0
Kingman 72 0 0 0 0.0 1 4 6.9 18 24 19 6 0 0 0
Kiowa 32 0 0 1 3.1 0 1 6.3 4 13 9 3 1 0 0
Labette 260 0 0 1 0.4 3 9 5.0 41 105 79 18 3 0 1
Lane 15 0 0 0 0.0 0 0 0.0 3 8 3 1 0 0 0
Leavenworth 951 3 3 4 1.1 11 46 7.0 172 359 274 68 10 1 0
Lincoln 22 0 0 0 0.0 0 0 0.0 1 9 9 3 0 0 0
Linn 99 0 0 0 0.0 0 5 5.1 19 38 25 11 0 1 0
Logan 39 0 0 2 5.1 2 1 12.8 6 16 10 1 1 0 0
Table C15
Kansas, 2017by Birth Weight in Grams
Live Births by County of Residence and Peer Group*

Birth Weight in Grams
500 1000 % Under 1500 2000 % Under 2500 3000 3500 4000 4500 5000
County of Under - - 1500 gr - - 2500 gr - - - - - &
Residence Total 500 999 1499 (VLBW) 1999 2499 (LBW) 2999 3499 3999 4499 4999 Over n.s.
Table C15
Kansas, 2017by Birth Weight in Grams
Live Births by County of Residence and Peer Group*
Lyon 393 0 1 3 1.0 9 25 9.7 54 144 101 45 6 4 1
McPherson 324 0 1 1 0.6 2 12 4.9 58 118 102 23 7 0 0
Marion 113 0 0 0 0.0 1 1 1.8 16 45 39 9 2 0 0
Marshall 121 0 1 0 0.8 0 1 1.7 23 42 42 10 2 0 0
Meade 44 0 1 0 2.3 0 0 2.3 7 18 13 4 1 0 0
Miami 387 0 1 3 1.0 2 10 4.1 51 158 114 44 4 0 0
Mitchell 74 1 0 0 1.4 0 1 2.7 7 26 35 4 0 0 0
Montgomery 350 0 4 1 1.4 2 17 6.9 61 146 84 31 4 0 0
Morris 72 0 0 2 2.8 0 5 9.7 9 41 12 3 0 0 0
Morton 45 0 0 0 0.0 2 4 13.3 5 20 11 2 1 0 0
Nemaha 151 0 1 1 1.3 1 5 5.3 23 50 52 13 3 2 0
Neosho 196 0 1 3 2.0 2 6 6.1 34 66 67 14 3 0 0
Ness 15 0 0 0 0.0 0 0 0.0 4 5 1 4 1 0 0
Norton 50 0 0 0 0.0 0 2 4.0 9 20 17 2 0 0 0
Osage 171 0 0 2 1.2 3 4 5.3 22 82 41 14 3 0 0
Osborne 45 0 0 0 0.0 1 3 8.9 3 21 12 5 0 0 0
Ottawa 44 0 0 0 0.0 0 4 9.1 11 12 13 4 0 0 0
Pawnee 81 0 1 2 3.7 4 3 12.3 15 27 17 10 2 0 0
Phillips 49 0 0 0 0.0 1 1 4.1 4 15 21 7 0 0 0
Pottawatomie 355 0 1 4 1.4 5 13 6.5 43 114 135 36 3 1 0
Pratt 104 0 2 1 2.9 1 4 7.7 16 50 25 5 0 0 0
Rawlins 33 0 0 2 6.1 1 0 9.1 9 8 8 5 0 0 0
Reno 693 1 5 4 1.4 10 25 6.5 123 271 196 53 5 0 0
Republic 60 0 0 0 0.0 0 0 0.0 9 27 22 2 0 0 0
Rice 103 1 1 0 1.9 0 8 9.7 17 39 29 6 2 0 0
Riley 883 2 1 4 0.8 9 38 6.1 164 339 256 67 1 1 1
Rooks 52 1 0 0 1.9 0 1 3.8 11 21 14 4 0 0 0
Rush 31 0 0 0 0.0 2 0 6.5 8 12 6 1 1 1 0
Russell 73 0 0 0 0.0 1 3 5.5 11 25 27 5 1 0 0
Saline 702 4 10 2 2.3 13 35 9.1 140 266 175 49 7 1 0
Scott 57 0 0 2 3.5 1 1 7.0 13 21 16 3 0 0 0
Sedgwick 6,907 21 54 57 1.9 140 322 8.6 1,195 2,632 1,901 503 76 5 1
Seward 419 1 2 3 1.4 6 12 5.7 94 173 109 14 4 1 0
Shawnee 2,065 9 12 20 2.0 31 104 8.5 390 771 533 164 29 2 0
Sheridan 29 0 0 0 0.0 1 1 6.9 2 14 9 1 1 0 0
Sherman 73 0 0 0 0.0 0 3 4.1 25 27 14 4 0 0 0
Smith 43 0 0 0 0.0 0 2 4.7 8 14 18 1 0 0 0
Stafford 54 0 0 0 0.0 1 0 1.9 9 22 18 3 1 0 0
Stanton 28 0 0 0 0.0 3 0 10.7 4 12 7 1 1 0 0
Stevens 69 0 0 0 0.0 0 2 2.9 16 29 19 2 0 1 0
Sumner 262 0 0 2 0.8 3 5 3.8 44 119 72 17 0 0 0
Thomas 120 0 0 0 0.0 2 4 5.0 23 54 32 4 1 0 0
Trego 27 0 0 0 0.0 0 3 11.1 1 9 10 4 0 0 0
Wabaunsee 77 0 0 0 0.0 2 2 5.2 12 24 29 8 0 0 0
Wallace 18 0 0 0 0.0 0 0 0.0 2 7 6 3 0 0 0
Washington 76 0 0 1 1.3 1 3 6.6 5 26 25 14 1 0 0
Wichita 30 0 1 1 6.7 1 0 10.0 5 16 5 1 0 0 0
Wilson 113 0 2 0 1.8 2 4 7.1 18 43 32 11 1 0 0
Woodson 34 0 0 1 2.9 0 1 5.9 7 14 10 1 0 0 0
Wyandotte 2,539 3 10 19 1.3 43 156 9.1 494 983 658 153 17 3 0
n.s. 0 0 0 0 n/a 0 0 n/a 0 0 0 0 0 0 0
Peer Group
Frontier 1,207 2 5 10 1.4 18 41 6.3 215 478 329 96 11 2 0
Rural 2,709 5 10 12 1.0 26 108 5.9 440 1,043 818 218 23 6 0
Densely -Settled Rural 5,933 6 16 44 1.1 80 241 6.5 1,029 2,378 1,671 406 48 10 4
Semi-Urban 5,812 13 35 35 1.4 78 255 7.2 1,009 2,228 1,661 439 51 6 2
Urban 20,803 49 98 150 1.4 340 1,020 8.0 3,563 7,796 5,925 1,616 222 21 3
* See Technical Notes for Peer Group definition.

County of Live
Residence Births Number Percent Number Percent n.s.‡
Kansas 36,464 32,162 88.5 4,169 11.5 133
Allen 140 118 84.3 22 15.7 0
Anderson 104 87 83.7 17 16.3 0
Atchison 174 138 79.3 36 20.7 0
Barber 55 48 88.9 6 11.1 1
Barton 284 249 87.7 35 12.3 0
Bourbon 180 163 91.1 16 8.9 1
Brown 130 107 84.3 20 15.7 3
Butler 763 665 87.6 94 12.4 4
Chase 19 17 89.5 2 10.5 0
Chautauqua 30 26 86.7 4 13.3 0
Cherokee 212 158 74.5 54 25.5 0
Cheyenne 30 29 96.7 1 3.3 0
Clark 22 19 86.4 3 13.6 0
Clay 91 83 91.2 8 8.8 0
Cloud 109 94 88.7 12 11.3 3
Coffey 94 82 87.2 12 12.8 0
Comanche 18 16 88.9 2 11.1 0
Cowley 415 331 80.3 81 19.7 3
Crawford 460 359 78.7 97 21.3 4
Decatur 33 29 87.9 4 12.1 0
Dickinson 208 176 85.4 30 14.6 2
Doniphan 69 53 79.1 14 20.9 2
Douglas 1,134 1,008 89.1 123 10.9 3
Edwards 23 17 73.9 6 26.1 0
Elk 24 22 91.7 2 8.3 0
Ellis 299 267 89.6 31 10.4 1
Ellsworth 58 50 86.2 8 13.8 0
Finney 625 534 85.6 90 14.4 1
Ford 589 499 84.7 90 15.3 0
Franklin 305 250 82.2 54 17.8 1
Geary 890 780 88.0 106 12.0 4
Gove 31 31 100.0 0 0.0 0
Graham 21 18 90.0 2 10.0 1
Grant 113 96 85.0 17 15.0 0
Gray 88 81 92.0 7 8.0 0
Greeley 25 24 96.0 1 4.0 0
Greenwood 57 50 89.3 6 10.7 1
Hamilton 31 25 83.3 5 16.7 1
Harper 64 55 85.9 9 14.1 0
Harvey 379 341 90.2 37 9.8 1
Haskell 46 45 100.0 0 0.0 1
Hodgeman 17 16 94.1 1 5.9 0
Jackson 180 146 81.1 34 18.9 0
Jefferson 178 154 87.5 22 12.5 2
Jewell 31 30 96.8 1 3.2 0
Johnson 7,207 6,762 94.1 424 5.9 21
Kearny 65 59 90.8 6 9.2 0
Kingman 72 64 88.9 8 11.1 0
Kiowa 32 32 100.0 0 0.0 0
Labette 260 198 76.7 60 23.3 2
Lane 15 15 100.0 0 0.0 0
Leavenworth 951 842 88.8 106 11.2 3
Lincoln 22 22 100.0 0 0.0 0
Linn 99 89 89.9 10 10.1 0
Logan 39 35 89.7 4 10.3 0
Initiated BreastfeedingDid Not Initiate Breastfeeding
Table C16Live Births by County of Residence and Peer Group*
by Initiation of Breastfeeding† Kansas, 2017

County of Live
Residence Births Number Percent Number Percent n.s.‡
Initiated BreastfeedingDid Not Initiate Breastfeeding
Table C16Live Births by County of Residence and Peer Group*
by Initiation of Breastfeeding† Kansas, 2017
Lyon 393 345 88.2 46 11.8 2
McPherson 324 293 90.4 31 9.6 0
Marion 113 106 93.8 7 6.2 0
Marshall 121 100 83.3 20 16.7 1
Meade 44 39 88.6 5 11.4 0
Miami 387 344 88.9 43 11.1 0
Mitchell 74 61 83.6 12 16.4 1
Montgomery 350 269 77.3 79 22.7 2
Morris 72 63 87.5 9 12.5 0
Morton 45 36 80.0 9 20.0 0
Nemaha 151 135 89.4 16 10.6 0
Neosho 196 153 78.1 43 21.9 0
Ness 15 13 86.7 2 13.3 0
Norton 50 46 92.0 4 8.0 0
Osage 171 144 84.7 26 15.3 1
Osborne 45 41 91.1 4 8.9 0
Ottawa 44 40 90.9 4 9.1 0
Pawnee 81 72 88.9 9 11.1 0
Phillips 49 48 98.0 1 2.0 0
Pottawatomie 355 325 92.3 27 7.7 3
Pratt 104 92 88.5 12 11.5 0
Rawlins 33 30 90.9 3 9.1 0
Reno 693 612 88.6 79 11.4 2
Republic 60 54 91.5 5 8.5 1
Rice 103 82 80.4 20 19.6 1
Riley 883 795 90.2 86 9.8 2
Rooks 52 45 86.5 7 13.5 0
Rush 31 26 83.9 5 16.1 0
Russell 73 65 89.0 8 11.0 0
Saline 702 603 86.5 94 13.5 5
Scott 57 51 89.5 6 10.5 0
Sedgwick 6,907 6,225 90.4 659 9.6 23
Seward 419 341 81.4 78 18.6 0
Shawnee 2,065 1,682 82.0 370 18.0 13
Sheridan 29 26 89.7 3 10.3 0
Sherman 73 64 87.7 9 12.3 0
Smith 43 39 90.7 4 9.3 0
Stafford 54 46 85.2 8 14.8 0
Stanton 28 25 89.3 3 10.7 0
Stevens 69 56 81.2 13 18.8 0
Sumner 262 222 85.4 38 14.6 2
Thomas 120 115 95.8 5 4.2 0
Trego 27 26 96.3 1 3.7 0
Wabaunsee 77 69 89.6 8 10.4 0
Wallace 18 15 83.3 3 16.7 0
Washington 76 67 89.3 8 10.7 1
Wichita 30 27 90.0 3 10.0 0
Wilson 113 89 78.8 24 21.2 0
Woodson 34 28 82.4 6 17.6 0
Wyandotte 2,539 2,168 85.6 364 14.4 7
n.s. 0 0 n/a 0 n/a 0
Peer GroupFrontier 1,207 1,078 89.6 125 10.4 4Rural 2,709 2,372 87.9 325 12.1 12Densely -Settled Rural 5,933 5,007 84.7 904 15.3 22Semi-Urban 5,812 5,018 86.7 769 13.3 25Urban 20,803 18,687 90.1 2,046 9.9 70
* See Technical Notes for Peer Group definition.† See Technical Notes‡ Not stated (n.s.) includes births with missing/unknown data and where the infant died
shortly after birth.

3 Months First Second Third
County of Prior to Trimester Trimester Trimester
Residence Total Pregnancy of Pregnancy of Pregnancy of Pregnancy Number Percent n.s.
Kansas 36,464 4,221 3,632 3,259 3,129 3,680 10.1 90
Allen 140 21 21 18 17 21 15.1 1
Anderson 104 16 16 16 15 16 15.4 0
Atchison 174 31 24 21 21 24 13.8 0
Barber 55 9 8 6 6 8 14.5 0
Barton 284 58 44 39 39 44 15.5 0
Bourbon 180 35 31 29 27 31 17.2 0
Brown 130 32 23 20 17 24 18.5 0
Butler 763 116 106 99 99 108 14.2 1
Chase 19 5 4 4 4 4 21.1 0
Chautauqua 30 11 11 11 11 11 37.9 1
Cherokee 212 49 41 37 33 42 19.8 0
Cheyenne 30 6 5 4 4 5 16.7 0
Clark 22 1 0 0 0 0 0.0 0
Clay 91 14 11 10 11 12 13.2 0
Cloud 109 22 17 15 15 17 15.6 0
Coffey 94 20 15 15 13 16 17.0 0
Comanche 18 5 3 3 3 3 16.7 0
Cowley 415 85 73 62 61 74 17.9 1
Crawford 460 73 66 62 58 67 14.6 1
Decatur 33 7 6 5 4 6 18.2 0
Dickinson 208 44 28 24 23 29 13.9 0
Doniphan 69 10 8 6 5 8 11.6 0
Douglas 1,134 117 97 80 75 99 8.7 1
Edwards 23 3 3 3 3 3 13.0 0
Elk 24 6 6 6 6 6 25.0 0
Ellis 299 39 33 30 26 33 11.1 1
Ellsworth 58 15 11 11 11 11 19.0 0
Finney 625 41 27 20 20 28 4.5 0
Ford 589 11 9 8 8 9 1.5 1
Franklin 305 62 52 48 46 52 17.2 2
Geary 890 110 75 57 49 75 8.5 3
Gove 31 2 2 1 1 2 6.5 0
Graham 21 5 5 5 5 5 23.8 0
Grant 113 5 5 3 3 5 4.4 0
Gray 88 5 5 4 4 5 5.7 0
Greeley 25 2 2 2 2 2 8.0 0
Greenwood 57 15 11 11 11 12 21.1 0
Hamilton 31 3 2 2 1 2 6.5 0
Harper 64 13 12 11 10 12 18.8 0
Harvey 379 56 51 47 42 52 13.8 1
Haskell 46 5 4 3 3 4 8.7 0
Hodgeman 17 1 1 1 1 1 5.9 0
Jackson 180 37 25 23 21 26 14.7 3
Jefferson 178 27 23 17 17 23 13.1 2
Jewell 31 5 3 2 2 3 9.7 0
Johnson 7,207 248 202 170 161 208 2.9 5
Kearny 65 4 3 2 1 3 4.6 0
Kingman 72 9 9 8 9 9 12.5 0
Kiowa 32 3 3 2 2 3 9.4 0
Labette 260 52 46 38 37 48 19.0 7
Lane 15 1 1 1 1 1 6.7 0
Leavenworth 951 119 106 91 87 108 11.4 3
Lincoln 22 3 2 2 2 2 9.1 0
Linn 99 28 25 24 25 26 26.3 0
Logan 39 8 6 5 5 6 15.4 0
During Pregnancy
Table C17Live Births by County of Residence and Peer Group*
by Mother's Reported Cigarette UseKansas, 2017
Any Time

3 Months First Second Third
County of Prior to Trimester Trimester Trimester
Residence Total Pregnancy of Pregnancy of Pregnancy of Pregnancy Number Percent n.s.
During Pregnancy
Table C17Live Births by County of Residence and Peer Group*
by Mother's Reported Cigarette UseKansas, 2017
Any Time
Lyon 393 46 33 27 25 35 9.0 2
McPherson 324 45 38 35 34 39 12.1 1
Marion 113 21 15 13 14 15 13.4 1
Marshall 121 18 16 12 11 16 13.2 0
Meade 44 4 4 3 3 4 9.1 0
Miami 387 60 48 40 38 48 12.4 1
Mitchell 74 8 7 6 6 7 9.5 0
Montgomery 350 85 69 64 61 72 21.1 9
Morris 72 14 12 12 12 12 16.7 0
Morton 45 8 7 6 6 7 15.6 0
Nemaha 151 18 15 14 13 15 9.9 0
Neosho 196 39 35 30 30 35 17.9 0
Ness 15 0 0 0 0 0 0.0 0
Norton 50 10 10 9 6 10 20.0 0
Osage 171 43 34 32 31 35 20.5 0
Osborne 45 8 8 4 4 8 17.8 0
Ottawa 44 7 6 3 4 7 15.9 0
Pawnee 81 16 13 11 10 13 16.0 0
Phillips 49 7 7 6 5 7 14.3 0
Pottawatomie 355 32 26 24 21 26 7.3 0
Pratt 104 15 11 11 11 11 10.8 2
Rawlins 33 5 4 4 4 4 12.1 0
Reno 693 130 102 95 89 103 14.9 0
Republic 60 7 6 5 5 6 10.0 0
Rice 103 24 19 18 17 19 18.4 0
Riley 883 94 74 62 51 74 8.4 0
Rooks 52 6 5 5 5 5 9.6 0
Rush 31 9 6 5 5 6 19.4 0
Russell 73 22 17 13 13 18 24.7 0
Saline 702 151 119 99 93 121 17.3 2
Scott 57 8 8 7 7 8 14.0 0
Sedgwick 6,907 754 746 730 727 748 10.8 8
Seward 419 28 25 19 18 25 6.0 3
Shawnee 2,065 365 310 270 260 315 15.4 18
Sheridan 29 1 1 1 1 1 3.4 0
Sherman 73 20 18 16 16 18 25.0 1
Smith 43 6 4 4 3 4 9.3 0
Stafford 54 6 5 5 5 5 9.3 0
Stanton 28 6 4 4 4 4 14.3 0
Stevens 69 5 4 5 4 5 7.2 0
Sumner 262 55 54 54 52 54 20.6 0
Thomas 120 11 8 4 4 9 7.6 1
Trego 27 1 0 0 0 0 0.0 0
Wabaunsee 77 9 8 7 7 8 10.4 0
Wallace 18 1 1 1 1 1 5.6 0
Washington 76 8 4 3 3 4 5.3 0
Wichita 30 1 1 0 0 1 3.3 0
Wilson 113 23 22 18 17 22 19.6 1
Woodson 34 10 7 7 7 7 20.6 0
Wyandotte 2,539 221 208 192 183 209 8.3 6
n.s. 0 0 0 0 0 0 n/a 0
Peer GroupFrontier 1,207 187 155 136 132 156 12.9 2Rural 2,709 445 368 324 312 376 13.9 5Densely -Settled Rural 5,933 828 678 593 566 689 11.7 22Semi-Urban 5,812 937 762 673 626 772 13.3 20Urban 20,803 1,824 1,669 1,533 1,493 1,687 8.1 41
* See Technical Notes for Peer Group definition.


County of
Residence Total Number Percent Number Percent n.s.
Kansas 36,464 32,809 90.1 3,625 9.9 30
Allen 140 127 90.7 13 9.3 0Anderson 104 100 96.2 4 3.8 0
Atchison 174 159 91.4 15 8.6 0
Barber 55 50 90.9 5 9.1 0
Barton 284 256 90.1 28 9.9 0
Bourbon 180 164 91.1 16 8.9 0
Brown 130 108 83.1 22 16.9 0
Butler 763 703 92.3 59 7.7 1
Chase 19 18 94.7 1 5.3 0
Chautauqua 30 27 90.0 3 10.0 0
Cherokee 212 189 89.2 23 10.8 0
Cheyenne 30 26 86.7 4 13.3 0
Clark 22 21 95.5 1 4.5 0
Clay 91 87 95.6 4 4.4 0
Cloud 109 94 86.2 15 13.8 0
Coffey 94 83 88.3 11 11.7 0
Comanche 18 12 66.7 6 33.3 0
Cowley 415 383 92.3 32 7.7 0
Crawford 460 420 91.3 40 8.7 0
Decatur 33 27 81.8 6 18.2 0
Dickinson 208 187 89.9 21 10.1 0
Doniphan 69 61 88.4 8 11.6 0
Douglas 1,134 1,035 91.4 98 8.6 1
Edwards 23 22 95.7 1 4.3 0
Elk 24 23 95.8 1 4.2 0
Ellis 299 262 87.6 37 12.4 0
Ellsworth 58 57 98.3 1 1.7 0
Finney 625 534 85.4 91 14.6 0
Ford 589 521 88.8 66 11.2 2
Franklin 305 273 89.5 32 10.5 0
Geary 890 808 90.8 82 9.2 0
Gove 31 25 80.6 6 19.4 0
Graham 21 18 85.7 3 14.3 0
Grant 113 103 91.2 10 8.8 0
Gray 88 81 92.0 7 8.0 0
Greeley 25 23 92.0 2 8.0 0
Greenwood 57 48 84.2 9 15.8 0
Hamilton 31 25 80.6 6 19.4 0
Harper 64 53 82.8 11 17.2 0
Harvey 379 351 92.9 27 7.1 1
Haskell 46 39 84.8 7 15.2 0
Hodgeman 17 16 94.1 1 5.9 0
Jackson 180 164 91.6 15 8.4 1
Jefferson 178 163 91.6 15 8.4 0
Jewell 31 30 96.8 1 3.2 0
Johnson 7,207 6,569 91.2 632 8.8 6
Kearny 65 59 90.8 6 9.2 0
Kingman 72 58 80.6 14 19.4 0
Kiowa 32 30 93.8 2 6.3 0
Labette 260 235 91.4 22 8.6 3
Lane 15 14 93.3 1 6.7 0
Leavenworth 951 849 89.3 102 10.7 0
Lincoln 22 20 95.2 1 4.8 1
Linn 99 87 87.9 12 12.1 0
Logan 39 36 92.3 3 7.7 0
Small for Gestational Age
(Less than 10th percentile)
Normal for Gestational Age
(10th or greater percentile)
Table C18Live Births by County of Residence and Peer Group*
by Birth Weight Category for Gestational Age†Kansas, 2017

County of
Residence Total Number Percent Number Percent n.s.
Small for Gestational Age
(Less than 10th percentile)
Normal for Gestational Age
(10th or greater percentile)
Table C18Live Births by County of Residence and Peer Group*
by Birth Weight Category for Gestational Age†Kansas, 2017
Lyon 393 344 87.8 48 12.2 1
McPherson 324 294 90.7 30 9.3 0
Marion 113 109 96.5 4 3.5 0
Marshall 121 108 89.3 13 10.7 0
Meade 44 42 95.5 2 4.5 0
Miami 387 356 92.0 31 8.0 0
Mitchell 74 67 90.5 7 9.5 0
Montgomery 350 309 88.5 40 11.5 1
Morris 72 61 84.7 11 15.3 0
Morton 45 41 91.1 4 8.9 0
Nemaha 151 136 90.1 15 9.9 0
Neosho 196 180 92.3 15 7.7 1
Ness 15 13 86.7 2 13.3 0
Norton 50 43 86.0 7 14.0 0
Osage 171 156 91.8 14 8.2 1
Osborne 45 42 93.3 3 6.7 0
Ottawa 44 38 86.4 6 13.6 0
Pawnee 81 72 88.9 9 11.1 0
Phillips 49 47 95.9 2 4.1 0
Pottawatomie 355 337 94.9 18 5.1 0
Pratt 104 95 91.3 9 8.7 0
Rawlins 33 30 90.9 3 9.1 0
Reno 693 633 91.5 59 8.5 1
Republic 60 56 93.3 4 6.7 0
Rice 103 92 89.3 11 10.7 0
Riley 883 792 89.8 90 10.2 1
Rooks 52 47 90.4 5 9.6 0
Rush 31 24 77.4 7 22.6 0
Russell 73 65 89.0 8 11.0 0
Saline 702 607 86.5 95 13.5 0
Scott 57 49 86.0 8 14.0 0
Sedgwick 6,907 6,192 89.7 714 10.3 1
Seward 419 378 91.3 36 8.7 5
Shawnee 2,065 1,833 88.8 231 11.2 1
Sheridan 29 29 100.0 0 0.0 0
Sherman 73 65 89.0 8 11.0 0
Smith 43 40 93.0 3 7.0 0
Stafford 54 47 87.0 7 13.0 0
Stanton 28 22 78.6 6 21.4 0
Stevens 69 61 88.4 8 11.6 0
Sumner 262 251 95.8 11 4.2 0
Thomas 120 108 90.0 12 10.0 0
Trego 27 25 92.6 2 7.4 0
Wabaunsee 77 65 84.4 12 15.6 0
Wallace 18 18 100.0 0 0.0 0
Washington 76 71 93.4 5 6.6 0
Wichita 30 27 90.0 3 10.0 0
Wilson 113 103 91.2 10 8.8 0
Woodson 34 29 87.9 4 12.1 1
Wyandotte 2,539 2,227 87.7 312 12.3 0
n.s. 0 0 n/a 0 n/a 0
Peer GroupFrontier 1,207 1,082 89.7 124 10.3 1Rural 2,709 2,425 89.5 283 10.5 1Densely -Settled Rural 5,933 5,345 90.3 574 9.7 14Semi-Urban 5,812 5,252 90.4 555 9.6 5Urban 20,803 18,705 90.0 2,089 10.0 9
* See Technical Notes for Peer Group definition.† See technical notes
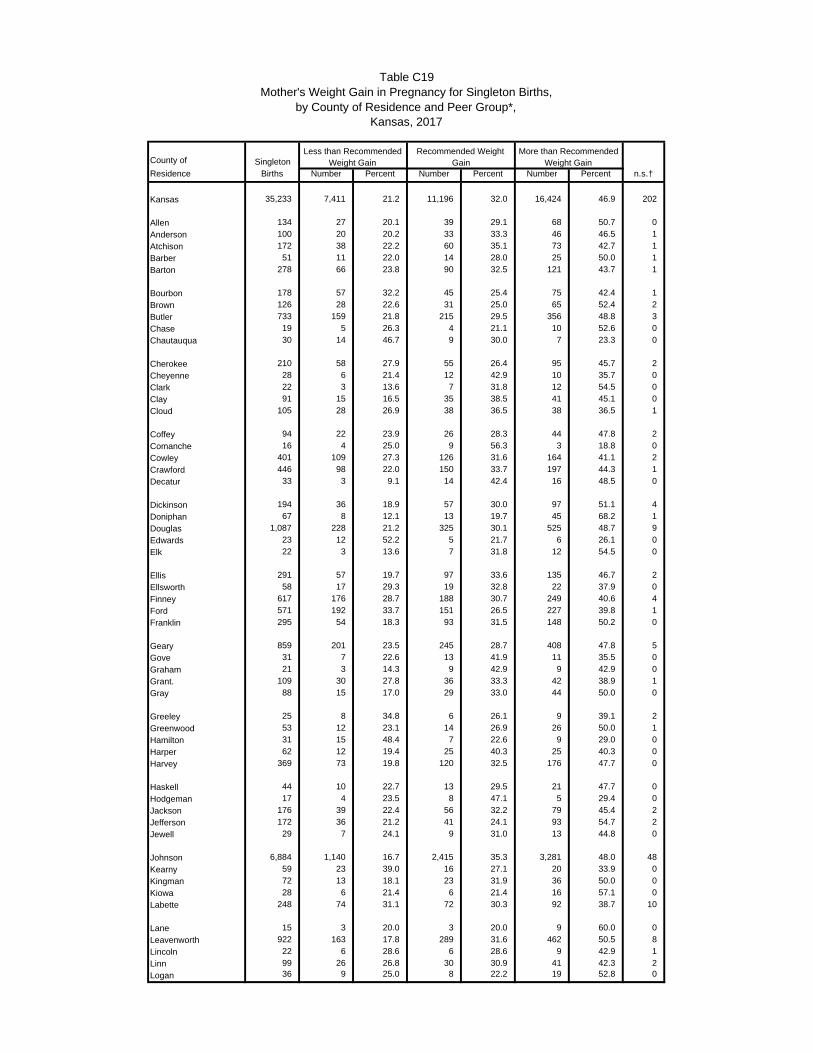
County of SingletonResidence Births Number Percent Number Percent Number Percent n.s.†
Kansas 35,233 7,411 21.2 11,196 32.0 16,424 46.9 202
Allen 134 27 20.1 39 29.1 68 50.7 0
Anderson 100 20 20.2 33 33.3 46 46.5 1
Atchison 172 38 22.2 60 35.1 73 42.7 1
Barber 51 11 22.0 14 28.0 25 50.0 1
Barton 278 66 23.8 90 32.5 121 43.7 1
Bourbon 178 57 32.2 45 25.4 75 42.4 1
Brown 126 28 22.6 31 25.0 65 52.4 2
Butler 733 159 21.8 215 29.5 356 48.8 3
Chase 19 5 26.3 4 21.1 10 52.6 0
Chautauqua 30 14 46.7 9 30.0 7 23.3 0
Cherokee 210 58 27.9 55 26.4 95 45.7 2
Cheyenne 28 6 21.4 12 42.9 10 35.7 0
Clark 22 3 13.6 7 31.8 12 54.5 0
Clay 91 15 16.5 35 38.5 41 45.1 0
Cloud 105 28 26.9 38 36.5 38 36.5 1
Coffey 94 22 23.9 26 28.3 44 47.8 2
Comanche 16 4 25.0 9 56.3 3 18.8 0
Cowley 401 109 27.3 126 31.6 164 41.1 2
Crawford 446 98 22.0 150 33.7 197 44.3 1
Decatur 33 3 9.1 14 42.4 16 48.5 0
Dickinson 194 36 18.9 57 30.0 97 51.1 4
Doniphan 67 8 12.1 13 19.7 45 68.2 1
Douglas 1,087 228 21.2 325 30.1 525 48.7 9
Edwards 23 12 52.2 5 21.7 6 26.1 0
Elk 22 3 13.6 7 31.8 12 54.5 0
Ellis 291 57 19.7 97 33.6 135 46.7 2
Ellsworth 58 17 29.3 19 32.8 22 37.9 0
Finney 617 176 28.7 188 30.7 249 40.6 4
Ford 571 192 33.7 151 26.5 227 39.8 1
Franklin 295 54 18.3 93 31.5 148 50.2 0
Geary 859 201 23.5 245 28.7 408 47.8 5
Gove 31 7 22.6 13 41.9 11 35.5 0
Graham 21 3 14.3 9 42.9 9 42.9 0
Grant. 109 30 27.8 36 33.3 42 38.9 1
Gray 88 15 17.0 29 33.0 44 50.0 0
Greeley 25 8 34.8 6 26.1 9 39.1 2
Greenwood 53 12 23.1 14 26.9 26 50.0 1
Hamilton 31 15 48.4 7 22.6 9 29.0 0
Harper 62 12 19.4 25 40.3 25 40.3 0
Harvey 369 73 19.8 120 32.5 176 47.7 0
Haskell 44 10 22.7 13 29.5 21 47.7 0
Hodgeman 17 4 23.5 8 47.1 5 29.4 0
Jackson 176 39 22.4 56 32.2 79 45.4 2
Jefferson 172 36 21.2 41 24.1 93 54.7 2
Jewell 29 7 24.1 9 31.0 13 44.8 0
Johnson 6,884 1,140 16.7 2,415 35.3 3,281 48.0 48
Kearny 59 23 39.0 16 27.1 20 33.9 0
Kingman 72 13 18.1 23 31.9 36 50.0 0
Kiowa 28 6 21.4 6 21.4 16 57.1 0
Labette 248 74 31.1 72 30.3 92 38.7 10
Lane 15 3 20.0 3 20.0 9 60.0 0
Leavenworth 922 163 17.8 289 31.6 462 50.5 8
Lincoln 22 6 28.6 6 28.6 9 42.9 1
Linn 99 26 26.8 30 30.9 41 42.3 2
Logan 36 9 25.0 8 22.2 19 52.8 0
Recommended Weight Gain
More than Recommended Weight Gain
Less than Recommended Weight Gain
Table C19Mother's Weight Gain in Pregnancy for Singleton Births,
by County of Residence and Peer Group*, Kansas, 2017

County of SingletonResidence Births Number Percent Number Percent Number Percent n.s.†
Recommended Weight Gain
More than Recommended Weight Gain
Less than Recommended Weight Gain
Table C19Mother's Weight Gain in Pregnancy for Singleton Births,
by County of Residence and Peer Group*, Kansas, 2017
Lyon 372 88 23.9 111 30.2 169 45.9 4
McPherson 314 52 16.6 97 31.0 164 52.4 1
Marion 113 25 22.1 31 27.4 57 50.4 0
Marshall 119 34 28.6 27 22.7 58 48.7 0
Meade 44 12 27.9 14 32.6 17 39.5 1
Miami 376 59 15.8 119 31.8 196 52.4 2
Mitchell 74 9 12.2 20 27.0 45 60.8 0
Montgomery 344 115 33.7 82 24.0 144 42.2 3
Morris 70 19 27.1 22 31.4 29 41.4 0
Morton 41 10 24.4 14 34.1 17 41.5 0
Nemaha 149 33 22.4 45 30.6 69 46.9 2
Neosho 188 51 27.3 69 36.9 67 35.8 1
Ness 15 3 20.0 7 46.7 5 33.3 0
Norton 44 10 23.3 16 37.2 17 39.5 1
Osage 169 41 24.3 41 24.3 87 51.5 0
Osborne 43 10 23.3 20 46.5 13 30.2 0
Ottawa 40 9 22.5 16 40.0 15 37.5 0
Pawnee 78 22 28.2 24 30.8 32 41.0 0
Phillips 49 5 10.6 17 36.2 25 53.2 2
Pottawatomie 343 73 21.5 105 31.0 161 47.5 4
Pratt 102 22 21.6 39 38.2 41 40.2 0
Rawlins 31 8 25.8 8 25.8 15 48.4 0
Reno 671 146 21.8 194 29.0 329 49.2 2
Republic 60 16 27.1 19 32.2 24 40.7 1
Rice 97 27 27.8 32 33.0 38 39.2 0
Riley 841 210 25.0 276 32.9 354 42.1 1
Rooks 50 9 18.4 14 28.6 26 53.1 1
Rush 31 5 16.1 6 19.4 20 64.5 0
Russell 73 21 28.8 26 35.6 26 35.6 0
Saline 666 147 22.1 237 35.6 281 42.3 1
Scott 57 20 35.1 14 24.6 23 40.4 0
Sedgwick 6,698 1,318 19.7 2,169 32.5 3,197 47.8 14
Seward 411 90 22.1 128 31.4 189 46.4 4
Shawnee 1,992 412 20.9 549 27.8 1,013 51.3 18
Sheridan 27 4 14.8 8 29.6 15 55.6 0
Sherman 71 16 23.2 22 31.9 31 44.9 2
Smith 39 10 25.6 11 28.2 18 46.2 0
Stafford 54 15 27.8 18 33.3 21 38.9 0
Stanton 26 8 30.8 11 42.3 7 26.9 0
Stevens 67 17 25.4 21 31.3 29 43.3 0
Sumner 257 51 19.8 82 31.9 124 48.2 0
Thomas 116 20 17.4 37 32.2 58 50.4 1
Trego 27 8 29.6 11 40.7 8 29.6 0
Wabaunsee 77 9 12.3 26 35.6 38 52.1 4
Wallace 18 3 17.6 7 41.2 7 41.2 1
Washington 72 11 15.3 23 31.9 38 52.8 0
Wichita 28 4 14.3 15 53.6 9 32.1 0
Wilson 111 32 28.8 33 29.7 46 41.4 0
Woodson 34 8 23.5 9 26.5 17 50.0 0
Wyandotte 2,481 575 23.3 788 31.9 1,108 44.8 10
n.s. 0 0 n/a 0 n/a 0 n/a 0
Peer GroupFrontier 1,156 289 25.2 372 32.5 485 42.3 10Rural 2,650 605 23.0 835 31.7 1,190 45.2 20Densely -Settled Rural 5,763 1,419 24.8 1,723 30.1 2,574 45.0 47Semi-Urban 5,600 1,262 22.6 1,731 31.0 2,589 46.4 18Urban 20,064 3,836 19.2 6,535 32.7 9,586 48.0 107
* See Technical Notes for Peer Group definition.†includes births where height, prepegnancy weight or weight at delivery are unknownWeight gain based on prepregnancy BMI category

County of White Black Native American Asian/Pacific Islander Other Hispanic
Residence Total Non-Hispanic Non-Hispanic Non-Hispanic Non-Hispanic Non-Hispanic† Any Race n.s.
Kansas 36,464 25,431 2,463 168 1,255 1,177 5,945 25
Allen 140 129 1 0 2 3 5 0
Anderson 104 98 0 0 0 2 4 0
Atchison 174 150 7 0 3 8 6 0
Barber 55 48 0 1 0 1 5 0
Barton 284 208 3 0 1 4 68 0
Bourbon 180 169 3 0 0 5 3 0
Brown 130 104 1 13 0 4 8 0
Butler 763 693 7 5 12 13 33 0
Chase 19 16 1 0 0 2 0 0
Chautauqua 30 24 0 3 0 1 2 0
Cherokee 212 187 2 5 0 17 1 0
Cheyenne 30 24 0 0 0 0 6 0
Clark 22 19 0 0 0 0 3 0
Clay 91 85 0 0 1 0 5 0
Cloud 109 101 1 0 0 4 3 0
Coffey 94 88 0 1 2 2 1 0
Comanche 18 17 0 0 0 0 1 0
Cowley 415 312 8 2 11 9 73 0
Crawford 460 377 18 1 7 11 46 0
Decatur 33 33 0 0 0 0 0 0
Dickinson 208 179 3 0 0 10 16 0
Doniphan 69 65 0 0 1 2 1 0
Douglas 1,134 861 53 23 74 48 74 1
Edwards 23 14 0 0 0 1 8 0
Elk 24 22 0 1 0 1 0 0
Ellis 299 258 1 0 7 2 31 0
Ellsworth 58 55 0 0 0 0 3 0
Finney 625 185 25 1 22 8 384 0
Ford 589 176 17 2 3 4 387 0
Franklin 305 291 0 0 2 4 8 0
Geary 890 497 140 4 40 72 137 0
Gove 31 30 0 0 0 0 1 0
Graham 21 19 1 0 0 0 1 0
Grant 113 42 0 1 0 0 70 0
Gray 88 77 0 0 0 0 11 0
Greeley 25 17 0 0 0 0 7 1
Greenwood 57 53 0 0 1 1 2 0
Hamilton 31 18 0 0 0 0 13 0
Harper 64 56 1 0 0 1 6 0
Harvey 379 319 2 0 4 9 45 0
Haskell 46 33 0 0 0 1 12 0
Hodgeman 17 14 0 0 0 1 2 0
Jackson 180 135 0 22 1 7 15 0
Jefferson 178 169 1 0 1 3 4 0
Jewell 31 30 0 0 1 0 0 0
Johnson 7,207 5,403 373 9 498 212 703 9
Kearny 65 43 0 0 0 0 22 0
Kingman 72 69 0 0 1 1 1 0
Kiowa 32 28 2 0 0 1 1 0
Labette 260 235 8 5 0 6 6 0
Lane 15 15 0 0 0 0 0 0
Leavenworth 951 736 63 1 21 36 91 3
Lincoln 22 21 0 0 1 0 0 0
Linn 99 94 0 0 0 2 3 0
Logan 39 33 0 0 0 1 5 0
Population Group
Table C20Live Births by County of Residence and Peer Group*
by Population Group of MotherKansas, 2017

County of White Black Native American Asian/Pacific Islander Other Hispanic
Residence Total Non-Hispanic Non-Hispanic Non-Hispanic Non-Hispanic Non-Hispanic† Any Race n.s.
Population Group
Table C20Live Births by County of Residence and Peer Group*
by Population Group of MotherKansas, 2017
Lyon 393 244 5 1 10 10 122 1
McPherson 324 287 8 1 4 4 18 2
Marion 113 103 0 1 0 1 8 0
Marshall 121 114 1 0 0 0 6 0
Meade 44 35 0 0 1 0 8 0
Miami 387 361 4 1 1 10 10 0
Mitchell 74 70 0 0 0 0 4 0
Montgomery 350 270 18 13 2 23 24 0
Morris 72 68 0 1 1 1 1 0
Morton 45 24 0 0 1 0 20 0
Nemaha 151 144 1 0 0 2 3 1
Neosho 196 176 5 0 0 7 8 0
Ness 15 12 0 0 0 0 3 0
Norton 50 44 0 0 0 2 3 1
Osage 171 157 0 0 1 3 10 0
Osborne 45 45 0 0 0 0 0 0
Ottawa 44 43 0 0 0 1 0 0
Pawnee 81 71 0 1 1 2 6 0
Phillips 49 46 0 0 1 0 2 0
Pottawatomie 355 323 1 1 2 5 23 0
Pratt 104 92 1 0 2 1 8 0
Rawlins 33 28 3 0 0 0 2 0
Reno 693 549 14 3 5 25 96 1
Republic 60 56 0 0 0 2 2 0
Rice 103 83 0 0 1 0 19 0
Riley 883 618 75 3 47 45 95 0
Rooks 52 48 0 0 0 2 2 0
Rush 31 30 1 0 0 0 0 0
Russell 73 71 0 0 0 1 1 0
Saline 702 501 20 1 11 29 140 0
Scott 57 50 0 0 0 0 7 0
Sedgwick 6,907 4,295 824 16 277 220 1,273 2
Seward 419 83 6 1 10 3 316 0
Shawnee 2,065 1,336 183 17 40 120 369 0
Sheridan 29 27 0 0 0 1 1 0
Sherman 73 65 0 0 0 3 5 0
Smith 43 40 0 1 0 2 0 0
Stafford 54 46 0 0 0 0 8 0
Stanton 28 17 0 0 0 0 11 0
Stevens 69 40 0 0 1 2 26 0
Sumner 262 249 3 1 0 1 8 0
Thomas 120 105 1 0 0 0 14 0
Trego 27 25 0 0 0 0 2 0
Wabaunsee 77 72 0 0 2 0 3 0
Wallace 18 14 0 0 0 1 3 0
Washington 76 68 0 0 0 2 6 0
Wichita 30 21 0 0 0 0 9 0
Wilson 113 107 0 1 0 0 5 0
Woodson 34 31 0 0 0 0 3 0
Wyandotte 2,539 853 547 4 117 126 889 3
n.s. 0 0 0 0 0 0 0 0
Peer Group
Frontier 1,207 1,015 8 6 5 19 153 1
Rural 2,709 2,380 7 19 13 34 254 2
Densely -Settled Rural 5,933 4,076 107 42 79 121 1,505 3
Semi-Urban 5,812 4,476 298 31 131 241 634 1
Urban 20,803 13,484 2,043 70 1,027 762 3,399 18
* See Technical Notes for Peer Group definition.
† Includes selection of two or more races and other non-specified race
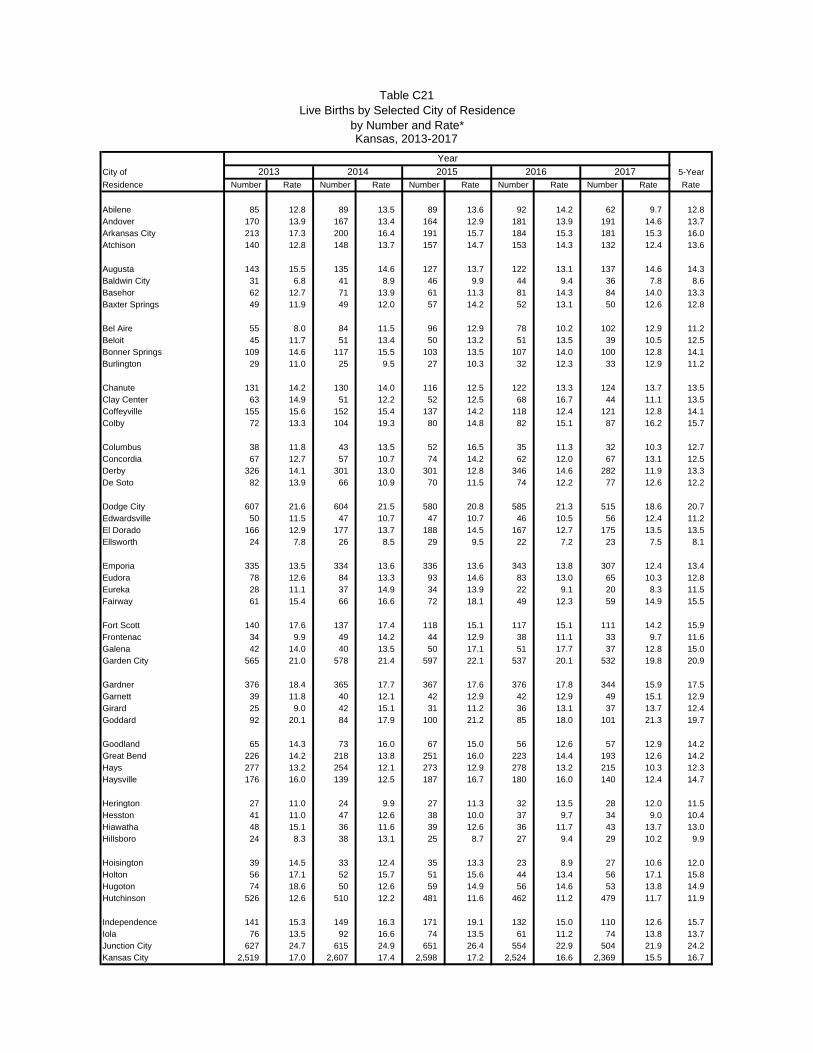
City of 5-Year
Residence Number Rate Number Rate Number Rate Number Rate Number Rate Rate
Abilene 85 12.8 89 13.5 89 13.6 92 14.2 62 9.7 12.8Andover 170 13.9 167 13.4 164 12.9 181 13.9 191 14.6 13.7Arkansas City 213 17.3 200 16.4 191 15.7 184 15.3 181 15.3 16.0Atchison 140 12.8 148 13.7 157 14.7 153 14.3 132 12.4 13.6
Augusta 143 15.5 135 14.6 127 13.7 122 13.1 137 14.6 14.3Baldwin City 31 6.8 41 8.9 46 9.9 44 9.4 36 7.8 8.6Basehor 62 12.7 71 13.9 61 11.3 81 14.3 84 14.0 13.3Baxter Springs 49 11.9 49 12.0 57 14.2 52 13.1 50 12.6 12.8
Bel Aire 55 8.0 84 11.5 96 12.9 78 10.2 102 12.9 11.2Beloit 45 11.7 51 13.4 50 13.2 51 13.5 39 10.5 12.5Bonner Springs 109 14.6 117 15.5 103 13.5 107 14.0 100 12.8 14.1Burlington 29 11.0 25 9.5 27 10.3 32 12.3 33 12.9 11.2
Chanute 131 14.2 130 14.0 116 12.5 122 13.3 124 13.7 13.5Clay Center 63 14.9 51 12.2 52 12.5 68 16.7 44 11.1 13.5Coffeyville 155 15.6 152 15.4 137 14.2 118 12.4 121 12.8 14.1Colby 72 13.3 104 19.3 80 14.8 82 15.1 87 16.2 15.7
Columbus 38 11.8 43 13.5 52 16.5 35 11.3 32 10.3 12.7Concordia 67 12.7 57 10.7 74 14.2 62 12.0 67 13.1 12.5Derby 326 14.1 301 13.0 301 12.8 346 14.6 282 11.9 13.3De Soto 82 13.9 66 10.9 70 11.5 74 12.2 77 12.6 12.2
Dodge City 607 21.6 604 21.5 580 20.8 585 21.3 515 18.6 20.7Edwardsville 50 11.5 47 10.7 47 10.7 46 10.5 56 12.4 11.2El Dorado 166 12.9 177 13.7 188 14.5 167 12.7 175 13.5 13.5Ellsworth 24 7.8 26 8.5 29 9.5 22 7.2 23 7.5 8.1
Emporia 335 13.5 334 13.6 336 13.6 343 13.8 307 12.4 13.4Eudora 78 12.6 84 13.3 93 14.6 83 13.0 65 10.3 12.8Eureka 28 11.1 37 14.9 34 13.9 22 9.1 20 8.3 11.5Fairway 61 15.4 66 16.6 72 18.1 49 12.3 59 14.9 15.5
Fort Scott 140 17.6 137 17.4 118 15.1 117 15.1 111 14.2 15.9Frontenac 34 9.9 49 14.2 44 12.9 38 11.1 33 9.7 11.6Galena 42 14.0 40 13.5 50 17.1 51 17.7 37 12.8 15.0Garden City 565 21.0 578 21.4 597 22.1 537 20.1 532 19.8 20.9
Gardner 376 18.4 365 17.7 367 17.6 376 17.8 344 15.9 17.5Garnett 39 11.8 40 12.1 42 12.9 42 12.9 49 15.1 12.9Girard 25 9.0 42 15.1 31 11.2 36 13.1 37 13.7 12.4Goddard 92 20.1 84 17.9 100 21.2 85 18.0 101 21.3 19.7
Goodland 65 14.3 73 16.0 67 15.0 56 12.6 57 12.9 14.2Great Bend 226 14.2 218 13.8 251 16.0 223 14.4 193 12.6 14.2Hays 277 13.2 254 12.1 273 12.9 278 13.2 215 10.3 12.3Haysville 176 16.0 139 12.5 187 16.7 180 16.0 140 12.4 14.7
Herington 27 11.0 24 9.9 27 11.3 32 13.5 28 12.0 11.5Hesston 41 11.0 47 12.6 38 10.0 37 9.7 34 9.0 10.4Hiawatha 48 15.1 36 11.6 39 12.6 36 11.7 43 13.7 13.0Hillsboro 24 8.3 38 13.1 25 8.7 27 9.4 29 10.2 9.9
Hoisington 39 14.5 33 12.4 35 13.3 23 8.9 27 10.6 12.0Holton 56 17.1 52 15.7 51 15.6 44 13.4 56 17.1 15.8Hugoton 74 18.6 50 12.6 59 14.9 56 14.6 53 13.8 14.9Hutchinson 526 12.6 510 12.2 481 11.6 462 11.2 479 11.7 11.9
Independence 141 15.3 149 16.3 171 19.1 132 15.0 110 12.6 15.7Iola 76 13.5 92 16.6 74 13.5 61 11.2 74 13.8 13.7Junction City 627 24.7 615 24.9 651 26.4 554 22.9 504 21.9 24.2Kansas City 2,519 17.0 2,607 17.4 2,598 17.2 2,524 16.6 2,369 15.5 16.7
Kansas, 2013-2017
2015
Live Births by Selected City of Residence
2013
by Number and Rate*
Table C21
Year
20172014 2016
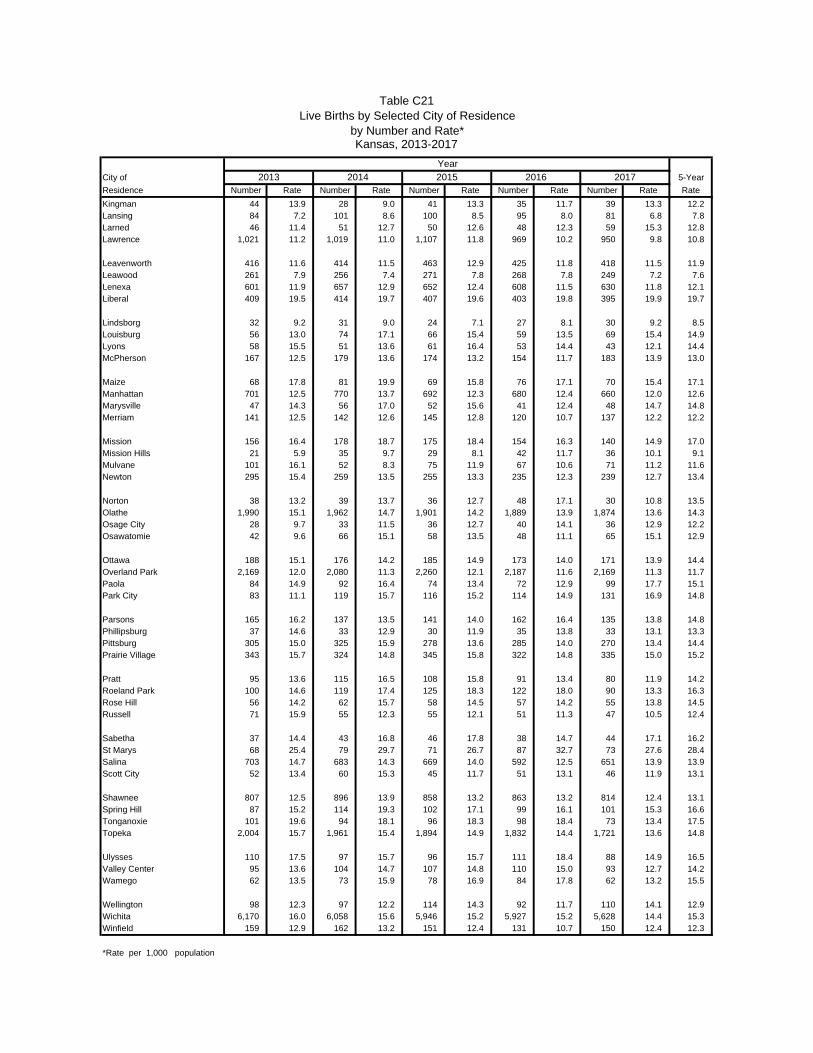
City of 5-Year
Residence Number Rate Number Rate Number Rate Number Rate Number Rate Rate
Kansas, 2013-2017
2015
Live Births by Selected City of Residence
2013
by Number and Rate*
Table C21
Year
20172014 2016
Kingman 44 13.9 28 9.0 41 13.3 35 11.7 39 13.3 12.2Lansing 84 7.2 101 8.6 100 8.5 95 8.0 81 6.8 7.8Larned 46 11.4 51 12.7 50 12.6 48 12.3 59 15.3 12.8Lawrence 1,021 11.2 1,019 11.0 1,107 11.8 969 10.2 950 9.8 10.8
Leavenworth 416 11.6 414 11.5 463 12.9 425 11.8 418 11.5 11.9Leawood 261 7.9 256 7.4 271 7.8 268 7.8 249 7.2 7.6Lenexa 601 11.9 657 12.9 652 12.4 608 11.5 630 11.8 12.1Liberal 409 19.5 414 19.7 407 19.6 403 19.8 395 19.9 19.7
Lindsborg 32 9.2 31 9.0 24 7.1 27 8.1 30 9.2 8.5Louisburg 56 13.0 74 17.1 66 15.4 59 13.5 69 15.4 14.9Lyons 58 15.5 51 13.6 61 16.4 53 14.4 43 12.1 14.4McPherson 167 12.5 179 13.6 174 13.2 154 11.7 183 13.9 13.0
Maize 68 17.8 81 19.9 69 15.8 76 17.1 70 15.4 17.1Manhattan 701 12.5 770 13.7 692 12.3 680 12.4 660 12.0 12.6Marysville 47 14.3 56 17.0 52 15.6 41 12.4 48 14.7 14.8Merriam 141 12.5 142 12.6 145 12.8 120 10.7 137 12.2 12.2
Mission 156 16.4 178 18.7 175 18.4 154 16.3 140 14.9 17.0Mission Hills 21 5.9 35 9.7 29 8.1 42 11.7 36 10.1 9.1Mulvane 101 16.1 52 8.3 75 11.9 67 10.6 71 11.2 11.6Newton 295 15.4 259 13.5 255 13.3 235 12.3 239 12.7 13.4
Norton 38 13.2 39 13.7 36 12.7 48 17.1 30 10.8 13.5Olathe 1,990 15.1 1,962 14.7 1,901 14.2 1,889 13.9 1,874 13.6 14.3Osage City 28 9.7 33 11.5 36 12.7 40 14.1 36 12.9 12.2Osawatomie 42 9.6 66 15.1 58 13.5 48 11.1 65 15.1 12.9
Ottawa 188 15.1 176 14.2 185 14.9 173 14.0 171 13.9 14.4Overland Park 2,169 12.0 2,080 11.3 2,260 12.1 2,187 11.6 2,169 11.3 11.7Paola 84 14.9 92 16.4 74 13.4 72 12.9 99 17.7 15.1Park City 83 11.1 119 15.7 116 15.2 114 14.9 131 16.9 14.8
Parsons 165 16.2 137 13.5 141 14.0 162 16.4 135 13.8 14.8Phillipsburg 37 14.6 33 12.9 30 11.9 35 13.8 33 13.1 13.3Pittsburg 305 15.0 325 15.9 278 13.6 285 14.0 270 13.4 14.4Prairie Village 343 15.7 324 14.8 345 15.8 322 14.8 335 15.0 15.2
Pratt 95 13.6 115 16.5 108 15.8 91 13.4 80 11.9 14.2Roeland Park 100 14.6 119 17.4 125 18.3 122 18.0 90 13.3 16.3Rose Hill 56 14.2 62 15.7 58 14.5 57 14.2 55 13.8 14.5Russell 71 15.9 55 12.3 55 12.1 51 11.3 47 10.5 12.4
Sabetha 37 14.4 43 16.8 46 17.8 38 14.7 44 17.1 16.2St Marys 68 25.4 79 29.7 71 26.7 87 32.7 73 27.6 28.4Salina 703 14.7 683 14.3 669 14.0 592 12.5 651 13.9 13.9Scott City 52 13.4 60 15.3 45 11.7 51 13.1 46 11.9 13.1
Shawnee 807 12.5 896 13.9 858 13.2 863 13.2 814 12.4 13.1Spring Hill 87 15.2 114 19.3 102 17.1 99 16.1 101 15.3 16.6Tonganoxie 101 19.6 94 18.1 96 18.3 98 18.4 73 13.4 17.5Topeka 2,004 15.7 1,961 15.4 1,894 14.9 1,832 14.4 1,721 13.6 14.8
Ulysses 110 17.5 97 15.7 96 15.7 111 18.4 88 14.9 16.5Valley Center 95 13.6 104 14.7 107 14.8 110 15.0 93 12.7 14.2Wamego 62 13.5 73 15.9 78 16.9 84 17.8 62 13.2 15.5
Wellington 98 12.3 97 12.2 114 14.3 92 11.7 110 14.1 12.9Wichita 6,170 16.0 6,058 15.6 5,946 15.2 5,927 15.2 5,628 14.4 15.3Winfield 159 12.9 162 13.2 151 12.4 131 10.7 150 12.4 12.3
*Rate per 1,000 population

*1919-1939, not available; 2017 not available
Figure C7
Percent of Births to Unmarried Mothers,Kansas and the U.S., 1919-2017
0
5
10
15
20
25
30
35
40
45
1919 1924 1929 1934 1939 1944 1949 1954 1959 1964 1969 1974 1979 1984 1989 1994 1999 2004 2009 2014
Per
cent
age
Year
Kansas
U.S.*

White Black Nat. Am. Asian/PI Other Hisp.
County of 45 & Non- Non- Non- Non- Non Any
Residence Total 10-14 15-19 20-24 25-29 30-34 35-39 40-44 Over n.s. Hisp. Hisp. Hisp. Hisp. Hisp.† Race n.s.
Kansas 12,990 13 1,800 4,790 3,541 1,854 817 168 7 0 7,481 1,680 103 154 547 3,018 7
Allen 62 0 12 25 19 3 3 0 0 0 56 1 0 0 3 2 0
Anderson 33 0 7 14 5 3 3 1 0 0 30 0 0 0 2 1 0
Atchison 77 0 11 35 19 7 5 0 0 0 63 4 0 0 6 4 0
Barber 18 0 2 6 6 2 2 0 0 0 18 0 0 0 0 0 0
Barton 123 0 20 47 35 15 5 1 0 0 80 2 0 0 4 37 0
Bourbon 77 0 14 32 24 5 1 1 0 0 72 1 0 0 3 1 0
Brown 49 0 12 17 15 4 1 0 0 0 34 0 9 0 3 3 0
Butler 246 0 42 80 74 31 18 1 0 0 220 5 2 2 2 15 0
Chase 8 0 0 5 1 2 0 0 0 0 6 0 0 0 2 0 0
Chautauqua 15 0 2 5 6 1 1 0 0 0 10 0 2 0 1 2 0
Cherokee 103 0 17 51 16 14 5 0 0 0 93 1 1 0 7 1 0
Cheyenne 10 0 0 5 2 1 2 0 0 0 7 0 0 0 0 3 0
Clark 5 0 1 1 2 1 0 0 0 0 4 0 0 0 0 1 0
Clay 31 0 3 13 12 3 0 0 0 0 29 0 0 0 0 2 0
Cloud 47 0 9 23 11 2 2 0 0 0 42 0 0 0 2 3 0
Coffey 26 0 4 10 11 1 0 0 0 0 23 0 0 0 2 1 0
Comanche 5 0 1 2 2 0 0 0 0 0 4 0 0 0 0 1 0
Cowley 205 0 30 83 58 24 7 3 0 0 147 5 2 1 4 46 0
Crawford 195 0 22 74 51 32 12 4 0 0 153 11 0 1 3 27 0
Decatur 7 0 2 2 1 2 0 0 0 0 7 0 0 0 0 0 0
Dickinson 63 0 6 28 18 8 3 0 0 0 54 3 0 0 4 2 0
Doniphan 25 0 1 12 9 3 0 0 0 0 23 0 0 0 2 0 0
Douglas 357 0 47 117 103 54 28 6 2 0 233 31 19 8 29 37 0
Edwards 10 0 1 4 0 2 2 1 0 0 5 0 0 0 1 4 0
Elk 8 0 1 4 0 3 0 0 0 0 7 0 1 0 0 0 0
Ellis 95 0 13 34 29 13 5 1 0 0 72 0 0 1 2 20 0
Ellsworth 19 0 2 8 7 2 0 0 0 0 18 0 0 0 0 1 0
Finney 301 3 41 115 82 40 15 5 0 0 58 7 0 7 0 229 0
Ford 281 0 52 89 60 53 27 0 0 0 64 7 1 1 2 206 0
Franklin 120 0 25 42 31 12 8 2 0 0 113 0 0 0 1 6 0
Geary 174 0 27 68 50 17 9 3 0 0 75 46 0 6 20 27 0
Gove 1 0 0 0 1 0 0 0 0 0 0 0 0 0 0 1 0
Graham 7 0 0 6 1 0 0 0 0 0 6 1 0 0 0 0 0
Grant 41 0 8 10 12 9 1 1 0 0 9 0 0 0 0 32 0
Gray 11 0 2 3 3 2 1 0 0 0 8 0 0 0 0 3 0
Greeley 5 0 2 2 0 1 0 0 0 0 2 0 0 0 0 3 0
Greenwood 20 0 4 11 0 3 2 0 0 0 19 0 0 0 1 0 0
Hamilton 12 0 1 8 2 1 0 0 0 0 7 0 0 0 0 5 0
Harper 22 0 6 9 3 3 1 0 0 0 19 1 0 0 1 1 0
Harvey 149 0 31 52 45 17 4 0 0 0 112 1 0 0 6 30 0
Haskell 11 0 1 7 2 1 0 0 0 0 8 0 0 0 1 2 0
Hodgeman 4 0 0 3 0 1 0 0 0 0 3 0 0 0 0 1 0
Jackson 63 0 13 27 11 8 3 1 0 0 35 0 18 0 3 7 0
Jefferson 71 0 12 32 16 7 4 0 0 0 65 0 0 1 2 3 0
Jewell 5 0 0 4 0 1 0 0 0 0 5 0 0 0 0 0 0
Johnson 1,430 0 125 449 422 264 132 37 1 0 843 195 3 22 66 299 2
Kearny 16 0 1 8 3 2 2 0 0 0 8 0 0 0 0 8 0
Kingman 25 0 0 12 9 2 2 0 0 0 24 0 0 0 1 0 0
Kiowa 5 0 2 0 3 0 0 0 0 0 5 0 0 0 0 0 0
Labette 125 0 12 51 40 13 7 2 0 0 104 8 5 0 4 4 0
Lane 3 0 0 1 2 0 0 0 0 0 3 0 0 0 0 0 0
Leavenworth 297 0 36 104 94 36 22 5 0 0 205 41 0 1 21 28 1
Lincoln 5 0 0 2 2 1 0 0 0 0 5 0 0 0 0 0 0
Linn 46 0 5 17 15 6 3 0 0 0 43 0 0 0 1 2 0
Logan 13 0 1 4 5 3 0 0 0 0 8 0 0 0 0 5 0
Kansas, 2017by Age-Group and Population Group of Mother
Births to Unmarried Mothers by County of Residence and Peer Group*Table C22
Age-Group of Mother Population Group

White Black Nat. Am. Asian/PI Other Hisp.
County of 45 & Non- Non- Non- Non- Non Any
Residence Total 10-14 15-19 20-24 25-29 30-34 35-39 40-44 Over n.s. Hisp. Hisp. Hisp. Hisp. Hisp.† Race n.s.
Kansas, 2017by Age-Group and Population Group of Mother
Births to Unmarried Mothers by County of Residence and Peer Group*Table C22
Age-Group of Mother Population Group
Lyon 158 0 21 62 42 20 11 1 1 0 85 4 1 0 5 63 0
McPherson 95 0 9 35 29 17 5 0 0 0 81 1 1 0 1 10 1
Marion 29 0 5 16 5 2 1 0 0 0 23 0 1 0 1 4 0
Marshall 34 0 1 17 9 5 1 0 1 0 28 1 0 0 0 5 0
Meade 12 0 1 5 1 3 2 0 0 0 10 0 0 0 0 2 0
Miami 143 0 27 54 37 17 5 3 0 0 132 2 0 0 6 3 0
Mitchell 17 0 2 5 7 1 1 1 0 0 15 0 0 0 0 2 0
Montgomery 174 0 21 65 58 24 4 2 0 0 130 18 4 1 12 9 0
Morris 19 0 0 11 5 1 2 0 0 0 18 0 0 0 0 1 0
Morton 18 1 4 6 2 4 1 0 0 0 11 0 0 0 0 7 0
Nemaha 33 0 5 11 8 4 3 2 0 0 31 1 0 0 0 1 0
Neosho 87 0 15 41 14 15 2 0 0 0 72 3 0 0 6 6 0
Ness 4 0 0 4 0 0 0 0 0 0 4 0 0 0 0 0 0
Norton 16 0 1 9 5 0 1 0 0 0 13 0 0 0 0 3 0
Osage 67 0 11 24 17 10 4 1 0 0 62 0 0 0 2 3 0
Osborne 8 0 2 3 2 1 0 0 0 0 8 0 0 0 0 0 0
Ottawa 10 0 0 4 4 2 0 0 0 0 9 0 0 0 1 0 0
Pawnee 39 0 5 18 11 2 3 0 0 0 33 0 0 0 2 4 0
Phillips 17 0 1 5 6 4 0 1 0 0 16 0 0 0 0 1 0
Pottawatomie 42 0 6 18 10 6 2 0 0 0 36 0 1 0 2 3 0
Pratt 36 0 7 14 14 1 0 0 0 0 31 1 0 0 1 3 0
Rawlins 12 0 1 4 3 3 1 0 0 0 11 0 0 0 0 1 0
Reno 278 0 47 104 72 31 18 5 1 0 199 6 3 1 15 53 1
Republic 22 0 2 13 4 2 0 1 0 0 20 0 0 0 1 1 0
Rice 41 0 8 15 8 6 4 0 0 0 31 0 0 0 0 10 0
Riley 190 0 23 73 49 33 8 4 0 0 124 22 1 0 10 33 0
Rooks 15 0 4 5 4 1 1 0 0 0 13 0 0 0 0 2 0
Rush 12 0 1 6 3 2 0 0 0 0 11 1 0 0 0 0 0
Russell 27 0 3 8 7 7 2 0 0 0 25 0 0 0 1 1 0
Saline 311 0 37 115 96 48 13 2 0 0 207 11 1 3 19 70 0
Scott 15 0 1 10 4 0 0 0 0 0 12 0 0 0 0 3 0
Sedgwick 2,912 5 443 1,068 781 407 174 34 0 0 1,435 635 7 71 106 658 0
Seward 201 0 32 78 49 28 13 1 0 0 28 2 0 0 3 168 0
Shawnee 970 0 127 363 253 159 57 11 0 0 509 149 14 4 86 208 0
Sheridan 2 0 2 0 0 0 0 0 0 0 2 0 0 0 0 0 0
Sherman 22 0 4 8 2 5 3 0 0 0 20 0 0 0 0 2 0
Smith 10 0 3 4 2 0 1 0 0 0 7 0 1 0 2 0 0
Stafford 9 0 0 4 1 1 2 1 0 0 5 0 0 0 0 4 0
Stanton 9 0 2 4 2 1 0 0 0 0 4 0 0 0 0 5 0
Stevens 23 0 3 10 5 3 2 0 0 0 12 0 0 0 1 10 0
Sumner 108 0 14 41 36 13 4 0 0 0 102 2 0 0 0 4 0
Thomas 38 0 6 17 6 8 1 0 0 0 32 1 0 0 0 5 0
Trego 7 0 3 2 1 1 0 0 0 0 7 0 0 0 0 0 0
Wabaunsee 17 0 3 7 4 3 0 0 0 0 17 0 0 0 0 0 0
Wallace. 2 0 0 1 1 0 0 0 0 0 1 0 0 0 0 1 0
Washington 8 0 1 2 3 0 2 0 0 0 5 0 0 0 1 2 0
Wichita 7 0 1 2 4 0 0 0 0 0 3 0 0 0 0 4 0
Wilson 49 0 7 23 9 6 3 1 0 0 44 0 1 0 0 4 0
Woodson 15 0 3 7 2 3 0 0 0 0 13 0 0 0 0 2 0Wyandotte 1,418 4 186 496 394 203 112 22 1 0 368 449 4 23 51 521 2
n.s. 0 0 0 0 0 0 0 0 0 0 0 0 0 0 0 0 0Peer Group
Frontier 331 1 49 141 67 49 22 2 0 0 256 2 4 0 7 62 0
Rural 866 0 123 365 231 98 40 8 1 0 715 5 11 0 22 113 0
Densely -Settled Rural 2,429 3 362 960 633 322 131 17 1 0 1,452 51 30 11 65 819 1
Semi-Urban 1,980 0 302 727 563 262 99 26 1 0 1,465 122 11 14 94 273 1
Urban 7,384 9 964 2,597 2,047 1,123 525 115 4 0 3,593 1,500 47 129 359 1,751 5
* See Technical Notes for Peer Group definition.
† Includes selection of two or more races and other non-specified race
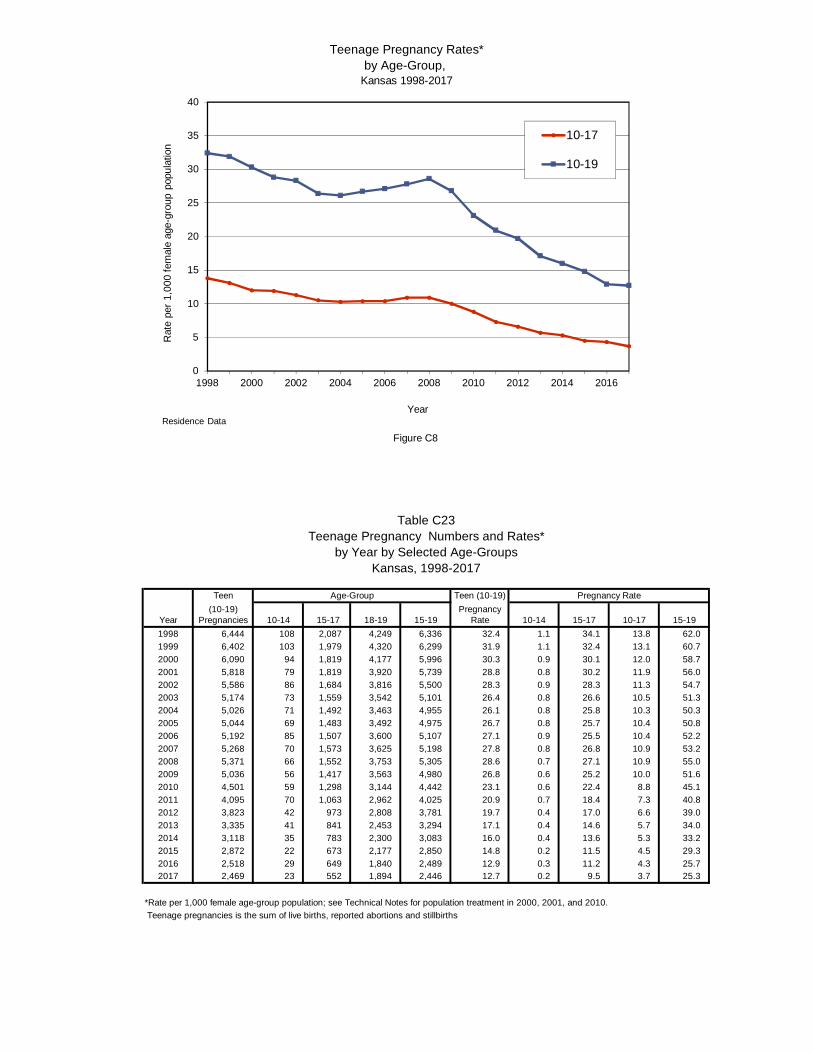
Teen Teen (10-19)
(10-19) PregnancyYear Pregnancies 10-14 15-17 18-19 15-19 Rate 10-14 15-17 10-17 15-19
1998 6,444 108 2,087 4,249 6,336 32.4 1.1 34.1 13.8 62.0
1999 6,402 103 1,979 4,320 6,299 31.9 1.1 32.4 13.1 60.7
2000 6,090 94 1,819 4,177 5,996 30.3 0.9 30.1 12.0 58.7
2001 5,818 79 1,819 3,920 5,739 28.8 0.8 30.2 11.9 56.0
2002 5,586 86 1,684 3,816 5,500 28.3 0.9 28.3 11.3 54.7
2003 5,174 73 1,559 3,542 5,101 26.4 0.8 26.6 10.5 51.3
2004 5,026 71 1,492 3,463 4,955 26.1 0.8 25.8 10.3 50.3
2005 5,044 69 1,483 3,492 4,975 26.7 0.8 25.7 10.4 50.8
2006 5,192 85 1,507 3,600 5,107 27.1 0.9 25.5 10.4 52.2
2007 5,268 70 1,573 3,625 5,198 27.8 0.8 26.8 10.9 53.2
2008 5,371 66 1,552 3,753 5,305 28.6 0.7 27.1 10.9 55.0
2009 5,036 56 1,417 3,563 4,980 26.8 0.6 25.2 10.0 51.6
2010 4,501 59 1,298 3,144 4,442 23.1 0.6 22.4 8.8 45.1
2011 4,095 70 1,063 2,962 4,025 20.9 0.7 18.4 7.3 40.8
2012 3,823 42 973 2,808 3,781 19.7 0.4 17.0 6.6 39.0
2013 3,335 41 841 2,453 3,294 17.1 0.4 14.6 5.7 34.0
2014 3,118 35 783 2,300 3,083 16.0 0.4 13.6 5.3 33.2
2015 2,872 22 673 2,177 2,850 14.8 0.2 11.5 4.5 29.3
2016 2,518 29 649 1,840 2,489 12.9 0.3 11.2 4.3 25.72017 2,469 23 552 1,894 2,446 12.7 0.2 9.5 3.7 25.3
*Rate per 1,000 female age-group population; see Technical Notes for population treatment in 2000, 2001, and 2010.
Teenage pregnancies is the sum of live births, reported abortions and stillbirths
Teenage Pregnancy Numbers and Rates*by Year by Selected Age-Groups
Kansas, 1998-2017
Teenage Pregnancy Rates*by Age-Group,
Age-Group Pregnancy Rate
Kansas 1998-2017
Table C23
0
5
10
15
20
25
30
35
40
1998 2000 2002 2004 2006 2008 2010 2012 2014 2016
Rat
e pe
r 1
,00
0 f
emal
e ag
e-gr
oup
popu
latio
n
Year
10-17
10-19
Figure C8
Residence Data

Figure C9
Figure C10
*Includes selection of two or more races
or other race
Teenage Live Births by Population GroupKansas, 2017
Teen and Non-Teen Live Births:Percent Distribution by Month Prenatal Care Began
Kansas, 2017
2.2
32.233.6
13.8
6.9
4.2 2.61.7 1.0
1.92.7
39.3 40.0
8.5
3.72.0 1.4 1.0
0.5 0.9
0.0
5.0
10.0
15.0
20.0
25.0
30.0
35.0
40.0
45.0
1 2 3 4 5 6 7 8 9 None
Per
cen
t
Month
Teen Non-Teen
WhiteNon-Hisp.
53.7%Black Non-Hisp.
11.0%
Other Non-Hisp.*
6.9%
Hisp.Any Race
28.4%

Year Number Rate Number Rate Number Rate Number Rate Number Rate Number Rate Number Rate Number Rate Number Rate Number Rate Number Rate Number Rate
2013 14 0.2 433 3.9 1,856 26.3 1,870 13.4 2 0.3 89 7.1 353 44.7 355 22.4 17 1.0 293 11.5 872 60.7 889 28.7
2014 15 0.2 416 3.8 1,737 24.8 1,752 12.6 6 0.8 84 6.7 317 40.1 323 20.4 11 0.6 257 9.9 808 54.8 819 25.8
2015 9 0.1 317 2.9 1,577 22.7 1,586 11.6 5 0.6 87 6.8 297 38.1 302 19.0 5 0.3 241 9.0 779 50.5 784 24.0
2016 12 0.2 317 2.9 1,366 19.8 1,378 10.1 6 0.7 85 6.7 260 33.8 266 16.9 8 0.5 236 8.6 713 45.1 721 21.6
2017 11 0.2 266 2.5 1,326 19.5 1,337 9.9 2 0.2 79 6.3 282 36.8 284 17.9 8 0.4 185 6.6 667 41.3 675 19.8
*Rate per 1,000 female race/Hispanic age-group population. †This table includes mutually exclusive race/ethnicity groups and is not comparable to tables in Annual Summaries prior to 2006.
See Technical Notes.
by Year for Selected Population Groups†
10-19
Hispanic Any Race
Table C24Teenage Pregnancy Numbers and Rates*
and Age-GroupsKansas, 2013-2017
10-14 10-1710-14
White Non-Hispanic Black Non-Hispanic
10-17 10-1915-19 15-1910-1710-1415-19 10-19

Total Teenage†
Live Births Stillbirths Abortions Pregnancies Preg. Rates
County of Age-Group Age-Group Age-Group Age Group Age-Group
Residence 10-14 15-19 10-14 15-19 10-14 15-19 10-14 15-19 10-19 10-19
Kansas 13 2,053 0 11 10 382 23 2,446 2,469 12.7
Allen 0 12 0 0 0 0 0 12 12 14.1Anderson 0 7 0 0 0 0 0 7 7 13.6Atchison 0 12 0 0 0 0 0 12 12 9.4Barber 0 2 0 0 0 0 0 2 2 8.1Barton 0 22 0 1 0 4 0 27 27 15.4
Bourbon 0 15 0 0 0 3 0 18 18 17.2Brown 0 14 0 0 0 0 0 14 14 22.6Butler 0 50 0 1 0 5 0 56 56 11.0Chase 0 0 0 0 0 0 0 0 0 0.0Chautauqua 0 2 0 0 0 0 0 2 2 11.2
Cherokee 0 18 0 0 0 2 0 20 20 15.0Cheyenne 0 0 0 0 0 0 0 0 0 0.0Clark 0 1 0 0 0 0 0 1 1 6.7Clay 0 3 0 0 0 0 0 3 3 6.0Cloud 0 10 0 0 0 0 0 10 10 17.4
Coffey 0 5 0 0 0 1 0 6 6 11.8Comanche 0 1 0 0 0 0 0 1 1 8.0Cowley 0 34 0 0 0 2 0 36 36 14.9Crawford 0 27 0 0 0 6 0 33 33 12.5Decatur 0 2 0 0 0 0 0 2 2 13.8
Dickinson 0 8 0 0 0 1 0 9 9 7.4Doniphan 0 1 0 0 0 2 0 3 3 5.7Douglas 0 50 0 0 0 27 0 77 77 9.0Edwards 0 1 0 0 0 0 0 1 1 5.2Elk 0 1 0 0 0 0 0 1 1 7.4
Ellis 0 17 0 0 0 9 0 26 26 14.2Ellsworth 0 2 0 0 0 0 0 2 2 7.0Finney 3 48 0 0 0 3 3 51 54 18.6Ford 0 63 0 0 1 5 1 68 69 27.5Franklin 0 29 0 0 0 3 0 32 32 18.0
Geary 0 63 0 0 1 12 1 75 76 39.4Gove 0 0 0 0 0 0 0 0 0 0.0Graham 0 0 0 0 0 0 0 0 0 0.0Grant 0 9 0 0 0 2 0 11 11 17.5Gray 0 2 0 0 0 0 0 2 2 4.1
Greeley 0 3 0 0 0 0 0 3 3 34.1Greenwood 0 4 0 0 0 0 0 4 4 11.1Hamilton 0 1 0 0 0 0 0 1 1 5.6Harper 0 8 0 0 0 0 0 8 8 24.2Harvey 0 32 0 0 0 3 0 35 35 14.5
Haskell 0 2 0 0 0 2 0 4 4 13.2Hodgeman 0 0 0 0 0 0 0 0 0 0.0Jackson 0 14 0 0 0 0 0 14 14 15.8Jefferson 0 12 0 0 0 2 0 14 14 11.6Jewell 0 0 0 0 0 0 0 0 0 0.0
Johnson 0 134 0 1 1 51 1 186 187 4.8Kearny 0 2 0 0 0 1 0 3 3 10.9Kingman 0 2 0 0 0 0 0 2 2 4.2Kiowa 0 2 0 0 0 0 0 2 2 11.5Labette 0 21 0 0 0 0 0 21 21 17.2
Lane 0 0 0 0 0 0 0 0 0 0.0Leavenworth 0 47 0 0 1 8 1 55 56 11.3Lincoln 0 0 0 0 0 0 0 0 0 0.0Linn 0 6 0 0 0 3 0 9 9 14.2Logan 0 1 0 0 0 0 0 1 1 5.5
Table C25Teenage Pregnancies by County of Residence and Peer Group*
by Age-Group and Component Kansas, 2017

Total Teenage†
Live Births Stillbirths Abortions Pregnancies Preg. Rates
County of Age-Group Age-Group Age-Group Age Group Age-Group
Residence 10-14 15-19 10-14 15-19 10-14 15-19 10-14 15-19 10-19 10-19
Table C25Teenage Pregnancies by County of Residence and Peer Group*
by Age-Group and Component Kansas, 2017
Lyon 0 25 0 0 0 4 0 29 29 11.8McPherson 0 10 0 0 0 1 0 11 11 5.8Marion 0 5 0 0 0 0 0 5 5 6.4Marshall 0 1 0 0 0 0 0 1 1 1.6Meade 0 1 0 0 0 0 0 1 1 3.4
Miami 0 30 0 0 0 8 0 38 38 16.1Mitchell 0 2 0 0 0 1 0 3 3 7.9Montgomery 0 22 0 0 0 0 0 22 22 10.5Morris 0 3 0 0 0 0 0 3 3 10.0Morton 1 5 0 0 0 0 1 5 6 31.7
Nemaha 0 7 0 0 0 0 0 7 7 10.6Neosho 0 16 0 0 0 1 0 17 17 15.7Ness 0 0 0 0 0 0 0 0 0 0.0Norton 0 2 0 0 0 0 0 2 2 7.1Osage 0 11 0 0 0 2 0 13 13 13.1
Osborne 0 2 0 0 0 0 0 2 2 10.8Ottawa 0 0 0 0 0 0 0 0 0 0.0Pawnee 0 6 0 1 0 0 0 7 7 25.5Phillips 0 1 0 0 0 0 0 1 1 2.9Pottawatomie 0 8 0 0 0 4 0 12 12 6.8
Pratt 0 7 0 0 0 2 0 9 9 15.3Rawlins 0 1 0 0 0 0 0 1 1 7.9Reno 0 54 0 0 0 4 0 58 58 14.2Republic 0 2 0 0 0 0 0 2 2 8.2Rice 0 9 0 0 0 3 0 12 12 18.2
Riley 0 44 0 0 0 12 0 56 56 11.1Rooks 0 4 0 0 0 0 0 4 4 12.7Rush 0 1 0 0 0 0 0 1 1 5.7Russell 0 3 0 0 0 1 0 4 4 10.7Saline 0 41 0 0 0 10 0 51 51 14.9
Scott 0 2 0 0 0 0 0 2 2 5.7Sedgwick 5 474 0 3 4 81 9 558 567 16.3Seward 0 36 0 0 1 4 1 40 41 23.5Shawnee 0 133 0 0 1 24 1 157 158 13.7Sheridan 0 2 0 0 0 0 0 2 2 12.2
Sherman 0 4 0 0 0 2 0 6 6 15.9Smith 0 3 0 0 0 0 0 3 3 14.5Stafford 0 1 0 1 0 0 0 2 2 8.1Stanton 0 2 0 0 0 0 0 2 2 12.8Stevens 0 3 0 0 0 0 0 3 3 6.5
Sumner 0 14 0 0 0 1 0 15 15 9.9Thomas 0 6 0 0 0 0 0 6 6 10.4Trego 0 3 0 0 0 0 0 3 3 20.7Wabaunsee 0 3 0 0 0 0 0 3 3 6.9Wallace 0 0 0 0 0 0 0 0 0 0.0
Washington 0 1 0 0 0 0 0 1 1 3.2Wichita 0 1 0 0 0 0 0 1 1 6.3Wilson 0 9 0 0 0 0 0 9 9 15.7Woodson 0 4 0 0 0 1 0 5 5 26.2Wyandotte 4 207 0 3 0 43 4 253 257 22.6n.s. 0 0 0 0 0 16 0 16 16 n/a
Peer GroupFrontier 1 53 0 1 0 3 1 57 58 8.8Rural 0 155 0 1 0 17 0 173 173 10.9Densely -Settled Rural 3 408 0 1 2 49 5 458 463 14.9Semi-Urban 0 392 0 1 1 63 1 456 457 14.8Urban 9 1,045 0 7 7 234 16 1,286 1,302 11.8
* See Technical Notes for Peer Group definition. † Rate per 1,000 female age-group population

Teenage Pregnancies for 10-17 Year Olds
by County of Residence and Peer Group*, by ComponentKansas, 2017
County of Total Pregnancy
Residence Live Births Stillbirths Abortions Pregnancies Rate†
Kansas 471 4 100 575 3.7
Allen 5 0 0 5 7.5Anderson 0 0 0 0 0.0Atchison 2 0 0 2 2.3Barber 0 0 0 0 0.0Barton 5 0 1 6 4.2
Bourbon 4 0 0 4 4.6Brown 2 0 0 2 3.7Butler 7 0 2 9 2.1Chase 0 0 0 0 0.0Chautauqua 0 0 0 0 0.0
Cherokee 2 0 1 3 2.7Cheyenne 0 0 0 0 0.0Clark 1 0 0 1 8.3Clay 0 0 0 0 0.0Cloud 0 0 0 0 0.0
Coffey 2 0 0 2 4.7Comanche 0 0 0 0 0.0Cowley 6 0 0 6 3.3Crawford 7 0 0 7 3.8Decatur 0 0 0 0 0.0
Dickinson 3 0 0 3 2.9Doniphan 0 0 0 0 0.0Douglas 13 0 4 17 3.6Edwards 1 0 0 1 6.4Elk 0 0 0 0 0.0
Ellis 4 0 0 4 3.2Ellsworth 0 0 0 0 0.0Finney 9 0 1 10 4.3Ford 19 0 3 22 10.7Franklin 5 0 2 7 4.9
Geary 5 0 2 7 4.4Gove 0 0 0 0 0.0Graham 0 0 0 0 0.0Grant 3 0 2 5 9.6Gray 0 0 0 0 0.0
Greeley 1 0 0 1 13.9Greenwood 0 0 0 0 0.0Hamilton 0 0 0 0 0.0Harper 3 0 0 3 10.6Harvey 10 0 1 11 5.8
Haskell 0 0 0 0 0.0Hodgeman 0 0 0 0 0.0Jackson 3 0 0 3 4.1Jefferson 1 0 1 2 1.9Jewell 0 0 0 0 0.0
Johnson 32 0 17 49 1.5Kearny 0 0 0 0 0.0Kingman 1 0 0 1 2.5Kiowa 2 0 0 2 16.4Labette 1 0 0 1 1.0
Lane 0 0 0 0 0.0Leavenworth 7 0 1 8 1.9Lincoln 0 0 0 0 0.0
Linn 0 0 1 1 1.9Logan 1 0 0 1 6.4
Table C26
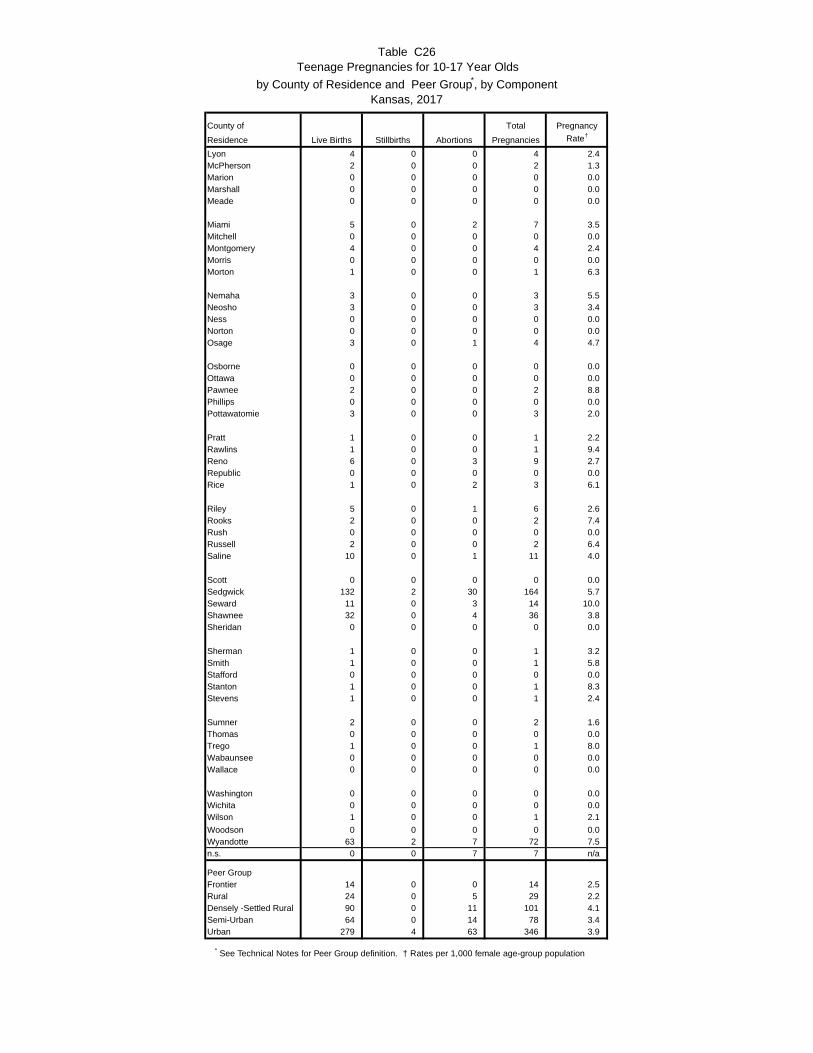
Teenage Pregnancies for 10-17 Year Olds
by County of Residence and Peer Group*, by ComponentKansas, 2017
County of Total Pregnancy
Residence Live Births Stillbirths Abortions Pregnancies Rate†
Table C26
Lyon 4 0 0 4 2.4McPherson 2 0 0 2 1.3Marion 0 0 0 0 0.0Marshall 0 0 0 0 0.0Meade 0 0 0 0 0.0
Miami 5 0 2 7 3.5Mitchell 0 0 0 0 0.0Montgomery 4 0 0 4 2.4Morris 0 0 0 0 0.0Morton 1 0 0 1 6.3
Nemaha 3 0 0 3 5.5Neosho 3 0 0 3 3.4Ness 0 0 0 0 0.0Norton 0 0 0 0 0.0Osage 3 0 1 4 4.7
Osborne 0 0 0 0 0.0Ottawa 0 0 0 0 0.0Pawnee 2 0 0 2 8.8Phillips 0 0 0 0 0.0Pottawatomie 3 0 0 3 2.0
Pratt 1 0 0 1 2.2Rawlins 1 0 0 1 9.4Reno 6 0 3 9 2.7Republic 0 0 0 0 0.0Rice 1 0 2 3 6.1
Riley 5 0 1 6 2.6Rooks 2 0 0 2 7.4Rush 0 0 0 0 0.0Russell 2 0 0 2 6.4Saline 10 0 1 11 4.0
Scott 0 0 0 0 0.0Sedgwick 132 2 30 164 5.7Seward 11 0 3 14 10.0Shawnee 32 0 4 36 3.8Sheridan 0 0 0 0 0.0
Sherman 1 0 0 1 3.2Smith 1 0 0 1 5.8Stafford 0 0 0 0 0.0Stanton 1 0 0 1 8.3Stevens 1 0 0 1 2.4
Sumner 2 0 0 2 1.6Thomas 0 0 0 0 0.0Trego 1 0 0 1 8.0Wabaunsee 0 0 0 0 0.0Wallace 0 0 0 0 0.0
Washington 0 0 0 0 0.0Wichita 0 0 0 0 0.0Wilson 1 0 0 1 2.1
Woodson 0 0 0 0 0.0Wyandotte 63 2 7 72 7.5n.s. 0 0 7 7 n/a
Peer GroupFrontier 14 0 0 14 2.5Rural 24 0 5 29 2.2Densely -Settled Rural 90 0 11 101 4.1Semi-Urban 64 0 14 78 3.4Urban 279 4 63 346 3.9
* See Technical Notes for Peer Group definition. † Rates per 1,000 female age-group population

D. FETAL AND INFANT MORTALITY

Total
Cause of Death* Stillbirths 20-31 32-41 42 & Over n.s.
All Causes 184 119 64 0 1
Certain Conditions Originating in the Perinatal Period 165 107 57 0 1
-Fetus Affected by Maternal Conditions 20 10 10 0 0
-Fetus Affected by Maternal Complications of Pregnancy 23 20 3 0 0
-Fetus Affected by Complications of Placenta, Cord & Membrane 50 28 22 0 0
-Fetus Affected by Complications of Labor & Delivery 1 0 0 0 1
-Disorders Related to Short Gestation & Low Birth Weight 3 3 0 0 0
-Hypoxia and Birth Asphyxia 0 0 0 0 0
-Cardiovascular Disorders 0 0 0 0 0
-Hemorrhagic & Hematologic Disorders of Fetus 0 0 0 0 0
-Unspecified Cause 60 40 20 0 0
-Other Perinatal Conditions 8 6 2 0 0
Congenital Anomalies 18 12 6 0 0
All other Causes 1 0 1 0 0
* The ICD-10 codes associated with each category are listed in Appendix 8.
Table D1Number of Stillbirths by Cause of Death and Weeks Gestation
Kansas, 2017

Kansas, 2017
*Includes selection of two or more races and other
non-specified race
Figure D1
Number of StillbirthsBy Selected Characteristics
151
30
20
20
40
60
80
100
120
140
160
<2500 2500-4499 4500 & Over
Num
ber
of S
tillb
irths
Birth Weight in Grams
119
64
00
20
40
60
80
100
120
140
20-31 32-41 42 & Over
Num
ber
of S
tillb
irths
Weeks Gestation
72
4228
2022
0
20
40
60
80
100
120
140
1st 2nd 3rd 4th 5th & Over
Num
ber
of S
tillb
irths
Birth Order
173
110 0
0
20
40
60
80
100
120
140
160
180
200
Single Twin Triplet Other
Num
ber
of S
tillb
irths
Plurality
99
79
0
20
40
60
80
100
120
140
Married Unmarried
Num
ber
of S
tillb
irths
Marital Status
131
19
1 3 4
25
0
30
60
90
120
150
WhiteNon-Hisp.
BlackNon-Hisp.
Nat.Amer.
Non-Hisp.
AsianPac. Non-
Hisp.
OtherNon-Hisp*
Hisp. AnyRace
Num
ber
of S
tillb
irths
Population Group
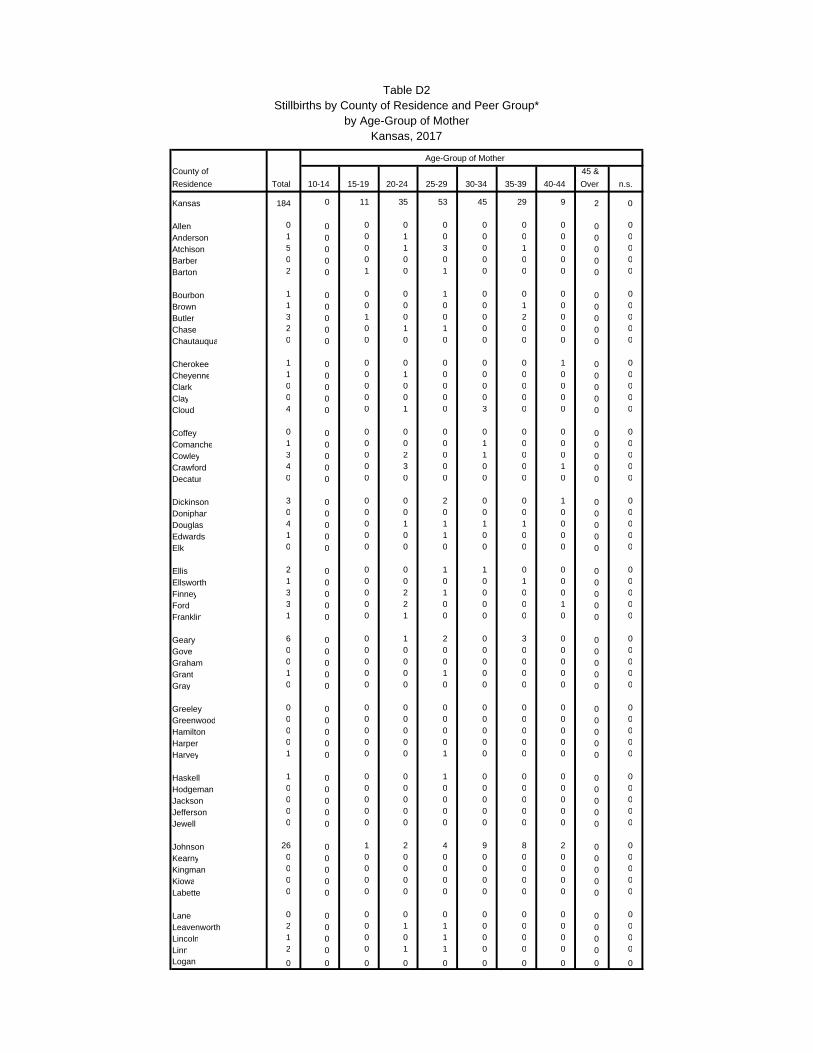
County of 45 &
Residence Total 10-14 15-19 20-24 25-29 30-34 35-39 40-44 Over n.s.
Kansas 184 0 11 35 53 45 29 9 2 0
Allen 0 0 0 0 0 0 0 0 0 0
Anderson 1 0 0 1 0 0 0 0 0 0
Atchison 5 0 0 1 3 0 1 0 0 0
Barber 0 0 0 0 0 0 0 0 0 0
Barton 2 0 1 0 1 0 0 0 0 0
Bourbon 1 0 0 0 1 0 0 0 0 0
Brown 1 0 0 0 0 0 1 0 0 0
Butler 3 0 1 0 0 0 2 0 0 0
Chase 2 0 0 1 1 0 0 0 0 0
Chautauqua 0 0 0 0 0 0 0 0 0 0
Cherokee 1 0 0 0 0 0 0 1 0 0
Cheyenne 1 0 0 1 0 0 0 0 0 0
Clark 0 0 0 0 0 0 0 0 0 0
Clay 0 0 0 0 0 0 0 0 0 0
Cloud 4 0 0 1 0 3 0 0 0 0
Coffey 0 0 0 0 0 0 0 0 0 0
Comanche 1 0 0 0 0 1 0 0 0 0
Cowley 3 0 0 2 0 1 0 0 0 0
Crawford 4 0 0 3 0 0 0 1 0 0
Decatur 0 0 0 0 0 0 0 0 0 0
Dickinson 3 0 0 0 2 0 0 1 0 0
Doniphan 0 0 0 0 0 0 0 0 0 0
Douglas 4 0 0 1 1 1 1 0 0 0
Edwards 1 0 0 0 1 0 0 0 0 0
Elk 0 0 0 0 0 0 0 0 0 0
Ellis 2 0 0 0 1 1 0 0 0 0
Ellsworth 1 0 0 0 0 0 1 0 0 0
Finney 3 0 0 2 1 0 0 0 0 0
Ford 3 0 0 2 0 0 0 1 0 0
Franklin 1 0 0 1 0 0 0 0 0 0
Geary 6 0 0 1 2 0 3 0 0 0
Gove 0 0 0 0 0 0 0 0 0 0
Graham 0 0 0 0 0 0 0 0 0 0
Grant 1 0 0 0 1 0 0 0 0 0
Gray 0 0 0 0 0 0 0 0 0 0
Greeley 0 0 0 0 0 0 0 0 0 0
Greenwood 0 0 0 0 0 0 0 0 0 0
Hamilton 0 0 0 0 0 0 0 0 0 0
Harper 0 0 0 0 0 0 0 0 0 0
Harvey 1 0 0 0 1 0 0 0 0 0
Haskell 1 0 0 0 1 0 0 0 0 0
Hodgeman 0 0 0 0 0 0 0 0 0 0
Jackson 0 0 0 0 0 0 0 0 0 0
Jefferson 0 0 0 0 0 0 0 0 0 0
Jewell 0 0 0 0 0 0 0 0 0 0
Johnson 26 0 1 2 4 9 8 2 0 0
Kearny 0 0 0 0 0 0 0 0 0 0
Kingman 0 0 0 0 0 0 0 0 0 0
Kiowa 0 0 0 0 0 0 0 0 0 0
Labette 0 0 0 0 0 0 0 0 0 0
Lane 0 0 0 0 0 0 0 0 0 0
Leavenworth 2 0 0 1 1 0 0 0 0 0
Lincoln 1 0 0 0 1 0 0 0 0 0
Linn 2 0 0 1 1 0 0 0 0 0
Logan 0 0 0 0 0 0 0 0 0 0
Table D2Stillbirths by County of Residence and Peer Group*
by Age-Group of MotherKansas, 2017
Age-Group of Mother

County of 45 &
Residence Total 10-14 15-19 20-24 25-29 30-34 35-39 40-44 Over n.s.
Table D2Stillbirths by County of Residence and Peer Group*
by Age-Group of MotherKansas, 2017
Age-Group of Mother
Lyon 2 0 0 0 0 2 0 0 0 0
McPherson 3 0 0 0 2 1 0 0 0 0
Marion 0 0 0 0 0 0 0 0 0 0
Marshall 0 0 0 0 0 0 0 0 0 0
Meade 1 0 0 0 1 0 0 0 0 0
Miami 1 0 0 0 1 0 0 0 0 0
Mitchell 0 0 0 0 0 0 0 0 0 0
Montgomery 1 0 0 0 0 1 0 0 0 0
Morris 0 0 0 0 0 0 0 0 0 0
Morton 0 0 0 0 0 0 0 0 0 0
Nemaha 2 0 0 0 0 2 0 0 0 0
Neosho 0 0 0 0 0 0 0 0 0 0
Ness 0 0 0 0 0 0 0 0 0 0
Norton 1 0 0 0 0 1 0 0 0 0
Osage 0 0 0 0 0 0 0 0 0 0
Osborne 0 0 0 0 0 0 0 0 0 0
Ottawa 0 0 0 0 0 0 0 0 0 0
Pawnee 1 0 1 0 0 0 0 0 0 0
Phillips 1 0 0 0 0 0 1 0 0 0
Pottawatomie 0 0 0 0 0 0 0 0 0 0
Pratt 2 0 0 0 1 1 0 0 0 0
Rawlins 0 0 0 0 0 0 0 0 0 0
Reno 3 0 0 0 2 1 0 0 0 0
Republic 2 0 0 1 1 0 0 0 0 0
Rice 0 0 0 0 0 0 0 0 0 0
Riley 4 0 0 1 1 1 1 0 0 0
Rooks 0 0 0 0 0 0 0 0 0 0
Rush 0 0 0 0 0 0 0 0 0 0
Russell 2 0 0 0 0 1 0 0 1 0
Saline 1 0 0 0 1 0 0 0 0 0
Scott 0 0 0 0 0 0 0 0 0 0
Sedgwick 31 0 3 5 5 10 6 1 1 0
Seward 2 0 0 1 0 1 0 0 0 0
Shawnee 12 0 0 3 5 3 0 1 0 0
Sheridan 0 0 0 0 0 0 0 0 0 0
Sherman 0 0 0 0 0 0 0 0 0 0
Smith 0 0 0 0 0 0 0 0 0 0
Stafford 1 0 1 0 0 0 0 0 0 0
Stanton 0 0 0 0 0 0 0 0 0 0
Stevens 1 0 0 0 1 0 0 0 0 0
Sumner 2 0 0 0 1 1 0 0 0 0
Thomas 1 0 0 0 1 0 0 0 0 0
Trego 0 0 0 0 0 0 0 0 0 0
Wabaunsee 1 0 0 0 1 0 0 0 0 0
Wallace 0 0 0 0 0 0 0 0 0 0
Washington 0 0 0 0 0 0 0 0 0 0
Wichita 0 0 0 0 0 0 0 0 0 0Wilson 0 0 0 0 0 0 0 0 0 0Woodson 0 0 0 0 0 0 0 0 0 0Wyandotte 19 0 3 3 5 3 4 1 0 0n.s. 0 0 0 0 0 0 0 0 0 0
Peer GroupFrontier 8 0 1 2 4 1 0 0 0 0Rural 28 0 1 4 10 9 3 0 1 0Densely -Settled Rural 29 0 1 8 10 6 1 3 0 0Semi-Urban 25 0 1 6 8 3 6 1 0 0Urban 94 0 7 15 21 26 19 5 1 0
* See Technical Notes for Peer Group definition.

Out of State
Year Total* Residents Residents Ratio†n.s.
1971 9,472 5,763 3,709 103.0 01972 12,248 7,736 4,512 136.0 01973 12,612 7,695 4,917 153.8 01974 10,171 4,503 5,657 172.9 111975 9,160 3,565 5,581 165.6 141976 9,154 3,455 5,686 161.2 131977 7,965 2,918 5,045 137.0 21978 9,740 3,957 5,722 156.4 611979 12,335 5,042 7,281 187.1 121980 11,791 4,750 7,038 173.0 31981 10,448 4,150 6,291 152.7 71982 9,976 3,823 6,153 151.0 01983 8,547 3,218 5,329 132.0 01984 8,008 2,689 5,319 133.1 01985 7,092 2,447 4,645 117.8 01986 6,561 2,316 4,245 108.4 01987 6,409 2,357 4,052 105.4 01988 7,930 3,161 4,769 123.2 01989 8,984 3,270 4,149 107.4 1,5651990 9,459 3,341 4,175 107.4 1,9431991 10,141 4,071 6,070 161.3 01992 11,135 4,904 6,231 164.6 01993 11,247 4,853 6,394 171.5 01994 10,847 4,245 6,596 177.0 61995‡
11,149 4,562 6,566 177.0 211996 11,181 4,367 6,806 186.3 81997 11,507 4,973 6,532 175.6 21998 11,624 5,184 6,440 167.8 01999¶ 12,445 6,029 6,416 165.6 02000 12,327 5,971 6,356 160.3 02001 12,422 6,003 6,419 165.3 02002 11,844 5,546 6,298 160.1 02003 11,697 5,534 6,163 156.6 02004 11,446 5,475 5,971 151.0 02005 10,543 4,914 5,629 141.8 02006 11,271 5,385 5,886 143.9 02007 10,841 5,162 5,679 135.4 02008 10,643 5,131 5,512 131.8 02009 9,474 4,693 4,780 115.5 12010 8,373 4,150 4,223 104.4 02011 7,885 3,989 3,946 99.6 02012 7,598 3,796 3,802 94.3 02013 7,485 3,722 3,763 97.0 02014 7,294 3,578 3,716 94.8 02015 6,974 3,395 3,579 91.5 02016 6,820 3,381 3,439 90.4 02017 6,826 3,376 3,450 94.6 0
out of state. Ratio per 1,000 live births.
and every person licensed to practice medicine and surgery.
‡ As of July 1, 1995, reporting became mandatory for every medical care facility
¶ Numbers from 1999 on are larger than the ones reported in the preliminary reports due to induced termination of pregnancy reports received from other states after the Kansas reporting deadlines.
Table D3Total Reported Abortions and Ratios of Abortions to Live Births*
Kansas, 1971-2017
Kansas
* Includes in state occurrences to Kansas residents and out of state residents, plus Kansas resident
† Abortion ratios are per 1,000 live births, and are basesd on Kansas residence.
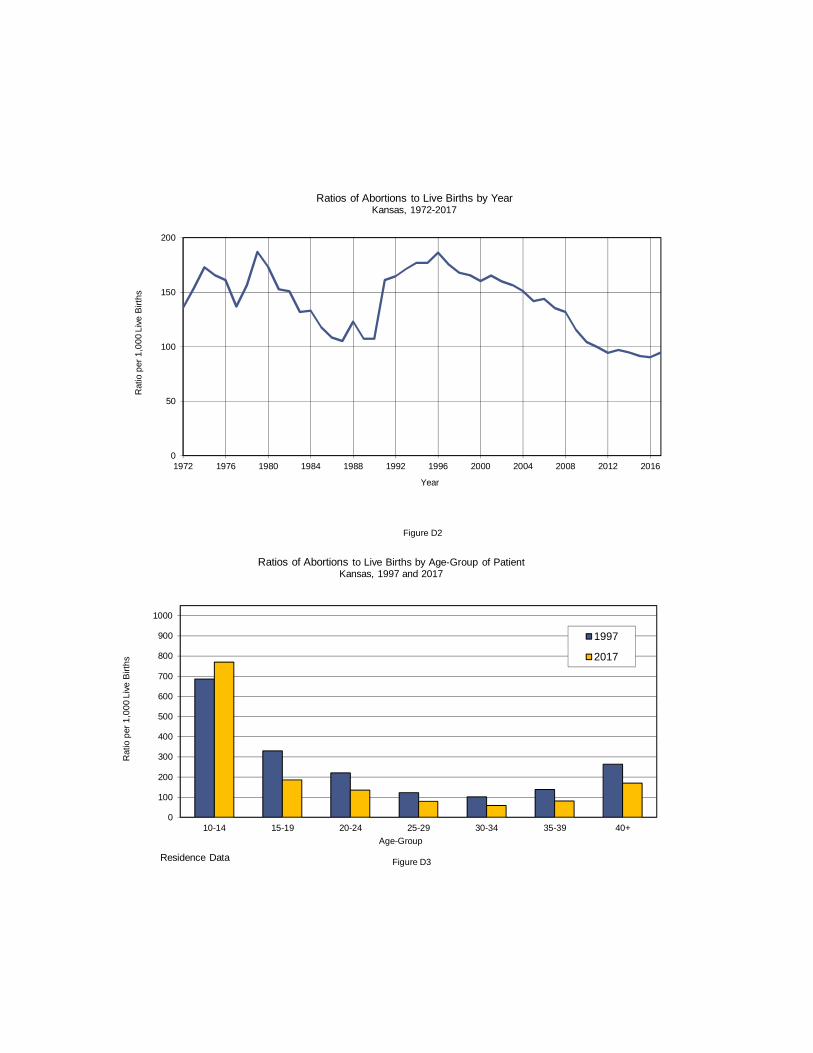
Figure D2
*Rate per 1,000 Female Population 15-44**2005-2006 Rates Provisional Figure 12
0
50
100
150
200
1972 1976 1980 1984 1988 1992 1996 2000 2004 2008 2012 2016
Rat
io p
er 1
,00
0 L
ive
Birt
hs
Year
Ratios of Abortions to Live Births by YearKansas, 1972-2017
0
100
200
300
400
500
600
700
800
900
1000
10-14 15-19 20-24 25-29 30-34 35-39 40+
Rat
io p
er 1
,00
0 L
ive
Birt
hs
Age-Group
Ratios of Abortions to Live Births by Age-Group of PatientKansas, 1997 and 2017
1997
2017
Residence Data Figure D3
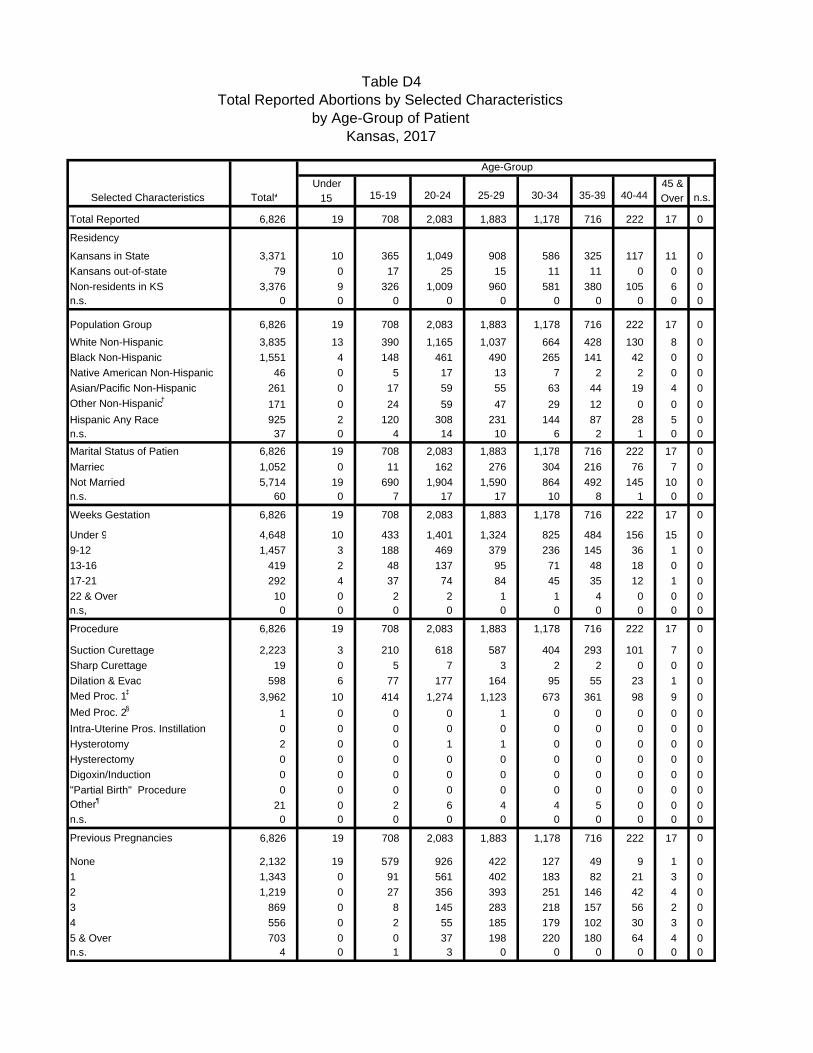
Under 45 &Selected Characteristics Total* 15 15-19 20-24 25-29 30-34 35-39 40-44 Over n.s.
Total Reported 6,826 19 708 2,083 1,883 1,178 716 222 17 0
Residency
Kansans in State 3,371 10 365 1,049 908 586 325 117 11 0
Kansans out-of-state 79 0 17 25 15 11 11 0 0 0
Non-residents in KS 3,376 9 326 1,009 960 581 380 105 6 0n.s. 0 0 0 0 0 0 0 0 0 0
Population Group 6,826 19 708 2,083 1,883 1,178 716 222 17 0
White Non-Hispanic 3,835 13 390 1,165 1,037 664 428 130 8 0
Black Non-Hispanic 1,551 4 148 461 490 265 141 42 0 0
Native American Non-Hispanic 46 0 5 17 13 7 2 2 0 0
Asian/Pacific Non-Hispanic 261 0 17 59 55 63 44 19 4 0
Other Non-Hispanic†171 0 24 59 47 29 12 0 0 0
Hispanic Any Race 925 2 120 308 231 144 87 28 5 0n.s. 37 0 4 14 10 6 2 1 0 0
Marital Status of Patien 6,826 19 708 2,083 1,883 1,178 716 222 17 0
Married 1,052 0 11 162 276 304 216 76 7 0
Not Married 5,714 19 690 1,904 1,590 864 492 145 10 0n.s. 60 0 7 17 17 10 8 1 0 0
Weeks Gestation 6,826 19 708 2,083 1,883 1,178 716 222 17 0
Under 9 4,648 10 433 1,401 1,324 825 484 156 15 0
9-12 1,457 3 188 469 379 236 145 36 1 0
13-16 419 2 48 137 95 71 48 18 0 0
17-21 292 4 37 74 84 45 35 12 1 0
22 & Over 10 0 2 2 1 1 4 0 0 0n.s, 0 0 0 0 0 0 0 0 0 0
Procedure 6,826 19 708 2,083 1,883 1,178 716 222 17 0
Suction Curettage 2,223 3 210 618 587 404 293 101 7 0
Sharp Curettage 19 0 5 7 3 2 2 0 0 0
Dilation & Evac 598 6 77 177 164 95 55 23 1 0
Med Proc. 1‡3,962 10 414 1,274 1,123 673 361 98 9 0
Med Proc. 2§1 0 0 0 1 0 0 0 0 0
Intra-Uterine Pros. Instillation 0 0 0 0 0 0 0 0 0 0
Hysterotomy 2 0 0 1 1 0 0 0 0 0
Hysterectomy 0 0 0 0 0 0 0 0 0 0
Digoxin/Induction 0 0 0 0 0 0 0 0 0 0
"Partial Birth" Procedure 0 0 0 0 0 0 0 0 0 0Other¶ 21 0 2 6 4 4 5 0 0 0n.s. 0 0 0 0 0 0 0 0 0 0
Previous Pregnancies 6,826 19 708 2,083 1,883 1,178 716 222 17 0
None 2,132 19 579 926 422 127 49 9 1 0
1 1,343 0 91 561 402 183 82 21 3 0
2 1,219 0 27 356 393 251 146 42 4 0
3 869 0 8 145 283 218 157 56 2 0
4 556 0 2 55 185 179 102 30 3 0
5 & Over 703 0 0 37 198 220 180 64 4 0n.s. 4 0 1 3 0 0 0 0 0 0
Table D4Total Reported Abortions by Selected Characteristics
by Age-Group of PatientKansas, 2017
Age-Group

Under 45 &Selected Characteristics Total* 15 15-19 20-24 25-29 30-34 35-39 40-44 Over n.s.
Table D4Total Reported Abortions by Selected Characteristics
by Age-Group of PatientKansas, 2017
Age-Group
Previous Induced Abortions 6,826 19 708 2,083 1,883 1,178 716 222 17 0
None 4,612 19 647 1,593 1,181 663 376 121 12 0
1 1,456 0 50 382 458 312 204 47 3 0
2 518 0 8 80 181 127 85 36 1 0
3 138 0 2 20 40 42 24 9 1 0
4 59 0 0 3 17 19 16 4 0 0
5 & Over 40 0 0 3 6 15 11 5 0 0n.s. 3 0 1 2 0 0 0 0 0 0
Number of Living Children 6,826 19 708 2,083 1,883 1,178 716 222 17 0
None 2,877 19 633 1,221 652 229 95 27 1 0
1 1,587 0 62 531 517 283 148 42 4 0
2 1,304 0 11 255 389 335 232 75 7 0
3 662 0 1 64 225 194 129 48 1 0
4 254 0 0 9 74 81 71 18 1 0
5 & Over 141 0 0 3 26 56 41 12 3 0n.s. 1 0 1 0 0 0 0 0 0 0
Children Born Alive Now Dead 6,826 19 708 2,083 1,883 1,178 716 222 17 0
None 6,786 19 707 2,079 1,871 1,167 709 217 17 0
1 30 0 0 1 9 9 6 5 0 0
2 4 0 0 0 2 1 1 0 0 0
3 0 0 0 0 0 0 0 0 0 0
4 2 0 0 0 1 1 0 0 0 0
5 & Over 0 0 0 0 0 0 0 0 0 0n.s. 4 0 1 3 0 0 0 0 0 0
Spontaneous Terminations 6,826 19 708 2,083 1,883 1,178 716 222 17 0
None 5,701 19 690 1,906 1,531 902 495 146 12 0
1 865 0 16 147 282 204 164 47 5 0
2 176 0 1 18 51 50 38 18 0 0
3 41 0 0 7 10 8 10 6 0 0
4 18 0 0 1 3 6 5 3 0 0
5 & Over 22 0 0 2 6 8 4 2 0 0n.s. 3 0 1 2 0 0 0 0 0 0
* Totals are larger than reported in the preliminary report due to induced termination of pregnancy reports received from other states after the Kansas reporting deadline. Not stated (n.s.) represent patients who refused to provide information or information not collected by other states.† Includes selection of two or more races or other non-specified race‡ Refers to drug mifepristone§ Refers to drug methotrexate¶ Other procedures included: unknown, Suction Aspiration, Medical Pill, Hern Procedure,Dilation and Curettage and Cytot

Under 45 &
Selected Characteristics Total* 15 15-19 20-24 25-29 30-34 35-39 40-44 Over n.s.
All Resident 3,450 10 382 1,074 923 597 336 117 11 0
Population Group 3,450 10 382 1,074 923 597 336 117 11 0
White Non-Hispanic 1,953 7 213 580 536 335 211 67 4 0Black Non-Hispanic 552 1 54 179 159 101 39 19 0 0Native American Non-Hispanic 31 0 5 12 8 4 1 1 0 0Asian/Pacific Non-Hispanic 174 0 9 36 41 39 29 16 4 0Other Non-Hispanic†
95 0 13 34 24 20 4 0 0 0Hispanic Any Race 629 2 85 228 151 96 50 14 3 0n.s. 16 0 3 5 4 2 2 0 0 0
Marital Status of Patient 3,450 10 382 1,074 923 597 336 117 11 0
Married 597 0 9 100 174 160 105 43 6 0Not Married 2,800 10 367 959 735 427 223 74 5 0n.s. 53 0 6 15 14 10 8 0 0 0
Weeks Gestation 3,450 10 382 1,074 923 597 336 117 11 0
Under 9 2,423 5 247 758 648 441 223 91 10 09-12 689 0 100 230 179 100 65 14 1 013-16 195 2 20 56 46 32 30 9 0 017-21 133 3 13 28 49 23 14 3 0 022 & Over 10 0 2 2 1 1 4 0 0 0n.s. 0 0 0 0 0 0 0 0 0 0
Procedure 3,450 10 382 1,074 923 597 336 117 11 0
Suction Curettage 1,138 1 120 324 292 198 140 58 5 0Sharp Curettage 19 0 5 7 3 2 2 0 0 0Dilation & Evac 262 5 28 69 84 45 23 8 0 0Med Proc. 1‡
2,009 4 227 667 539 349 166 51 6 0Med Proc. 2§
0 0 0 0 0 0 0 0 0 0Intra-Uterine Pros. Instillation 0 0 0 0 0 0 0 0 0 0Hysterotomy 2 0 0 1 0 0 1 0 0 0Hysterectomy 0 0 0 0 0 0 0 0 0 0Digoxin/Induction 0 0 0 0 0 0 0 0 0 0"Partial Birth" Procedure 0 0 0 0 0 0 0 0 0 0Other¶
20 0 2 6 5 3 4 0 0 0n.s. 0 0 0 0 0 0 0 0 0 0
Previous Pregnancies 3,450 10 382 1,074 923 597 336 117 11 0
None 1,120 10 307 493 218 64 25 3 0 01 672 0 48 269 214 95 36 8 2 02 623 0 20 191 185 131 71 22 3 03 437 0 4 71 135 109 79 37 2 04 268 0 2 31 77 93 47 16 2 05 & Over 326 0 0 16 94 105 78 31 2 0n.s. 4 0 1 3 0 0 0 0 0 0
Previous Induced Abortions 3,450 10 382 1,074 923 597 336 117 11 0
None 2,428 10 348 849 603 361 187 63 7 01 698 0 25 173 227 161 86 23 3 02 232 0 7 39 71 48 45 21 1 03 57 0 1 8 16 16 10 6 0 04 22 0 0 2 6 8 5 1 0 05 & Over 10 0 0 1 0 3 3 3 0 0n.s. 3 0 1 2 0 0 0 0 0 0
Table D5Kansas Resident Abortions by Selected Characteristics
by Age-Group of PatientKansas, 2017
Age-Group

Under 45 &
Selected Characteristics Total* 15 15-19 20-24 25-29 30-34 35-39 40-44 Over n.s.
Table D5Kansas Resident Abortions by Selected Characteristics
by Age-Group of PatientKansas, 2017
Age-Group
Number of Living Children 3,450 10 382 1,074 923 597 336 117 11 0
None 1,473 10 337 618 336 117 47 8 0 01 772 0 34 281 242 128 61 23 3 02 656 0 9 137 188 166 112 39 5 03 334 0 1 31 107 103 60 31 1 04 143 0 0 6 35 54 37 11 0 05 & Over 71 0 0 1 15 29 19 5 2 0n.s. 1 0 1 0 0 0 0 0 0 0
Children Born Alive Now Dead 3,450 10 382 1,074 923 597 336 117 11 0
None 3,426 10 381 1,070 916 590 335 113 11 01 16 0 0 1 5 5 1 4 0 02 3 0 0 0 2 1 0 0 0 03 0 0 0 0 0 0 0 0 0 04 1 0 0 0 0 1 0 0 0 05 & Over 0 0 0 0 0 0 0 0 0 0n.s. 4 0 1 3 0 0 0 0 0 0
Spontaneous Terminations 3,450 10 382 1,074 923 597 336 117 11 0
None 2,899 10 371 985 747 462 231 85 8 01 424 0 9 73 143 96 76 24 3 02 81 0 1 8 19 30 16 7 0 03 25 0 0 5 9 3 7 1 0 04 10 0 0 1 2 4 3 0 0 05 & Over 8 0 0 0 3 2 3 0 0 0n.s. 3 0 1 2 0 0 0 0 0 0
* Totals are larger than reported in the preliminary report due to induced termination of pregnancy reports received from other states after the Kansas reporting deadline. Not stated (n.s.) represent patients who refused to provide information or information not collected by other states.† Includes selection of two or more races or other non-specified race‡ Refers to drug mifepristone§ Refers to drug methotrexate¶ Other procedures included: unknown, Suction Aspiration, Medical Pill, Hern Procedure,Dilation and Curettage and Cytotec
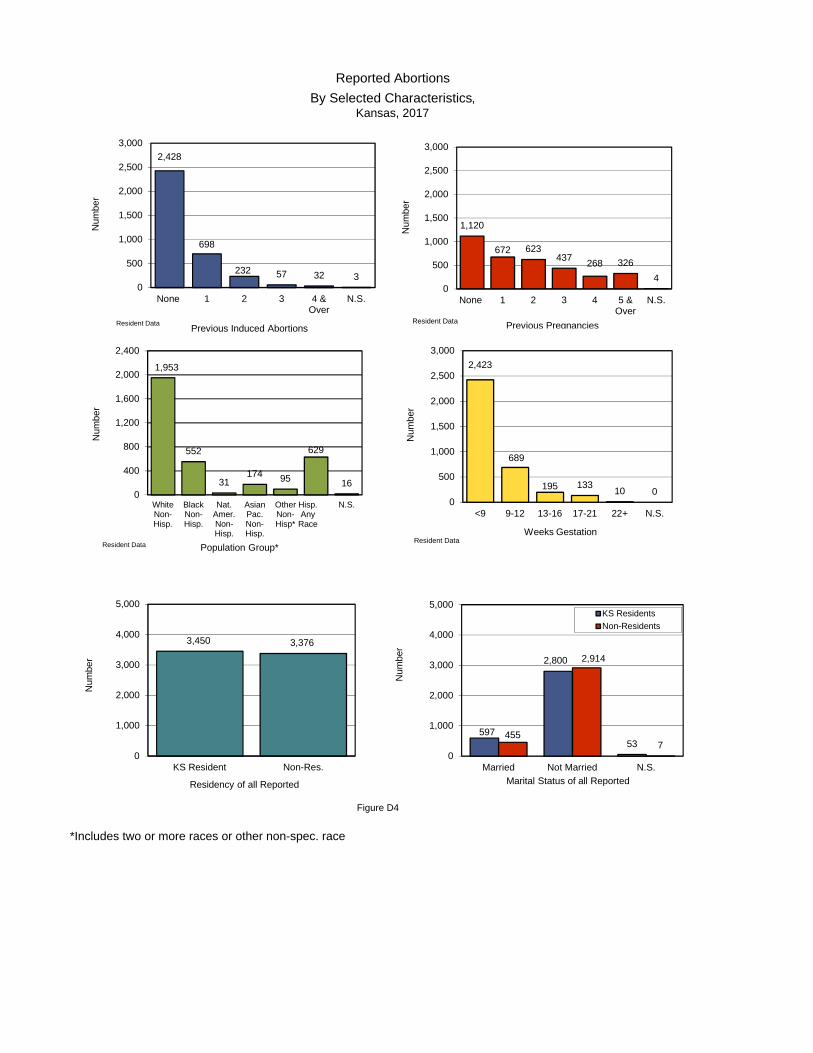
Figure D4
*Includes two or more races or other non-spec. race
Reported Abortions
By Selected Characteristics,Kansas, 2017
2,428
698
232 57 32 30
500
1,000
1,500
2,000
2,500
3,000
None 1 2 3 4 &Over
N.S.
Num
ber
Previous Induced AbortionsResident Data
1,120
672 623437
268 326
40
500
1,000
1,500
2,000
2,500
3,000
None 1 2 3 4 5 &Over
N.S.
Num
ber
Previous PregnanciesResident Data
1,953
552
31174 95
629
160
400
800
1,200
1,600
2,000
2,400
WhiteNon-Hisp.
BlackNon-Hisp.
Nat.Amer.Non-Hisp.
AsianPac.Non-Hisp.
OtherNon-Hisp*
Hisp.Any
Race
N.S.
Num
ber
Population Group*Resident Data
2,423
689
195 13310 0
0
500
1,000
1,500
2,000
2,500
3,000
<9 9-12 13-16 17-21 22+ N.S.
Num
ber
Weeks GestationResident Data
3,450 3,376
0
1,000
2,000
3,000
4,000
5,000
KS Resident Non-Res.
Num
ber
Residency of all Reported
597
2,800
53455
2,914
70
1,000
2,000
3,000
4,000
5,000
Married Not Married N.S.
Num
ber
Marital Status of all Reported
KS Residents
Non-Residents

Population Group Number Percent Number Percent Number Percent n.s.†
Total 6,826 100 1,052 15.5 5,714 84.5 60
White Non-Hispanic 3,835 100 639 16.8 3,171 83.2 25Black Non-Hispanic 1,551 100 131 8.5 1,411 91.5 9Native American
Non-Hispanic 46 100 6 13.0 40 87.0 0Asian/Pacific
Non-Hispanic 261 100 128 49.4 131 50.6 2Other Non-Hispanic* 171 100 22 12.9 149 87.1 0Hispanic Any Race 925 100 119 13.2 784 86.8 22
n.s†37 n/a‡
7 n/a 28 n/a 2
* Includes selection of two or more races or other non-specified rac† The not stated (n.s.) represent patients who refused to provide information or informatio not collected by other states‡n/a not applicable
Population Group Number Percent Number Percent Number Percent Number Percent Number Percent Number Percent n.s.†
Total 6,826 100 4,648 68.1 1,457 21.3 419 6.1 292 4.3 10 0.1 0
White Non-Hispanic 3,835 100 2,695 70.3 765 19.9 216 5.6 159 4.1 0 0.0 0Black Non-Hispanic 1,551 100 956 61.6 397 25.6 122 7.9 76 4.9 0 0.0 0Native American Non-Hispanic 46 100 32 69.6 9 19.6 3 6.5 2 4.3 0 0.0 0Asian/Pacific Non-Hispanic 261 100 198 75.9 47 18.0 9 3.4 7 2.7 0 0.0 0Other Non-Hispanic* 171 100 114 66.7 41 24.0 11 6.4 5 2.9 0 0.0 0Hispanic Any Race 925 100 623 67.4 192 20.8 57 6.2 43 4.6 10 1.1 0n/a‡ 37 n/a 30 n/a 6 n/a 1 n/a 0 n/a 0 n/a 0
* Includes selection of two or more races or other non-specified rac† The not stated (n.s.) represent patients who refused to provide information or informatio not collected by other states
22 & Over
Table D7Total Reported Abortions by Population Group
by Weeks GestationKansas, 2017
Weeks Gestation
Total Under 9 9-12 13-16 17-21
Total Married Unmarried
Table D6Total Reported Abortions by Population Group
by Marital StatusKansas, 2017
Marital Status

Total Reported Abortions by Termination Procedure by Weeks Gestation
Kansas, 2017
Termination Under 22 &Procedure Total 9 9-12 13-16 17-21 Over n.s.*
Total 6,826 4,648 1,457 419 292 10 0
Suction Curettage 2,223 1,101 998 119 5 0 0Sharp Curettage 19 16 3 0 0 0 0Dilation & Evacuation 598 3 15 299 281 0 0Medical Procedure I† 3,962 3,521 440 0 1 0 0Medical Procedure II‡ 1 1 0 0 0 0 0Intra-Uterine 0 0 0 0 0 0 0 Prostaglandin Instillation 0 0 0 0 0 0 0Hysterotomy 2 2 0 0 0 0 0Hysterectomy 0 0 0 0 0 0 0Digoxin/Induction 0 0 0 0 0 0 0"Partial Birth" Procedure 0 0 0 0 0 0 0Other¶ 21 4 1 1 5 10 0n.s. 0 0 0 0 0 0 0
* The not stated (n.s.) represent patients who refused to provide information or information not collected by other states.† Refers to drug mifepristone‡ Refers to drug methotrexate¶ Other procedures included: unknown, Suction Aspiration, Medical Pill, Hern Procedure,Dilation and Curettage and Cytotec
Total Reported Abortions: Percent
Distribution by Weeks GestationKansas, 2017
Table D8
Weeks Gestation
Under 968.1%
9-1221.3%
13-166.1%
17-214.3%
22 & Over0.1%
Figure D5

County of 45 &Residence Total 10-14 15-19 20-24 25-29 30-34 35-39 40-44 Over n.s.
Kansas 3,450 10 382 1,074 923 597 336 117 11 0
Allen 6 0 0 1 0 4 1 0 0 0
Anderson 5 0 0 0 3 1 0 0 1 0
Atchison 15 0 0 7 2 4 0 2 0 0
Barber 3 0 0 3 0 0 0 0 0 0
Barton 17 0 4 7 4 1 1 0 0 0
Bourbon 18 0 3 7 5 3 0 0 0 0
Brown 5 0 0 3 0 2 0 0 0 0
Butler 46 0 5 14 12 10 3 2 0 0
Chase 0 0 0 0 0 0 0 0 0 0
Chautauqua 0 0 0 0 0 0 0 0 0 0
Cherokee 3 0 2 0 1 0 0 0 0 0
Cheyenne 0 0 0 0 0 0 0 0 0 0
Clark 0 0 0 0 0 0 0 0 0 0
Clay 1 0 0 0 1 0 0 0 0 0
Cloud 4 0 0 1 2 0 1 0 0 0
Coffey 8 0 1 1 3 2 1 0 0 0
Comanche 1 0 0 1 0 0 0 0 0 0
Cowley 21 0 2 8 6 3 2 0 0 0
Crawford 45 0 6 21 10 5 2 1 0 0
Decatur 0 0 0 0 0 0 0 0 0 0
Dickinson 12 0 1 5 3 2 1 0 0 0
Doniphan 7 0 2 2 1 1 0 1 0 0
Douglas 208 0 27 68 52 30 24 7 0 0
Edwards 3 0 0 1 0 1 1 0 0 0
Elk 0 0 0 0 0 0 0 0 0 0
Ellis 38 0 9 17 9 2 1 0 0 0
Ellsworth 0 0 0 0 0 0 0 0 0 0
Finney 44 0 3 12 14 11 4 0 0 0
Ford 31 1 5 7 10 5 2 1 0 0
Franklin 17 0 3 2 9 0 2 0 1 0
Geary 90 1 12 39 28 7 2 1 0 0
Gove 1 0 0 1 0 0 0 0 0 0
Graham 0 0 0 0 0 0 0 0 0 0
Grant 4 0 2 1 0 1 0 0 0 0
Gray 3 0 0 1 0 1 1 0 0 0
Greeley 0 0 0 0 0 0 0 0 0 0
Greenwood 2 0 0 0 0 1 1 0 0 0
Hamilton 1 0 0 1 0 0 0 0 0 0
Harper 3 0 0 2 1 0 0 0 0 0
Harvey 27 0 3 11 6 4 2 1 0 0
Haskell 5 0 2 0 0 0 2 1 0 0
Hodgeman 1 0 0 1 0 0 0 0 0 0
Jackson 6 0 0 2 1 1 0 2 0 0
Jefferson 11 0 2 7 2 0 0 0 0 0
Jewell 0 0 0 0 0 0 0 0 0 0
Johnson 811 1 51 209 228 170 103 43 6 0
Kearny 2 0 1 0 0 0 1 0 0 0
Kingman 4 0 0 0 1 2 1 0 0 0
Kiowa 2 0 0 2 0 0 0 0 0 0
Labette 7 0 0 2 2 1 2 0 0 0
Lane 0 0 0 0 0 0 0 0 0 0
Leavenworth 90 1 8 35 19 19 5 3 0 0
Lincoln 0 0 0 0 0 0 0 0 0 0
Linn 7 0 3 0 1 3 0 0 0 0
Logan 1 0 0 1 0 0 0 0 0 0
Table D9Abortions by County of Residence and Peer Group*
by Age-Group of Patient,Kansas, 2017
Age-Group

County of 45 &Residence Total 10-14 15-19 20-24 25-29 30-34 35-39 40-44 Over n.s.
Table D9Abortions by County of Residence and Peer Group*
by Age-Group of Patient,Kansas, 2017
Age-Group
Lyon 32 0 4 15 3 7 3 0 0 0
Mcpherson 17 0 1 6 6 4 0 0 0 0
Marion 3 0 0 0 3 0 0 0 0 0
Marshall 8 0 0 2 1 2 2 1 0 0
Meade 1 0 0 0 1 0 0 0 0 0
Miami 33 0 8 7 5 8 2 3 0 0
Mitchell 5 0 1 2 0 1 1 0 0 0
Montgomery 9 0 0 2 4 2 1 0 0 0
Morris 1 0 0 0 0 1 0 0 0 0
Morton 0 0 0 0 0 0 0 0 0 0
Nemaha 3 0 0 0 1 1 1 0 0 0
Neosho 6 0 1 0 3 1 1 0 0 0
Ness 4 0 0 0 1 3 0 0 0 0
Norton 1 0 0 1 0 0 0 0 0 0
Osage 12 0 2 8 1 1 0 0 0 0
Osborne 0 0 0 0 0 0 0 0 0 0
Ottawa 2 0 0 1 0 0 1 0 0 0
Pawnee 1 0 0 0 0 0 1 0 0 0
Phillips 5 0 0 1 2 2 0 0 0 0
Pottawatomie 12 0 4 5 2 1 0 0 0 0
Pratt 6 0 2 1 1 2 0 0 0 0
Rawlins 0 0 0 0 0 0 0 0 0 0
Reno 39 0 4 10 16 3 6 0 0 0
Republic 1 0 0 0 0 0 1 0 0 0
Rice 9 0 3 4 1 0 1 0 0 0
Riley 95 0 12 47 17 13 5 1 0 0
Rooks 1 0 0 1 0 0 0 0 0 0
Rush 1 0 0 0 0 1 0 0 0 0
Russell 5 0 1 1 3 0 0 0 0 0
Saline 60 0 10 26 15 3 2 3 1 0
Scott 3 0 0 1 2 0 0 0 0 0
Sedgwick 763 4 81 211 234 134 74 24 1 0
Seward 22 1 4 5 9 2 1 0 0 0
Shawnee 210 1 24 80 46 30 25 4 0 0
Sheridan 2 0 0 0 2 0 0 0 0 0
Sherman 3 0 2 0 0 0 1 0 0 0
Smith 1 0 0 1 0 0 0 0 0 0
Stafford 1 0 0 1 0 0 0 0 0 0
Stanton 1 0 0 0 1 0 0 0 0 0
Stevens 1 0 0 1 0 0 0 0 0 0
Sumner 10 0 1 4 1 2 1 1 0 0
Thomas 2 0 0 2 0 0 0 0 0 0
Trego 1 0 0 0 0 1 0 0 0 0
Wabaunsee 1 0 0 0 1 0 0 0 0 0
Wallace 0 0 0 0 0 0 0 0 0 0
Washington 3 0 0 0 2 1 0 0 0 0
Wichita 1 0 0 0 1 0 0 0 0 0
Wilson 3 0 0 0 2 1 0 0 0 0
Woodson 1 0 1 0 0 0 0 0 0 0
Wyandotte 352 0 43 106 90 66 31 15 1 0
n.s.† 61 0 16 19 10 7 9 0 0 0
Peer GroupFrontier 34 0 3 14 6 7 4 0 0 0Rural 122 0 17 30 36 25 12 1 1 0Densely -Settled Rur 338 2 49 123 80 54 22 8 0 0Semi-Urban 461 1 63 179 122 55 27 12 2 0Urban 2,434 7 234 709 669 449 262 96 8 0
* See Technical Notes for Peer Group definition† County information not collected by other states.

HebdomadalYear Stillbirths Deaths Number Rate*
1998 199 132 331 8.6
1999 175 159 334 8.6
2000 177 146 323 8.1
2001 209 148 357 9.1
2002 146 155 301 7.6
2003 206 138 344 8.7
2004 186 144 330 8.3
2005 194 153 347 8.7
2006 192 137 329 8.0
2007 186 163 349 8.3
2008 182 160 342 8.1
2009 213 144 357 8.6
2010 168 143 311 7.7
2011 188 121 309 7.8
2012 195 142 337 8.3
2013 173 140 313 8.0
2014 199 138 337 8.6
2015 233 132 365 9.3
2016 252 119 371 9.7
2017 184 128 312 8.5
*Rate per 1,000 live births + stillbirths
Table D10Perinatal Period III Deaths by Component
Kansas, 1998-2017
Perinatal Period III Deaths

County of Hebdomadal County of Hebdomadal
Residence Total Stillbirths Deaths Residence Total Stillbirths Deaths
Kansas 312 184 128
Allen 0 0 0 Lyon 3 2 1
Anderson 1 1 0 McPherson 3 3 0
Atchison 5 5 0 Marion 0 0 0
Barber 1 0 1 Marshall 1 0 1
Barton 2 2 0 Meade 1 1 0
Bourbon 2 1 1 Miami 1 1 0
Brown 5 1 4 Mitchell 1 0 1
Butler 7 3 4 Montgomery 3 1 2
Chase 2 2 0 Morris 0 0 0
Chautauqua 0 0 0 Morton 0 0 0
Cherokee 1 1 0 Nemaha 2 2 0
Cheyenne 1 1 0 Neosho 0 0 0
Clark 0 0 0 Ness 1 0 1
Clay 0 0 0 Norton 1 1 0
Cloud 6 4 2 Osage 1 0 1
Coffey 0 0 0 Osborne 0 0 0
Comanche 1 1 0 Ottawa 0 0 0
Cowley 6 3 3 Pawnee 1 1 0
Crawford 8 4 4 Phillips 1 1 0
Decatur 0 0 0 Pottawatomie 2 0 2
Dickinson 6 3 3 Pratt 2 2 0
Doniphan 1 0 1 Rawlins 0 0 0
Douglas 9 4 5 Reno 5 3 2
Edwards 1 1 0 Republic 2 2 0
Elk 0 0 0 Rice 1 0 1
Ellis 3 2 1 Riley 5 4 1
Ellsworth 1 1 0 Rooks 0 0 0
Finney 6 3 3 Rush 0 0 0
Ford 3 3 0 Russell 2 2 0
Franklin 1 1 0 Saline 7 1 6
Geary 11 6 5 Scott 0 0 0
Gove 0 0 0 Sedgwick 57 31 26
Graham 1 0 1 Seward 2 2 0
Grant 1 1 0 Shawnee 27 12 15
Gray 0 0 0 Sheridan 0 0 0
Greeley 0 0 0 Sherman 0 0 0
Greenwood 1 0 1 Smith 0 0 0
Hamilton 1 0 1 Stafford 1 1 0
Harper 1 0 1 Stanton 0 0 0
Harvey 3 1 2 Stevens 1 1 0
Haskell 1 1 0 Sumner 3 2 1
Hodgeman 0 0 0 Thomas 1 1 0
Jackson 0 0 0 Trego 0 0 0
Jefferson 1 0 1 Wabaunsee 1 1 0
Jewell 0 0 0 Wallace 0 0 0
Johnson 39 26 13 Washington 1 0 1
Kearny 0 0 0 Wichita 0 0 0
Kingman 0 0 0 Wilson 0 0 0
Kiowa 0 0 0 Woodson 0 0 0
Labette 0 0 0 Wyandotte 25 19 6
Lane 0 0 0
Leavenworth 5 2 3
Lincoln 1 1 0
Linn 2 2 0
Logan 0 0 0
Table D11Perinatal Period III Deaths by County of Residence
by ComponentKansas, 2017
Perinatal Period III Deaths Perinatal Period III Deaths
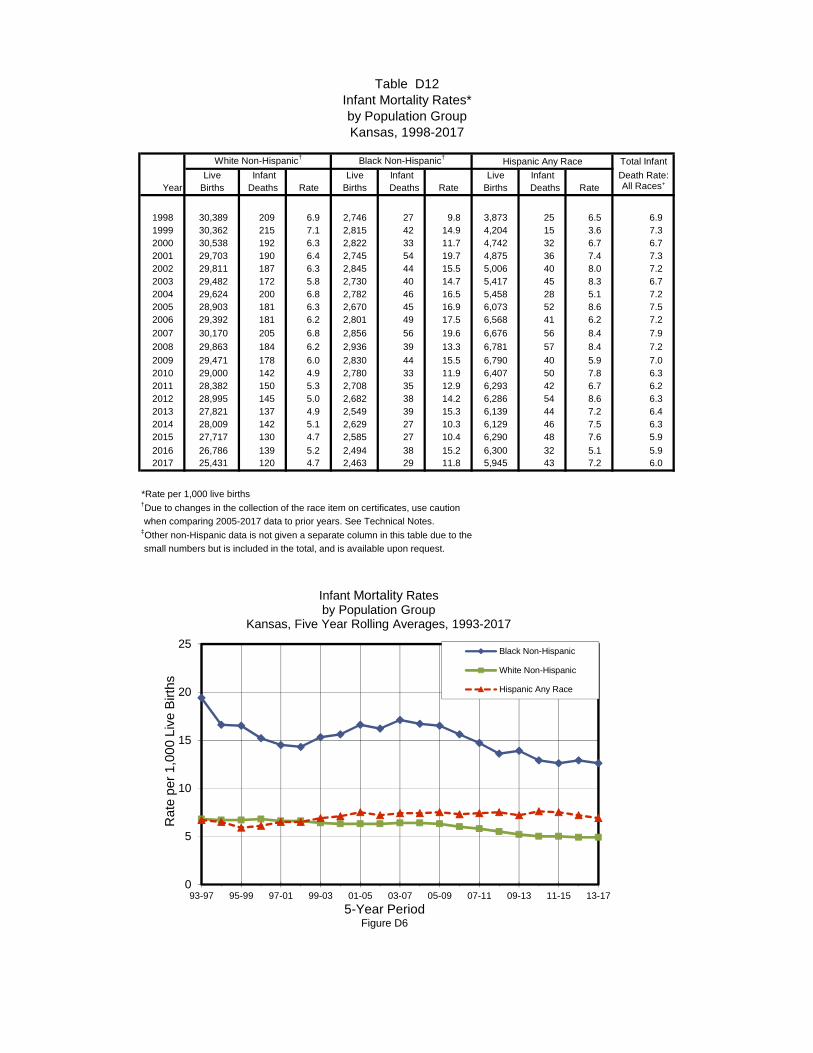
Total Infant
Live Infant Live Infant Live Infant Death Rate:Year Births Deaths Rate Births Deaths Rate Births Deaths Rate All Races‡
1998 30,389 209 6.9 2,746 27 9.8 3,873 25 6.5 6.91999 30,362 215 7.1 2,815 42 14.9 4,204 15 3.6 7.32000 30,538 192 6.3 2,822 33 11.7 4,742 32 6.7 6.72001 29,703 190 6.4 2,745 54 19.7 4,875 36 7.4 7.32002 29,811 187 6.3 2,845 44 15.5 5,006 40 8.0 7.22003 29,482 172 5.8 2,730 40 14.7 5,417 45 8.3 6.72004 29,624 200 6.8 2,782 46 16.5 5,458 28 5.1 7.22005 28,903 181 6.3 2,670 45 16.9 6,073 52 8.6 7.52006 29,392 181 6.2 2,801 49 17.5 6,568 41 6.2 7.2
2007 30,170 205 6.8 2,856 56 19.6 6,676 56 8.4 7.9
2008 29,863 184 6.2 2,936 39 13.3 6,781 57 8.4 7.2
2009 29,471 178 6.0 2,830 44 15.5 6,790 40 5.9 7.02010 29,000 142 4.9 2,780 33 11.9 6,407 50 7.8 6.32011 28,382 150 5.3 2,708 35 12.9 6,293 42 6.7 6.22012 28,995 145 5.0 2,682 38 14.2 6,286 54 8.6 6.32013 27,821 137 4.9 2,549 39 15.3 6,139 44 7.2 6.42014 28,009 142 5.1 2,629 27 10.3 6,129 46 7.5 6.32015 27,717 130 4.7 2,585 27 10.4 6,290 48 7.6 5.9
2016 26,786 139 5.2 2,494 38 15.2 6,300 32 5.1 5.92017 25,431 120 4.7 2,463 29 11.8 5,945 43 7.2 6.0
*Rate per 1,000 live births†Due to changes in the collection of the race item on certificates, use caution
when comparing 2005-2017 data to prior years. See Technical Notes.‡Other non-Hispanic data is not given a separate column in this table due to the
small numbers but is included in the total, and is available upon request.
Table D12Infant Mortality Rates*by Population GroupKansas, 1998-2017
White Non-Hispanic† Black Non-Hispanic†Hispanic Any Race
0
5
10
15
20
25
93-97 95-99 97-01 99-03 01-05 03-07 05-09 07-11 09-13 11-15 13-17
Ra
te p
er
1,0
00
Liv
e B
irth
s
5-Year Period
Infant Mortality Rates by Population Group
Kansas, Five Year Rolling Averages, 1993-2017
Black Non-Hispanic
White Non-Hispanic
Hispanic Any Race
Figure D6

Age-Group of Infant
Under 1-6 Under 7 7-27 Under 28-364 Under
Cause of Death *1 Day Days Days † Days 28 Days §
Days 1 Year
All Causes 102 26 128 26 154 63 217
Infectious and Parasitic Diseases 0 0 0 0 0 2 2
Other Diseases and Disorders 1 0 1 1 2 7 9
Certain Conditions Originating in the Perinatal Period 78 15 93 12 105 2 107
-Maternal Factors and Compl. Of Pregnancy, Labor and Delivery 24 1 25 0 25 0 25
-Disorders Relating to Short Gestation and Low Birth Weight 40 0 40 0 40 0 40
-Birth Trauma 0 0 0 0 0 0 0
-Hypoxia and Birth Asphyxia 1 2 3 0 3 0 3
-Respiratory Distress of Newborn 1 0 1 0 1 0 1
-Congenital Pneumonia 0 0 0 0 0 0 0
-Other Respiratory Conditions of Newborn 4 2 6 0 6 1 7
-Bacterial Sepsis of Newborn 1 1 2 5 7 0 7
-Omphalitis of Newborn w/wo Mild Hemorrhage 0 0 0 0 0 0 0
-Hemorrhagic and Hematolog. Disorders of Fetus and Newborn 0 2 2 0 2 0 2
-Other Perinatal Conditions 7 7 14 7 21 1 22
Congenital Anomalies 21 11 32 9 41 12 53
Symptoms and Abnormal Findings 2 0 2 2 4 25 29
-Sudden Infant Death Syndrome 0 0 0 0 0 13 13
-Other 2 0 2 2 4 12 16
External Causes of Mortality 0 0 0 2 2 15 17
* The ICD-10 codes associated with each category are listed in Appendix 5.† Hebdomadal Deaths§ Neonatal Deaths
Table D13Infant Deaths by Cause of Death by Age-Group of Infant
Kansas, 2017

Figure D7
Figure D8
*See Technical Notes for Pregnancy Associated Deaths and Maternal Mortality definitions
Infant Deaths for Three Age SubgroupsKansas, 1998-2017
Pregnancy Associated Deaths*Kansas, 2013-2017
0
20
40
60
80
100
120
140
160
180
200
1998 1999 2000 2001 2002 2003 2004 2005 2006 2007 2008 2009 2010 2011 2012 2013 2014 2015 2016 2017
Nu
mb
er
Year
0-6 Days
7-27 Days
28-364 Days
105 5
8 8
15
117
129
0
10
20
30
40
50
2013 2014 2015 2016 2017
Nu
mb
er
Year
Other Pregnancy AssociatedDeaths
Maternal Deaths

Total Infant
Infant Death
County of Deaths Rate†
Residence 2013 2014 2015 2016 2017 2013-2017 2013-2017
Kansas 248 246 230 223 217 1,164 6.1
Allen 0 1 1 0 0 2 2.8Anderson 2 1 1 0 1 5 10.1Atchison 1 0 2 1 0 4 4.1Barber 0 0 0 0 2 2 6.8Barton 1 3 3 0 0 7 4.2
Bourbon 0 0 2 1 2 5 4.8Brown 1 1 0 1 4 7 11.1Butler 6 9 8 3 6 32 8.5Chase 0 0 0 0 0 0 0.0Chautauqua 0 0 0 0 0 0 0.0
Cherokee 0 0 0 0 0 0 0.0Cheyenne 0 0 0 0 0 0 0.0Clark 0 1 0 0 0 1 9.2Clay 1 0 3 2 0 6 11.6Cloud 0 0 0 1 3 4 7.5
Coffey 0 0 0 0 0 0 0.0Comanche 0 0 1 1 0 2 20.6Cowley 4 2 2 0 5 13 6.0Crawford 3 1 1 4 4 13 5.3Decatur 0 0 0 0 0 0 0.0
Dickinson 2 2 1 2 3 10 9.0Doniphan 0 0 1 0 1 2 5.2Douglas 5 7 6 8 11 37 6.1Edwards 0 0 0 0 0 0 0.0Elk 1 0 0 2 0 3 21.4
Ellis 1 3 4 3 1 12 7.0Ellsworth 0 0 0 0 0 0 0.0Finney 6 3 7 2 3 21 6.3Ford 5 4 9 3 1 22 6.8Franklin 1 5 2 2 1 11 7.0
Geary 6 7 8 3 5 29 5.7Gove 0 0 0 1 0 1 5.6Graham 0 1 0 0 1 2 18.2Grant 0 0 1 0 0 1 1.6Gray 2 0 1 0 0 3 6.8
Greeley 0 0 0 0 0 0 0.0Greenwood 1 0 1 0 1 3 9.3Hamilton 0 0 0 1 1 2 11.0Harper 2 3 0 0 1 6 15.9Harvey 4 3 3 4 3 17 8.4
Haskell 0 0 0 1 1 2 7.8Hodgeman 0 0 1 1 0 2 20.0Jackson 0 1 3 3 1 8 9.4Jefferson 2 1 3 0 2 8 8.5Jewell 0 0 0 1 0 1 6.3
Johnson 34 34 35 26 25 154 4.2Kearny 0 0 1 0 0 1 3.2Kingman 0 0 0 0 1 1 2.5Kiowa 0 0 0 0 0 0 0.0Labette 2 2 2 4 1 11 8.2
Lane 0 0 0 0 0 0 0.0Leavenworth 5 5 5 6 11 32 6.5Lincoln 0 0 1 0 0 1 6.8Linn 0 1 2 1 0 4 7.9Logan 0 0 0 0 0 0 0.0
Table D14Infant Deaths by County of Residence and Peer Group*
by Year of DeathKansas, 2013-2017
Year

Table D14Infant Deaths by County of Residence and Peer Group*
by Year of DeathKansas, 2013-2017
Lyon 3 3 2 2 2 12 5.9McPherson 1 2 2 1 1 7 4.3Marion 0 0 1 1 0 2 3.5Marshall 0 1 0 1 1 3 4.8Meade 0 0 0 1 0 1 3.4
Miami 0 4 0 2 1 7 3.9Mitchell 0 1 0 0 1 2 5.0Montgomery 0 3 4 4 3 14 6.8Morris 0 2 0 0 0 2 6.5Morton 0 0 0 0 0 0 0.0
Nemaha 2 2 1 1 0 6 8.0Neosho 1 3 0 0 1 5 4.9Ness 1 0 0 0 1 2 12.8Norton 2 0 0 1 0 3 10.5Osage 2 2 1 2 3 10 12.0
Osborne 1 1 0 0 0 2 8.7Ottawa 0 0 0 0 0 0 0.0Pawnee 0 0 2 0 0 2 5.9Phillips 1 1 0 0 0 2 6.6Pottawatomie 2 2 1 1 2 8 4.4
Pratt 1 4 0 0 0 5 7.8Rawlins 0 0 0 0 0 0 0.0Reno 14 6 4 4 5 33 9.3Republic 1 1 0 1 0 3 11.9Rice 0 4 0 0 2 6 10.0
Riley 7 7 3 5 3 25 5.1Rooks 0 1 0 0 0 1 3.4Rush 0 0 0 1 0 1 6.3Russell 0 1 0 0 0 1 2.5Saline 7 1 1 4 7 20 5.5
Scott 0 0 0 0 0 0 0.0Sedgwick 62 43 41 60 44 250 6.9Seward 3 5 3 2 1 14 6.5Shawnee 15 12 18 21 22 88 7.8Sheridan 1 0 0 0 0 1 6.9
Sherman 0 1 0 0 0 1 2.6Smith 0 0 0 0 0 0 0.0Stafford 0 0 0 0 0 0 0.0Stanton 0 0 0 0 0 0 0.0Stevens 0 0 0 0 0 0 0.0
Sumner 2 2 2 0 1 7 5.3Thomas 0 2 1 2 0 5 8.6Trego 0 1 0 0 0 1 5.9Wabaunsee 0 0 0 0 0 0 0.0Wallace 0 1 0 0 0 1 10.0
Washington 1 0 1 1 1 4 10.7Wichita 0 0 0 0 0 0 0.0Wilson 2 1 0 0 0 3 5.5Woodson 0 0 0 0 0 0 0.0Wyandotte 18 25 21 17 13 94 7.0
Peer GroupFrontier 5 7 5 9 6 32 4.9Rural 18 26 14 14 16 88 6.3Densely -Settled Rural 38 41 51 27 31 188 6.0Semi-Urban 48 46 34 35 38 201 6.5Urban 139 126 126 138 126 655 6.0
* See Technical Notes for Peer Group definition.† Rate per 1,000 live births.
Numerator and denominator for 5-year rate based on peer group assignment of counties for the event year.

Hebdomadal Post-Hebdomadal Neonatal Post-Neonatal Total
County of Deaths Deaths Deaths Deaths Infant Deaths
Residence Under 7 Days 7-27 Days Under 28 Days 28-364 Days Under 1 Year
Kansas 128 26 154 63 217
Allen 0 0 0 0 0
Anderson 0 0 0 1 1
Atchison 0 0 0 0 0
Barber 1 1 2 0 2
Barton 0 0 0 0 0
Bourbon 1 0 1 1 2
Brown 4 0 4 0 4
Butler 4 1 5 1 6
Chase 0 0 0 0 0
Chautauqua 0 0 0 0 0
Cherokee 0 0 0 0 0
Cheyenne 0 0 0 0 0
Clark 0 0 0 0 0
Clay 0 0 0 0 0
Cloud 2 0 2 1 3
Coffey 0 0 0 0 0
Comanche 0 0 0 0 0
Cowley 3 0 3 2 5
Crawford 4 0 4 0 4Decatur 0 0 0 0 0
Dickinson 3 0 3 0 3
Doniphan 1 0 1 0 1
Douglas 5 1 6 5 11
Edwards 0 0 0 0 0
Elk 0 0 0 0 0
Ellis 1 0 1 0 1
Ellsworth 0 0 0 0 0
Finney 3 0 3 0 3
Ford 0 1 1 0 1
Franklin 0 0 0 1 1
Geary 5 0 5 0 5
Gove 0 0 0 0 0
Graham 1 0 1 0 1
Grant 0 0 0 0 0Gray 0 0 0 0 0
Greeley 0 0 0 0 0
Greenwood 1 0 1 0 1
Hamilton 1 0 1 0 1
Harper 1 0 1 0 1
Harvey 2 0 2 1 3
Haskell 0 0 0 1 1
Hodgeman 0 0 0 0 0
Jackson 0 1 1 0 1
Jefferson 1 0 1 1 2
Jewell 0 0 0 0 0
Johnson 13 2 15 10 25
Kearny 0 0 0 0 0
Kingman 0 0 0 1 1
Kiowa 0 0 0 0 0
Labette 0 1 1 0 1
Lane 0 0 0 0 0
Leavenworth 3 2 5 6 11
Lincoln 0 0 0 0 0
Linn 0 0 0 0 0
Logan 0 0 0 0 0
Table D15Infant Deaths by County of Residence and Peer Group*
by ComponentKansas, 2017
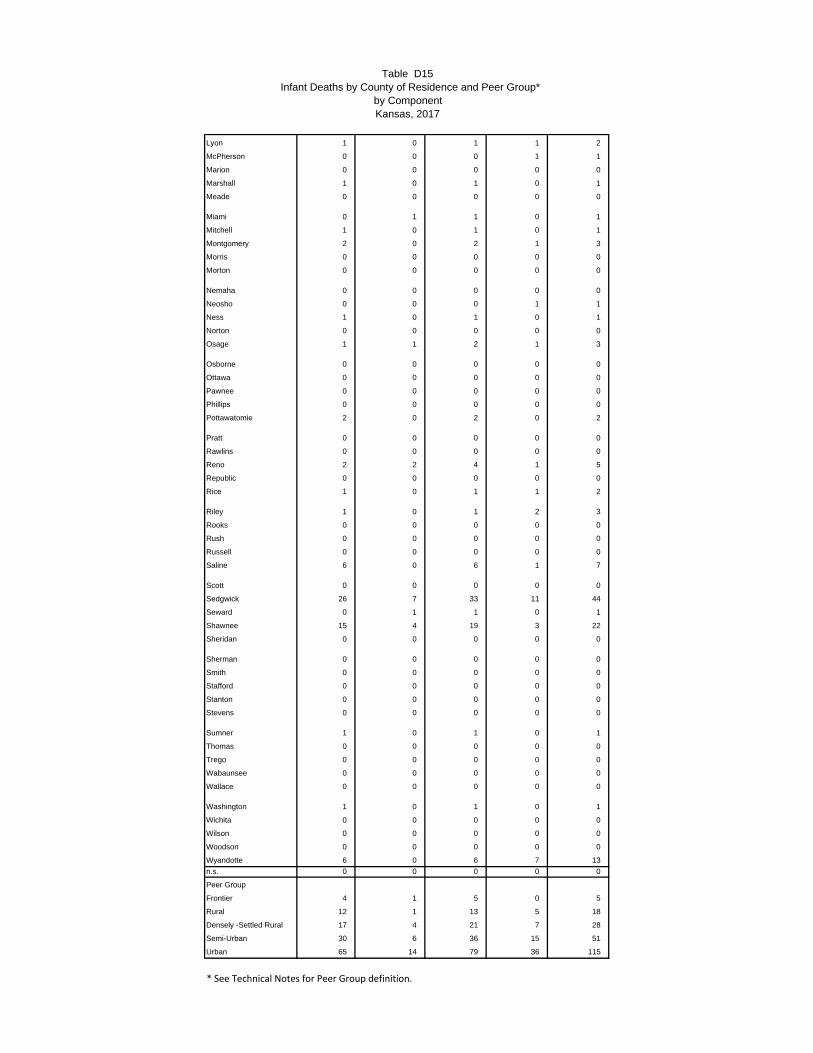
Table D15Infant Deaths by County of Residence and Peer Group*
by ComponentKansas, 2017
Lyon 1 0 1 1 2
McPherson 0 0 0 1 1
Marion 0 0 0 0 0
Marshall 1 0 1 0 1
Meade 0 0 0 0 0
Miami 0 1 1 0 1
Mitchell 1 0 1 0 1
Montgomery 2 0 2 1 3
Morris 0 0 0 0 0
Morton 0 0 0 0 0
Nemaha 0 0 0 0 0
Neosho 0 0 0 1 1
Ness 1 0 1 0 1
Norton 0 0 0 0 0
Osage 1 1 2 1 3
Osborne 0 0 0 0 0
Ottawa 0 0 0 0 0
Pawnee 0 0 0 0 0
Phillips 0 0 0 0 0
Pottawatomie 2 0 2 0 2
Pratt 0 0 0 0 0
Rawlins 0 0 0 0 0
Reno 2 2 4 1 5
Republic 0 0 0 0 0
Rice 1 0 1 1 2
Riley 1 0 1 2 3
Rooks 0 0 0 0 0
Rush 0 0 0 0 0
Russell 0 0 0 0 0
Saline 6 0 6 1 7
Scott 0 0 0 0 0
Sedgwick 26 7 33 11 44
Seward 0 1 1 0 1
Shawnee 15 4 19 3 22
Sheridan 0 0 0 0 0
Sherman 0 0 0 0 0
Smith 0 0 0 0 0
Stafford 0 0 0 0 0
Stanton 0 0 0 0 0
Stevens 0 0 0 0 0
Sumner 1 0 1 0 1
Thomas 0 0 0 0 0
Trego 0 0 0 0 0
Wabaunsee 0 0 0 0 0
Wallace 0 0 0 0 0
Washington 1 0 1 0 1
Wichita 0 0 0 0 0
Wilson 0 0 0 0 0
Woodson 0 0 0 0 0
Wyandotte 6 0 6 7 13
n.s. 0 0 0 0 0
Peer Group
Frontier 4 1 5 0 5
Rural 12 1 13 5 18
Densely -Settled Rural 17 4 21 7 28
Semi-Urban 30 6 36 15 51
Urban 65 14 79 36 115
* See Technical Notes for Peer Group definition.

E. GENERAL MORTALITY

Year and Population Group Number Crude RateAge-AdjustedRate
2013 25,347 875.9 755.6 White Non-Hispanic 22,639 1,014.2 752.7 Black Non-Hispanic 1,264 746.5 949.3 Native American Non-Hispanic 194 823.1 1,202.1 Asian/Pacific Islander Non-Hispanic 200 258.8 476.6 Other Non-Hispanic 290 426.3 1,079.2 Hispanic 709 219.1 527.5 Not Stated 51 n/a n/a2014 25,731 886.0 757.3
White Non-Hispanic 22,923 1,028.4 754.7
Black Non-Hispanic 1,308 766.5 971.6
Native American Non-Hispanic 200 848.1 1,212.7
Asian/Pacific Islander Non-Hispanic 196 241.4 415.8
Other Non-Hispanic 321 459.4 1,188.8
Hispanic 757 229.7 524.9
Not Stated 26 n/a n/a
2015 26,611 914.0 772.5
White Non-Hispanic 23,706 1,066.1 773.7
Black Non-Hispanic 1,357 789.7 973.8
Native American Non-Hispanic 211 895.0 1,237.5
Asian/Pacific Islander Non-Hispanic 191 225.5 395.3
Other Non-Hispanic 301 422.3 1,031.8
Hispanic 808 240.1 522.8
Not Stated 37 n/a n/a
2016 26,129 898.7 753.5
White Non-Hispanic 23,217 1,046.9 754.8
Black Non-Hispanic 1,366 810.6 956.6
Native American Non-Hispanic 171 730.7 982.0
Asian/Pacific Islander Non-Hispanic 202 233.4 407.0
Other Non-Hispanic 316 434.5 1,115.3
Hispanic 799 236.1 501.1
Not Stated 58 n/a n/a
2017 26,725 917.4 761.3
White Non-Hispanic 23,557 1,066.0 757.6
Black Non-Hispanic 1,421 843.6 992.5
Native American Non-Hispanic 194 836.4 1,109.5
Asian/Pacific Islander Non-Hispanic 232 257.3 395.5
Other Non-Hispanic 340 458.7 1,089.6
Hispanic 918 264.2 547.2 Not Stated 63 n/a n/a
* Includes selection of two or more races or other non-specified race
Table E1Resident Deaths by Year and by Population Group,
Kansas, 2013-2017By Number, Crude and Age-Adjusted Rates

*1912-1936 Occurrence data
1937-2017 Residence data
Figure E1
Crude Death RatesKansas and the U.S., 1912-2017
7
9
11
13
15
17
19
1912 1917 1922 1927 1932 1937 1942 1947 1952 1957 1962 1967 1972 1977 1982 1987 1992 1997 2002 2007
Rat
e
Year
Kansas * U.S.
7
9
11
13
15
17
19
1912 1917 1922 1927 1932 1937 1942 1947 1952 1957 1962 1967 1972 1977 1982 1987 1992 1997 2002 2007 2012 2017
Rat
e pe
r 1,
000
popu
latio
n
Year
Kansas *
U.S.

Age-Groupand Sex 1998 1999 2000 2001 2002 2003 2004 2005 2006 2007 2008 2009 2010 2011 2012 2013 2014 2015 2016 2017
Both Sexes
Total 9.1 9.2 9.2 9.1 9.2 9.0 8.7 9.0 8.9 8.8 8.9 8.5 8.6 8.7 8.7 8.8 8.9 9.1 9.0 9.2
Under 1 7.1 7.5 7.0 7.5 7.4 6.8 7.3 7.7 7.4 8.2 7.1 7.0 6.2 6.2 6.4 6.3 6.2 5.9 5.8 5.7
1-4 0.4 0.4 0.4 0.4 0.4 0.4 0.4 0.3 0.3 0.2 0.4 0.3 0.4 0.3 0.3 0.4 0.2 0.3 0.2 0.3
5-14 0.2 0.2 0.2 0.2 0.2 0.2 0.2 0.2 0.2 0.2 0.1 0.2 0.2 0.2 0.1 0.2 0.1 0.2 0.2 0.2
15-24 0.9 0.8 0.8 0.9 0.9 0.7 0.7 0.7 0.8 0.8 0.8 0.7 0.8 0.7 0.7 0.6 0.7 0.7 0.7 0.8
25-34 1.0 1.0 0.9 0.9 0.8 0.8 1.0 0.9 1.1 0.9 0.9 1.1 1.1 1.1 1.1 1.0 1.0 1.1 1.2 1.2
35-44 1.7 1.6 1.7 1.8 2.0 1.8 1.8 1.8 1.8 1.7 1.7 1.7 1.6 1.8 1.8 1.7 1.6 1.8 1.8 1.9
45-54 3.6 3.8 3.6 3.9 4.0 4.0 4.1 4.1 4.0 4.2 3.9 4.1 4.0 4.1 4.1 4.2 4.2 4.3 4.0 4.0
55-64 9.4 9.9 9.3 9.6 9.1 9.0 8.6 8.9 8.6 8.3 8.6 8.6 8.5 8.6 8.5 8.4 8.8 9.0 9.0 9.2
65-74 23.7 24.0 23.1 22.9 22.4 21.6 20.9 21.5 21.3 20.0 20.5 20.1 18.9 19.1 19.3 18.8 19.1 19.1 18.7 18.7
75-84 54.1 54.7 55.9 55.7 55.7 54.6 52.8 54.0 53.5 53.4 53.2 50.1 48.4 48.8 48.8 48.3 48.7 48.6 48.7 48.685 and over 154.3 154.2 160.5 154.5 154.6 149.7 140.4 142.3 137.8 138.0 138.6 133.4 144.8 145.9 140.5 143.5 140.6 146.4 137.5 139.6
Male 8.9 8.9 8.8 8.8 8.8 8.5 8.3 8.7 8.5 8.6 8.7 8.4 8.6 8.6 8.7 8.6 8.9 9.1 9.0 9.4
Under 1 7.7 8.7 7.5 8.4 7.6 8.0 8.1 8.1 8.3 9.0 7.8 7.0 7.2 6.8 7.0 6.8 6.4 6.8 6.3 6.5
1-4 0.5 0.5 0.5 0.5 0.5 0.4 0.5 0.3 0.3 0.3 0.4 0.4 0.4 0.4 0.2 0.5 0.3 0.3 0.2 0.3
5-14 0.3 0.2 0.2 0.2 0.2 0.2 0.2 0.2 0.2 0.2 0.2 0.2 0.2 0.2 0.2 0.1 0.1 0.2 0.2 0.2
15-24 1.3 1.2 1.2 1.3 1.2 1.0 1.0 1.0 1.0 1.1 1.2 0.9 1.1 1.1 1.0 0.9 0.9 1.0 1.0 1.0
25-34 1.5 1.3 1.3 1.3 1.2 1.1 1.2 1.3 1.5 1.3 1.3 1.5 1.5 1.4 1.5 1.4 1.5 1.4 1.6 1.6
35-44 2.2 2.0 2.1 2.2 2.5 2.3 2.2 2.2 2.1 2.0 2.1 2.0 2.0 2.2 2.1 2.0 2.0 2.2 2.2 2.3
45-54 4.6 4.6 4.5 4.9 4.9 4.8 5.2 5.1 5.1 5.1 4.9 4.9 5.1 4.8 5.0 5.0 5.1 5.1 5.0 4.8
55-64 11.5 11.9 11.1 11.9 11.1 11.1 10.6 10.9 10.3 10.2 10.7 10.8 10.6 10.5 10.5 10.6 10.9 10.9 11.1 11.3
65-74 30.3 30.5 27.8 28.1 27.6 26.4 25.3 25.9 25.2 24.4 24.3 24.3 23.2 23.1 23.2 21.8 23.3 22.9 22.0 22.9
75-84 68.0 67.8 70.3 69.2 67.3 65.3 62.0 64.5 65.0 65.1 64.8 59.6 58.3 57.0 57.3 57.3 56.8 56.6 55.9 58.085 and over 173.6 170.2 187.4 179.6 174.5 163.6 148.4 156.1 149.3 153.9 156.8 156.8 161.9 159.0 155.5 156.2 156.2 160.0 151.1 153.5
Female 9.2 9.4 9.5 9.4 9.6 9.4 9.0 9.2 9.2 9.0 9.1 8.6 8.5 8.9 8.7 8.9 8.8 9.2 9.0 9.0
Under 1 6.4 6.3 6.4 6.5 7.1 5.6 6.5 7.2 6.5 7.4 6.5 7.0 5.2 5.5 5.7 5.7 5.9 5.0 5.3 4.8
1-4 0.4 0.4 0.4 0.3 0.4 0.4 0.3 0.3 0.3 0.2 0.4 0.2 0.3 0.2 0.3 0.3 0.2 0.2 0.2 0.2
5-14 0.1 0.2 0.2 0.2 0.1 0.1 0.2 0.2 0.1 0.2 0.1 0.1 0.1 0.1 0.1 0.2 0.1 0.2 0.2 0.2
15-24 0.5 0.5 0.4 0.4 0.5 0.4 0.4 0.5 0.5 0.4 0.5 0.4 0.4 0.4 0.4 0.3 0.4 0.3 0.4 0.4
25-34 0.6 0.7 0.5 0.6 0.5 0.5 0.7 0.5 0.6 0.6 0.6 0.8 0.6 0.7 0.6 0.7 0.6 0.8 0.7 0.8
35-44 1.1 1.2 1.3 1.4 1.5 1.4 1.3 1.5 1.5 1.4 1.2 1.3 1.2 1.4 1.5 1.4 1.3 1.4 1.4 1.4
45-54 2.6 2.9 2.7 3.0 3.0 3.1 3.0 3.1 3.0 3.2 2.9 3.2 3.0 3.4 3.3 3.3 3.3 3.5 3.0 3.2
55-64 7.3 8.0 7.6 7.5 7.3 7.0 6.7 7.0 7.0 6.4 6.6 6.4 6.4 6.6 6.5 6.2 6.7 7.2 7.0 7.2
65-74 18.2 18.7 19.2 18.6 18.1 17.6 17.3 17.7 17.9 16.3 17.1 16.4 15.2 15.6 15.8 16.0 15.2 15.5 15.7 14.9
75-84 45.1 46.0 46.4 46.9 47.8 47.2 46.2 46.4 45.5 45.3 45.1 43.4 41.2 42.8 42.5 41.5 42.6 42.5 43.1 41.385 and over 146.4 147.5 150.0 144.7 146.5 143.9 136.9 136.1 132.7 131.0 130.4 123.3 136.5 139.4 132.9 137.0 132.4 139.2 130.2 132.2
*Rate per 1,000 age-group population
Rates may differ from those published in reports prior to 1999.
Kansas, 1998-2017
Table E2Age-Specific Death Rates* by Sex
Year

† 2017 Rates Not Available
Year Total Male Female Total Male Female
1998 837.8 1,027.8 695.3 870.6 1,069.4 724.7
1999 847.2 1,020.6 716.1 875.6 1,067.0 734.0
2000 849.0 1,033.1 717.6 869.0 1,053.8 731.4
2001 846.2 1,031.2 711.4 858.8 1,035.4 725.6
2002 841.6 1,006.6 717.2 855.9 1,030.6 723.6
2003 817.9 965.6 702.7 843.5 1,010.3 715.2
2004 790.1 920.6 683.0 813.7 973.3 690.5
2005 805.0 949.9 689.4 815.0 971.9 692.3
2006 792.6 932.1 681.7 791.8 943.5 672.2
2007 780.4 930.8 663.3 775.3 922.9 658.1
2008 782.2 937.5 661.1 774.9 918.8 659.9
2009 759.4 911.7 643.4 749.6 890.9 636.8
2010 759.8 910.6 638.0 747.0 887.1 634.9
2011 767.1 894.7 662.1 741.3 875.3 632.4
2012 759.0 891.3 650.5 732.8 865.1 624.7
2013 755.6 879.4 652.5 731.9 863.6 623.5
2014 757.3 893.2 644.5 724.6 855.1 616.7
2015 772.5 898.3 667.2 733.1 863.2 624.2
2016 753.5 878.7 647.8 728.8 861.0 617.5
2017 761.3 899.4 645.0 n/a n/a n/a
* Rate per 100,000 standard U.S. 2000 population (see Technical Notes)
Rates will differ from those published prior to 1999 because they have
been recalculated using the 2000 U.S. standard population.
Kansas U.S.
Age-Adjusted Death Rates*Kansas and the U.S., 1998-2017
Table E3Age-Adjusted Death Rates* by SexKansas and the U.S., 1998-2017
700
750
800
850
900
950
1998 2000 2002 2004 2006 2008 2010 2012 2014 2016
Ra
te p
er
10
0,0
00
Sta
nd
ard
U.S
. 20
00
po
pu
latio
n
Year
Kansas
U.S.†
Figure E2

Average
Under 85 & Age At
Population Group Total 1 1-4 5-14 15-24 25-34 35-44 45-54 55-64 65-74 75-84 Over n.s. Death
All Races 26,725 217 42 64 313 476 653 1,375 3,443 4,780 6,296 9,065 1 74.2
Male 13,576 127 26 34 226 325 406 826 2,060 2,799 3,276 3,470 1 71.1
Female 13,149 90 16 30 87 151 247 549 1,383 1,981 3,020 5,595 0 77.5
n.s. 0 0 0 0 0 0 0 0 0 0 0 0 0 n/a
White Non-Hispanic 23,557 120 22 39 203 315 479 1,086 2,859 4,194 5,731 8,508 1 75.7
Male 11,857 62 14 21 147 212 298 658 1,694 2,477 3,002 3,271 1 72.8
Female 11,700 58 8 18 56 103 181 428 1,165 1,717 2,729 5,237 0 78.7
n.s. 0 0 0 0 0 0 0 0 0 0 0 0 0 n/a
Black Non-Hispanic 1,421 29 7 5 32 59 73 133 297 294 258 234 0 64.7
Male. 768 19 5 3 23 45 46 73 188 169 119 78 0 60.7
Female 653 10 2 2 9 14 27 60 109 125 139 156 0 69.3
n.s. 0 0 0 0 0 0 0 0 0 0 0 0 0 n/a
Native American Non-Hispanic 194 2 1 1 4 8 7 21 45 41 36 28 0 65.2
Male 97 1 1 1 4 5 4 11 23 24 18 5 0 60.2
Female 97 1 0 0 0 3 3 10 22 17 18 23 0 70.1
n.s. 0 0 0 0 0 0 0 0 0 0 0 0 0 n/a
Asian/Pacific Non-Hispanic 232 6 0 0 11 11 8 21 34 47 60 34 0 65.2
Male. 128 3 0 0 8 6 4 15 20 27 28 17 0 63.6
Female 104 3 0 0 3 5 4 6 14 20 32 17 0 67.3
n.s. 0 0 0 0 0 0 0 0 0 0 0 0 0 n/a
Other Non-Hispanic* 340 15 1 4 15 18 20 23 55 65 56 68 0 62.3
Male 181 11 0 2 11 11 13 16 32 34 25 26 0 57.9
Female 159 4 1 2 4 7 7 7 23 31 31 42 0 67.4
n.s. 0 0 0 0 0 0 0 0 0 0 0 0 0 n/a
Hispanic Any Race 918 43 11 14 47 64 65 83 129 123 149 190 0 60.0
Male 503 30 6 7 32 45 41 47 83 61 79 72 0 55.5
Female 415 13 5 7 15 19 24 36 46 62 70 118 0 65.4
n.s. 0 0 0 0 0 0 0 0 0 0 0 0 0 n/a
Not Stated 63 2 0 1 1 1 1 8 24 16 6 3 0 60.3
Male 42 1 0 0 1 1 0 6 20 7 5 1 0 60.0
Female 21 1 0 1 0 0 1 2 4 9 1 2 0 60.9
n.s. 0 0 0 0 0 0 0 0 0 0 0 0 0 n/a
* Includes selection of two or more races or other non-specified race
Age-Group
Table E4Deaths by Population Group and Sex, by Age-Group and Average Age at Death
Kansas, 2017

Chronic Nephritis,
Lower Cerebro- Pneumonia Nephrotic All
Heart Malignant Respiratory Unintentional vascular Alzheimer's Diabetes Suicide and Syndrome, Other
Population Group Total Disease Neoplasms Diseases Injuries Disease Disease Mellitus Influenza Nephrosis Causes
Total 26,725 5,636 5,391 1,816 1,573 1,327 886 864 544 540 531 7,617
White Non-Hispanic 23,557 5,073 4,790 1,678 1,317 1,189 825 706 456 502 440 6,581
Black Non-Hispanic 1,421 292 275 69 68 65 23 79 21 15 43 471
Native American Non-Hispanic 194 32 38 15 21 7 5 12 6 2 5 51
Asian/Pacific Non-Hispanic 232 34 64 7 12 14 3 10 11 5 6 66
Other Non-Hispanic* 340 57 53 20 33 14 6 12 15 3 5 122
Hispanic Any Race 918 133 168 18 116 38 24 43 34 12 32 300
n.s. 63 15 3 9 6 0 0 2 1 1 0 26
Male 13,576 2,962 2,936 896 913 539 278 476 426 243 267 3,640
White Non-Hispanic 11,857 2,665 2,619 836 748 477 262 396 360 224 215 3,055
Black Non-Hispanic 768 154 143 28 45 28 6 38 15 8 26 277
Native American Non-Hispanic 97 14 16 8 13 3 0 7 6 1 4 25
Asian/Pacific Non-Hispanic 128 18 42 5 9 5 1 2 7 4 4 31
Other Non-Hispanic* 181 29 30 8 19 4 2 8 9 2 3 67
Hispanic Any Race 503 72 84 8 74 22 7 23 28 3 15 167
n.s. 42 10 2 3 5 0 0 2 1 1 0 18
Female 13,149 2,674 2,455 920 660 788 608 388 118 297 264 3,977
White Non-Hispanic 11,700 2,408 2,171 842 569 712 563 310 96 278 225 3,526
Black Non-Hispanic 653 138 132 41 23 37 17 41 6 7 17 194
Native American Non-Hispanic 97 18 22 7 8 4 5 5 0 1 1 26
Asian/Pacific Non-Hispanic 104 16 22 2 3 9 2 8 4 1 2 35
Other Non-Hispanic* 159 28 23 12 14 10 4 4 6 1 2 55
Hispanic Any Race 415 61 84 10 42 16 17 20 6 9 17 133
n.s. 21 5 1 6 1 0 0 0 0 0 0 8
n.s. 0 0 0 0 0 0 0 0 0 0 0 0
* Includes selection of two or more races or other non-specified race
Causes of Death
Table E5Ten Leading Causes of Death by Population Group and Sex of Decedent
Kansas, 2017

Average
Selected Causes of Under 85 & Age at
Death * Total 1 1-4 5-14 15-24 25-34 35-44 45-54 55-64 65-74 75-84 Over n.s. Death
All Causes 26,725 217 42 64 313 476 653 1,375 3,443 4,780 6,296 9,065 1 74.2
Selected Causes 20,401 71 28 47 278 390 539 1,100 2,779 3,849 4,822 6,498 1 n.a.
Tuberculosis 1 0 0 0 0 0 0 1 0 0 0 0 0 51.0
HIV/AIDS 22 0 0 0 1 1 1 9 3 5 2 0 0 55.6
Malignant Neoplasms 5,391 1 4 11 9 24 97 312 1,083 1,461 1,463 925 1 71.9
Diabetes mellitus 864 0 0 0 0 13 28 51 144 232 213 183 0 72.0
Alzheimer's Disease 886 0 0 0 0 0 0 2 10 35 259 580 0 86.8
Heart Disease 5,636 0 1 0 3 29 75 250 653 958 1,255 2,412 0 78.7
Prim. Hypertension/Hypertensive Renal Dis. And Sec. Hypertension 263 0 0 0 0 4 1 14 34 37 50 123 0 79.1
Cerebrovascular Disease 1,327 1 0 3 3 3 14 41 99 176 360 627 0 80.6
Atherosclerosis 384 0 0 0 0 0 0 5 25 39 107 208 0 83.5
Pneumonia and Influenza 540 0 1 0 1 3 7 12 32 67 129 288 0 82.0
Chronic Lower Respiratory Diseases 1,816 0 0 2 1 5 7 44 208 458 574 517 0 76.9
Peptic Ulcer 32 0 0 0 0 0 0 1 4 6 6 15 0 78.5
Chronic Liver Disease and Cirrhosis 311 0 0 0 0 8 26 63 106 63 32 13 0 60.3
Nephritis, Nephrotic Syndrome and Nephrosis 531 0 0 0 0 3 6 15 69 91 141 206 0 78.2
Congenital Anomalies 102 53 2 4 3 4 3 6 12 9 3 3 0 24.3
Unintentional Injuries 1,573 14 14 21 117 146 157 162 199 159 204 380 0 60.3
Suicide 544 0 0 6 93 101 91 91 75 48 23 16 0 43.8
Homicide 179 2 6 0 47 46 26 21 23 5 1 2 0 35.2
* The ICD-10 codes associated with each category are listed in Appendix 4.
Table E6Selected Causes of Death by Age-Group
and Average Age at DeathKansas, 2017
Age-Group

Leading Causes of Death †
Total Male Female n.s. Total Male Female Total Male Female
All Causes 26,725 13,576 13,149 0 917.4 935.0 899.9 74.2 71.1 77.5
Heart Disease 5,636 2,962 2,674 0 193.5 204.0 183.0 78.7 75.4 82.4
Malignant Neoplasms 5,391 2,936 2,455 0 185.1 202.2 168.0 71.9 72.0 71.8
Chronic Lower Respiratory Diseases 1,816 896 920 0 62.3 61.7 63.0 76.9 76.6 77.2
Unintentional Injuries 1,573 913 660 0 54.0 62.9 45.2 60.3 55.4 67.1
Cerebrovascular Disease 1,327 539 788 0 45.6 37.1 53.9 80.6 77.8 82.6
Alzheimer's Disease 886 278 608 0 30.4 19.1 41.6 86.8 85.2 87.5
Diabetes mellitus 864 476 388 0 29.7 32.8 26.6 72.0 71.1 73.0
Suicide 544 426 118 0 18.7 29.3 8.1 43.8 44.5 41.3
Pneumonia and Influenza 540 243 297 0 18.5 16.7 20.3 82.0 79.6 83.9
Nephritis, Nephrotic Syndrome and Nephrosis 531 267 264 0 18.2 18.4 18.1 78.2 77.3 79.0
*Rate per 100,000 population
† The ICD-10 codes associated with each category are listed in Appendix 4.
Note: Rates are based US Census Bureau population estimates for 2017.
Average Age at Death
Table E7Ten Leading Causes of Death,
Number, Rate and Average Age at Death, by SexKansas, 2017
Cause-Specific Death Rate* Number of Deaths
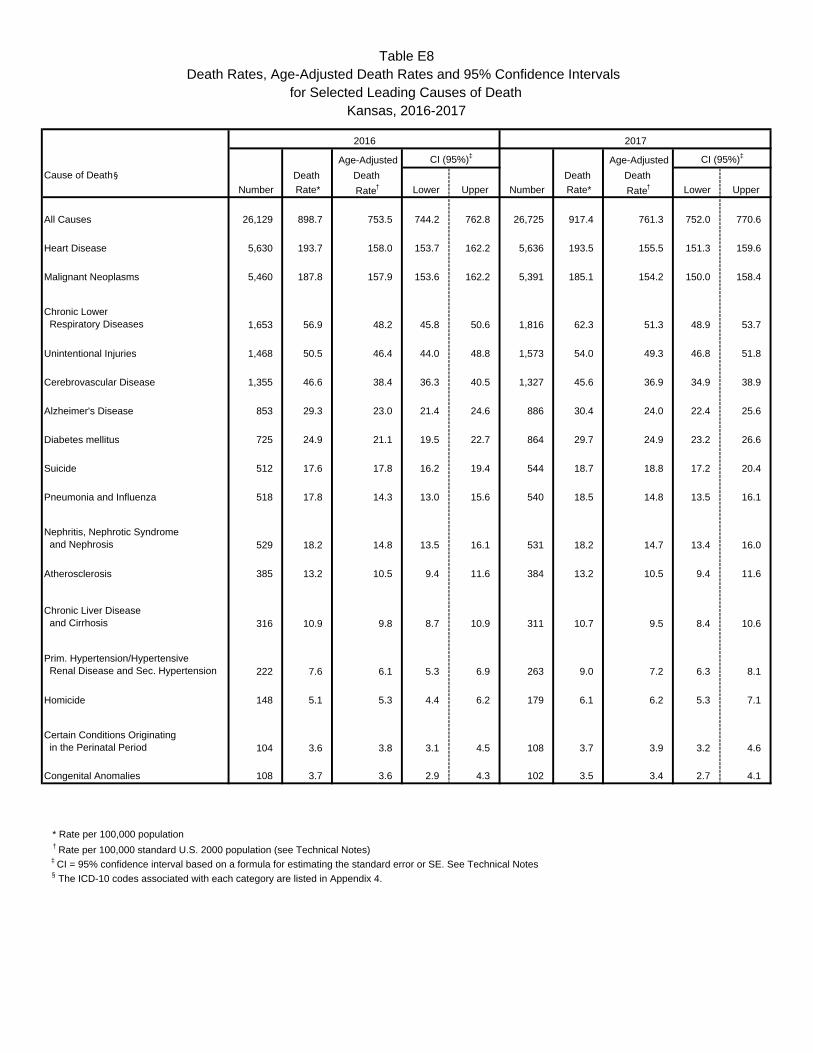
Age-Adjusted Age-Adjusted
Cause of Death § Death Death Death Death
Number Rate* Rate† Lower Upper Number Rate* Rate† Lower Upper
All Causes 26,129 898.7 753.5 744.2 762.8 26,725 917.4 761.3 752.0 770.6
Heart Disease 5,630 193.7 158.0 153.7 162.2 5,636 193.5 155.5 151.3 159.6
Malignant Neoplasms 5,460 187.8 157.9 153.6 162.2 5,391 185.1 154.2 150.0 158.4
Chronic Lower Respiratory Diseases 1,653 56.9 48.2 45.8 50.6 1,816 62.3 51.3 48.9 53.7
Unintentional Injuries 1,468 50.5 46.4 44.0 48.8 1,573 54.0 49.3 46.8 51.8
Cerebrovascular Disease 1,355 46.6 38.4 36.3 40.5 1,327 45.6 36.9 34.9 38.9
Alzheimer's Disease 853 29.3 23.0 21.4 24.6 886 30.4 24.0 22.4 25.6
Diabetes mellitus 725 24.9 21.1 19.5 22.7 864 29.7 24.9 23.2 26.6
Suicide 512 17.6 17.8 16.2 19.4 544 18.7 18.8 17.2 20.4
Pneumonia and Influenza 518 17.8 14.3 13.0 15.6 540 18.5 14.8 13.5 16.1
Nephritis, Nephrotic Syndrome and Nephrosis 529 18.2 14.8 13.5 16.1 531 18.2 14.7 13.4 16.0
Atherosclerosis 385 13.2 10.5 9.4 11.6 384 13.2 10.5 9.4 11.6
Chronic Liver Disease and Cirrhosis 316 10.9 9.8 8.7 10.9 311 10.7 9.5 8.4 10.6
Prim. Hypertension/Hypertensive Renal Disease and Sec. Hypertension 222 7.6 6.1 5.3 6.9 263 9.0 7.2 6.3 8.1
Homicide 148 5.1 5.3 4.4 6.2 179 6.1 6.2 5.3 7.1
Certain Conditions Originating in the Perinatal Period 104 3.6 3.8 3.1 4.5 108 3.7 3.9 3.2 4.6
Congenital Anomalies 108 3.7 3.6 2.9 4.3 102 3.5 3.4 2.7 4.1
* Rate per 100,000 population
† Rate per 100,000 standard U.S. 2000 population (see Technical Notes) ‡ CI = 95% confidence interval based on a formula for estimating the standard error or SE. See Technical Notes
§ The ICD-10 codes associated with each category are listed in Appendix 4.
2017
CI (95%)‡
Table E8Death Rates, Age-Adjusted Death Rates and 95% Confidence Intervals
for Selected Leading Causes of DeathKansas, 2016-2017
2016
CI (95%)‡

Death Rates for Selected Leading Causes of Death
Kansas, 1998-2017
Figure E3
0
50
100
150
200
250
300
1998 2000 2002 2004 2006 2008 2010 2012 2014 2016
Rat
e pe
r 10
0,00
0 P
opul
atio
n
Year
Heart Disease
Cancer
Cerebrovascular Dis.
Unintentional Injuries
Chron. Lower Res. Dis.

Leading Causes of Death by Age-Group
ALL AGES UNDER 1 YEAR 1-4 YEARSCAUSE NUMBER CAUSE NUMBER CAUSE NUMBER HEART DISEASE 5,636 CONGENITAL ANOMALIES 53 UNINTENTIONAL INJURIES 14CANCER 5,391 LENGTH GEST./FETAL GROWTH 40 HOMICIDE 6CHRON. LOWER RESP. DIS. 1,816 MATERNAL FACTORS & COMPL. 25 ENDOCRINE DISEASES 2UNINTENTIONAL INJURIES 1,573 UNINTENTIONAL INJURIES 14 DIS. OF THE RESPIRATORY SYST 2CEREBROVASC. DIS. 1,327 SIDS 13 OTHER CAUSES 18OTHER CAUSES 10,982 OTHER CAUSES 72
TOTAL 42TOTAL 26,725 TOTAL 217
5-14 YEARS 15-24 YEARS 25-44 YEARSCAUSE NUMBER CAUSE NUMBER CAUSE NUMBER UNINTENTIONAL INJURIES 21 UNINTENTIONAL INJURIES 117 UNINTENTIONAL INJURIES 303CANCER 11 SUICIDE 93 SUICIDE 192SUICIDE 6 HOMICIDE 47 CANCER 121CONGENITAL ANOMALIES 4 CANCER 9 HEART DISEASE 104CEREBROVASCULAR DISEASE 3 CEREBROVASC. DIS. 3 HOMICIDE 72OTHER CAUSES 19 CONGENITAL ANOMALIES 3 OTHER CAUSES 337
HEART DISEASE 3TOTAL 64 OTHER CAUSES 38 TOTAL 1,129
TOTAL 313
45-64 YEARS 85 YEARS AND OVERCAUSE NUMBER CAUSE NUMBER
65-84 YEARS
CANCER 1,395 CAUSE NUMBER HEART DISEASE 2,412HEART DISEASE 903 CANCER 925UNINTENTIONAL INJURIES 361 CANCER 2,924 CEREBROVASC. DIS. 627CHRON. LOWER RESP. DIS. 252 HEART DISEASE 2,213 ALZHEIMER'S DISEASE 580DIABETES MELLITUS 195 CHRON. LOWER RESP. DIS. 1,032 CHRON. LOWER RESP. DIS. 517OTHER CAUSES 1,712 CEREBROVASC. DIS. 536 OTHER CAUSES 4,004
DIABETES MELLITUS 445TOTAL 4,818 OTHER CAUSES 3,926 TOTAL 9,065
TOTAL 11,076
Kansas, 2017
Figure E4

Number of Age-AdjustedYear Deaths Rate
1999 670 22.02000 740 24.12001 557 18.32002 690 22.12003 686 21.62004 558 17.52005 728 22.42006 647 19.42007 662 19.72008 740 21.72009 592 17.82010 555 16.52011 641 18.62012 621 17.92013 709 20.02014 631 18.02015 682 18.92016 518 14.32017 540 14.8
* 1999 is year Kansas switched to ICD-10 cause of death classification.
Kansas Residents, 1999-2017*
Table E9
Figure E5
Pneumonia and Influenza Deathsby Month and by Five-Year Median for Month
Kansas Residents, 2017
Pneumonia and Influenza MortalityNumber and Age-Adjusted Rates
0
20
40
60
80
100
120
140
Jan Feb Mar Apr May Jun Jul Aug Sep Oct Nov Dec
Month
Count
5-Year Median

Causes of Death and Sex Under 85 &
of Decedent * Total 1 1-4 5-14 15-24 25-34 35-44 45-54 55-64 65-74 75-84 Over n.s.
Heart Disease 5,636 0 1 0 3 29 75 250 653 958 1,255 2,412 0
Male 2,962 0 1 0 2 20 44 175 456 625 679 960 0
Female 2,674 0 0 0 1 9 31 75 197 333 576 1,452 0
Acute Rheumatic Fever and Chronic Rheumatic Heart Disease 26 0 0 0 0 0 1 1 1 5 7 11 0
Male 8 0 0 0 0 0 0 1 1 1 3 2 0
Female 18 0 0 0 0 0 1 0 0 4 4 9 0
Hypertensive Heart Disease with or without Renal Disease 376 0 0 0 0 0 7 17 34 60 58 200 0
Male 156 0 0 0 0 0 3 11 22 36 27 57 0
Female 220 0 0 0 0 0 4 6 12 24 31 143 0
Ischemic Heart Disease 3,299 0 0 0 0 10 42 157 465 640 756 1,229 0
Male 1,977 0 0 0 0 8 31 111 340 451 462 574 0
Female 1,322 0 0 0 0 2 11 46 125 189 294 655 0
Pulmonary Heart Disease and Diseases of Pulmonary Circulation 189 0 0 0 1 3 8 17 22 30 50 58 0
Male 58 0 0 0 1 1 2 10 7 13 14 10 0
Female 131 0 0 0 0 2 6 7 15 17 36 48 0
Other Forms of Heart Disease 1,746 0 1 0 2 16 17 58 131 223 384 914 0
Male 763 0 1 0 1 11 8 42 86 124 173 317 0
Female 983 0 0 0 1 5 9 16 45 99 211 597 0
* The ICD-10 codes associated with each category are listed in Appendix 4.
Table E10Heart Disease Deaths by Component and Sex of Decedent, by Age-Group of Decedent
Age-Group
Kansas, 2017

Site of Lesion and Sex Under 85 &of Decedent * Total† 1 1-4 5-14 15-24 25-34 35-44 45-54 55-64 65-74 75-84 Over
Malignant Neoplasms (All Sites) 5,390 1 4 11 9 24 97 312 1,083 1,461 1,463 925 Male 2,935 0 3 5 4 13 40 151 597 840 824 458 Female 2,455 1 1 6 5 11 57 161 486 621 639 467
Lip, Oral Cavity and Pharynx 95 0 0 0 0 0 1 9 28 24 21 12
Male 71 0 0 0 0 0 0 9 24 17 14 7
Female 24 0 0 0 0 0 1 0 4 7 7 5
Digestive Organs 1,370 0 0 2 0 4 22 99 308 366 350 219
Male 805 0 0 1 0 1 12 58 203 238 200 92
Female 565 0 0 1 0 3 10 41 105 128 150 127
Respiratory and Intrathoracic Organs 1,398 0 0 0 1 1 8 57 288 462 406 175
Male 777 0 0 0 0 1 3 30 155 263 227 98
Female 621 0 0 0 1 0 5 27 133 199 179 77
Bone and Articular Cartilage 18 0 0 1 2 1 3 1 1 2 5 2
Male 11 0 0 0 2 1 1 1 1 2 2 1
Female 7 0 0 1 0 0 2 0 0 0 3 1
Skin 116 0 0 0 0 0 2 8 18 37 24 27
Male 79 0 0 0 0 0 1 3 17 25 16 17
Female 37 0 0 0 0 0 1 5 1 12 8 10
Mesothelial and Soft Tissue 77 0 0 2 2 1 3 9 18 20 15 7
Male 45 0 0 1 1 0 2 6 9 11 11 4
Female 32 0 0 1 1 1 1 3 9 9 4 3
Breast 342 0 0 0 0 2 12 36 79 79 77 57
Male 8 0 0 0 0 0 0 0 1 4 3 0
Female 334 0 0 0 0 2 12 36 78 75 74 57
Genital Organs 563 0 0 1 1 1 13 25 87 145 152 138
Male 277 0 0 1 0 0 1 4 26 61 96 88
Female 286 0 0 0 1 1 12 21 61 84 56 50
Urinary Tract 299 0 1 0 0 0 1 11 49 65 101 71
Male 207 0 1 0 0 0 1 6 38 51 68 42
Female 92 0 0 0 0 0 0 5 11 14 33 29
Eye and Adnexa 4 0 0 0 0 0 0 0 0 1 2 1
Male 2 0 0 0 0 0 0 0 0 0 2 0
Female 2 0 0 0 0 0 0 0 0 1 0 1
Meninges, Brain and Other Parts of Central Nervous System 166 0 0 3 2 7 14 12 46 43 26 13
Male 93 0 0 0 1 4 8 9 23 31 12 5
Female 73 0 0 3 1 3 6 3 23 12 14 8
Thyroid and Other Endocrine Glands 23 0 0 1 0 0 1 1 4 8 4 4
Male 13 0 0 1 0 0 0 1 2 5 2 2
Female 10 0 0 0 0 0 1 0 2 3 2 2
Other and Unspecified Sites 398 0 0 0 0 2 6 27 92 83 106 82
Male 234 0 0 0 0 1 2 12 56 55 67 41
Female 164 0 0 0 0 1 4 15 36 28 39 41
Leukemia 234 1 3 1 0 4 4 6 30 53 79 53
Male 142 0 2 1 0 4 2 3 21 30 53 26
Female 92 1 1 0 0 0 2 3 9 23 26 27
Other Lymphoid, Hematopoietic and Related Tissue 287 0 0 0 1 1 7 11 35 73 95 64
Male 171 0 0 0 0 1 7 9 21 47 51 35
Female 116 0 0 0 1 0 0 2 14 26 44 29
* The ICD-10 codes associated with each category are listed in Appendix 6.
† There was also one genital cancer death in 2017 for an male of unknown age, for a total of 5,391 malignant neoplasm deaths.
Age-Group
Table E11Malignant Neoplasm Deaths
by Site of Lesion and Sex of Decedent, by Age-Group of DecedentKansas, 2017

Cause of Death and Sex
of Decedent Under 85 &
Total 1 1-4 5-14 15-24 25-34 35-44 45-54 55-64 65-74 75-84 Over
Cerebrovascular Disease 1,327 1 0 3 3 3 14 41 99 176 360 627
Male 539 1 0 3 2 1 8 19 52 90 161 202
Female 788 0 0 0 1 2 6 22 47 86 199 425
Subarachnoid Hemorrhage 53 0 0 0 0 1 3 10 9 7 13 10
Male 14 0 0 0 0 0 1 2 1 2 5 3
Female 39 0 0 0 0 1 2 8 8 5 8 7
Intracerebral and Other Intercranial Hemorrhage 277 0 0 1 1 2 7 12 29 42 92 91
Male 128 0 0 1 1 1 4 7 20 20 37 37
Female 149 0 0 0 0 1 3 5 9 22 55 54
Cerebral Infarction 183 0 0 0 0 0 0 3 12 30 49 89
Male 73 0 0 0 0 0 0 1 6 18 19 29
Female 110 0 0 0 0 0 0 2 6 12 30 60
Stroke, Not Specified as Hemorrhage or Infarction 563 0 0 2 1 0 1 11 38 68 146 296
Male 231 0 0 2 0 0 1 6 22 37 72 91
Female 332 0 0 0 1 0 0 5 16 31 74 205
Other Cerebrovascular Diseases 251 1 0 0 1 0 3 5 11 29 60 141
Male 93 1 0 0 1 0 2 3 3 13 28 42
Female 158 0 0 0 0 0 1 2 8 16 32 99
* The ICD-10 codes associated with each category are listed in Appendix 4.
Table E12Cerebrovascular Disease Deaths by Component and Sex of Decedent, by Age-Group of Decedent
Kansas, 2017
Age-Group

Cause of Death and Sex Under 85 &of Decedent Total 1 1-4 5-14 15-24 25-34 35-44 45-54 55-64 65-74 75-84 Over
Unintentional Injuries 1,573 14 14 21 117 146 157 162 199 159 204 380
Male 913 9 11 11 86 103 108 103 128 103 103 148
Female 660 5 3 10 31 43 49 59 71 56 101 232
Motor-Vehicle 447 0 6 12 77 74 62 54 67 34 41 20
Male 317 0 6 8 55 52 46 46 46 24 21 13
Female 130 0 0 4 22 22 16 8 21 10 20 7
Traffic 427 0 4 9 75 73 61 52 62 32 40 19
Male 301 0 4 6 54 52 45 44 42 22 20 12
Female 126 0 0 3 21 21 16 8 20 10 20 7
Non-Traffic 20 0 2 3 2 1 1 2 5 2 1 1
Male 16 0 2 2 1 0 1 2 4 2 1 1
Female 4 0 0 1 1 1 0 0 1 0 0 0
Water Transport 2 0 0 0 0 0 0 1 0 0 1 0
Male 2 0 0 0 0 0 0 1 0 0 1 0
Female 0 0 0 0 0 0 0 0 0 0 0 0
Air and Space Transport 4 0 0 0 0 2 0 0 2 0 0 0
Male 3 0 0 0 0 1 0 0 2 0 0 0
Female 1 0 0 0 0 1 0 0 0 0 0 0
Falls 469 0 0 0 0 2 4 11 26 52 99 275
Male 206 0 0 0 0 2 4 8 19 30 47 96
Female 263 0 0 0 0 0 0 3 7 22 52 179
Inanimate Mechanical Forces 30 0 0 2 5 1 3 4 5 1 9 0
Male 27 0 0 1 5 1 3 4 4 1 8 0
Female 3 0 0 1 0 0 0 0 1 0 1 0
Drowning and Submersion 26 1 2 4 5 4 4 1 3 1 1 0
Male 18 0 2 0 5 4 4 0 2 1 0 0
Female 8 1 0 4 0 0 0 1 1 0 1 0
Other Accidental Threats to Breathing 100 13 2 0 2 2 4 3 12 20 18 24
Male 60 9 2 0 1 2 3 1 8 12 8 14
Female 40 4 0 0 1 0 1 2 4 8 10 10
Table E13Unintentional Injury Deaths by Component and Sex of Decedent, by Age-Group of Decedent
Kansas, 2017
Age-Group

Cause of Death and Sex Under 85 &of Decedent Total 1 1-4 5-14 15-24 25-34 35-44 45-54 55-64 65-74 75-84 Over
Table E13Unintentional Injury Deaths by Component and Sex of Decedent, by Age-Group of Decedent
Kansas, 2017
Age-Group
Electric Current, Radiation and Air Temperature/Pressure 5 0 1 0 0 2 0 1 0 0 1 0
Male 4 0 0 0 0 2 0 1 0 0 1 0
Female 1 0 1 0 0 0 0 0 0 0 0 0
Smoke, Fire and Flames 26 0 2 1 1 0 3 1 5 6 2 5
Male 16 0 0 1 1 0 2 0 4 4 1 3
Female 10 0 2 0 0 0 1 1 1 2 1 2
Forces of Nature 8 0 0 0 0 0 1 1 1 2 1 2
Male 8 0 0 0 0 0 1 1 1 2 1 2
Female 0 0 0 0 0 0 0 0 0 0 0 0
Poisonings 290 0 0 0 21 52 68 72 59 12 4 2
Male 164 0 0 0 17 35 41 31 31 7 1 1
Female 126 0 0 0 4 17 27 41 28 5 3 1
Other Unintentional Injuries 120 0 0 2 6 5 7 11 7 18 20 44
Male 62 0 0 1 2 2 4 9 5 13 11 15
Female 58 0 0 1 4 3 3 2 2 5 9 29
Complications of Medical and Surgical Care 46 0 1 0 0 2 1 2 12 13 7 8
Male 26 0 1 0 0 2 0 1 6 9 3 4
Female 20 0 0 0 0 0 1 1 6 4 4 4
* The ICD-10 codes associated with each category are listed in Appendix 4.

Cause Group † Total Unintentional Suicide Homicide Undetermined Legal/War
Total 2,286 1,527 544 179 33 3
Cut/Pierce 25 2 7 16 0 0
Drowning 32 26 1 1 4 0
Falls 473 469 4 0 0 0
Fire/flame 30 26 2 1 1 0
Hot Object/Scalding 1 1 0 0 0 0
Firearm 455 9 309 134 0 3
Machinery 11 11 0 0 0 0
Motor Vehicle Traffic 427 427 0 0 0 0
Other Pedal Cyclist 0 0 0 0 0 0
Other Pedestrian 9 9 0 0 0 0
Other Land Transport 22 20 1 1 0 0
Other Transport 6 6 0 0 0 0
Natural/Environmental 10 10 0 0 0 0
Overexertion 0 0 0 0 0 0
Poisoning 373 290 64 2 17 0
Struck By/Against 6 6 0 0 0 0
Suffocation 256 100 150 5 1 0
Other Specified 14 11 2 1 0 0
NEC § 18 10 3 4 1 0
Not Specified 118 94 1 14 9 0
† The ICD-10 codes associated with each category are listed in Appendix 7.
* Adverse effects of drugs or medical care are excluded.
§ NEC = Not Elsewhere Classified
Table E14Selected External Causes of Death by Injury Matrix Group and Intent,
Kansas, 2017*

Type of
Industry Total 2008 2009 2010 2011 2012 2013 2014 2015 2016 2017
Total 545 42 50 74 59 49 59 58 50 55 49
Agriculture, Forestry, Fishing and Hunting 100 12 14 15 10 11 9 13 7 3 6
Mining 23 3 2 2 0 2 5 3 2 3 1
Utilities 12 2 0 1 1 0 1 0 2 3 2
Construction 102 5 14 18 15 9 13 5 7 6 10
Manufacturing 54 3 1 6 5 4 5 13 4 10 3
Wholesale Trade 27 0 1 1 8 4 1 3 4 2 3
Retail Trade 26 2 2 9 2 5 1 0 0 3 2
Transportation andWarehousing 61 5 4 6 5 3 12 6 6 7 7
Information 1 0 0 0 0 0 0 1 0 0 0
Finance and Insurance 2 1 0 0 0 0 0 0 1 0 0
Real Estate, and Rental, and Leasing 3 1 1 0 0 0 0 0 0 1 0
Professional, Scientificand Technical Services 7 1 0 1 0 1 0 2 0 0 2
Management of Companiesand Enterprises 0 0 0 0 0 0 0 0 0 0 0
Admin. and Support & Waste Management Services 10 0 0 1 2 1 0 3 3 0 0
Educational Services 7 0 0 1 1 1 0 1 0 3 0
Health Care and Social Assistance 14 0 3 1 0 1 1 2 0 2 4
Arts, Entertainment, andRecreation 3 0 0 1 0 0 0 1 0 1 0
Accommodation and Food Services 5 2 0 0 1 0 2 0 0 0 0
Other Services (except Public Admin.) 18 1 1 2 2 1 1 1 5 1 3
Public Admin. and Active Duty Military 30 2 3 4 2 4 1 3 1 6 4
Housewives, Students, Children,
Volunteers and None§ 16 0 2 3 3 0 3 0 3 2 0
n.s. 24 2 2 2 2 2 4 1 5 2 2
*Due to changes in the coding of industry, use caution when comparing different years.§This category includes those who were never employed.
Year
Table E15Work-related Injury Deaths by Industry* of Decedent's Occupation by Year
Kansas, 2008-2017

Cause of Death * and Sex Under 85 &
of Decedent Total 1 1-4 5-14 15-24 25-34 35-44 45-54 55-64 65-74 75-84 Over
Total 4,201 0 0 2 1 33 68 193 590 926 1,123 1,265
Male 2,132 0 0 1 1 23 44 109 328 510 577 539
Female 2,069 0 0 1 0 10 24 84 262 416 546 726
Diabetes mellitus 864 0 0 0 0 13 28 51 144 232 213 183
Male 476 0 0 0 0 7 16 29 93 126 116 89
Female 388 0 0 0 0 6 12 22 51 106 97 94
Primary Hypertension/Hypertensive Renal Dis. And Secondary Hypertension 263 0 0 0 0 4 1 14 34 37 50 123
Male 117 0 0 0 0 3 1 9 21 21 22 40
Female 146 0 0 0 0 1 0 5 13 16 28 83
Atherosclerosis 384 0 0 0 0 0 0 5 25 39 107 208
Male 156 0 0 0 0 0 0 4 14 22 41 75
Female 228 0 0 0 0 0 0 1 11 17 66 133
Chronic Lower Respiratory Diseases 1,816 0 0 2 1 5 7 44 208 458 574 517
Male 896 0 0 1 1 3 5 13 95 244 306 228
Female 920 0 0 1 0 2 2 31 113 214 268 289
Peptic Ulcer 32 0 0 0 0 0 0 1 4 6 6 15
Male 13 0 0 0 0 0 0 0 3 1 4 5
Female 19 0 0 0 0 0 0 1 1 5 2 10
Chronic Liver Disease and Cirrhosis 311 0 0 0 0 8 26 63 106 63 32 13
Male 207 0 0 0 0 7 18 47 69 45 17 4
Female 104 0 0 0 0 1 8 16 37 18 15 9
Nephritis, Nephrotic Syndrome, and Nephrosis 531 0 0 0 0 3 6 15 69 91 141 206
Male 267 0 0 0 0 3 4 7 33 51 71 98
Female 264 0 0 0 0 0 2 8 36 40 70 108
* The ICD-10 codes associated with each category are listed in Appendix 4.
Table E16Selected Chronic Disease Deaths by Component and Sex of Decedent, by Age-Group of Decedent
Kansas, 2017
Age-Group

Underlying Cause of Death
Number of Deaths with Underlying Cause
Number of Deaths in which Diabetes was Contributing Cause
HIV (AIDS) 22 1
Cancer 5,391 217
Diabetes Mellitus 864 859
Alzheimer's Disease 886 49
Heart Disease 5,636 593
Primary Hypertension/HypertensiveRenal Disease/Secondary Hypertension
263 22
Cerebrovascular Disease 1,327 87
Atherosclerosis 384 2
Influenza and Pneumonia 540 31
Chronic Lower Respiratory Disease 1,816 101
Chronic Liver Disease and Cirrhosis 311 18
Nephritis, Nephrotic Syndrome, Nephrosis 531 3
Accidents/Adverse Effects 1,573 71
Suicide 544 3Total for These Causes 20,088 2,057
Table E17. Diabetes Mellitus as an Underlying and ContributingCause of Death, Kansas, 2017

Chronic
Cerebro- Lower Chronic Liver All
Occupation of Heart Malignant vascular Unintentional Respiratory Athero- Disease and Peptic Hyper- Other
Decedent Total Disease Neoplasms Disease Injuries Diseases Suicide sclerosis Cirrhosis Homicide Ulcer tension Causes
Total 26,725 5,636 5,391 1,327 1,573 1,816 544 384 311 179 32 263 9,269
Management 3,238 777 725 179 166 193 56 37 28 7 3 26 1,041
Business and Financial Operations 734 141 167 41 27 47 15 15 10 1 1 7 262
Computer and Mathematical 192 32 61 5 14 8 9 1 2 2 0 1 57
Architecture and Engineering 446 88 103 27 25 23 7 7 6 2 0 3 155
Life, Physical, and Social Services 144 26 36 3 8 6 4 1 0 0 0 1 59
Community and Social Services 352 85 87 13 18 13 4 9 1 0 0 1 121
Legal 132 22 37 6 7 9 1 2 1 0 0 0 47
Education, Training, and Library 1,229 246 254 68 70 57 11 16 6 0 0 9 492
Arts, Design, Entertainment, Sports, and Media 303 55 69 18 13 20 9 1 6 2 1 3 106
Healthcare Practitioners and Technical 1,059 202 242 58 49 54 22 23 8 4 4 10 383
Healthcare Support 584 118 122 31 41 46 9 9 10 4 0 8 186
Protective Service 314 66 60 8 18 25 18 5 7 0 0 5 102
Food Preparation and Serving Related 658 128 111 35 40 56 16 6 9 10 2 11 234
Building and Grounds Cleaning and Maintenance 649 139 125 28 40 65 8 8 14 7 1 4 210
Personal Care and Service 465 89 87 25 34 30 6 8 3 5 1 3 174
Sales and Related 2,016 440 427 104 105 143 34 32 19 6 2 16 688
Office and Admin. Support 2,518 504 514 140 116 184 15 44 25 9 1 31 935
Farming, Forestry, and Fishing 81 21 14 1 7 8 4 0 1 0 0 0 25
Construction and Extraction 1,572 322 404 55 110 126 49 14 44 31 1 13 403
Installation, Repair, and Maintenance 819 186 176 25 61 66 28 7 14 9 1 9 237
Production 1,826 422 390 86 104 142 39 29 25 3 3 19 564
Transportation and Material Moving 1,749 363 412 70 113 152 50 18 25 20 3 16 507
Housewives, Students, Children,
Volunteers, and None§ 3,383 701 443 204 171 212 41 69 23 19 4 46 1,450
n.s. 2,262 463 325 97 216 131 89 23 24 38 4 21 831
*Due to changes in the coding of occupation, use caution when comparing prior years.
† The ICD-10 codes associated with each category are listed in Appendix 4.
§ This category includes those who were never employed.
Selected Causes of Death †
Table E18Deaths by Occupation of Decedent* by
Selected Causes of DeathKansas, 2017
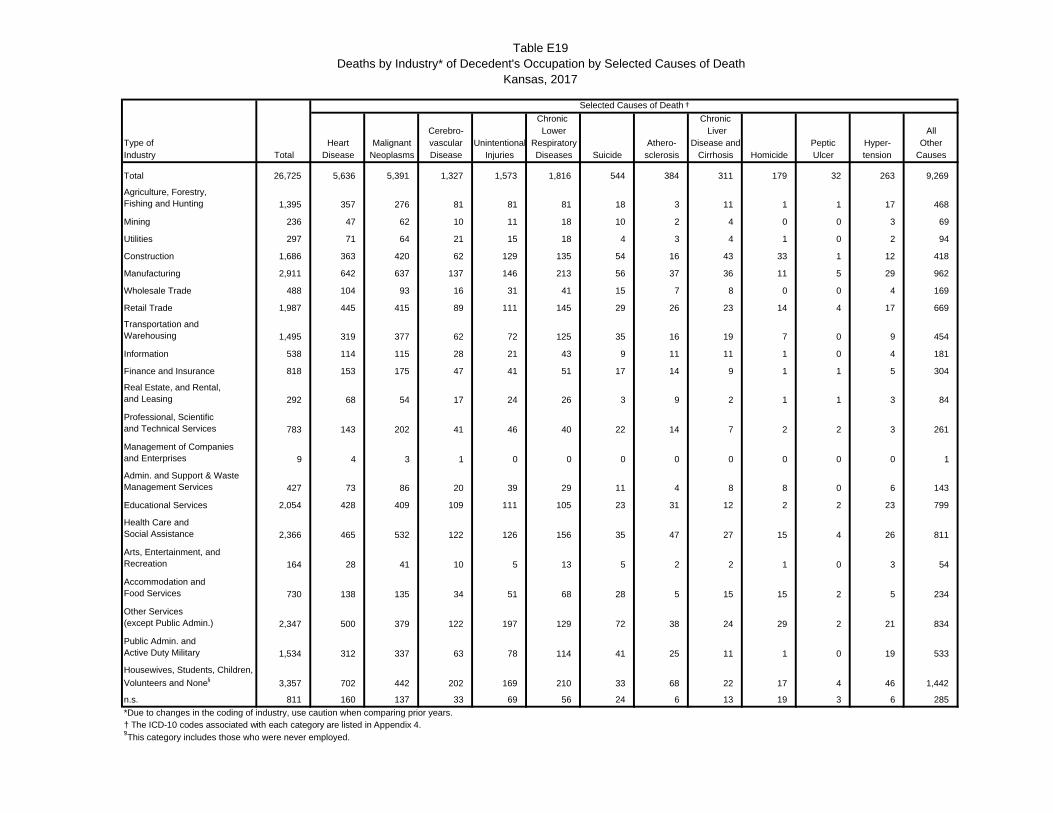
Chronic ChronicCerebro- Lower Liver All
Type of Heart Malignant vascular Unintentional Respiratory Athero- Disease and Peptic Hyper- OtherIndustry Total Disease Neoplasms Disease Injuries Diseases Suicide sclerosis Cirrhosis Homicide Ulcer tension Causes
Total 26,725 5,636 5,391 1,327 1,573 1,816 544 384 311 179 32 263 9,269
Agriculture, Forestry, Fishing and Hunting 1,395 357 276 81 81 81 18 3 11 1 1 17 468
Mining 236 47 62 10 11 18 10 2 4 0 0 3 69
Utilities 297 71 64 21 15 18 4 3 4 1 0 2 94
Construction 1,686 363 420 62 129 135 54 16 43 33 1 12 418
Manufacturing 2,911 642 637 137 146 213 56 37 36 11 5 29 962
Wholesale Trade 488 104 93 16 31 41 15 7 8 0 0 4 169
Retail Trade 1,987 445 415 89 111 145 29 26 23 14 4 17 669
Transportation andWarehousing 1,495 319 377 62 72 125 35 16 19 7 0 9 454
Information 538 114 115 28 21 43 9 11 11 1 0 4 181
Finance and Insurance 818 153 175 47 41 51 17 14 9 1 1 5 304
Real Estate, and Rental, and Leasing 292 68 54 17 24 26 3 9 2 1 1 3 84
Professional, Scientificand Technical Services 783 143 202 41 46 40 22 14 7 2 2 3 261
Management of Companiesand Enterprises 9 4 3 1 0 0 0 0 0 0 0 0 1
Admin. and Support & Waste Management Services 427 73 86 20 39 29 11 4 8 8 0 6 143
Educational Services 2,054 428 409 109 111 105 23 31 12 2 2 23 799
Health Care and Social Assistance 2,366 465 532 122 126 156 35 47 27 15 4 26 811
Arts, Entertainment, andRecreation 164 28 41 10 5 13 5 2 2 1 0 3 54
Accommodation and Food Services 730 138 135 34 51 68 28 5 15 15 2 5 234
Other Services (except Public Admin.) 2,347 500 379 122 197 129 72 38 24 29 2 21 834
Public Admin. and Active Duty Military 1,534 312 337 63 78 114 41 25 11 1 0 19 533
Housewives, Students, Children,
Volunteers and None§ 3,357 702 442 202 169 210 33 68 22 17 4 46 1,442
n.s. 811 160 137 33 69 56 24 6 13 19 3 6 285
*Due to changes in the coding of industry, use caution when comparing prior years.† The ICD-10 codes associated with each category are listed in Appendix 4.§This category includes those who were never employed.
Table E19Deaths by Industry* of Decedent's Occupation by Selected Causes of Death
Kansas, 2017
Selected Causes of Death †

Percent Rate†
Number of Total Years Years Lost Years Lost
CAUSE OF DEATH * Deaths Life Lost By Cause By Cause
Total Deaths 26,725 196,255 100.0 67.4
Heart Disease 5,636 25,245 12.9 8.7
Cancer 5,391 37,642 19.2 12.9
Chronic Lower Respiratory Dis. 1,816 6,958 3.5 2.4
Unintentional Injuries 1,573 30,129 15.4 10.3
Cerebrovascular Disease 1,327 4,474 2.3 1.5
Alzheimer's Disease 886 364 0.2 0.1
Diabetes 864 6,225 3.2 2.1
Suicide 544 17,273 8.8 5.9
Pneumonia and Influenza 540 1,630 0.8 0.6
Nephritis and Nephrotic Syndrome 531 2,210 1.1 0.8
Atherosclerosis 384 714 0.4 0.2
Chronic Liver Disease and Cirrhosis 311 4,881 2.5 1.7
Homicide 179 7,149 3.6 2.5
All Other Causes 6,743 51,361 26.2 17.6
Male Deaths 13,576 121,651 100.0 83.8
Heart Disease 2,962 17,158 14.1 11.8
Cancer 2,936 19,996 16.4 13.8
Unintentional Injuries 913 20,568 16.9 14.2
Chronic Lower Respiratory Dis. 896 3,352 2.8 2.3
Cerebrovascular Disease 539 2,399 2.0 1.7
Diabetes 476 3,657 3.0 2.5
Suicide 426 13,245 10.9 9.1
Alzheimer's Disease 278 127 0.1 0.1
Nephritis and Nephrotic Syndrome 267 1,190 1.0 0.8
Pneumonia and Influenza 243 921 0.8 0.6
Chronic Liver Disease and Cirrhosis 207 3,494 2.9 2.4
Atherosclerosis 156 427 0.4 0.3
Homicide 141 5,545 4.6 3.8
All Other Causes 3,136 29,572 24.3 20.4
Female Deaths 13,149 74,604 100.0 51.1
Heart Disease 2,674 8,087 10.8 5.5
Cancer 2,455 17,646 23.7 12.1
Chronic Lower Respiratory Dis. 920 3,606 4.8 2.5
Cerebrovascular Disease 788 2,075 2.8 1.4
Unintentional Injuries 660 9,561 12.8 6.5
Alzheimer's Disease 608 237 0.3 0.2
Diabetes 388 2,568 3.4 1.8
Pneumonia and Influenza 297 709 1.0 0.5
Nephritis and Nephrotic Syndrome 264 1,020 1.4 0.7
Atherosclerosis 228 287 0.4 0.2
Suicide 118 4,028 5.4 2.8
Chronic Liver Disease and Cirrhosis 104 1,387 1.9 0.9
Homicide 38 1,604 2.2 1.1
All Other Causes 3,607 21,789 29.2 14.9
* The ICD-10 codes associated with each category are listed in Appendix 4.†Rate per 1,000 population.
Table E20Selected Causes of Death and Years of Potential Life Lost (YPLL)
Before Age 75Kansas, 2017
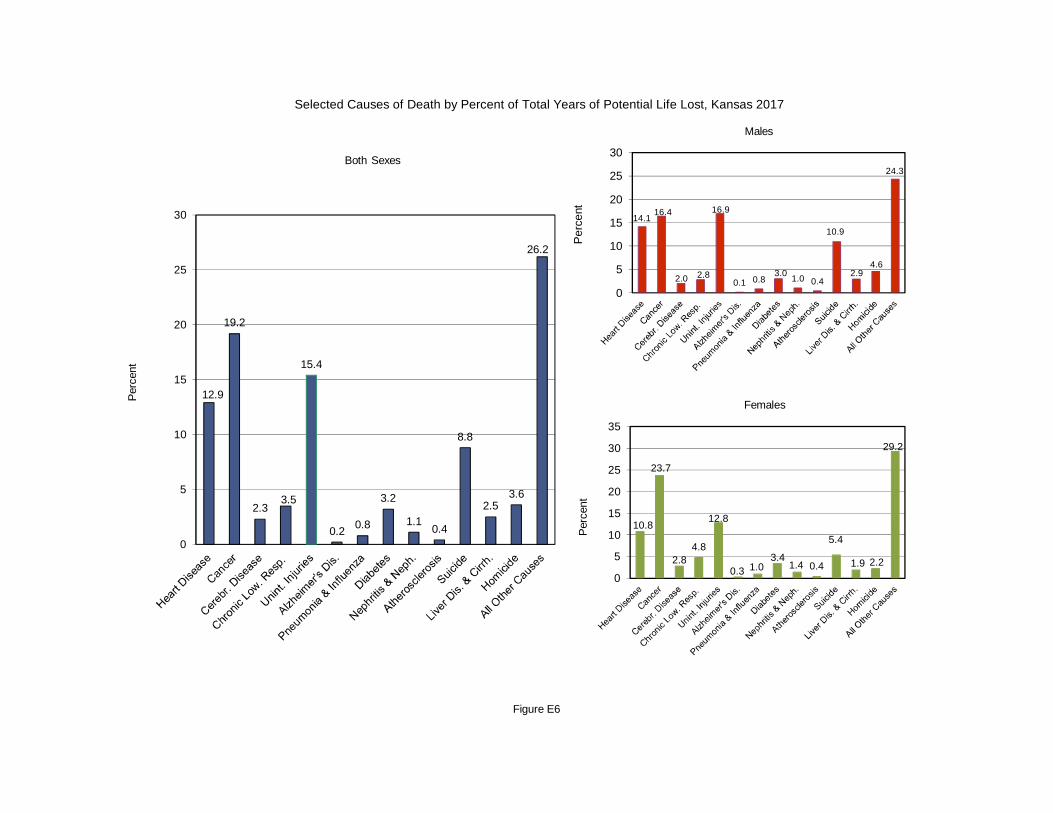
Figure E6
Selected Causes of Death by Percent of Total Years of Potential Life Lost, Kansas 2017
12.9
19.2
2.33.5
15.4
0.20.8
3.2
1.10.4
8.8
2.53.6
26.2
0
5
10
15
20
25
30
Per
cent
Both Sexes
14.116.4
2.0 2.8
16.9
0.1 0.83.0
1.0 0.4
10.9
2.94.6
24.3
0
5
10
15
20
25
30
Per
cent
Males
10.8
23.7
2.84.8
12.8
0.3 1.03.4
1.4 0.4
5.4
1.9 2.2
29.2
0
5
10
15
20
25
30
35
Per
cent
Females

Cause of Death * and Sex Yes + Probably Total
of Decedent Total Yes Probably as % of Known No Known Unknown
All Causes 26,725 2,993 1,722 25.3 13,946 18,661 8,064
Male 13,576 1,782 1,093 31.5 6,257 9,132 4,444
Female 13,149 1,211 629 19.3 7,689 9,529 3,620
Tuberculosis 1 1 0 100.0 0 1 0
Male 1 1 0 100.0 0 1 0
Female 0 0 0 0 0 0
Syphilis 1 0 0 0 0 1
Male 1 0 0 0 0 1
Female 0 0 0 0 0 0
HIV/AIDS 22 1 1 12.5 14 16 6
Male 19 1 1 14.3 12 14 5
Female 3 0 0 0.0 2 2 1
Cancer of Stomach 69 7 7 26.9 38 52 17
Male 45 5 6 33.3 22 33 12
Female 24 2 1 15.8 16 19 5
Cancer of Colon, Rectum & Anus 507 23 23 13.4 297 343 164
Male 285 15 15 15.7 161 191 94
Female 222 8 8 10.5 136 152 70
Cancer of Pancreas 363 19 25 17.7 205 249 114
Male 181 11 13 20.2 95 119 62
Female 182 8 12 15.4 110 130 52
Cancer of Trachea, Bronchus & Lung 1,367 634 268 86.1 146 1,048 319
Male 753 366 151 89.9 58 575 178
Female 614 268 117 81.4 88 473 141
Cancer of Breast 342 12 10 9.0 223 245 97
Male 8 1 2 50.0 3 6 2
Female 334 11 8 7.9 220 239 95
Cancer of Cervix, Corpus & Ovary 259 5 5 5.4 176 186 73
Male 0 0 0 0 0 0
Female 259 5 5 5.4 176 186 73
Cancer of Prostate 271 9 12 11.2 166 187 84
Male 271 9 12 11.2 166 187 84
Female 0 0 0 0 0 0
Table E21Deaths from 39 Selected Causes by Number and Percent and Sex of Decedent
Related to TobaccoKansas, 2017
Did Tobacco Use Contribute to This Death?

Cause of Death * and Sex Yes + Probably Total
of Decedent Total Yes Probably as % of Known No Known Unknown
Table E21Deaths from 39 Selected Causes by Number and Percent and Sex of Decedent
Related to TobaccoKansas, 2017
Did Tobacco Use Contribute to This Death?
Cancer of Urinary Tract 299 29 39 33.3 136 204 95
Male 207 20 30 36.0 89 139 68
Female 92 9 9 27.7 47 65 27
Non-Hodgkin's Lymphoma 174 6 7 10.4 112 125 49
Male 101 6 5 15.7 59 70 31
Female 73 0 2 3.6 53 55 18
Leukemia 234 9 7 8.7 167 183 51
Male 142 3 6 8.2 101 110 32
Female 92 6 1 9.6 66 73 19
Other Malignant Neoplasms 1,506 150 114 25.1 788 1,052 454
Male 943 119 91 32.5 436 646 297
Female 563 31 23 13.3 352 406 157
Diabetes mellitus 864 98 78 28.9 434 610 254
Male 476 75 51 39.0 197 323 153
Female 388 23 27 17.4 237 287 101
Alzheimer's Disease 886 6 12 2.5 697 715 171
Male 278 2 9 5.2 200 211 67
Female 608 4 3 1.4 497 504 104
Hypertensive Heart Disease 376 30 24 23.3 178 232 144
Male 156 21 14 41.2 50 85 71
Female 220 9 10 12.9 128 147 73
Ischemic Heart Disease 3,299 401 236 33.2 1,279 1,916 1,383
Male 1,977 279 174 42.2 620 1,073 904
Female 1,322 122 62 21.8 659 843 479
Other Heart Disease 1,961 119 88 16.2 1,071 1,278 683
Male 829 67 54 25.1 362 483 346
Female 1,132 52 34 10.8 709 795 337
Prim. Hypertension/ Hypertensive Renal Dis. & Sec. Hypertension 263 24 14 20.8 145 183 80
Male 117 12 11 29.5 55 78 39
Female 146 12 3 14.3 90 105 41
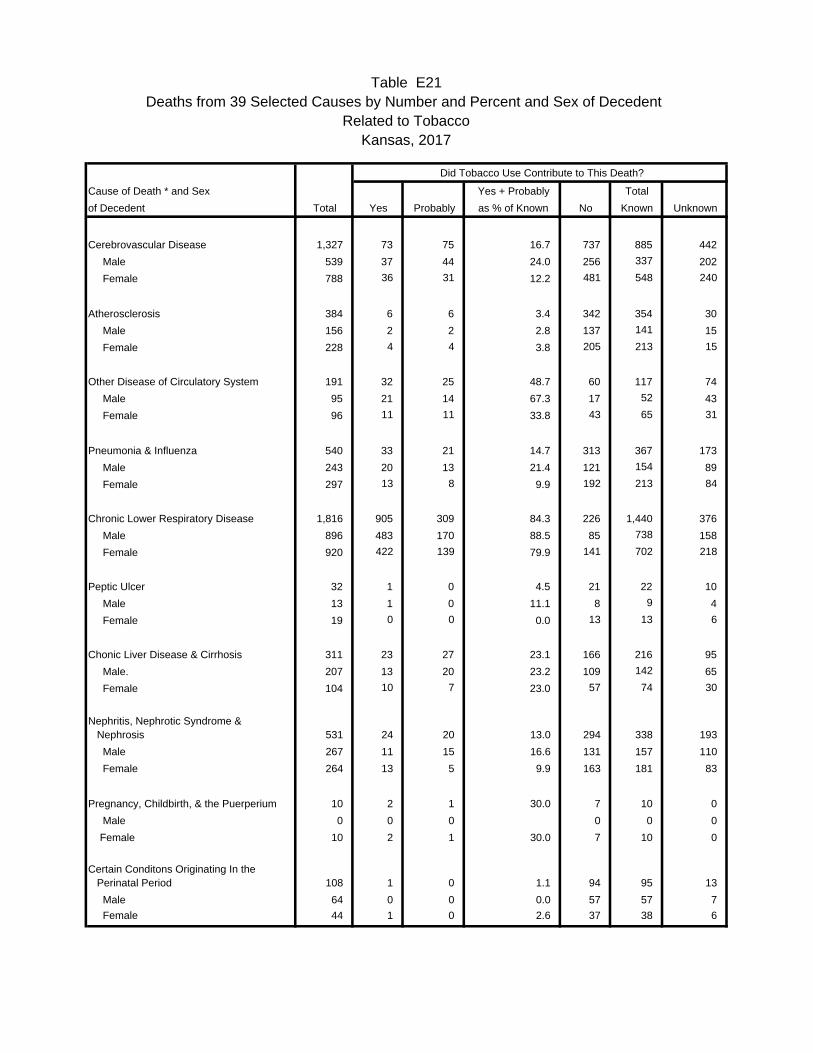
Cause of Death * and Sex Yes + Probably Total
of Decedent Total Yes Probably as % of Known No Known Unknown
Table E21Deaths from 39 Selected Causes by Number and Percent and Sex of Decedent
Related to TobaccoKansas, 2017
Did Tobacco Use Contribute to This Death?
Cerebrovascular Disease 1,327 73 75 16.7 737 885 442
Male 539 37 44 24.0 256 337 202
Female 788 36 31 12.2 481 548 240
Atherosclerosis 384 6 6 3.4 342 354 30
Male 156 2 2 2.8 137 141 15
Female 228 4 4 3.8 205 213 15
Other Disease of Circulatory System 191 32 25 48.7 60 117 74
Male 95 21 14 67.3 17 52 43
Female 96 11 11 33.8 43 65 31
Pneumonia & Influenza 540 33 21 14.7 313 367 173
Male 243 20 13 21.4 121 154 89
Female 297 13 8 9.9 192 213 84
Chronic Lower Respiratory Disease 1,816 905 309 84.3 226 1,440 376
Male 896 483 170 88.5 85 738 158
Female 920 422 139 79.9 141 702 218
Peptic Ulcer 32 1 0 4.5 21 22 10
Male 13 1 0 11.1 8 9 4
Female 19 0 0 0.0 13 13 6
Chonic Liver Disease & Cirrhosis 311 23 27 23.1 166 216 95
Male. 207 13 20 23.2 109 142 65
Female 104 10 7 23.0 57 74 30
Nephritis, Nephrotic Syndrome & Nephrosis 531 24 20 13.0 294 338 193
Male 267 11 15 16.6 131 157 110
Female 264 13 5 9.9 163 181 83
Pregnancy, Childbirth, & the Puerperium 10 2 1 30.0 7 10 0
Male 0 0 0 0 0 0
Female 10 2 1 30.0 7 10 0
Certain Conditons Originating In the Perinatal Period 108 1 0 1.1 94 95 13
Male 64 0 0 0.0 57 57 7
Female 44 1 0 2.6 37 38 6

Cause of Death * and Sex Yes + Probably Total
of Decedent Total Yes Probably as % of Known No Known Unknown
Table E21Deaths from 39 Selected Causes by Number and Percent and Sex of Decedent
Related to TobaccoKansas, 2017
Did Tobacco Use Contribute to This Death?
Congenital Anomalies 102 1 1 2.2 88 90 12
Male 48 1 0 2.4 40 41 7
Female 54 0 1 2.0 48 49 5
Sudden Infant Death Syndrome 13 0 0 0.0 9 9 4
Male 10 0 0 0.0 7 7 3
Female 3 0 0 0.0 2 2 1
Symptoms and Abnormal Findings 459 5 7 4.6 247 259 200
Male 251 4 5 8.0 103 112 139
Female 208 1 2 2.0 144 147 61
All Other Diseases 5,505 257 241 12.6 3,444 3,942 1,563
Male 2,497 146 153 17.6 1,399 1,698 799
Female 3,008 111 88 8.9 2,045 2,244 764
Motor Vehicle Accidents 447 2 0 0.5 362 364 83
Male 317 0 0 0.0 254 254 63
Female 130 2 0 1.8 108 110 20
All Other Accidents and Adverse Effects 1,126 39 17 8.2 623 679 447
Male 596 24 10 9.1 340 374 222
Female 530 15 7 7.2 283 305 225
Suicide 544 3 2 1.1 457 462 82
Male 426 3 2 1.4 365 370 56
Female 118 0 0 0.0 92 92 26
Homicide 179 2 0 1.2 167 169 10
Male 141 2 0 1.5 133 135 6
Female 38 0 0 0.0 34 34 4
All Other External Causes 36 1 0 5.6 17 18 18
Male 20 1 0 10.0 9 10 10
Female 16 0 0 0.0 8 8 8
* The ICD-10 codes associated with each category are listed in Appendix 4.

Cause of Death * and Sex Under 85 &
of Decedent Total 1 1-4 5-14 15-24 25-34 35-44 45-54 55-64 65-74 75-84 Over n.s.
All Causes 26,725 217 42 64 313 476 653 1,375 3,443 4,780 6,296 9,065 1
Male 13,576 127 26 34 226 325 406 826 2,060 2,799 3,276 3,470 1
Female 13,149 90 16 30 87 151 247 549 1,383 1,981 3,020 5,595 0
Tuberculosis 1 0 0 0 0 0 0 1 0 0 0 0 0
Male 1 0 0 0 0 0 0 1 0 0 0 0 0
Female 0 0 0 0 0 0 0 0 0 0 0 0 0
Syphilis 1 0 0 0 0 0 0 0 1 0 0 0 0
Male 1 0 0 0 0 0 0 0 1 0 0 0 0
Female 0 0 0 0 0 0 0 0 0 0 0 0 0
HIV/AIDS 22 0 0 0 1 1 1 9 3 5 2 0 0
Male 19 0 0 0 1 1 0 7 3 5 2 0 0
Female 3 0 0 0 0 0 1 2 0 0 0 0 0
Cancer of Stomach 69 0 0 0 0 1 1 8 15 15 21 8 0
Male 45 0 0 0 0 0 1 4 10 11 14 5 0
Female 24 0 0 0 0 1 0 4 5 4 7 3 0
Cancer of Colon, Rectum & Anus 507 0 0 0 0 3 11 41 87 131 133 101 0
Male 285 0 0 0 0 1 5 23 53 85 76 42 0
Female 222 0 0 0 0 2 6 18 34 46 57 59 0
Cancer of Pancreas 363 0 0 0 0 0 5 13 81 98 99 67 0
Male 181 0 0 0 0 0 2 4 47 57 51 20 0
Female 182 0 0 0 0 0 3 9 34 41 48 47 0
Cancer of Trachea, Bronchus & Lung 1,367 0 0 0 0 1 7 56 280 452 401 170 0
Male 753 0 0 0 0 1 2 29 148 255 223 95 0
Female 614 0 0 0 0 0 5 27 132 197 178 75 0
Cancer of Breast 342 0 0 0 0 2 12 36 79 79 77 57 0
Male 8 0 0 0 0 0 0 0 1 4 3 0 0
Female 334 0 0 0 0 2 12 36 78 75 74 57 0
Cancer of Cervix, Corpus & Ovary 259 0 0 0 1 0 12 18 57 79 48 44 0
Male 0 0 0 0 0 0 0 0 0 0 0 0 0
Female 259 0 0 0 1 0 12 18 57 79 48 44 0
Cancer of Prostate 271 0 0 0 0 0 0 1 25 60 96 88 1
Male 271 0 0 0 0 0 0 1 25 60 96 88 1
Female 0 0 0 0 0 0 0 0 0 0 0 0 0
by Sex by Age-Group of DecedentKansas, 2017
Deaths from 39 Selected Causes Table E22
Age-Group
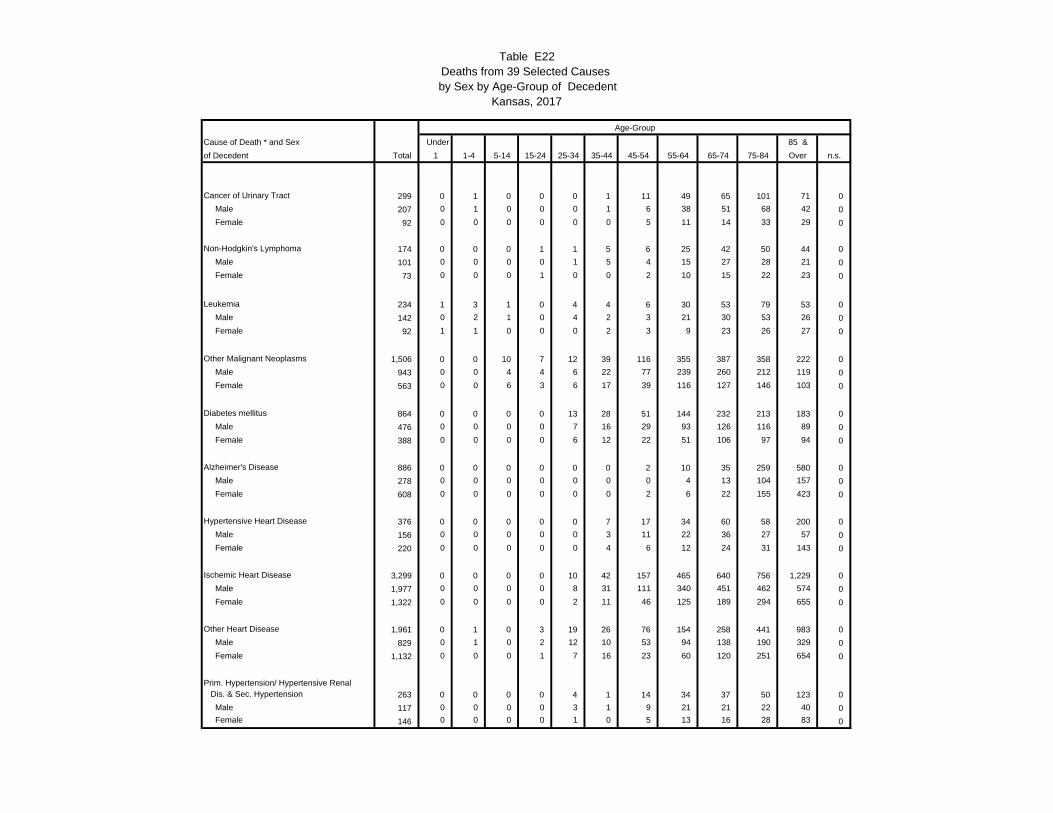
Cause of Death * and Sex Under 85 &
of Decedent Total 1 1-4 5-14 15-24 25-34 35-44 45-54 55-64 65-74 75-84 Over n.s.
by Sex by Age-Group of DecedentKansas, 2017
Deaths from 39 Selected Causes Table E22
Age-Group
Cancer of Urinary Tract 299 0 1 0 0 0 1 11 49 65 101 71 0
Male 207 0 1 0 0 0 1 6 38 51 68 42 0
Female 92 0 0 0 0 0 0 5 11 14 33 29 0
Non-Hodgkin's Lymphoma 174 0 0 0 1 1 5 6 25 42 50 44 0
Male 101 0 0 0 0 1 5 4 15 27 28 21 0
Female 73 0 0 0 1 0 0 2 10 15 22 23 0
Leukemia 234 1 3 1 0 4 4 6 30 53 79 53 0
Male 142 0 2 1 0 4 2 3 21 30 53 26 0
Female 92 1 1 0 0 0 2 3 9 23 26 27 0
Other Malignant Neoplasms 1,506 0 0 10 7 12 39 116 355 387 358 222 0
Male 943 0 0 4 4 6 22 77 239 260 212 119 0
Female 563 0 0 6 3 6 17 39 116 127 146 103 0
Diabetes mellitus 864 0 0 0 0 13 28 51 144 232 213 183 0
Male 476 0 0 0 0 7 16 29 93 126 116 89 0
Female 388 0 0 0 0 6 12 22 51 106 97 94 0
Alzheimer's Disease 886 0 0 0 0 0 0 2 10 35 259 580 0
Male 278 0 0 0 0 0 0 0 4 13 104 157 0
Female 608 0 0 0 0 0 0 2 6 22 155 423 0
Hypertensive Heart Disease 376 0 0 0 0 0 7 17 34 60 58 200 0
Male 156 0 0 0 0 0 3 11 22 36 27 57 0
Female 220 0 0 0 0 0 4 6 12 24 31 143 0
Ischemic Heart Disease 3,299 0 0 0 0 10 42 157 465 640 756 1,229 0
Male 1,977 0 0 0 0 8 31 111 340 451 462 574 0
Female 1,322 0 0 0 0 2 11 46 125 189 294 655 0
Other Heart Disease 1,961 0 1 0 3 19 26 76 154 258 441 983 0
Male 829 0 1 0 2 12 10 53 94 138 190 329 0
Female 1,132 0 0 0 1 7 16 23 60 120 251 654 0
Prim. Hypertension/ Hypertensive Renal Dis. & Sec. Hypertension 263 0 0 0 0 4 1 14 34 37 50 123 0
Male 117 0 0 0 0 3 1 9 21 21 22 40 0
Female 146 0 0 0 0 1 0 5 13 16 28 83 0

Cause of Death * and Sex Under 85 &
of Decedent Total 1 1-4 5-14 15-24 25-34 35-44 45-54 55-64 65-74 75-84 Over n.s.
by Sex by Age-Group of DecedentKansas, 2017
Deaths from 39 Selected Causes Table E22
Age-Group
Cerebrovascular Disease 1,327 1 0 3 3 3 14 41 99 176 360 627 0
Male 539 1 0 3 2 1 8 19 52 90 161 202 0
Female 788 0 0 0 1 2 6 22 47 86 199 425 0
Atherosclerosis 384 0 0 0 0 0 0 5 25 39 107 208 0
Male 156 0 0 0 0 0 0 4 14 22 41 75 0
Female 228 0 0 0 0 0 0 1 11 17 66 133 0
Other Disease of Circulatory System 191 0 0 0 1 1 0 2 26 48 47 66 0
Male 95 0 0 0 1 1 0 2 17 33 22 19 0
Female 96 0 0 0 0 0 0 0 9 15 25 47 0
Pneumonia & Influenza 540 0 1 0 1 3 7 12 32 67 129 288 0
Male 243 0 1 0 1 1 5 5 20 29 72 109 0
Female 297 0 0 0 0 2 2 7 12 38 57 179 0
Chronic Lower Respiratory Disease 1,816 0 0 2 1 5 7 44 208 458 574 517 0
Male 896 0 0 1 1 3 5 13 95 244 306 228 0
Female 920 0 0 1 0 2 2 31 113 214 268 289 0
Peptic Ulcer 32 0 0 0 0 0 0 1 4 6 6 15 0
Male 13 0 0 0 0 0 0 0 3 1 4 5 0
Female 19 0 0 0 0 0 0 1 1 5 2 10 0
Chonic Liver Disease & Cirrhosis 311 0 0 0 0 8 26 63 106 63 32 13 0
Male 207 0 0 0 0 7 18 47 69 45 17 4 0
Female 104 0 0 0 0 1 8 16 37 18 15 9 0
Nephritis, Nephrotic Syndrome & Nephrosis 531 0 0 0 0 3 6 15 69 91 141 206 0
Male 267 0 0 0 0 3 4 7 33 51 71 98 0
Female 264 0 0 0 0 0 2 8 36 40 70 108 0
Pregnancy, Childbirth, & the Puerperium 10 0 0 0 1 3 3 3 0 0 0 0 0
Male 0 0 0 0 0 0 0 0 0 0 0 0 0
Female 10 0 0 0 1 3 3 3 0 0 0 0 0
Certain Conditons Originating In the Perinatal Period 108 107 1 0 0 0 0 0 0 0 0 0 0
Male 64 63 1 0 0 0 0 0 0 0 0 0 0
Female 44 44 0 0 0 0 0 0 0 0 0 0 0

Cause of Death * and Sex Under 85 &
of Decedent Total 1 1-4 5-14 15-24 25-34 35-44 45-54 55-64 65-74 75-84 Over n.s.
by Sex by Age-Group of DecedentKansas, 2017
Deaths from 39 Selected Causes Table E22
Age-Group
Congenital Anomalies 102 53 2 4 3 4 3 6 12 9 3 3 0
Male 48 26 1 0 0 4 1 2 7 4 2 1 0
Female 54 27 1 4 3 0 2 4 5 5 1 2 0
Sudden Infant Death Syndrome 13 13 0 0 0 0 0 0 0 0 0 0 0
Male 10 10 0 0 0 0 0 0 0 0 0 0 0
Female 3 3 0 0 0 0 0 0 0 0 0 0 0
Symptoms and Abnormal Findings 459 16 5 3 10 18 27 33 53 65 71 158 0
Male 251 11 2 2 6 12 21 24 40 40 45 48 0
Female 208 5 3 1 4 6 6 9 13 25 26 110 0
All Other Diseases 5,505 9 5 14 20 54 83 228 578 816 1,356 2,342 0
Male 2,497 4 2 7 14 25 42 138 326 461 665 813 0
Female 3,008 5 3 7 6 29 41 90 252 355 691 1,529 0
Motor Vehicle Accidents 447 0 6 12 77 74 62 54 67 34 41 20 0
Male 317 0 6 8 55 52 46 46 46 24 21 13 0
Female 130 0 0 4 22 22 16 8 21 10 20 7 0
All Other Accidents and Adverse Effects 1,126 14 8 9 40 72 95 108 132 125 163 360 0
Male 596 9 5 3 31 51 62 57 82 79 82 135 0
Female 530 5 3 6 9 21 33 51 50 46 81 225 0
Suicide 544 0 0 6 93 101 91 91 75 48 23 16 0
Male 426 0 0 5 68 78 73 68 61 41 19 13 0
Female 118 0 0 1 25 23 18 23 14 7 4 3 0
Homicide 179 2 6 0 47 46 26 21 23 5 1 2 0
Male 141 2 2 0 38 37 19 18 18 4 1 2 0
Female 38 0 4 0 9 9 7 3 5 1 0 0 0
All Other External Causes 36 1 3 0 3 10 1 9 6 2 0 1 0
Male 20 1 2 0 2 6 1 4 2 1 0 1 0
Female 16 0 1 0 1 4 0 5 4 1 0 0 0
* The ICD-10 codes associated with each category are listed in Appendix 4.

Age Age Age Age Age Age
County of Crude Adj. Crude Adj. Crude Adj. Crude Adj. Crude Adj. Crude Adj.
Residence Number Rate Rate Number Rate Rate Number Rate Rate Number Rate Rate Number Rate Rate Rate Rate
Kansas 25,347 875.9 755.6 25,731 886.0 757.4 26,611 914.0 772.5 26,129 898.7 753.5 26,725 917.4 761.3 898.4 760.1
Allen 199 1,516.3 1,032.1 179 1,386.6 909.4 174 1,368.2 877.7 155 1,219.1 801.5 164 1,310.0 855.7 1,361.3 897.5Anderson 93 1,177.7 775.6 79 1,002.2 665.7 95 1,216.7 766.0 111 1,418.2 844.4 115 1,468.1 918.3 1,256.1 796.7Atchison 170 1,015.0 808.9 183 1,108.2 870.4 197 1,201.4 936.3 191 1,166.1 936.3 161 985.8 759.5 1,095.0 862.4Barber 61 1,233.1 887.6 66 1,347.8 870.7 70 1,451.4 929.2 51 1,087.9 674.6 70 1,526.4 1,007.5 1,328.3 874.5Barton 261 948.8 696.7 287 1,048.0 743.6 298 1,099.5 788.5 294 1,098.0 772.4 293 1,106.7 742.0 1,059.5 748.4
Bourbon 196 1,319.7 945.8 192 1,299.8 910.6 210 1,427.4 987.9 190 1,299.9 877.0 218 1,477.6 1,031.1 1,364.9 951.1Brown 136 1,360.4 926.9 117 1,192.1 808.4 97 992.2 663.5 111 1,146.2 770.5 139 1,441.8 966.4 1,226.7 826.3Butler 634 963.5 846.8 606 915.0 796.1 642 961.9 833.4 639 953.4 818.5 635 949.5 817.5 948.7 823.0Chase 34 1,259.3 794.6 41 1,523.0 981.5 28 1,045.2 602.8 44 1,648.6 944.6 29 1,080.9 626.0 1,311.2 788.2Chautauqua 60 1,689.2 906.0 49 1,407.6 817.8 55 1,616.7 945.0 59 1,748.7 1,102.6 50 1,486.8 804.9 1,589.8 909.7
Cherokee 247 1,177.4 905.3 269 1,294.1 1,013.3 244 1,188.3 900.3 248 1,224.9 919.5 274 1,362.2 998.6 1,248.8 946.7Cheyenne 31 1,150.7 550.9 33 1,225.4 583.1 37 1,381.1 633.9 37 1,390.5 607.6 31 1,155.4 579.2 1,260.3 587.2Clark 29 1,322.4 681.1 38 1,772.4 1,005.9 37 1,765.3 987.6 29 1,399.6 886.9 31 1,546.9 1,008.6 1,560.6 909.9Clay 115 1,368.1 769.4 110 1,322.6 781.0 112 1,341.8 780.1 103 1,264.9 744.3 85 1,068.1 583.9 1,275.2 733.5Cloud 121 1,302.2 774.8 133 1,417.2 852.6 150 1,627.1 920.0 145 1,584.7 897.0 132 1,468.1 878.3 1,479.2 864.5
Coffey 109 1,295.8 870.4 78 924.9 652.6 105 1,252.4 845.4 96 1,138.4 743.5 93 1,130.8 762.9 1,148.4 774.2Comanche 34 1,739.1 1,012.3 39 1,995.9 1,285.8 36 1,953.3 1,194.4 28 1,503.8 941.6 29 1,620.1 977.0 1,765.2 1,075.2Cowley 440 1,215.3 945.0 434 1,206.8 894.1 464 1,296.5 956.1 434 1,213.9 907.7 405 1,145.3 858.9 1,215.7 912.9Crawford 383 975.1 819.2 422 1,074.1 898.5 437 1,114.3 916.4 427 1,090.3 920.3 421 1,078.5 912.4 1,066.4 893.7Decatur 39 1,331.1 563.6 37 1,272.4 502.3 41 1,398.4 577.9 46 1,624.3 723.3 49 1,698.4 804.0 1,463.4 632.1
Dickinson 224 1,142.3 766.4 219 1,129.2 736.2 259 1,341.8 863.6 241 1,264.2 798.0 235 1,243.3 789.1 1,223.6 791.0Doniphan 77 980.8 683.9 76 965.2 724.0 87 1,115.8 758.2 78 1,017.7 713.1 101 1,307.1 896.9 1,076.8 757.1Douglas 650 568.6 664.9 699 599.6 689.6 723 612.4 692.6 650 544.2 619.6 792 655.7 728.3 596.2 678.5Edwards 30 1,018.7 640.6 40 1,320.1 928.1 37 1,246.6 780.8 28 953.0 631.7 34 1,175.3 738.3 1,143.9 742.6Elk 45 1,694.9 954.1 37 1,373.4 725.9 45 1,727.4 916.7 38 1,492.0 911.5 46 1,841.5 975.9 1,623.2 883.9
Ellis 246 846.5 687.1 237 816.9 680.6 259 892.2 734.2 258 892.9 774.2 254 885.4 759.7 866.7 725.9Ellsworth 89 1,391.1 848.8 73 1,142.1 670.8 102 1,608.1 1,038.9 86 1,359.0 859.9 97 1,532.4 951.8 1,406.1 872.5Finney 217 584.9 752.0 199 535.2 651.5 229 617.0 731.6 210 571.9 667.3 218 587.9 666.5 579.4 692.0Ford 244 700.8 769.3 229 658.1 702.8 241 697.8 710.5 241 709.4 742.5 259 753.3 775.1 703.8 739.9Franklin 256 994.6 849.0 256 999.6 843.9 267 1,042.6 855.4 296 1,158.1 953.7 269 1,045.4 849.3 1,047.9 870.3
Geary 199 532.3 830.2 189 514.8 779.0 218 588.7 900.1 230 646.3 936.8 205 605.5 893.2 576.5 867.2Gove 50 1,805.7 985.9 40 1,466.8 805.9 37 1,401.5 768.7 38 1,467.7 787.2 29 1,102.2 544.1 1,452.5 782.9Graham 20 771.3 382.3 35 1,364.0 643.4 35 1,350.8 693.1 32 1,248.0 664.9 47 1,883.8 968.4 1,319.4 669.5Grant 40 503.1 565.6 54 690.9 795.3 53 685.4 726.5 51 667.0 719.1 62 823.8 816.2 672.3 724.6Gray 44 732.2 641.0 47 772.8 703.3 55 896.8 781.9 68 1,126.9 942.1 39 654.6 529.9 837.3 721.9
Greeley 16 1,240.3 865.3 16 1,229.8 938.0 25 1,879.7 1,063.2 15 1,157.4 710.1 15 1,201.0 575.0 1,345.5 813.1Greenwood 97 1,510.0 902.7 96 1,517.1 866.9 104 1,665.6 947.8 109 1,772.1 1,047.9 116 1,894.5 1,150.3 1,669.3 984.4Hamilton 26 996.6 946.0 23 883.6 971.0 31 1,253.0 1,297.7 19 749.2 822.6 25 947.0 958.4 964.1 990.9Harper 76 1,296.9 770.7 80 1,375.0 883.4 103 1,770.7 1,059.1 83 1,460.0 886.4 90 1,610.0 977.5 1,501.6 912.0Harvey 399 1,148.5 759.7 415 1,191.8 800.1 399 1,137.6 732.5 408 1,168.6 753.1 396 1,146.4 744.1 1,158.6 758.0
Haskell 31 748.6 763.9 26 633.2 618.4 30 738.2 723.9 29 723.9 742.9 30 740.2 652.6 716.7 693.6Hodgeman 20 1,025.6 568.5 20 1,043.8 530.1 22 1,162.2 808.5 22 1,176.5 594.7 21 1,140.1 648.9 1,108.6 627.7Jackson 125 935.2 710.6 123 908.5 682.7 158 1,184.6 883.9 129 970.6 767.5 162 1,216.4 928.8 1,042.6 794.0Jefferson 169 898.3 712.8 185 981.2 732.1 201 1,061.8 797.9 178 941.9 692.8 213 1,121.2 840.0 1,001.1 754.9Jewell 43 1,411.7 715.8 45 1,478.8 642.2 36 1,212.1 636.0 35 1,206.5 565.0 31 1,087.7 482.7 1,282.9 612.2
Johnson 3,714 655.1 629.3 3,649 635.4 599.0 3,858 665.0 620.4 3,735 639.1 586.0 3,980 673.2 618.5 653.6 610.4Kearny 50 1,274.5 1,089.1 31 791.8 649.2 35 884.7 789.9 35 893.5 803.0 25 631.3 531.9 894.7 773.8Kingman 99 1,262.1 725.3 104 1,351.0 778.9 95 1,235.9 785.6 102 1,366.0 806.9 91 1,236.4 699.4 1,290.2 760.7Kiowa 30 1,189.1 750.5 32 1,273.4 747.4 17 663.0 404.2 20 805.5 487.0 26 1,046.3 700.3 994.6 615.0Labette 260 1,243.1 908.9 273 1,302.5 930.2 254 1,221.0 866.6 285 1,394.1 979.1 258 1,280.7 903.3 1,287.9 918.2
Lane 17 988.4 553.3 24 1,422.6 771.6 30 1,796.4 1,068.1 32 1,956.0 1,112.6 30 1,924.3 1,010.7 1,607.8 901.3Leavenworth 564 721.4 733.7 556 705.6 701.3 612 771.6 753.9 655 816.7 785.9 609 751.0 718.6 753.5 739.5Lincoln 31 985.1 499.0 36 1,136.7 575.7 37 1,191.6 741.8 37 1,204.0 709.1 32 1,051.6 529.8 1,113.6 607.6Linn 114 1,198.0 880.9 105 1,105.0 752.1 104 1,090.6 772.6 119 1,245.0 844.4 107 1,100.1 761.7 1,147.6 801.6Logan 41 1,465.3 816.8 50 1,789.5 971.2 34 1,203.5 662.1 22 777.1 420.4 36 1,276.1 689.6 1,300.7 716.2
5-Year20152013
Table E23Deaths by County of Residence and Peer Group*
by Number, Crude† and Age-Adjusted Rate‡Kansas, 2013-2017
2014 2016
Year
2017

Age Age Age Age Age Age
County of Crude Adj. Crude Adj. Crude Adj. Crude Adj. Crude Adj. Crude Adj.
Residence Number Rate Rate Number Rate Rate Number Rate Rate Number Rate Rate Number Rate Rate Rate Rate
5-Year20152013
Table E23Deaths by County of Residence and Peer Group*
by Number, Crude† and Age-Adjusted Rate‡Kansas, 2013-2017
2014 2016
Year
2017
Lyon 295 880.3 803.1 273 822.0 731.0 300 899.8 789.6 252 752.0 646.9 300 898.4 758.2 850.5 746.1McPherson 380 1,285.1 784.3 411 1,405.6 821.2 380 1,313.0 787.3 351 1,218.6 729.9 389 1,355.0 848.6 1,315.5 794.3Marion 166 1,358.5 757.5 169 1,384.3 767.4 184 1,520.3 811.9 166 1,370.5 769.1 161 1,343.2 764.4 1,395.4 774.9Marshall 121 1,209.8 651.8 129 1,289.2 784.3 120 1,207.7 636.0 128 1,301.3 705.9 139 1,426.4 825.0 1,286.2 720.9Meade 55 1,266.4 757.6 42 964.0 669.3 48 1,108.5 709.3 52 1,233.4 856.8 60 1,394.4 912.8 1,192.6 780.0
Miami 253 770.5 657.1 309 941.4 781.1 321 986.1 815.3 303 919.2 755.9 335 1,001.2 776.1 923.9 757.4Mitchell 96 1,505.2 935.7 73 1,161.7 631.1 83 1,321.2 693.1 67 1,073.2 546.1 94 1,533.9 852.2 1,318.9 731.7Montgomery 400 1,166.5 824.1 424 1,244.7 910.5 458 1,374.8 974.5 459 1,401.7 994.2 459 1,409.9 966.7 1,317.0 933.2Morris 68 1,184.5 608.2 69 1,211.0 672.7 89 1,576.6 852.5 81 1,453.4 717.3 75 1,374.9 685.0 1,358.9 708.5Morton 42 1,336.3 952.5 37 1,189.7 875.8 40 1,330.2 931.5 31 1,088.5 738.4 32 1,167.9 664.5 1,225.8 838.7
Nemaha 134 1,318.8 728.1 130 1,281.0 714.7 117 1,144.0 578.7 120 1,171.8 676.9 138 1,363.9 777.6 1,255.5 695.4Neosho 197 1,199.0 840.2 215 1,309.7 915.5 190 1,162.4 803.6 202 1,251.1 826.5 194 1,211.4 810.3 1,226.8 839.6Ness 48 1,562.0 918.0 51 1,642.5 798.1 47 1,564.1 802.7 43 1,451.7 721.3 58 2,021.6 1,081.2 1,645.1 858.7Norton 61 1,085.0 737.0 63 1,133.1 699.8 62 1,117.1 649.1 81 1,474.6 947.3 59 1,084.4 678.2 1,178.3 741.0Osage 189 1,170.9 865.3 196 1,229.9 890.3 226 1,426.1 999.0 187 1,180.3 844.4 191 1,211.0 854.2 1,243.4 889.5
Osborne 65 1,702.5 857.3 62 1,650.7 919.9 79 2,145.0 1,082.9 66 1,812.2 916.1 63 1,745.2 1,019.1 1,809.9 956.0Ottawa 70 1,158.6 877.1 60 989.3 728.0 77 1,288.7 896.8 85 1,435.8 1,028.9 81 1,381.5 978.7 1,249.0 901.6Pawnee 72 1,032.9 686.2 94 1,359.2 924.3 77 1,126.1 773.9 81 1,201.2 757.4 95 1,422.2 868.9 1,227.0 802.0Phillips 74 1,335.7 918.4 75 1,355.5 824.3 70 1,289.6 723.8 64 1,179.1 672.6 74 1,378.0 777.3 1,307.7 783.7Pottawatomie 176 775.6 737.0 199 869.1 817.5 194 832.7 791.1 164 693.1 641.4 178 744.5 679.7 782.3 732.2
Pratt 135 1,366.7 922.9 110 1,116.8 724.3 119 1,227.9 821.5 126 1,314.7 887.2 105 1,099.8 712.1 1,225.5 812.0Rawlins 50 1,931.2 889.4 37 1,431.9 577.1 43 1,715.9 887.3 41 1,608.5 701.8 37 1,481.8 799.5 1,634.6 771.2Reno 772 1,202.7 822.9 762 1,194.5 829.1 743 1,166.1 807.3 722 1,142.0 786.1 769 1,230.2 828.7 1,187.0 814.8Republic 88 1,825.7 883.3 96 1,998.8 1,035.4 88 1,862.4 832.1 81 1,723.8 772.1 96 2,046.5 1,066.8 1,891.5 917.6Rice 129 1,288.6 918.9 130 1,298.1 954.5 122 1,222.8 890.0 114 1,159.6 844.6 131 1,356.1 919.7 1,264.8 904.8
Riley 313 415.2 609.6 324 430.9 610.9 339 450.5 622.4 378 515.4 701.7 370 498.8 652.6 461.8 639.8Rooks 62 1,194.6 699.8 73 1,416.1 916.2 63 1,217.6 785.3 66 1,300.2 740.3 67 1,328.6 800.1 1,291.1 788.5Rush 45 1,412.4 696.8 50 1,564.0 768.1 55 1,757.2 887.0 65 2,125.6 1,124.3 39 1,256.8 581.0 1,620.5 806.9Russell 84 1,211.6 616.0 90 1,293.8 708.7 85 1,207.6 709.4 81 1,159.1 653.8 95 1,373.8 792.3 1,248.9 696.1Saline 544 976.0 778.4 530 950.6 743.2 536 962.5 739.0 518 939.4 727.9 612 1,118.1 823.7 988.9 762.0
Scott 47 933.5 682.9 45 885.8 615.8 40 805.8 547.5 55 1,093.0 721.5 51 1,028.0 697.5 949.3 652.0Sedgwick 4,111 813.4 789.1 4,299 844.9 806.8 4,421 864.2 819.0 4,513 881.5 825.8 4,439 864.1 793.8 853.7 807.0Seward 121 517.3 665.4 143 609.4 785.9 128 552.9 677.0 136 598.9 735.3 114 514.5 634.8 558.9 700.3Shawnee 1,714 958.4 766.3 1,865 1,045.4 819.7 1,879 1,051.3 823.1 1,870 1,049.7 807.0 1,880 1,055.1 808.1 1,031.9 804.7Sheridan 23 900.9 579.5 37 1,457.3 919.7 32 1,273.9 612.8 30 1,195.7 575.5 23 910.2 519.8 1,147.2 645.1
Sherman 88 1,439.1 1,011.3 64 1,047.5 678.8 83 1,387.3 931.6 66 1,106.5 779.3 65 1,096.1 754.5 1,215.8 832.4Smith 68 1,834.9 862.9 76 2,016.4 916.2 52 1,403.9 716.8 70 1,927.3 851.5 56 1,526.7 655.3 1,742.5 800.4Stafford 54 1,238.8 772.5 60 1,396.3 831.4 66 1,558.1 924.8 40 950.6 609.1 68 1,616.4 1,034.2 1,351.7 833.4Stanton 12 546.9 407.5 25 1,184.3 809.9 17 820.5 543.6 22 1,066.9 743.9 21 1,019.4 766.9 923.9 656.4Stevens 45 773.7 658.9 58 999.8 848.1 53 912.8 780.6 45 805.9 695.4 52 926.6 729.5 884.0 742.7
Sumner 257 1,089.4 808.0 251 1,066.8 781.1 264 1,121.7 831.3 246 1,057.1 766.3 268 1,157.2 806.5 1,098.3 799.6Thomas 81 1,019.1 721.0 75 950.4 724.7 87 1,100.7 821.4 69 874.3 624.3 67 860.3 609.4 961.4 700.5Trego 40 1,342.3 670.2 52 1,791.9 997.2 50 1,708.2 888.1 55 1,915.0 989.3 42 1,456.3 835.5 1,640.9 867.6Wabaunsee 73 1,035.3 773.8 58 826.0 630.2 68 978.3 746.8 68 986.8 720.6 50 727.4 512.6 911.2 674.0Wallace. 19 1,211.0 803.9 21 1,394.4 694.6 22 1,449.3 625.3 16 1,068.8 487.0 13 853.0 517.7 1,195.2 626.2
Washington 73 1,296.9 734.1 60 1,071.8 543.2 79 1,411.2 737.3 75 1,352.3 720.8 70 1,276.2 629.9 1,281.6 672.6Wichita 29 1,323.0 824.0 23 1,057.0 734.7 25 1,159.0 691.4 22 1,041.7 668.5 23 1,082.4 705.8 1,133.6 721.3Wilson 131 1,438.8 987.8 127 1,406.7 960.3 116 1,309.8 905.4 102 1,169.3 769.3 117 1,348.7 946.1 1,336.0 914.0Woodson 65 2,018.0 1,177.8 45 1,425.4 794.5 53 1,701.4 975.5 52 1,643.0 976.2 42 1,334.6 711.4 1,626.1 929.3Wyandotte 1,367 852.3 907.9 1,352 836.4 896.5 1,358 831.2 886.0 1,348 822.8 875.4 1,362 824.0 850.4 833.3 882.5
n.s. 0 n/a n/a 1 n/a n/a 2 n/a n/a 2 n/a n/a 2 n/a n/a n/a n/a
Peer GroupFrontier 1,504 1,338.4 777.2 1,538 1,376.6 782.7 1,551 1,407.0 806.6 1,461 1,344.1 775.8 1,469 1,358.0 788.3 1,364.8 788.7Rural 2,880 1,221.1 786.9 2,762 1,176.0 789.0 2,890 1,237.9 786.6 2,845 1,229.0 775.5 2,872 1,252.3 786.4 1,223.1 779.7Densely -Settled Rural 4,690 984.7 800.6 4,773 1,005.6 796.3 4,957 1,049.0 828.7 4,670 994.9 783.4 4,849 1,036.3 809.7 1,014.0 805.5Semi-Urban 4,153 892.4 779.8 4,237 912.6 774.5 4,360 939.3 804.0 4,380 952.9 808.9 4,471 977.3 812.5 934.7 799.4Urban 12,120 755.6 729.7 12,420 767.4 714.4 12,851 787.8 741.9 12,771 779.6 725.1 13,062 791.5 727.7 776.5 730.7
† Rate per 100,000 population‡ Rate per 100,000 standard U.S. 2000 population (see Technical Notes)
* See Technical Notes for Peer Group definition. Numerator and denominator for 5-year rate based on peer group assignment of counties in effect for the event year.


Average
County of Under 85 and Age At
Residence Total 1 1-4 5-14 15-24 25-34 35-44 45-54 55-64 65-74 75-84 over n.s. Death
Kansas 26,725 217 42 64 313 476 653 1,375 3,443 4,780 6,296 9,065 1 74.2
Allen 164 0 0 0 1 2 7 2 19 36 41 56 0 76.6
Anderson 115 1 0 0 1 0 4 4 11 20 33 41 0 76.5
Atchison 161 0 1 1 1 1 4 10 21 36 34 52 0 74.2
Barber 70 2 0 0 1 1 2 1 9 10 20 24 0 74.1
Barton 293 0 0 0 3 3 8 17 33 44 65 120 0 76.8
Bourbon 218 2 2 0 2 2 3 13 23 36 61 74 0 74.9
Brown 139 4 0 0 0 3 2 6 15 30 28 51 0 75.4
Butler 635 6 0 3 11 6 15 33 80 132 147 202 0 73.9
Chase 29 0 0 0 0 2 0 1 4 2 7 13 0 78.0
Chautauqua 50 0 0 0 1 0 0 4 6 9 12 18 0 75.8
Cherokee 274 0 0 0 6 3 6 14 43 58 74 70 0 73.3
Cheyenne 31 0 0 0 0 0 0 3 3 2 8 15 0 79.9
Clark 31 0 0 0 0 1 2 3 4 4 4 13 0 73.7
Clay 85 0 0 0 0 1 2 3 9 14 15 41 0 78.9
Cloud 132 3 0 0 0 1 3 5 14 20 29 57 0 76.3
Coffey 93 0 1 0 0 3 1 3 8 17 26 34 0 76.2
Comanche 29 0 0 0 1 1 0 0 5 5 11 6 0 73.3
Cowley 405 5 2 2 3 13 10 20 46 94 88 122 0 72.2
Crawford 421 4 0 0 3 1 9 28 56 74 120 126 0 74.4
Decatur 49 0 0 2 0 0 0 2 5 6 14 20 0 77.1
Dickinson 235 3 0 0 2 2 2 9 25 38 61 93 0 76.7
Doniphan 101 1 0 0 0 0 0 4 8 21 32 35 0 78.4
Douglas 792 11 1 0 6 19 17 47 96 140 167 288 0 74.6
Edwards 34 0 0 0 0 0 0 2 1 8 10 13 0 78.7
Elk 46 0 0 0 0 1 0 3 8 11 13 10 0 73.8
Ellis 254 1 1 2 3 3 9 13 19 35 69 99 0 76.0
Ellsworth 97 0 1 0 0 1 1 3 13 14 26 38 0 77.8
Finney 219 3 1 0 2 7 7 16 38 35 52 58 0 70.4
Ford 259 1 2 6 2 7 4 9 39 32 64 93 0 73.5
Franklin 269 1 1 0 2 1 2 13 34 51 68 96 0 76.4
Geary 205 5 0 1 7 8 14 17 18 43 45 47 0 66.8
Gove 29 0 0 0 1 0 1 0 0 3 9 15 0 80.7
Graham 47 1 0 0 0 1 2 0 5 4 18 16 0 75.6
Grant 62 0 2 0 1 1 0 6 9 13 16 14 0 70.3
Gray 39 0 0 0 1 2 0 0 6 4 11 15 0 76.0
Greeley 15 0 0 0 1 0 0 0 1 0 3 10 0 81.9
Greenwood 116 1 0 0 1 0 6 7 16 21 28 36 0 74.0
Hamilton 24 1 0 0 1 0 1 0 2 3 6 10 0 73.0
Harper 90 1 0 0 4 0 2 1 7 22 23 30 0 74.3
Harvey 396 3 1 1 5 10 5 15 35 70 85 166 0 76.6
Haskell 30 1 0 0 1 0 0 2 5 6 6 9 0 70.9
Hodgeman 21 0 0 0 1 1 0 0 2 1 9 7 0 75.0
Jackson 162 1 0 1 2 2 1 6 22 24 49 54 0 75.6
Jefferson 213 2 0 0 3 4 2 14 22 45 54 67 0 74.2
Jewell 31 0 0 0 1 0 0 0 3 9 8 10 0 77.5
Johnson 3,980 25 5 7 51 60 83 193 403 623 930 1,600 0 76.4
Kearny 25 0 0 1 0 1 0 0 1 6 7 9 0 77.2
Kingman 91 1 0 0 0 1 1 1 8 13 34 32 0 78.9
Kiowa 26 0 0 0 1 0 1 1 2 4 10 7 0 74.4
Labette 259 1 0 1 2 2 6 18 39 53 62 75 0 73.7
Lane 30 0 0 0 0 0 0 1 5 5 5 14 0 78.9
Leavenworth 609 11 0 0 5 5 12 37 75 124 173 167 0 73.4
Lincoln 32 0 0 0 0 0 0 2 6 7 4 13 0 76.6
Linn 107 0 0 0 1 4 3 8 21 18 27 25 0 71.7
Logan 37 0 0 0 0 0 0 0 5 2 13 17 0 82.1
Age-Group
Table E24Deaths by County of Residence and Peer Group*
by Age-Group and Average Age at DeathKansas, 2017

Average
County of Under 85 and Age At
Residence Total 1 1-4 5-14 15-24 25-34 35-44 45-54 55-64 65-74 75-84 over n.s. Death
Age-Group
Table E24Deaths by County of Residence and Peer Group*
by Age-Group and Average Age at DeathKansas, 2017
Lyon 300 2 0 1 2 4 7 8 42 63 71 100 0 74.9
McPherson 389 1 0 1 8 7 4 10 37 69 88 164 0 77.1
Marion 161 0 0 0 0 2 2 7 24 35 38 53 0 76.0
Marshall 139 1 0 0 0 1 3 5 14 22 37 56 0 78.3
Meade 60 0 0 0 1 2 1 1 3 11 16 25 0 77.5
Miami 335 1 0 0 8 4 9 25 59 63 67 99 0 72.0
Mitchell 94 1 0 1 0 1 1 3 6 15 26 40 0 78.2
Montgomery 459 3 0 1 7 13 5 27 77 81 102 142 1 72.9
Morris 75 0 0 1 0 1 1 2 9 12 12 37 0 78.9
Morton 32 0 0 1 0 0 0 2 6 3 5 15 0 77.1
Nemaha 138 0 0 1 0 1 3 5 12 22 28 66 0 79.1
Neosho 194 1 0 0 2 3 5 5 18 29 58 73 0 77.3
Ness 58 1 0 0 2 1 1 2 2 8 13 28 0 76.2
Norton 59 0 0 0 1 1 2 5 8 4 15 23 0 75.2
Osage 191 3 0 0 5 2 3 11 30 33 45 59 0 72.8
Osborne 63 0 0 0 0 3 2 4 6 5 22 21 0 75.4
Ottawa 81 0 0 0 1 0 1 3 8 18 18 32 0 78.2
Pawnee 95 0 0 0 0 1 1 4 14 18 25 32 0 76.7
Phillips 74 0 0 0 0 1 2 2 5 12 16 36 0 79.9
Pottawatomie 178 2 0 0 4 3 3 9 16 40 37 64 0 74.3
Pratt 105 0 0 0 1 2 3 4 12 18 26 39 0 76.4
Rawlins 37 0 0 1 2 0 0 1 4 6 12 11 0 73.5
Reno 769 5 2 4 7 10 13 34 109 141 191 253 0 74.6
Republic 96 0 0 0 0 1 4 6 4 11 30 40 0 78.6
Rice 131 2 0 0 0 1 2 4 11 26 31 54 0 77.7
Riley 370 3 0 0 3 10 11 15 48 62 74 144 0 75.2
Rooks 67 0 0 0 0 0 3 4 10 12 8 30 0 76.4
Rush 39 0 0 0 0 0 0 2 8 4 6 19 0 79.0
Russell 95 0 1 0 0 0 3 7 10 17 22 35 0 75.6
Saline 612 7 1 1 3 14 8 37 86 116 130 209 0 73.8
Scott 51 0 0 0 0 2 2 1 7 11 9 19 0 76.0
Sedgwick 4,439 44 10 11 52 80 151 268 683 843 988 1,309 0 72.1
Seward 114 1 0 1 2 6 7 7 11 16 31 32 0 70.3
Shawnee 1,879 22 2 3 24 38 58 95 268 357 435 577 0 72.8
Sheridan 23 0 0 0 1 1 0 0 2 3 7 9 0 77.2
Sherman 65 0 0 0 2 0 2 2 7 13 16 23 0 76.0
Smith 56 0 0 0 0 0 0 2 7 2 20 25 0 81.3
Stafford 68 0 0 1 2 0 3 3 16 5 17 21 0 72.6
Stanton 21 0 0 0 0 1 0 1 0 5 7 7 0 78.1
Stevens 52 0 0 0 0 2 1 3 6 12 8 20 0 74.7
Sumner 268 1 1 0 1 6 3 8 36 51 60 101 0 76.4
Thomas 67 0 0 0 0 1 0 4 9 7 15 31 0 78.9
Trego 42 0 0 0 0 0 1 1 3 4 23 10 0 78.8
Wabaunsee 50 0 0 0 1 0 1 2 7 15 11 13 0 73.4
Wallace 13 0 0 0 0 1 0 0 2 4 3 3 0 71.5
Washington 70 1 0 0 0 1 0 2 5 13 13 35 0 79.8
Wichita 23 0 0 0 0 1 0 1 2 3 7 9 0 79.0
Wilson 117 0 0 1 3 5 3 5 13 22 31 34 0 71.6
Woodson 42 0 0 0 0 0 0 1 5 8 13 15 0 78.9
Wyandotte 1,362 13 4 6 27 55 58 95 242 253 279 330 0 68.5
n.s. 1 0 0 0 0 0 0 0 1 0 0 0 0 n/a
Peer Group
Frontier 1,469 6 0 6 20 19 28 56 171 210 401 552 0 76.4
Rural 2,872 16 5 4 16 41 54 117 315 509 698 1,097 0 76.6
Densely -Settled Rural 4,851 31 10 16 56 82 101 223 587 888 1,196 1,661 0 74.7
Semi-Urban 4,471 38 5 11 56 77 91 244 602 833 1,029 1,484 1 74.0
Urban 13,061 126 22 27 165 257 379 735 1,767 2,340 2,972 4,271 0 73.3
* See Technical Notes for Peer Group definition.

County of White Black Native American Asian/Pacific Islander Other Hispanic
Residence Total Non-Hispanic Non-Hispanic Non-Hispanic Non-Hispanic Non-Hispanic† Any Race n.s.
Kansas 26,725 23,557 1,421 194 232 340 918 63
Allen 164 159 4 0 0 1 0 0
Anderson 115 112 3 0 0 0 0 0
Atchison 161 147 10 1 1 1 1 0
Barber 70 67 0 0 1 0 2 0
Barton 293 279 2 0 0 1 11 0
Bourbon 218 212 3 1 0 1 1 0
Brown 139 124 1 12 1 0 1 0
Butler 635 597 3 5 2 20 8 0
Chase 29 27 0 0 0 2 0 0
Chautauqua 50 49 0 1 0 0 0 0
Cherokee 274 268 2 1 1 1 1 0
Cheyenne 31 31 0 0 0 0 0 0
Clark 31 31 0 0 0 0 0 0
Clay 85 83 0 0 1 0 1 0
Cloud 132 129 0 0 0 0 3 0
Coffey 93 92 0 0 0 0 1 0
Comanche 29 27 0 0 0 0 2 0
Cowley 405 360 8 8 4 15 10 0
Crawford 421 404 6 2 0 7 2 0
Decatur 49 47 0 0 0 0 2 0
Dickinson 235 228 3 1 0 1 2 0
Doniphan 101 97 0 4 0 0 0 0
Douglas 792 723 25 17 10 4 12 1
Edwards 34 33 0 0 0 0 1 0
Elk 46 46 0 0 0 0 0 0
Ellis 254 249 2 1 0 0 2 0
Ellsworth 97 91 1 0 0 2 3 0
Finney 219 156 3 1 7 4 48 0
Ford 259 207 4 0 1 1 46 0
Franklin 269 259 3 4 0 2 1 0
Geary 205 142 25 3 15 3 17 0
Gove 29 28 0 1 0 0 0 0
Graham 47 40 6 0 0 1 0 0
Grant 62 47 0 0 0 0 15 0
Gray 39 39 0 0 0 0 0 0
Greeley 15 15 0 0 0 0 0 0
Greenwood 116 108 1 1 0 2 4 0
Hamilton 24 20 0 1 0 0 3 0
Harper 90 87 0 1 0 1 1 0
Harvey 396 369 9 0 0 4 14 0
Haskell 30 27 0 0 0 0 3 0
Hodgeman 21 21 0 0 0 0 0 0
Jackson 162 143 0 14 0 2 3 0
Jefferson 213 207 1 1 0 1 3 0
Jewell 31 31 0 0 0 0 0 0
Johnson 3,980 3,626 140 8 57 57 88 4
Kearny 25 23 0 0 0 0 2 0
Kingman 91 90 0 0 0 0 1 0
Kiowa 26 25 0 0 1 0 0 0
Labette 259 236 13 1 2 2 5 0
Lane 30 30 0 0 0 0 0 0
Leavenworth 609 528 51 5 8 7 9 1
Lincoln 32 31 0 0 0 0 1 0
Linn 107 104 0 1 0 0 2 0
Logan 37 36 0 0 0 0 1 0
Table E25Deaths by County of Residence and Peer Group*
by Population GroupKansas, 2017
Population Group

County of White Black Native American Asian/Pacific Islander Other Hispanic
Residence Total Non-Hispanic Non-Hispanic Non-Hispanic Non-Hispanic Non-Hispanic† Any Race n.s.
Table E25Deaths by County of Residence and Peer Group*
by Population GroupKansas, 2017
Population Group
Lyon 300 268 5 1 3 6 17 0
McPherson 389 379 3 3 0 1 3 0
Marion 161 159 0 0 0 2 0 0
Marshall 139 136 1 0 0 2 0 0
Meade 60 55 0 0 0 2 3 0
Miami 335 318 8 3 0 3 2 1
Mitchell 94 88 0 1 0 4 1 0
Montgomery 459 418 25 6 2 1 7 0
Morris 75 74 0 0 0 0 1 0
Morton 32 27 0 0 0 0 5 0
Nemaha 138 136 1 0 1 0 0 0
Neosho 194 191 1 0 0 0 2 0
Ness 58 57 0 0 0 1 0 0
Norton 59 58 0 0 0 0 1 0
Osage 191 178 2 2 0 6 3 0
Osborne 63 63 0 0 0 0 0 0
Ottawa 81 81 0 0 0 0 0 0
Pawnee 95 88 4 0 0 0 3 0
Phillips 74 74 0 0 0 0 0 0
Pottawatomie 178 171 1 1 0 2 3 0
Pratt 105 102 0 0 0 0 3 0
Rawlins 37 37 0 0 0 0 0 0
Reno 769 710 16 3 2 13 24 1
Republic 96 95 0 0 0 0 1 0
Rice 131 124 0 2 0 1 4 0
Riley 370 328 10 1 8 11 11 1
Rooks 67 66 0 1 0 0 0 0
Rush 39 38 0 0 0 1 0 0
Russell 95 93 1 0 0 0 1 0
Saline 612 554 24 3 6 6 15 4
Scott 51 46 0 1 0 2 2 0
Sedgwick 4,439 3,627 420 32 69 63 194 34
Seward 114 79 9 1 2 1 22 0
Shawnee 1,879 1,535 170 25 14 30 93 12
Sheridan 23 22 0 0 0 1 0 0
Sherman 65 62 0 0 0 0 3 0
Smith 56 56 0 0 0 0 0 0
Stafford 68 63 0 0 0 2 3 0
Stanton 21 20 0 0 0 0 1 0
Stevens 52 47 1 0 0 1 3 0
Sumner 268 254 0 4 0 5 5 0
Thomas 67 64 0 1 0 1 1 0
Trego 42 42 0 0 0 0 0 0
Wabaunsee 50 47 1 0 0 1 0 1
Wallace 13 13 0 0 0 0 0 0
Washington 70 70 0 0 0 0 0 0
Wichita 23 17 0 0 0 0 6 0
Wilson 117 114 1 2 0 0 0 0
Woodson 42 42 0 0 0 0 0 0
Wyandotte 1,362 783 388 5 13 28 142 3
n.s. 1 1 0 0 0 0 0 0
Peer Group
Frontier 1,469 1,404 7 5 2 12 39 0
Rural 2,872 2,763 15 21 3 17 52 1
Densely -Settled Rural 4,851 4,468 76 46 21 52 188 0
Semi-Urban 4,471 4,099 129 30 35 70 101 7
Urban 13,061 10,822 1,194 92 171 189 538 55
* See Technical Notes for Peer Group definition.
† Includes selection of two or more races or other non-specified race

Yes + Probably
County of Total as PercentResidence Yes Probably No Unknown Deaths of Known
Kansas 2,993 1,722 13,946 8,064 26,725 25.3
Allen 14 13 86 51 164 23.9
Anderson 15 5 71 24 115 22.0
Atchison 26 14 79 42 161 33.6
Barber 4 2 39 25 70 13.3
Barton 40 14 156 83 293 25.7
Bourbon 25 19 139 35 218 24.0
Brown 28 9 66 36 139 35.9
Butler 55 38 271 271 635 25.5
Chase 3 1 19 6 29 17.4
Chautauqua 4 1 21 24 50 19.2
Cherokee 35 24 111 104 274 34.7
Cheyenne 5 1 17 8 31 26.1
Clark 4 3 20 4 31 25.9
Clay 13 3 43 26 85 27.1
Cloud 17 8 78 29 132 24.3
Coffey 8 6 61 18 93 18.7
Comanche 5 2 20 2 29 25.9
Cowley 58 21 207 119 405 27.6
Crawford 71 34 213 103 421 33.0
Decatur 11 5 25 8 49 39.0
Dickinson 30 12 151 42 235 21.8
Doniphan 15 7 60 19 101 26.8
Douglas 91 45 450 206 792 23.2
Edwards 11 5 11 7 34 59.3
Elk 5 10 16 15 46 48.4
Ellis 23 26 126 79 254 28.0
Ellsworth 20 3 58 16 97 28.4
Finney 12 15 129 63 219 17.3
Ford 26 21 145 67 259 24.5
Franklin 46 27 151 45 269 32.6
Geary 34 18 111 42 205 31.9
Gove 5 3 19 2 29 29.6
Graham 8 4 29 6 47 29.3
Grant 4 3 37 18 62 15.9
Gray 5 2 27 5 39 20.6
Greeley 2 5 8 0 15 46.7
Greenwood 6 8 58 44 116 19.4
Hamilton 2 2 17 3 24 19.0
Harper 6 2 33 49 90 19.5
Harvey 49 27 214 106 396 26.2
Haskell 1 4 17 8 30 22.7
Hodgeman 1 1 16 3 21 11.1
Jackson 12 8 78 64 162 20.4
Jefferson 27 8 86 92 213 28.9
Jewell 8 1 9 13 31 50.0
Johnson 311 200 2,230 1,239 3,980 18.6
Kearny 3 0 20 2 25 13.0
Kingman 9 4 61 17 91 17.6
Kiowa 6 2 11 7 26 42.1
Labette 37 13 137 72 259 26.7
Lane 1 2 18 9 30 14.3
Leavenworth 101 45 262 201 609 35.8
Lincoln 7 3 13 9 32 43.5
Linn 14 11 55 27 107 31.3Logan 8 1 21 7 37 30.0
Did Tobacco Use Contribute to this death?
Table E26Deaths by County of Residence and Peer Group *
by Number and Percent Related to TobaccoKansas, 2017

Yes + Probably
County of Total as PercentResidence Yes Probably No Unknown Deaths of Known
Did Tobacco Use Contribute to this death?
Table E26Deaths by County of Residence and Peer Group *
by Number and Percent Related to TobaccoKansas, 2017
Lyon 40 19 157 84 300 27.3
McPherson 35 21 260 73 389 17.7
Marion 19 9 84 49 161 25.0
Marshall 23 9 76 31 139 29.6
Meade 8 2 41 9 60 19.6
Miami 38 21 186 90 335 24.1
Mitchell 16 6 58 14 94 27.5
Montgomery 36 31 219 173 459 23.4
Morris 21 1 38 15 75 36.7
Morton 5 0 19 8 32 20.8
Nemaha 12 7 78 41 138 19.6
Neosho 27 9 118 40 194 23.4
Ness 7 2 35 14 58 20.5
Norton 8 2 35 14 59 22.2
Osage 19 14 94 64 191 26.0
Osborne 12 8 31 12 63 39.2
Ottawa 10 5 48 18 81 23.8
Pawnee 14 9 44 28 95 34.3
Phillips 7 4 46 17 74 19.3
Pottawatomie 30 11 88 49 178 31.8
Pratt 9 11 61 24 105 24.7
Rawlins 4 1 18 14 37 21.7
Reno 88 35 380 266 769 24.5
Republic 9 4 49 34 96 21.0
Rice 12 10 87 22 131 20.2
Riley 42 28 248 52 370 22.0
Rooks 8 4 32 23 67 27.3
Rush 4 2 19 14 39 24.0
Russell 12 4 54 25 95 22.9
Saline 95 56 360 101 612 29.5
Scott 3 2 20 26 51 20.0
Sedgwick 407 324 2,055 1,653 4,439 26.2
Seward 9 8 54 43 114 23.9
Shawnee 216 133 915 615 1,879 27.6
Sheridan 1 3 16 3 23 20.0
Sherman 14 3 41 7 65 29.3
Smith. 13 2 38 3 56 28.3
Stafford 3 7 24 34 68 29.4
Stanton 6 2 13 0 21 38.1
Stevens 8 3 31 10 52 26.2
Sumner 43 8 140 77 268 26.7
Thomas 7 2 38 20 67 19.1
Trego 8 0 33 1 42 19.5
Wabaunsee 9 4 15 22 50 46.4
Wallace 1 0 8 4 13 11.1
Washington 12 2 41 15 70 25.5
Wichita 1 3 12 7 23 25.0
Wilson 15 11 51 40 117 33.8
Woodson 2 2 22 16 42 15.4
Wyandotte 158 87 689 428 1,362 26.2n.s. 0 0 1 0 1 n/a
Peer Group
Frontier 204 101 807 357 1,469 27.4
Rural 368 167 1,583 754 2,872 25.3
Densely -Settled Rural 583 305 2,601 1,362 4,851 25.5
Semi-Urban 554 315 2,353 1,249 4,471 27.0Urban 1,284 834 6,601 4,342 13,061 24.3
* See Technical Notes for Peer Group definition.

MalignantMalignant Neoplasms of Malignant
Residual Neoplasms Respiratory Malignant NeoplasmsInfect. All of and Malignant Neoplasms of
County of All Tuber- & Para- Malignant Digestive Intrathoracic Neoplasm of Genital UrinaryResidence Causes culosis sitic Dis. Neoplasms Organs Organs of Breast Organs Tract
Kansas 26,725 1 538 5,391 1,370 1,398 342 564 299
Allen 164 0 3 37 11 10 2 3 3
Anderson 115 0 4 17 7 5 1 1 1
Atchison 161 0 3 31 13 7 1 1 1
Barber 70 0 0 9 0 3 1 0 2
Barton 293 0 9 55 10 15 6 9 4
Bourbon 218 0 3 55 14 16 5 1 3
Brown 139 0 3 27 5 10 0 3 1
Butler 635 0 15 124 27 35 14 8 9
Chase 29 0 0 6 0 1 1 1 0
Chautauqua 50 0 1 7 3 2 0 0 1
Cherokee 274 0 4 49 14 18 1 3 3
Cheyenne 31 0 1 1 1 0 0 0 0
Clark 31 0 0 5 2 2 0 0 0
Clay 85 0 0 14 4 2 0 1 0
Cloud 132 0 2 23 8 9 1 2 0
Coffey 93 0 2 19 7 5 0 2 1
Comanche 29 0 0 4 2 0 0 1 0
Cowley 405 0 9 81 23 26 2 12 2
Crawford 421 0 11 98 31 35 4 5 3
Decatur 49 0 0 10 2 5 0 1 1
Dickinson 235 0 3 50 13 11 5 7 4
Doniphan 101 0 2 25 4 7 3 1 1
Douglas 792 0 10 151 36 31 10 15 4
Edwards 34 0 1 7 1 1 0 2 1
Elk 46 0 0 5 1 2 0 0 0
Ellis 254 0 4 41 16 9 1 1 3
Ellsworth 97 0 1 17 3 4 1 4 0
Finney 218 0 4 36 8 11 2 3 2
Ford 259 0 7 50 15 11 3 7 8
Franklin 269 0 5 60 11 20 4 5 0
Geary 205 0 4 37 10 12 1 2 1
Gove 29 0 0 3 0 1 0 1 0
Graham 47 0 1 8 0 2 1 0 0
Grant 62 0 1 16 8 2 2 2 1
Gray 39 0 0 6 1 3 0 0 0
Greeley 15 0 0 0 0 0 0 0 0
Greenwood 116 0 1 17 2 3 2 2 0
Hamilton 25 0 0 3 3 0 0 0 0
Harper 90 0 2 20 6 5 2 1 0
Harvey 396 0 8 77 18 18 6 8 2
Haskell 30 0 0 8 2 1 1 1 1
Hodgeman 21 0 1 5 0 1 1 0 1
Jackson 162 0 0 27 11 8 0 1 0
Jefferson 213 0 4 47 10 14 0 6 3
Jewell 31 0 0 8 1 4 0 0 0
Johnson 3,980 0 68 827 212 197 58 89 47
Kearny 25 0 0 4 1 0 1 1 0
Kingman 91 0 0 22 4 2 1 1 1
Kiowa 26 0 0 5 1 3 0 0 1
Labette 258 0 5 44 15 10 3 5 3
Lane 30 0 1 8 3 2 0 0 1
Leavenworth 609 0 8 132 35 44 3 13 4
Lincoln 32 0 1 7 1 5 0 1 0
Linn 107 0 3 27 12 4 2 3 0
Logan 36 0 1 5 1 3 0 0 0
Table E27Selected Causes of Death by County of Residence and Peer Group
Kansas, 2017
Selected Causes of Death *

MalignantMalignant Neoplasms of Malignant
Residual Neoplasms Respiratory Malignant NeoplasmsInfect. All of and Malignant Neoplasms of
County of All Tuber- & Para- Malignant Digestive Intrathoracic Neoplasm of Genital UrinaryResidence Causes culosis sitic Dis. Neoplasms Organs Organs of Breast Organs Tract
Table E27Selected Causes of Death by County of Residence and Peer Group
Kansas, 2017
Selected Causes of Death *
Lyon 300 0 6 63 23 13 2 6 2
McPherson 389 0 6 84 17 14 12 16 6
Marion 161 0 0 37 11 6 3 5 3
Marshall 139 0 2 25 3 8 2 2 3
Meade 60 0 0 10 2 3 1 1 0
Miami 335 0 6 64 15 24 6 2 7
Mitchell 94 0 1 15 3 3 1 2 1
Montgomery 459 0 6 86 23 24 4 8 5
Morris 75 0 3 12 2 4 1 1 2
Morton 32 0 0 7 1 4 0 0 1
Nemaha 138 0 0 29 8 7 1 2 4
Neosho 194 0 3 32 5 11 1 2 0
Ness 58 0 0 13 8 1 0 0 0
Norton 59 0 1 9 2 2 0 1 2
Osage 191 0 4 45 12 14 3 2 1
Osborne 63 0 0 13 3 6 0 0 0
Ottawa 81 0 3 14 2 3 3 0 3
Pawnee 95 0 1 25 5 5 0 5 2
Phillips 74 0 1 9 3 2 0 2 0
Pottawatomie 178 0 5 42 12 9 2 2 5
Pratt 105 0 0 15 5 4 2 2 0
Rawlins 37 0 0 5 1 2 1 0 0
Reno 769 0 22 159 44 41 8 20 11
Republic 96 0 2 16 3 4 2 2 0
Rice 131 0 3 21 5 5 0 4 3
Riley 370 0 9 80 15 23 10 6 5
Rooks 67 0 1 11 3 1 1 2 0
Rush 39 0 1 9 0 6 0 0 1
Russell 95 0 1 19 1 5 0 5 2
Saline 612 0 6 147 31 40 8 14 16
Scott 51 0 1 10 2 0 1 1 2
Sedgwick 4,439 1 134 910 234 232 56 113 45
Seward 114 0 3 23 8 2 1 2 2
Shawnee 1,880 0 38 364 95 94 27 39 17
Sheridan 23 0 0 5 1 0 1 0 1
Sherman 65 0 1 20 4 5 0 3 3
Smith 56 0 1 8 2 0 1 0 1
Stafford 68 0 3 11 2 4 0 1 0
Stanton 21 0 0 5 1 1 0 0 0
Stevens 52 0 1 12 3 1 0 2 0
Sumner 268 0 5 56 10 14 4 10 3
Thomas 67 0 2 12 2 3 0 3 0
Trego 42 0 0 11 3 4 0 1 0
Wabaunsee 50 0 0 10 2 5 0 0 0
Wallace 13 0 0 6 1 1 0 0 1
Washington 70 0 1 28 6 3 0 4 3
Wichita 23 0 0 3 1 2 0 0 0
Wilson 117 0 2 28 6 6 1 3 1
Woodson 42 0 2 4 2 1 0 1 0
Wyandotte 1,362 0 35 272 68 69 24 31 11
n.s. 2 0 0 0 0 0 0 0 0
Peer GroupFrontier 1,469 0 16 264 58 80 12 18 16Rural 2,872 0 45 566 143 129 28 68 37Densely -Settled Rural 4,849 0 92 973 264 250 59 100 59Semi-Urban 4,471 0 92 932 225 272 65 78 59Urban 13,062 1 293 2,656 680 667 178 300 128
* The ICD-10 codes associated with each category are listed in Appendix 4.

County ofResidence
Kansas
AllenAndersonAtchisonBarberBarton
BourbonBrownButlerChaseChautauqua
CherokeeCheyenneClarkClayCloud
CoffeyComancheCowleyCrawfordDecatur
DickinsonDoniphanDouglasEdwardsElk
EllisEllsworthFinneyFordFranklin
GearyGoveGrahamGrantGray
GreeleyGreenwoodHamiltonHarperHarvey
HaskellHodgemanJacksonJeffersonJewell
JohnsonKearnyKingmanKiowaLabette
LaneLeavenworthLincolnLinnLogan
Hyperten-Rheumatic sive Heart
Major Fever and DiseaseOther Cardio- Rheumatic w, w/out Ischemic Other
Malignant Diabetes Alzheimer's vascular Diseases Heart Renal Heart HeartLeukemia Neoplasms mellitus Disease Diseases of Heart Diseases Disease Diseases Diseases
234 1,184 864 886 7,801 5,636 26 376 3,299 1,935
2 6 10 4 49 39 0 0 21 180 2 4 8 43 30 0 3 14 130 8 5 2 47 35 1 3 17 140 3 1 1 18 16 0 0 7 92 9 7 16 78 61 0 4 34 23
4 12 6 19 64 49 0 3 22 241 7 3 6 48 34 0 1 22 114 27 16 15 175 143 1 6 82 541 2 1 2 8 7 0 1 4 20 1 2 5 17 15 0 1 13 1
3 7 6 10 99 70 0 5 44 210 0 1 0 13 10 0 0 9 10 1 2 1 8 6 0 0 5 12 5 3 2 30 23 0 0 16 71 2 7 2 35 25 1 2 15 7
1 3 1 6 33 26 0 0 13 130 1 3 1 7 4 0 0 3 11 15 21 20 118 92 0 5 51 365 15 11 19 110 87 1 4 55 270 1 2 2 15 12 0 2 7 3
1 9 7 2 68 54 0 6 34 142 7 4 4 34 27 0 0 20 7
15 40 28 38 250 169 1 19 93 560 2 1 0 10 8 0 0 7 11 1 1 0 17 16 0 0 12 4
1 10 5 11 76 57 1 3 31 221 4 3 1 31 20 2 0 11 73 7 9 7 51 38 0 1 18 192 4 12 3 72 58 0 2 43 134 16 8 7 101 67 1 2 39 25
2 9 8 8 63 47 0 2 32 130 1 1 4 8 6 0 1 2 32 3 0 0 13 10 0 0 8 20 1 3 0 18 13 0 0 6 70 2 0 1 13 8 0 0 6 2
0 0 1 1 2 2 0 1 1 02 6 4 2 41 31 0 2 18 110 0 1 2 9 8 1 1 3 30 6 2 2 21 16 0 1 5 104 21 14 18 113 83 0 5 58 20
0 2 0 2 5 3 0 0 2 10 2 1 0 5 3 0 0 2 10 7 6 2 60 45 0 1 32 122 12 6 15 53 37 0 1 20 162 1 1 0 10 6 0 0 3 3
37 187 86 116 1,292 794 3 43 400 3480 1 0 5 6 6 0 0 4 21 12 3 7 25 17 0 0 15 20 0 1 0 5 4 0 0 2 21 7 10 11 83 59 0 3 35 21
1 1 1 2 5 5 0 0 3 25 28 22 21 181 136 0 8 82 460 0 1 1 10 9 0 1 3 51 5 2 6 29 25 0 0 20 50 1 0 2 14 9 0 1 5 3
Selected Causes of Death *
Table E27Selected Causes of Death by County of Residence and Peer Group
Kansas, 2017

County ofResidence
LyonMcPhersonMarionMarshallMeade
MiamiMitchellMontgomeryMorrisMorton
NemahaNeoshoNessNortonOsage
OsborneOttawaPawneePhillipsPottawatomie
PrattRawlinsRenoRepublicRice
RileyRooksRushRussellSaline
ScottSedgwickSewardShawneeSheridan
ShermanSmithStaffordStantonStevens
SumnerThomasTregoWabaunseeWallace
WashingtonWichitaWilsonWoodsonWyandotten.s.
Peer GroupFrontierRuralDensely -Settled RuralSemi-UrbanUrban
* The ICD-10 codes associate
Hyperten-Rheumatic sive Heart
Major Fever and DiseaseOther Cardio- Rheumatic w, w/out Ischemic Other
Malignant Diabetes Alzheimer's vascular Diseases Heart Renal Heart HeartLeukemia Neoplasms mellitus Disease Diseases of Heart Diseases Disease Diseases Diseases
Selected Causes of Death *
Table E27Selected Causes of Death by County of Residence and Peer Group
Kansas, 2017
1 16 15 14 109 92 0 5 50 373 16 10 18 103 82 1 5 48 282 7 10 4 48 35 0 4 19 120 7 2 8 43 33 1 2 20 101 2 1 5 21 17 0 4 10 3
3 7 12 8 102 77 0 3 41 331 4 6 1 36 27 0 2 20 53 19 23 8 169 141 0 14 107 200 2 0 4 24 18 0 2 9 70 1 1 0 10 10 0 0 7 3
1 6 7 11 44 27 0 0 18 91 12 2 5 55 44 0 1 29 140 4 3 1 15 12 0 3 7 20 2 3 0 17 14 0 1 9 40 13 4 7 42 30 1 1 18 10
0 4 2 2 22 21 0 1 18 22 1 2 1 23 17 0 1 12 41 7 6 9 23 15 0 0 10 50 2 1 5 24 22 0 1 12 92 10 5 9 54 44 0 1 27 16
0 2 4 5 31 26 0 0 14 120 1 0 1 15 13 0 0 7 65 30 37 24 203 147 0 14 81 520 5 4 1 23 17 0 0 10 70 4 2 7 42 32 0 1 15 16
4 17 7 20 105 80 1 6 39 340 4 0 4 25 16 0 0 14 20 2 2 1 16 9 0 1 4 40 6 5 4 33 24 0 0 15 9
10 28 16 22 172 108 0 12 55 41
1 3 1 1 14 12 0 1 11 044 186 161 99 1,136 864 3 45 547 2692 6 7 3 27 22 0 4 12 66 86 51 79 503 368 5 63 179 1210 2 1 0 8 7 0 0 5 2
1 4 4 1 16 10 0 0 7 31 3 1 0 23 14 0 5 5 41 3 3 5 13 8 0 1 4 30 3 0 2 4 3 0 1 2 02 4 3 1 15 8 0 0 4 4
4 11 14 5 67 43 0 7 31 50 4 0 1 21 17 0 0 12 50 3 1 0 17 16 0 1 12 31 2 3 0 17 13 0 2 8 30 3 0 0 6 5 0 0 5 0
1 11 0 2 19 15 0 1 11 30 0 1 2 8 3 0 1 2 02 9 0 3 34 28 0 1 20 70 0 3 2 13 8 0 0 6 2
11 58 54 29 382 242 1 14 142 85
0 0 0 0 0 0 0 0 0 0
13 67 46 55 460 357 1 29 230 9722 139 93 113 875 648 4 26 400 21837 204 171 187 1,409 1,078 4 61 637 37644 189 152 149 1,313 980 4 68 589 319
118 585 402 382 3,744 2,573 13 192 1,443 925
* The ICD-10 codes associated with each category are listed in Appendix 4.

County ofResidence
Kansas
AllenAndersonAtchisonBarberBarton
BourbonBrownButlerChaseChautauqua
CherokeeCheyenneClarkClayCloud
CoffeyComancheCowleyCrawfordDecatur
DickinsonDoniphanDouglasEdwardsElk
EllisEllsworthFinneyFordFranklin
GearyGoveGrahamGrantGray
GreeleyGreenwoodHamiltonHarperHarvey
HaskellHodgemanJacksonJeffersonJewell
JohnsonKearnyKingmanKiowaLabette
LaneLeavenworthLincolnLinnLogan
Primary OtherHypertension/ Diseases ChronicHypertensive of Arter- Chronic Liver Nephritis,
Renal Disease Cerebro- ies, Arteri Pneumonia Lower Disease Nephrotic& Secondary vascular Athero- oles and and Respiratory Peptic and Syndr. andHypertension Diseases sclerosis Capillaries Influenza Diseases Ulcer Cirrhosis Nephrosis
263 1,327 384 191 540 1,816 32 311 531
0 8 1 1 5 16 1 1 20 9 4 0 2 11 0 0 53 9 0 0 8 19 0 1 30 2 0 0 0 1 0 1 62 10 1 4 8 22 1 9 6
1 11 1 2 2 7 0 1 60 10 0 4 4 14 1 0 23 24 2 3 18 45 2 13 150 0 0 1 0 2 0 1 21 0 0 1 0 4 0 1 1
9 16 1 3 9 23 0 2 60 3 0 0 1 5 0 0 00 1 0 1 0 0 0 1 01 6 0 0 2 5 0 1 30 9 0 1 1 14 0 0 3
0 6 1 0 1 3 0 1 20 3 0 0 1 5 0 0 13 20 0 3 12 21 1 3 45 15 1 2 13 37 0 10 111 2 0 0 0 3 0 0 0
2 11 1 0 6 27 1 3 61 6 0 0 3 8 0 1 36 58 9 8 14 48 2 7 61 0 0 1 2 2 0 0 10 1 0 0 0 5 1 0 1
1 13 2 3 4 17 0 4 22 7 0 2 1 14 1 0 33 6 0 4 4 13 0 9 132 11 0 1 2 20 0 3 96 10 15 3 4 19 0 0 6
6 9 1 0 4 14 0 7 40 2 0 0 1 5 0 0 00 2 0 1 1 6 0 0 23 2 0 0 1 4 0 0 01 4 0 0 2 2 0 0 1
0 0 0 0 0 3 0 0 02 8 0 0 2 6 0 0 60 0 0 1 0 1 0 1 11 3 0 1 1 7 0 3 32 25 1 2 15 25 0 7 8
0 2 0 0 1 1 0 0 10 2 0 0 0 2 0 0 05 8 1 1 3 18 0 1 42 11 2 1 10 12 1 2 20 3 0 1 0 0 0 0 0
29 216 238 15 68 200 3 34 720 0 0 0 0 1 0 1 00 7 1 0 2 5 0 1 10 0 0 1 0 3 0 0 04 17 1 2 8 16 0 2 0
0 0 0 0 1 2 0 2 04 28 8 5 7 53 1 8 91 0 0 0 0 4 0 0 00 4 0 0 4 4 0 3 23 2 0 0 0 4 0 0 1
Selected Causes of Death *
Table E27Selected Causes of Death by County of Residence and Peer Group
Kansas, 2017

County ofResidence
LyonMcPhersonMarionMarshallMeade
MiamiMitchellMontgomeryMorrisMorton
NemahaNeoshoNessNortonOsage
OsborneOttawaPawneePhillipsPottawatomie
PrattRawlinsRenoRepublicRice
RileyRooksRushRussellSaline
ScottSedgwickSewardShawneeSheridan
ShermanSmithStaffordStantonStevens
SumnerThomasTregoWabaunseeWallace
WashingtonWichitaWilsonWoodsonWyandotten.s.
Peer GroupFrontierRuralDensely -Settled RuralSemi-UrbanUrban
* The ICD-10 codes associate
Primary OtherHypertension/ Diseases ChronicHypertensive of Arter- Chronic Liver Nephritis,
Renal Disease Cerebro- ies, Arteri Pneumonia Lower Disease Nephrotic& Secondary vascular Athero- oles and and Respiratory Peptic and Syndr. andHypertension Diseases sclerosis Capillaries Influenza Diseases Ulcer Cirrhosis Nephrosis
Selected Causes of Death *
Table E27Selected Causes of Death by County of Residence and Peer Group
Kansas, 2017
1 11 1 4 5 19 0 2 51 16 0 4 8 26 1 3 71 11 0 1 3 15 0 3 10 8 0 2 4 10 0 0 02 2 0 0 0 5 0 0 1
1 14 8 2 7 30 0 4 32 7 0 0 5 8 0 2 14 20 2 2 5 20 3 4 82 2 0 2 0 6 0 1 10 0 0 0 1 0 0 0 1
2 13 1 1 6 9 0 0 22 8 0 1 7 19 0 2 33 0 0 0 2 7 0 0 11 2 0 0 2 5 0 0 20 11 1 0 2 14 0 2 1
0 0 0 1 2 5 0 0 13 2 0 1 2 5 0 0 13 3 0 2 2 5 0 2 10 2 0 0 1 6 0 0 11 7 1 1 1 13 0 1 0
0 4 0 1 2 7 0 1 20 2 0 0 2 3 0 0 18 35 3 10 30 54 1 6 111 5 0 0 1 4 0 1 11 8 0 1 3 12 0 1 7
3 19 0 3 11 17 0 4 63 5 1 0 0 5 0 1 22 2 1 2 0 4 0 0 01 6 1 1 3 2 0 2 3
10 45 6 3 15 41 0 6 18
0 0 0 2 0 5 0 1 141 198 5 28 80 301 5 71 1062 3 0 0 2 6 0 3 3
17 87 9 22 30 142 3 23 330 1 0 0 2 1 0 0 1
1 4 0 1 0 4 0 0 01 8 0 0 0 5 0 0 01 4 0 0 0 6 0 0 20 1 0 0 1 2 0 0 02 4 0 1 0 1 0 0 0
1 23 0 0 5 20 1 3 70 3 0 1 3 1 0 0 10 0 0 1 0 4 0 0 01 2 0 1 1 2 0 0 21 0 0 0 0 0 0 0 1
0 4 0 0 0 6 0 0 11 4 0 0 0 1 0 0 20 5 0 1 3 10 0 0 20 3 2 0 3 3 0 1 0
20 61 50 9 20 92 2 16 32
0 0 0 0 0 0 0 0 0
24 64 2 13 19 116 1 9 3528 163 10 26 66 206 2 24 5646 236 14 35 114 356 7 58 9248 216 39 30 122 302 6 61 90
117 648 319 87 219 836 16 159 258
* The ICD-10 codes associated with each category are listed in Appendix 4.

County ofResidence
Kansas
AllenAndersonAtchisonBarberBarton
BourbonBrownButlerChaseChautauqua
CherokeeCheyenneClarkClayCloud
CoffeyComancheCowleyCrawfordDecatur
DickinsonDoniphanDouglasEdwardsElk
EllisEllsworthFinneyFordFranklin
GearyGoveGrahamGrantGray
GreeleyGreenwoodHamiltonHarperHarvey
HaskellHodgemanJacksonJeffersonJewell
JohnsonKearnyKingmanKiowaLabette
LaneLeavenworthLincolnLinnLogan
Cert. Cond.Origina- Symptoms,
Pregnancy, ting in Signs All OtherChildbirth the Peri- and Accidentsand the Congenital natal Abnormal Motor and Adverse All Other
Puerperium Anomalies Period Findings Vehicle Effects Suicide Homicide Causes
10 102 108 472 447 1,126 544 179 5,026
0 0 0 1 3 4 2 1 250 0 1 0 4 2 0 0 140 0 0 0 5 8 1 1 270 3 0 0 2 6 3 1 180 2 0 1 6 9 4 0 60
0 1 0 5 4 4 3 1 370 1 3 2 2 4 1 0 180 1 4 21 9 28 19 2 1130 0 0 0 1 0 0 0 60 0 0 0 0 2 1 0 9
0 0 0 5 7 6 2 4 420 0 0 1 1 2 0 0 50 0 0 0 3 0 1 0 100 0 0 0 3 2 0 0 200 2 0 6 2 2 1 0 32
0 0 0 2 2 6 0 0 150 0 0 0 2 1 0 0 40 2 3 5 8 15 6 3 730 1 3 2 2 6 7 0 800 0 0 1 3 3 1 0 9
0 0 3 2 2 7 2 1 450 1 0 1 0 2 0 0 130 2 5 12 11 51 17 7 1330 0 0 0 1 3 0 0 60 0 0 1 1 6 1 0 7
0 1 0 4 6 18 3 0 580 0 0 2 0 6 0 1 160 2 1 8 4 16 4 2 361 2 0 4 10 12 7 0 450 1 1 2 1 9 1 1 43
1 1 4 1 5 7 11 1 250 1 0 0 0 1 0 0 50 1 0 0 1 0 1 0 130 0 0 3 2 3 0 0 110 0 0 1 2 0 0 0 11
0 1 0 0 1 0 0 0 60 1 0 1 5 6 1 0 230 0 1 0 0 1 1 0 30 1 0 4 4 2 2 0 160 2 1 4 4 24 3 7 66
0 1 0 0 1 3 0 0 70 0 0 0 2 0 0 0 50 1 1 4 3 11 1 0 200 2 0 0 3 5 8 2 410 0 0 9 0 2 0 0 1
2 9 10 76 39 146 103 15 8140 0 0 0 1 1 0 0 60 0 0 0 0 2 3 0 200 0 0 1 0 0 2 0 90 1 0 1 4 9 4 2 59
0 0 0 1 0 2 0 1 41 1 4 15 7 19 11 4 1050 0 0 0 0 1 0 0 70 0 0 1 3 2 2 1 180 0 0 1 0 3 0 0 6
Selected Causes of Death *
Table E27Selected Causes of Death by County of Residence and Peer Group
Kansas, 2017

County ofResidence
LyonMcPhersonMarionMarshallMeade
MiamiMitchellMontgomeryMorrisMorton
NemahaNeoshoNessNortonOsage
OsborneOttawaPawneePhillipsPottawatomie
PrattRawlinsRenoRepublicRice
RileyRooksRushRussellSaline
ScottSedgwickSewardShawneeSheridan
ShermanSmithStaffordStantonStevens
SumnerThomasTregoWabaunseeWallace
WashingtonWichitaWilsonWoodsonWyandotten.s.
Peer GroupFrontierRuralDensely -Settled RuralSemi-UrbanUrban
* The ICD-10 codes associate
Cert. Cond.Origina- Symptoms,
Pregnancy, ting in Signs All OtherChildbirth the Peri- and Accidentsand the Congenital natal Abnormal Motor and Adverse All Other
Puerperium Anomalies Period Findings Vehicle Effects Suicide Homicide Causes
Selected Causes of Death *
Table E27Selected Causes of Death by County of Residence and Peer Group
Kansas, 2017
0 3 0 2 2 11 9 2 330 0 0 2 11 21 6 1 820 1 0 0 2 6 2 0 290 1 1 2 3 7 2 0 290 0 0 1 1 3 0 0 12
0 0 0 9 6 20 12 3 490 0 1 0 2 1 0 0 150 1 2 6 12 16 9 3 780 0 0 2 2 3 0 0 170 1 0 1 0 0 0 0 10
0 0 0 1 5 2 1 0 210 0 0 5 7 6 5 0 430 0 1 0 1 3 2 0 90 0 0 2 1 2 2 0 130 2 1 6 6 7 6 0 42
0 0 0 1 2 2 3 0 80 0 0 10 1 2 0 1 160 0 0 0 1 6 1 0 130 0 0 2 0 3 1 0 200 1 0 3 6 6 4 0 28
1 1 0 1 2 7 4 0 220 0 0 1 3 1 0 0 51 2 2 18 12 33 10 2 1420 1 0 16 0 6 3 0 170 2 1 2 0 0 7 0 21
0 1 2 5 4 11 8 2 780 0 0 0 1 4 2 0 110 0 0 0 0 1 0 0 50 0 0 1 1 3 1 1 160 1 5 13 4 30 10 2 104
0 0 0 2 2 3 0 1 92 18 30 70 70 228 104 37 8760 0 1 7 2 9 5 0 130 10 13 21 19 94 41 28 3870 0 0 0 0 0 0 1 4
0 0 0 0 3 0 2 0 140 0 0 0 0 2 1 0 150 0 0 0 2 5 2 0 160 0 0 0 1 1 0 0 50 0 0 1 1 4 0 0 13
0 1 0 2 4 8 3 0 670 1 0 2 1 6 3 0 130 0 0 0 2 1 1 0 50 0 0 0 2 3 2 0 80 0 0 0 0 0 0 0 0
0 0 0 1 0 2 0 0 100 0 0 0 1 1 0 0 40 0 0 2 4 5 3 2 190 0 0 0 0 0 2 0 91 9 3 41 42 41 25 35 231
0 0 0 0 1 0 0 0 0
0 8 2 20 41 64 25 3 2851 12 7 68 55 105 43 7 5281 22 10 68 103 194 85 20 8892 11 24 81 59 184 90 23 7786 49 65 235 188 579 301 126 2,546
* The ICD-10 codes associated with each category are listed in Appendix 4.

County of Life County of Life
Residence Expectancy Residence Expectancy
Kansas 76.1
Allen 74.4 Lyon 76.0
Anderson 75.1 McPherson 76.1
Atchison 74.8 Marion 75.8
Barber 74.5 Marshall 76.7
Barton 75.8 Meade 75.6
Bourbon 74.0 Miami 76.2
Brown 75.3 Mitchell 76.4
Butler 75.4 Montgomery 73.4
Chase 74.8 Morris 76.9
Chautauqua 72.9 Morton 72.8
Cherokee 73.9 Nemaha 76.8
Cheyenne 78.7 Neosho 75.2
Clark 73.7 Ness 73.1
Clay 75.4 Norton 75.3
Cloud 75.1 Osage 74.3
Coffey 76.1 Osborne 72.8
Comanche 71.0 Ottawa 75.5
Cowley 73.7 Pawnee 74.8
Crawford 74.7 Phillips 75.8
Decatur 77.5 Pottawatomie 76.9
Dickinson 75.5 Pratt 74.7
Doniphan 77.0 Rawlins 75.0
Douglas 77.7 Reno 75.0
Edwards 77.4 Republic 72.9
Elk 71.9 Rice 73.8
Ellis 76.8 Riley 78.2
Ellsworth 75.3 Rooks 75.7
Finney 76.6 Rush 75.6
Ford 76.3 Russell 76.8
Franklin 75.7 Saline 75.6
Geary 74.1 Scott 77.5
Gove 75.1 Sedgwick 75.3
Graham 77.0 Seward 76.6
Grant 76.6 Shawnee 75.1
Gray 76.4 Sheridan 75.9
Greeley 72.3 Sherman 74.7
Greenwood 72.6 Smith 75.7
Hamilton 75.4 Stafford 74.1
Harper 72.9 Stanton 78.0
Harvey 76.1 Stevens 75.8
Haskell 77.9 Sumner 75.4
Hodgeman 76.1 Thomas 77.2
Jackson 75.9 Trego 75.2
Jefferson 75.8 Wabaunsee 77.4
Jewell 77.6 Wallace 77.5
Johnson 78.9 Washington 76.5
Kearny 76.2 Wichita 76.5
Kingman 75.9 Wilson 72.9
Kiowa 77.5 Woodson 73.5
Labette 73.3 Wyandotte 73.8
Lane 75.5 Peer Group
Leavenworth 76.5 Frontier 75.2
Lincoln 77.2 Rural 75.6
Linn 74.0 Densely -Settled Rural 75.5
Logan 78.0 Semi-Urban 75.6
Urban 76.6
* See Technical Notes for Peer Group definition.
Table E28Life-Expectancy at Birth by County of Residence and Peer Group*
2013-2017

City of 5-Year
Residence Rate Rate Rate Rate Rate Rate
Abilene 92 1,380.3 92 1,396.1 108 1,646.8 113 1,746.8 88 1,379.3 1,509.4
Andover 110 896.9 99 791.4 92 721.9 105 808.9 102 778.0 798.6Arkansas City 160 1,300.3 165 1,351.9 167 1,376.1 175 1,450.7 147 1,238.8 1,343.8Atchison 120 1,098.4 126 1,169.8 145 1,353.6 143 1,339.1 122 1,147.0 1,221.1
Augusta 105 1,140.9 120 1,298.4 108 1,161.4 111 1,190.9 130 1,384.6 1,235.6Baldwin City 46 1,013.2 42 916.0 47 1,006.6 44 940.8 48 1,033.6 982.0Basehor 43 877.9 39 761.9 46 851.5 40 707.8 57 947.6 830.7Baxter Springs 55 1,333.7 51 1,252.1 65 1,613.7 39 984.1 54 1,364.3 1,310.4
Bel Aire 57 824.2 67 919.8 72 968.4 69 900.7 72 909.8 905.7Beloit 63 1,638.1 39 1,028.5 53 1,398.4 47 1,247.0 64 1,725.1 1,406.9Bonner Springs 70 935.8 72 953.3 72 946.6 69 900.2 54 693.7 884.8Burlington 53 2,015.2 24 910.8 45 1,720.8 33 1,264.4 39 1,527.6 1,487.4
Chanute 117 1,264.2 137 1,473.9 110 1,188.9 112 1,225.5 111 1,226.0 1,276.2Clay Center 70 1,651.3 77 1,843.4 85 2,036.9 77 1,892.4 57 1,432.2 1,773.4Coffeyville 147 1,477.5 134 1,356.8 156 1,613.4 164 1,719.3 189 1,993.5 1,628.4Colby 62 1,144.8 62 1,150.7 74 1,366.1 49 904.2 46 858.0 1,085.1
Columbus 44 1,365.2 54 1,694.9 43 1,366.8 56 1,804.1 54 1,744.2 1,593.1Concordia 80 1,520.6 80 1,506.3 97 1,858.9 81 1,564.0 75 1,470.9 1,584.3Derby 176 763.7 216 929.7 205 872.0 215 909.7 201 849.1 865.1De Soto 69 1,167.3 43 712.2 55 905.5 39 642.4 38 622.2 807.9
Dodge City 173 614.4 176 626.0 179 641.3 171 622.9 194 699.9 640.8Edwardsville 61 1,400.7 51 1,164.4 50 1,139.0 47 1,070.6 69 1,534.0 1,262.9El Dorado 174 1,353.9 166 1,288.9 177 1,368.8 172 1,308.9 174 1,339.2 1,331.9Ellsworth 48 1,560.0 32 1,040.3 50 1,635.6 31 1,017.4 47 1,539.0 1,358.5
Emporia 225 907.3 201 818.4 220 892.5 182 733.4 207 837.2 837.7Eudora 43 692.3 60 951.9 50 783.9 36 564.4 47 742.6 746.8Eureka 51 2,018.2 51 2,052.3 59 2,408.2 61 2,531.1 67 2,790.5 2,354.8Fairway 22 555.1 12 302.3 16 403.0 18 453.2 22 556.0 453.8
Fort Scott 138 1,739.3 124 1,574.8 140 1,786.2 122 1,569.5 141 1,804.7 1,695.0Frontenac 46 1,340.3 46 1,335.7 59 1,724.1 44 1,288.8 45 1,318.5 1,401.5Galena 58 1,937.2 66 2,225.2 42 1,433.4 42 1,455.3 45 1,551.7 1,723.9Garden City 174 645.3 158 585.1 181 670.2 169 631.8 181 673.0 641.1
Gardner 83 405.4 84 406.4 102 488.8 99 469.0 125 579.2 470.9Garnett 49 1,481.7 46 1,396.1 51 1,565.4 61 1,868.9 59 1,813.7 1,624.2Girard 36 1,295.4 49 1,767.0 36 1,304.3 42 1,528.4 32 1,182.6 1,416.5Goddard 41 894.8 47 1,001.7 36 762.9 66 1,401.3 38 800.7 972.3
Goodland 71 1,558.0 50 1,097.9 69 1,548.1 57 1,283.5 49 1,110.9 1,320.2Great Bend 174 1,094.3 172 1,085.9 179 1,138.9 184 1,184.4 183 1,192.6 1,138.7Hays 187 888.9 179 850.6 194 919.8 189 898.8 188 901.9 892.0Haysville 122 1,108.7 109 980.9 113 1,007.8 127 1,129.4 115 1,019.7 1,049.2
Herington 34 1,388.3 33 1,367.6 33 1,377.3 21 889.1 36 1,543.7 1,313.6Hesston 59 1,579.2 61 1,633.6 46 1,206.4 48 1,262.2 56 1,480.7 1,431.0Hiawatha 64 2,013.8 44 1,415.7 50 1,615.5 46 1,500.8 57 1,811.2 1,673.8Hillsboro 44 1,515.7 54 1,866.6 61 2,126.2 45 1,558.7 41 1,438.6 1,701.2
Hoisington 25 931.1 30 1,126.1 29 1,105.6 29 1,121.4 32 1,250.5 1,105.4Holton 66 2,013.4 55 1,658.6 68 2,084.0 50 1,522.1 66 2,020.8 1,858.8Hugoton 31 779.1 46 1,159.9 42 1,059.5 37 964.8 41 1,070.2 1,006.4Hutchinson 544 1,298.7 534 1,282.4 512 1,231.7 484 1,171.6 526 1,290.1 1,254.9
Independence 142 1,538.5 136 1,484.4 138 1,540.5 142 1,613.8 123 1,409.1 1,517.4Iola 92 1,639.1 94 1,692.8 84 1,535.6 82 1,503.5 72 1,344.8 1,545.0Junction City 168 661.7 155 628.4 180 731.1 187 773.4 172 748.2 707.5Kansas City 1,233 830.4 1,225 818.7 1,232 814.2 1,229 810.1 1,238 809.5 816.5
2017
Number
Year
by Number and Crude Rate*
Table E29Deaths by Selected City of Residence
Kansas, 2013-2017
2013 2016
Number
2015
Number Number
2014
Number

City of 5-Year
Residence Rate Rate Rate Rate Rate Rate
2017
Number
Year
by Number and Crude Rate*
Table E29Deaths by Selected City of Residence
Kansas, 2013-2017
2013 2016
Number
2015
Number Number
2014
Number
Kingman 50 1,583.3 61 1,971.6 51 1,652.6 52 1,733.3 43 1,468.1 1,683.4Lansing 64 549.7 68 580.6 76 645.9 113 953.7 77 644.5 675.5Larned 50 1,235.8 69 1,715.1 63 1,588.1 55 1,410.3 80 2,075.2 1,601.7Lawrence 489 538.5 500 539.0 532 566.5 483 506.5 607 626.5 555.8
Leavenworth 273 760.6 271 752.8 256 711.5 287 793.8 272 751.2 754.0Leawood 243 736.6 252 732.7 254 734.5 233 674.1 280 807.9 737.2Lenexa 357 709.1 346 677.9 349 664.9 378 714.5 438 817.9 717.5Liberal 116 553.5 132 628.2 113 544.7 126 619.2 106 534.7 576.3
Lindsborg 51 1,465.1 53 1,541.6 51 1,507.5 46 1,378.1 48 1,468.8 1,472.7Louisburg 41 953.7 39 902.4 54 1,262.9 41 935.6 36 802.3 969.4Lyons 51 1,364.7 51 1,364.7 58 1,557.0 43 1,171.3 45 1,262.3 1,345.3McPherson 160 1,201.0 158 1,198.0 157 1,194.5 134 1,017.9 162 1,227.2 1,167.8
Maize 18 470.8 17 417.4 17 389.7 24 540.8 26 570.6 479.9Manhattan 256 456.0 242 431.5 256 454.6 304 552.9 292 532.5 485.0Marysville 51 1,547.8 46 1,396.1 45 1,354.2 44 1,335.8 58 1,773.2 1,480.8Merriam 118 1,046.0 103 912.3 109 965.6 82 729.2 88 784.9 887.8
Mission 102 1,071.9 67 705.2 96 1,011.5 94 995.4 86 914.0 939.6Mission Hills 18 502.5 16 444.8 20 555.4 19 527.8 12 335.9 473.5Mulvane 49 779.4 55 874.5 78 1,235.4 66 1,045.0 68 1,069.4 1,001.1Newton 217 1,135.1 228 1,192.5 229 1,191.7 223 1,167.2 216 1,144.7 1,166.3
Norton 44 1,527.8 49 1,721.7 45 1,583.9 58 2,062.6 43 1,549.5 1,688.6Olathe 681 516.4 684 514.0 722 537.6 698 515.2 770 560.1 528.9Osage City 44 1,517.8 60 2,096.4 54 1,898.7 46 1,621.4 54 1,931.3 1,812.1Osawatomie 51 1,163.1 53 1,216.4 54 1,256.7 52 1,207.1 70 1,628.7 1,293.6
Ottawa 144 1,153.7 146 1,177.1 140 1,130.2 151 1,222.1 147 1,191.1 1,174.8Overland Park 1,267 699.0 1,253 679.0 1,315 705.0 1,298 686.9 1,347 704.2 694.9Paola 78 1,385.4 95 1,698.6 70 1,266.5 94 1,688.2 89 1,595.0 1,527.0Park City 37 493.4 34 450.0 39 511.9 44 576.5 45 582.2 523.2
Parsons 152 1,495.5 161 1,582.5 147 1,456.9 145 1,463.8 138 1,413.8 1,483.2Phillipsburg 42 1,652.9 33 1,291.1 43 1,703.6 40 1,572.9 41 1,632.2 1,569.9Pittsburg 189 926.6 198 970.9 230 1,127.0 213 1,045.9 216 1,068.5 1,027.7Prairie Village 189 863.3 175 799.9 181 827.4 161 738.4 189 845.0 815.0
Pratt 109 1,560.3 83 1,192.0 90 1,314.1 94 1,388.3 88 1,304.1 1,352.1Roeland Park 46 672.0 40 584.8 42 615.2 45 663.1 40 590.7 625.2Rose Hill 36 913.2 32 808.1 37 926.2 42 1,046.1 28 703.5 879.8Russell 61 1,363.1 68 1,516.5 65 1,433.6 65 1,444.4 79 1,770.1 1,505.2
Sabetha 45 1,752.3 49 1,911.1 47 1,818.2 44 1,702.8 55 2,140.9 1,864.8St Marys 22 821.8 26 976.0 24 901.6 27 1,013.5 28 1,058.6 954.0Salina 494 1,032.5 484 1,011.1 483 1,010.2 460 971.8 560 1,191.6 1,043.1Scott City 39 1,002.8 40 1,018.6 34 885.9 51 1,311.1 43 1,116.6 1,067.3
Shawnee 389 604.8 429 664.1 447 687.2 405 621.2 382 583.1 632.0Spring Hill 43 750.4 59 1,000.7 52 869.4 44 713.6 42 634.6 789.7Tonganoxie 55 1,064.9 54 1,040.1 55 1,048.0 46 863.7 59 1,083.8 1,019.9Topeka 1,414 1,107.5 1,525 1,198.8 1,565 1,229.7 1,519 1,197.9 1,569 1,239.5 1,194.5
Ulysses 37 589.7 45 730.5 39 639.7 43 712.5 49 828.8 698.9Valley Center 50 713.2 43 609.3 59 816.9 54 735.4 58 794.5 734.7Wamego 56 1,216.6 38 830.1 45 972.6 42 890.8 54 1,148.2 1,011.8
Wellington 110 1,380.7 101 1,271.7 96 1,202.0 97 1,229.6 120 1,534.1 1,323.0Wichita 3,293 851.9 3,445 886.9 3,523 903.4 3,555 911.8 3,569 913.7 893.6Winfield 198 1,605.4 159 1,297.1 190 1,556.9 151 1,229.2 175 1,445.8 1,426.9
*Rate per 100,000 population, based on US Census Bureau Estimates.

F. MARRIAGES AND
MARRIAGE DISSOLUTIONS

Year Number Rate Year Number Rate
1968 21,748 9.6 1968 7,144 3.2
1969 22,304 9.8 1969 7,956 3.5
1970 22,421 10.0 1970 8,785 3.9
1971 22,528 10.0 1971 9,461 4.2
1972 23,879 10.5 1972 9,925 4.4
1973 24,592 10.7 1973 10,472 4.6
1974 24,491 10.6 1974 11,484 5.1
1975 23,767 10.3 1975 12,561 5.5
1976 23,559 10.1 1976 12,833 5.6
1977 23,673 10.1 1977 12,629 5.4
1978 23,975 10.2 1978 12,668 5.4
1979 24,774 10.5 1979 12,749 5.4
1980 24,847 10.5 1980 13,410 5.7
1981 26,137 10.9 1981 13,737 5.8
1982 26,670 11.1 1982 12,392 5.1
1983 25,877 10.7 1983 12,207 5.0
1984 24,737 10.1 1984 12,905 5.3
1985 23,281 9.3 1985 12,794 5.2
1986 22,667 9.2 1986 12,364 5.0
1987 22,220 9.0 1987 12,218 4.9
1988 22,705 9.1 1988 12,475 5.0
1989 22,214 8.8 1989 12,296 4.9
1990 22,720 9.2 1990 12,580 5.1
1991 21,786 8.7 1991 12,590 5.0
1992 21,845 8.7 1992 12,365 4.9
1993 21,527 8.5 1993 12,068 4.8
1994 21,524 8.4 1994 11,659 4.6
1995 21,057 8.2 1995 11,029 4.3
1996 20,657 8.0 1996 10,779 4.2
1997 20,537 7.9 1997 10,618 4.1
1998 20,403 7.8 1998 10,363 3.9
1999 20,905 7.9 1999 9,926 3.7
2000 20,426 7.6 2000 10,105 3.8
2001 20,457 7.6 2001 9,885 3.7
2002 19,783 7.3 2002 9,654 3.6
2003 18,722 6.9 2003 8,644 3.2
2004 19,174 7.0 2004 8,759 3.2
2005 18,745 6.8 2005 8,476 3.1
2006 18,836 6.8 2006 9,145 3.3
2007 18,910 6.8 2007 9,347 3.4
2008 18,717 6.7 2008 9,818 3.5
2009 18,268 6.5 2009 10,333 3.7
2010 18,150 6.4 2010 10,579 3.7
2011 17,897 6.2 2011 10,445 3.6
2012 18,154 6.3 2012 9,782 3.4
2013 17,328 6.0 2013 9,085 3.1
2014 17,655 6.1 2014 8,441 2.9
2015 17,595 6.0 2015 8,036 2.8
2016 17,948 6.2 2016 7,198 2.52017 17,274 5.9 2017 6,494 2.2
* Rates are per 1000 population.
Table F1Marriages and Marriage Dissolutions
by Number and Rate*, Kansas Occurrence, 1968-2017
Marriage Marriage Dissolutions

*1913-1919 not available, 1991-2016 Rates Provisional, 2017 Rates not yet available.
*1991-2016 Rates Provisional, 2017 Rates not yet available.
US rates from 2000 forward based on fewer than 50 states.
Figure F2
Figure F1
0
5
10
15
20
25
30
35
40
45
1913 1923 1933 1943 1953 1963 1973 1983 1993 2003 2013
Rat
e pe
r 1,
000
popu
latio
n
Year
Marriage RatesKansas and the U.S., 1913-2017
Kansas
U.S.*
0
1
2
3
4
5
6
1951 1956 1961 1966 1971 1976 1981 1986 1991 1996 2001 2006 2011 2016
Rat
e pe
r 1,
000
popu
latio
n
Year
Marriage Dissolution RatesKansas and the U.S., 1951-2017
Kansas
U.S. *

Population Group White Black Native American Asian/Pacific Other* Hispanic
of Groom Total Non-Hispanic Non-Hispanic Non-Hispanic Non-Hispanic Non-Hispanic Any Race n.s.
Total 17,274 12,430 836 97 520 461 2,870 60
White Non-Hispanic 12,247 10,926 103 62 206 228 705 17
Black Non-Hispanic 1,129 290 644 6 23 67 94 5
88 60 2 14 1 1 10 0
369 70 7 0 255 12 25 0
Other Non-Hispanic* 474 258 34 2 13 109 57 1
Hispanic Any Race 2,905 807 42 13 22 44 1,973 4
n.s. 62 19 4 0 0 0 6 33
* Includes selection of two or more races or other non-specified race
Population Group White Black Native American Asian/Pacific Other* Hispanic
of Husband Total Non-Hispanic Non-Hispanic Non-Hispanic Non-Hispanic Non-Hispanic Any Race n.s.
Total 6,494 4,906 375 31 152 72 682 276
White Non-Hispanic 4,711 4,385 32 21 46 29 157 41
Black Non-Hispanic 513 137 317 2 10 17 25 5
30 22 3 2 0 0 1 2
126 39 2 0 76 1 5 3
Other Non-Hispanic* 67 31 7 0 3 15 8 3
Hispanic Any Race 767 237 12 6 15 9 477 11
n.s. 280 55 2 0 2 1 9 211
* Includes selection of two or more races or other non-specified race
Native American Non-Hispanic
Asian/Pacific Non-Hispanic
Kansas, 2017
Population Group of Wife
Kansas, 2017Marriages by Population Group of Groom by Population Group of Bride
Table F2
Population Group of Bride
Table F3Marriage Dissolutions by Population Group of Husband by Population Group of Wife
Native American Non-Hispanic
Asian/Pacific Non-Hispanic

Figure F3
Premarital Status Never
of Groom Total Married Divorced Annulled Widowed n.s.
Total 17,274 11,928 4,849 86 410 1
Never Married 11,974 10,205 1,667 34 67 1
Divorced 4,772 1,620 2,920 39 193 0
Annulled 91 44 35 9 3 0
Widowed 436 59 227 4 146 0
n.s. 1 0 0 0 1 0
Number of Marriages by Month
Kansas, 2017
Premarital Status of Bride
Table F4Marriages by Premarital Status of Groom
by Premarital Status of BrideKansas, 2017
812 857
1,222
1,402
1,641
1,897
1,682
1,378
2,019 1,991
1,2341,139
0
500
1,000
1,500
2,000
2,500
Jan Feb Mar Apr May Jun Jul Aug Sep Oct Nov Dec
Nu
mbe
r
Month

Age-Group 75 &
of Groom Total 15-19 20-24 25-29 30-34 35-39 40-44 45-49 50-54 55-59 60-64 65-69 70-74 Over n.s.
Total 17,274 825 4,689 4,431 2,410 1,501 1,008 813 613 432 272 145 79 56 0
15-19 387 249 120 14 1 2 1 0 0 0 0 0 0 0 0
20-24 3,684 473 2,662 421 79 30 11 2 4 1 0 0 0 1 0
25-29 4,497 79 1,505 2,337 429 90 40 11 3 1 2 0 0 0 0
30-34 2,793 12 277 1,150 954 295 68 26 9 1 1 0 0 0 0
35-39 1,766 8 68 347 600 510 158 53 16 3 2 1 0 0 0
40-44 1,146 3 30 97 213 330 312 122 26 11 1 1 0 0 0
45-49 922 0 10 36 84 160 243 251 101 30 6 1 0 0 0
50-54 710 0 7 17 27 44 108 198 200 80 16 8 3 2 0
55-59 565 0 8 7 11 32 41 107 151 144 54 9 0 1 0
60-64 369 0 1 3 6 4 17 29 66 105 109 20 8 1 0
65-69 213 1 1 2 5 2 9 9 20 39 48 55 18 4 0
70-74 116 0 0 0 1 2 0 4 10 10 20 34 26 9 0
75 & Over 106 0 0 0 0 0 0 1 7 7 13 16 24 38 0
n.s. 0 0 0 0 0 0 0 0 0 0 0 0 0 0 0
Table F5Marriages by Age-Group of Groom by Age-Group of Bride
Kansas, 2017
Age-Group of Bride

Average Age at MarriageKansas, 1998-2017
Figure F4
22
24
26
28
30
32
34
36
38
40
42
44
1998 2000 2002 2004 2006 2008 2010 2012 2014 2016
Age
in Y
ears
Year
Bride
Total First Remarriage
24
26
28
30
32
34
36
38
40
42
44
46
1998 2000 2002 2004 2006 2008 2010 2012 2014 2016
Age
in Y
ears
Year
Groom
Total First Remarriage

Age-Group 75 &
of Husband Total 15-19 20-24 25-29 30-34 35-39 40-44 45-49 50-54 55-59 60-64 65-69 70-74 Over n.s.
Total 6,494 29 552 1,016 1,090 1,060 829 668 474 330 195 99 23 30 99
15-19 10 3 6 0 0 0 0 0 0 0 1 0 0 0 0
20-24 360 22 268 54 8 2 1 2 0 0 0 0 0 0 3
25-29 843 2 224 477 94 25 8 5 0 1 1 0 0 0 6
30-34 1,078 2 36 339 493 152 32 10 5 0 1 0 0 0 8
35-39 1,044 0 9 92 330 460 99 25 16 1 0 0 0 0 12
40-44 860 0 4 28 101 266 325 90 19 14 2 0 0 0 11
45-49 728 0 1 10 34 85 228 259 66 23 5 2 0 1 14
50-54 553 0 0 3 10 36 75 173 174 56 14 3 0 1 8
55-59 439 0 1 4 4 11 33 78 124 135 39 7 0 1 2
60-64 250 0 0 0 3 6 10 21 39 61 75 26 1 1 7
65-69 137 0 0 1 0 2 4 3 17 20 40 44 3 1 2
70-74 55 0 0 0 2 2 0 1 6 8 9 13 12 1 1
75 & Over 48 0 0 0 0 0 1 1 1 4 6 4 7 24 0
n.s. 89 0 3 8 11 13 13 0 7 7 2 0 0 0 25
Table F6Marriage Dissolutions by Age-Group of Husband by Age-Group of Wife
Kansas, 2017
Age-Group of Wife

0
5
10
15
20
25
30
35
40
45
1998 2000 2002 2004 2006 2008 2010 2012 2014 2016
Age
in Y
ears
Year
Average Age at Marriage DissolutionKansas, 1998-2017
Wife
Husband
Figure F5

Duration of
Marriage Total Divorces Annulments
Total 6,494 6,402 92
Under 1 211 168 43
1 467 442 25
2 469 466 3
3 459 457 2
4 440 435 5
5 421 421 0
6 365 362 3
7 354 352 2
8 288 288 0
9 270 267 3
10 258 258 0
11 216 216 0
12 196 196 0
13 159 159 0
14 142 142 0
15 138 138 0
16 157 157 0
17 113 113 0
18 118 118 0
19 107 107 0
20-24 414 414 0
25-29 244 244 0
30-34 138 138 0
35-39 76 76 0
40 & Over 69 69 0
n.s. 205 199 6
Table F7Marriage Dissolutions
by Duration of Marriage in YearsKansas, 2017

Total
ChildrenAffected
Number of MinorChildren Reported Number Percent Number Percent Number*
Total 6,402 100 92 100.0 5,885
None 3,293 51.6 81 88.0 0
1 1,235 19.3 4 4.3 1,239
2 1,196 18.7 2 2.2 2,396
3 477 7.5 3 3.3 1,440
4 or More 185 2.9 2 2.2 810
n.s. 16 n/a 0 n/a 0
*Represents the number of children involved in marriages
ending in divorce or annulment.
Marriage DissolutionsPercent Distribution by Number of Minor Children
Kansas, 2017
Divorces Annulments
Table F8Marriage Dissolutions by Number of Minor Children Reported
and Number of Minor Children AffectedKansas, 2017
52.0
19.1 18.4
7.4
2.10.6 0.1 0.0 0.0 0.0 0.2
0
10
20
30
40
50
60
None 1 2 3 4 5 6 7 8 9 &Over
n.s.
Per
cent
Number Children Reported
Figure F6

County of 5-Year
Marriage Number Rate Number Rate Number Rate Number Rate Number Rate Rate
Kansas 17,328 6.0 17,655 6.1 17,595 6.0 17,948 6.2 17274 5.9 6.0
Allen 67 5.1 64 5.0 59 4.6 59 4.6 56 4.5 4.8Anderson 36 4.6 53 6.7 31 4.0 40 5.1 34 4.3 4.9Atchison 96 5.7 84 5.1 90 5.5 79 4.8 77 4.7 5.2Barber 30 6.1 39 8.0 36 7.5 31 6.6 22 4.8 6.6Barton 168 6.1 192 7.0 176 6.5 171 6.4 156 5.9 6.4
Bourbon 88 5.9 101 6.8 109 7.4 95 6.5 87 5.9 6.5Brown 66 6.6 62 6.3 63 6.4 48 5.0 58 6.0 6.1Butler 415 6.3 424 6.4 404 6.1 428 6.4 453 6.8 6.4Chase 23 8.5 35 13.0 33 12.3 33 12.4 39 14.5 12.1Chautauqua 28 7.9 21 6.0 20 5.9 19 5.6 18 5.4 6.2
Cherokee 104 5.0 85 4.1 107 5.2 87 4.3 72 3.6 4.4Cheyenne 18 6.7 15 5.6 8 3.0 11 4.1 5 1.9 4.3Clark 12 5.5 13 6.1 7 3.3 7 3.4 4 2.0 4.1Clay 53 6.3 46 5.5 45 5.4 58 7.1 61 7.7 6.4Cloud 45 4.8 58 6.2 53 5.7 48 5.2 51 5.7 5.5
Coffey 61 7.3 53 6.3 50 6.0 47 5.6 43 5.2 6.1Comanche 12 6.1 8 4.1 12 6.5 7 3.8 8 4.5 5.0Cowley 232 6.4 228 6.3 214 6.0 212 5.9 212 6.0 6.1Crawford 182 4.6 209 5.3 219 5.6 210 5.4 216 5.5 5.3Decatur 20 6.8 18 6.2 12 4.1 15 5.3 17 5.9 5.7
Dickinson 123 6.3 139 7.2 130 6.7 108 5.7 108 5.7 6.3Doniphan 44 5.6 35 4.4 29 3.7 31 4.0 30 3.9 4.3Douglas 728 6.4 899 7.7 812 6.9 792 6.6 758 6.3 6.8Edwards 17 5.8 21 6.9 13 4.4 16 5.4 13 4.5 5.4Elk 12 4.5 14 5.2 15 5.8 7 2.7 17 6.8 5.0
Ellis 216 7.4 170 5.9 170 5.9 168 5.8 169 5.9 6.2Ellsworth 42 6.6 39 6.1 38 6.0 25 4.0 40 6.3 5.8Finney 229 6.2 242 6.5 223 6.0 288 7.8 262 7.1 6.7Ford 253 7.3 256 7.4 244 7.1 286 8.4 249 7.2 7.5Franklin 136 5.3 154 6.0 144 5.6 149 5.8 126 4.9 5.5
Geary 603 16.1 527 14.4 535 14.4 500 14.1 484 14.3 14.7Gove 15 5.4 9 3.3 14 5.3 7 2.7 5 1.9 3.7Graham 12 4.6 10 3.9 15 5.8 14 5.5 11 4.4 4.8Grant 58 7.3 42 5.4 35 4.5 28 3.7 19 2.5 4.7Gray 32 5.3 38 6.2 26 4.2 26 4.3 25 4.2 4.9
Greeley 6 4.7 5 3.8 2 1.5 10 7.7 11 8.8 5.3Greenwood 56 8.7 31 4.9 37 5.9 32 5.2 32 5.2 6.0Hamilton 17 6.5 14 5.4 8 3.2 5 2.0 12 4.5 4.4Harper 26 4.4 28 4.8 28 4.8 30 5.3 34 6.1 5.1Harvey 212 6.1 209 6.0 230 6.6 240 6.9 220 6.4 6.4
Haskell 20 4.8 15 3.7 30 7.4 17 4.2 16 3.9 4.8Hodgeman 3 1.5 6 3.1 7 3.7 5 2.7 14 7.6 3.7Jackson 77 5.8 66 4.9 66 4.9 71 5.3 43 3.2 4.8Jefferson 110 5.8 97 5.1 95 5.0 165 8.7 142 7.5 6.4Jewell 18 5.9 19 6.2 13 4.4 19 6.5 16 5.6 5.7
Johnson 2,430 4.3 2,588 4.5 2,586 4.5 2,795 4.8 2598 4.4 4.5Kearny 23 5.9 18 4.6 18 4.6 18 4.6 20 5.1 4.9Kingman 41 5.2 41 5.3 49 6.4 43 5.8 39 5.3 5.6Kiowa 15 5.9 24 9.6 13 5.1 14 5.6 12 4.8 6.2Labette 115 5.5 96 4.6 104 5.0 86 4.2 89 4.4 4.7
Lane 7 4.1 4 2.4 4 2.4 9 5.5 3 1.9 3.3Leavenworth 455 5.8 465 5.9 506 6.4 504 6.3 495 6.1 6.1Lincoln 13 4.1 16 5.1 17 5.5 20 6.5 14 4.6 5.1Linn 39 4.1 41 4.3 49 5.1 65 6.8 73 7.5 5.6Logan 25 8.9 9 3.2 16 5.7 19 6.7 17 6.0 6.1
2017
Marriages by County of Marriage and Peer Group*
2014 20152013
Table F9
Kansas, 2013-2017
2016
by Number and Rate†

County of 5-Year
Marriage Number Rate Number Rate Number Rate Number Rate Number Rate Rate
2017
Marriages by County of Marriage and Peer Group*
2014 20152013
Table F9
Kansas, 2013-2017
2016
by Number and Rate†
Lyon 190 5.7 186 5.6 193 5.8 199 5.9 197 5.9 5.8McPherson 175 5.9 199 6.8 175 6.0 179 6.2 160 5.6 6.1Marion 67 5.5 60 4.9 52 4.3 57 4.7 52 4.3 4.8Marshall 71 7.1 59 5.9 47 4.7 64 6.5 50 5.1 5.9Meade 21 4.8 23 5.3 21 4.8 19 4.5 21 4.9 4.9
Miami 227 6.9 231 7.0 215 6.6 209 6.3 216 6.5 6.7Mitchell 42 6.6 44 7.0 37 5.9 26 4.2 28 4.6 5.7Montgomery 189 5.5 203 6.0 199 6.0 209 6.4 174 5.3 5.8Morris 34 5.9 45 7.9 41 7.3 30 5.4 30 5.5 6.4Morton 17 5.4 12 3.9 11 3.7 16 5.6 16 5.8 4.8
Nemaha 61 6.0 98 9.7 75 7.3 63 6.2 60 5.9 7.0Neosho 99 6.0 115 7.0 98 6.0 100 6.2 108 6.7 6.4Ness 14 4.6 11 3.5 8 2.7 14 4.7 18 6.3 4.3Norton 36 6.4 36 6.5 34 6.1 28 5.1 31 5.7 6.0Osage 78 4.8 87 5.5 69 4.4 67 4.2 65 4.1 4.6
Osborne 18 4.7 15 4.0 19 5.2 22 6.0 20 5.5 5.1Ottawa 25 4.1 20 3.3 24 4.0 29 4.9 26 4.4 4.2Pawnee 29 4.2 42 6.1 47 6.9 35 5.2 27 4.0 5.3Phillips 28 5.1 29 5.2 31 5.7 26 4.8 30 5.6 5.3Pottawatomie 91 4.0 104 4.5 83 3.6 113 4.8 112 4.7 4.3
Pratt 55 5.6 60 6.1 61 6.3 45 4.7 49 5.1 5.6Rawlins 18 7.0 11 4.3 11 4.4 17 6.7 16 6.4 5.7Reno 416 6.5 392 6.1 428 6.7 396 6.3 423 6.8 6.5Republic 28 5.8 23 4.8 26 5.5 30 6.4 23 4.9 5.5Rice 38 3.8 36 3.6 41 4.1 56 5.7 55 5.7 4.6
Riley 740 9.8 731 9.7 768 10.2 766 10.4 692 9.3 9.9Rooks 32 6.2 20 3.9 24 4.6 28 5.5 32 6.3 5.3Rush 8 2.5 18 5.6 13 4.2 12 3.9 8 2.6 3.8Russell 35 5.0 50 7.2 33 4.7 19 2.7 48 6.9 5.3Saline 333 6.0 335 6.0 324 5.8 353 6.4 324 5.9 6.0
Scott 29 5.8 26 5.1 31 6.2 19 3.8 41 8.3 5.8Sedgwick 3,176 6.3 3,207 6.3 3,308 6.5 3,227 6.3 3209 6.2 6.3Seward 193 8.3 178 7.6 177 7.6 192 8.5 157 7.1 7.8Shawnee 1,037 5.8 1,066 6.0 1,072 6.0 1,077 6.0 995 5.6 5.9Sheridan 6 2.4 13 5.1 7 2.8 9 3.6 12 4.7 3.7
Sherman 42 6.9 40 6.5 44 7.4 21 3.5 41 6.9 6.2Smith 22 5.9 24 6.4 19 5.1 18 5.0 18 4.9 5.5Stafford 22 5.0 22 5.1 26 6.1 22 5.2 21 5.0 5.3Stanton 15 6.8 8 3.8 19 9.2 30 14.5 20 9.7 8.8Stevens 35 6.0 23 4.0 20 3.4 27 4.8 36 6.4 4.9
Sumner 168 7.1 186 7.9 175 7.4 156 6.7 140 6.0 7.0Thomas 51 6.4 58 7.4 68 8.6 75 9.5 39 5.0 7.4Trego 15 5.0 18 6.2 21 7.2 19 6.6 20 6.9 6.4Wabaunsee 35 5.0 38 5.4 36 5.2 48 7.0 46 6.7 5.8Wallace 18 11.5 15 10.0 18 11.9 6 4.0 4 2.6 8.0
Washington 43 7.6 36 6.4 38 6.8 39 7.0 42 7.7 7.1Wichita 12 5.5 12 5.5 19 8.8 12 5.7 11 5.2 6.1Wilson 58 6.4 59 6.5 38 4.3 42 4.8 41 4.7 5.4Woodson 21 6.5 17 5.4 25 8.0 11 3.5 25 7.9 6.3Wyandotte 1,130 7.0 1,119 6.9 1,157 7.1 1,354 8.3 1340 8.1 7.5
n.s. 1 n/a 0 n/a 0 n/a 0 n/a 0 n/a n/a
Peer GroupFrontier 662 5.9 611 5.5 600 5.4 583 5.4 588 5.4 5.5Rural 1,340 5.7 1,375 5.9 1,302 5.6 1,244 5.4 1272 5.5 5.6Densely -Settled Rural 2,916 6.1 2,910 6.1 2,786 5.9 2,912 6.2 2691 5.8 6.0Semi-Urban 3,453 7.4 3,415 7.4 3,466 7.5 3,460 7.5 3328 7.3 7.4Urban 8,956 5.6 9,344 5.8 9,441 5.8 9,749 6.0 9395 5.7 5.8
* See Technical Notes for Peer Group definition.† Rate per 1,000 population

County of 5-Year
Action Number Rate Number Rate Number Rate Number Rate Number Rate Rate
Kansas 9,085 3.1 8,441 2.9 8,036 2.8 7,198 2.5 6,494 2.2 2.7
Allen 30 2.3 32 2.5 26 2.0 43 3.4 28 2.2 2.5Anderson 25 3.2 30 3.8 26 3.3 35 4.5 46 5.9 4.1Atchison 56 3.3 34 2.1 36 2.2 29 1.8 29 1.8 2.2Barber. 18 3.6 22 4.5 10 2.1 7 1.5 10 2.2 2.8Barton 60 2.2 66 2.4 73 2.7 74 2.8 72 2.7 2.6
Bourbon 60 4.0 35 2.4 50 3.4 55 3.8 48 3.3 3.4Brown 22 2.2 21 2.1 17 1.7 12 1.2 22 2.3 1.9Butler 143 2.2 129 1.9 148 2.2 141 2.1 132 2.0 2.1Chase 3 1.1 4 1.5 9 3.4 1 0.4 1 0.4 1.3Chautauqua 9 2.5 3 0.9 10 2.9 9 2.7 9 2.7 2.3
Cherokee 68 3.2 73 3.5 72 3.5 64 3.2 40 2.0 3.1Cheyenne 10 3.7 6 2.2 7 2.6 6 2.3 9 3.4 2.8Clark 5 2.3 1 0.5 5 2.4 2 1.0 4 2.0 1.6Clay 25 3.0 13 1.6 26 3.1 19 2.3 17 2.1 2.4Cloud 32 3.4 35 3.7 25 2.7 44 4.8 27 3.0 3.5
Coffey 85 10.1 75 8.9 115 13.7 103 12.2 137 16.7 12.3Comanche 4 2.0 2 1.0 5 2.7 0 0.0 4 2.2 1.6Cowley 160 4.4 144 4.0 143 4.0 104 2.9 97 2.7 3.6Crawford 109 2.8 96 2.4 112 2.9 84 2.1 77 2.0 2.4Decatur 5 1.7 4 1.4 8 2.7 9 3.2 6 2.1 2.2
Dickinson 79 4.0 82 4.2 81 4.2 67 3.5 73 3.9 4.0Doniphan 16 2.0 21 2.7 18 2.3 11 1.4 5 0.6 1.8Douglas 235 2.1 212 1.8 197 1.7 161 1.3 187 1.5 1.7Edwards 14 4.8 9 3.0 14 4.7 14 4.8 8 2.8 4.0Elk 6 2.3 10 3.7 4 1.5 2 0.8 7 2.8 2.2
Ellis 66 2.3 57 2.0 69 2.4 50 1.7 53 1.8 2.0Ellsworth 33 5.2 43 6.7 42 6.6 37 5.8 39 6.2 6.1Finney 78 2.1 62 1.7 77 2.1 99 2.7 76 2.0 2.1Ford 128 3.7 94 2.7 81 2.3 79 2.3 83 2.4 2.7Franklin 114 4.4 97 3.8 76 3.0 65 2.5 52 2.0 3.2
Geary 367 9.8 291 7.9 341 9.2 358 10.1 323 9.5 9.3Gove 4 1.4 9 3.3 5 1.9 5 1.9 7 2.7 2.2Graham 8 3.1 9 3.5 3 1.2 10 3.9 7 2.8 2.9Grant 20 2.5 21 2.7 22 2.8 18 2.4 15 2.0 2.5Gray 14 2.3 14 2.3 13 2.1 13 2.2 8 1.3 2.1
Greeley 5 3.9 4 3.1 4 3.0 4 3.1 1 0.8 2.8Greenwood 6 0.9 13 2.1 10 1.6 7 1.1 4 0.7 1.3Hamilton 9 3.4 7 2.7 7 2.8 10 3.9 4 1.5 2.9Harper 14 2.4 10 1.7 18 3.1 22 3.9 19 3.4 2.9Harvey 90 2.6 88 2.5 116 3.3 76 2.2 72 2.1 2.5
Haskell 4 1.0 5 1.2 7 1.7 5 1.2 8 2.0 1.4Hodgeman 8 4.1 6 3.1 4 2.1 3 1.6 6 3.3 2.9Jackson 26 1.9 22 1.6 13 1.0 20 1.5 11 0.8 1.4Jefferson 38 2.0 25 1.3 16 0.8 15 0.8 41 2.2 1.4Jewell 20 6.6 13 4.3 9 3.0 10 3.4 7 2.5 4.0
Johnson 1,317 2.3 1,229 2.1 939 1.6 805 1.4 760 1.3 1.7Kearny 11 2.8 13 3.3 9 2.3 11 2.8 6 1.5 2.5Kingman 35 4.5 15 1.9 19 2.5 19 2.5 16 2.2 2.7Kiowa 1 0.4 3 1.2 4 1.6 7 2.8 2 0.8 1.4Labette 52 2.5 44 2.1 57 2.7 48 2.3 47 2.3 2.4
Lane 7 4.1 11 6.5 10 6.0 6 3.7 8 5.1 5.1Leavenworth 277 3.5 261 3.3 244 3.1 225 2.8 210 2.6 3.1Lincoln 11 3.5 11 3.5 8 2.6 8 2.6 9 3.0 3.0Linn 37 3.9 28 2.9 36 3.8 32 3.3 41 4.2 3.6Logan 17 6.1 7 2.5 4 1.4 8 2.8 5 1.8 2.9
2016
Year
Table F10Marriage Dissolutions by County of Action and Peer Group*
by Number and Rate†
2017
Kansas, 2013-2017
2013 20152014

County of 5-Year
Action Number Rate Number Rate Number Rate Number Rate Number Rate Rate
2016
Year
Table F10Marriage Dissolutions by County of Action and Peer Group*
by Number and Rate†
2017
Kansas, 2013-2017
2013 20152014
Lyon 53 1.6 65 2.0 91 2.7 69 2.1 48 1.4 2.0McPherson 84 2.8 74 2.5 72 2.5 67 2.3 51 1.8 2.4Marion 21 1.7 18 1.5 20 1.7 16 1.3 15 1.3 1.5Marshall 26 2.6 26 2.6 24 2.4 27 2.7 15 1.5 2.4Meade 10 2.3 9 2.1 9 2.1 9 2.1 10 2.3 2.2
Miami 107 3.3 111 3.4 97 3.0 90 2.7 110 3.3 3.1Mitchell 21 3.3 17 2.7 19 3.0 11 1.8 10 1.6 2.5Montgomery 146 4.3 127 3.7 113 3.4 114 3.5 102 3.1 3.6Morris 14 2.4 14 2.5 8 1.4 13 2.3 12 2.2 2.2Morton 10 3.2 10 3.2 6 2.0 3 1.1 4 1.5 2.2
Nemaha 20 2.0 9 0.9 19 1.9 15 1.5 15 1.5 1.5Neosho 41 2.5 29 1.8 42 2.6 30 1.9 28 1.7 2.1Ness 7 2.3 17 5.5 8 2.7 14 4.7 7 2.4 3.5Norton 31 5.5 28 5.0 37 6.7 15 2.7 21 3.9 4.8Osage 62 3.8 64 4.0 45 2.8 41 2.6 39 2.5 3.2
Osborne 9 2.4 6 1.6 6 1.6 7 1.9 6 1.7 1.8Ottawa 15 2.5 11 1.8 13 2.2 19 3.2 9 1.5 2.2Pawnee 27 3.9 17 2.5 26 3.8 17 2.5 13 1.9 2.9Phillips 17 3.1 15 2.7 13 2.4 12 2.2 8 1.5 2.4Pottawatomie 64 2.8 47 2.1 35 1.5 31 1.3 22 0.9 1.7
Pratt 37 3.7 31 3.1 21 2.2 24 2.5 16 1.7 2.7Rawlins 7 2.7 8 3.1 8 3.2 6 2.4 6 2.4 2.8Reno 231 3.6 213 3.3 181 2.8 132 2.1 157 2.5 2.9Republic 17 3.5 11 2.3 15 3.2 17 3.6 13 2.8 3.1Rice 17 1.7 20 2.0 11 1.1 23 2.3 14 1.4 1.7
Riley 309 4.1 228 3.0 215 2.9 156 2.1 178 2.4 2.9Rooks 11 2.1 15 2.9 8 1.5 6 1.2 14 2.8 2.1Rush 9 2.8 10 3.1 8 2.6 8 2.6 4 1.3 2.5Russell 24 3.5 20 2.9 19 2.7 15 2.1 12 1.7 2.6Saline 246 4.4 214 3.8 196 3.5 187 3.4 187 3.4 3.7
Scott 14 2.8 15 3.0 11 2.2 17 3.4 13 2.6 2.8Sedgwick 2,222 4.4 2,247 4.4 2,148 4.2 1,789 3.5 1,429 2.8 3.9Seward 97 4.1 91 3.9 89 3.8 70 3.1 94 4.2 3.8Shawnee 417 2.3 367 2.1 360 2.0 456 2.6 296 1.7 2.1Sheridan 1 0.4 4 1.6 4 1.6 2 0.8 7 2.8 1.4
Sherman 20 3.3 26 4.3 26 4.3 24 4.0 23 3.9 4.0Smith 5 1.3 11 2.9 6 1.6 6 1.7 8 2.2 1.9Stafford 9 2.1 8 1.9 6 1.4 5 1.2 9 2.1 1.7Stanton 6 2.7 3 1.4 10 4.8 6 2.9 11 5.3 3.4Stevens 19 3.3 23 4.0 36 6.2 19 3.4 23 4.1 4.2
Sumner 71 3.0 75 3.2 58 2.5 76 3.3 61 2.6 2.9Thomas 31 3.9 36 4.6 27 3.4 26 3.3 22 2.8 3.6Trego 9 3.0 4 1.4 4 1.4 5 1.7 10 3.5 2.2Wabaunsee 19 2.7 17 2.4 12 1.7 9 1.3 7 1.0 1.8Wallace 2 1.3 5 3.3 2 1.3 3 2.0 3 2.0 2.0
Washington 13 2.3 13 2.3 12 2.1 4 0.7 8 1.5 1.8Wichita 7 3.2 5 2.3 3 1.4 4 1.9 6 2.8 2.3Wilson 31 3.4 32 3.5 34 3.8 26 3.0 23 2.7 3.3Woodson 8 2.5 7 2.2 9 2.9 4 1.3 5 1.6 2.1Wyandotte 295 1.8 297 1.8 294 1.8 282 1.7 255 1.5 1.7
n.s. 0 n/a 0 n/a 0 n/a 0 n/a 0 n/a n/a
Peer GroupFrontier 303 2.7 308 2.8 263 2.4 247 2.3 252 2.3 2.5Rural 768 3.3 690 2.9 752 3.2 688 3.0 669 2.9 3.1Densely -Settled Rural 1,389 2.9 1,236 2.6 1,244 2.6 1,142 2.4 1046 2.2 2.6Semi-Urban 1,862 4.0 1,594 3.4 1,595 3.4 1,403 3.1 1390 3.0 3.4Urban 4,763 3.0 4,613 2.9 4,182 2.6 3,718 2.3 3137 1.9 2.5
* See Technical Notes for Peer Group definition.† Rate per 1,000 population

Marriage Rates
By County of Occurrence
Kansas, 2017
Figure F7


TECHNICAL NOTES

1
ContentsRevisions and Updates ................................................................................................................. 2
Revisions to 2017 Annual Summary .......................................................................................... 2
Revisions to 2016 Annual Summary .......................................................................................... 2
Revisions to 2015 Annual Summary .......................................................................................... 2
Revisions to 2014 Annual Summary .......................................................................................... 7
Revisions to 2013 Annual Summary .......................................................................................... 7
Revisions to 2012 Annual Summary .......................................................................................... 7
Revisions to 2011 Annual Summary .......................................................................................... 8
Revisions to 2010 Annual Summary .......................................................................................... 8
Health Equity and Disparities ................................................................................................. 8
Live Births by Trimester Prenatal Care Began by Population Group ..................................... 8
Live Births by Population Group of Mother by Birth Weight in Grams ................................... 8
Live births by Population Group of Mother by Final Route of Delivery .................................. 8
External Cause of Death by Injury Matrix, Intent and Cause Group Categories ................... 9
Years of Potential Life Lost before Age 75 (YPLL75) ............................................................ 9
2014 Revisions to Certificates ................................................................................................... 9
2011 Revisions to Certificates ................................................................................................. 10
2009 Revisions to Certificates ................................................................................................. 10
General Methods ........................................................................................................................ 10
Data Sources ........................................................................................................................... 10
Quality of Data ......................................................................................................................... 10
Unknowns and Imputation ....................................................................................................... 11
Month prenatal care began ...................................................................................................... 11
Population group method of reporting race and Hispanic origin .............................................. 11
Residence vs occurrence data ............................................................................................ 12
Population Estimates ............................................................................................................... 12
Peer Groups ........................................................................................................................ 13
Cause of Death ........................................................................................................................ 14
Age-Adjusted Death Rates ...................................................................................................... 14
Comparing Age-Adjusted Death Rates .................................................................................... 14
Significance test when both rates are based on 100 or more events ...................................... 15
Rate Reliability ......................................................................................................................... 16
Adequacy of Prenatal Care Utilization (APNCU) Index ........................................................... 16
Criteria for Small for Gestational Age (SGA) ........................................................................... 17
Criteria for Weight Gain in Pregnancy ..................................................................................... 17

2
Revisions and Updates
Revisions to 2017 Annual Summary No new tables were added for the 2017 Annual Summary, but the method for counting stillbirths was revised to meet national standards: stillbirths at less than twenty (20) weeks gestation are not included even when reported. Stillbirth counts from 2014–2016 (in multi-year tables) were revised to meet the new standards. A new breakdown of gestational age was also adopted, 20-31 weeks, 32-41 weeks, and 42 & Over weeks. The tables and figures affected by these changes were:
Table A1. Selected Vital Events and Percent Change Kansas, 2017, 2016 and 1998. Table A2. Selected Vital Event Percents, Rates, and Ratios Kansas, 1998-2017. Figure A3. Selected Vital Event Rates Kansas, 1998-2017. Table D1. Stillbirths by Cause of Death and Weeks Gestation, Kansas, 2017. Figure D1. Stillbirths By Selected Characteristics, Kansas, 2017. Table D2. Stillbirths by County of Residence and Peer Group, by Age-Group of Mother,
Kansas, 2017. Table D10. Perinatal Period III Deaths by Component, Kansas, 1998-2017. Table D11. Perinatal Period III Deaths by County of Residence, by Component, Kansas,
2017.
Revisions to 2016 Annual Summary One new table was added to the Live Births and Fertility Section of the 2016 Annual Summary: E28. Life-Expectancy at Birth by County of Residence and Peer Group, Kansas, 2012-2016. This led to a new table number for the previous table E28: E29. Deaths by Selected City of Residence by Number and Crude Rate, Kansas, 2012-2016.
Revisions to 2015 Annual Summary The structure of the Annual Summary of Vital Statistics has been substantially revised. First, the Annual Summary was divided into six sections: A. Vital Events B. Population C. Live Births and Fertility D. Fetal and Infant Mortality E. General Mortality F. Marriages and Marriage Dissolutions The Live Births section includes most of the tables and figures that were previously in the old Pregnancy Outcomes section. The Fetal and Infant Mortality section includes some tables and figures that had been in the old Pregnancy Outcomes section and some that had been in the old Deaths section. Within each section, statewide results are presented first, followed by county and city tables. Table and figure numbers have been changes so that the numbering in each section is inde-pendent of the numbering in the other sections, thus reducing the number of table or figure numbers that would need to be changed if a table or figure were added or removed from a sec-tion in the future.

3
New tables in 2015: B1. Population by Year and by Sex, Kansas, 1966-2015 E1. Deaths by Year and by Population Group, by Number, Crude and Age-Adjusted Rate, Kansas, 2011-2015 E15. Work-related injury deaths by Occupation/Industry of Decedent, Kansas, 2015 E17. Diabetes Mellitus as Underlying and contributing Cause of Death, Kansas, 2015 F1. Marriage and Marriage Dissolution Numbers and Rates by Year of Occurrence, Kansas, 1966-2015 The table that follows maps table and figure numbers in the 2015 Annual Summary to table and figure numbers in the 2014 Annual Summary. To avoid constant repetition of the words “table” and “figure,” rows for figures are highlighted in light orange. Table A. Changes to table and figure numbers and sequence in the 2015 Annual Summary2015 2014 TITLE (with years for 2015 Annual Summary)A. VITAL EVENTS A1 1 Selected Vital Events and Percent Change, Kansas, 2015, 2014, and 1996A1 1 Every Day During 2015A2 2 Kansas Vital Events for 2015A2 2 Selected Vital Event Rates, Kansas, 1996-2015A3 3 Selected Vital Event Rates, Kansas, 1996-2015A3 3 Selected Vital Events by Population Group, Kansas, 2015 B. POPULATION B1 NEW Population by Year and by Sex, Kansas, 1966-2015B1 4 Total Population, Kansas, 1996-2015 (in Thousands)B2 5 Rate of Natural Increase, Kansas, 1996-2015B3 6 Median Age, Kansas, 1996-2015B4 8 Population Density, Kansas and the U.S., 1996-2015
B2 6 Population by Nine Selected Age-Groups and Sex, Kansas, 1996_2015 (in Thousands)
B3 7 Population by 11 Selected Age-Groups, by Population Group and Sex, Kansas, 2015
B5 7 Percent Change in Age-Group population, Both Sexes, Kansas, 1996-2015B4 4 Population by County and Peer Group, by Population Group, Kansas, 2015B6 9 Population Density by County of Residence, Kansas, 2015 [MAP]
B5 8 Population by County of Residence and Peer Group, by Population Group, Kansas, 2015
B6 5 City Population, Kansas, 2011-2015C. LIVE BIRTHS AND FERTILITY C1 11 Birth Rates, Kansas and the U.S., 1912-2015C1 10 Birth Rates, Kansas and the U.S., 1912-2015C2 11 Fertility Rates, Kansas and the U.S., 1995-2015
C3 12 Age-Specific Fertility Rates by Year by Age-Group of Mother, Kansas, 2011-2015
C2 12 Age-Specific Fertility Rates by Age-Group of Mother, Kansas, 1996-2015C3 13 Live Births by Age-Group of Mother by Sex of Infant, Kansas, 2015

4
C4 14 Live Births by Age-Group of Father by Age-Group of Mother, Kansas, 2015C5 24 Live Births by Age-Group of Mother by Birth Weight in Grams, Kansas, 2015C4 15 Live Births by Birth Order, Kansas, 2015C6 25 Live Births by Birth Order by Age-Group of Mother, Kansas, 2015
C7 26 Live Births by Population Group of Mother by Trimester Prenatal Care Began, Kansas, 2015
C8 27 Live Births by Population Group of Mother by Birth Weight in Grams, Kansas, 2015
C9 28 Live Births by Population Group of Mother by Final Route of Delivery, Kansas, 2015
C10 9 Live Births by County of Residence and Peer Group, by Number and Rate, Kansas, 2015
C5 13 Birth Rates by County of Residence, Kansas, 2015 [MAP]
C11 15 Live Births by County of Residence and Peer Group by Age-Group of Mother, Kansas, 2015
C12 16 Live Births by County of Residence and Peer Group by Weeks Gestation, Kan-sas, 2015
C13 17 Live Births by County of Residence and Peer Group by Month Prenatal Care Began, Kansas, 2015
C14 18 Live Births by County of Residence and Peer Group by Adequacy of Prenatal Care Utilization (APNCU) Index, Kansas, 2015
C15 19 Live Births by County of Residence and Peer Group by Birth Weight in Grams, Kansas, 2015
C16 20 Live Births by County of Residence and Peer Group by Initiation of Breastfeed-ing, Kansas, 2015
C17 21 Live Births by County of Residence and Peer Group by Mother’s Reported Cig-arette Use, Kansas, 2015
C6 14 Percent of Maternal Cigarette Use During Pregnancy by County of Residence, Kansas, 2015 [MAP]
C18 22 Live Births by County of Residence and Peer Group by Birth Weight Category for Gestational Age, Kansas, 2015
C19 23 Mother’s Weight Gain in Pregnancy for Singleton Births, by County of Resi-dence and Peer Group, Kansas, 2015
C20 29 Live Births by County of Residence and Peer Group by Population Group of Mother, Kansas, 2015
C21 10 Live Births by Selected City of Residence, by Number and Rate, Kansas, 2011-2015
C7 16 Out-of-Wedlock Birth Ratios, Kansas and the U.S., 1919-2015
C22 30 Out-of-Wedlock Births by County of Residence and Peer Group by Age-Group and Population Group of Mother
C23 31 Teenage Pregnancy Numbers and Rates by Year by Selected Age-Groups, Kansas, 996-2015
C8 19 Teenage Pregnancy Rates by Age-Group, Kansas, 1996-2015
C9 17 Teen and Non-Teen Live Births: Percent Distribution by Month Prenatal Care Began, Kansas, 2015
C10 18 Teenage Live Births by Population Group, Kansas, 2015
C24 32 Teenage Pregnancy Numbers and Rates by Year for Selected Population Groups and Age-Groups, Kansas, 2011-2015
C25 33 Teenage Pregnancies by County of Residence and Peer Group by Age-Group and Component, Kansas, 2015

5
C26 34 Teenage Pregnancies for 10-17 Year Olds by County of Residence and Peer Group, by Component, Kansas, 2015
D. FETAL AND INFANT MORTALITYD1 45 Stillbirths by Cause of Death and Weeks Gestation, Kansas, 2015 D1 20 Stillbirths by Selected Characteristics, Kansas, 2015
D2 35 Stillbirths by County of Residence and Peer Group, by Age-Group of Mother, Kansas, 2105
D3 36 Total Reported Abortions and Ratios of Abortions to Live Births, Kansas, 1971-2015
D2 21 Ratios of Abortions to Live Births, Kansas, 1971-2015
D3 22 Ratios of Abortions to Live Births by Age-Group of Patient, Kansas, 1996 and 2015
D4 38 Total Reported Abortions by Selected Characteristics by Age-Group of Patient, Kansas, 2015
D5 39 Kansas Resident Abortions by Selected Characteristics, Kansas, 2015D4 23 Reported Abortions by Selected CharacteristicsD6 40 Total Reported Abortions by Population Group by Marital Status, Kansas, 2015D7 41 Total Reported Abortions by Population Group by Weeks Gestation
D5 24 Total Reported Abortions by Termination Procedure by Weeks Gestation, Kan-sas, 2015
D8 42 Total Reported Abortions by Termination Procedure by Weeks Gestation, Kan-sas, 2015
D9 37 Abortions by County of Residence and Peer Group, by Age-Group of Mother, Kansas, 2015
D10 46 Perinatal Period III Deaths by Component, Kansas, 1996-2016
D11 47 Perinatal Period III Deaths by County of Residence by Component, Kansas, 2015
D12 48 Infant Mortality Rates by Population Group, Kansas, 1996-2015
D6 27 Infant Mortality Rates by Population Group, Five Year Rolling Averages, Kan-sas, 1991-2015
D13 50 Infant Deaths by Cause of Death by Age-Group of Infant, Kansas, 2015D7 28 Infant Deaths for Three Age Subgroups, Kansas, 1996-2015 D8 29 Pregnancy Associated Deaths [this is moms]
D14 49 Infant Deaths by County of Residence and Peer Group, by Year of Death, Kan-sas, 2011-2015
D15 D15 Infant Deaths by County of Residence and Peer Group, by Component, Kan-sas, 2015
E. GENERAL MORTALITY
E1 NEW Deaths by Year and by Population Group, by Number, Crude and Age-Adjusted Rate, Kansas, 2011-2015
E1 26 Crude Death Rates, Kansas and the U.S., 1912-2015E2 52 Age-Specific Death Rates by Sex, Kansas, 1996-2015E2 30 Age-Adjusted Death Rates, Kansas and the U.S., 1996-2015 E3 53 Age-Adjusted Death Rates by Sex, Kansas and the U.S., 1996-2015
E4 56 Deaths by Population Group and Sex, by Age-Group and Average Age at Death, Kansas, 2015
E5 57 Ten Leading Causes of Death by Population Group and Sex of Decedent, Kan-sas, 2015
E6 58 Selected Causes of Death by Age-Group and Average Age at Death, Kansas, 2015

6
E7 59 Ten Leading Causes of Death, Number, Rate and Average Age at Death, by Sex, Kansas, 2015
E8 60 Death Rates, Age-Adjusted Death Rates and 95% Confidence Intervals for Se-lected leading Causes of Death, Kansas, 2014-2015
E3 31 Death Rates for Selected Leading Causes of Death, Kansas, 1996-2015E4 32 Leading Causes of Death by Age-Group, Kansas, 2015
E9 61 Pneumonia and Influenza Mortality, Number and Age-Adjusted Rates, Kansas Residents, 1999-2015
E5 33 Pneumonia and Influenza Deaths by Month and Five-Year Median for Month, Kansas Residents, 2015
E10 62 Heart Disease Deaths by Component and Sex of Decedent, by Age-Group of Decedent, Kansas, 2015
E11 63 Malignant Neoplasm Deaths by Site of Lesion and Sex of Decedent, by Age-Group of Decedent, Kansas, 2015
E12 64 Cerebrovascular Disease Deaths by Component and Sex of Decedent, by Age-Group of Decedent, Kansas, 2015
E13 65 Unintentional Injury Deaths by Component and Sex of Decedent, by Age-Group of decedent, Kansas, 2015
E14 66 Selected External Causes of Death by Injury Matrix Group and Intent, Kansas, 2015
E15 NEW Work-related injury deaths by Occupation/Industry of Decedent, Kansas, 2015
E16 67 Selected Chronic Disease Deaths by Component and Sex of Decedent, by Age-Group of Decedent, Kansas, 2006- 2015
E17 NEW Diabetes Mellitus as Underlying and Contributing Cause of Death, Kansas, 2015
E18 68 Deaths by Occupation of Decedent by Selected Causes of Death, Kansas, 2015
E19 69 Deaths by Industry of Decedent by Selected Causes of Death, Kansas, 2015
E20 70 Selected Causes of Death and Years of Potential Life Lost (YPLL) Before Age 75, Kansas, 2015
E6 34 Percent Years of Potential Life Lost before Age 75
E21 72 Deaths from 39 Selected Causes by Number and Percent and Sex of Decedent Related to Tobacco, Kansas, 2015
E22 73 Deaths from 39 Selected Causes and Sex by Age-Group of Decedent
E23 43 Deaths by County of Residence and Peer Group, by Number, Crude and Age-Adjusted Rate, Kansas, 2011-2015
E7 25 Age-Adjusted Death Rates by County of Residence, Kansas, 2015 [MAP]
E24 54 Deaths by County of Residence and Peer Group, by Age-Group and Average Age at Death, Kansas, 2015
E25 55 Deaths by County of Residence and Peer Group, by Population Group, Kansas, 2015
E26 71 Deaths by County of Residence and Peer Group, by Number and Percent Re-lated to Tobacco, Kansas, 2015
E27 74 Selected Causes of Death by County of Residence and Peer Group, Kansas, 2015
E28 44 Deaths by Selected City of Residence, by Number and Crude Rate, Kansas, 2011-2015
F. MARRIAGES AND MARRIAGE DISSOLUTIONS
F1 NEW Marriage and Marriage Dissolution Numbers and Rates by Year of Occurrence, Kansas, 1966-2015
F1 37 Marriage Rates, Kansas and the U.S., 1913-2015

7
F2 38 Marriage Dissolution Rates, Kansas and the U.S., 1951-2015
F2 77 Marriages by Population Group of Groom by Population Group of Bride, Kan-sas, 2015
F3 78 Marriage Dissolutions by Population Group of Husband by Population Group of Wife, Kansas, 2015
F3 39 Number of Marriages by Month, Kansas, 2015
F4 79 Marriages by Premarital Status of Groom by Premarital Status of Bride, Kan-sas, 2015
F5 80 Marriages by Age-Group of Groom by Age-Group of Bride, Kansas, 2015F4 40 Average Age at Marriage, Kansas, 1996-2015
F6 81 Marriage Dissolutions by Age-Group of Husband by Age-Group of Wife, Kan-sas, 2015
F5 41 Average Age at Marriage Dissolution, Kansas, 1996-2015 F7 82 Marriage Dissolutions by Duration of Marriage in Years, Kansas, 2015
F6 42 Marriage Dissolution Percent Distribution by Number of Minor Children, Kan-sas, 2015
F8 83 Marriage Dissolutions by Number of Minor Children Reported and Number of Minor Children Affected
F9 75 Marriages by County of Marriage and Peer Group, by Number and Rate, Kan-sas, 2011-2015
F10 76 Marriage Dissolutions by County of Action and Peer Group, By Number and Rate, Kansas, 2011-2015
F7 35 Marriage Rates by County of Occurrence, Kansas, 2015 [MAP] F8 36 Marriage Dissolution Rates by County of Action, Kansas, 2015 [MAP]
Revisions to 2014 Annual Summary One new table (Table 61) and one new figure (Figure 33) related to pneumonia and influenza mortality have been added in the 2014 Annual Summary of Kansas Vital Statistics. Tables pre-viously numbered 61-82 are now numbered 62-83, and figures previously numbered 33-41 are now numbered 34-42.
Revisions to 2013 Annual Summary No tables and figures in the 2013 Annual Summary have been added or dropped. Table and figure numbers remain unchanged from 2012. The cause of death code lists included in several mortality tables have been modified. To improve readability the lists of codes have been re-moved from the tables and placed in appendices in the back of the report. The number of tables to include population density peer groups has been increased to include all tables for which county level, multi-year statistics are provided. Birth tables that report on gestation have been modified to reflect the establishment of a gestational age category called ‘near term’ which in-cludes 37 and 38 weeks gestation. This will enable the determination of near term birth rates. Figure 28 has been redesigned to better indicate changes in the count of infant deaths by gesta-tional age.
Revisions to 2012 Annual Summary The Annual Summary for 2012 contains no new tables, but some categories in Table 64 were subdivided to allow matching to categories used in the Healthy People 2020 project. No tables or figures have been deleted from the past year. The narrative has been expanded to include comparisons to selected Healthy People 2020 targets. Table and figure numbers remain un-changed from 2011.

8
Revisions to 2011 Annual Summary The Annual Summary for 2011 contains no new tables. No tables or figures have been deleted from the past year. Table and figure numbers remain unchanged from 2010.
Revisions to 2010 Annual Summary The Annual Summary for 2010 contains four new tables. No tables or figures have been deleted from the past year. Please see Technical Notes for past years for information on other table and figure changes. Table and figure numbers are updated to reflect the changes. Health Equity and Disparities Several new tables present data and statistics on health disparities or health equality. According to the National Partnership for Action to End Health Disparities (NPA), “Health equity is attainment of the highest level of health for all people. Achieving health equity requires valuing everyone equally with focused and ongoing societal efforts to address avoida-ble inequalities, historical and contemporary injustices, and the elimination of health and healthcare disparities”.1 Live Births by Trimester Prenatal Care Began by Population Group This table shows the number and percentage of live births by trimester prenatal care began and population group. Starting prenatal care in the first trimester is particularly important for women with risk factors for poor infant and maternal outcomes. As an example, national data (2008) shows wide differences in pre-pregnancy diabetes (DM) and gestational diabetes (GDM) ob-served by race and Hispanic origin. Among the three largest racial and ethnic groups, Black non-Hispanic women are more likely than White non-Hispanic and Hispanic women to have DM; Hispanic and white non-Hispanic mothers are more likely to develop GDM than black non-Hispanic mothers.2 Data caveats
In calculating percent, unknowns are excluded. Border county residents who deliver out of state may have a high number of unknown or
missing values. Live Births by Population Group of Mother by Birth Weight in Grams This table shows the number of live births by birth weight in grams and population group. Infant weight at birth is an important predictor of short term complications and long term health. Small-er infants, especially those born at less than 1,500 grams are at the greatest risk. Among the three largest racial and ethnic groups, national data (2008) shows that Black non-Hispanic women are more likely than White non-Hispanic and Hispanic women to have very low birth weight babies.3 Live births by Population Group of Mother by Final Route of Delivery This table shows the number of deliveries by the final route of delivery and the percentage of cesarean births and cesarean births preceded by a trial of labor. Nationally, the total cesarean delivery rate has been increasing since the mid-1990s, reaching 32.3 percent in 2008[3]. The increase in cesarean births is a public health concern, since the surgery may have risks for both the mother and newborn. Cesarean deliveries may contribute to the growing number of babies who are born "late pre-term," between 34 and 36 weeks gestation. While babies born at this time are usually consid-ered healthy, they are more likely to have medical problems than babies born a few weeks later

9
at fullterm.4 Data caveats
In calculating percent, unknowns are excluded. Data collected on cesarean deliveries by the birth certificate before 2005 are not compa-
rable to data collected in 2005 and after. External Cause of Death by Injury Matrix, Intent and Cause Group Categories This table uses the Centers for Disease Control & Prevention (CDC) injury matrix to categorize cause or mechanism of death by intent. The ICD-10 codes for the intent categories by mecha-nism are available for download at the following internet address. http://www.cdc.gov/nchs/injury/injury_tools.htm Injuries, including all intents, are the leading cause of death in the 1-44 age-groups. This table with intent is provided to give a better understanding of the problem and help identify interven-tion activities. Data caveats
Adverse effects of drugs and medical care are excluded. Years of Potential Life Lost before Age 75 (YPLL75) The YPLL75, for this report, is a measurement of the number of years of potential life lost by each death occurring before age 75.5 This calculation provides more information on the societal impact of mortality. Years of potential life lost counts deaths at a younger age more heavily than those at older ages (e.g., the younger person has a greater potential for years left than an elderly person). YPLL75 values were calculated by subtracting the age of the decedent from 75 only for those persons who died before that age. The resulting value represents the years of potential life lost. These values are then summed for all individuals, providing the total years of life lost. This method represents a new approach for years of potential life lost calculations. Formerly, KDHE used the life expectancy for males and females for the calculations. The change allows for more uniformity in calculation of YPLL75 as well as better comparability to national statistics. YPLL75 statistics in this report can’t be compared to statistics from prior years’ reports because of the change in methodology.
2014 Revisions to Certificates Beginning in July 2014, requirements for reporting stillbirths or fetal deaths to the Kansas De-partment of Health and Environment changed. All stillbirths in which the unborn child is 20 weeks gestation and greater must now be reported. The old law required stillbirths to be report-ed when fetal weight was greater than 350 grams. The change may result in slightly different counts because of the different definitions of stillbirth and implementation occurring mid-year. The reporting certificate did not change. Beginning in July 2014, the department implemented a revised form for reporting abor-tions. This revised VS 213 form resulted in changes to the reverse side wherein information about procedures performed at 22 weeks or greater and partial birth abortions are collected. No changes were made to the obverse side of the form. Please see the sample form later in the Technical Notes.

10
2011 Revisions to Certificates Beginning in July 2011, Kansas implemented a revised form for reporting abortions. This re-vised VS213 form resulted from changed made in abortion reporting laws passed by the Kansas Legislature. Question 14 that asks the reasons for determining gestational age, is now required to be completed on all abortions, rather than only abortions that occurred at 22 weeks gestation or later. One new question (#15 on the revised form) addresses whether a report of physical, mental, or emotional abuse or neglect has been filed about the patient pursuant to K.S.A. 38-2223.
2009 Revisions to Certificates Beginning in July 2009, Kansas implemented an Electronic Death Registration System involving online entry of medical information by physicians. At the same time, the death certificate was modified to include a new item “3. If female, name prior to first marriage.” Neither change has an effect on the information included in this report. Certificates used for the collection of births, stillbirths, and deaths conform to the U.S. Standard Certificates. These standards were implemented in Kansas beginning in 2005. Please refer to Technical Notes in previous reports for information on certificate changes in past years.
General Methods
Data Sources Data derived on information collected on vital records (birth, stillbirth, death, marriage, and mar-riage dissolution) and abortion, serves as the basis for the following reports: Annual Summary of Vital Statistics, Preliminary Abortion Report, Vital Statistics Annual Tables, Adequacy of Prena-tal Care Utilization Index, Adolescent and Teenage Pregnancy, Selected Special Statistics Still-births and Infant Deaths, Natality Report by Racial and Ethnic Population Groups. Reporting of Kansas vital events to the Kansas Department of Health and Environment (KDHE) is mandated by law (K.S.A. 65-102, K.S.A. 65-2422b, K.S.A. 65-445). The filing of birth and death records began in 1911, the registration of marriages was initiated in 1913, and divorce tabulations started in 1951. The reporting of abortions began in 1970. Birth, death, stillbirth, marriage, marriage dissolution certificates, and abortion reports are completed by the combined efforts of physicians, hospital personnel, funeral directors, attorneys, and district courts. All cer-tificates and reports are filed with the Office of Vital Statistics by direct reporting. Since the reg-istration of vital events began, over 10 million records have been processed, filed, and indexed.
Quality of Data The quality of the analyses in the Annual Summary of Vital Statistics depends on complete and accurate reporting of vital events. The Office of Vital Statistics (OVS) collects the certificates and works to ensure the completeness and accuracy of the certificates filed. OVS staff receive records for events that occur in the state. Other states or jurisdictions provide occurrence infor-mation on births, deaths, and stillbirths that occur to Kansas residents. In recent years an elec-tronic interstate jurisdictional exchange system has been improving the timeliness of receipt of out-of-state records. Events involving Kansas from 56 other registration states/jurisdictions and Canada are shared with KDHE. All vital events included in this report cover a calendar year. Birth, death, and stillbirth events are counted in the 2015 Kansas Annual Summary of Vital Statistics if they were reported by June 30, 2016. The number of events received from other states after the cutoff is less than one percent of the total reports filed and does not have an impact on report statistics.

11
Incomplete reporting of marriage dissolution impacts statistics. As more counties and attorneys use the KDHE electronic reporting system, completeness has been improving. However, there may be some undercount. Users of marriage dissolution statistics should take this into account when interpreting the information.
Unknowns and Imputation Unknown values in vital records can result in incomplete statistics. As part of ongoing data quality efforts, BEPHI identifies records with missing or illogical information and works with hos-pitals and physicians to fill in the blanks and correct mistakes. However, there are occasions when the information remains unknown in the analytical files used to create the statistics in this report. BEPHI displays counts for "not stated" (N.S.) in tables and graphs throughout this publication. To ensure statistical accuracy in pregnancy outcome tables, the "not stated" count has been subtracted from the denominator when calculating percentages. In limited instances, BEPHI will impute missing information using commonly accepted tech-niques in the civil registration/data analysis field. Imputation can either involve review of other information in the vital record to deduce the unknown value or using some form of algorithm to randomly assign a value. For 2015 data, the Bureau addressed unknowns or illogical values in age, county of residence, and sex. Cities and counties were corrected for spelling, city-county designation, and for missing information. Race and ethnicity entries were corrected when “un-known” and a specified category were selected. Not every unknown can be corrected.
Month prenatal care began Calculation of month prenatal care began uses the dates of last menstrual period and the date of first prenatal care visit. This date difference method began in 2005. Prior to that time, month care began was a value entered on the birth certificate by the hospital. Because of the change, month prenatal care began statistics in this report can’t be compared to statistics from annual summary reports prior to 2005.
Population group method of reporting race and Hispanic origin The 2000 U.S. Census and implementation of the revised birth, death and stillbirth certificates in Kansas in 2005 altered the way race and Hispanic origin was reported. These changes were implemented to provide a better picture of the nation’s variation in race and Hispanic origin. The expanded race and Hispanic origin categories on Kansas certificates are compliant with the provisions of the Statistical Policy Directive No. 15, Race and Ethnic Standards for Federal Sta-tistics and Administrative Reporting, issued by the Office of Management and Budget (OMB) in 1997.6 Under these guidelines, when race and Hispanic origin are collected separately, Hispanic origin is collected first on the certificate. Changes in collection of race and Hispanic origin information on vital events certificates neces-sitated the use of a population group method for grouping the information. The population group method utilizes mutually exclusive groups of race and Hispanic origin to encompass the 16 race checkboxes and the eight Hispanic origin checkboxes on each certificate. This approach results in a unique matrix of population groups for reporting statistics. At the most detailed level, there are nine population-groups: Hispanic any race, White non-Hispanic, Black non-Hispanic, Asian non-Hispanic, Native Hawaiian and other Pacific Islander (NHOPI) non-Hispanic, American Indian/Alaska Native (AIAN) non-Hispanic, Multiple race non-Hispanic, Oth-er race non-Hispanic, and Unknown race non-Hispanic. In the event Hispanic origin is unknown but race information is known, the individual will be reported as the specified race and non-Hispanic.

12
BEPHI developed an aggrega-tion grid (Table A) to use when counts for population-groups are too small to be displayed or used in a rate calculation. This report uses partial or full aggregation of population groups for reporting statistics. The principal advantage of us-ing population groups is the ability to more closely tabulate population estimates to the same groups as those used for vital events. The U.S. Census Bureau (USCB) population estimates, used in this Annual Summary, can be collapsed into seven of the nine population-groups. Population-based rates using compatible numerators and denominators produce more accurate statistics. Residence vs occurrence data Residence data is information compiled according to the usual residence regardless of where the event occurred (including events occurring out-of-state). Occurrence data is information compiled according to the geographical location where the event took place, regardless of the actual residence. Information compiled for births, stillbirths, and deaths in this report are resi-dence data, while marriages and marriage dissolutions are occurrence data; and abortions are reported in both data formats (residence and occurrence).
Population Estimates All population data used in the Annual Summary come from the United States Census Bureau (USCB), which provides actual counts for Census years, and estimates for other years. The es-timates update Census counts by adjusting for subsequent births, deaths, and net migration. At the state level, USCB estimates are provided by sex (2 categories), race (6 categories), and Hispanic origin (2 categories), by single year of age. At the county level, USCB estimates are provided by the same sex, race, and Hispanic origin categories as for the state, but by eighteen 5-year age groups (0-4, 5-9, …, 80-84, and 85+) rather than by single year of age. The reduc-tion in granularity in the age category is necessary to assure that the statistical methods used provide reliable estimates for counties, where the population is usually at least an order of mag-nitude smaller than that of the state. Due to rounding and variation in estimation methods within the USCB, some discrepancies may be found between population estimates provided for the state and those provided for the coun-ties. Usually, differences are negligible and rarely result in discrepancies in the totals. We ad-vise you to utilize state totals from the county population totals when a total population estimate is needed. However, the age categories provided by the USCB estimates are not adequate for all purpos-es. For example, analysis of infant deaths requires population estimates for a single year of age (under one), analysis of teen pregnancy traditionally uses age brackets other than the two USCB categories that cover the age group (10-14 and 15-19), and age-adjusted death rate cal-culations normally use eleven standard age groups (0, 1-4, 5-14, 15-24, …, 75-84, 85+) that cannot be obtained by combining the eighteen USCB age groups. For these purposes, KDHE
Table A. Aggregation Grid for Population GroupsAg-gre-gation Level
Population Groups
None Hispan-ic any Race
White Non-Hispan-ic
Black Non-Hispan-ic
Asian Non-Hispan-ic
NHOPI Non-Hispan-ic
AIAN Non-Hispan-ic
Multi race Non-Hispan-ic
Other race Non-Hispan-ic
Un-known Non-Hispanic
Par-tial
Hispan-ic any Race
White Non-Hispan-ic
Black Non-Hispan-ic
Asian/NHOPI Non-Hispanic
AIAN Non-Hispan-ic
Multi & other non-specified race(s) Non-Hispanic
N.A.
Full Hispan-ic any Race
White Non-Hispan-ic
Black Non-Hispan-ic
Multi, other specified & non-specified race(s) Non-Hispanic
N.A.

13
uses population estimates provided by the National Center for Health Statistics (NCHS) known as the bridged-race estimates. NCHS creates these estimates by taking the USCB estimates and applying a computer algorithm which provides single-year-of-age estimates for counties, but at the cost of reducing the number of race categories from six to four. KDHE then combines the NCHS single-year-of-age estimates to obtain the eleven standard age groups or other grouping required for analysis. Because the USCB reassigns the race of certain categories in their bridged and unbridged es-timates, 2010 totals by population group may be inconsistent with 2009 estimates. This affects population-based rates using 2010 population estimates as the denominator in a rate. It may result in an artificially lower rate than the prior year. The greatest impact will involve rates for the smaller population groups. For 2001, time constraints associated with analysis of the 2000 census data left the Census Bu-reau unable to provide population estimates by the time they were needed by KDHE. For that year, KDHE produced its own estimates, though the methods used were necessarily less so-phisticated than those ultimately used by the Census Bureau. In due time, KDHE population ta-bles were updated with the appropriate USCB and NCHS estimates, but the rates calculated for the Annual Summary and other reports of the year were not re-calculated with the updated pop-ulation estimates. The 2001 state and county estimates for teenage females (10-14, 10-17, 15-19, 10-19) were compiled by the KDHE based on 2000 USCB numbers. In order to estimate the 2001 teenage female population for the various age groupings, the 2000 proportion for the age grouping within the total population had to be derived. These estimates were calculated as in the following ex-ample for 2001. Female Population 10-14 Year 10-14 Year Age Group (2000) x 2001 Population = Age-Group ------------------------- All Ages (2001) 2000 Population All Ages Peer Groups For various demographic studies, it is useful to compare county statistics to counties with similar characteristics. “Peer groups” of counties, as used in this report, are defined as those with simi-lar population density based on a method derived by the KDHE Bureau of Community Health Systems. (See Appendices 1 and 2 for county tables indicating population density peer group membership before and after the 2010 U.S. Census.) Peer groups are updated after every cen-sus. Frontier counties are defined as those with less than 6.0 persons per square mile, Rural coun-ties as those with 6.0 - 19.9 persons per square mile, Densely-Settled Rural counties as those with 20.0 - 39.9 persons per square mile, Semi-Urban counties as those with 40.0 - 149.9 per-sons per square mile, and Urban counties as those with 150.0 or more persons per square mile. These designations should not be confused with the USCB definitions of urban and rural areas. BEPHI uses peer groups in county statistics tables. Based on the 2010 U.S. Census, eight Kan-sas counties changed peer groups. In order to facilitate a time series comparison, peer-group statistics for prior years are based on the peer-group in effect during that decade.7 Sources for calculation of population densities are population figures from the 2010 U.S. Census and land areas from the 2010 U.S. Census.

14
Cause of Death For 1999 and later years, underlying causes of death in the Annual Summary of Vital Statistics are established through a system known as the International Classification of Diseases, 10th Revision (ICD-10). This system promotes uniformity and comparability in the collection and presentation of mortality data. Prior to 1999, Kansas used ICD-9 to report mortality statistics. Periodically, the classification system needs to be updated to address new diseases and reflect a better understanding of causes of death. The World Health Organization maintains ICD-10 and the NCHS, which compiles national statistics, modifies ICD-10 for use by Kansas and other states [3].8 Death data from 1999 forward are classified by ICD-10, and trends in mortality will be comparable. Such data trends are not comparable if the statistics bridge 1998-1999. In accordance with NCHS guidelines, stillbirths that were coded Symptoms, Signs & Abnormal Findings (R00 - R99) are now coded unspecified cause (P95).
Age-Adjusted Death Rates The mortality rate, the number of deaths per 100,000 population, is a common way to report death statistics so that comparisons can be made from year to year or among geographic areas. Crude death rates compensate for the differences in population within the areas or time periods studied. Crude death rates, however, do not compensate for the different age make up of com-pared populations. For example, some Kansas counties may have older residents than other counties. To address this, statisticians prepare age-adjusted death rates. The direct method for calculating age-adjusted death rates was used in this report. Age-adjusting is a process by which the age composition of a population is defined as constant so that differences in age composition can be eliminated from the analysis. This is necessary as the risk of dying increas-es with age. Age-adjusted rates allow for more meaningful comparison of the risk of mortality over time and among groups. For this report, age-adjusted death rates were calculated using the 2000 population standard. Kansas began using the 2000 population standard, as recommended by NCHS, in the 1999 Annual Summary of Vital Statistics.
Comparing Age-Adjusted Death Rates Mortality rates, derived from vital records, are not subject to sampling error but are subject to what is termed random error. This arises from random variations in the number of deaths over time or between different communities. The potential impact of random error increases as the number of events decreases. This makes resulting rates subject to volatility, and requires cau-tion when comparing them to rates from other populations, geographic areas, and time periods. Confidence intervals are often used in research when comparing two age-adjusted death rates (for two different or independent populations) to determine whether a significant difference ex-ists between them. Ninety-five percent confidence intervals are provided for the age-adjusted rates in this report. The precise statistical definition of the 95% confidence interval is that if the measurement was conducted 100 times, 95 percent of the time the true value would be within the calculated confidence interval and five percent of the time the true value would be either higher or lower than the range of the confidence interval. The first step in calculating a confidence interval for an age-adjusted rate is the computation of a standard error (SE), which defines the rate’s variability. The SE for an adjusted rate per 100,000 population can be estimated by dividing that rate by the square root of the number of events (n) upon which the rate was based: /√

15
The estimated SE can then be used to compute a 95% confidence interval (CI) for the rate. The standard formula for determining the 95% CI of a rate is: R + (1.96 X SE) Computing confidence limits for pairs of rates varies depending on the number of events on which each rate was created. The formula below was used for calculating confidence intervals that appear in this report. (Table E8) Confidence limits for rates when the numerator is 100 or more In this case, use the following formula for the rate R based on the standard error SE: Lower limit = R - (1.96 x SE) Upper limit = R + (1.96 x SE) where: R = the rate (age-adjusted rate)
SE = the rate divided by the square root of the number of events (deaths) An example of this would be the comparison of cancer age-adjusted death rates for two years. If 2007’s rate has a 95% confidence interval of 174.3-183.9 and the 95% confidence interval for 2008 is 168.3-177.7, then they overlap and there is no significant difference between the two years’ rates, at the 95% confidence level. There are various statistical formulas for comparing rates, depending on the types of rates or populations being studied and the number of events involved. Please note that the formulas shown above are a conservative approach and, in some cases, may not be the most appropri-ate.
Significance test when both rates are based on 100 or more events To compare two rates when both are based on 100 or more events, first calculate the difference between the two rates by subtracting the lower rate from the higher rate. This difference is con-sidered statistically significant if it exceeds the statistic in the formula below. This statistic equals 1.96 times the standard error for the difference between two rates. where: R1 = the first rate R2 = the second rate N1 = the first number of events N2 = the second number of events If the difference is greater than this statistic, then the difference would occur by chance less than five times out of 100. The difference is statistically significant at the 95 percent confidence level. If the difference is less than this statistic, the difference might occur by chance more than five times out of 100. The difference is not statistically significant at the 95 percent confidence level. NCHS was used as a source for confidence interval and significance tests based on the Vital Statistics of the United States: Mortality, 1999 Technical Appendix.
R12
1.96 R22
N1 N2+

16
Rate Reliability Vital statistics are easily influenced by random variation and single-year rates can fluctuate widely. A multiple-year rate such as a five- or ten-year average of single-year rates would be more reliable in determining trends in vital events. For example, between 2005 and 2009 the infant death rate for Kansas ranged from 7.0 to 7.9, while the 2005-2009 five-year infant death rate for Kansas was 7.4 infant deaths per 1,000 live births. A five or 10-year rate smoothes some of the single-year rate variation and is a more reliable indicator of Kansas infant death rates. Rates based on a small or large number of events in a sparsely populated area can vary widely. To exemplify the variation that may occur with a small change in the number of events, in 2009 Greeley County was the least populated county in Kansas with 1,234 residents, and Johnson County was the largest with 542,737 residents. With 15 deaths occurring in Greeley County in 2009, the crude death rate was 12.2 deaths per 1,000 population; whereas 3,234 deaths occur-ring in Johnson County resulted in a crude death rate of 6.0 deaths per 1,000 population. If five more deaths occurred in each county (e.g., multiple- death accident), Greeley County's crude death rate would have increased to 16.2, while Johnson County's rate would have increased by only a few hundredths and, with rounding, still remain 6.0 deaths per 1,000 population. There-fore, one must use caution when comparing rates of vital events between counties of extreme population size differences to avoid misleading conclusions.
Adequacy of Prenatal Care Utilization (APNCU) Index Adequacy of prenatal care utilization values are based on a method developed by Dr. Milton Kotelchuck:9 I. Month prenatal care began (Adequacy of Initiation of Prenatal Care)
Adequate Plus: 1st or 2nd month Adequate: 3rd or 4th month Intermediate: 5th or 6th month Inadequate: 7th month or later or no prenatal care
II. Proportion of the number of visits recommended by the American College of Obstetricians and Gynecologists (ACOG) received from the time prenatal care began until delivery (Adequacy of Received Services)
Adequate Plus: 110% or more Adequate: 80% - 109% Intermediate: 50% - 79% Inadequate: less than 50%
III. Summary Adequacy of Prenatal Care Utilization Index
Adequate Plus: Prenatal care begun by the 4th month and 110% or more of recom-mended visits received
Adequate: Prenatal care begun by the 4th month and 80% - 109% of recommended vis-its received
Intermediate: Prenatal care begun by the 4th month and 50% - 79% of recommended visits received
Inadequate: Prenatal care begun after the 4th month or less than 50% of recommended visits received

17
Criteria for Small for Gestational Age (SGA) Small for gestational age is when the infant’s birth-weight is less than the 10th percentile, (low-est 9.9 percent of births). These infants may be normal but small or pathologically small (intrau-terine growth restriction). “Many different things can lead to intrauterine growth restriction (IUGR). An unborn baby may not get enough nutrition because of:
High altitudes, Multiple pregnancies (twins, triplets, etc.), Placenta problems, Preeclampsia or eclampsia
Congenital or chromosomal abnormalities are often associated with below-normal weight. Infec-tions during pregnancy that affect the developing baby, such as rubella, cytomegalovirus, toxo-plasmosis, and syphilis may also affect the weight of the developing baby”.10 Infants born small for gestational age but constitutionally normal may represent 40% or more of the SGA infants at term.11 However, “In early preterm gestations, the definition of SGA may be justified as a proxy for IUGR”.12 Statistics reported for SGA are based on using birth-weights from 2010 births for the state as a whole as the reference in establishing the cutoff point. In cal-culating percents, unknowns are excluded. Data are adjusted for gender or population group of the infant.
Criteria for Weight Gain in Pregnancy This table presents weight gain in pregnancy based on pre-pregnancy BMI categories under-weight, normal weight, overweight and obese by county. According to the March of Dimes, “Gaining the right amount of weight helps protect the health of your ba-by. Women who gain too little are at increased risk of having a small baby (less than 5 1/2 pounds). Women who gain too much are at increased risk of having an early baby or a large baby. They may also have health problems themselves such as diabetes, high blood pressure and varicose veins.13 The BMI/weight categories used in the Annual Summary are based on the Institute of Medicine of the National Academies guidelines that reflect changing U. S. demographics (Table B).14 Historical Changes in Reporting Abortion Data
The increase in the 1989-1992 figures from previous years may not reflect an increase in the number of abortions being performed but rather an increase in the number of provid-ers voluntarily reporting data.
Residency data was not available for all abortions in 1989-1990. However, due to im-proved reporting, residency was obtained for most of the abortions reported in subse-quent years. This improved reporting is also responsible for the increase in the resident abortion ratio between 1990 and 1991.
Table C. Recommendations for Total and Rate of Weight Gain During Preg-nancy, by Pre-pregnancy BMIPre-pregnancy weight Recommended weight gainUnderweight (BMI less than 18.5) 28 to 40 pounds Normal weight (BMI 18.5 to 24.9) 25 to 35 pounds Overweight (BMI 25 to 29.9) 15 to 25 pounds Obese (BMI 30 or greater) 11 to 20 pounds Source: Institute of Medicine

18
References
1 The National Partnership for Action to End Health Disparities. (2011, March). Health equity and dispari-ties. Retrieved 10/4/2011 from http://www.minorityhealth.hhs.gov/npa/templates/browse.aspx?lvl=1&lvlid=34 2 Osterman MJK, Martin JA, Mathews TJ, Hamilton BE. (2011). Expanded data from the new birth certifi-cate, 2008. National vital statistics reports; vol 59 no 7. Hyattsville, MD: National Center for Health Statis-tics. 3 Martin JA, Hamilton BE, Sutton PD, et al. Births: Final data for 2008. National vital statistics reports; vol 59 no 1. Hyattsville, MD: National Center for Health Statistics. 4 March of Dimes. (2008, July). C-section: medical reasons. Retrieved 10/4/2011 from http://www.marchofdimes.com/pregnancy/csection_indepth.html 5 Crawford G. “Peer Groups Revised in Kansas”, Kansas Health Statistics Report. August 2011, No. 50: 4. 6 Office of Management and Budget. (1997, October). Standards for Maintaining, Collecting, and Present-ing Federal Data on Race and Ethnicity. Retrieved 10/4/2011 from https://www.whitehouse.gov/sites/default/files/omb/assets/information_and_regulatory_affairs/re_app-a-update.pdf. 7 Statistical Measures and Definitions. National Association of Public Health Statistics and Information Systems. Retrieved 10/5/2011 from https://naphsis-web.sharepoint.com/Pages/StatisticalMeasuresandDefinitions.aspx. 8 Classification of Diseases, Functioning, and Disability. National Center for Health Statistics. Retrieved 10/4/2011 from http://www.cdc.gov/nchs/icd/icd10.htm. 9 Kotelchuck, M. An Evaluation of the Kessner Adequacy of Prenatal Care Index and a Proposed Ade-quacy of Prenatal Care Utilization Index. American Journal of Public Health, 1994; 84(9): 1414 1420. 10 Vorvick, L. (2010, November). Intrauterine growth restriction. Medline Plus. Retrieved 11/2/2011 from http://www.nlm.nih.gov/medlineplus/ency/article/001500.htm. 11 Ross, M.G. (2011, February). Fetal growth restriction, Medscape reference. Retrieved 11/2/2011 from http://emedicine.medscape.com/article/261226-overview. 12 Ananth, C. V, Vintzileos A. M. (2009, October). Distinguishing pathological from constitutional small for gestational age births in population-based studies. Early Hum Dev. 85(10):653-8. 13 March of Dimes. (2009, September). Weight gain during pregnancy. Retrieved 10/14/2010 from http://www.marchofdimes.com/pnhec/159_153.asp. 14 Institute of Medicine of the National Academies. (2009, May). Weight Gain During Pregnancy: Reexam-ining the Guidelines. Available at: http://iom.edu/~/media/Files/Report%20Files/2009/Weight-Gain-During-Pregnancy-Reexamining-the-Guidelines/Report%20Brief%20-%20Weight%20Gain%20During%20Pregnancy.pdf.
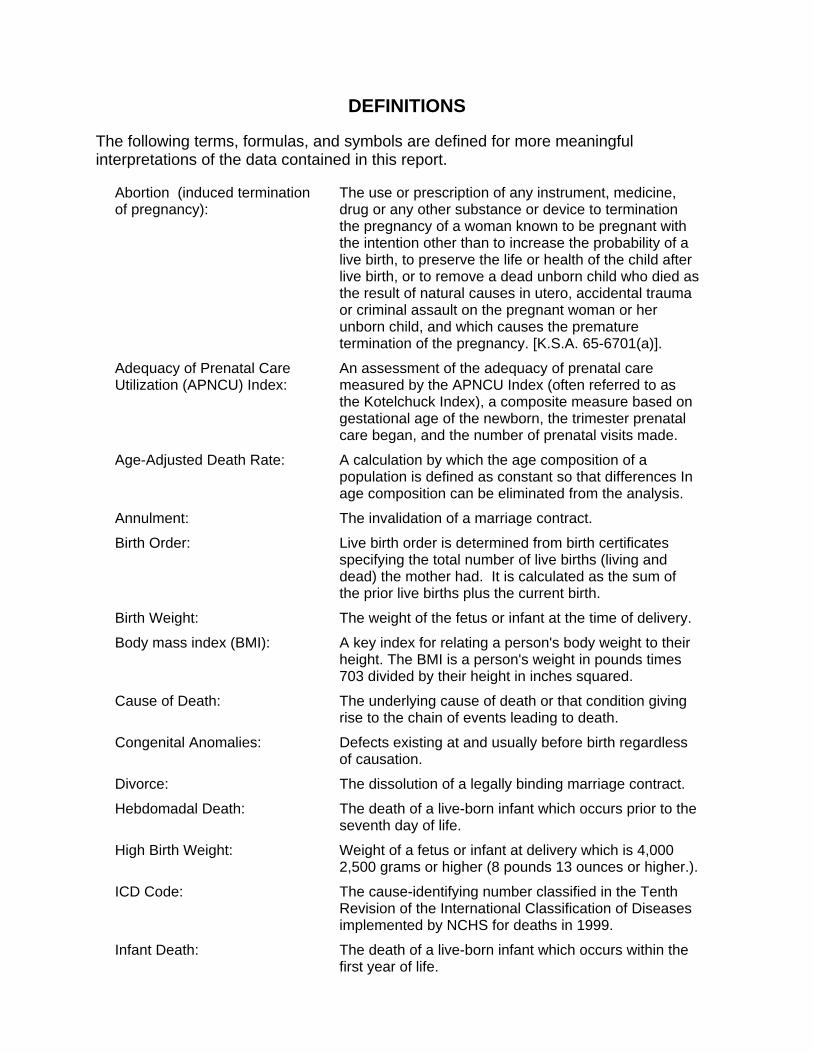
DEFINITIONS
The following terms, formulas, and symbols are defined for more meaningful interpretations of the data contained in this report.
Abortion (induced termination of pregnancy):
The use or prescription of any instrument, medicine, drug or any other substance or device to termination the pregnancy of a woman known to be pregnant with the intention other than to increase the probability of a live birth, to preserve the life or health of the child after live birth, or to remove a dead unborn child who died as the result of natural causes in utero, accidental trauma or criminal assault on the pregnant woman or her unborn child, and which causes the premature termination of the pregnancy. [K.S.A. 65-6701(a)].
Adequacy of Prenatal Care Utilization (APNCU) Index:
An assessment of the adequacy of prenatal care measured by the APNCU Index (often referred to as the Kotelchuck Index), a composite measure based on gestational age of the newborn, the trimester prenatal care began, and the number of prenatal visits made.
Age-Adjusted Death Rate: A calculation by which the age composition of a population is defined as constant so that differences In age composition can be eliminated from the analysis.
Annulment: The invalidation of a marriage contract.
Birth Order:
Live birth order is determined from birth certificates specifying the total number of live births (living and dead) the mother had. It is calculated as the sum of the prior live births plus the current birth.
Birth Weight: The weight of the fetus or infant at the time of delivery.
Body mass index (BMI): A key index for relating a person's body weight to their height. The BMI is a person's weight in pounds times 703 divided by their height in inches squared.
Cause of Death: The underlying cause of death or that condition giving rise to the chain of events leading to death.
Congenital Anomalies: Defects existing at and usually before birth regardless of causation.
Divorce: The dissolution of a legally binding marriage contract.
Hebdomadal Death: The death of a live-born infant which occurs prior to the seventh day of life.
High Birth Weight: Weight of a fetus or infant at delivery which is 4,000 2,500 grams or higher (8 pounds 13 ounces or higher.).
ICD Code: The cause-identifying number classified in the Tenth Revision of the International Classification of Diseases implemented by NCHS for deaths in 1999.
Infant Death: The death of a live-born infant which occurs within the first year of life.

DEFINITIONS (cont.)
Live Birth:
The complete expulsion or extraction of a product of human conception from its mother, irrespective of the duration of pregnancy, that, after such expulsion or extraction, shows any evidence of life such as breathing, heartbeat, pulsation of the umbilical cord, or voluntary muscle movement, whether or not the umbilical cord has been cut or the placenta attached.
Low Birth Weight: Weight of a fetus or infant at delivery which is less than 2,500 grams (less than five pounds, 8 ounces).
Marriage: The legal union of a male and female.
Marriage Dissolution: A marriage dissolved by either a divorce or an annulment.
Maternal Death: The death of a woman while pregnant or within 42 days of termination of pregnancy, irrespective of the duration and the site of the pregnancy, from any cause related to or aggravated by the pregnancy or its management, but not from accidental or incidental causes (Included in these deaths are ICD–10 codes A34, O00–O95, and O98–O99).
Medical Procedure I: Refers to use of the drug mifepristone as a pregnancy termination procedure.
Medical Procedure II: Refers to use of the drug methotrexate as a pregnancy termination procedure.
Natural Increase: Live births minus total deaths of a population within a given year.
Neonatal Death: The death of a live-born infant which occurs prior to the 28th day of life.
Normal Birth Weight: Weight of a fetus or infant at delivery which is between 2,500 and 3999 grams, inclusive (between 5 pounds 8 ounces and 8 pounds 12 ounces).
Occurrence Data: Vital statistics compiled on the basis of where the vital event happened.
Out-of-Wedlock Birth: A birth occurring to a mother who was not married at the time of conception or at the time of birth or at any time between conception and birth. Obsolete terminology. Current usage is Birth to Unmarried Mother, but the definition remains unchanged.
Peer Group:
A group of counties with similar population densities in persons per square mile, as adopted by the Kansas Department of Health and Environment, Bureau of Local and Rural Health.
Perinatal Period III Death: The aggregate total of stillbirths (fetus weighs over 350 grams) and hebdomadal deaths (deaths that occur prior to the 7th day of life).

DEFINITIONS (cont.)
Population Density: The average number of inhabitants per square mile.
Population Group: A reporting matrix of race and Hispanic origin (ethnicity) information comprised of distinct categories.
Post-Hebdomadal Death: The death of a live-born infant occurring seven days to prior to the twenty-eighth day of life.
Post-Neonatal Death: The death of a live-born infant occurring 28 days to prior to the 365th day of life.
Pregnancy-Associated Death: The death of any woman, from any cause, while pregnant or within one calendar year of termination of pregnancy, regardless of the duration and the site of pregnancy. Maternal deaths are a subset of pregnancy-associated deaths.
Prenatal Care: Pregnancy-related health care services provided to a woman between conception and delivery.
Previous Pregnancy: Includes all previous reported spontaneous terminations, previous induced abortions, children born still living and children born now dead.
Puerperium: Period of time after delivery, usually six to eight weeks, during which all maternal reproductive organs return to the normal pre-pregnancy condition.
Small for Gestational Age (SGA):
Condition where the live born infant’s birth weight lies below the 10th percentile for that gestational age.
Stillbirth:
Effective July 1, 2014, the definition of stillbirth changed. The new definition is: “Any complete expulsion or extraction from its mother of a product of human conception, the gestation of which is 20 weeks or greater, resulting in other than a live birth, and which is not an induced termination of pregnancy.”
The old definition used until June 30, 2014 used a fetal weight value of greater than 350 grams to determine whether a miscarriage was a reportable stillbirth.
Residence Data: Vital statistics compiled on the basis of the usual place of residence of the person(s) to whom the vital event occurred.
Teenage Pregnancy: A live birth, stillbirth or abortion occurring to a female under 20 years of age.
Total Reported: Used only for abortion reporting this represents all abortions reported regardless of residence or occurrence locations.

DEFINITIONS (cont.)
Trimester: A three-month period of time. First trimester care, for example, refers to care initiated in the first three months of pregnancy. When a pregnancy runs past the normal nine months (up to 11.75 months of pregnancy are possible according to CDC guidance) the additional months are considered part of the third trimester.
Very Low Birth Weight: Weight of a fetus or infant at delivery which is less than 1,500 grams (less than 3 pounds, 5 ounces).
Weeks Gestation: The number of weeks between first day of the last reported normal menses and the delivery of the fetus or infant.
Work-Related Injury: “Yes” has been selected in death certificate box 27c INJURY AT WORK.
Years of Life Expectancy at Birth:
The hypothetical number of years a newborn would live, on average, if (s)he experienced the levels of mortality prevailing within each age group at the time of his birth as he aged. The method used to calculate life expectancy for the Annual Summary is based on that posted by David Backus (Heinz Riehl Professor, Stern School of Business, New York University) at pages.stern.nyu.edu/~dbackus/BCH/ms/Espen_lifeexpectancy.pdf.
Years of Potential Life Lost (YPLL75):
A measurement of the number of years of potential life lost by each death occurring before the age of 75.

RATES AND RATIOS
Abortion Ratio: induced abortions x 1,000 live births
Age-Adjusted Ma Pa x 1,000 or
Death Rate: P 100,000 Where Ma = age-specific death rate per 1,000 or 100,000 population for a given age-group Pa = standard population in a given age-group P = total standard population
Age-Specific deaths in a specific age-group x 1,000 Death Rate: population in a specific age-group
Age-Specific live births in a specific age-group x 1,000 Fertility Rate: female population in a specific age-group
Birth Rate: live births x 1,000
total population
Cause-Specific cause-specific deaths x 100,000 Death Rate: total population
Death Rate: total deaths x 1,000
total population
Divorce Rate: divorces x 1,000 total population
Marriage divorces and annulments x 1,000 Dissolution Rate: total population Fertility Rate: live births x 1,000
female population 15-44
Stillbirth Rate: stillbirths x 1,000 live births + stillbirths
Hebdomadal Death hebdomadal deaths x 1,000 Rate: live births
Infant Death Rate: infant deaths x 1,000
live births Marriage Rate: marriages x 1,000
total population Maternal Death maternal deaths x 100,000 Rate: live births

RATES AND RATIOS (Cont.)
Natural Increase live birth rate minus total death rate Rate:
Neonatal Death neonatal deaths x 1,000 Rate: live births
Out-of-Wedlock out-of-wedlock births x 100 Birth Ratio: live births
Perinatal Period perinatal period III deaths x 1,000 III Death Rate: live births + stillbirths Post-Neonatal post-neonatal deaths x 1,000 Death Rate: live births Teenage Pregnancy live births, stillbirths, Rate: abortions for females
in a specific age-group x 1,000 female population in a specific age-group
Years of Potential years of potential life lost x 1,000 Life Lost Rate population

SYMBOLS AND ABBREVIATIONS
.
n.s. not stated
n.a not available
n/a not applicable
0.0 quantity or percent more than zero but less than 0.05

APPENDIX 1 Kansas County Codes and Groupings
County Name FIPS Code
Abbreviation Population Density Peer Group (2010)
Population Density Peer Group (2000)
Allen 001 AL Densely-Settled Rural Densely-Settled Rural Anderson 003 AN Rural RuralAtchison 005 AT Densely-Settled Rural Densely-Settled Rural Barber 007 BA Frontier FrontierBarton 009 BT Densely-Settled Rural Densely-Settled Rural Bourbon 011 BB Densely-Settled Rural Densely-Settled Rural Brown 013 BR Rural RuralButler 015 BU Semi-Urban Semi-UrbanChase 017 CS Frontier FrontierChautauqua 019 CQ Frontier Rural Cherokee 021 CK Densely-Settled Rural Densely-Settled Rural Cheyenne 023 CN Frontier Frontier Clark 025 CA Frontier FrontierClay 027 CY Rural RuralCloud 029 CD Rural RuralCoffey 031 CF Rural Rural Comanche 033 CM Frontier Frontier Cowley 035 CL Densely-Settled Rural Densely-Settled Rural Crawford 037 CR Semi-Urban Semi-UrbanDecatur 039 DC Frontier FrontierDickinson 041 DK Densely-Settled Rural Densely-Settled Rural Doniphan 043 DP Densely-Settled Rural Densely-Settled Rural Douglas 045 DG Urban Urban Edwards 047 ED Frontier FrontierElk 049 EK Frontier FrontierEllis 051 EL Densely-Settled Rural Densely-Settled Rural Ellsworth 053 EW Rural Rural Finney 055 FI Densely-Settled Rural Densely-Settled Rural Ford 057 FO Densely-Settled Rural Densely-Settled Rural Franklin 059 FR Semi-Urban Semi-UrbanGeary 061 GE Semi-Urban Semi-UrbanGove 063 GO Frontier Frontier Graham 065 GH Frontier Frontier Grant 067 GT Rural Rural Gray 069 GY Rural RuralGreeley 071 GL Frontier FrontierGreenwood 073 GW Frontier RuralHamilton 075 HM Frontier Frontier Harper 077 HP Rural Rural Harvey 079 HV Semi-Urban Semi-UrbanHaskell 081 HS Rural RuralHodgeman 083 HG Frontier FrontierJackson 085 JA Densely-Settled Rural Rural Jefferson 087 JF Densely-Settled Rural Densely-Settled Rural Jewell 089 JW Frontier Frontier Johnson 091 JO Urban UrbanKearny 093 KE Frontier FrontierKingman 095 KM Rural RuralKiowa 097 KW Frontier Frontier Labette 099 LB Densely-Settled Rural Densely-Settled Rural Lane 101 LE Frontier Frontier Leavenworth 103 LV Urban Semi-UrbanLincoln 105 LC Frontier FrontierLinn 107 LN Rural Rural

County Name FIPS Code
Abbreviation Population Density Peer Group (2010)
Population Density Peer Group (2000)
Logan 109 LG Frontier FrontierLyon 111 LY Densely-Settled Rural Semi-Urban McPherson 113 MP Densely-Settled Rural Densely-Settled Rural Marion 115 MN Rural Rural Marshall 117 MS Rural RuralMeade 119 ME Frontier FrontierMiami 121 MI Semi-Urban Semi-UrbanMitchell 123 MC Rural Rural Montgomery 125 MG Semi-Urban Semi-Urban Morris 127 MR Rural RuralMorton 129 MT Frontier FrontierNemaha 131 NM Rural RuralNeosho 133 NO Densely-Settled Rural Densely-Settled Rural Ness 135 NS Frontier Frontier Norton 137 NT Rural Rural Osage 139 OS Densely-Settled Rural Densely-Settled Rural Osborne 141 OB Frontier FrontierOttawa 143 OT Rural RuralPawnee 145 PN Rural Rural Phillips 147 PL Rural Rural Pottawatomie 149 PT Densely-Settled Rural Densely-Settled Rural Pratt 151 PR Rural RuralRawlins 153 RA Frontier FrontierReno 155 RN Semi-Urban Semi-Urban Republic 157 RP Rural Rural Rice 159 RC Rural Rural Riley 161 RL Semi-Urban Semi-UrbanRooks 163 RO Frontier RuralRush 165 RH Frontier FrontierRussell 167 RS Rural Rural Saline 169 SA Semi-Urban Semi-Urban Scott 171 SC Rural Rural Sedgwick 173 SG Urban UrbanSeward 175 SW Densely-Settled Rural Densely-Settled Rural Shawnee 177 SN Urban Urban Sheridan 179 SD Frontier Frontier Sherman 181 SH Frontier Rural Smith 183 SM Frontier FrontierStafford 185 SF Frontier RuralStanton 187 ST Frontier FrontierStevens 189 SV Rural Rural Sumner 191 SU Densely-Settled Rural Densely-Settled Rural Thomas 193 TH Rural Rural Trego 195 TR Frontier FrontierWabaunsee 197 WB Rural RuralWallace 199 WA Frontier Frontier Washington 201 WS Rural Rural Wichita 203 WH Frontier Frontier Wilson 205 WL Rural RuralWoodson 207 WO Rural RuralWyandotte 209 WY Urban Urban

APPENDIX 2 Population Density County Peer Groups
FrontierBarber Chase Chautauqua Cheyenne Clark ComancheDecatur Edwards Elk Gove Graham Greeley Greenwood Hamilton Hodgeman Jewell Kearny Kiowa Lane Lincoln Logan Meade Morton Ness Osborne Rawlins Rooks Rush Sheridan Sherman Smith Stafford Stanton Trego Wallace Wichita
RuralAnderson Brown Clay Cloud Coffey Ellsworth Grant Gray Harper Haskell Kingman Linn Marion Marshall Mitchell Morris Nemaha NortonOttawa Pawnee Phillips Pratt Republic Rice Russell Scott Stevens Thomas Wabaunsee WashingtonWilson Woodson
Densely-Settled RuralAllen Atchison Barton Bourbon Cherokee Cowley Dickinson Doniphan Ellis Finney Ford Jackson Jefferson Labette Lyon McPherson Neosho OsagePottawatomie Seward Sumner
Semi-UrbanButler Crawford Franklin Geary Harvey Miami Montgomery Reno Riley Saline
UrbanDouglas Johnson Leavenworth Sedgwick Shawnee Wyandotte
Italicized counties changed peer group after the 2010 Census.

APPENDIX 3 Metric to English Conversions for Birth Weight Categories
Metric (grams)
English (pounds)
English (ounces)
500 1 2 1000 2 3 1500 3 5 2000 4 7 2500 5 8 3000 6 10 3500 7 11 4000 8 13 4500 9 15 5000 11 0
1 ounce = 28.349 grams. English equivalents are rounded to the nearest ounce.

APPENDIX 4 List of 39 Selected Causes of Death NUMBER CAUSE OF DEATH ICD-10 CODES 1 Tuberculosis A16-A19 2 Syphilis A50-A53 3 Human immunodeficiency virus (HIV) disease B20-B24 Malignant neoplasms C00-C97 4 Malignant neoplasm of stomach C16 5 Malignant neoplasm of colon, rectum and anus C18-C21 6 Malignant neoplasm of pancreas C25 7 Malignant neoplasm of trachea, bronchus and lung C33-C34 8 Malignant neoplasm of breast C50 9 Malignant neoplasm of cervix uteri, corpus uteri and ovary C53-C56 10 Malignant neoplasm of prostate C61 11 Malignant neoplasm of urinary tract C64-C68 12 Non-Hodgkin’s lymphoma C82-C85 13 Leukemia C91-C95 14 All other malignant neoplasms C00-C15, C17, C22-C24, C26-C32, C37-C49 C51-C52, C57-C60, C62-C63, C69-C81, C88, C90, C96-C97 15 Diabetes mellitus E10-E14 16 Alzheimer’s disease G30 Major cardiovascular diseases I00-I78 Diseases of heart I00-I09, I11, I13, I20-I51 17 Hypertensive heart disease with or without renal disease I11, I13 18 Ischemic heart disease I20-I25 19 Other diseases of heart I00-I09, I26-I51 a. Acute Rheumatic Fever and Chronic Rheumatic Heart Disease I00-I09 b. Pulmonary Heart Disease and Diseases of Pulmonary Circulation I26-I28 c. Other Forms of Heart Disease I30-I51 20 Essential hypertension and hypertensive renal disease I10, I12, I15 21 Cerebrovascular disease I60-I69 a. Subarachnoid Hemorrhage I60 b. Intracerebral and other intercranial hemorrhage I61-I62 c. Cerebral Infarction I63 d. Stroke, not specified as hemorrhage or infarction I64 e. Other cerebrovascular diseases I67, I69 22 Atherosclerosis I70 23 Other diseases of circulatory system I71-I78 24 Influenza and pneumonia J09-J18 25 Chronic lower respiratory diseases J40-J47 26 Peptic ulcer K25-K28 27 Chronic liver disease and cirrhosis K70, K73-K74 28 Nephritis, nephrotic syndrome and nephrosis N00-N07, N17-N19, N25-N27 29 Pregnancy, childbirth and the puerperium O00-O99 30 Certain conditions originating in the perinatal period P00-P96 31 Congenital malformations, deformations and chromosomal abnormalities Q00-Q99 32 Sudden infant death syndrome (SIDS) R95 33 Symptoms, signs and abnormal clinical and laboratory findings, not elsewhere classified (excluding Sudden infant death syndrome) R00-R94, R96-R99 34 All other diseases (residual) A00-A09, A20-A49, A54-B19, B25-B99, D00-E07, E15-G25, G31-H93, I60-J06, J20-J39, J60-K22, K29-K66, K71-K72, K75-M99, N10-N15, N20-N23, N28-N98, U04 External causes of Mortality *U01-*U04, V01-Y89 Unintentional Injuries V01-X59, Y40-Y86, Y88 35 Motor vehicle accidents V02-V04, V09.0, V09.2, V12-V14, V19.0-V19.2, V19.4-V19.6, V20-V79, V80.3-V80.5, V81.0-V81.1, V82.0-V82.1, V83-V86, V87.0-V87.8, V88.0-V88.8, V89.0, V89.2 a. Traffic V02-V04 (.1, .9), V09.2, V12-V14 (.3-.9), V19 (.4-.6), V20-V28 (.3-.9), V29-V79 (.4-.9), V80 (.3-.5), V81.1,

V82.1, V83-V86 (.0-.3), V87 (.0-.8), V89.2 b. Non-Traffic V02-V04 (.0), V09.0, V12-V14 (.0-.2), V19 (.0-.3), V20-V28 (.0-.2), V29-V79 (.0-.3), V81.0, V82.0, V83-V86 (.4-.9), V88 (.0-.8), V89.0 36 All other and unspecified accidents and adverse effects V01, V05-V06, V09.1, V09.3-V09.9, V10-V11, V15-V18, V19.3, V19.8-V19.9, V80.0-V80.2, V80.6-V80.9, V81.2-V81.9, V82.2-V82.9, V87.9, V88.9, V89.1, V89.3, V89.9, V90-X59, Y40-Y86, Y88 a. Water transport V90-V94 b. Air and space transport V95-V97 c. Falls W00-W19 d. Inanimate mechanical forces W20-W49 e. Drowning and submersion W65-W74 f. Other accidental threats to breathing W75-W84 g. Electric current, radiation and air temperature/pressure W85-W99 h. Smoke, fire and flames X00-X09 i. Forces of nature X30-X39 j. Poisoning X40-X49 k. Other unintentional injuries V01, V05-V06, V09.1, V09.3-V09.9, V10-V11, V15-V18, V19.3, V19.8-V19.9, V80.0-V80.2, V80.6-V80.9, V81.2-V81.9, V82.2-V82.9, V87.9, V88.9, V98-V99, W50-W64, X10-X29, X50-X59, Y85-Y86 l. Complications of medical and surgical care Y40-Y84, Y88 37 Intentional self-harm (suicide) *U03, X60-X84, Y87.0 38 Assault (homicide) *U01-*U02, X85-Y09, Y87.1 39 All other external causes Y10-Y36, Y87.2, Y89

APPENDIX 5 Cause of Death Groupings for Infant Death Tables NUMBER* CAUSE OF DEATH ICD-10 CODES Infectious and Parasitic Diseases A00-B98 Other Diseases and Disorders C00-O99 30 Certain Conditions Originating in the Perinatal Period P00-P96 Maternal Factors and Complications of Pregnancy, Labor and Delivery P00-P04 Disorders Relating to Short Gestation and Low Birth Weight P07 Birth Trauma P10-P15 Hypoxia and Birth Asphyxia P20-P21 Respiratory Distress of Newborn P22 Congenital Pneumonia P23 Other Respiratory Conditions of Newborn P24-P28 Bacterial Sepsis of Newborn P36 Omphalitis of Newborn w/wo Mild Hemorrhage P 38 Hemorrhagic and Hematologic Disorders of Fetus and Newborn P50-P61 Other Perinatal Conditions P05, P08, P29, P35, P37, P39, P70-P96 31 Congenital Anomalies Q00-Q99 Symptoms and Abnormal Findings R00-R99 32 Sudden Infant Death Syndrome R95 33 Symptoms, signs and abnormal clinical and laboratory findings, not elsewhere classified (excluding Sudden infant death syndrome) R00-R94, R96-R99 External causes of Mortality *U01-*U04, V01-Y89 * Number indicates categories that are the same as one of the 39 Leading Categories of Death listed in Appendix 4.

APPENDIX 6 Cause of Death Groupings for Cancer by Site of Lesion NUMBER* CAUSE OF DEATH ICD-10 CODES Malignant neoplasms C00-C97 Malignant neoplasm of lip, oral cavity and pharynx C00-C14 Malignant neoplasm of digestive organs C15-C26 Malignant neoplasm of respiratory and intrathoracic organs C30-C39 Malignant neoplasm of bone and articular cartilage C40-C41 Malignant neoplasm of skin C43-C44 Malignant neoplasm of mesothelial and soft tissue C45-C59 8 Malignant neoplasm of breast C50 Malignant neoplasm of genital organs C51-C63 11 Malignant neoplasm of urinary tract C64-C68 Malignant neoplasm of eye and adnexa C69 Malignant neoplasm of meninges, brain and other parts of the central nervous system C70-C72 Malignant neoplasm of thyroid and other endocrine glands C73-C75 Malignant neoplasm of other and unspecified sites C76-C80, C97 13 Leukemia C91-C95 Malignant neoplasm of other lymphoid, hematpoietic and related tissue C81-C90, C96 * Number indicates categories that are the same as one of the 39 Leading Categories of Death listed in Appendix 4.

APPENDIX 7 Cause of Death ICD-10 Code Groupings for the Injury Matrix Cause Group Unintentional Suicide Homicide Undetermined Legal/WarCut/Pierce W25-W29, W45 X78 X99 Y28 Y35.4Drowning W65-W74 X71 X92 Y21 --- Falls W00-W19 X80 Y01 Y30 --- Fire/flame X00-X09 X76 X97 Y26 --- Hot Object/ Scalding X10-X19 X77 X98 Y27 --- Firearm W32-W34 X72-X74 U01.4, X93-X95 Y22-Y24 Y35.0Machinery W24, W30-31 --- --- --- --- Motor Vehicle Traffic [V02-V04] (.1,.9),
V09.2, [V12-V14] (.3-.9), V19 (.4-.6), [V20-V28] (.3-.9), [V29-V79] (.4-.9), V80 (.3-.5), V81.1, V82.1, [V83-V86] (.0-.3), V87 (.0-.8), V89.2
--- --- --- ---
Other Pedal Cyclist V10-V11, [V12-V14] (.0-.2), V15-V18, V19 (.0-.3, .8, .9)
--- --- --- ---
Other Pedestrian V01, [V02-V04] (.0), V05, V06, V09 (.0-.1, .3, .9)
--- --- --- ---
Other Land Transport [V20-V28] (.0-.2), [V29-V79] (.0-.3), V80 (.0-.2, .6-.9), [V81-V82] (.0-.2, .9), [V83-V86] (.4-.9), V87.9, V88 (.0-.9), V89 (.0, .1, .3, .9)
X82 Y03 Y32 ---
Other Transport V90-V99 --- U01.1 --- Y36.1 Natural/Environmental W42-W43, W53-
W64, W92-W99, X20-X39, X51-X57
--- --- --- ---
Overexertion X50 --- --- --- --- Poisoning X40-X49 X60-X69 U01 (.6-.7), X85-
X90Y10-Y19 Y35.2
Struck By/Against W20-W22, W50-W52
X79 Y00, Y04 Y29 Y35.3
Suffocation W75-W84 X70 X91 Y20 --- Other Specified Y85 --- --- --- Y36 (.0, .2, .4-
.8) NEC X58, Y86 X83, Y87.0 U01.8, U02, Y08,
Y87.1 Y33, Y87.2 Y35.6, Y89 (.0-
.1) Not Specified X59, X84 U03.9 U01.9, Y09 Y34, Y89.9 Y35.7, Y36.9

APPENDIX 8 Cause of Death Groupings for Stillbirth Tables NUMBER* CAUSE OF DEATH ICD-10 CODES 30 Certain Conditions Originating in the Perinatal Period P00-P96 Fetus Affected by Maternal Conditions P00 Fetus Affected by maternal Complications of Pregnancy P01 Fetus Affected by Complications of Placenta, Cord & Membrane P02 Fetus Affected by Complications of Labor and Delivery P03 Disorders Relating to Short Gestation and Low Birth Weight P07 Hypoxia and Birth Asphyxia P20-P21 Cardiovascular Disorders P29 Hemorrhagic and Hematologic Disorders of Fetus P50-P54, P56 Unspecified Cause P95 Other Perinatal Conditions P04-P05, P08-P15, P22-P28, P35- P39, P55, P57-P94. P96 31 Congenital Anomalies Q00-Q99 All Other Causes All others * Number indicates categories that are the same as one of the 39 Leading Categories of Death listed in Appendix 4.

VS233 Rev. 05/01/2010
Kansas Department of Health and Environment Office of Vital Statistics
CERTIFICATE OF STILLBIRTH (FETAL DEATH)
State File Number
1. NAME (First, Middle, Last, Suffix) 2. DATE OF DELIVERY (Month, Day, Year) 3. TIME OF DELIVERY
M
4. SEX 5. CITY, TOWN, OR LOCATION OF DELIVERY 6. COUNTY OF DELIVERY
7. PLACE OF DELIVERY
Hospital Freestanding Birthing Center Home Delivery Clinic/Doctor’s Office Other (Specify)
8. FACILITY NAME (If not institution, give street and number and zip code)
9. MOTHER’S CURRENT LEGAL NAME (First, Middle, Last, Suffix) 10. MOTHER’S LAST NAME PRIOR TO FIRST MARRIAGE
11. DATE OF BIRTH (Month, Day, Year) 12. BIRTHPLACE (State, Territory, or Foreign Country) 13. PRESENT RESIDENCE-STATE
14. COUNTY 15. CITY, TOWN, OR LOCATION 16. STREET AND NUMBER OF PRESENT RESIDENCE
17. ZIPCODE 18. INSIDE CITY LIMITS?
Yes No
19. MOTHER’S MAILING ADDRESS (If same as residence, leave blank)
20. FATHER’S CURRENT LEGAL NAME (First, Middle, Last, Suffix) 21. DATE OF BIRTH (Month, Day, Year) 22. BIRTHPLACE (State, Territory, or Foreign Country)
23. I CERTIFY THAT THE PERSONAL INFORMATION PROVIDED ON THE CERTIFICATE IS CORRECT TO THE BEST OF MY KNOWLEDGE AND BELIEF.
Signature of Parent (or Other Informant)
24. DATE SIGNED (Month, Day, Year)
25. CAUSE/CONDITIONS CONTRIBUTING TO FETAL DEATH 25a. INITIATING CAUSE/CONDITION (Among the choices below, please select the one which most likely began the sequence of events resulting in the death of the fetus.)
Maternal Conditions/Diseases (Specify) Complications of Placenta, Cord, or Membranes – Rupture of membranes prior to onset of labor Abruptio placenta Placental insufficiency Prolapsed cord Chorioamnionitis Other (Specify)
Other Obstetrical or Pregnancy Complications (Specify) Fetal Injury (Specify) Other Fetal Conditions/Disorders (Specify)
Fetal Anomaly (Specify) Fetal Infection (Specify)
Unknown
25b. OTHER SIGNIFICANT CAUSES OR CONDITIONS (Select or specify all other conditions contributing to death in item 25a.)
Maternal Conditions/Diseases (Specify) Complications of Placenta, Cord, or Membranes – Rupture of membranes prior to onset of labor Abruptio placenta Placental insufficiency Prolapsed cord Chorioamnionitis Other (Specify)
Other Obstetrical or Pregnancy Complications (Specify) Fetal Injury (Specify) Other Fetal Conditions/Disorders (Specify)
Fetal Anomaly (Specify) Fetal Infection (Specify)
Unknown
26. ESTIMATED TIME OF FETAL DEATH Dead at time of first assessment, no labor ongoing Dead at time of first assessment, labor ongoing Died during labor, after first assessment Unknown time of fetal death
27a. WAS AN AUTOPSY PERFORMED? Yes No Planned
27b. WAS A HISTOLOGICAL PLACENTAL EXAMINATION PERFORMED? Yes No Planned
27c. WERE AUTOPSY OR HISTOLOGICAL PLACENTAL EXAMINATION RESULTS USED IN DETERMINING THE CAUSE OF FETAL DEATH? Yes No
28. I CERTIFY THAT THIS DELIVERY OCCURRED ON THE DATE STATED ABOVE AND THE FETUS WAS BORN DEAD.
Signature
29. DATE SIGNED (Month, Day, Year) 30. ATTENDANT’S NAME AND TITLE (If delivery not attended by physician) Name (Type) ________________________________________________________
CNM/CM Other Midwife Other (Specify)_____________________ 31. CERTIFIER’S NAME AND TITLE (Type)
M.D. D.O. Other (Specify)
32. CERTIFIER’S MAILING ADDRESS (Street and Number or Rural Route, City or Town, State, Zip Code)
33a. METHOD OF DISPOSITION
Burial Cremation Donation
Hospital Disposition Removal from State
Other (Specify)
33b. PLACE OF DISPOSITION (Name of cemetery, crematory, or other place) 33c. LOCATION (City or Town, and State)
34. FUNERAL DIRECTOR OR HOSPITAL ADMINISTRATOR
Signature
35. FIRM OR HOSPITAL NAME AND ADDRESS 36. DATE FILED BY STATE REGISTRAR (Month, Day, Year)

VS233 Rev. 05/01/2010 Pg 2 of 3
CONFIDENTIAL INFORMATION FOR INTERNAL USE ONLY
37. IF HOME DELIVERY, WAS DELIVERY PLANNED AT HOME? Yes No Unknown 38. MOTHER’S MEDICAL RECORD NO.
39a. WAS MOTHER EVER MARRIED? Yes No Unknown 39b. MOTHER MARRIED? (At birth, conception or any time between) Yes No Unknown
40. PARENT’S HISPANIC ORIGIN (Check the box or boxes that best describes whether the parent is Spanish, Hispanic, or Latino. Check the “no” box if the parent is not Spanish, Hispanic, or Latino.)
41. PARENT’S RACE (Check one or more races to indicate what you consider yourself to be.)
41a. MOTHER 41b. FATHER
40a. MOTHER-
No, not Spanish/ Hispanic/Latina
Yes, Mexican/Mexican American/Chicana
Yes, Puerto Rican
Yes, Cuban
Yes, Central American
Yes, South American
Yes, other Spanish/ Hispanic/Latina (Specify)
Unknown
40b. FATHER-
No, not Spanish/ Hispanic/Latino
Yes, Mexican/Mexican American/Chicano
Yes, Puerto Rican Yes, Cuban Yes, Central American Yes, South American Yes, other Spanish/
Hispanic/Latino (Specify)
Unknown
White Black or African
American American Indian or
Alaska Native (Name of the enrolled or principal tribes)
Asian Indian Chinese Filipino Japanese
Korean Vietnamese Other Asian
(Specify)
Native Hawaiian Guamanian or
Chamorro Samoan Other Pacific Islander
(Specify)
Other (Specify)
Unknown
White Black or African
American American Indian or
Alaska Native (Name of the enrolled or principal tribes)
Asian Indian Chinese Filipino Japanese
Korean Vietnamese Other Asian
(Specify)
Native Hawaiian Guamanian or
Chamorro Samoan Other Pacific Islander
(Specify)
Other (Specify)
Unknown
42. ANCESTRY - What is the parents’ ancestry or ethnic origin?- Italian, German, Dominican, Vietnamese, Hmong, French Canadian, etc. (Specify below)
43. OCCUPATION AND BUSINESS/INDUSTRY
Occupation Business/Industry (Do not give name of company.)
42a. MOTHER 43a. MOTHER (Most recent) 43c. MOTHER
42b. FATHER 43b. FATHER (Usual) 43d. FATHER
44. EDUCATION (Check the box that best describes the highest degree or level of school completed at the time of delivery.) 44a. MOTHER’S EDUCATION 8th grade or less 9th - 12th grade, no diploma High school graduate or GED Some College credit, but no degree Associate degree (e.g., AA,AS) Bachelor’s degree (e.g., BA, AB, BS)
Unknown Master’s degree (e.g., MA, MS, MEng, MEd, MSW, MBA) Doctorate (e.g., PhD, EdD) or Professional degree (e.g., MD, DDS, DVM, LLB, JD)
44a. FATHER’S EDUCATION 8th grade or less 9th - 12th grade, no diploma High school graduate or GED Some College credit, but no degree Associate degree (e.g., AA,AS) Bachelor’s degree (e.g., BA, AB, BS)
Unknown Master’s degree (e.g., MA, MS, MEng, MEd, MSW, MBA) Doctorate (e.g., PhD, EdD) or Professional degree (e.g., MD, DDS, DVM, LLB, JD)
45. PREVIOUS LIVE BIRTHS (Do not include this child.)
46. NUMBER OF OTHER OUTCOMES (Spontaneous or induced losses or ectopic or stillbirth pregnancies)
47. PLURALITY – Single, Twin, Triplet, etc. (Specify)
48. IF NOT A SINGLE BIRTH – Born First, Second, Third, etc. (Specify)
45a. Now living Number None
45b. Now dead Number None
46a. Before 20 weeks Number
None
46b. 20 weeks & over Number
None
49. DATE LAST NORMAL MENSES BEGAN (Month, Day, Year)
50. OBSTETRIC ESTIMATE OF GESTATION (Completed Weeks)
45c. DATE OF LAST LIVE BIRTH (Month, Year)
46c. DATE OF LAST OTHER PREGNANCY OUTCOME (Month, Year)
51. WEIGHT OF FETUS (grams)
52. PRENATAL CARE?
Yes No
53. DATE OF FIRST PRENATAL CARE VISIT (Month, Day, Year)
54. DATE OF LAST PRENATAL CARE VISIT (Month, Day, Year)
55. PRENATAL VISIT – Total number (If none, enter “0”)
56. CIGARETTE SMOKING BEFORE & DURING PREGNANCY: Did mother smoke 3 mos. before or during pregnancy? Yes No Unknown
For each time period, enter either the number of cigarettes or the number of packs of cigarettes smoked per day. If none, enter “0". Average number of cigarettes or packs of cigarettes smoked per day:
No. No. Three months before pregnancy: cigarettes or packs First three months of pregnancy: cigarettes or packs Second three months of pregnancy: cigarettes or packs Third Trimester of pregnancy: cigarettes or packs
57. PRINCIPAL SOURCE OF PAYMENT FOR THIS DELIVERY
Medicaid Private/Employer Ins. Self-pay
Indian Health Service CHAMPUS/TRICARE Other government
Other Unknown
58a. MOTHER TRANSFERRED IN FOR DELIVERY DUE TO MATERNAL, MEDICAL, OR FETAL INDICATIONS? Yes No (If yes, enter facility name)
58b. FACILITY TRANSFERRED FROM:
CHILD’S NAME MOTHER’S NAME

VS233 Rev. 05/01/2010 Pg 3 of 3
PRENATAL LABOR-DELIVERY/STILLBORN FETUS
59. NUTRITION OF MOTHER
1. Height 2. Prepregnancy
Weight 3. Weight at delivery 4. Did mother get WIC food for
herself? Yes No Unknown
62. MATERNAL MORBIDITY (Check all that apply.) (These are complications associated with labor and delivery.)
1. Maternal transfusion
2. Third or fourth degree perineal laceration
3. Ruptured uterus
4. Unplanned hysterectomy
5. Admission to intensive care unit
6. Unplanned operating room procedure following delivery
7. None of the above
60. MEDICAL RISK FACTORS (Check all that apply.)
1. Diabetes, prepregnancy 2. Diabetes, gestational 3. Hypertension
Prepregnancy (Chronic) Gestational (PIH, preeclampsia) Eclampsia
4. Previous preterm birth 5. Other previous poor pregnancy outcome (SGA, perinatal death, etc.) 6. Vaginal bleeding during this pregnancy prior to labor 7. Pregnancy resulted from infertility treatment (If yes, check all that apply.)
Fertility-enhancing drugs, Artificial insemination or Intrauterine insemination
Assisted reproductive technology (e.g. in vitro fertilization (IVF), gamete intrafallopian transfer (GIFT))
8. Mother had a previous cesarean delivery, if yes, how many Number
9. Alcohol use No. of drinks per week: ______ 10. None of the above
63. INFECTIONS PRESENT AND/OR TREATED (During this pregnancy, check all that apply.)
1. Gonorrhea
2. Syphilis
3. Herpes Simplex Virus (HSV)
4. Chlamydia
5. Listeria
6. Group B Streptococcus
7. Cytomeglovirus
8. Parvo virus
9. Toxoplasmosis
10. AIDS or HIV antibody
11. None of the above
12. Other (Specify) _____________________
61. METHOD OF DELIVERY
1. Forceps attempted? Yes No Successful: Yes No
2. Vacuum extraction attempted? Yes No Successful: Yes No
3. Fetal presentation at delivery Cephalic Breech Other
4. Final route and method of delivery (check one)
Vaginal/spontaneous Vaginal/forceps Vaginal/vacuum
Cesarean, if cesarean was a trial of labor attempted? Yes No
5. Hysterotomy/Hysterectomy Yes No
64. CONGENITAL ANOMALIES OF THE NEWBORN (Check all that apply.)
1. Anencephaly
2. Meningomyelocele/Spina bifida
3. Cyanotic congenital heart disease
4. Congenital diaphragmatic hernia
5. Omphalocele
6. Gastroschisis
7. Limb reduction defect (excluding congenital amputation and dwarfing syndromes)
8. Cleft Lip with or without Cleft Palate
9. Cleft Palate alone
10. Down Syndrome
Karyotype confirmed
Karyotype pending
11. Suspected chromosomal disorder
Karyotype confirmed
Karyotype pending
12. Hypospadias
13. Fetal alcohol syndrome
14. Other congenital anomalies (Specify)
15. None of the above
THIS IS NOT PART OF THE CERTIFICATE OF STILLBIRTH
Test required by K.S.A. 65-153F, 153G
Serological Test Made: _____ 1st _____ 2nd _____ 3rd (Trimester) _____ At Delivery _____ Not Performed
If no test made, state reason: ____________________________________________________

Form VS240 Rev. 05/01/2010
Kansas Department of Health and Environment Office of Vital Statistics
CERTIFICATE OF LIVE BIRTH 115-
State File Number
1. CHILD’S NAME (First, Middle, Last, Suffix) 2. DATE OF BIRTH (Month, Day, Year) 3. TIME OF BIRTH
M
4. SEX 5. BIRTH WEIGHT (Grams) 6. CITY, TOWN, OR LOCATION OF BIRTH 7. COUNTY OF BIRTH
8. PLACE OF BIRTH
Hospital Freestanding Birthing Center Home Birth
Clinic/Doctor’s Office Other (Specify)
9. FACILITY NAME (If not institution, give street and number)
10. I CERTIFY THAT THE STATED INFORMATION CONCERNING THIS CHILD IS TRUE TO THE BEST OF MY KNOWLEDGE AND BELIEF.
Certifier’s
Signature
11. DATE SIGNED (Month, Day, Year)
12. ATTENDANT’S NAME AND TITLE (Type)
Name
M.D. D.O. C.N.M. Other Midwife
Other (Specify)
13. Certifier’s Name and Title (Type)
Name
M.D. D.O. Hosp Adm. C.N.M. Other Midwife
Other (Specify)
14. ATTENDANT’S MAILING ADDRESS (Street and Number or Rural Route, City, or Town, State, Zip Code)
15. MOTHER’S CURRENT LEGAL NAME (First, Middle, Last, Suffix) 16. MOTHER’S LAST NAME PRIOR TO FIRST MARRIAGE
17. DATE OF BIRTH (Month, Day, Year) 18. BIRTHPLACE (State, Territory, or Foreign Country) 19. PRESENT RESIDENCE-STATE
20. COUNTY 21. CITY, TOWN, OR LOCATION 22. STREET AND NUMBER OF PRESENT RESIDENCE
23. ZIP CODE 24. INSIDE CITY LIMITS?
YES
NO
25. MOTHER’S MAILING ADDRESS (If same as residence, leave blank)
26. FATHER’S CURRENT LEGAL NAME (First, Middle, Last, Suffix) 27. DATE OF BIRTH (Month, Day, Year) 28. BIRTHPLACE (State, Territory, or Foreign Country)
29. PARENTS REQUEST SOCIAL SECURITY NUMBER ISSUANCE?
YES NO
30. IMMUNIZATION REGISTRY
I wish to enroll my child in the Immunization Registry YES NO
31. I CERTIFY THAT THE PERSONAL INFORMATION PROVIDED ON THE CERTIFICATE IS CORRECT TO THE BEST OF MY KNOWLEDGE AND BELIEF.
Signature of Parent
(or Other Informant)
32. DATE SIGNED (Month, Day, Year) 33 DATE FILED BY STATE REGISTRAR (Month, Day, Year) (Vital Statistics only)

Form VS240 Rev. 05/01/2010 Pg 2 of 4
CONFIDENTIAL INFORMATION FOR INTERNAL USE ONLY
34. IF HOME BIRTH, WAS DELIVERY PLANNED AT HOME? Yes No Unknown
35. MOTHER’S SOCIAL SECURITY NUMBER 36. FATHER’S SOCIAL SECURITY NUMBER
37a. WAS MOTHER EVER MARRIED? Yes No Unknown 37b. MOTHER MARRIED? (At birth, conception or any time between) Yes No Unknown
37c. IF NO, HAS PATERNITY ACKNOWLEDGMENT BEEN SIGNED? Yes No 37d. MOTHER REFUSES TO GIVE HUSBAND’S INFORMATION Yes No
38. WHAT IS THE PRIMARY LANGUAGE SPOKEN IN THE HOME? English Spanish Vietnamese German French
Russian Ukrainian Mandarin Cantonese Sign Language Other (Specify)
39. PARENT’S HISPANIC ORIGIN (Check the box or boxes that best describes whether the parent is Spanish, Hispanic, or Latino. Check the “No” box if the parent is not Spanish, Hispanic, or Latino.)
40. PARENT’S RACE (Check one or more races to indicate what you consider yourself to be.)
40a. MOTHER 40b. FATHER
39a. MOTHER
No, not Spanish/ Hispanic/Latina
Yes, Mexican/Mexican American/Chicana
Yes, Puerto Rican
Yes, Cuban
Yes, Central American
Yes, South American
Yes, other Spanish/ Hispanic/Latina
(Specify)
Unknown
39b. FATHER
No, not Spanish/ Hispanic/Latino
Yes, Mexican/Mexican American/Chicano
Yes, Puerto Rican Yes, Cuban Yes, Central American Yes, South American Yes, other Spanish/
Hispanic/Latino
(Specify)
Unknown
White
Black or African American
American Indian or Alaska Native (Name of the enrolled or principal tribes)
Asian Indian
Chinese
Filipino
Japanese
Korean
Vietnamese
Other Asian (Specify)
Native Hawaiian
Guamanian or Chamorro
Samoan
Other Pacific Islander (Specify)
Other (Specify)
Unknown
White
Black or African American
American Indian or Alaska Native (Name of the enrolled or principal tribes)
Asian Indian
Chinese
Filipino
Japanese
Korean
Vietnamese
Other Asian (Specify)
Native Hawaiian
Guamanian or Chamorro
Samoan
Other Pacific Islander (Specify)
Other (Specify)
Unknown
41. ANCESTRY - What is the parents’ ancestry or ethnic origin?- Italian, German, Dominican, Vietnamese, Hmong, French Canadian, etc. (Specify below)
42. OCCUPATION AND BUSINESS/INDUSTRY
Occupation Business/Industry (Do not give name of company.)
41a. MOTHER 42a. MOTHER (Most recent) 42c. MOTHER
41b. FATHER 42b. FATHER (Usual) 42d. FATHER
43. EDUCATION (Check the box that best describes the highest degree or level of school completed at the time of delivery.)
43a. MOTHER’S EDUCATION 8th grade or less 9th - 12th grade; no diploma High school graduate or GED
Some College credit, but no degree Associate degree (e.g., AA,AS) Bachelor’s degree (e.g., BA, AB, BS)
Unknown Master’s degree (e.g., MA, MS, MEng, MEd, MSW, MBA) Doctorate (e.g., PhD, EdD) or Professional degree (e.g., MD, DDS, DVM, LLB, JD)
43b. FATHER’S EDUCATION 8th grade or less 9th - 12th grade; no diploma High school graduate or GED
Some College credit, but no degree Associate degree (e.g., AA,AS) Bachelor’s degree (e.g., BA, AB, BS)
Unknown Master’s degree (e.g., MA, MS, MEng, MEd, MSW, MBA) Doctorate (e.g., PhD, EdD) or Professional degree (e.g., MD, DDS, DVM, LLB, JD)
44. PREVIOUS LIVE BIRTHS (Do not include this child.)
45. NUMBER OF OTHER OUTCOMES (Spontaneous or induced losses or ectopic or stillbirth pregnancies)
46. PRENATAL CARE?
Yes No
49. PRENATAL VISITS-Total Number (If none, enter “0")
44a. Now living
Number
None
44b. Now dead
Number
None
45a. Before 20 weeks
Number
None
45b. 20 weeks & over
Number
None
47. DATE OF FIRST PRENATAL CARE VISIT (Month, Day, Year)
50. DATE LAST NORMAL MENSES BEGAN (Month, Day, Year)
44c. DATE OF LAST LIVE BIRTH (Month, Year)
45c. DATE OF LAST OTHER PREGNANCY OUTCOME (Month, Year)
48. DATE OF LAST PRENATAL CARE VISIT (Month, Day, Year)
51. OBSTETRIC ESTIMATE OF GESTATION (Completed Weeks)
52. PLURALITY-Single, Twin, Triplet, etc. (Specify)
53. IF NOT A SINGLE BIRTH – Born First, Second, Third, etc. (Specify)
54. TOTAL LIVE BIRTHS AT THIS DELIVERY
55. IS INFANT ALIVE AT THE TIME OF THIS REPORT?
Yes No Unknown
56. IS INFANT BEING BREAST-FED AT DISCHARGE?
Yes No Unknown
57. CIGARETTE SMOKING BEFORE & DURING PREGNANCY: Did mother smoke
3 mos. before or during pregnancy? Yes No Unknown
For each time period, enter either the number of cigarettes or the number of packs of cigarettes smoked per day during each time period. If none, enter “0".
Average number of cigarettes or packs of cigarettes smoked per day for each period: No. No.
Three months before pregnancy: cigarettes or packs
First three months of pregnancy: cigarettes or packs
Second three months of pregnancy: cigarettes or packs
Third Trimester of pregnancy: cigarettes or packs
58. PRINCIPAL SOURCE OF PAYMENT FOR THIS DELIVERY
Medicaid Private/Employer Ins. Self-pay
Indian Health Service CHAMPUS/TRICARE Other government
Other (Specify) Unknown
59. MOTHER’S MEDICAL RECORD NO. 60. NEWBORN’S MEDICAL RECORD NO.
61. MOTHER TRANSFERRED IN FOR DELIVERY DUE TO MATERNAL, MEDICAL, OR
FETAL INDICATIONS? Yes No (If yes, enter facility name)
FACILITY TRANSFERRED FROM:
62. INFANT TRANSFERRED (Within 24 hours of delivery)
Yes No (If yes, enter facility name)
FACILITY TRANSFERRED TO:

Form VS240 Rev. 05/01/2010 Pg 3 of 4
CHILD’S NAME MOTHER’S NAME
PRENATAL (Birth) LABOR-DELIVERY/NEWBORN
63. NUTRITION OF MOTHER
1. Height
2. Prepregnancy Weight
3. Weight at delivery
4. Did mother get WIC food for herself?
Yes No
Unknown
66. OBSTETRICAL PROCEDURES (Check all that apply.)
1. Cervical cerclage
2. Tocolysis
3. External cephalic version:
Successful
Failed
4. None of the above
70. INFECTIONS PRESENT AND/OR TREATED (During this pregnancy, check all that apply.)
1. Gonorrhea
2. Syphilis
3. Herpes Simplex Virus (HSV)
4. Chlamydia
5. Hepatitis B
6. Hepatitis C
7. AIDS or HIV antibody
8. None of the above
71. ABNORMAL CONDITIONS OF NEWBORN (Check all that apply)
1. Assisted ventilation required immediately following delivery
2. Assisted ventilation required for more than six hours
3. NICU admission
4. Newborn given surfactant replacement therapy
5. Antibiotics received by the newborn for suspected neonatal sepsis
6. Seizure or serious neurologic dysfunction
7. Significant birth injury (skeletal fracture(s), peripheral nerve injury, and/or soft tissue/solid organ hemorrhage which requires intervention
8. None of the above
64. MEDICAL RISK FACTORS (Check all that apply.)
1. Diabetes, prepregnancy
2. Diabetes, gestational 3. Hypertension
Prepregnancy (Chronic)
Gestational (PIH, preeclampsia)
Eclampsia
4. Previous preterm birth
5. Other previous poor pregnancy outcome (SGA, perinatal death, etc.)
6. Vaginal bleeding during this pregnancy prior to labor
7. Pregnancy resulted from infertility treatment (If yes, check all that apply.)
Fertility-enhancing drugs, Artificial insemination or Intrauterine insemination
Assisted reproductive technology (e.g. in vitro fertilization (IVF), gamete intrafallopian transfer (GIFT))
8. Mother had a previous cesarean delivery, if yes, how many? Number:
9. Alcohol use No. of drinks per week:
10. None of the above
67. ONSET OF LABOR (Check all that apply.)
1. Premature Rupture of the Membranes (prolonged, > 12 hours)
2. Precipitous Labor (< 3 hrs)
3. Prolonged Labor (> 20 hrs)
4. None of the above
68. CHARACTERISTICS OF LABOR AND DELIVERY (Check all that apply.)
1. Induction of labor
2. Augmentation of labor
3. Non-vertex presentation
4. Steroids (glucocorticoids) for fetal lung maturation received by the mother prior to delivery
5. Antibiotics received by the mother during labor
6. Clinical chorioamnionitis diagnosed during labor or maternal temperature > 38 C (100.4 F)
7. Moderate/heavy meconium staining of the amniotic fluid
8. Fetal intolerance of labor: (examples: in-utero resuscitative measures, further fetal assessment, or operative delivery)
9. Epidural or spinal anesthesia during labor
10. None of the above
72. VACCINES ADMINISTERED TO NEWBORN
1. Hepatitis B Date Given:
2. Other* Specify:
Date Given:
73. APGAR SCORE
1 min 5 min 10 min
74. CONGENITAL ANOMALIES OF THE NEWBORN (Check all that apply.)
1. Anencephaly
2. Meningomyelocele/Spina bifida
3. Cyanotic congenital heart disease
4. Congenital diaphragmatic hernia
5. Omphalocele
6. Gastroschisis
7. Limb reduction defect (excluding congenital amputation and dwarfing syndromes)
8. Cleft Lip with or without Cleft Palate
9. Cleft Palate alone
10. Down Syndrome
Karyotype confirmed
Karyotype pending
11. Suspected chromosomal disorder
Karyotype confirmed
Karyotype pending
12. Hypospadias
13. Fetal alcohol syndrome
14. Other congenital anomalies (Specify)
15. None of the above
65. METHOD OF DELIVERY
1. Forceps attempted? Yes No
Successful Yes No
2. Vacuum extraction attempted?
Yes No
Successful Yes No
3. Fetal presentation at delivery
Cephalic
Breech
Other
4. Final route and method of delivery (check one)
Vaginal/spontaneous Vaginal/forceps
Vaginal/vacuum
Cesarean, if cesarean was a trial of labor attempted? Yes No
69. MATERNAL MORBIDITY (Check all that apply.) (These are complications associated with labor and delivery.)
1. Maternal transfusion
2. Third or fourth degree perineal laceration
3. Ruptured uterus
4. Unplanned hysterectomy
5. Admission to intensive care unit
6. Unplanned operating room procedure following delivery
7. None of the above
Parent’s Telephone Number: ____________________

Form VS240 Rev. 05/01/2010 Pg 4 of 4
CHILD’S NAME MOTHER’S NAME
Test required by K.S.A. 65-153f 153G
Serological Test Made:
1st 2nd 3rd (Trimester)
At Delivery Not Performed
If no test made, state reason:
Test required by K.S.A. 65-180
Infant Neonatal Screening specimen taken:
Yes No
Kit Number ____________________
If no test made, state reason:
Test required by K.S.A. 65-1157A
Newborn Hearing Screening Accomplished:
Yes No
Infant’s patient number:
Infant’s Primary Care Physician
First Middle Last Title (MD, DO, etc.)
If screening accomplished, Date hearing screened / /
Month Day Year
The results of the hearing screening :
Right ear: Pass
Left ear: Pass
Refer for further testing
Refer for further testing
Physiologic equipment used : OAE AABR ABR
If screening not accomplished, one reason:
b – missed appointment
c – could not test
d – deceased
i – Incomplete test
m – Infant discharged before screening
n – transferred to NICU
o – other
r – did not consent
s – scheduled but not completed
t – transferred to another hospital
u – no information
x – invalid results
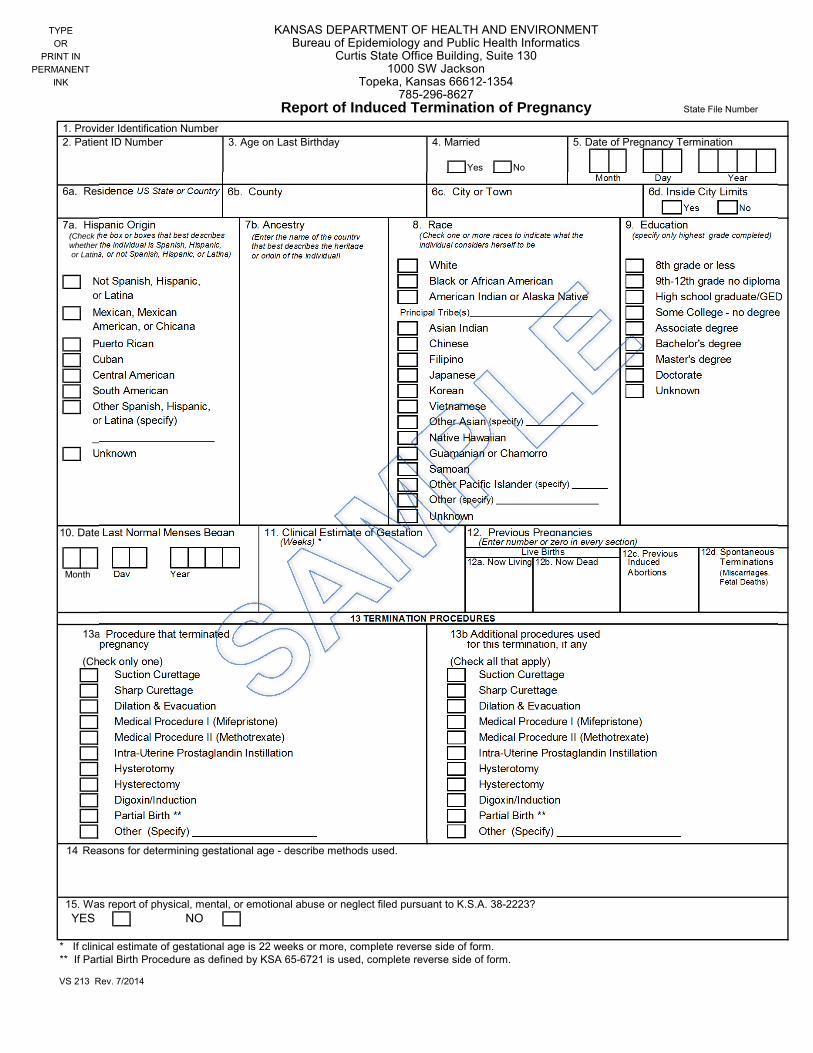
TYPE KANSAS DEPARTMENT OF HEALTH AND ENVIRONMENTOR Bureau of Epidemiology and Public Health Informatics
PRINT IN Curtis State Office Building, Suite 130PERMANENT 1000 SW Jackson
INK Topeka, Kansas 66612-1354785-296-8627
Report of Induced Termination of Pregnancy State File Number
1. Provider Identification Number 2. Patient ID Number 3. Age on Last Birthday 4. Married 5. Date of Pregnancy Termination
Yes NoMonth Day Year
6a. Residence US State or Country 6b. County 6c. City or Town 6d. Inside City LimitsYes No
7a. Hispanic Origin 7b. Ancestry 8. Race 9. Education(Check the box or boxes that best describes (Enter the name of the country (Check one or more races to indicate what the (specify only highest grade completed)whether the individual is Spanish, Hispanic, that best describes the heritage individual considers herself to be or Latina, or not Spanish, Hispanic, or Latina) or origin of the individual)
White 8th grade or lessNot Spanish, Hispanic, Black or African American 9th-12th grade no diploma
American Indian or Alaska Native High school graduate/GEDMexican, Mexican Principal Tribe(s)________________________ Some College - no degree
Asian Indian Associate degreePuerto Rican Chinese Bachelor's degreeCuban Filipino Master's degreeCentral American Japanese DoctorateSouth American Korean UnknownOther Spanish, Hispanic, Vietnamese
Other Asian (specify) ______________
________________________ Native HawaiianUnknown Guamanian or Chamorro
SamoanOther Pacific Islander (specify) _______
Other (specify) ____________________
Unknown10. Date Last Normal Menses Began 11. Clinical Estimate of Gestation 12. Previous Pregnancies
(Weeks) * (Enter number or zero in every section)Live Births 12c. Previous 12d.Spontaneous
12a. Now Living 12b. Now Dead Induced TerminationsMonth Day Year Abortions (Miscarriages,
Fetal Deaths)
13 TERMINATION PROCEDURES
13a Procedure that terminated 13b Additional procedures usedpregnancy for this termination, if any
(Check only one) (Check all that apply)Suction Curettage Suction CurettageSharp Curettage Sharp CurettageDilation & Evacuation Dilation & EvacuationMedical Procedure I (Mifepristone) Medical Procedure I (Mifepristone)Medical Procedure II (Methotrexate) Medical Procedure II (Methotrexate)Intra-Uterine Prostaglandin Instillation Intra-Uterine Prostaglandin InstillationHysterotomy HysterotomyHysterectomy HysterectomyDigoxin/Induction Digoxin/InductionPartial Birth ** Partial Birth **Other (Specify) _____________________ Other (Specify) _____________________
14 Reasons for determining gestational age - describe methods used.
15. Was report of physical, mental, or emotional abuse or neglect filed pursuant to K.S.A. 38-2223?YES NO
* If clinical estimate of gestational age is 22 weeks or more, complete reverse side of form.** If Partial Birth Procedure as defined by KSA 65-6721 is used, complete reverse side of form.
VS 213 Rev. 7/2014
or Latina
American, or Chicana
or Latina (specify)

If the clinical estimate of gestational age of the unborn child is 22 weeks or more, complete items 16 and 17.
16a If the clinical estimate of gestation age of the unborn child was 22 weeks or greater, indicate the reason why the abortionwas necessary.
To preserve the life of the pregnant woman
Prevent substantial and irreversible impairment of a major bodily function of the pregnant woman
16b Provide medical basis including specific medical diagnoses and diagnosis codes of the pregnant woman.
17a Was the unborn child viable?
YES NO
17b Provide medical basis including specific medical diagnoses and diagnosis codes and the reasons for the determinationof the viability/non-viability of the unborn child.
If a partial birth procedure was performed, complete item 18.
18. Provide the medical basis, including specific medical diagnoses and diagnosis codes, and reasons for the determinationthat a partial-birth procedure was necessary to save the life of the mother whose life is endangered by a physical disorder, physical illness or personal injury, including a life-endangering physical condition, caused by the pregnancy itself.
VS 213 Rev. 7/2014
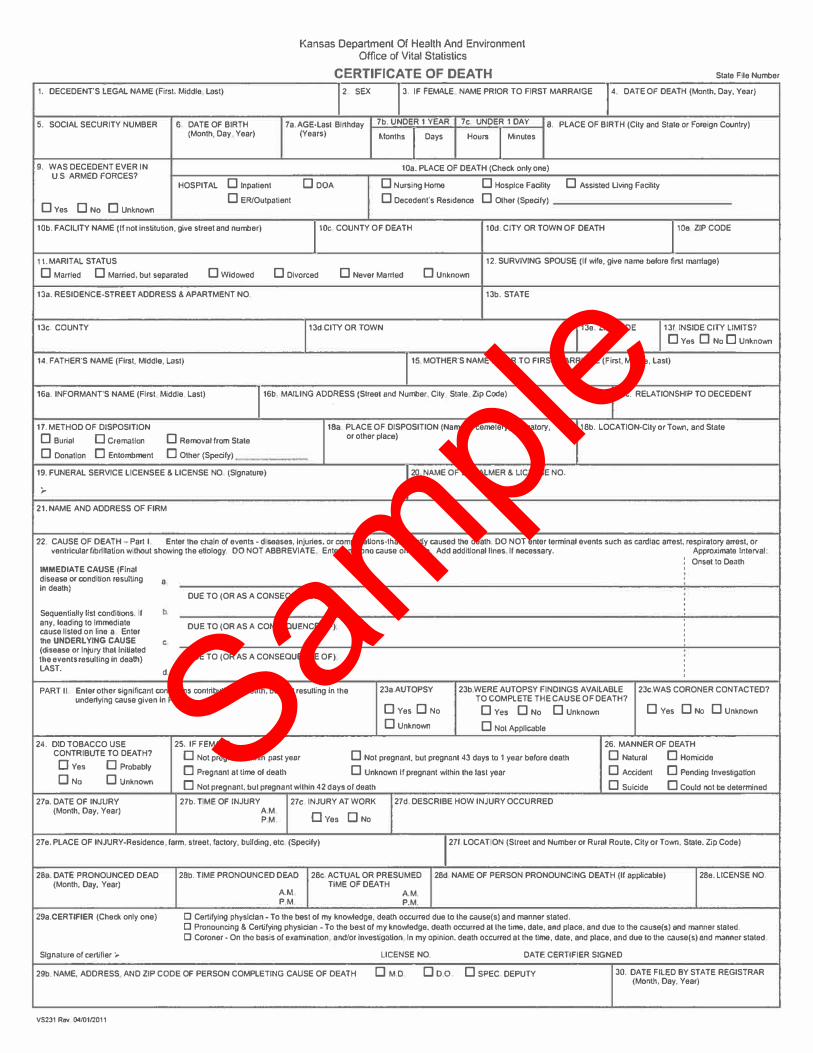
Kansas Department Of Health And Environment Office of Vital Statistics
CERTIFICATE OF DEATH State File Number
1. DECEDENT'S LEGAl NAME (Firs1. Middle Last)
1
2 SEX
1
3. IF FEMAlE NAME PRIOR TO FIRST MARRAIGE 14, DATE OF DEATH (Mon1h, Day, Year)
5. SOCIAL SECURITY NUMBER 6 DATE OF BIRTH 7a.AGE•Last Birthday 7b. UNDER 1 YEAR 7c UNDER 1 DAY 8. PLACE OF BIRTH (City and Stale or Foreign Coun1ry) (Month, Day Year) (Years) Months
I
Days Hours
I
Minutes
9. WAS DECEDENT EVER IN 10a. PLACE OF DEATH (Check only one) U.S ARMED FORCES?
D Inpatient DDoA D Nursing Home D Hospice Facility D Assls1ed Uving Facility HOSPITAl
DYes D No D Unknown D ER/Outpallen1 D Decedent's Residence D Other (Specify)
10b. FACILITY NAME (If nol lnstilution, give street and number)
1
10c COUNTY OF DEATH 10d. CITY OR TOWN OF DEATH
1
10a ZIP CODE
11. MARITAL STATUS 12. SURVIVING SPOUSE (If wife, give name before fiBI marriege) D Married D Married, but separa1ed Dw1dowed D Divorced D Never Married D Unknown
13a. RESIDENCE-STREET ADDRESS & APARTMENT NO. 13b. STATE
13c. COUNTY 13d.CITY OR TOWN 13e. ZIP CODE
1
131 INSIDE CITY LIMITS? D Yes D No D Unknown
14. FATHER'S NAME (First, Middle, Last)
1
15. MOTHER'S NAME PRIOR TO FIRST MARRIAGE (Fir.;t, Middle, Lasl)
16a. INFORMANT'S NAME (Flr.;t Middle Las1)
1
16b MAIUNG ADDRESS (Street and Number Clty Slale Zip Code) 16c. RELATIONSHIP TO DECEDENT
17. METHOD OF DISPOSITION 18a PLACE OF DISPOSITION (Name of cemetery, crematory, 18b. LOCATION-City or Town, and State D Burial D Cremation D Removal from Stale or o1her place)
D Donation D Entombmenl D Other (Specify)
19. FUNERAl SERVICE LICENSEE & LICENSE NO (Slgna1ure)
1
20 NAME OF EMBALMER & LICENSE NO.
;.
21. NAME AND ADDRESS OF FIRM
22. CAUSE OF DEATH -Part I. Enter the chain of events - d seases, Injuries. or compl.caUons-thal direcUy caused U,e death. 00 NOT enter terminal events such as cardiac arresl, respiralory arresl, or ventricular fibrillation without showing 1he etlology. 00 NOT ABBREVIATE En1er only ono cause on a line. Add addiUonal lines If necessary. Approximate Interval·
' Onsel to Death ' IMMEDIATE CAUSE (Final '
disease or condiUon resu!Ung a '
In dea1h) DUE TO (OR AS A CONSEQUENCE OF):
.
.
Sequentially 11st conditions. f b. .
any, loading to Immediate DUE TO (OR AS A CONSEQUENCE OF) : cause listed on line a Enter '
' the UNDERLYING CAUSE C
'
(disease or Injury thal Initiated DUE TO (OR AS A CONSEQUENCE OF) the events resulting in dealh) '
LAST. '
d. ' '
PART II Enter other significant conditions contributing to death, but not resulting In lhe 23a.AUTOPSY 23b.WERE AUTOPSY FINDINGS AVAILABLE 2Jc.WAS CORONER CONTACTED? unde�ying cause given In Part I. TO COMPLETE THE CAUSE OF DEATH?
Dves DNo DYes DNo D Unknown D Yes D No D Unknown D Unknown D Nol Applicable
24. DID TOBACCO USE 25. IF FEMALE 26. MANNER OF DEATH CONTRIBUTE TO DEA TH? D Not pregnant within pasl year D Not pregnant, bul pregnant 43 days to 1 year before dealh D Natural D Homicide
DYes D Probably D Pregnant at llme of deaU, D Unknown If pregnant within the last year D Accident D Pending Investigation
DNo D Unknown D Not pregnant but pregnant within 42 days or dealh D Suicide D Could not be de1ermined
27a. DATE OF INJURY 27b. T ME OF INJURY 27c INJURY AT WORK 27d. DESCRIBE HOW INJURY OCCURRED (Mon1h, Day, Year) A.M
Dves DNo P M
27e. PLACE OF INJURY-Residence farm. street. factory, building, etc (Specify)
1
271 LOCAT ON (Street and Number or Rural Route. City or Town. Slate. Zip Code)
28a. DATE PRONOUNCED DEAD 28b. TIME PRONOUNCED DEAD 28c ACTUAl OR PRESUMED 28d NAME OF PERSON PRONOUNCING DEATH (II applicable) 2Be. LICENSE NO (Month, Day, Year) TIME OF DEA TH
A.M AM. P.M P.M.
29a.CERTIFIER (Check only one) CJ Certifying physician - To the best ol my knowledge, deaUl occurred due to the cause(s) and manner stated. D Pronouncing & Certifying physician• To the best of my know1edge. death occurred al lhe time, date, and place, and due to the cause(S) and manner slated. CJ Coroner- On lho basis of examination and/or lnvesUgaUon In my opinion, death occurred at the time, da1e, and place, and due lo Ule cause(s) and manner staled
Signature of certifier ;.. LICENSE NO. DATE CERTIFIER SIGNED
29b. NAME, ADDRESS AND ZIP CODE OF PERSON COMPLETING CAUSE OF DEATH DM D Do.a D SPEC DEPUTY 30. DATE FILED BY STATE REGISTRAR (MonUl, Day, Year)
VS231 R"" 04/0112011
Sample

Sample

VS229 Rev. 07/01/2010
STATE OF KANSAS License No. DEPARTMENT OF HEALTH AND ENVIRONMENT
Office of Vital Statistics
Marriage License
1. GROOM’S NAME – FIRST MIDDLE LAST 2. DATE OF BIRTH (Month, Day, Year)
3. BIRTHPLACE (State or Foreign Country) 4. RESIDENCE – STATE OR FOREIGN COUNTRY
5. COUNTY OR PROVINCE 6. CITY OR TOWN
7. FATHER’S NAME (First, Middle, Last) 8. BIRTHPLACE (State or Foreign Country)
9. MOTHER’S NAME PRIOR TO FIRST MARRIAGE (First, Middle, Last)
10. BIRTHPLACE (State or Foreign Country)
11. BRIDE’S NAME- FIRST MIDDLE LAST
12. LAST NAME PRIOR TO FIRST MARRIAGE (If different) 13. DATE OF BIRTH (Month, Day, Year) 14. BIRTHPLACE (State or Foreign Country)
15. RESIDENCE – STATE OR FOREIGN COUNTRY 16. COUNTY OR PROVINCE 17. CITY OR TOWN
18. FATHER’S NAME (First, Middle, Last) 19. BIRTHPLACE (State or Foreign Country)
20. MOTHER’S NAME PRIOR TO FIRST MARRIAGE (First, Middle, Last)
21. BIRTHPLACE (State or Foreign Country)
22a. GROOM’S MOTHER/PARENT I OR GUARDIAN CONSENTING (If applicable, type or print) 22c. BRIDE’S MOTHER/PARENT I OR GUARDIAN CONSENTING (If applicable, type or print)
22b. GROOM’S FATHER/PARENT II OR GUARDIAN CONSENTING (If applicable, type or print) 22d. BRIDE’S FATHER/PARENT II OR GUARDIAN CONSENTING (If applicable, type or print)
22e. HAVE ALL LIVING PARENT(S) OR GUARDIAN(S) CONSENTED?
GROOM Yes No Emancipated Parent(s) Deceased
BRIDE Yes No Emancipated Parent(s) Deceased
22f. NAME OF CONSENTING JUDGE (If applicable, please type or print)
Completed marriage license is to be returned to Issuing District Court within 10 days after marriage:
23. DISTRICT COURT OF ISSUANCE 24. DATE LICENSE ISSUED (Month, Day, Year) 25. EXPIRATION DATE (Month, Day, Year)
26. ISSUING OFFICIAL 27. TITLE OF ISSUING OFFICIAL 28. DATE RECEIVED BY COURT OFFICIAL
This License Authorizes the Marriage in This State of the Parties Named Above By Any Person Duly Authorized to Perform a Marriage Ceremony Under the Laws of the State of Kansas.
29. I CERTIFY THAT THE ABOVE NAMED PERSONS WERE MARRIED ON: (Month, Day, Year)
30. WHERE MARRIED - COUNTY 31. CITY OR TOWN
32. SIGNATURE OF PERSON PERFORMING CEREMONY 33. NAME OF PERSON PERFORMING CEREMONY (Please type or print) 34. TITLE
35. ADDRESS OF PERSON PERFORMING CEREMONY (Street and No. or Rural Route, City or Town, State, Zip Code)
36. WITNESS NAME TO CEREMONY (Print or Type) 37. WITNESS NAME TO CEREMONY (Print or Type)
Designated new legal name pursuant to K.S.A. 23-133. (If applicable)
38. GROOM’S NAME - FIRST MIDDLE LAST
39. BRIDE’S NAME - FIRST MIDDLE LAST
STATISTICAL INFORMATION MUST BE COMPLETED ON THE BACK BEFORE SUBMITTING LICENSE TO STATE

STATISTICAL INFORMATION (THE INFORMATION BELOW WILL NOT APPEAR ON CERTIFIED COPIES OF THE RECORD.)
40. NUMBER OF THIS MARRIAGE First, Second, etc. (Specify below)
41. IF PREVIOUSLY MARRIED, LAST MARRIAGE ENDED DATE RECEIVED BY STATE REGISTRAR (Vital Statistics Use Only)
By Death, Divorce, or Annulment (Specify below)
Date (Month, Day, Year)
40a. GROOM
41a. GROOM 41b GROOM 42. GROOM’S SOCIAL SECURITY NUMBER
40b. BRIDE
41c. BRIDE 41d. BRIDE 43. BRIDE’S SOCIAL SECURITY NUMBER
44. GROOM AND BRIDE’S HISPANIC ORIGIN (Check the box or boxes that best describes whether you are Spanish, Hispanic, or Latino. Check the “no” box if you are not Spanish, Hispanic or Latino.)
45. GROOM AND BRIDE’S RACE (Check one or more boxes to indicate what race(s) you consider yourself to be.)
45a. GROOM
White Korean
Black or Vietnamese African American
American Indian or Other Asian (Specify) Alaska Native (Name of the enrolled or principal tribes)
Native Hawaiian
Asian Indian Guamanian or Chamorro
Chinese Samoan
Filipino Other Pacific Islander (Specify)
Japanese
Other (Specify)
Unknown
45b. BRIDE White Korean
Black or Vietnamese African American
American Indian or Other Asian (Specify) Alaska Native (Name of the enrolled or principal tribes)
Native Hawaiian
Asian Indian Guamanian or Chamorro
Chinese Samoan
Filipino Other Pacific Islander (Specify)
Japanese
Other (Specify)
Unknown
44a. GROOM
No, not Spanish/ Hispanic/Latino
Yes, Mexican, Mexican American, Chicano
Yes, Puerto Rican
Yes, Cuban
Yes, Central American
Yes, South American
Yes, other Spanish/ Hispanic/Latino
(Specify)
Unknown
44b. BRIDE
No, not Spanish/ Hispanic/Latina
Yes, Mexican, Mexican American, Chicana
Yes, Puerto Rican
Yes, Cuban
Yes, Central American
Yes, South American
Yes, other Spanish/ Hispanic/Latina
(Specify)
Unknown
46. EDUCATION (Check the box that best describes the highest degree or level of school completed)
46a. GROOM’S EDUCATION 8th grade or less 9th - 12th grade; no diploma High school graduate or GED
Some College credit, but no degree Associate degree (e.g., AA,AS) Bachelor’s degree (e.g., BA, AB, BS)
Unknown Master’s degree (e.g., MA, MS, MEng, MEd, MSW, MBA) Doctorate (e.g., PhD, EdD) or Professional degree (e.g., MD, DDS, DVM, LLB, JD)
46b. BRIDE’S EDUCATION 8th grade or less 9th - 12th grade; no diploma High school graduate or GED
Some College credit, but no degree Associate degree (e.g., AA,AS) Bachelor’s degree (e.g., BA, AB, BS)
Unknown Master’s degree (e.g., MA, MS, MEng, MEd, MSW, MBA) Doctorate (e.g., PhD, EdD) or Professional degree (e.g., MD, DDS, DVM, LLB, JD)
VS230 Rev.04/07/04
STATE OF KANSAS KANSAS DEPARTMENT OF HEALTH AND ENVIRONMENT
Office of Vital Statistics CERTIFICATE OF DIVORCE OR ANNULMENT
CASE NUMBER State File Number
1. HUSBAND’S NAME (First, Middle, Last) 2. DATE OF BIRTH (Month, Day, Year)
3. RESIDENCE-STATE 4. COUNTY
5. WIFE’S NAME (First, Middle, Last) 6. WIFE’S LAST NAME PRIOR TO FIRST MARRIAGE
7. DATE OF BIRTH (Month, Day, Year) 8. RESIDENCE-STATE 9. COUNTY
10. PLACE OF THIS MARRIAGE - STATE OR FOREIGN COUNTRY
11. COUNTY 12. DATE OF THIS MARRIAGE (Month, Day, Year)
13. NUMBER OF CHILDREN UNDER 18 IN THIS HOUSEHOLD AS OF DATE IN ITEM 17
14. PETITIONER
Husband Wife Both Other (Specify)
15. NAME OF PETITIONER’S ATTORNEY (Type)
16. ATTORNEY’S ADDRESS (Street and Number or Rural Route, City or Town, State, Zip Code)
17. DATE DECREE FILED (Month, Day, Year)
18. TYPE OF DECREE-(Specify)
Divorce Annulment
19. COUNTY OF DECREE 20. DATE FILED BY STATE REGISTRAR (Month, Day, Year)
THE INFORMATION BELOW WILL NOT APPEAR ON CERTIFIED COPIES OF THE RECORD.
K.S.A. 65-2422B, REQUIRES THE DIVORCE REPORT TO INCLUDE THE SOCIAL SECURITY NUMBER OF BOTH PARTIES TO MAKE SUCH INFORMATION AVAILABLE TO THE SECRETARY OF SOCIAL AND REHABILITATION SERVICES FOR THE PURPOSE OF ESTABLISHING, MODIFYING, OR ENFORCING A SUPPORT OBLIGATION.
21. HUSBAND’S SOCIAL SECURITY NUMBER 22. WIFE’S SOCIAL SECURITY NUMBER
23. NUMBER OF THIS MARRIAGE First, Second, etc. (Specify below)
24. IF PREVIOUSLY MARRIED, LAST MARRIAGE ENDED
By Death, Divorce, or Annulment (Specify below) Date (Month, Day, Year)
23a. HUSBAND 24a. HUSBAND 24b HUSBAND
23b. WIFE 24c. WIFE 24d. WIFE
25. HISPANIC ORIGIN (Check the box or boxes that best describes whether you are Spanish, Hispanic, or Latino. Check the “no” box if you are not Spanish, Hispanic, or Latino.)
26. RACE (Check one or more boxes to indicate what race(s) you consider yourself to be.)
26a. HUSBAND
White Korean
Black or Vietnamese African American
American Indian or Other Asian (Specify) Alaska Native (Name of the enrolled or principal tribes)
Native Hawaiian
Asian Indian Guamanian or Chamorro
Chinese Samoan
Filipino Other Pacific Islander (Specify)
Japanese
Other (Specify)
Unknown
26b. WIFE
White Korean
Black or Vietnamese African American
American Indian or Other Asian (Specify) Alaska Native (Name of the enrolled or principal tribes)
Native Hawaiian
Asian Indian Guamanian or Chamorro
Chinese Samoan
Filipino Other Pacific Islander (Specify)
Japanese
Other (Specify)
Unknown
25a. HUSBAND
No, not Spanish/ Hispanic/Latino
Yes, Mexican/Mexican American/Chicano
Yes, Puerto Rican
Yes, Cuban
Yes, Central American
Yes, South American
Yes, other Spanish/ Hispanic/Latino (Specify)
Unknown
25b. WIFE
No, not Spanish/ Hispanic/Latina
Yes, Mexican/Mexican American/Chicana
Yes, Puerto Rican
Yes, Cuban
Yes, Central American
Yes, South American
Yes, other Spanish/ Hispanic/Latina (Specify)
Unknown
27. EDUCATION (Check the box that best describes the highest degree or level of school completed.)
27a. HUSBAND’S EDUCATION 8th grade or less 9th - 12th grade; no diploma High school graduate or GED
Some College credit, but no degree Associate degree (e.g., AA,AS) Bachelor’s degree (e.g., BA, AB, BS)
Unknown Master’s degree (e.g., MA, MS, MEng, MEd, MSW, MBA) Doctorate (e.g., PhD, EdD) or Professional degree (e.g., MD, DDS, DVM, LLB, JD)
27b. WIFE’S EDUCATION 8th grade or less 9th - 12th grade; no diploma High school graduate or GED
Some College credit, but no degree Associate degree (e.g., AA,AS) Bachelor’s degree (e.g., BA, AB, BS)
Unknown Master’s degree (e.g., MA, MS, MEng, MEd, MSW, MBA) Doctorate (e.g., PhD, EdD) or Professional degree (e.g., MD, DDS, DVM, LLB, JD)