Embed Size (px)
Citation preview
Department of Health
Transforming NHS ambulance services
REPORT BY THE COMPTROLLER AND AUDITOR GENERAL
HC 1086
SESSION 2010–2012
10 JUNE 2011

The National Audit Offi ce scrutinises public spending on behalf
of Parliament. The Comptroller and Auditor General, Amyas Morse,
is an Offi cer of the House of Commons. He is the head of the NAO,
which employs some 880 staff. He and the NAO are totally independent
of government. He certifi es the accounts of all government departments
and a wide range of other public sector bodies; and he has statutory
authority to report to Parliament on the economy, effi ciency and
effectiveness with which departments and other bodies have used their
resources. Our work led to savings and other effi ciency gains worth
more than £1 billion in 2010-11.
Our vision is to help the nation spend wisely.
We apply the unique perspective of public audit
to help Parliament and Government drive lasting
improvement in public services.
Ordered by the House of Commons
to be printed on 9 June 2011
Report by the Comptroller and Auditor General
HC 1086 Session 2010–2012
10 June 2011
London: The Stationery Offi ce
£15.50
This report has been
prepared under Section 6
of the National Audit Act
1983 for presentation to
the House of Commons
in accordance with
Section 9 of the Act.
Amyas Morse
Comptroller and
Auditor General
National Audit Offi ce
8 June 2011
Department of Health
Transforming NHS ambulance services

In England, urgent and emergency healthcare
and patient transport services are provided
by 11 regionally-based ambulance trusts, with
separate arrangements for the Isle of Wight.
In 2009-10, the cost of ambulance services was
£1.9 billion, of which £1.5 billion was for urgent
and emergency services.
© National Audit Offi ce 2011
The text of this document may be reproduced free of charge in any format or medium providing that it is reproduced accurately and not in a misleading context.
The material must be acknowledged as National Audit Offi ce copyright and the document title specifi ed. Where third party material has been identifi ed, permission from the respective copyright holder must be sought.
Printed in the UK for the Stationery Offi ce Limited on behalf of the Controller of Her Majesty’s Stationery Offi ce2436250 06/11 STG
Contents
Summary 4
Part One
Introduction 12
Part Two
Ambulance service
performance 22
Part Three
Scope for improvement 30
Appendix One
Methodology 44
The National Audit Offi ce study team
consisted of:
Richard Alcorn, Leon Bardot,
Simon Bittlestone, Jeremy Gostick,
Annabel Kiddle, Alex McNish and
Andrew Oliver, under the direction
of Michael Kell.
This report can be found on the
National Audit Offi ce website at
www.nao.org.uk/ambulance-
service-2011
Photographs courtesy of
xxxxxxxxxxxxxxxxxxxxxxxx
For further information about the
National Audit Offi ce please contact:
National Audit Offi ce
Press Offi ce
157-197 Buckingham Palace Road
Victoria
London
SW1W 9SP
Tel: 020 7798 7400
Email: [email protected]
Website: www.nao.org.uk
Twitter: @NAOorguk
4 Summary Transforming NHS ambulance services
Summary
In England, urgent and emergency healthcare and patient transport services are 1
provided by 11 regionally-based ambulance services, with separate arrangements for
the Isle of Wight. In 2009-10, the cost of ambulance services was £1.9 billion, of which
around £1.5 billion was for urgent and emergency services.
In 2009-10, 7.9 million emergency ‘999’ calls were received by the ambulance 2
service, which resulted in 6.4 million ambulance incidents and 4.7 million emergency or
urgent patient journeys. The number of emergency or urgent calls that the ambulance
service receives has increased by about 4 per cent each year since 2007-08.
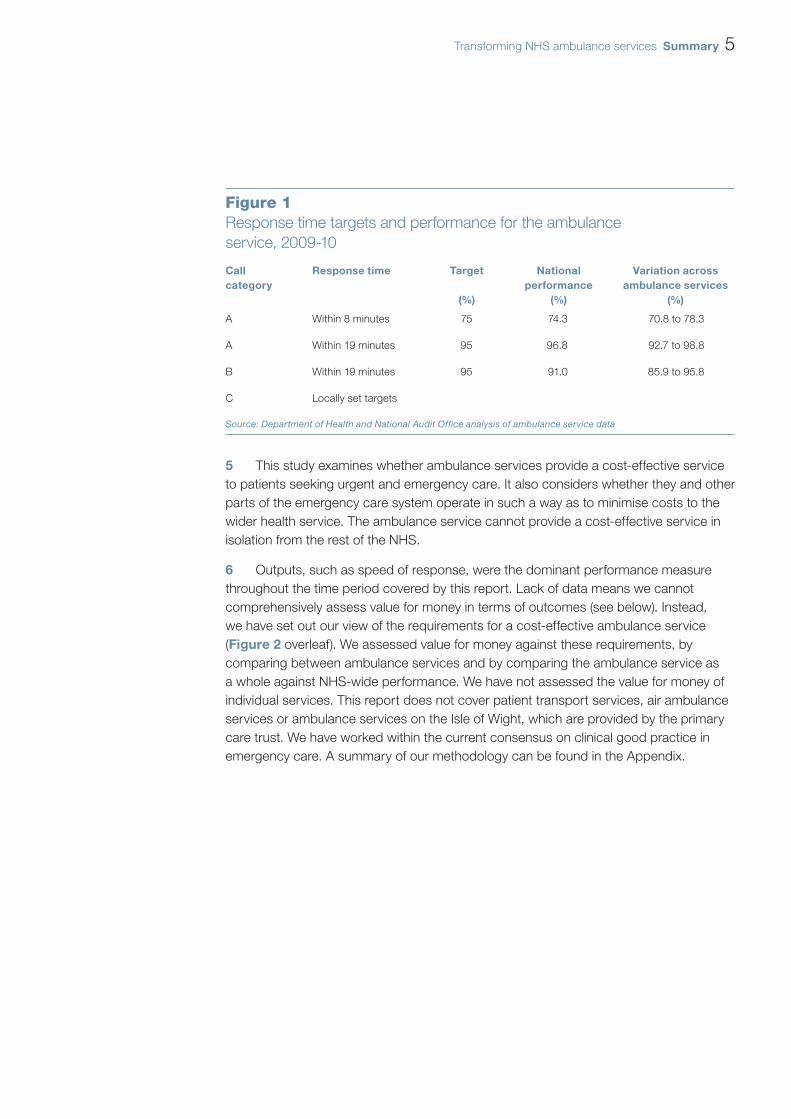
Until 1 April 2011, ambulance responses were split into three categories: 3
A – immediately life-threatening; B – serious but not immediately life-threatening; or
C – not immediately serious or life-threatening (Figure 1). For category A incidents,
the service has a target of an emergency response arriving at the scene within eight
minutes in 75 per cent of cases, and a vehicle able to transport the patient in a clinically
safe manner, if required, to attend within 19 minutes in 95 per cent of cases. There
was a similar 19-minute target for category B incidents. Category B responses and the
associated target were abolished by the Department of Health (the Department) from
1 April 2011, and a set of clinical quality indicators were introduced to complement the
response time target for category A incidents.
The Government has embarked on a fundamental reform of the NHS, which will 4
see the responsibility for the commissioning of ambulance services transfer from primary
care trusts to GP consortia. These reforms are being introduced at a time when the NHS
faces the tightest fi nancial settlement in many years and when the Government aims
to deliver up to £20 billion of effi ciency savings in the NHS by the end of 2014-15. The
ambulance service is expected to play a part in achieving these savings by identifying a
minimum of 4 per cent effi ciency savings within its budget (around £75 million per year).
Transforming NHS ambulance services Summary 5
This study examines whether ambulance services provide a cost-effective service 5
to patients seeking urgent and emergency care. It also considers whether they and other
parts of the emergency care system operate in such a way as to minimise costs to the
wider health service. The ambulance service cannot provide a cost-effective service in
isolation from the rest of the NHS.
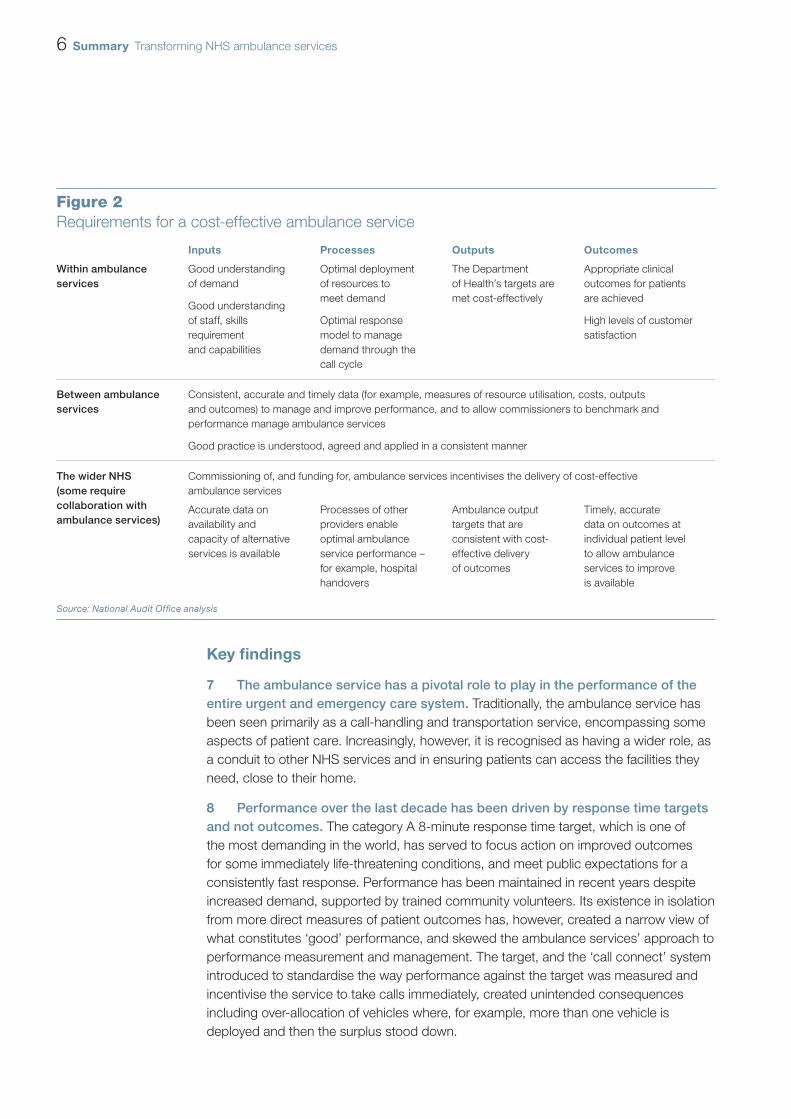
Outputs, such as speed of response, were the dominant performance measure 6
throughout the time period covered by this report. Lack of data means we cannot
comprehensively assess value for money in terms of outcomes (see below). Instead,
we have set out our view of the requirements for a cost-effective ambulance service
(Figure 2 overleaf). We assessed value for money against these requirements, by
comparing between ambulance services and by comparing the ambulance service as
a whole against NHS-wide performance. We have not assessed the value for money of
individual services. This report does not cover patient transport services, air ambulance
services or ambulance services on the Isle of Wight, which are provided by the primary
care trust. We have worked within the current consensus on clinical good practice in
emergency care. A summary of our methodology can be found in the Appendix.
Figure 1Response time targets and performance for the ambulance
service, 2009-10
Call
category
Response time Target
(%)
National
performance
(%)
Variation across
ambulance services
(%)
A Within 8 minutes 75 74.3 70.8 to 78.3
A Within 19 minutes 95 96.8 92.7 to 98.8
B Within 19 minutes 95 91.0 85.9 to 95.8
C Locally set targets
Source: Department of Health and National Audit Offi ce analysis of ambulance service data
6 Summary Transforming NHS ambulance services
Key fi ndings
The ambulance service has a pivotal role to play in the performance of the 7
entire urgent and emergency care system. Traditionally, the ambulance service has
been seen primarily as a call-handling and transportation service, encompassing some
aspects of patient care. Increasingly, however, it is recognised as having a wider role, as
a conduit to other NHS services and in ensuring patients can access the facilities they
need, close to their home.
Performance over the last decade has been driven by response time targets 8
and not outcomes. The category A 8-minute response time target, which is one of
the most demanding in the world, has served to focus action on improved outcomes
for some immediately life-threatening conditions, and meet public expectations for a
consistently fast response. Performance has been maintained in recent years despite
increased demand, supported by trained community volunteers. Its existence in isolation
from more direct measures of patient outcomes has, however, created a narrow view of
what constitutes ‘good’ performance, and skewed the ambulance services’ approach to
performance measurement and management. The target, and the ‘call connect’ system
introduced to standardise the way performance against the target was measured and
incentivise the service to take calls immediately, created unintended consequences
including over-allocation of vehicles where, for example, more than one vehicle is
deployed and then the surplus stood down.
Figure 2Requirements for a cost-effective ambulance service
Inputs Processes Outputs Outcomes
Within ambulance services
Good understanding
of demand
Good understanding
of staff, skills
requirement
and capabilities
Optimal deployment
of resources to
meet demand
Optimal response
model to manage
demand through the
call cycle
The Department
of Health’s targets are
met cost-effectively
Appropriate clinical
outcomes for patients
are achieved
High levels of customer
satisfaction
Between ambulance services
Consistent, accurate and timely data (for example, measures of resource utilisation, costs, outputs
and outcomes) to manage and improve performance, and to allow commissioners to benchmark and
performance manage ambulance services
Good practice is understood, agreed and applied in a consistent manner
The wider NHS (some require collaboration with ambulance services)
Commissioning of, and funding for, ambulance services incentivises the delivery of cost-effective
ambulance services
Accurate data on
availability and
capacity of alternative
services is available
Processes of other
providers enable
optimal ambulance
service performance –
for example, hospital
handovers
Ambulance output
targets that are
consistent with cost-
effective delivery
of outcomes
Timely, accurate
data on outcomes at
individual patient level
to allow ambulance
services to improve
is available
Source: National Audit Offi ce analysis
Transforming NHS ambulance services Summary 7
From 1 April 2011, the category A response targets will be part of a range of 9
indicators designed to encourage a much broader, outcome-led, performance regime.
We agree that this regime should be more fi t-for-purpose but note that the accurate
measurement of patient outcomes will rely on acute trusts and accident and emergency
departments sharing data with the ambulance service.
There is scope for improved effi ciency as evidenced by variations between 10
ambulance services in costs per call, the way resources are deployed to meet demand, the take-up of different approaches to responding to calls and reliance on overtime.
The cost per call across ambulance services varies between £144 and £216, and �
the cost per incident varies between £176 and £251, indicating scope for effi ciency.
Our analysis suggests these variations refl ect, at least in part, factors within the
control of ambulance services.
The most qualifi ed staff, advanced practitioners, are used in different ways by �
different ambulance services and are often not used in ways that make full use
of their skills.
Ambulance services are now handling more calls over the phone by providing �
clinical advice to callers (known as ‘hear and treat’), treating patients at the scene
(‘see and treat’) and conveying patients to a wider range of care destinations.
However, the percentage of calls treated in these ways varies considerably across
services, because some services started to undertake these changes earlier than
others and some have developed a closer relationship with NHS Direct, which
provides clinical telephone advice. We estimate indicative fi nancial savings to
the NHS from increased take-up of these new response models of £100 million
to £280 million a year. Realising these savings will depend on reconfi guration
of services by commissioners.
Services currently rely on overtime, at a cost of nearly £80 million per year, partly due �
to diffi culties in matching staff availability with demand, and sickness absence rates,
often the legacy of previous ambulance delivery bodies. High sickness absence rates
contribute to poor resource utilisation and reliance on overtime and sickness rates for
ambulance staff varies by 60 per cent between ambulance services.
Ambulance services need to take more opportunities to learn from each other.11
Coordination across services has improved substantially over the last few years, with
effective collaboration in a number of key areas such as procurement and emergency
planning. However, differences between the services in culture and data defi nitions have
inhibited the take-up of some good practice. There are also inconsistent performance
measurement criteria, meaning performance cannot always be compared across the
sector. For example, ambulance services need to have a clear understanding of the extent
to which ambulance crews are utilised. However, there is no consensus among ambulance
services on the best way to measure resource utilisation, or what ‘good performance’
looks like. The sharing of best practice and the achievement of economies of scale may
be inhibited if services envisage being in competition with one another in the future.
8 Summary Transforming NHS ambulance services
A lack of alignment of objectives between urgent and emergency care 12
providers, including ambulance services, means that work remains to achieve cost-effective integrated emergency care.
Over one-fi fth of patient handovers at hospital accident and emergency �
departments (the time taken from arrival at a hospital to handing over the
responsibility for care to a hospital healthcare professional) take longer than
the 15 minutes recommended in guidance. If ambulances are queuing outside
hospitals they are not available to respond to other calls. There is also scope to
reduce the time taken by ambulance crews from patient handover at the hospital
to being available for their next job. Commissioners can encourage services to
focus on these issues if progress is not being made – some commissioners, but
not all, have built fi nancial incentives into hospital contracts to reduce handover and
turnaround times.
Effective triaging and assessment relies on there being other services available �
that the patient can access. Primary care trusts, which currently commission
ambulance services, are at different stages of developing an electronic directory
of local services, which can be used by health service staff to identify appropriate
services that are available for their patients.
The commissioning of ambulance services has until recently focused on the �
day-to-day management of contracts. The National Ambulance Commissioning
Group is working to incentivise demand management and to develop a more
strategic approach to ambulance commissioning, and assisting the Department in
its development and implementation of a national system of tariffs for ambulance
services. However, as the NHS moves towards GP-led commissioning, there
is a danger that accumulated knowledge will be lost in the transition to the
new arrangements.
The ability to improve performance is limited by a lack of data on patient 13
outcomes and a lack of comparative information that can be used to benchmark performance. Being able to assess the impact of delays described in paragraph 12 and
the accuracy of paramedics’ diagnoses could help services to measure the safety and
quality of patient pathways, and ensure that these pathways are tightly managed. But
at present, data on clinical outcomes are available for only a few key conditions such as
stroke and cardiovascular disease. Services have been unable to track most patients
after they arrive at hospital as ambulance and hospital information systems are not
linked. Better measurement of outcomes will drive up clinical quality.
The ambulance service collects a wide range of performance data. But different 14
interpretations of data requested by the NHS Information Centre and in the way services
defi ne some of the metrics make it hard for commissioners to benchmark the services
they receive.
Transforming NHS ambulance services Summary 9
Conclusion on value for money
The ambulance service provides a life-saving service to some patients, is highly 15
regarded by the public, and rightly remains committed to providing a rapid response to
urgent and emergency calls at a time of steadily growing call volumes. But, until April 2011,
the Department’s emphasis on response time as a measure of performance rather than
on a more rounded view of clinical outcomes, meant that the incentive structure did not
encourage resource optimisation.
In addition, limitations in management information and benchmarking prevent 16
the Department, commissioners and the ambulance service driving improvement
– as demonstrated by the wide variations in the effi ciency of resource use across
the ambulance services, even after allowing for external factors such as geographic
variations. These differences indicate that value for money is not being achieved across
the entire network. The introduction of a new outcome measurement regime, together
with our recommendations, may begin to address these problems and help deliver
better value for money in the future.
Recommendations
A coordinated approach across the health sector will be required if the full benefi ts 17
of ambulance service transformation are to be realised. Our recommendations are
aimed at the ambulance service, commissioners and the Department.
The ambulance service has a pivotal role to play in the performance of a
the entire urgent and emergency care system to improve its integration, cost-effectiveness and consistency. The Department, and in future the NHS
Commissioning Board, has a role in helping to bring about a better model by
ensuring that existing specialist knowledge of ambulance commissioning is not
lost. Commissioners should increase the use of the levers within contracts to
develop an integrated emergency care response model which incentivises service
improvements, reduction in demand and reduction in conveyance rates to accident
and emergency departments and places the ambulance service at the heart of
this model. These arrangements should operate within an overarching urgent
and emergency care strategy to encourage integrated and consistent services.
In particular, commissioners need to ensure that:
work to develop local directories of services continues at pace; and �
alternative destinations to accident and emergency departments are available. �

10 Summary Transforming NHS ambulance services
Response time targets have been the major priority for ambulance services b
for over a decade but outcome indicators have now been introduced. The ambulance services are a clear example of what gets measured gets done.
The new clinical quality indicators show that the Department recognises that
change is needed. The new measures and the performance regime need to
be carefully thought through to deliver the right balance to preserve rapidity
of response, but as one element of a more rounded response model. The
Department needs to establish how the ‘call connect’ process during call initiation
can be adjusted to allow more fl exibility within the model. Ambulance services and
commissioners will have to decide quickly how to balance these indicators and to
what extent resources will have to be deployed in different ways.
Achieving effi ciencies across the ambulance service will require strong c
leadership. The Department, and later the NHS Commissioning Board, should
provide leadership to the emergency and urgent care sector by putting in place a
robust measurement and monitoring regime for the new clinical quality indicators,
ensuring NHS ambulance services and commissioners have information which
allows them to benchmark performance, and compare outcomes, in order to
deliver the best performance and value for the system overall. It needs to ensure
that hospitals provide good quality rigorous outcome data and that ambulance
services have the means to escalate data quality issues, otherwise the effort to
re-orientate to more sophisticated outcome measures will fail.
Ambulance services’ greatest challenge over the next four years will be d
to improve effi ciency in their resource bases while managing demand in a different way. Ambulance services should work more closely together to identify
opportunities to drive effi ciency improvements in the way their resources are
utilised and identify operational effi ciencies. In particular, ambulance services
should share best practice:
on the understanding of staff capacity and demand to better deploy staff in �
a way that maximises the opportunity to reduce journeys to accident and
emergency departments through better triaging; and
on managing sickness absence. �
Objectives are not consistently aligned to ensure that the performance of the e
ambulance service can be maximised. Commissioners should:
apply appropriate incentives in contracts for ambulance services and hospitals �
to ensure patient handover times at hospital do not systematically exceed
15 minutes and turnaround times of ambulance crews are optimised; and
incentivise health providers to establish and then maintain up-to-date �
information on local directories of services.

Transforming NHS ambulance services Summary 11
A lack of comparative information is available to benchmark performance f
alongside clinical quality indicators. NHS ambulance services, in conjunction
with commissioners, should develop a minimum data set, including staff utilisation,
with agreed defi nitions that services and commissioners can use to benchmark
performance and to monitor service improvements in the ‘see and treat’ and ‘hear
and treat’ categories.
12 Part One Transforming NHS ambulance services
Part One
Introduction
This part of the report explains what the ambulance service does, the environment 1.1
within which it operates, and its resources.
The ambulance service
The ambulance service provides urgent and emergency healthcare and patient 1.2
transport services. In 2006, 31 ambulance services in England were consolidated into
11 regionally-based ambulance services with separate management arrangements for
the Isle of Wight.1
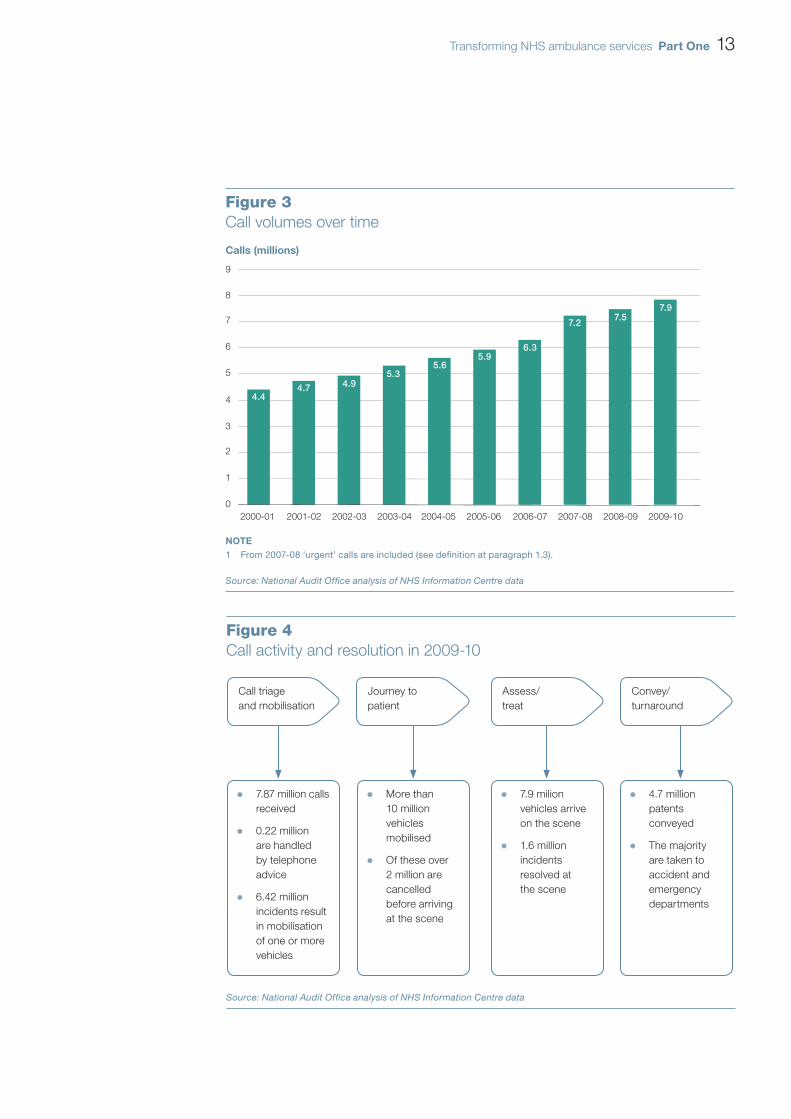
Call volumes have been steadily rising over the last few years (1.3 Figure 3). This is
part of a broader increase in demand for emergency services. The ambulance service
has limited infl uence over the number of ‘999’ emergency calls it receives, but has a
statutory obligation to resolve a call, once received. In addition to emergency calls,
ambulance services are required to take patients to hospital where a doctor, midwife or
other healthcare professional identifi es the need as urgent. From April 2007, these calls
were prioritised and classifi ed in the same way as emergency calls.
Traditionally, the ambulance service has been seen primarily as a call-handling 1.4
and transportation service, encompassing some aspects of patient care. Increasingly,
however, it is recognised as having a wider role, and as being pivotal to the performance
of the entire urgent and emergency care system.2
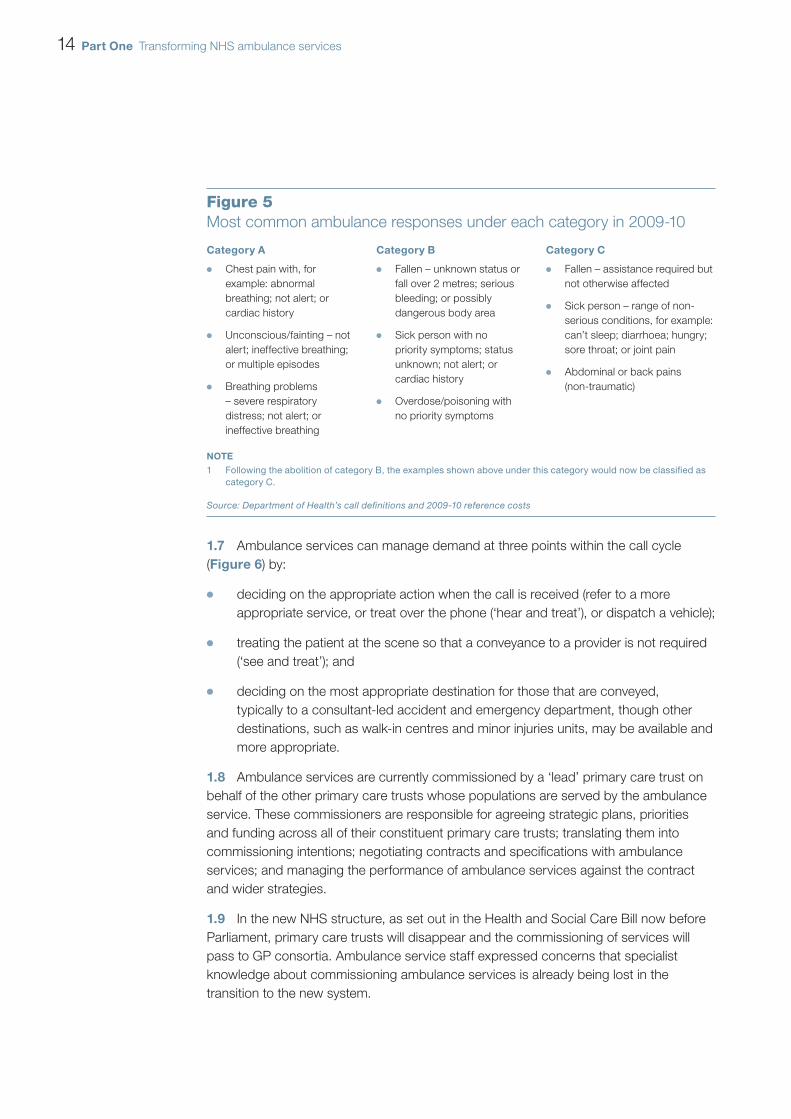
Key statistics for the ambulance service in 2009-10, are shown in 1.5 Figure 4.
Provisional fi gures for 2010-11 indicate that calls and incidents have continued to rise.
Until 2011, ambulance responses were split into three categories: A – immediately 1.6
life-threatening; B – serious but not immediately life-threatening (removed in April 2011);
or C – not immediately serious or life-threatening. Figure 5 on page 14, shows the
most common examples for each category. Research has shown that the triaging
system errs signifi cantly on the side of caution. For example, although currently
29 per cent of calls are categorised as category A, only about 10 per cent of calls have a
life-threatening condition.3
1 Ambulance services in the Isle of Wight are provided by the Isle of Wight Primary Care Trust. They account for 0.2 per cent of total call volumes.
2 Department of Health, Taking healthcare to the patient: Transforming NHS ambulance services, 2005.3 Department of Health, Taking healthcare to the patient: Transforming NHS ambulance services, 2005.
Transforming NHS ambulance services Part One 13
Figure 3Call volumes over time
Calls (millions)
9
8
7
6
5
4
3
2
1
0
2000-01 2001-02 2002-03 2003-04 2004-05 2005-06 2006-07 2007-08 2008-09 2009-10
NOTE
1 From 2007-08 ‘urgent’ calls are included (see definition at paragraph 1.3).
Source: National Audit Office analysis of NHS Information Centre data
4.44.7 4.9
5.35.6
5.9 6.3
7.2 7.5
7.9
Figure 4Call activity and resolution in 2009-10
More than �
10 million
vehicles
mobilised
Of these over �
2 million are
cancelled
before arriving
at the scene
7.9 milion �
vehicles arrive
on the scene
1.6 million �
incidents
resolved at
the scene
4.7 million �
patents
conveyed
The majority �
are taken to
accident and
emergency
departments
Source: National Audit Offi ce analysis of NHS Information Centre data
Call triage
and mobilisation
Journey to
patient
Assess/
treat
Convey/
turnaround
7.87 million calls �
received
0.22 million �
are handled
by telephone
advice
6.42 million �
incidents result
in mobilisation
of one or more
vehicles
14 Part One Transforming NHS ambulance services
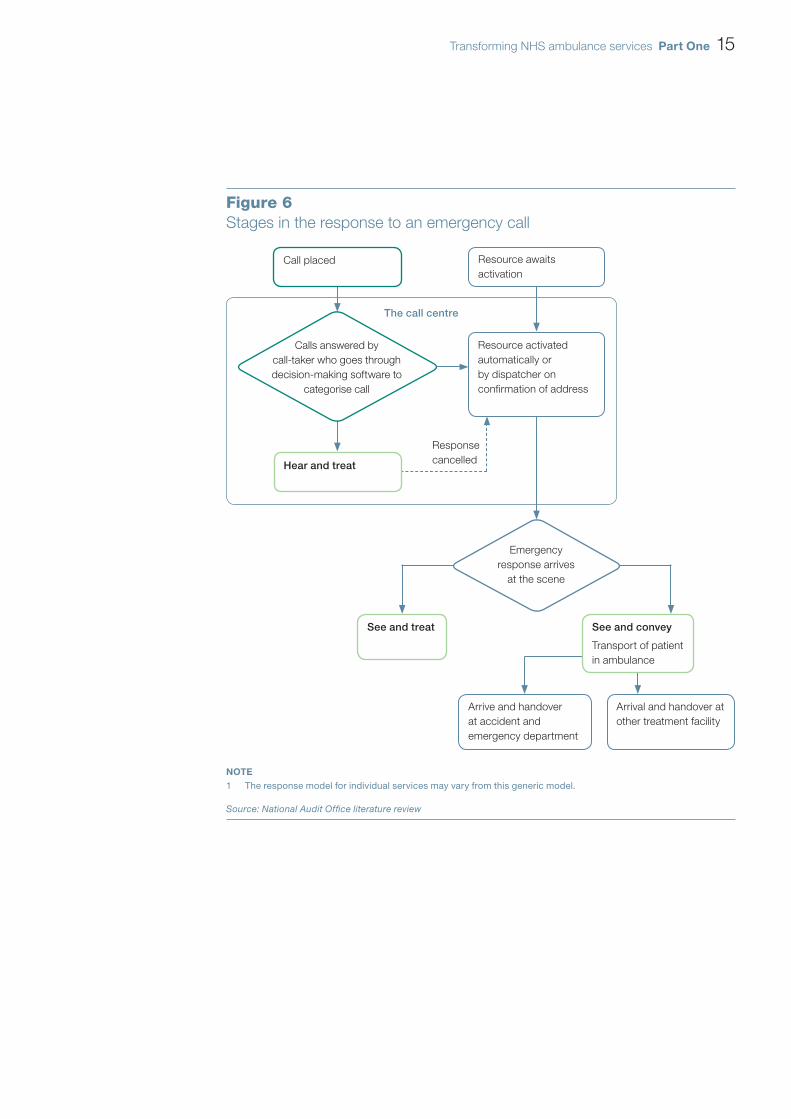
Ambulance services can manage demand at three points within the call cycle 1.7
(Figure 6) by:
deciding on the appropriate action when the call is received (refer to a more �
appropriate service, or treat over the phone (‘hear and treat’), or dispatch a vehicle);
treating the patient at the scene so that a conveyance to a provider is not required �
(‘see and treat’); and
deciding on the most appropriate destination for those that are conveyed, �
typically to a consultant-led accident and emergency department, though other
destinations, such as walk-in centres and minor injuries units, may be available and
more appropriate.
Ambulance services are currently commissioned by a ‘lead’ primary care trust on 1.8
behalf of the other primary care trusts whose populations are served by the ambulance
service. These commissioners are responsible for agreeing strategic plans, priorities
and funding across all of their constituent primary care trusts; translating them into
commissioning intentions; negotiating contracts and specifi cations with ambulance
services; and managing the performance of ambulance services against the contract
and wider strategies.
In the new NHS structure, as set out in the Health and Social Care Bill now before 1.9
Parliament, primary care trusts will disappear and the commissioning of services will
pass to GP consortia. Ambulance service staff expressed concerns that specialist
knowledge about commissioning ambulance services is already being lost in the
transition to the new system.
Figure 5Most common ambulance responses under each category in 2009-10
Category A Category B Category C
Chest pain with, for �
example: abnormal
breathing; not alert; or
cardiac history
Unconscious/fainting – not �
alert; ineffective breathing;
or multiple episodes
Breathing problems �
– severe respiratory
distress; not alert; or
ineffective breathing
Fallen – unknown status or �
fall over 2 metres; serious
bleeding; or possibly
dangerous body area
Sick person with no �
priority symptoms; status
unknown; not alert; or
cardiac history
Overdose/poisoning with �
no priority symptoms
Fallen – assistance required but �
not otherwise affected
Sick person – range of non- �
serious conditions, for example:
can’t sleep; diarrhoea; hungry;
sore throat; or joint pain
Abdominal or back pains �
(non-traumatic)
NOTE
Following the abolition of category B, the examples shown above under this category would now be classifi ed as 1 category C.
Source: Department of Health’s call defi nitions and 2009-10 reference costs
Transforming NHS ambulance services Part One 15
Figure 6Stages in the response to an emergency call
NOTE
The response model for individual services may vary from this generic model.1
Source: National Audit Offi ce literature review
Call placed
Resource activated
automatically or
by dispatcher on
confirmation of address
Resource awaits
activation
See and treat
Arrive and handover
at accident and
emergency department
Arrival and handover at
other treatment facility
The call centre
Response
cancelled
See and convey
Transport of patient
in ambulance
Calls answered by
call-taker who goes through
decision-making software to
categorise call
Hear and treat
Emergency
response arrives
at the scene
16 Part One Transforming NHS ambulance services
The Department sets national performance targets (see Figure 1, page 5), a range 1.10
of clinical quality indicators (see paragraph 2.9, page 28 and Figure 17, page 29) as
well as targets for effi ciency savings (see paragraph 3.19, page 37). The Care Quality
Commission regulates all health and adult social care services in England, including
ambulance services.
Funding
In 2009-10, total expenditure on ambulance services was £1.9 billion, of which 1.11
around £1.5 billion was classifi ed as emergency transport services spend, and
£0.4 billion on patient transport and other services. Spend on urgent and emergency
services has increased from around £1.1 billion in 2006-07.
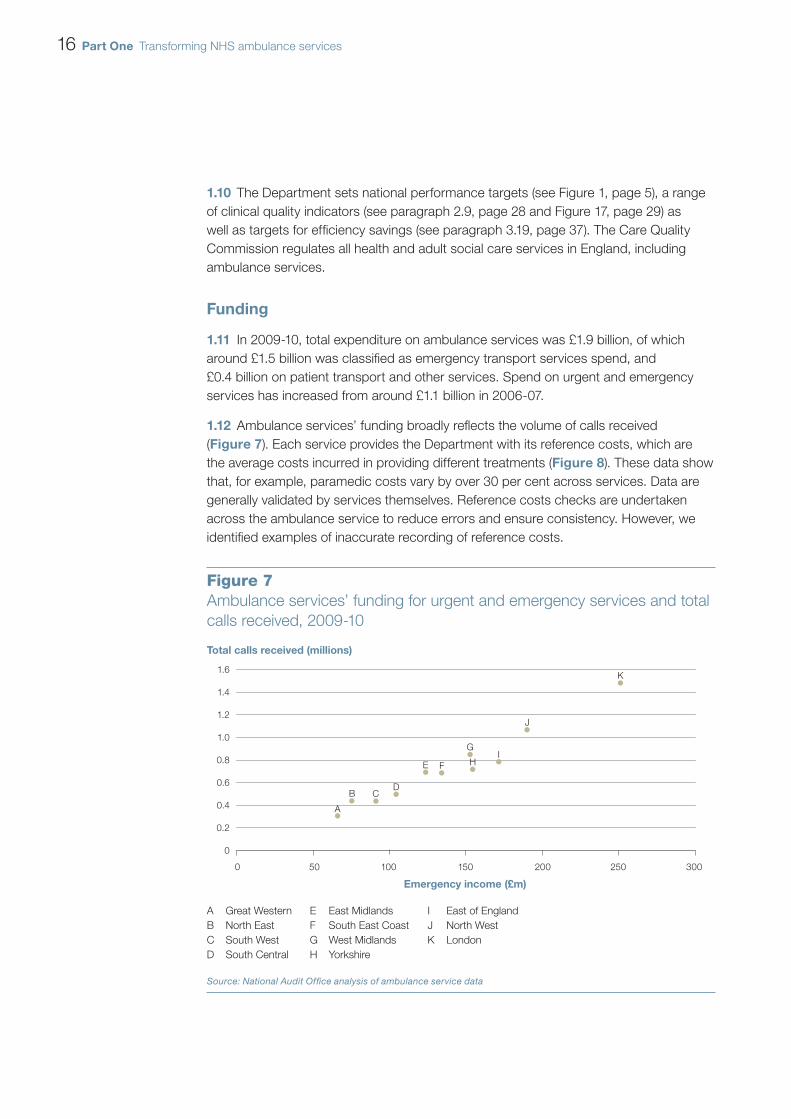
Ambulance services’ funding broadly refl ects the volume of calls received 1.12
(Figure 7). Each service provides the Department with its reference costs, which are
the average costs incurred in providing different treatments (Figure 8). These data show
that, for example, paramedic costs vary by over 30 per cent across services. Data are
generally validated by services themselves. Reference costs checks are undertaken
across the ambulance service to reduce errors and ensure consistency. However, we
identifi ed examples of inaccurate recording of reference costs.
Total calls received (millions)
Emergency income (£m)
1.6
1.4
1.2
1.0
0.8
0.6
0.4
0.2
0
Figure 7Ambulance services’ funding for urgent and emergency services and total
calls received, 2009-10
Source: National Audit Office analysis of ambulance service data
0 50 100 150 200 250 300
A
B CD
E F
G
HI
J
K
A Great Western
B North East
C South West
D South Central
E East Midlands
F South East Coast
G West Midlands
H Yorkshire
I East of England
J North West
K London
Transforming NHS ambulance services Part One 17
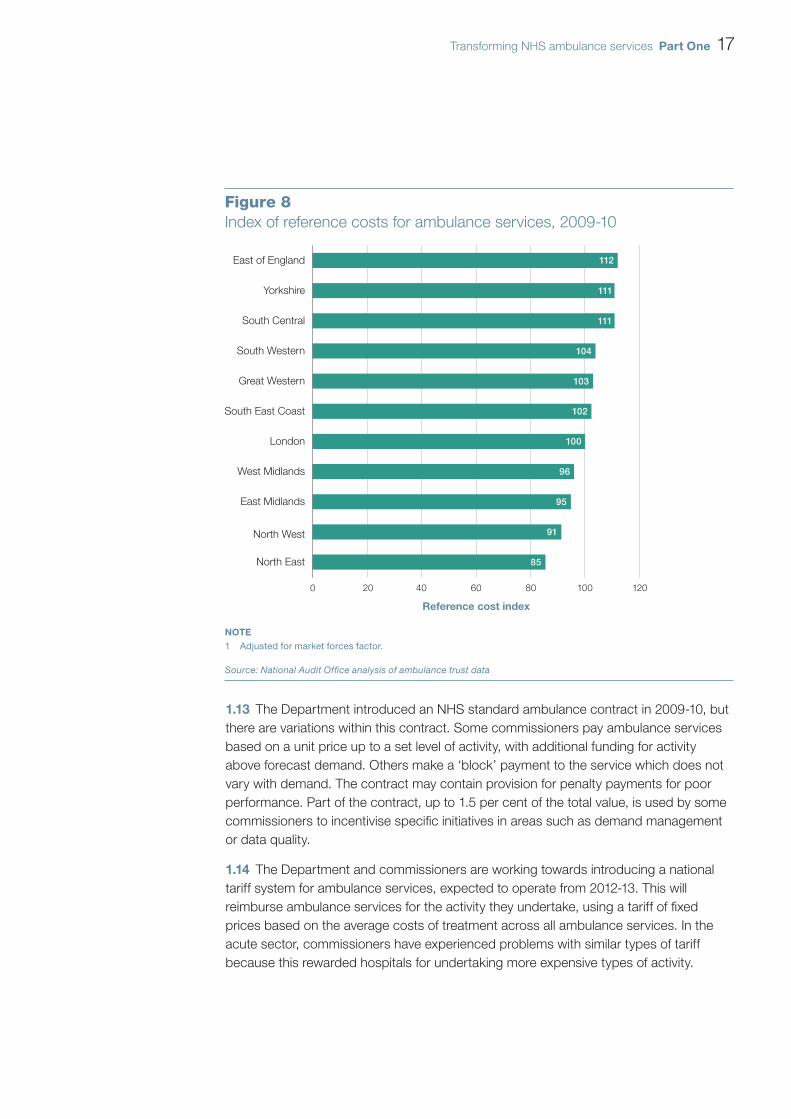
The Department introduced an NHS standard ambulance contract in 2009-10, but 1.13
there are variations within this contract. Some commissioners pay ambulance services
based on a unit price up to a set level of activity, with additional funding for activity
above forecast demand. Others make a ‘block’ payment to the service which does not
vary with demand. The contract may contain provision for penalty payments for poor
performance. Part of the contract, up to 1.5 per cent of the total value, is used by some
commissioners to incentivise specifi c initiatives in areas such as demand management
or data quality.
The Department and commissioners are working towards introducing a national 1.14
tariff system for ambulance services, expected to operate from 2012-13. This will
reimburse ambulance services for the activity they undertake, using a tariff of fi xed
prices based on the average costs of treatment across all ambulance services. In the
acute sector, commissioners have experienced problems with similar types of tariff
because this rewarded hospitals for undertaking more expensive types of activity.
Figure 8Index of reference costs for ambulance services, 2009-10
East of England
Yorkshire
South Central
South Western
Great Western
South East Coast
London
West Midlands
East Midlands
North West
North East
Reference cost index
0 20 40 60 80 100 120
NOTE
1 Adjusted for market forces factor.
Source: National Audit Office analysis of ambulance trust data
112
111
111
104
103
102
100
96
95
91
85
18 Part One Transforming NHS ambulance services
Expenditure
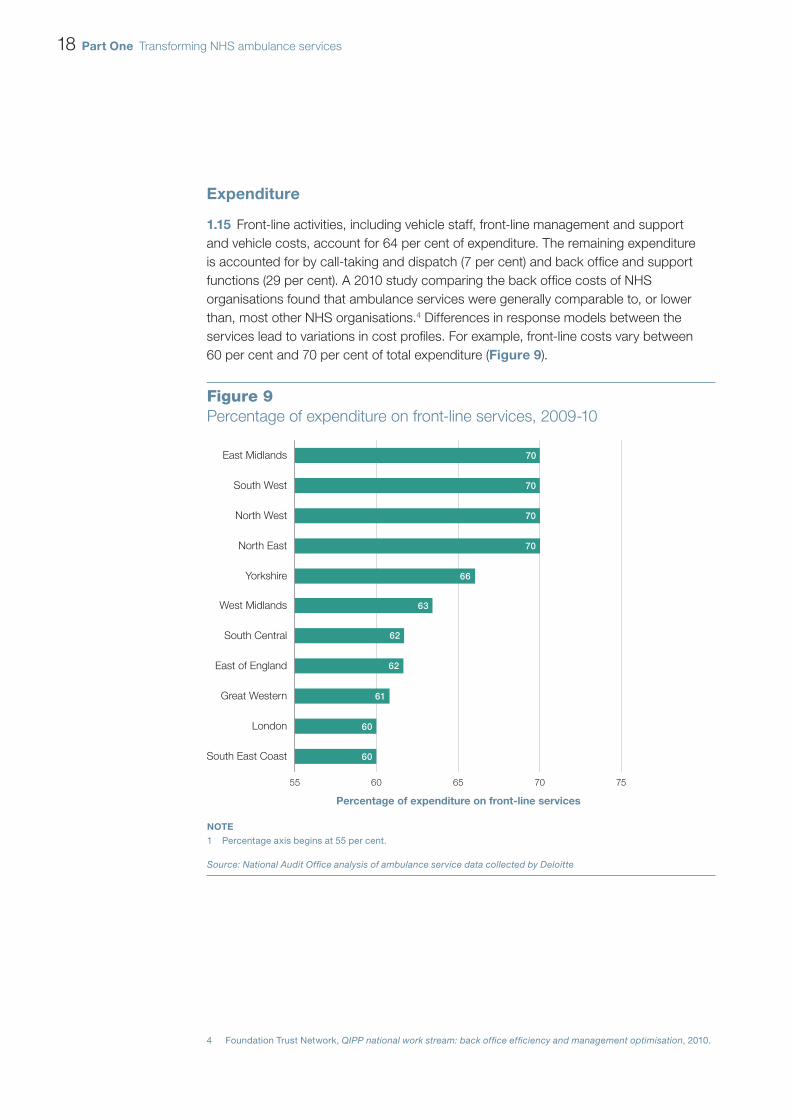
Front-line activities, including vehicle staff, front-line management and support 1.15
and vehicle costs, account for 64 per cent of expenditure. The remaining expenditure
is accounted for by call-taking and dispatch (7 per cent) and back offi ce and support
functions (29 per cent). A 2010 study comparing the back offi ce costs of NHS
organisations found that ambulance services were generally comparable to, or lower
than, most other NHS organisations.4 Differences in response models between the
services lead to variations in cost profi les. For example, front-line costs vary between
60 per cent and 70 per cent of total expenditure (Figure 9).
4 Foundation Trust Network, QIPP national work stream: back offi ce effi ciency and management optimisation, 2010.
Figure 9Percentage of expenditure on front-line services, 2009-10
East Midlands
South West
North West
North East
Yorkshire
West Midlands
South Central
East of England
Great Western
London
South East Coast
Percentage of expenditure on front-line services
55 60 65 70 75
NOTE
1 Percentage axis begins at 55 per cent.
Source: National Audit Office analysis of ambulance service data collected by Deloitte
70
70
70
70
66
63
62
61
60
60
62
Transforming NHS ambulance services Part One 19
Staff costs made up 68 per cent of total operating expenditure for ambulance 1.16
services in 2009-10. The remaining expenditure is accounted for by transport costs
(11 per cent), depreciation (4 per cent), buildings and their running costs (4 per cent),
clinical supplies and services (2 per cent) and other expenditure areas (11 per cent).
Staffi ng
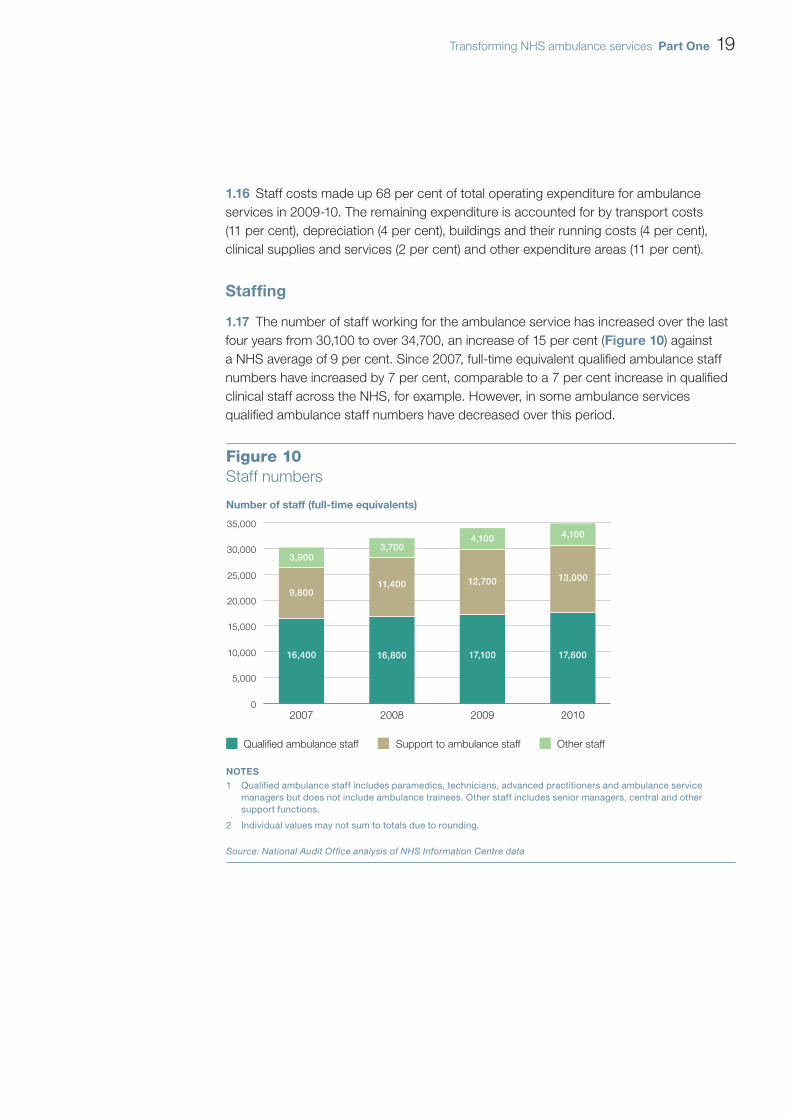
The number of staff working for the ambulance service has increased over the last 1.17
four years from 30,100 to over 34,700, an increase of 15 per cent (Figure 10) against
a NHS average of 9 per cent. Since 2007, full-time equivalent qualifi ed ambulance staff
numbers have increased by 7 per cent, comparable to a 7 per cent increase in qualifi ed
clinical staff across the NHS, for example. However, in some ambulance services
qualifi ed ambulance staff numbers have decreased over this period.
Number of staff (full-time equivalents)
Figure 10Staff numbers
35,000
30,000
25,000
20,000
15,000
10,000
5,000
0
2007 2008 2009 2010
Qualified ambulance staff Other staffSupport to ambulance staff
NOTES
1 Qualified ambulance staff includes paramedics, technicians, advanced practitioners and ambulance service managers but does not include ambulance trainees. Other staff includes senior managers, central and other support functions.
2 Individual values may not sum to totals due to rounding.
Source: National Audit Office analysis of NHS Information Centre data
16,400
9,800
3,900
16,800
11,400
3,700
17,100
12,700
4,100
17,600
13,000
4,100
20 Part One Transforming NHS ambulance services
The main grades of ambulance staff used by services to respond to emergency 1.18
calls are:
Emergency care assistants � who have a working knowledge of moving and
handling and communications systems and can undertake basic life support but
cannot otherwise carry out medical interventions with patients.
Emergency medical technicians � who respond to emergency calls, sometimes
as fi rst responder. They are trained to administer many of the same treatments and
procedures as paramedics. The role is being phased out.
Paramedics � who are professionals who assess a patient’s condition and give
essential treatment. They are usually part of a two-person crew with an assistant
or technician.
Advanced practitioners � who can undertake more specialised tasks such as
diagnostic testing; and directly admit patients to specialist units. They can treat
patients at home with urgent, non-life-threatening conditions. In most ambulance
services they operate as solo fi rst responders in cars.
The ambulance service also makes use of community fi rst responders – 1.19
non-medical professionals or members of the public with life-saving training. They are
trained and equipped by ambulance services to attend a range of emergency calls in
advance of the arrival of ambulance crews in order to begin medical assistance and life-
saving care as quickly as possible. In 2009-10, they attended over 111,000 incidents.
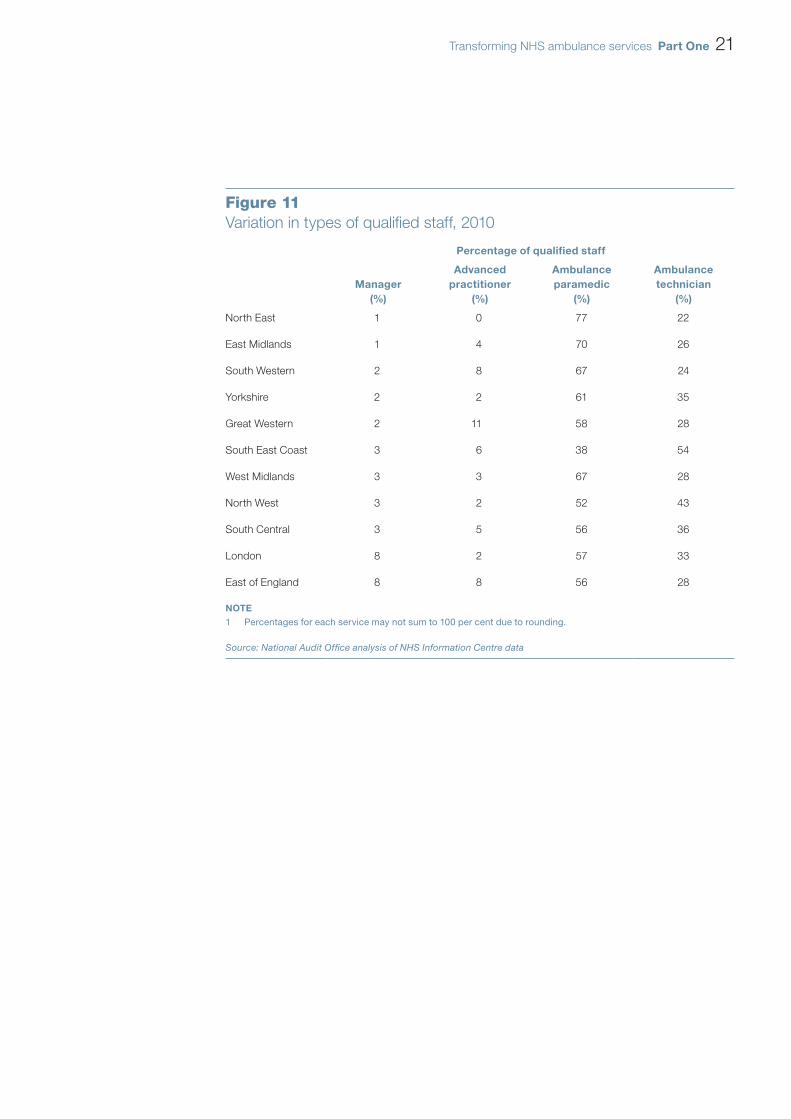
The different resource models that ambulance services employ are highlighted 1.20
by differences in grade mix (Figure 11). Some services are moving towards having a
paramedic in every ambulance, whilst others are making more use of technicians and
emergency care assistants. There is no common agreement on what an ideal resource
mix would be.
Ambulance staff are covered by the NHS Agenda for Change pay scales. Earnings 1.21
in front-line operational roles are often enhanced with unsocial hours payments of up to
a quarter of basic salary, refl ecting the 24-hour nature of the service.
Transforming NHS ambulance services Part One 21
Figure 11Variation in types of qualifi ed staff, 2010
Percentage of qualified staff
Manager
(%)
Advanced
practitioner
(%)
Ambulance
paramedic
(%)
Ambulance
technician
(%)
North East 1 0 77 22
East Midlands 1 4 70 26
South Western 2 8 67 24
Yorkshire 2 2 61 35
Great Western 2 11 58 28
South East Coast 3 6 38 54
West Midlands 3 3 67 28
North West 3 2 52 43
South Central 3 5 56 36
London 8 2 57 33
East of England 8 8 56 28
NOTE
Percentages for each service may not sum to 100 per cent due to rounding.1
Source: National Audit Offi ce analysis of NHS Information Centre data
22 Part Two Transforming NHS ambulance services
Part Two
Ambulance service performance
This part of the report covers the performance of ambulance services against 2.1
response time targets, in terms of cost-effectiveness, and against outcome and
quality measures.
National response targets
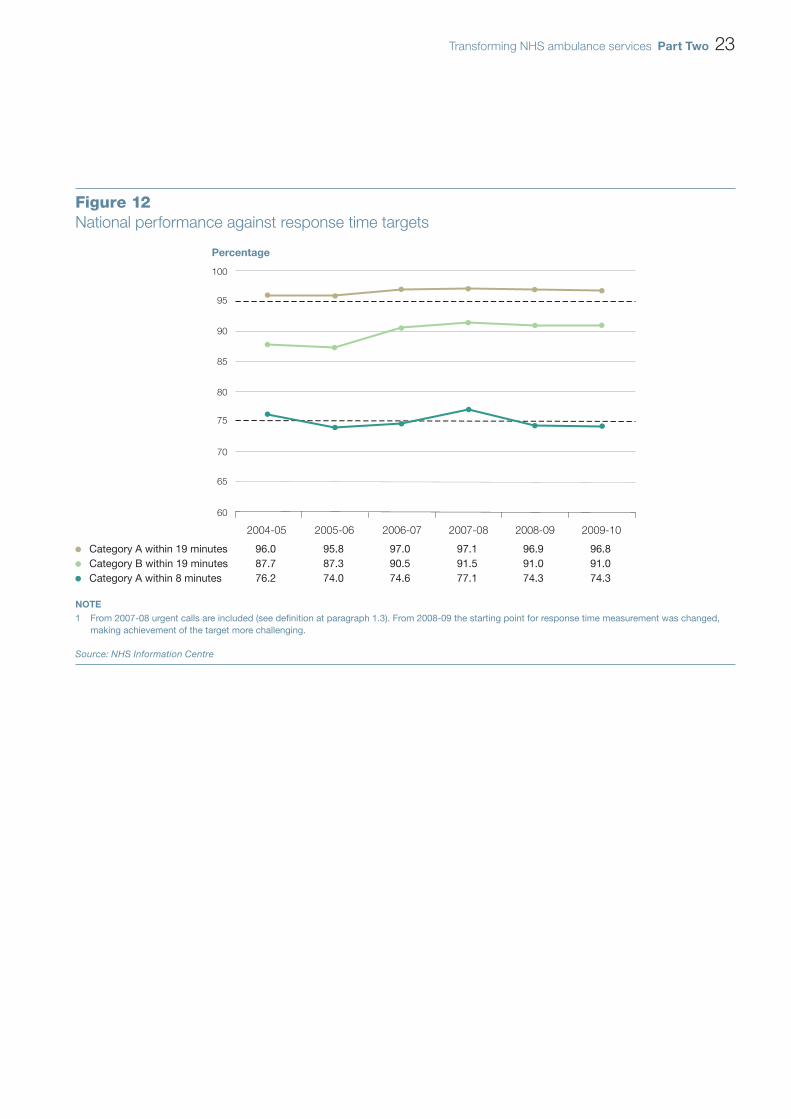
Figure 122.2 shows that in 2009-10 the ambulance service reached 74.3 per cent
of category A calls within eight minutes (against a target of 75 per cent), 96.8 per cent
in 19 minutes (against a target of 95 per cent) and 91 per cent of category B calls in
19 minutes (against a target of 95 per cent). Call connect, a new way of measuring
ambulance response times, was introduced in April 2008. Since this date, ambulance
response times have been measured from the moment the call is connected to the
ambulance control room. This meant that ambulance services needed to respond, on
average, 90 seconds faster than before. It also greatly increased the speed with which
phones are picked up – in London 95 per cent of calls are picked up in fi ve seconds
compared with 40 per cent fi ve years earlier.
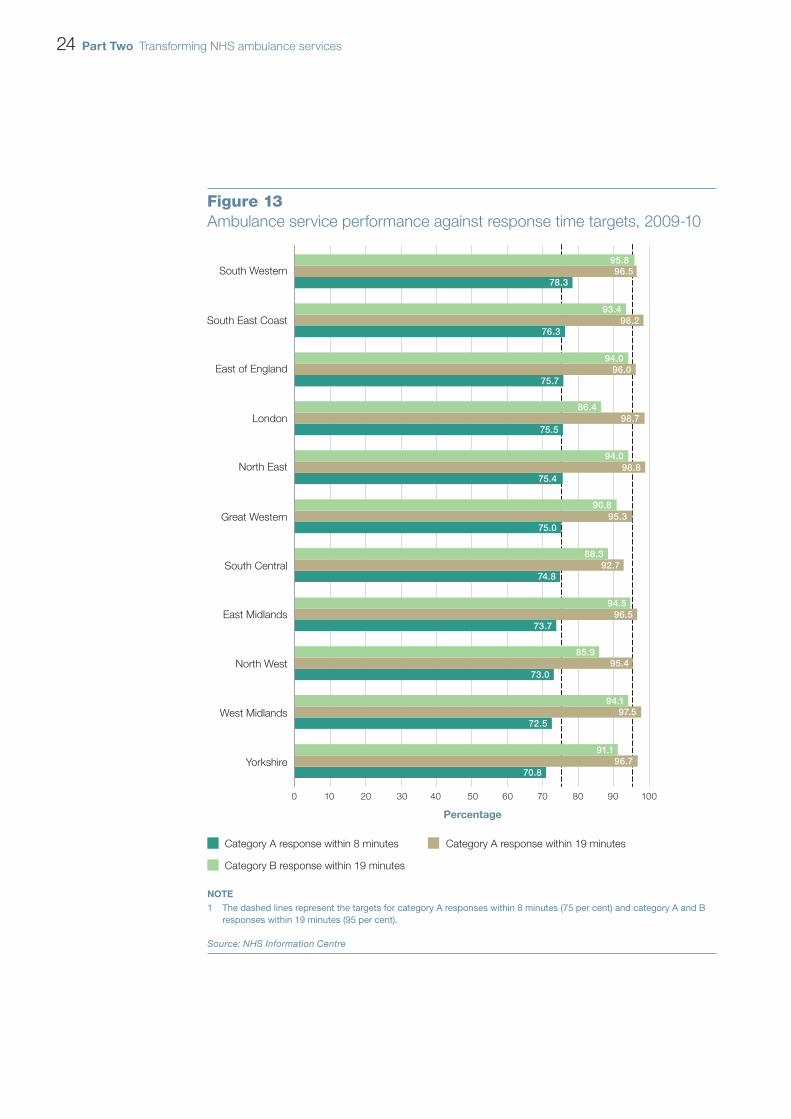
Of the 11 ambulance services, six met the 8-minute category A target and one 2.3
met the 19-minute category B target in 2009-10 (Figure 13 on page 24). South Central
was the only service that did not meet the 19-minute category A target in 2009-10. Most
services meet the targets for the majority of the year, but performance dips in the winter
months, when there are increased call volumes, congestion in hospital accident and
emergency departments and slower response times due to adverse road conditions.
Transforming NHS ambulance services Part Two 23
Figure 12National performance against response time targets
60
100
95
90
85
80
75
70
65
Percentage
NOTE
1 From 2007-08 urgent calls are included (see definition at paragraph 1.3). From 2008-09 the starting point for response time measurement was changed, making achievement of the target more challenging.
Source: NHS Information Centre
Category A within 19 minutes 96.0 95.8 97.0 97.1 96.9 96.8Category B within 19 minutes 87.7 87.3 90.5 91.5 91.0 91.0Category A within 8 minutes 76.2 74.0 74.6 77.1 74.3 74.3
2004-05 2005-06 2006-07 2007-08 2008-09 2009-10
24 Part Two Transforming NHS ambulance services
Figure 13Ambulance service performance against response time targets, 2009-10
Great Western
North West
South Western
South East Coast
South Central
London
North East
East of England
Yorkshire
West Midlands
East Midlands
Percentage
0 10 20 30 40 50 60 70 80 90 100
Category A response within 8 minutes
Category B response within 19 minutes
Category A response within 19 minutes
NOTE
1 The dashed lines represent the targets for category A responses within 8 minutes (75 per cent) and category A and B responses within 19 minutes (95 per cent).
Source: NHS Information Centre
95.896.5
78.3
93.498.2
76.3
94.096.0
75.7
86.498.7
75.5
94.098.8
75.4
90.895.3
75.0
88.392.7
74.8
94.596.5
73.7
85.995.4
73.0
94.197.5
72.5
91.196.7
70.8
Transforming NHS ambulance services Part Two 25
Cost-effectiveness
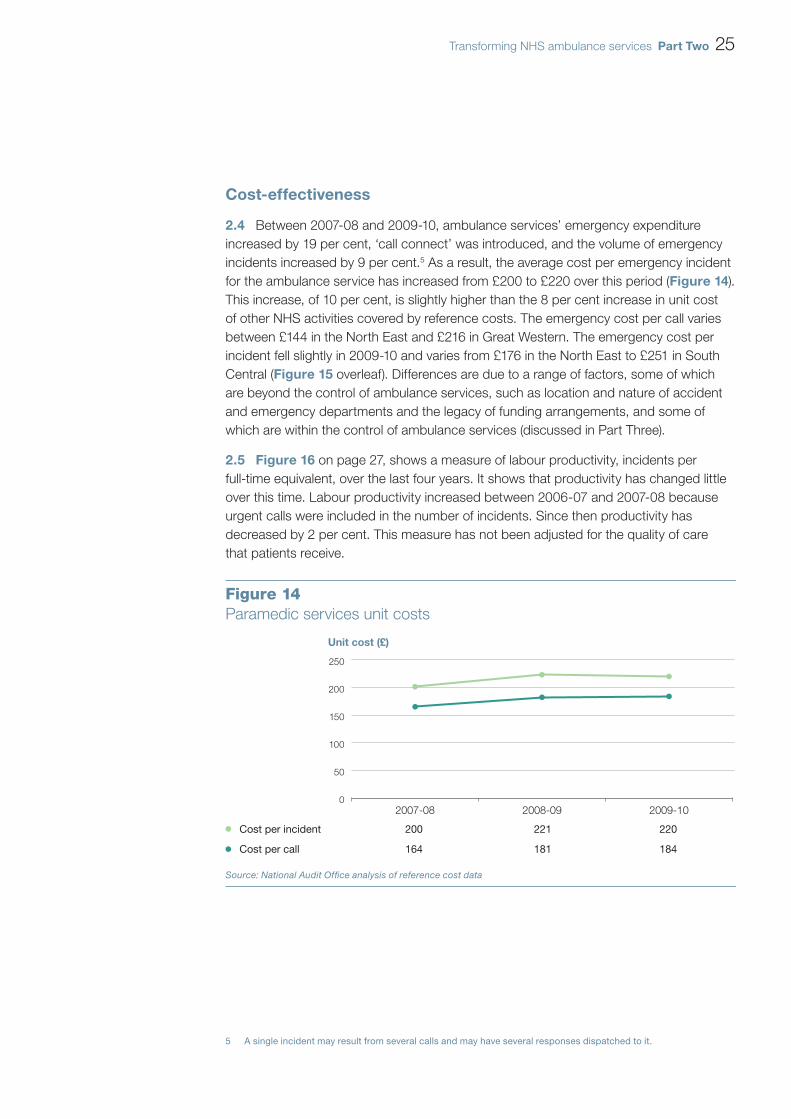
Between 2007-08 and 2009-10, ambulance services’ emergency expenditure 2.4
increased by 19 per cent, ‘call connect’ was introduced, and the volume of emergency
incidents increased by 9 per cent.5 As a result, the average cost per emergency incident
for the ambulance service has increased from £200 to £220 over this period (Figure 14).
This increase, of 10 per cent, is slightly higher than the 8 per cent increase in unit cost
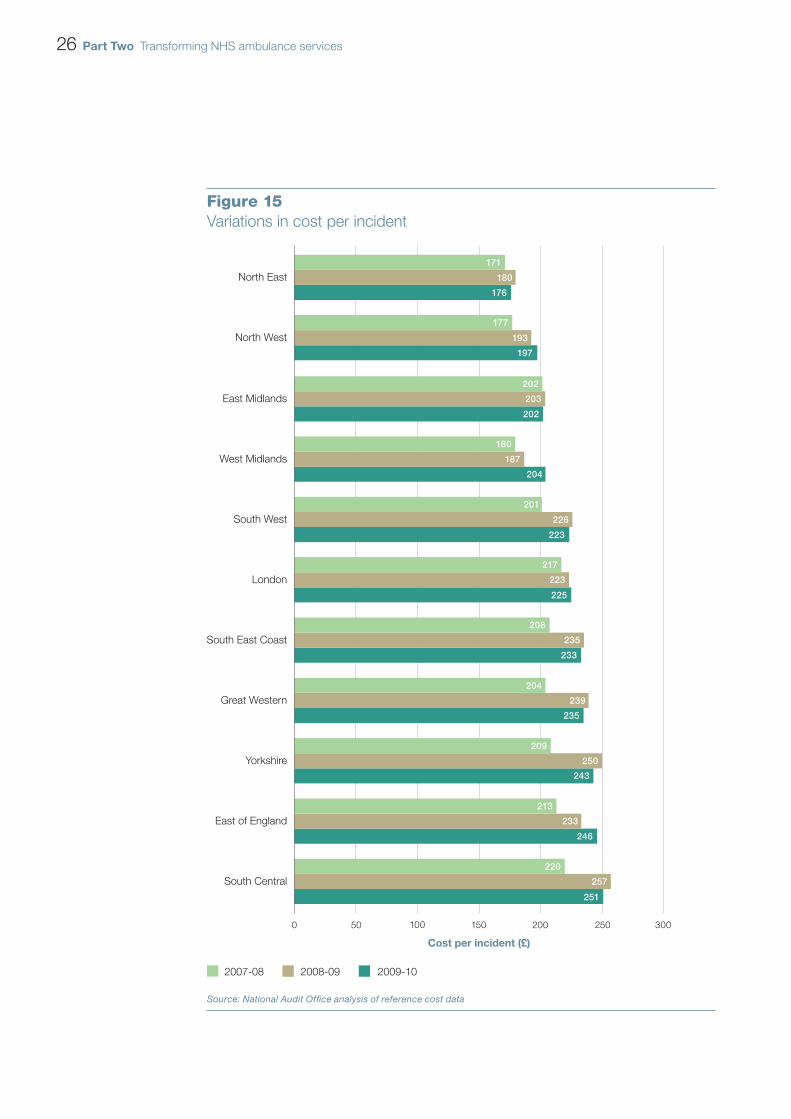
of other NHS activities covered by reference costs. The emergency cost per call varies
between £144 in the North East and £216 in Great Western. The emergency cost per
incident fell slightly in 2009-10 and varies from £176 in the North East to £251 in South
Central (Figure 15 overleaf). Differences are due to a range of factors, some of which
are beyond the control of ambulance services, such as location and nature of accident
and emergency departments and the legacy of funding arrangements, and some of
which are within the control of ambulance services (discussed in Part Three).
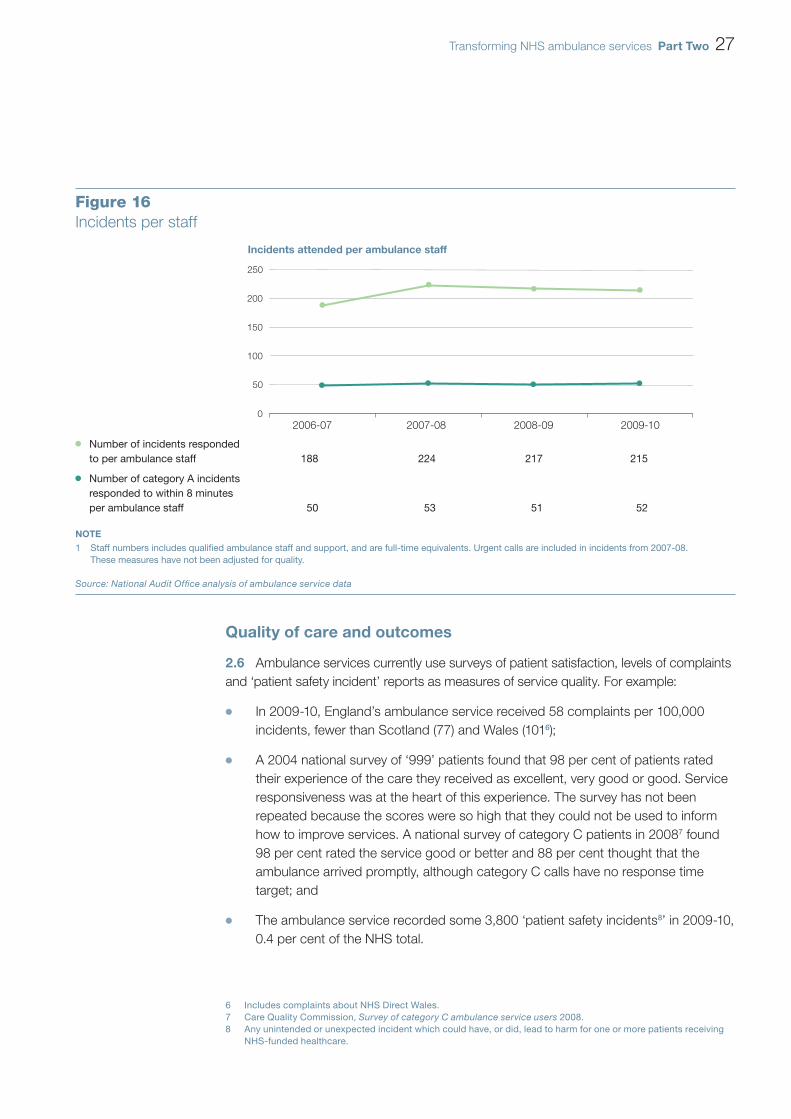
Figure 162.5 on page 27, shows a measure of labour productivity, incidents per
full-time equivalent, over the last four years. It shows that productivity has changed little
over this time. Labour productivity increased between 2006-07 and 2007-08 because
urgent calls were included in the number of incidents. Since then productivity has
decreased by 2 per cent. This measure has not been adjusted for the quality of care
that patients receive.
5 A single incident may result from several calls and may have several responses dispatched to it.
Figure 14Paramedic services unit costs
0
50
100
150
200
250
2007-08 2008-09 2009-10
Unit cost (£)
Cost per incident 200 221 220
Cost per call 164 181 184
Source: National Audit Office analysis of reference cost data
26 Part Two Transforming NHS ambulance services
Figure 15Variations in cost per incident
0 50 100 150 200 250 300
East of England
Yorkshire
South Central
South West
Great Western
South East Coast
London
West Midlands
East Midlands
North West
North East
Cost per incident (£)
2007-08 2008-09
Source: National Audit Office analysis of reference cost data
2009-10
171
180
176
177
193
197
202
203
202
180
187
204
201
226
223
217
223
225
208
235
233
204
239
235
209
250
243
213
233
246
220
257
251
Transforming NHS ambulance services Part Two 27
Quality of care and outcomes
Ambulance services currently use surveys of patient satisfaction, levels of complaints 2.6
and ‘patient safety incident’ reports as measures of service quality. For example:
In 2009-10, England’s ambulance service received 58 complaints per 100,000 �
incidents, fewer than Scotland (77) and Wales (1016);
A 2004 national survey of ‘999’ patients found that 98 per cent of patients rated �
their experience of the care they received as excellent, very good or good. Service
responsiveness was at the heart of this experience. The survey has not been
repeated because the scores were so high that they could not be used to inform
how to improve services. A national survey of category C patients in 20087 found
98 per cent rated the service good or better and 88 per cent thought that the
ambulance arrived promptly, although category C calls have no response time
target; and
The ambulance service recorded some 3,800 ‘patient safety incidents � 8’ in 2009-10,
0.4 per cent of the NHS total.
6 Includes complaints about NHS Direct Wales.7 Care Quality Commission, Survey of category C ambulance service users 2008.8 Any unintended or unexpected incident which could have, or did, lead to harm for one or more patients receiving
NHS-funded healthcare.
0
50
100
150
200
250
Figure 16Incidents per staff
2006-07 2007-08 2008-09 2009-10
NOTE
1 Staff numbers includes qualified ambulance staff and support, and are full-time equivalents. Urgent calls are included in incidents from 2007-08. These measures have not been adjusted for quality.
Source: National Audit Office analysis of ambulance service data
Number of incidents responded to per ambulance staff 188 224 217 215
Number of category A incidents responded to within 8 minutes per ambulance staff 50 53 51 52
Incidents attended per ambulance staff
28 Part Two Transforming NHS ambulance services
The category A 8-minute response time target is one of the most challenging in 2.7
the world9, and has led to better clinical outcomes for the small proportion of patients
for whom fast response is potentially life-saving. Research found that, for people
unconscious, not breathing or with acute chest pain, only for those in cardiac arrest
(about 1 per cent of ‘999’ patients) did 8-minute response times make a signifi cant
difference to survival-to-discharge, as opposed to survival-to-hospital, rates.10 Other
evidence suggests that further reductions in ambulance response times for stroke
patients would not signifi cantly improve clinical outcomes.11 However, 29 per cent of
callers are currently classifi ed as requiring an 8-minute response time.
To date, feedback about the diagnosis and treatment decisions services make 2.8
has relied on ad hoc initiatives. For example, London has collected data on cardiac
arrest survival rates for a decade, which show an increase from 15 per cent in
2008-09 to 22 per cent in 2009-10. The service attributes this increase to maintaining
their response times, investing in training and upgrading their triage system.
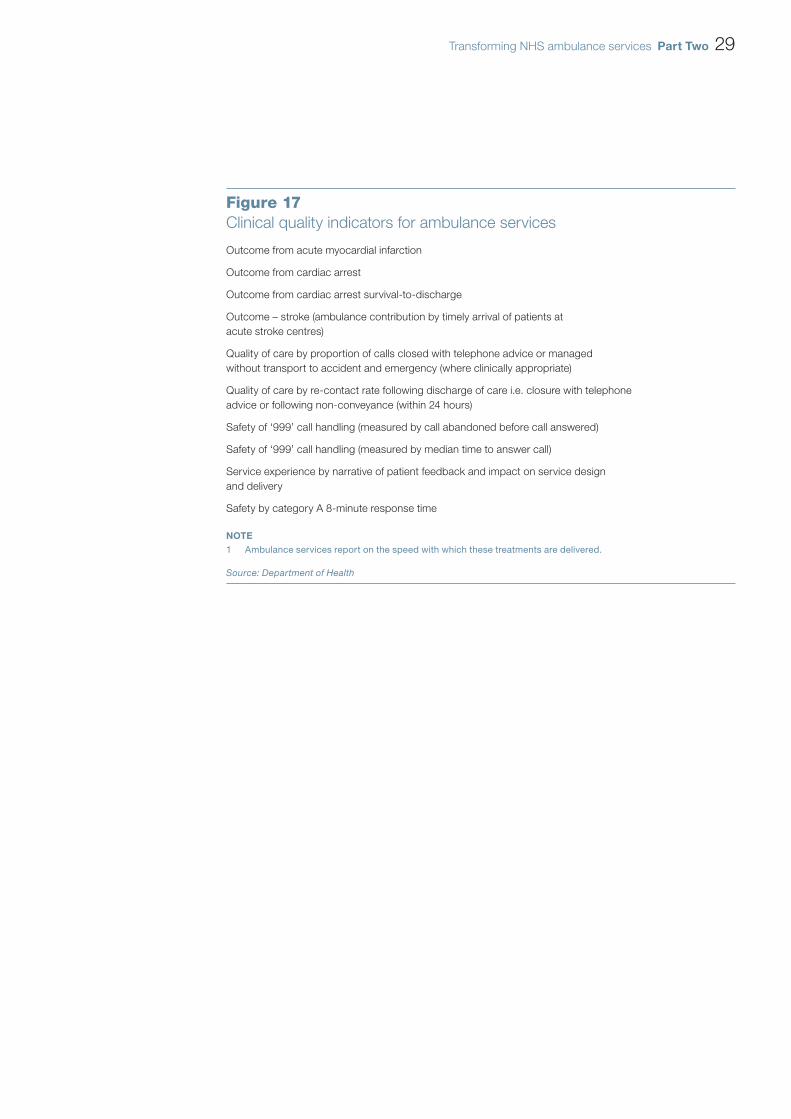
Response time targets became less dominant from 1 April 2011, since ambulance 2.9
services and their partners are now also measured specifi cally on survival-to-discharge
rates as part of a set of clinical quality indicators (Figure 17)12, which in some cases
build on existing clinical performance indicators for conditions such as stroke. This is in
line with previous National Audit Offi ce recommendations.13
The emergency services must now quickly develop procedures for collecting and 2.10
sharing information across organisations to measure performance. The key is for data
systems that can link different organisations. The electronic patient record forms being
piloted in some areas will make it easier to track patients through the system and for
information to be shared. The Scottish Ambulance Service introduced these forms in
all ambulances in 2008, which have been useful in terms of clinical audit. Pilots have
been successful in transferring the data to hospitals prior to patient arrival. However,
full roll-out has been delayed by problems with the interfaces between different
hospital systems.
9 Offi ce of the Strategic Health Authorities, Emergency services review: a comparative review of ambulance service best practice, 2009.
10 University of Sheffi eld, The cost and benefi ts of changing ambulance response time standards – fi nal report to the Department of Health, 2006.
11 Comptroller and Auditor General’s report, Progress in improving stroke care, HC 291 Session 2009-10.12 Department of Health, Equity and excellence: liberating the NHS, Cm 7881, 2010.13 Comptroller and Auditor General’s reports, Major trauma care in England, HC 213 Session 2009-10 and Progress in
improving stroke care, HC 291 Session 2009-10.
Transforming NHS ambulance services Part Two 29
Figure 17Clinical quality indicators for ambulance services
Outcome from acute myocardial infarction
Outcome from cardiac arrest
Outcome from cardiac arrest survival-to-discharge
Outcome – stroke (ambulance contribution by timely arrival of patients at
acute stroke centres)
Quality of care by proportion of calls closed with telephone advice or managed
without transport to accident and emergency (where clinically appropriate)
Quality of care by re-contact rate following discharge of care i.e. closure with telephone
advice or following non-conveyance (within 24 hours)
Safety of ‘999’ call handling (measured by call abandoned before call answered)
Safety of ‘999’ call handling (measured by median time to answer call)
Service experience by narrative of patient feedback and impact on service design
and delivery
Safety by category A 8-minute response time
NOTE
Ambulance services report on the speed with which these treatments are delivered.1
Source: Department of Health
30 Part Three Transforming NHS ambulance services
Part Three
Scope for improvement
This part of the report discusses the potential for improvement, distinguishing 3.1
between the key factors that impact on performance:
within the control of ambulance services, such as staffi ng and fi nancial �
management; and
those which require collaboration, such as congestion in hospital accident and �
emergency departments.
It also presents estimates of the fi nancial savings from changing the response model.
Scope for improvement within ambulance services’ control
Staffi ng
The availability and deployment of ambulance staff with appropriate skills, using 3.2
the most effi cient shift and rota patterns, has a major impact on the service’s ability to
meet its performance targets and minimise unnecessary patient visits to accident and
emergency departments.
Utilisation of ambulance crews
Services need to have a clear understanding of the extent to which crews are 3.3
being utilised. This will vary between types of vehicle and between rural and urban areas
within the service, which makes it harder for ambulance services to decide whether
performance is good. However, services measure their staff utilisation in different ways:
some use the average number of times a crew is called out in a given hour; some use
the number of hours worked as a proportion of hours available; but some services use
neither. This means that performance in relation to staff utilisation cannot be compared
across the sector.
Skills mix and deployment of ambulance staff
Some ambulance services told us that in the past it was normal for the same 3.4
amount of resource to be ‘on’ for the whole 24 hours, even though hourly call demand
may vary by a factor of three. Over the last few years, services have improved the way
they model demand against capacity. As a result, services are revisiting their preferred
pattern of 12-hour shifts with varying lengths of shift and start times, and deploying
crews to ‘standby’ points rather than ambulance stations.
Transforming NHS ambulance services Part Three 31
Advanced practitioners offer the greatest scope for treatment by ambulance staff. 3.5
Research at the time of their introduction, identifi ed potential reductions in transfer of
patients to accident and emergency departments of 30 per cent by treating them at
the scene.14 They are able to generate large savings through responding to calls from
nursing and residential homes, for example, which are often sources of unnecessary
hospital admissions.15 In practice, however, ambulance services have tended to use
advanced practitioners alongside paramedics, without targeting them where they can
have the greatest impact on conveyance rates.
Some ambulance services are using, or considering using, advanced practitioners 3.6
in ways that will make greater use of their skills. However, many have experienced
retention problems and one service no longer employs them. Only two services were
able to supply us with data on how their practitioners are deployed. In these services,
practitioners treated 13 per cent of patients at the scene while only attending 6 per cent
of incidents. This impact was clearer in the service that was targeting practitioners at
those cases offering most scope for treatment at the scene. Evidence suggests that the
call categorisation system currently in use in most services is not sophisticated enough
to direct practitioners to the most suitable calls.16
Increasing staff availability by reducing the level of ‘relief’
All ambulance services are concentrating efforts to reduce the level of additional 3.7
working required to cover shift time lost to leave, sickness and training. However,
overtime working (‘relief’ work) to cover for lost time is still part of the standard shift
pattern. Overtime is also used to cover vacancies, shift overruns and to address peaks
in demand. In 2009-10, the overtime hours worked by ambulance staff was equivalent to
almost 2,000 extra full-time ambulance staff, at a cost of nearly £80 million a year.
Since leave and a core level of training are mandatory, the main area where the 3.8
need for overtime can be reduced is through reducing sickness rates. Sickness rates
in the ambulance service are higher than the NHS as a whole. There are some good
reasons for this – ambulance work by its nature carries an increased risk of musculo-
skeletal injury and violence – but services also recognise that there is a cultural issue
around short-term sickness. For example, some areas that were formerly independent
ambulance services continue to have very different levels of sickness absence fi ve years
after consolidation.
14 Skills for Health, http://www.skillsforhealth.org.uk/about-us/resource-library/doc_details/87-cs-10-10-ecp-case-study.html
15 University of Sheffi eld, A Multi-centre community intervention trial to evaluate the clinical and cost effectiveness of Emergency Care Practitioners, 2009.
16 Gray and Walker, AMPDS categories: are they an appropriate method to select cases for extended role ambulance practitioners? Journal of Emergency Medicine, 2008.
32 Part Three Transforming NHS ambulance services
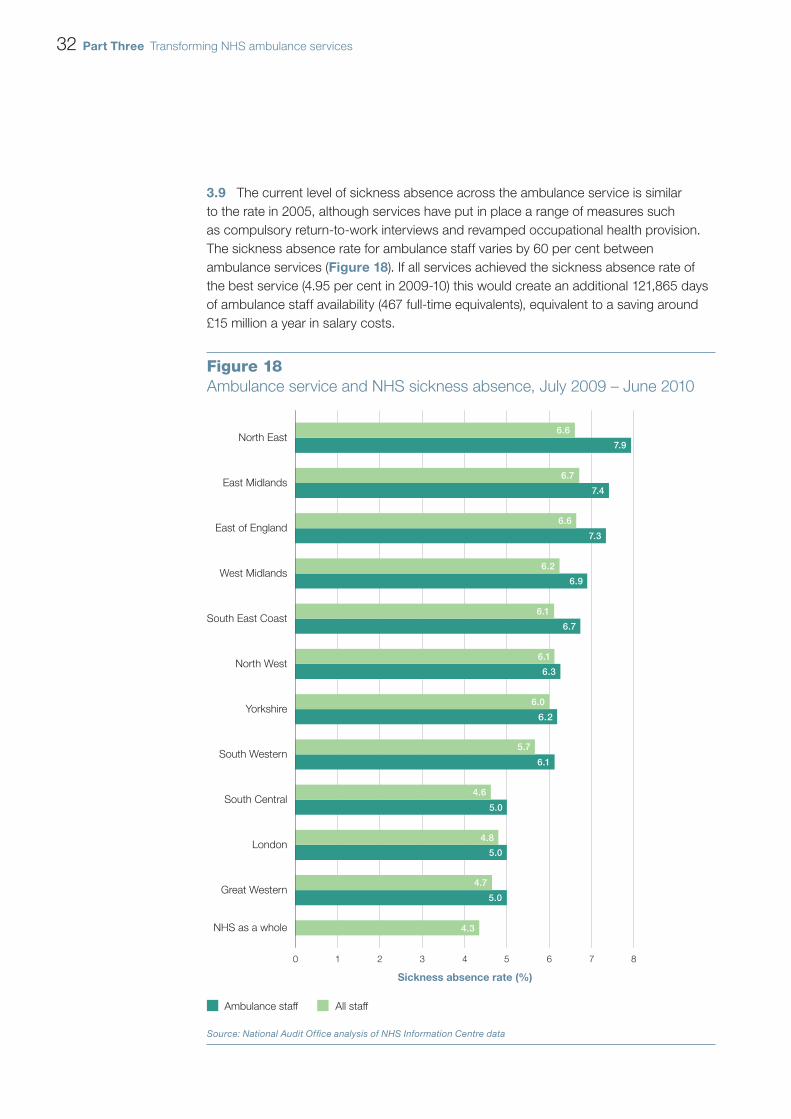
The current level of sickness absence across the ambulance service is similar 3.9
to the rate in 2005, although services have put in place a range of measures such
as compulsory return-to-work interviews and revamped occupational health provision.
The sickness absence rate for ambulance staff varies by 60 per cent between
ambulance services (Figure 18). If all services achieved the sickness absence rate of
the best service (4.95 per cent in 2009-10) this would create an additional 121,865 days
of ambulance staff availability (467 full-time equivalents), equivalent to a saving around
£15 million a year in salary costs.
Figure 18Ambulance service and NHS sickness absence, July 2009 – June 2010
North East
East of England
East Midlands
West Midlands
South East Coast
North West
Yorkshire
South Western
South Central
London
Great Western
NHS as a whole
0 1 2 3 4 5 6 7 8
Sickness absence rate (%)
Ambulance staff All staff
Source: National Audit Office analysis of NHS Information Centre data
6.6
7.9
6.7
7.4
6.6
7.3
6.2
6.9
6.1
6.7
6.1
6.3
6.0
6.2
5.7
6.1
4.6
5.0
4.8
5.0
4.7
5.0
4.3
Transforming NHS ambulance services Part Three 33
Response models
Ambulance services have organised themselves in different ways in response to the 3.10
category A 8-minute target. Services often mobilise more than one vehicle immediately
on receiving a call so that the dispatch is running in parallel to assessing the call. This
may happen for a number of reasons, for example, because a rapid response vehicle is
dispatched but the patient may need transportation which the rapid response vehicle
cannot provide. In 2009-10, more than one response was allocated to 49 per cent of
incidents (3.2 million). This percentage varies between services (Figure 19) because
different services have different allocation policies. The new clinical quality indicators
provide an opportunity for services to reassess their response and operational models.
Many ambulance services have a policy of mobilising the closest vehicle to the 3.11
scene, irrespective of type, whereas others only send a rapid response vehicle to
some calls unless staff indicate the need for back-up. In 2010-11, some 2.6 million
vehicles were activated then cancelled. Some services have recognised the benefi t of
reducing the number of vehicles per incident in some geographical areas. For example,
South Central reduced its response ratio in Hampshire from 1.3 to 1.15, more in line with
other areas within the service, saving about £80,000 a month.
Figure 19Percentage of incidents where more than one vehicle was allocated,
2009-10
South East Coast
Great Western
London
North West
Yorkshire
East of England
West Midlands
South Central
North East
South Western
East Midlands
0 10 20 30 40 50 60 70
Source: National Audit Office analysis of ambulance service data
Percentage
62
61
56
56
54
47
45
45
42
40
28
34 Part Three Transforming NHS ambulance services
Ambulance services can manage demand at three points in the call cycle: 3.12
‘hear and treat’; ‘see and treat’; and conveyance of patients to a range of destinations.
Reforms to each offer considerable benefi ts (Figure 20). There is considerable
variation across services as to how much of each is undertaken (Figure 21).
Figure 20The benefi ts of managing demand through the call cycle
Key areas where the response model can be transformed
Hear and treat See and treat Alternative destinations
Resolution of calls using telephone clinical assessment without the need to dispatch a vehicle
Resolution of incident at the scene without the need to convey to another provider
Conveyance of patients to an alternative destination such as a minor injuries unit
Key benefits
Ambulance sector
Reduction in the number �
of dispatches
Incidents are dealt with �
more promptly
Reduction in call cycle as �
no journey or turnaround
More effective uses of �
crew’s clinical skills
Reduction in handover �
times
Potential reductions in �
journey times
Wider NHS
Most appropriate �
pathways chosen
System capacity is �
better utilised
Reduction in emergency �
attendances
Substantial reduction in �
emergency attendances
Potential reduction in �
hospital admissions
Lower cost setting for �
attendance
Reduction in hospital �
admissions
The patient
Appropriate and immediate �
resolution
Care closer to home �
More immediate access to �
clinical treatment
Shorter treatment times �
Signposting to most �
appropriate setting
Care closer to home �
Improved convenience �
and choice
Shorter treatment times �
More coordinated patient �
service
Care closer to home �
Potential annual savings to the NHS (net)
£40-£80 million £15-£110 million £45-£90 million
Source: National Audit Offi ce literature review and National Audit Offi ce-commissioned work undertaken by Deloitte
Transforming NHS ambulance services Part Three 35
Figure 21Number of calls and methods of resolution, 2009-10
Patients treated at the scene Calls resolved through telephone adviceCalls received Emergency patient journeys
NOTE
1 Data include calls resolved over the phone by call-handlers.
Source: Analysis of ambulance service data
Number (000s)
0 200 400 600 800 1,000 1,200 1,400 1,600
Great Western
North East
South Western
South Central
South East Coast
East Midlands
Yorkshire
East of England
West Midlands
North West
London
1,480762
16866
1,064741
16419
844506
778
711
693
619
495
436
432
296
431
471
402
393
247
248
279
17285
82
125
140
175
185
126
245
20326
22
20
20
12
15
12
16
4
36 Part Three Transforming NHS ambulance services
Hear and treat
The proportion of calls resolved over the phone doubled between 2007-08 3.13
and 2009-10.17 They are resolved either by referral to clinicians in the call centre, the
call-taker, or transfer to NHS Direct. In 2009-10, 230,500 calls in total were resolved
through telephone advice18 (3 per cent of calls received by the service). The large
majority of these were through formal arrangements between eight of the ambulance
services and NHS Direct. Less than 10 per cent of these were referred back to the
services by NHS Direct.
‘Hear and treat’ (Box 1) interventions err on the side of caution. For example, for 3.14
84,000 calls referred for telephone advice in 2009-10, an ambulance response was
nevertheless sent. But only 17 per cent of these cases required patient transportation.
The North East Ambulance Service operates call-handling software called 3.15
NHS Pathways which assesses the patient’s symptoms on a different basis to non-NHS
software used by other services. NHS Pathways classifi es a smaller percentage of calls
as category A (24.6 per cent versus 28.8 per cent elsewhere, equivalent to 314,000
fewer category A calls in 2009-10 across the service), thus increasing the opportunities
for ‘hear and treat’ and ‘see and treat’ by service staff. Although evaluation confi rmed
this software as clinically safe in 200819, it is only being introduced more widely from
March 2011. Moreover, only eight services plan to, or have, introduced NHS Pathways.
See and treat
In 2009-10, 1.7 million emergency incidents were treated at the scene by 3.16
ambulance services (Box 1). This varied between 17 and 37 patients per 100 incidents
attended by services. Neither the number of patients treated at the scene, nor the
number of emergency and urgent journeys per hundred incidents, changed substantially
between 2007-08 and 2009-10.20 More patients are treated at the scene in rural areas,
implying that crews in these areas are more willing to use their training to treat people at
the scene because of the long distances involved in accessing other services.
17 Not all ambulance services provided 2007-08 data and prior to 2009 there was no national defi nition.18 This includes calls resolved over the phone by call-takers. 19 It has also been recommended by professional bodies such as the British Medical Association.20 Not all ambulance services provided 2007-08 data.
Transforming NHS ambulance services Part Three 37
See and convey
In 2009-10, there were 4.7 million emergency patient journeys. The proportion 3.17
varied from 64 to 83 emergency journeys per 100 incidents across services.21 The fi nal
destination of the patients includes accident and emergency departments, specialist
centres, minor injuries units or walk-in centres (discussed in paragraphs 3.33 and
3.34, page 41).
Financial drivers for improved effi ciency
Ambulance services on average receive high marks for their fi nancial standing 3.18
in the Audit Commission’s Auditors’ Local Evaluations, both in absolute terms and in
comparison with hospital trusts.
Ambulance services will be required to achieve signifi cant effi ciencies in the future. 3.19
Services’ commissioners set the ambulance service a target of £97 million of effi ciency
savings (5 per cent of income) for 2010-11. Individual services’ targets vary from
3 per cent to 10 per cent. Those with higher targets have above-average reference costs
(see Figure 8, page 17).
The cost improvement plans of ambulance services show how they intend to 3.20
achieve the annual 4 per cent effi ciency savings required of all NHS trusts.22 They
contain common themes to increase the effi ciency of front-line resources, which refl ect
the issues we identifi ed in paragraphs 3.2 to 3.9 on pages 30 to 32, with challenging
implications for management of staff: reorganisation of shift patterns and rosters;
reduced sickness absence; changes in skill-mix of staff; and headcount reductions.
21 Includes calls from healthcare professionals, 94 per cent of these calls result in patient transportation to hospital.22 Department of Health, The Operating Framework for the NHS in England 2011-12.
Box 1Case examples
1 Hear and treat
A patient has a nasty cut to the arm. The over-the-phone assessment identifies that the cut is in a
non-dangerous area and the blood loss is not severe. The size indicates it probably needs stitching.
The call-taker’s assessment triggers a search on the directory of services and then the patient is referred
to a minor injuries unit with the facilities they need, close to their home.
2 See and treat
An elderly person has fallen at home. An advanced practitioner, sent to the scene, is able to check the cause
of the fall, inject local anaesthetic, apply stitches and ensure the patient has painkillers and advice cards.
The practitioner can then contact the patient’s GP, providing them with a copy of the clinical record and book
a follow-up appointment with the district nurse to remove the stitches. This prevents the patient having to
make an unnecessary trip to hospital and ensures they receive the correct follow-up treatment.
Source: NHS Confederation, Seeing ambulance services in a different light, June 2010
38 Part Three Transforming NHS ambulance services
In common with other NHS trusts, by April 2014, ambulance services will need to 3.21
be approved as foundation trusts by Monitor, the independent regulator, if they wish to
continue to operate as separate entities. Ambulance services are at different stages in
this process; the fi rst two received foundation trust status in March 2011. We found that
the application process helps to promote a culture of strong fi nancial management and
robust longer-term business plans.
The role of rurality
Rural areas present inherent challenges for an effi cient, fast-responding service 3.22
because calls are less frequent and widely spaced. When performance is broken down
to the level of individual primary care trusts, we found that in 2009-10, the category A
8-minute response target was met in only one-quarter of the most rural 25 per cent of
primary care trusts. In comparison, the target was met in just under two-thirds of the
most urban 25 per cent (Figure 22). There was, however, a wide range of performance
even in areas with the same level of population density and population clustering,
which indicates there is scope for services containing more rural areas to learn from
each other.
Figure 22Performance against the category A 8-minute response target for primary
care trusts, by level of rurality, 2009-10
Percentage responded to within 8 minutes
90
85
80
75
70
65
60
1 2 3 4
More rural More urban
Level of rurality (quartiles)
NOTE
1 The circle represents the mean and the bar represents two standard errors. The maximum and minimum values may fall outside these ranges.
Source: National Audit Office analysis of ambulance service data
8-minute target
Upper 72.9 76.9 78.6 79.4
Mid-point 71.5 74.8 76.5 77.4
Lower 70.0 72.7 74.5 75.5
Transforming NHS ambulance services Part Three 39
Scope for improvement requiring collaboration
Reducing Demand
Ambulance services are working with partners to reduce demand. The key 3.23
Departmental initiative to which services are contributing is the introduction of
the ‘111’ number which provides an alternative for those callers who do not have
immediately life-threatening conditions and should help to ensure that ambulance
resources are directed to those who have a medical emergency and require an
immediate response. Pilots began in 2010 in Lincolnshire, Nottingham City, Luton and
Durham and Darlington. NHS Direct are hosting the service in the fi rst three, North East
Ambulance Service in the latter. Local commissioners decide on the speed of roll-out
in their area, the size of each project, the provider, and which software will be used. It is
too soon to see an impact on ‘999’ call volumes.23 Strategic health authorities’ plans
forecast that 40 per cent of the population will be covered by April 2012, but some are
not on course to deliver against this timescale.
Many ambulance services also work with partners to reduce calls from particular 3.24
patient groups. For example, falls account for over 10 per cent of calls. In some areas,
falls teams have been established by the ambulance service in conjunction with social
care, whilst in others areas primary care trusts have established them to provide an
advice and prevention service to people at risk of repeat falls. The ambulance service is
then able to refer patients to these teams.
Data
The ambulance service collects a wide range of performance data. However, we 3.25
found that different interpretations of data requested by the NHS Information Centre,
different computer-aided dispatch systems and recording of information by users,
and differences in the way ambulance services defi ne some metrics, for example,
conveyance rates and utilisation rates, limit its reliability and use. The ability of services
to generate some performance information also varied. In addition, the quality of data
on treatment costs is variable, which could undermine attempts to introduce a charging
system based on treatment administered. A national ambulance information group was
established in 2010 to address these issues.
Commissioners need to be able to monitor contract performance effectively. 3.26
Some have specifi ed a minimum data set within their contract, but there is no standard
set across the service.
23 University of Sheffi eld, Evaluation of NHS 111 pilot sites First Interim Report, May 2011.
40 Part Three Transforming NHS ambulance services
No ambulance services can currently accurately identify the fi nal treatment pathway 3.27
of the patient. This information is required to monitor progress in conveying people to the
most appropriate places of care. Published ambulance data24 include information about
the fi nal destination of some patients, but are incomplete. Hospital data are unable to
ascertain which type of facility treated a patient brought in by ambulance.
Sharing best practice
Coordination across ambulance services has improved substantially over the last 3.28
few years with regular meetings between chief executives, directors of operations and
other key members of staff. Effective collaboration takes place across a number of areas
such as procurement and emergency planning. Whilst they also share best practice,
cultural differences between the services and differences in data defi nitions inhibit the
take-up of good practice. Services told us of their concerns that the sharing of best
practice may be inhibited if services envisage being in competition with one another
in the future.
Congestion in hospital accident and emergency departments
Advantages gained by ambulances responding to calls quickly can be lost 3.29
at the end of the journey. The average time taken at hospital for staff to handover
the patient and turnaround for another call varies across services between 20 and
35 minutes. Data for 2010-11, suggests that at least one-fi fth of emergency transports
to hospitals result in patient handovers that take over the expected time of 15 minutes.25
One ambulance service estimated that, based on the current level of delays, £4 million
per year is required in additional resources due to hospital congestion. Our analysis
suggests that delays in handover time impact more on response times to less serious
calls. Ambulances diverted from overcrowded accident and emergency departments are
also signifi cantly correlated with slower response times in London.
Congestion at hospital accident and emergency departments impacts on 3.30
ambulance performance. Increased levels of queuing by ambulances over the period
November 2010 to February 2011, had a signifi cant correlation with declining national
performance against category A and B targets in most parts of the country. It is notable,
however, that West Midlands was able to maintain performance despite accounting for
39 per cent of all queuing occurrences during the period.26
24 By the NHS Information Centre.25 This fi gure is a minimum since handover times are not always recorded.26 Diverting ambulances from accident and emergency departments only had a signifi cant correlation with
declining performance against the category B target because of the extent of the problem in London, where one-third of all diverts occurred.
Transforming NHS ambulance services Part Three 41
Ambulance services, commissioners and acute trusts have, or are, introducing a 3.31
range of measures to reduce handover times including:
display screens in hospitals so that staff know when to expect ambulance �
crews arriving;
handover buttons at hospitals that are pressed when the patient has been handed �
over to the hospital;
agreed escalation policies if handover times exceed the recommended limit; and �
reports sent to acute trusts’ chief executives and strategic health authorities to �
highlight poor performance.
Some commissioners require ambulance services to reduce turnaround times 3.32
at hospitals under threat of fi nancial penalty to encourage crews to make themselves
available as soon as possible after handing over patients, while others have penalised
hospitals for failing to accept patients from ambulances promptly. But these are not
common practice across commissioners.
Access to non-emergency facilities
Access to facilities that can provide cheaper destinations offering more appropriate 3.33
care for some patients can be hindered by the need for a number of different factors to
be in place:
The right services being available and visible to ambulance staff. �
Protocols in place for staff to drop off patients when appropriate. This requires �
the formal approval of the ambulance service, the service provider and their
respective commissioners. Providers and commissioners do not always agree to
such arrangements.
Ambulance staff using the services as intended. �
Alternatives to transporting patients to accident and emergency departments can 3.34
be provided most effectively for patients when there is an electronic directory of services
which informs staff of alternative services available, underpinned by information about
health and social services, their capabilities and real-time capacities. The North East
Ambulance Service’s ‘hear and treat’ fi gures doubled, from 8,000 to 16,000 a year,
after it introduced such a system. Most ambulance services have yet to introduce such
a system, and instead work on an ad hoc basis or have a paper-based directory of
services to which call-takers can refer. Work to develop this information is linked to the
introduction of the ‘111’ non-emergency number in local areas and the pace of progress
varies widely. Ambulance services rely on these directories being populated by primary
care trusts, GPs and other local health providers.
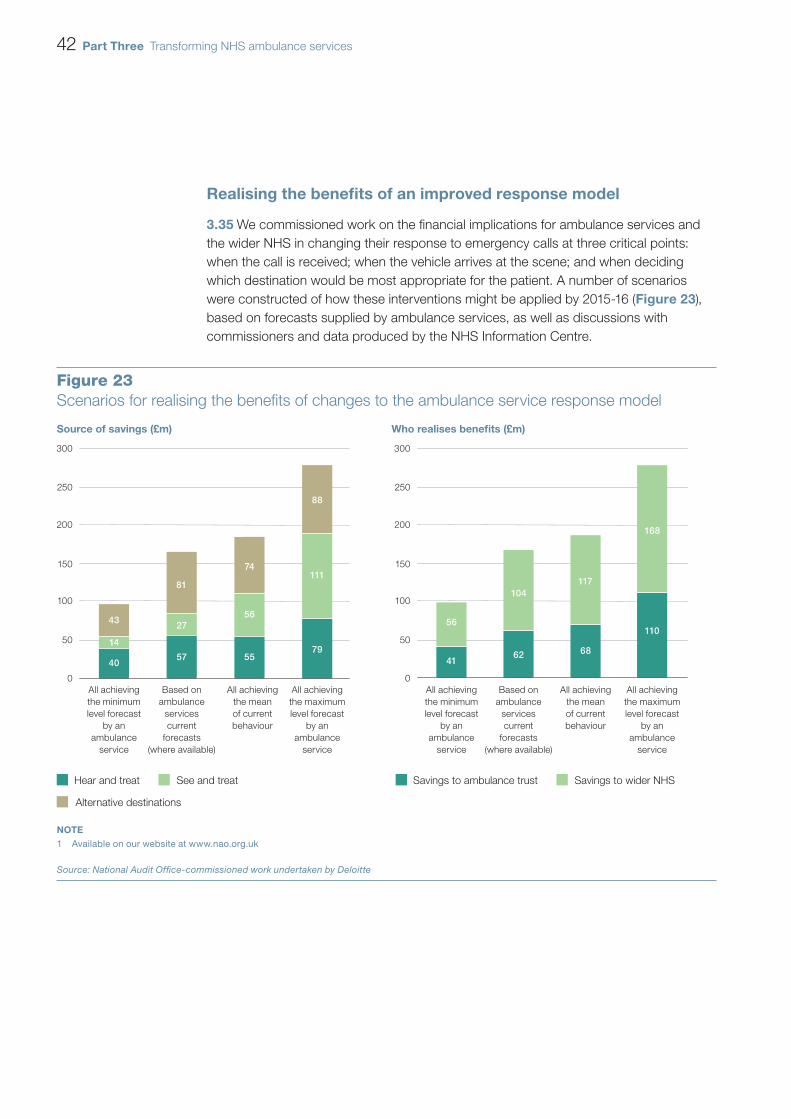
42 Part Three Transforming NHS ambulance services
Realising the benefi ts of an improved response model
We commissioned work on the fi nancial implications for ambulance services and 3.35
the wider NHS in changing their response to emergency calls at three critical points:
when the call is received; when the vehicle arrives at the scene; and when deciding
which destination would be most appropriate for the patient. A number of scenarios
were constructed of how these interventions might be applied by 2015-16 (Figure 23),
based on forecasts supplied by ambulance services, as well as discussions with
commissioners and data produced by the NHS Information Centre.
Source of savings (£m) Who realises benefits (£m)
Figure 23Scenarios for realising the benefits of changes to the ambulance service response model
300
250
200
150
100
50
0
300
250
200
150
100
50
0
All achieving
the minimum
level forecast
by an
ambulance
service
Based on
ambulance
services
current
forecasts
(where available)
All achieving
the mean
of current
behaviour
All achieving
the maximum
level forecast
by an
ambulance
service
All achieving
the minimum
level forecast
by an
ambulance
service
Based on
ambulance
services
current
forecasts
(where available)
All achieving
the mean
of current
behaviour
All achieving
the maximum
level forecast
by an
ambulance
service
Hear and treat
Alternative destinations
See and treat Savings to ambulance trust Savings to wider NHS
NOTE
1 Available on our website at www.nao.org.uk
Source: National Audit Office-commissioned work undertaken by Deloitte
14
43
40
81
27
57 55
56
74
79
111
88
41
56
62
104
68
117
110
168
Transforming NHS ambulance services Part Three 43
These scenarios, combined with a range of data and assumptions on unit 3.36
costs, produced a range of indicative savings from £100 million a year, based on a very
conservative prediction of service performance, to £280 million a year (both in 2009-10
prices) on the assumption that services will meet the highest aspirations. If in fi ve years all
ambulance services were to achieve the best that is currently being achieved by a service
in each category of performance (with, say, urban services treating as high a proportion of
patients at the scene as rural services do) the savings would be an estimated £165 million
a year. In all scenarios, most of these savings would accrue to other NHS organisations
and realising these savings will require their cooperation.
There are a number of factors which need to be in place to realise these benefi ts, 3.37
and which will place a constraint on the ability to realise savings at the upper end of the
scenarios presented:
the need to maintain a strong culture of clinically safe behaviour; �
ensuring staff have the right skills and the confi dence to use them; �
encouraging staff to use triaging techniques when appropriate, even when less �
effective solutions are more convenient;
strategic commissioning that recognises costs and benefi ts across the emergency �
care sector, and incentivises the right behaviour;
the need to actively decommission health services which would receive less use if �
more appropriate care solutions were available;
availability and visibility of non-emergency destinations; and �
the need to manage the public’s expectations in relation to ambulance services, �
particularly in relation to being taken to hospital.
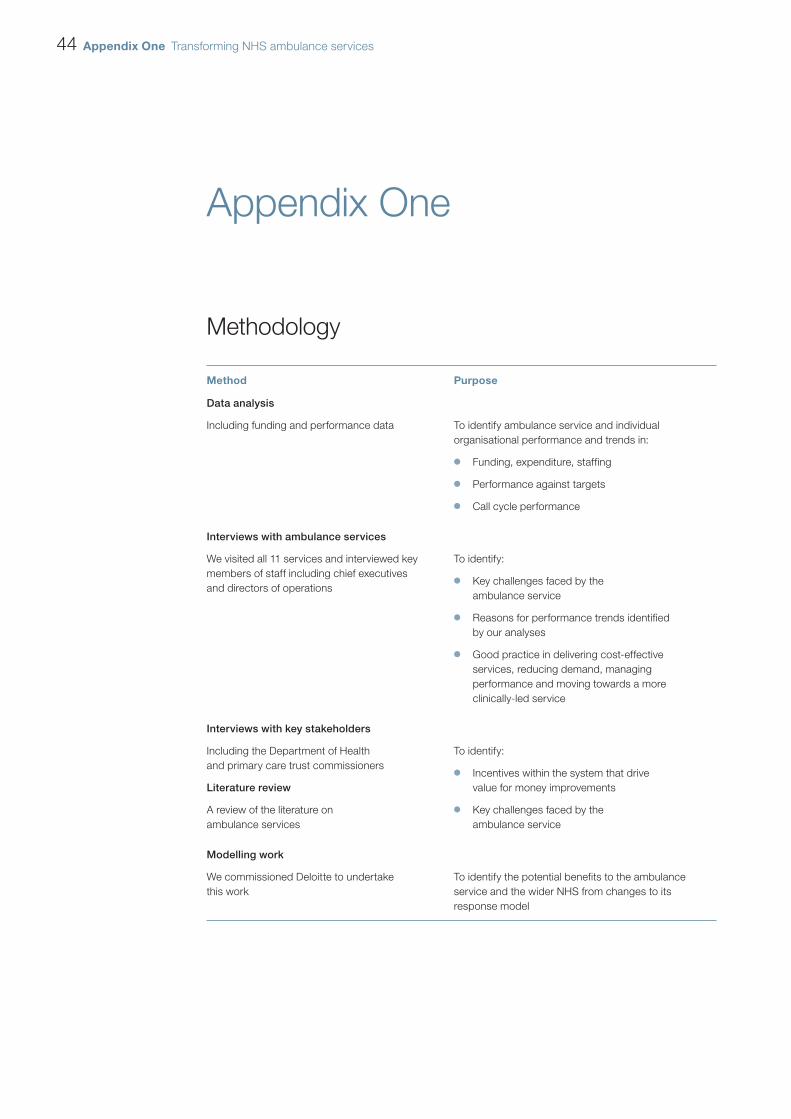
44 Appendix One Transforming NHS ambulance services
Appendix One
Methodology
Method Purpose
Data analysis
Including funding and performance data To identify ambulance service and individual
organisational performance and trends in:
Funding, expenditure, staffing �
Performance against targets �
Call cycle performance �
Interviews with ambulance services
We visited all 11 services and interviewed key
members of staff including chief executives
and directors of operations
To identify:
Key challenges faced by the �
ambulance service
Reasons for performance trends identified �
by our analyses
Good practice in delivering cost-effective �
services, reducing demand, managing
performance and moving towards a more
clinically-led service
Interviews with key stakeholders
Including the Department of Health
and primary care trust commissioners
Literature review
A review of the literature on
ambulance services
To identify:
Incentives within the system that drive �
value for money improvements
Key challenges faced by the �
ambulance service
Modelling work
We commissioned Deloitte to undertake
this work
To identify the potential benefits to the ambulance
service and the wider NHS from changes to its
response model

Design and Production byNAO CommunicationsDP Ref: 009589-001
This report has been printed on Consort 155 and contains material sourced from responsibly managed and sustainable forests certified in accordance with FSC (Forest Stewardship Council).
The wood pulp is totally recyclable and acid-free. Our printers also have full ISO 14001 environmental accreditation which ensures that they have effective procedures in place to manage waste and practices that may affect the environment.

Published by TSO (The Stationery Office) and available from:
Online
www.tsoshop.co.uk
Mail, Telephone, Fax & Email
TSOPO Box 29, Norwich NR3 1GNTelephone orders/General enquiries: 0870 600 5522Order through the Parliamentary Hotline Lo-Call 0845 7 023474Fax orders: 0870 600 5533Email: [email protected]: 0870 240 3701
The Parliamentary Bookshop12 Bridge Street, Parliament Square, London SW1A 2JXTelephone orders/General enquiries 020 7219 3890Fax orders: 020 7219 3866Email: [email protected]: http//www.bookshop.parliament.uk
TSO@Blackwell and other Accredited Agents
Customers can also order publications from:
TSO Ireland
16 Arthur Street, Belfast BT1 4GD028 9023 8451 Fax 028 9023 5401
9 780102 969719
ISBN 978-0-10-296971-9
£15.50