Embed Size (px)
Citation preview
California Environmental Protection Agency Edmund G. Brown, Jr., Governor
DEPARTMENT OF RESOURCES RECYCLING AND RECOVERY 1001 I STREET, SACRAMENTO, CALIFORNIA 95814 • WWW.CALRECYCLE.CA.GOV • (916) 322-4027
P.O. BOX 4025, SACRAMENTO, CALIFORNIA 95812
ORIGINAL PRINTED ON 100 % POST-CONSUMER CONTENT, PROCESS CHLORINE FREE PAPER
January 25, 2018 Ramin Abidi Deputy Director County of San Diego 5510 Overland Ave., Suite 410 San Diego, CA 92123-1237 VIA ELECTRONIC MAIL Re: Five-Year Review Report For the Countywide Integrated Waste Management
Plan For The County of San Diego Dear Mr. Abidi: This letter is notification that on January 25, 2018 the County of San Diego’s request for approval was approved. Please see CalRecycle Public Notices page at “http://www.calrecycle.ca.gov/Actions/” for complete item information. We look forward to working with you as the County of San Diego implements its diversion-related programs. Should you have any questions, please contact Arlene Iwahiro of the Local Assistance and Market Development Division at (916) 322.8000. Sincerely,
Caroll Mortensen, Manager North Section, Local Assistance and Market Development Division Attachment: Request For Approval cc: A. Iwahiro
i
County of San Diego
Five-Year Review Report of the Countywide Integrated Waste Management Plan
Board of Supervisors Greg Cox, District 1
Dianne Jacob, District 2 Kristin Gaspar, District 3 Ron Roberts, District 4
Bill Horn, District 5
Chief Administrative Officer
Helen N. Robbins-Meyer
Deputy Chief Administrative Officer Sarah E. Aghassi
Land Use and Environment Group
Department of Public Works Richard E. Crompton, Director
Prepared by:
County of San Diego Department of Public Works
5510 Overland Avenue, Suite 410 San Diego, CA 92123
ii
Table of Contents TABLE OF CONTENTS ............................................................................................................. 2 1 LIST OF FIGURES ............................................................................................................. 3 2 LIST OF TABLES ............................................................................................................... 4 3 INTRODUCTION .............................................................................................................. 5
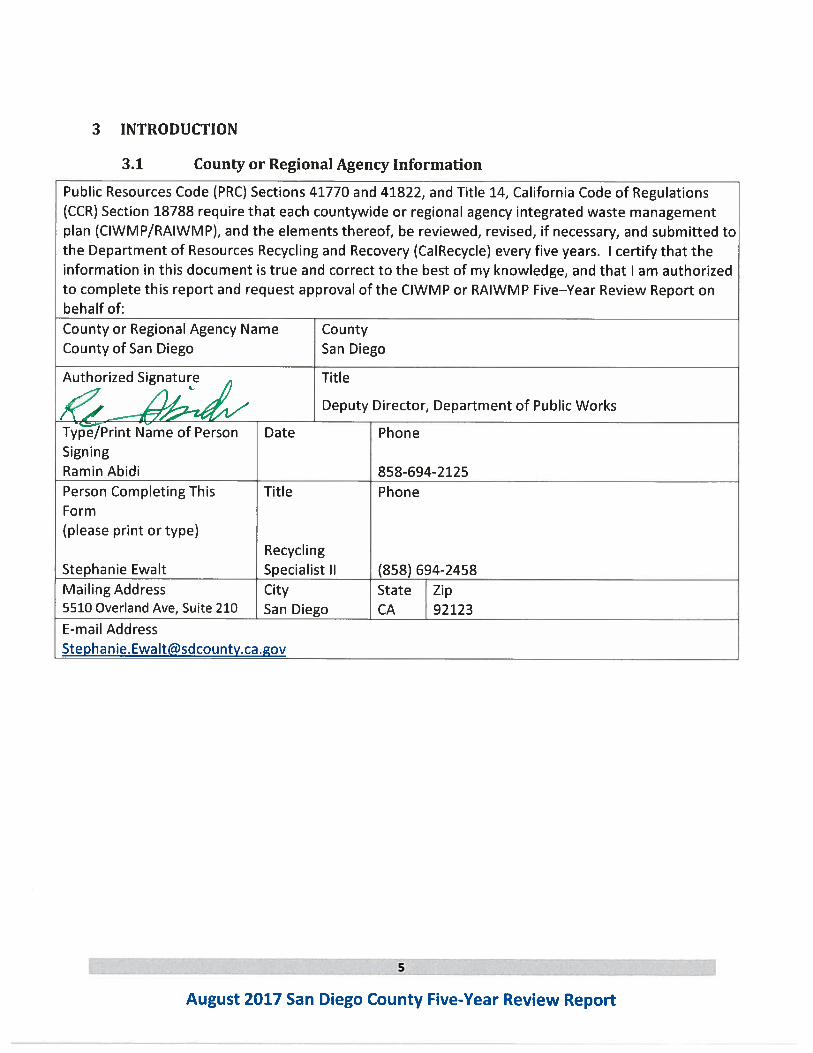
3.1 County or Regional Agency Information ......................................................................... 5 3.2 Background ..................................................................................................................... 6
4 LOCAL TASK FORCE REVIEW ........................................................................................... 7 5 TITLE 14, CALIFORNIA CODE OF REGULATIONS SECTION 18788 (3) (A) THROUGH (H) ...... 8
5.1 Changes in Demographics in the County or Regional Agency ........................................ 8 5.2 Changes in Quantities of Waste within the County and Changes in Permitted Disposal Capacity and Waste Disposed in the County ............................................................................ 17 5.3 Changes in Funding Source for Administration of the Siting Element (SE) and Summary Plan (SP) .................................................................................................................................... 30 5.4 Changes in Administrative Responsibilities .................................................................. 30 5.5 Programs that were Scheduled to be Implemented but were not .............................. 30 5.6 Changes in Available Markets for Recyclable Materials ............................................... 31 5.7 Changes in the Implementation Schedule .................................................................... 31
6 ANNUAL REPORT REVIEW ............................................................................................ 32 7 APPENDICES A AND B. .................................................................................................. 33
iii
1 LIST OF FIGURES
Figure 1- San Diego Countywide Demographics in Relation to Waste Disposal .......................... 15 Figure 2 - San Diego Countywide In-County Disposal Trend ........................................................ 16 Figure 3 - San Diego County Disposal and Per Capita Tons Disposal Trends (1995-2015) ........... 24 Figure 4 - San Diego and Statewide Per Capita Disposal (2007 – 2015) ....................................... 25 Figure 5 - San Diego Countywide Exports (1995-2015) ................................................................ 27 Figure 6 - San Diego County Landfill Capacity Projections ........................................................... 28 Figure 7 - San Diego County Landfill Capacity Projections (Detailed) .......................................... 29
iv
2 LIST OF TABLES
Table 1 - Population of San Diego County Jurisdictions, 2000-2015 ............................................ 11 Table 2 - San Diego County Labor Force, 1995-2016 .................................................................... 12 Table 3- San Diego Consumer Price Index, 2007-2016 ................................................................. 13 Table 4- San Diego County Taxable Sales ($) ................................................................................ 14 Table 5 - Solid Waste Generation Tonnage Comparison for San Diego County, 2000 to 2006 * 21 Table 6 - Solid Waste Disposal Tonnage for San Diego County Jurisdictions, 2000-2015 ............ 22 Table 7 - Solid Waste Diversion and Per Capita Disposal Rates for San Diego County Jurisdictions, 2000-2015 ............................................................................................................... 23 Table 8 - San Diego County Landfill Information and Estimated Capacity ................................... 26
6
August 2017 San Diego County Five-Year Review Report
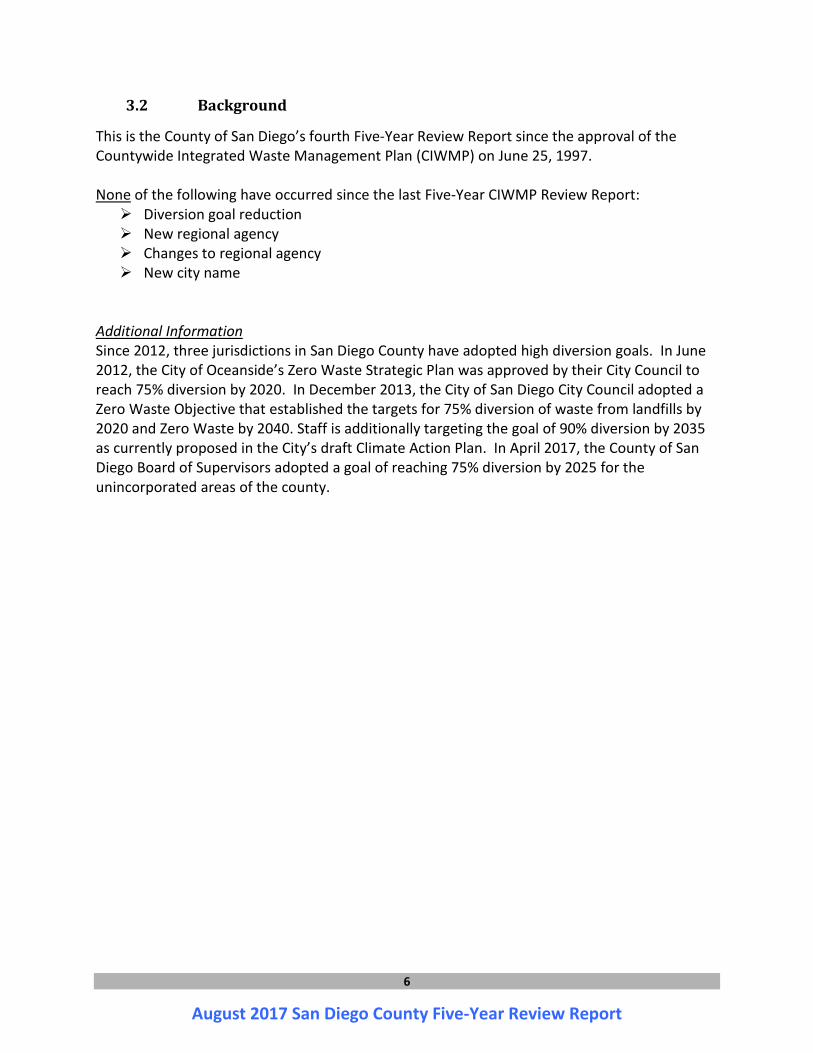
3.2 Background
This is the County of San Diego’s fourth Five-Year Review Report since the approval of the Countywide Integrated Waste Management Plan (CIWMP) on June 25, 1997. None of the following have occurred since the last Five-Year CIWMP Review Report: Diversion goal reduction New regional agency Changes to regional agency New city name
Additional Information Since 2012, three jurisdictions in San Diego County have adopted high diversion goals. In June 2012, the City of Oceanside’s Zero Waste Strategic Plan was approved by their City Council to reach 75% diversion by 2020. In December 2013, the City of San Diego City Council adopted a Zero Waste Objective that established the targets for 75% diversion of waste from landfills by 2020 and Zero Waste by 2040. Staff is additionally targeting the goal of 90% diversion by 2035 as currently proposed in the City’s draft Climate Action Plan. In April 2017, the County of San Diego Board of Supervisors adopted a goal of reaching 75% diversion by 2025 for the unincorporated areas of the county.
7
August 2017 San Diego County Five-Year Review Report
4 LOCAL TASK FORCE REVIEW
a. In accordance with Title 14 CCR, Section 18788, the Local Task Force (LTF) reviewed each element and plan included in the CIWMP and finalized its comments.
at the LTF meeting. electronically (fax, e-mail) other (Explain): County of San Diego staff presented the Five-Year Review Report to the Local Task Force. It was sent to the Technical Advisory Committee (TAC) on July 6th, 2017 and to the Citizen’s Advisory Committee (CAC) on 7/13/17. Both were provided an open comment period through August 1, 2017. No comments were received by either committee. See Appendix B for TAC and CAC meeting agendas. County staff also provided the Five-Year Review Report to the San Diego Association of Governments (SANDAG) in August 2017.
b. The County of San Diego received the written comments from the LTF on N/A – No
comments were received.
Members of the Integrated Waste Management Technical Advisory Committee include representatives of the following jurisdictions: Carlsbad Lemon Grove Chula Vista National City Coronado Oceanside Del Mar Poway El Cajon San Diego Encinitas San Marcos Escondido Santee Imperial Beach Solana Beach La Mesa Vista County of San Diego (unincorporated)
Members of the Citizen’s Advisory Committee vary and consist of citizens, haulers and solid waste industry, and non-profit organizations. _____________________________________________________________________________________________
8
August 2017 San Diego County Five-Year Review Report
5 TITLE 14, CALIFORNIA CODE OF REGULATIONS SECTION 18788 (3) (A) THROUGH (H)
San Diego County CIWMP documents, accompanied by individual annual reports, continue to serve as appropriate reference tools for implementing and monitoring compliance with AB 939. The goals, objectives, and policies in the elements are still applicable. Each jurisdiction’s letter of planning document accuracy is in Appendix A. The subsections below address the areas of change specified in the regulations, and provide specific analysis regarding the continued adequacy of the planning documents including a determination regarding any need for a revision to one or more of the planning documents.
5.1 Changes in Demographics in the County or Regional Agency
Analysis
Upon review of demographic changes since 1990: The demographic changes since the development of the CIWMP do not warrant a revision to any of the countywide planning documents.
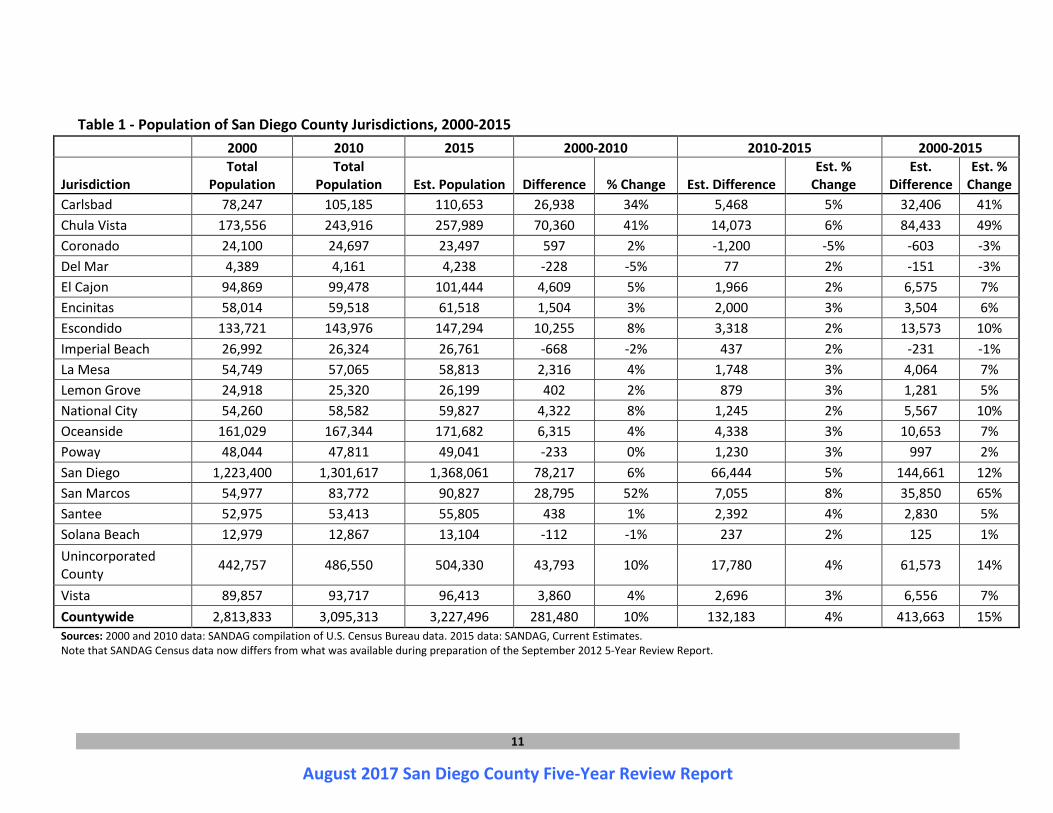
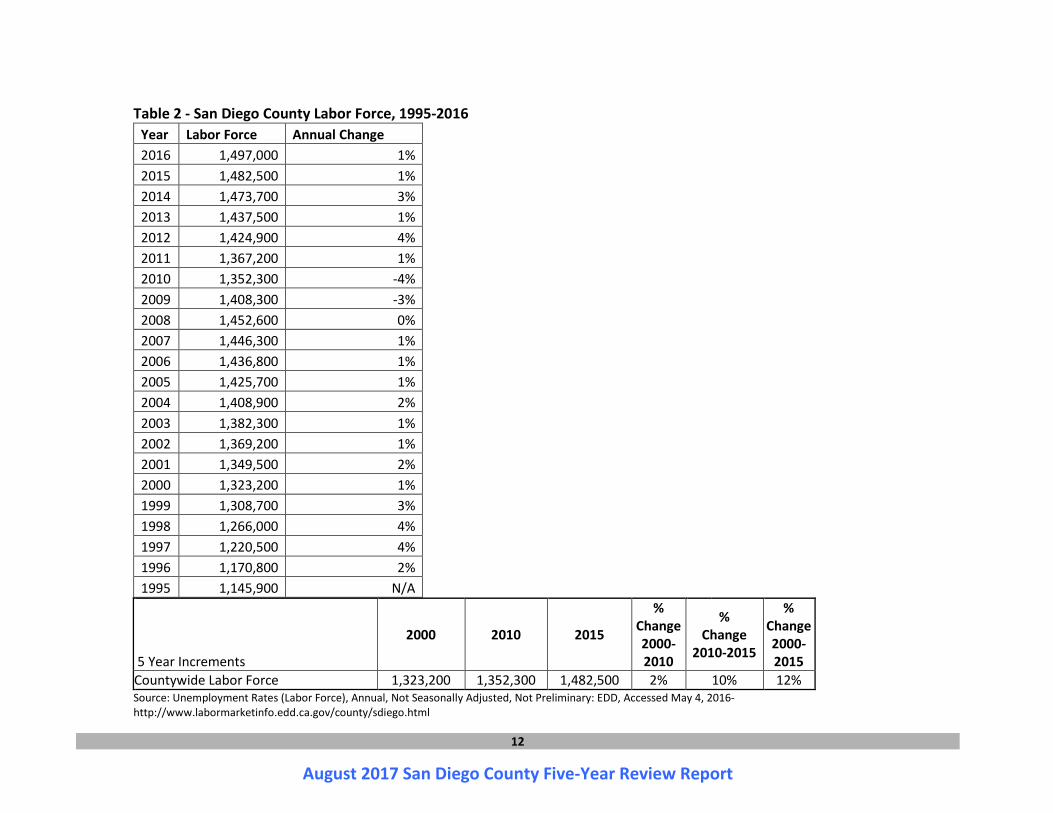
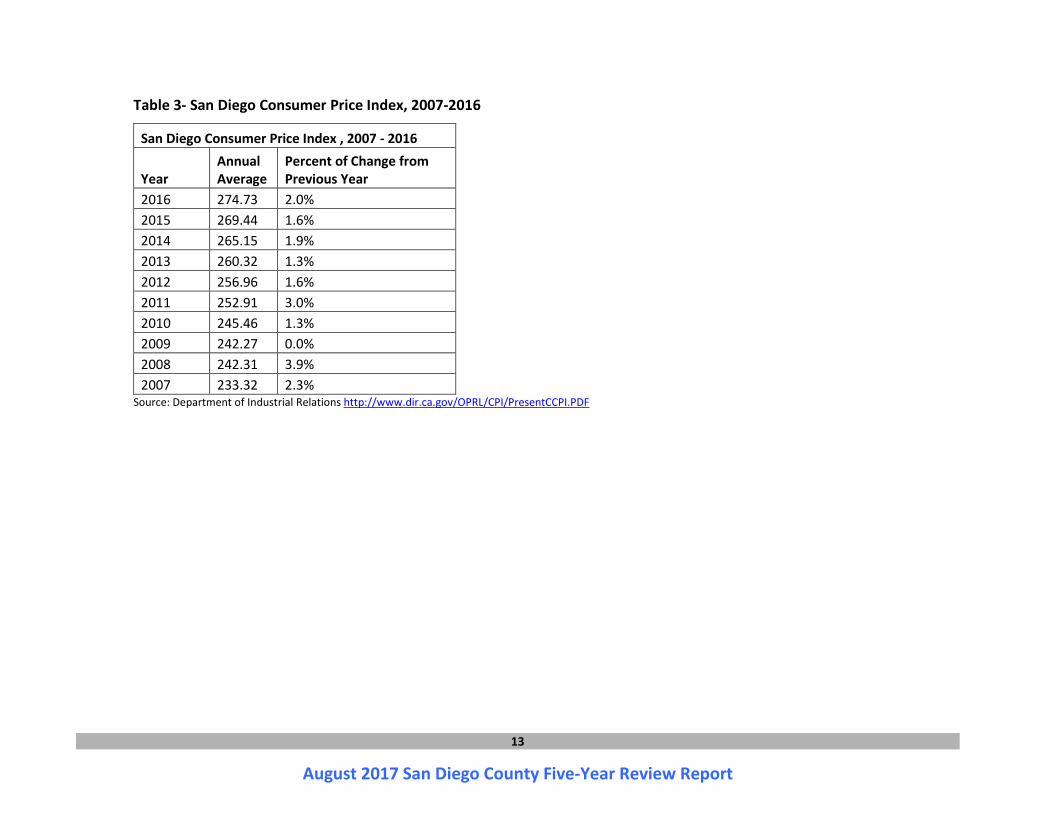
Additional Analysis The previous 2012 Five-Year Review Report of the CIWMP noted a high rate of population growth from 2000 to 2010. However, as shown in this 2017 Five-Year Review Report of the CIWMP, this did not continue into the next five year period. From 2010 to 2015, San Diego County experienced a steady rate of population growth (Table 1)1. Population grew countywide by 4% between 2010 and 2015. Population changes generally vary from jurisdiction to jurisdiction, but within the five year period of 2010 through 2015 all jurisdictions had a narrow growth rate increase between 2% to 8% (with the exception of Coronado which decreased by 5%). The San Diego countywide labor force also increased (Table 2)2. From 2010 to 2015, the labor force grew by 10% after increasing only 2% during the 2000-2010 period. However, the year-over-year change in the labor force has been fluctuating since 2010, with labor force growth at 1% in 2011, 2013, 2015, and 2016. This is less robust than the annual job growth between 1996 and 1999 which was between 2% and 4% each year. San Diego Consumer Price Index grew from an annual average of 245.46 in 2010 to an annual average of 274.73 in 2016 for an 11.9% growth rate during that time frame (Table 3)3. San
1 Source: SANDAG Census Data, Table page 11. 2 Source: California Employment Development Department unemployment rates, Table page 12. 3 Source: Department of Industrial Relations, Table page 13
9
August 2017 San Diego County Five-Year Review Report
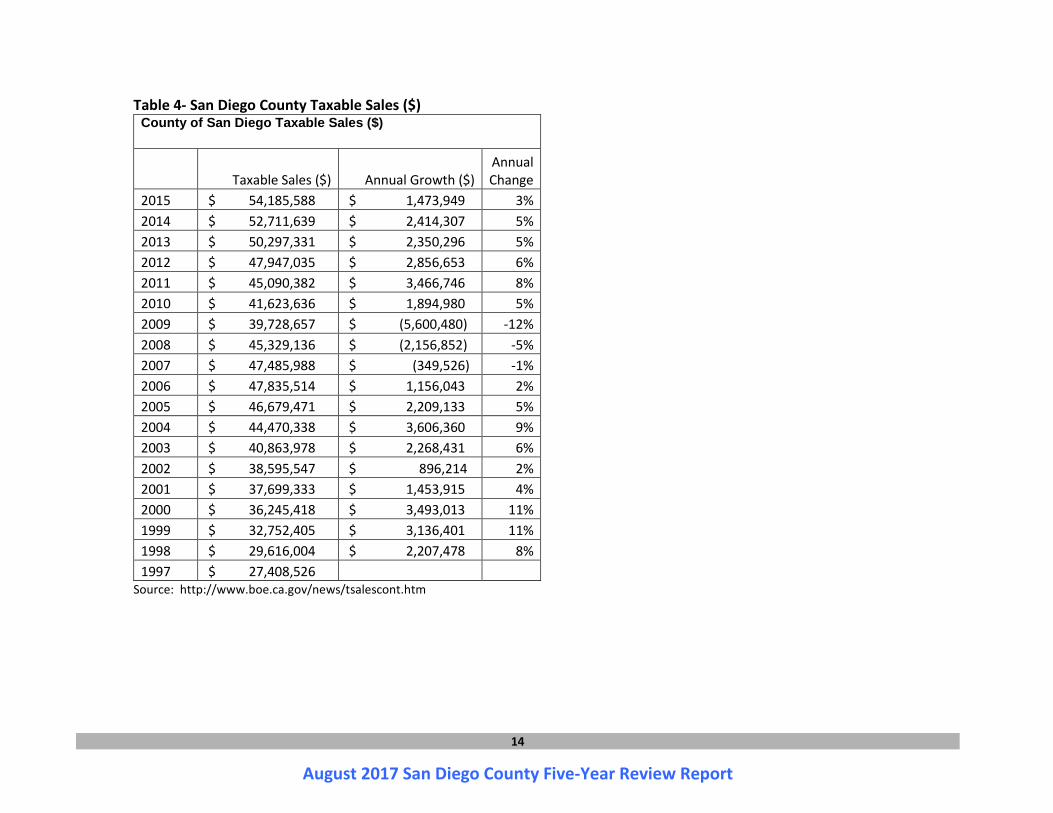
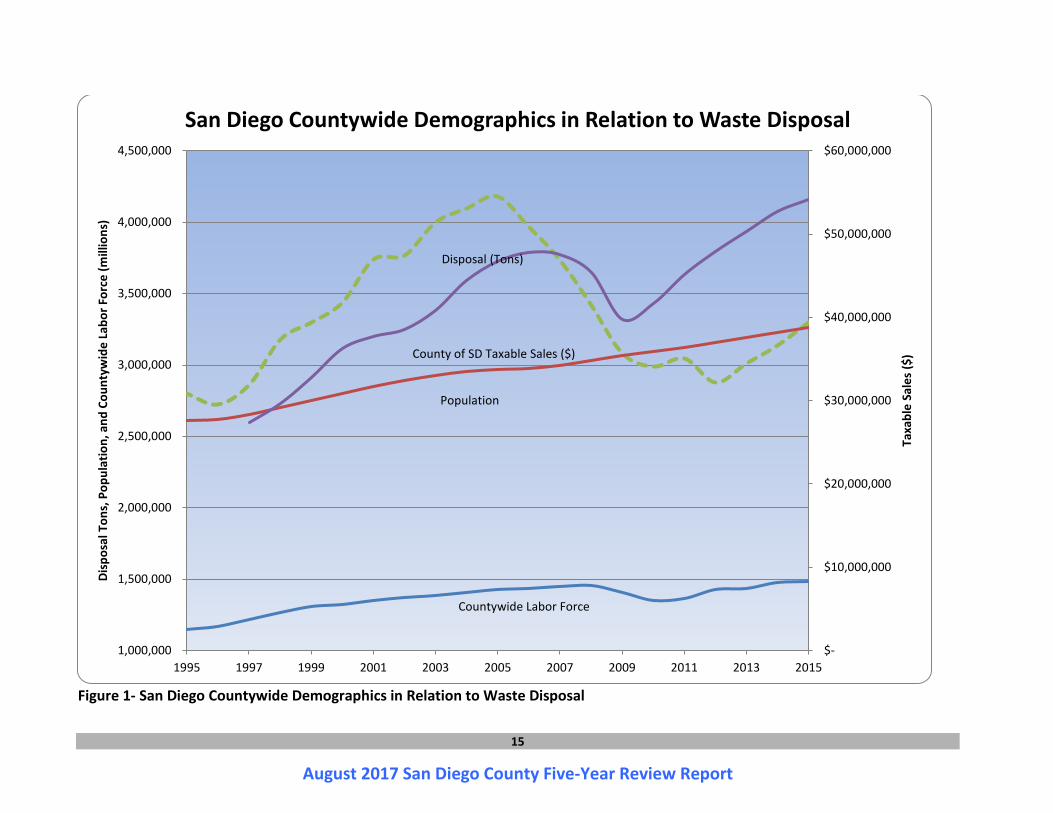
Diego taxable sales also grew from 2010 – 2015 by a total of 30%, from $41,623,636 to $54,185,588, during the five year period (Table 4)4. Past population, employment, and taxable sales trends for San Diego County are shown on a graph in Figure 1: San Diego Countywide Demographics in Relation to Waste Disposal. Disposal trends are also displayed in Figure 1, which demonstrates that while countywide population has grown at a slow and steady pace, employment growth has lagged behind, and disposal and taxable sales fluctuated to a greater extent. Taxable sales have been on an upward trajectory since 2010, but the rate of increase has been slowing since 2011. Meanwhile, disposal decreased and flattened out for a longer period of time than taxable sales, before trending moderately upward in 2013. Though disposal tonnages for 2014 and 2015 were similar to those in 1998 and 1999 (Figure 2), it is not presumed that disposal will return to the peak levels that occurred from 2003 to 2005. The State of California continues to pass legislation in support of additional recycling requirements with an emphasis on increasing organic material diversion and developing the necessary organics processing infrastructure. Recent and future State mandates are anticipated to result in continued reduction in landfill disposal, greater operating costs at landfills, and the need to develop new recycling processing facilities. Key legislation predicted to affect disposal includes the following: (1) AB 939 (1989) – Local jurisdictions were required to reach 50% diversion by 2000 and to maintain or exceed this rate, implement recycling programs, and to report disposal to the State. (2) AB 32 (2006) – The Global Warming Solutions Act, requires that the California Air Resource Board (CARB) develop a scoping plan, identifying strategies to reduce greenhouse gas emissions. CARB’s scoping plan targeted the handling of green waste and other organic materials in an effort to reduce landfill gas emissions. (3) AB 341 (2011) – The State set a statewide (not city-by-city) landfill diversion goal of 75% by 2020 and redefined what constituted diversion for this determination. AB 341 also implemented recycling requirements for businesses, public entities and multi-family complexes and for jurisdictions to implement programs for these sectors. (4) AB 1594 (2014) – Green waste used as alternate daily landfill cover (ADC) will no longer receive recycling credit beginning in 2020. Currently, approximately 300,000 tons of green waste is used as ADC annually. To continue receiving recycling credit, this material will need to be sent to a composting or other organics processing facility. Reductions in disposal tonnage are anticipated. (5) AB 1826 (2014) –Phased-in commercial organics (food scraps and green waste) recycling requirements began in 2016. Existing organic processing facility infrastructure is insufficient to process the additional organic materials targeted by AB 1594 and AB 1826. Through various methods and incentives, the State is supporting the development and expansion of composting and anaerobic digestion facilities to process the additional organic materials. Reductions in disposal tonnage are anticipated.
4 Source: California Board of Equalization, Table page 14.
10
August 2017 San Diego County Five-Year Review Report
(6) SB 1383 (2016) - CalRecycle, in consultation with the California Air Resources Board (ARB), is required to develop regulations to reduce the disposal of organic waste 50 percent below 2014 levels by 2020 and 75 percent by 2025. Additionally, requirements are included to recover 20 percent of edible food for human consumption that is currently landfilled by 2025. These mandates support the Short-Lived Climate Pollutant (SLCP) Reduction Strategy developed by the California Air Resources Board because the decomposition of organic material in a landfill releases methane and other greenhouse gases. Reductions in disposal tonnage are anticipated. The County of San Diego is currently assessing region-wide organics generation and processing capacity to prepare for the above legislation. Jurisdictions in San Diego County have responded to increases in population, employment, and the economy with a variety of different measures, including adding new or improved waste management and recycling programs, instituting mandatory recycling requirements, and providing technical assistance for residents and businesses, all of which help meet AB 939 requirements. The demographic changes since the development of the CIWMP do not warrant a revision to the Countywide Summary Plan or the Countywide Siting Element planning documents. Though population is increasing, rates of increase in sales and employment have been slowing after a post-recession surge. Additionally, State and local regulations and programs are expected to divert increasing amounts of organic and other recyclable materials. Further analysis of generation and disposal of solid waste appear in Section 5.2. _____________________________________________________________________________________________
11
August 2017 San Diego County Five-Year Review Report
Table 1 - Population of San Diego County Jurisdictions, 2000-2015
2000 2010 2015 2000-2010 2010-2015 2000-2015
Jurisdiction Total
Population Total
Population Est. Population Difference % Change Est. Difference Est. %
Change Est.
Difference Est. %
Change Carlsbad 78,247 105,185 110,653 26,938 34% 5,468 5% 32,406 41% Chula Vista 173,556 243,916 257,989 70,360 41% 14,073 6% 84,433 49% Coronado 24,100 24,697 23,497 597 2% -1,200 -5% -603 -3% Del Mar 4,389 4,161 4,238 -228 -5% 77 2% -151 -3% El Cajon 94,869 99,478 101,444 4,609 5% 1,966 2% 6,575 7% Encinitas 58,014 59,518 61,518 1,504 3% 2,000 3% 3,504 6% Escondido 133,721 143,976 147,294 10,255 8% 3,318 2% 13,573 10% Imperial Beach 26,992 26,324 26,761 -668 -2% 437 2% -231 -1% La Mesa 54,749 57,065 58,813 2,316 4% 1,748 3% 4,064 7% Lemon Grove 24,918 25,320 26,199 402 2% 879 3% 1,281 5% National City 54,260 58,582 59,827 4,322 8% 1,245 2% 5,567 10% Oceanside 161,029 167,344 171,682 6,315 4% 4,338 3% 10,653 7% Poway 48,044 47,811 49,041 -233 0% 1,230 3% 997 2% San Diego 1,223,400 1,301,617 1,368,061 78,217 6% 66,444 5% 144,661 12% San Marcos 54,977 83,772 90,827 28,795 52% 7,055 8% 35,850 65% Santee 52,975 53,413 55,805 438 1% 2,392 4% 2,830 5% Solana Beach 12,979 12,867 13,104 -112 -1% 237 2% 125 1% Unincorporated County 442,757 486,550 504,330 43,793 10% 17,780 4% 61,573 14%
Vista 89,857 93,717 96,413 3,860 4% 2,696 3% 6,556 7% Countywide 2,813,833 3,095,313 3,227,496 281,480 10% 132,183 4% 413,663 15% Sources: 2000 and 2010 data: SANDAG compilation of U.S. Census Bureau data. 2015 data: SANDAG, Current Estimates. Note that SANDAG Census data now differs from what was available during preparation of the September 2012 5-Year Review Report.
12
August 2017 San Diego County Five-Year Review Report
Table 2 - San Diego County Labor Force, 1995-2016 Year Labor Force Annual Change
2016 1,497,000 1% 2015 1,482,500 1% 2014 1,473,700 3% 2013 1,437,500 1% 2012 1,424,900 4% 2011 1,367,200 1% 2010 1,352,300 -4% 2009 1,408,300 -3% 2008 1,452,600 0% 2007 1,446,300 1% 2006 1,436,800 1% 2005 1,425,700 1% 2004 1,408,900 2% 2003 1,382,300 1% 2002 1,369,200 1% 2001 1,349,500 2% 2000 1,323,200 1% 1999 1,308,700 3% 1998 1,266,000 4% 1997 1,220,500 4% 1996 1,170,800 2% 1995 1,145,900 N/A
5 Year Increments
2000 2010 2015
% Change 2000-2010
% Change
2010-2015
% Change 2000-2015
Countywide Labor Force 1,323,200 1,352,300 1,482,500 2% 10% 12% Source: Unemployment Rates (Labor Force), Annual, Not Seasonally Adjusted, Not Preliminary: EDD, Accessed May 4, 2016-
http://www.labormarketinfo.edd.ca.gov/county/sdiego.html
13
August 2017 San Diego County Five-Year Review Report
Table 3- San Diego Consumer Price Index, 2007-2016
San Diego Consumer Price Index , 2007 - 2016
Year Annual Average
Percent of Change from Previous Year
2016 274.73 2.0% 2015 269.44 1.6% 2014 265.15 1.9% 2013 260.32 1.3% 2012 256.96 1.6% 2011 252.91 3.0% 2010 245.46 1.3% 2009 242.27 0.0% 2008 242.31 3.9% 2007 233.32 2.3%
Source: Department of Industrial Relations http://www.dir.ca.gov/OPRL/CPI/PresentCCPI.PDF
14
August 2017 San Diego County Five-Year Review Report
Table 4- San Diego County Taxable Sales ($) County of San Diego Taxable Sales ($)
Taxable Sales ($) Annual Growth ($) Annual Change
2015 $ 54,185,588 $ 1,473,949 3% 2014 $ 52,711,639 $ 2,414,307 5% 2013 $ 50,297,331 $ 2,350,296 5% 2012 $ 47,947,035 $ 2,856,653 6% 2011 $ 45,090,382 $ 3,466,746 8% 2010 $ 41,623,636 $ 1,894,980 5% 2009 $ 39,728,657 $ (5,600,480) -12% 2008 $ 45,329,136 $ (2,156,852) -5% 2007 $ 47,485,988 $ (349,526) -1% 2006 $ 47,835,514 $ 1,156,043 2% 2005 $ 46,679,471 $ 2,209,133 5% 2004 $ 44,470,338 $ 3,606,360 9% 2003 $ 40,863,978 $ 2,268,431 6% 2002 $ 38,595,547 $ 896,214 2% 2001 $ 37,699,333 $ 1,453,915 4% 2000 $ 36,245,418 $ 3,493,013 11% 1999 $ 32,752,405 $ 3,136,401 11% 1998 $ 29,616,004 $ 2,207,478 8% 1997 $ 27,408,526
Source: http://www.boe.ca.gov/news/tsalescont.htm
15
August 2017 San Diego County Five-Year Review Report
Figure 1- San Diego Countywide Demographics in Relation to Waste Disposal
$-
$10,000,000
$20,000,000
$30,000,000
$40,000,000
$50,000,000
$60,000,000
1,000,000
1,500,000
2,000,000
2,500,000
3,000,000
3,500,000
4,000,000
4,500,000
1995 1997 1999 2001 2003 2005 2007 2009 2011 2013 2015
Taxa
ble
Sale
s ($
)
Disp
osal
Ton
s, P
opul
atio
n, a
nd C
ount
ywid
e La
bor F
orce
(mill
ions
)
San Diego Countywide Demographics in Relation to Waste Disposal
Disposal (Tons)
County of SD Taxable Sales ($)
Population
Countywide Labor Force
16
August 2017 San Diego County Five-Year Review Report
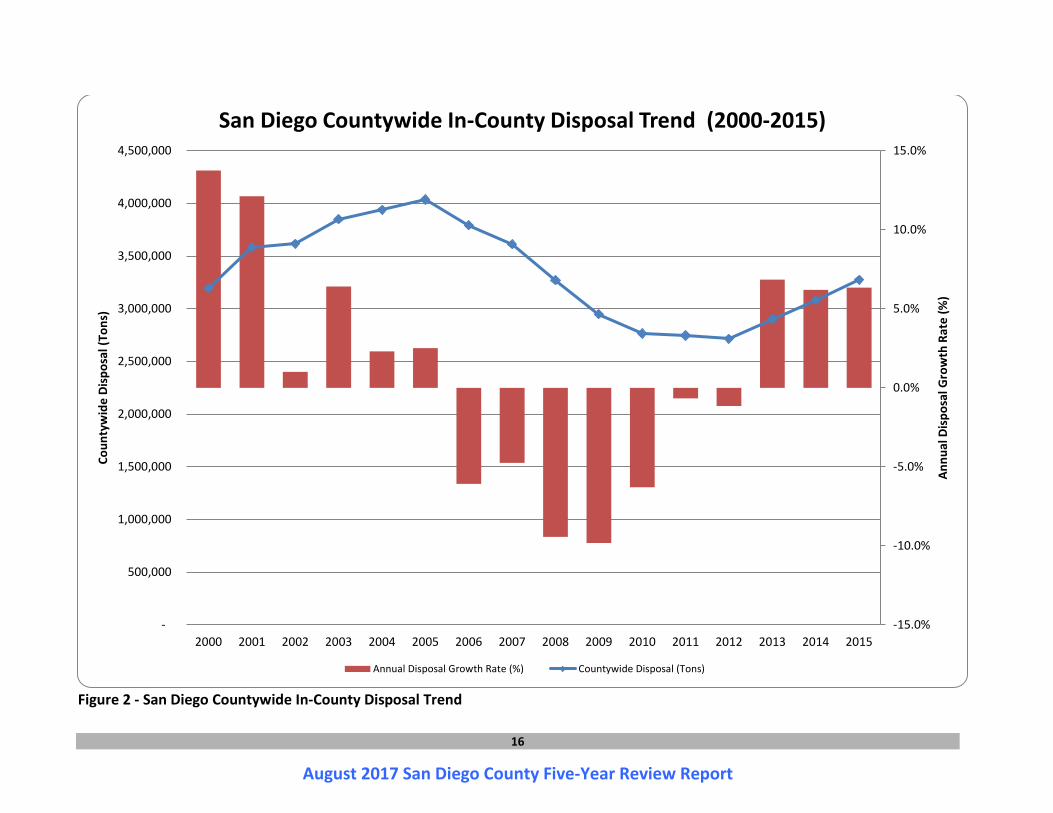
Figure 2 - San Diego Countywide In-County Disposal Trend
-15.0%
-10.0%
-5.0%
0.0%
5.0%
10.0%
15.0%
-
500,000
1,000,000
1,500,000
2,000,000
2,500,000
3,000,000
3,500,000
4,000,000
4,500,000
2000 2001 2002 2003 2004 2005 2006 2007 2008 2009 2010 2011 2012 2013 2014 2015
Annu
al D
ispo
sal G
row
th R
ate
(%)
Coun
tyw
ide
Disp
osal
(Ton
s)
San Diego Countywide In-County Disposal Trend (2000-2015)
Annual Disposal Growth Rate (%) Countywide Disposal (Tons)
17
August 2017 San Diego County Five-Year Review Report
5.2 Changes in Quantities of Waste within the County and Changes in Permitted Disposal Capacity and Waste Disposed in the County
The county or regional agency (if it includes the entire county) continues to have adequate disposal capacity (i.e., equal to or greater than 15 years).
Analysis
The changes in quantities of waste and changes in permitted disposal capacity since the development of the CIWMP do not warrant a revision to any of the countywide planning documents. Specifically, see additional analysis below.
Additional Analysis
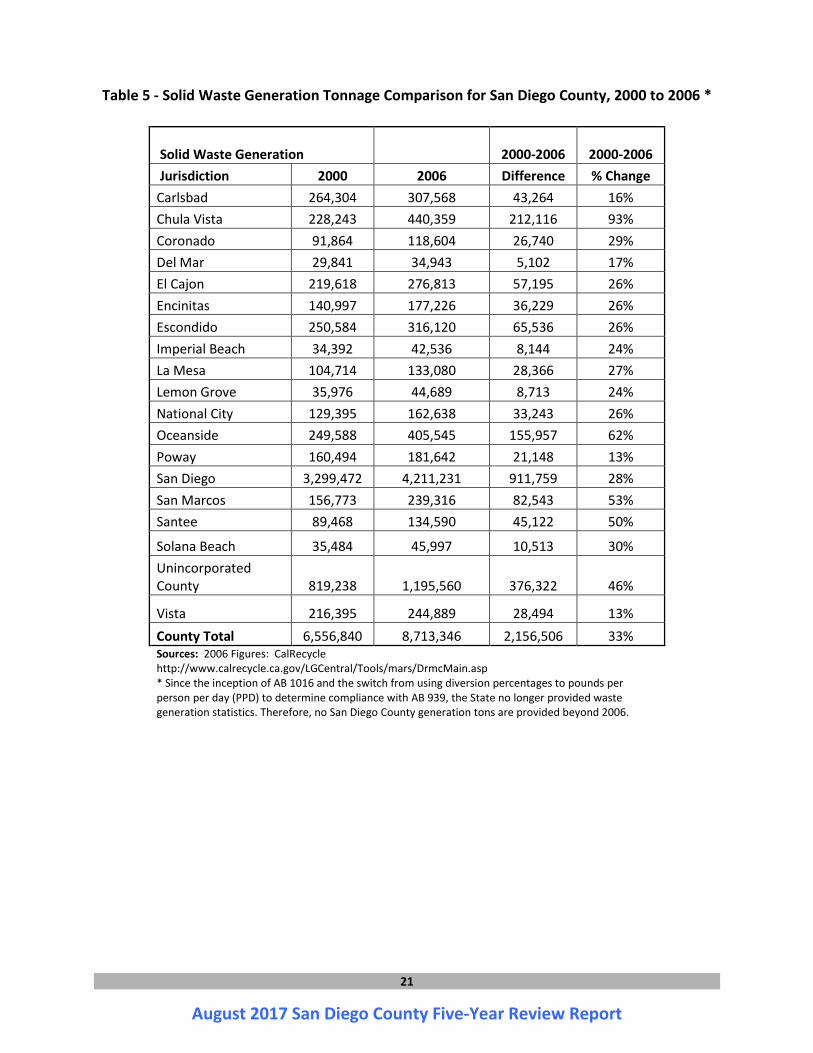
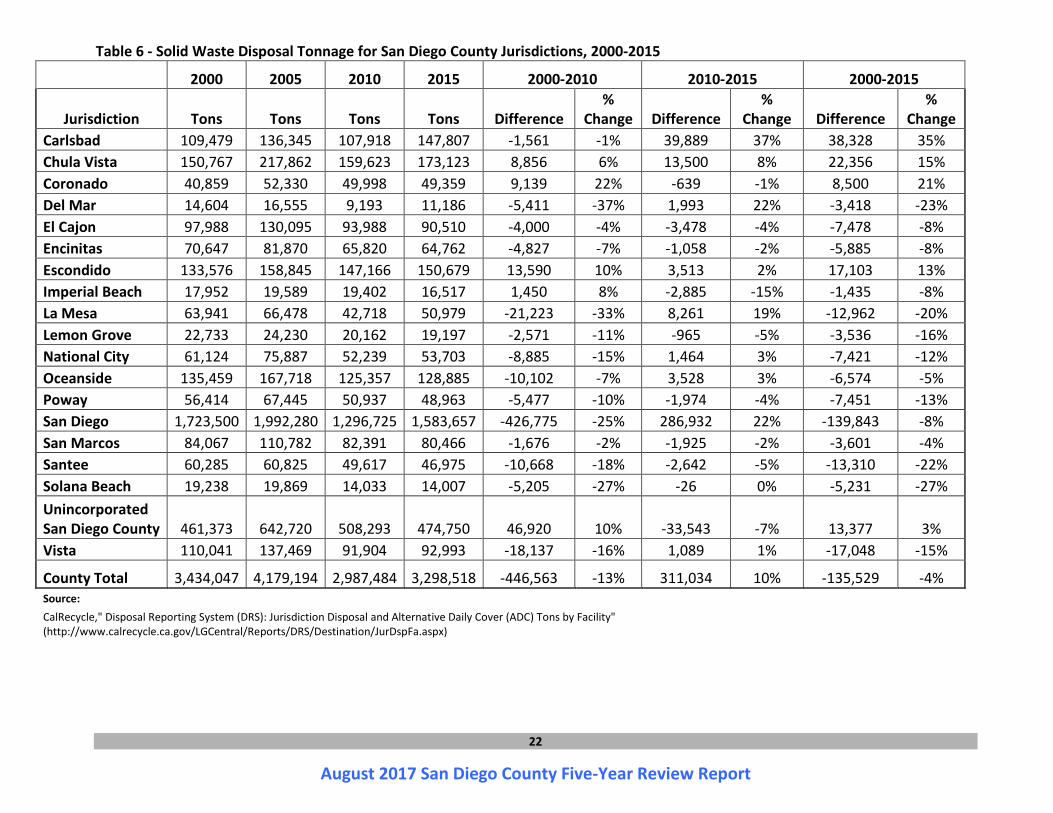
Disposal & Generation Trends Between 2000 and 2006, the quantity of solid waste generated within the County increased by 33% (Table 5)5. All jurisdictions had an increase in solid waste generation. Jurisdictions with the greatest increases over the seven years were Chula Vista, Oceanside, San Marcos, and Santee. Prior to 2007, the State provided jurisdictional waste generation statistics. Since the inception of AB 1016 and the switch from using diversion percentages to pounds per person per day (PPD) to determine compliance with AB 939, the State no longer provided waste generation statistics. Therefore, no San Diego County generation tons are provided beyond 2006. Countywide solid waste disposal decreased by 13% between 2000 and 2010, and rose by 10% between 2010 and 2015 (Table 6)6. Between 2000 and 2015, five jurisdictions had increases in the amount disposed (Carlsbad, Chula Vista, Coronado, Escondido, and the unincorporated County). The remaining fourteen jurisdictions had decreases in disposal, some by as much as 25%. No single factor has been identified for this drop, but the Great Recession between 2007 and 2009 likely caused people and businesses to discard less waste during that period. Another reason for the reduced landfill disposal rate has been increased conservation and recycling activities. Xeriscape landscaping, which reduces production of green waste, is more widely used, compost facilities have expanded, jurisdictions have implemented mandatory recycling ordinances, and there are increased construction and demolition recycling ordinances and facilities. Figure 2 displays the in-county disposal trends from 2000 – 2015 and each year’s annual growth rate by percentage. Countywide disposal was at its highest in 2005 at 4,037,762 tons and at its lowest in 2012 at 2,714,430 tons. While there was approximately a 6% growth rate annually in 2013, 2014, and 2015, disposal numbers are similar to those in 1998 -2000. It is presumed that waste disposal tonnages will not reach 2005 levels again due to increased State and local recycling requirements and programs. Waste Diversion and Pounds Per Person Per Day Disposed (PPD) Trends 5 Source: CalRecycle, Table page 21. 6 Source: CalRecycle, Table page 22.
18
August 2017 San Diego County Five-Year Review Report
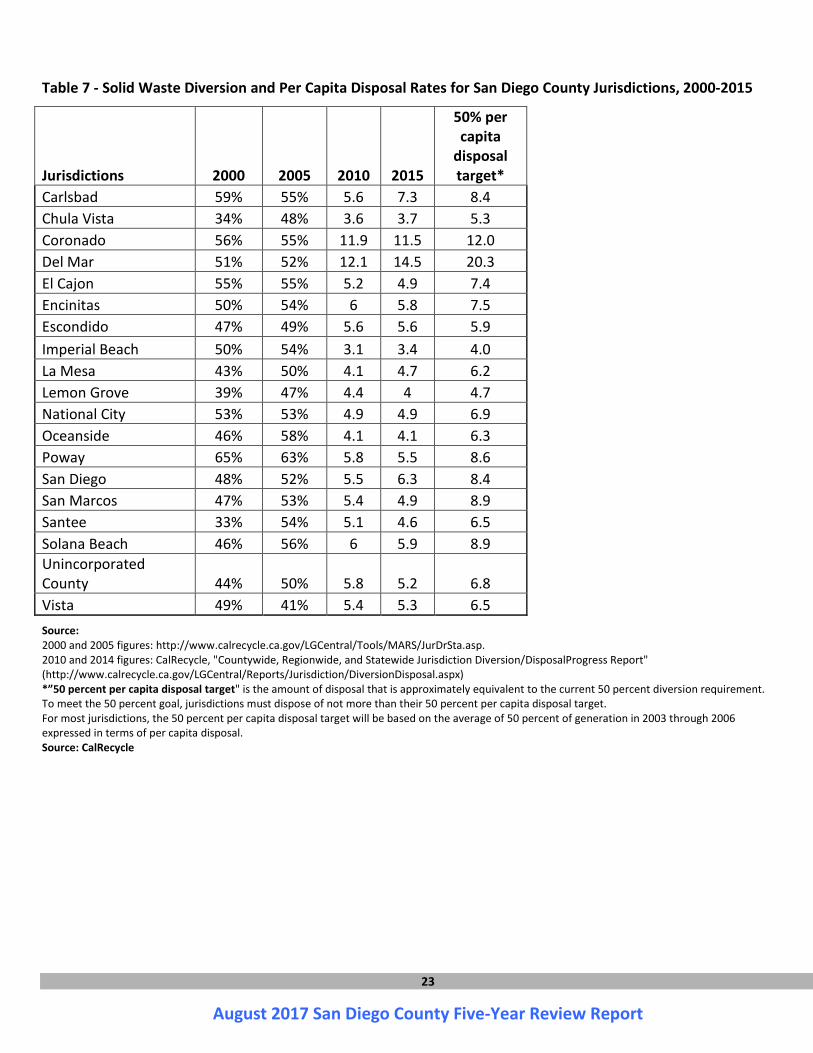
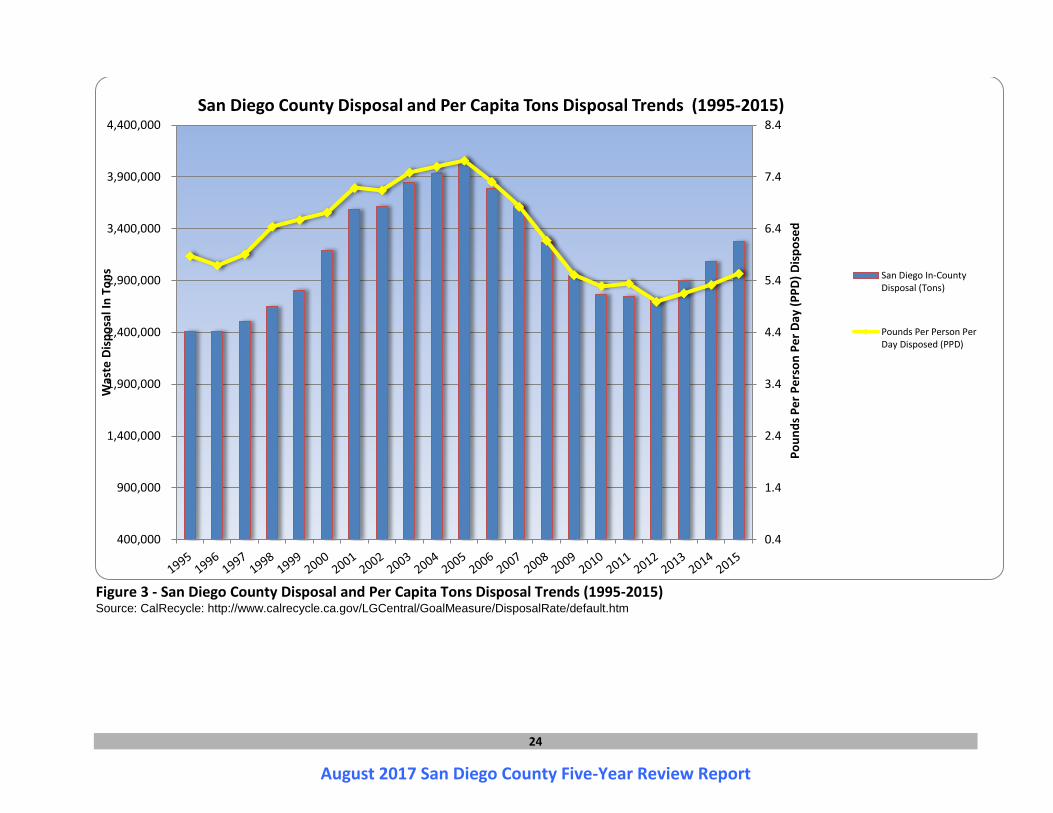
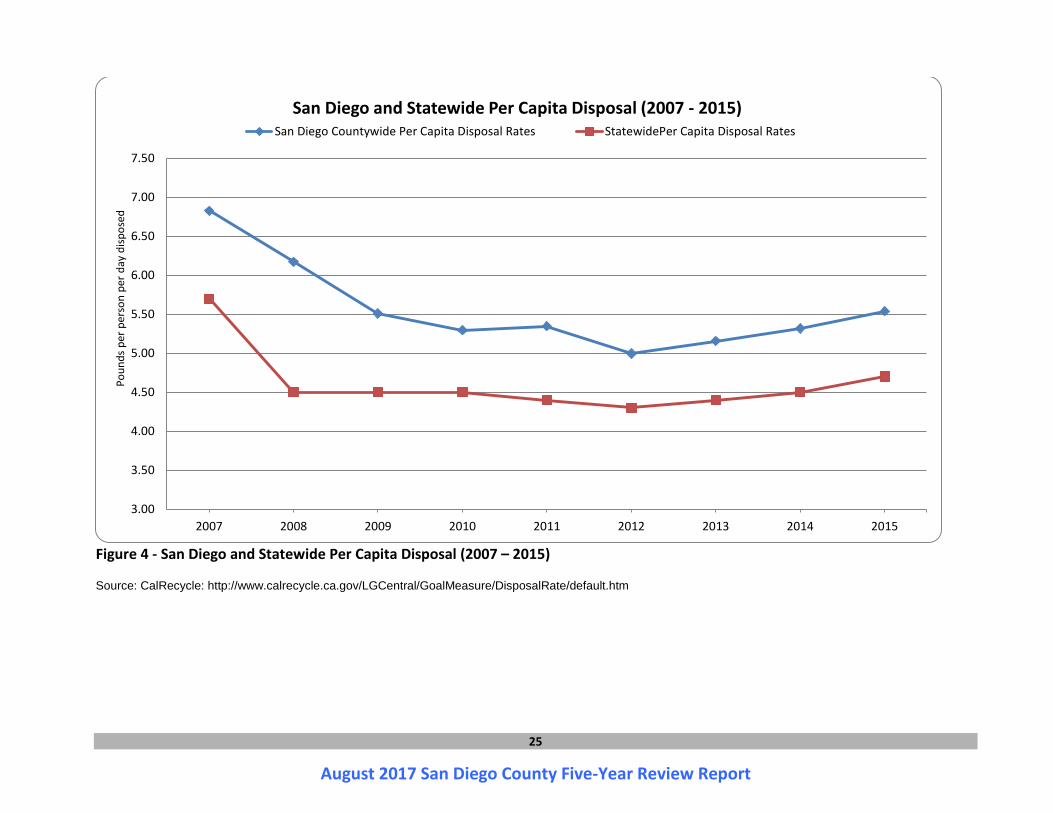
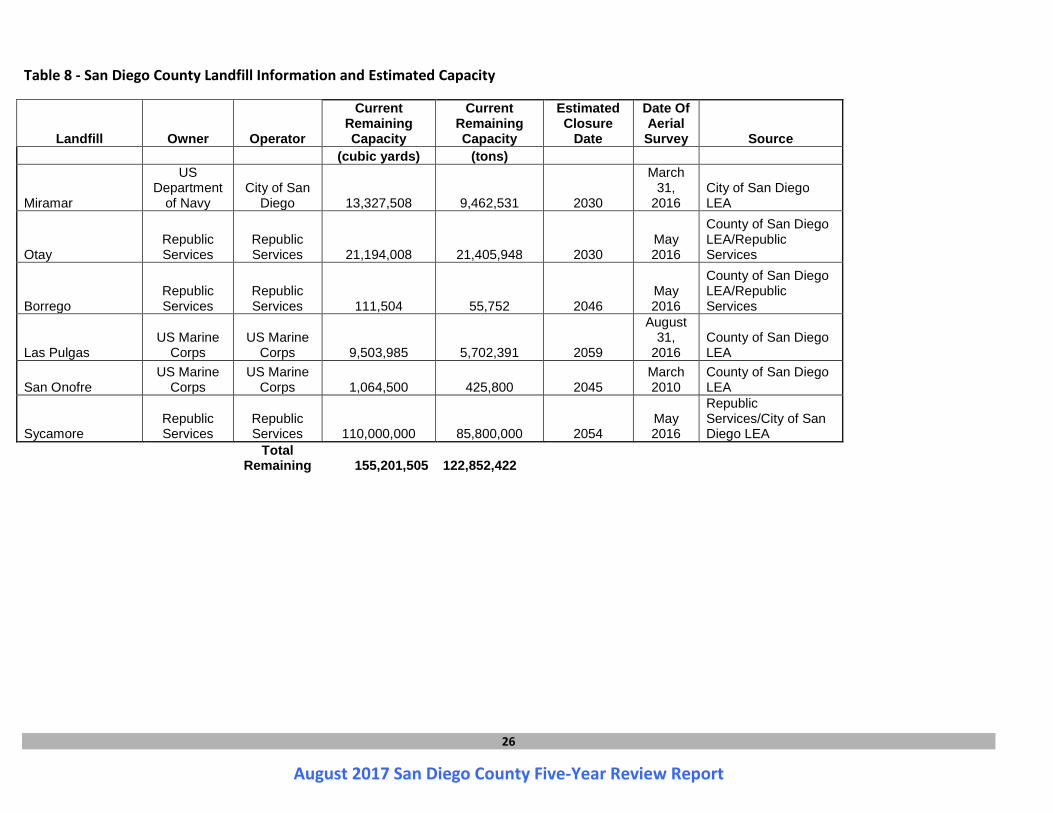
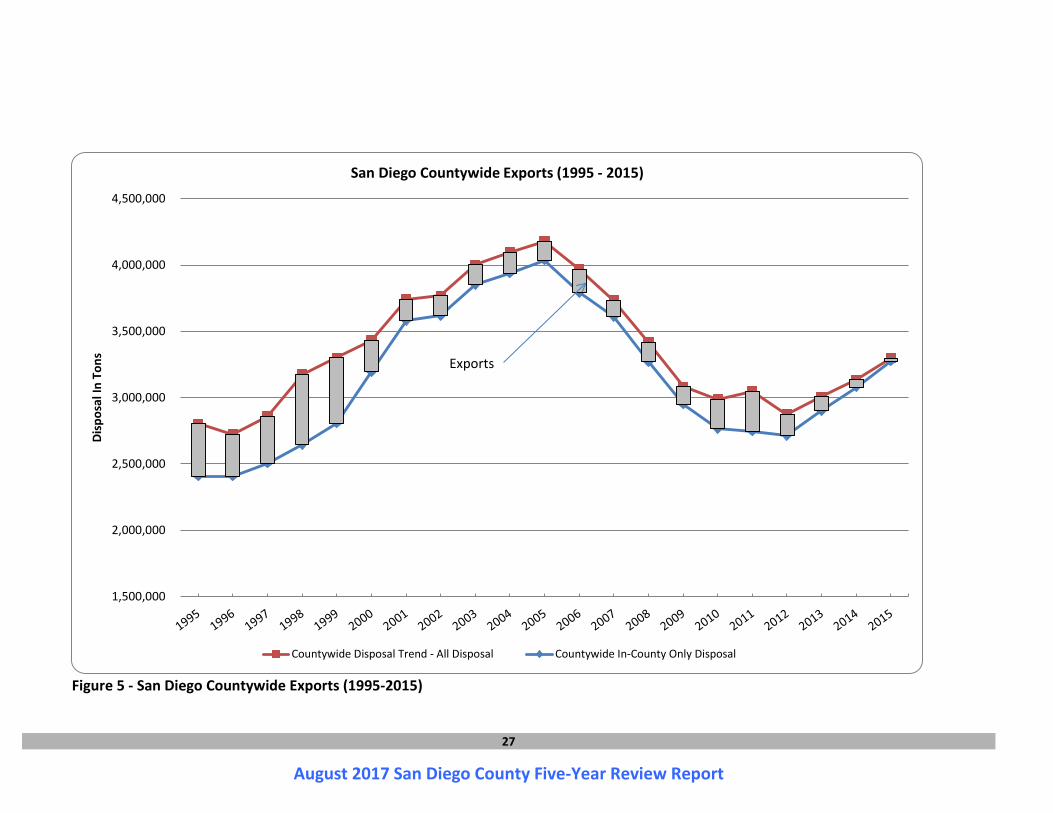
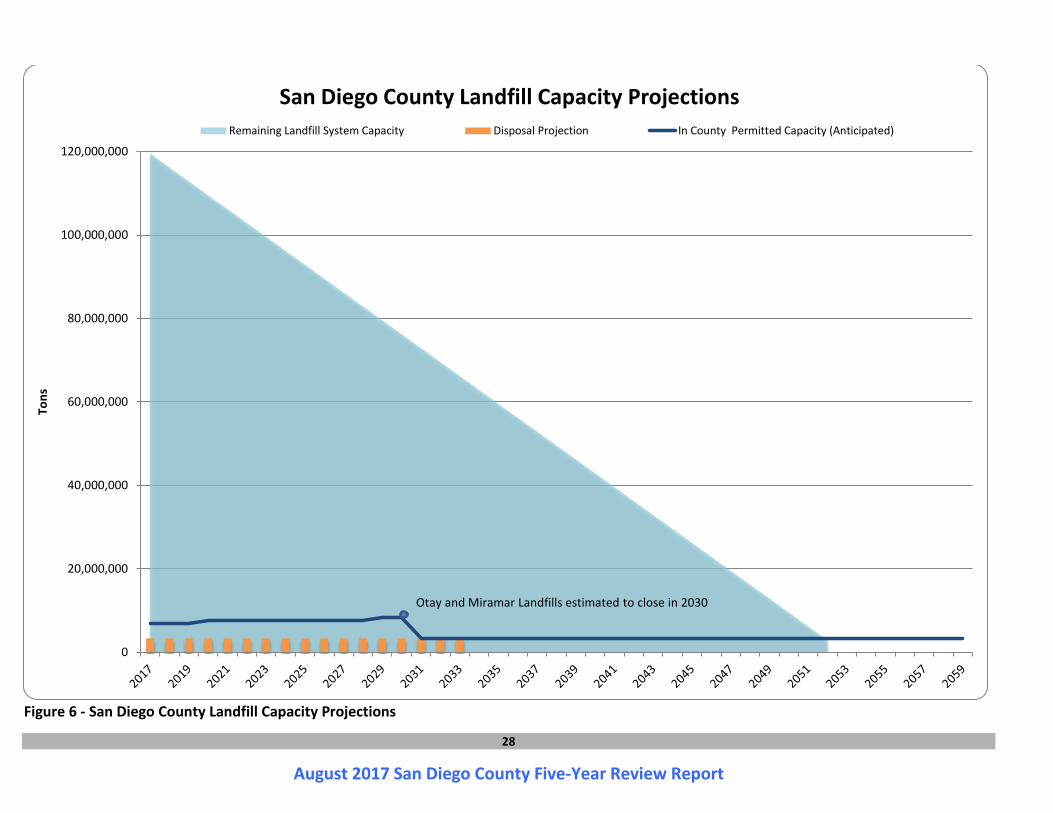
Table 77 summarizes each jurisdiction’s progress in implementing the Source Reduction and Recycling Element (SRRE) and compliance with the 50% diversion rate requirement. In 2007, AB 1016 changed the diversion reporting from a percentage calculation to a target of daily pounds per capita disposal based on each jurisdiction’s average waste generation from 2003 through 2006. In Table 7 the data are displayed in 5 year increments displaying years 2000, 2005, 2010, and 2015. The years 2000 and 2005 are displayed as diversion percentages, and 2010 and 2015 are displayed as the per capita disposal rate. The population target was used, rather than the employment target for this analysis. In 2000, 11 of the 19 jurisdictions were below the 50% diversion target. By 2005, only four jurisdictions were below the 50% diversion target. By 2010, all 19 jurisdictions reached and exceeded their individual pounds per person per day disposed (PPD) targets. Though some jurisdictions experienced higher disposal rates in 2015, all jurisdictions continued to reach or exceed their individual targets. Figure 38 shows the countywide disposal and per capita disposal from 1995 through 2015. As disposal decreased significantly from 2006 through 2010, so did countywide per capita disposal rates. As disposal slowly rose in 2013 through 2015, per capita disposal rates rose as well, though, still remain lower overall than pre-2000 per capita rates. Although San Diego per capita rates are, on average, higher than the statewide disposal averages (Figure 4), San Diego and statewide trends are parallel in the rates of increases and decreases annually from 2007 through 2015. Landfill Capacity and Disposal Projections (Figure 6 and 7) The purpose of the Five-Year Review Report is to plan for 15 years of countywide landfill disposal capacity and to determine the feasibility of the region’s planning documents. Figure 6 displays the overall disposal projections and landfill capacity for San Diego County from 2017 through 2059. Using estimated remaining capacities provided by landfill operators, the current physical space available in the region’s landfills is the equivalent of nearly 120,000,000 tons with the last landfill closure date projected in 2059 (See Table 8)9. Figure 7 displays anticipated daily permitted capacities and disposal projections in even greater detail than Figure 6. While permitted capacity is available through 2059, waste disposal is only projected through the state-mandated 15 year period of 2032. Landfill capacity and disposal projections are explained in more detail below. In the 2005 Siting Element revision and the 2011 and 2012 Five-Year Review Reports, the County of San Diego used regression analyses of past disposal data to project future disposal. To conform to more commonly used disposal projection methods in California, an average of the past 15 years’ in-county disposal data (2000-2015) is used to project disposal for the next 15 years (2017-2032). Though in-county disposal may both increase and decrease over the next 15 years, a conservative projection is that disposal will remain near the average. The 15 year disposal average is 3,333,042 in-county tons annually. Exported waste, making up 7 Source: CalRecycle, Table page 23. 8 Source: CalRecycle, Figure page 24. 9 Source: City of San Diego LEA, County of San Diego LEA, and Republic Services, Table page 26.
19
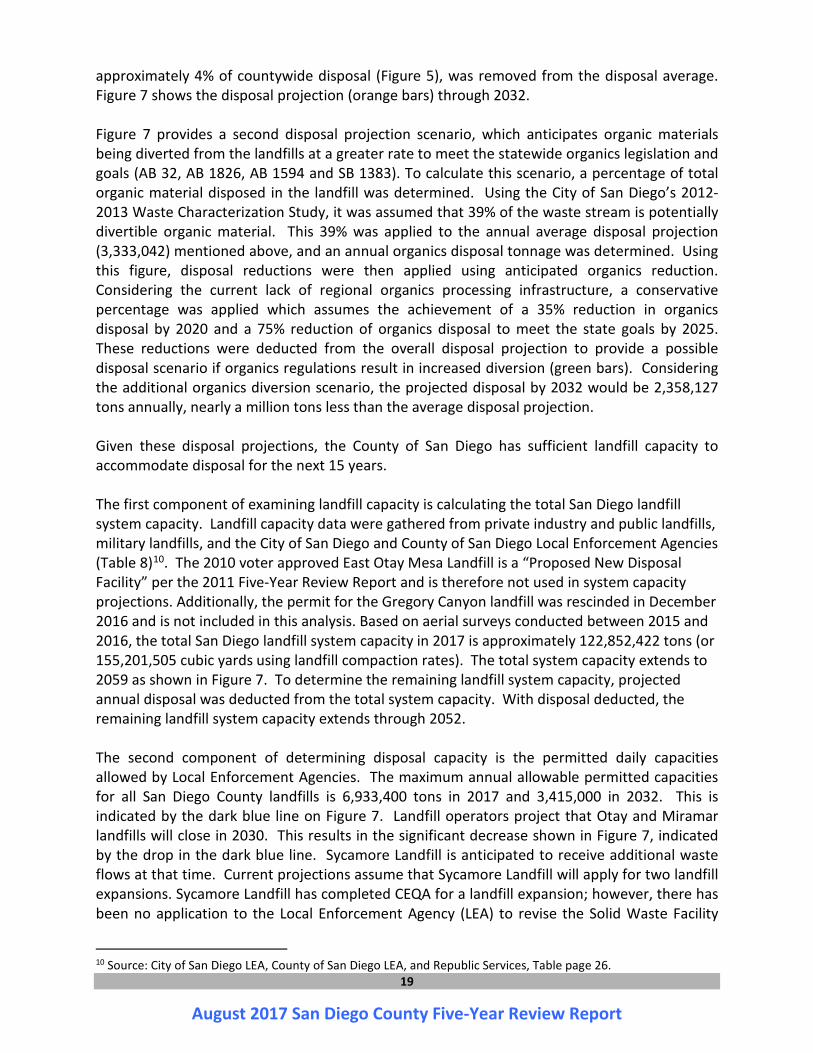
August 2017 San Diego County Five-Year Review Report
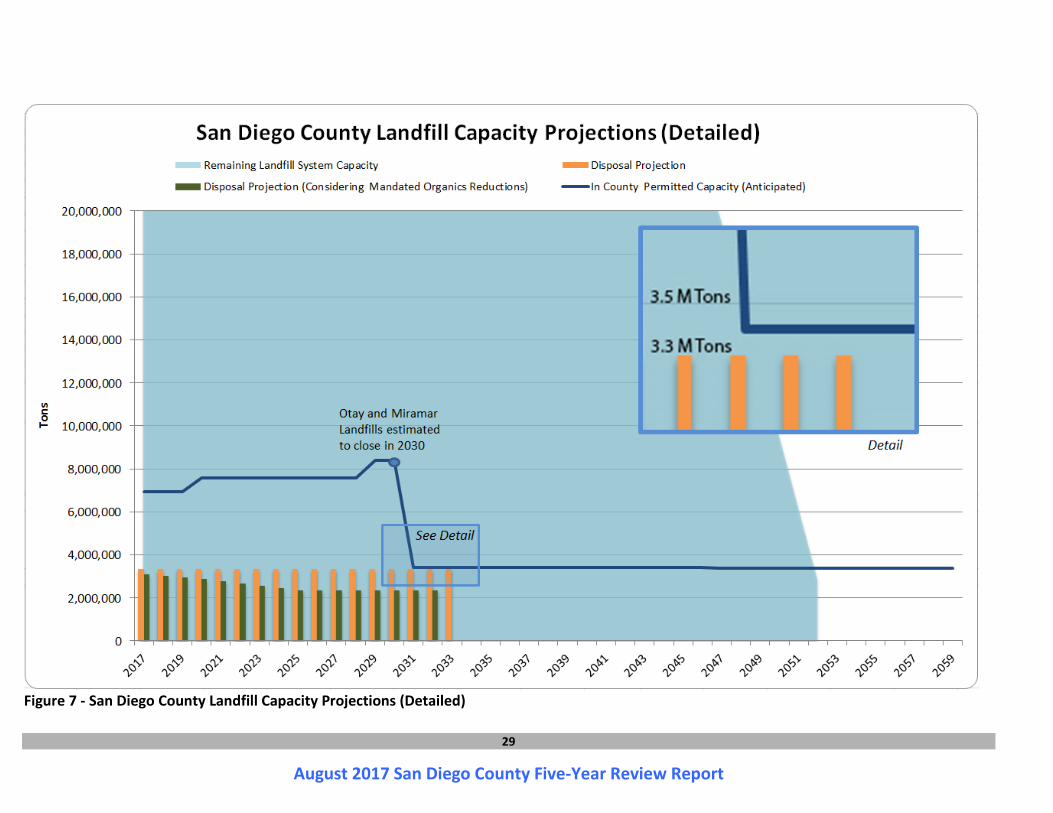
approximately 4% of countywide disposal (Figure 5), was removed from the disposal average. Figure 7 shows the disposal projection (orange bars) through 2032. Figure 7 provides a second disposal projection scenario, which anticipates organic materials being diverted from the landfills at a greater rate to meet the statewide organics legislation and goals (AB 32, AB 1826, AB 1594 and SB 1383). To calculate this scenario, a percentage of total organic material disposed in the landfill was determined. Using the City of San Diego’s 2012-2013 Waste Characterization Study, it was assumed that 39% of the waste stream is potentially divertible organic material. This 39% was applied to the annual average disposal projection (3,333,042) mentioned above, and an annual organics disposal tonnage was determined. Using this figure, disposal reductions were then applied using anticipated organics reduction. Considering the current lack of regional organics processing infrastructure, a conservative percentage was applied which assumes the achievement of a 35% reduction in organics disposal by 2020 and a 75% reduction of organics disposal to meet the state goals by 2025. These reductions were deducted from the overall disposal projection to provide a possible disposal scenario if organics regulations result in increased diversion (green bars). Considering the additional organics diversion scenario, the projected disposal by 2032 would be 2,358,127 tons annually, nearly a million tons less than the average disposal projection. Given these disposal projections, the County of San Diego has sufficient landfill capacity to accommodate disposal for the next 15 years. The first component of examining landfill capacity is calculating the total San Diego landfill system capacity. Landfill capacity data were gathered from private industry and public landfills, military landfills, and the City of San Diego and County of San Diego Local Enforcement Agencies (Table 8)10. The 2010 voter approved East Otay Mesa Landfill is a “Proposed New Disposal Facility” per the 2011 Five-Year Review Report and is therefore not used in system capacity projections. Additionally, the permit for the Gregory Canyon landfill was rescinded in December 2016 and is not included in this analysis. Based on aerial surveys conducted between 2015 and 2016, the total San Diego landfill system capacity in 2017 is approximately 122,852,422 tons (or 155,201,505 cubic yards using landfill compaction rates). The total system capacity extends to 2059 as shown in Figure 7. To determine the remaining landfill system capacity, projected annual disposal was deducted from the total system capacity. With disposal deducted, the remaining landfill system capacity extends through 2052. The second component of determining disposal capacity is the permitted daily capacities allowed by Local Enforcement Agencies. The maximum annual allowable permitted capacities for all San Diego County landfills is 6,933,400 tons in 2017 and 3,415,000 in 2032. This is indicated by the dark blue line on Figure 7. Landfill operators project that Otay and Miramar landfills will close in 2030. This results in the significant decrease shown in Figure 7, indicated by the drop in the dark blue line. Sycamore Landfill is anticipated to receive additional waste flows at that time. Current projections assume that Sycamore Landfill will apply for two landfill expansions. Sycamore Landfill has completed CEQA for a landfill expansion; however, there has been no application to the Local Enforcement Agency (LEA) to revise the Solid Waste Facility
10 Source: City of San Diego LEA, County of San Diego LEA, and Republic Services, Table page 26.
20
August 2017 San Diego County Five-Year Review Report
Permit. Presently, landfills are not maximizing their permitted daily waste capacity. For the purposes of projection, the first expansion at Sycamore Landfill is estimated to occur in 2020 and to increase permitted capacity to 6,700 tons per day. The second expansion is estimated to occur in 2029 and to increase permitted capacity to 9,000 tons per day.
Figure 7 illustrates that the County of San Diego has enough daily permitted disposal capacity for the next 15 years (2017 to 2032), thereby meeting the State requirement that the County maintain 15 years of disposal capacity. If the orange bars would meet the dark blue line in Figure 7, disposal would meet permitted capacity, and theoretically the region would be lacking sufficient local landfill capacity. These lines do not cross (see dotted insert in Figure 7). Additionally, it is important to note that recent State legislation and policy goals have the potential to decrease future landfill disposal volumes. The dark green bars in Figure 7 take these goals into consideration. With efforts to meet these aggressive goals and continued improvements in recycling, there is a significant potential for increased diversion, which would extend landfill capacity over an even longer term.
Given the above analysis, San Diego County continues to have more than 15 years of disposal capacity. Revision to the Countywide Siting Element of the CIWMP is not warranted at this time. _____________________________________________________________________________________________
21
August 2017 San Diego County Five-Year Review Report
Table 5 - Solid Waste Generation Tonnage Comparison for San Diego County, 2000 to 2006 *
Solid Waste Generation 2000-2006 2000-2006 Jurisdiction 2000 2006 Difference % Change Carlsbad 264,304 307,568 43,264 16% Chula Vista 228,243 440,359 212,116 93% Coronado 91,864 118,604 26,740 29% Del Mar 29,841 34,943 5,102 17% El Cajon 219,618 276,813 57,195 26% Encinitas 140,997 177,226 36,229 26% Escondido 250,584 316,120 65,536 26% Imperial Beach 34,392 42,536 8,144 24% La Mesa 104,714 133,080 28,366 27% Lemon Grove 35,976 44,689 8,713 24% National City 129,395 162,638 33,243 26% Oceanside 249,588 405,545 155,957 62% Poway 160,494 181,642 21,148 13% San Diego 3,299,472 4,211,231 911,759 28% San Marcos 156,773 239,316 82,543 53% Santee 89,468 134,590 45,122 50%
Solana Beach 35,484 45,997 10,513 30% Unincorporated County 819,238 1,195,560 376,322 46%
Vista 216,395 244,889 28,494 13% County Total 6,556,840 8,713,346 2,156,506 33% Sources: 2006 Figures: CalRecycle http://www.calrecycle.ca.gov/LGCentral/Tools/mars/DrmcMain.asp * Since the inception of AB 1016 and the switch from using diversion percentages to pounds per person per day (PPD) to determine compliance with AB 939, the State no longer provided waste generation statistics. Therefore, no San Diego County generation tons are provided beyond 2006.
22
August 2017 San Diego County Five-Year Review Report
Table 6 - Solid Waste Disposal Tonnage for San Diego County Jurisdictions, 2000-2015
2000 2005 2010 2015 2000-2010 2010-2015 2000-2015
Jurisdiction Tons Tons Tons Tons Difference %
Change Difference %
Change Difference %
Change Carlsbad 109,479 136,345 107,918 147,807 -1,561 -1% 39,889 37% 38,328 35% Chula Vista 150,767 217,862 159,623 173,123 8,856 6% 13,500 8% 22,356 15% Coronado 40,859 52,330 49,998 49,359 9,139 22% -639 -1% 8,500 21% Del Mar 14,604 16,555 9,193 11,186 -5,411 -37% 1,993 22% -3,418 -23% El Cajon 97,988 130,095 93,988 90,510 -4,000 -4% -3,478 -4% -7,478 -8% Encinitas 70,647 81,870 65,820 64,762 -4,827 -7% -1,058 -2% -5,885 -8% Escondido 133,576 158,845 147,166 150,679 13,590 10% 3,513 2% 17,103 13% Imperial Beach 17,952 19,589 19,402 16,517 1,450 8% -2,885 -15% -1,435 -8% La Mesa 63,941 66,478 42,718 50,979 -21,223 -33% 8,261 19% -12,962 -20% Lemon Grove 22,733 24,230 20,162 19,197 -2,571 -11% -965 -5% -3,536 -16% National City 61,124 75,887 52,239 53,703 -8,885 -15% 1,464 3% -7,421 -12% Oceanside 135,459 167,718 125,357 128,885 -10,102 -7% 3,528 3% -6,574 -5% Poway 56,414 67,445 50,937 48,963 -5,477 -10% -1,974 -4% -7,451 -13% San Diego 1,723,500 1,992,280 1,296,725 1,583,657 -426,775 -25% 286,932 22% -139,843 -8% San Marcos 84,067 110,782 82,391 80,466 -1,676 -2% -1,925 -2% -3,601 -4% Santee 60,285 60,825 49,617 46,975 -10,668 -18% -2,642 -5% -13,310 -22% Solana Beach 19,238 19,869 14,033 14,007 -5,205 -27% -26 0% -5,231 -27% Unincorporated San Diego County 461,373 642,720 508,293 474,750 46,920 10% -33,543 -7% 13,377 3% Vista 110,041 137,469 91,904 92,993 -18,137 -16% 1,089 1% -17,048 -15%
County Total 3,434,047 4,179,194 2,987,484 3,298,518 -446,563 -13% 311,034 10% -135,529 -4% Source:
CalRecycle," Disposal Reporting System (DRS): Jurisdiction Disposal and Alternative Daily Cover (ADC) Tons by Facility" (http://www.calrecycle.ca.gov/LGCentral/Reports/DRS/Destination/JurDspFa.aspx)
23
August 2017 San Diego County Five-Year Review Report
Table 7 - Solid Waste Diversion and Per Capita Disposal Rates for San Diego County Jurisdictions, 2000-2015
Source: 2000 and 2005 figures: http://www.calrecycle.ca.gov/LGCentral/Tools/MARS/JurDrSta.asp. 2010 and 2014 figures: CalRecycle, "Countywide, Regionwide, and Statewide Jurisdiction Diversion/DisposalProgress Report" (http://www.calrecycle.ca.gov/LGCentral/Reports/Jurisdiction/DiversionDisposal.aspx) *”50 percent per capita disposal target" is the amount of disposal that is approximately equivalent to the current 50 percent diversion requirement. To meet the 50 percent goal, jurisdictions must dispose of not more than their 50 percent per capita disposal target. For most jurisdictions, the 50 percent per capita disposal target will be based on the average of 50 percent of generation in 2003 through 2006 expressed in terms of per capita disposal. Source: CalRecycle
Jurisdictions 2000 2005 2010 2015
50% per capita
disposal target*
Carlsbad 59% 55% 5.6 7.3 8.4 Chula Vista 34% 48% 3.6 3.7 5.3 Coronado 56% 55% 11.9 11.5 12.0 Del Mar 51% 52% 12.1 14.5 20.3 El Cajon 55% 55% 5.2 4.9 7.4 Encinitas 50% 54% 6 5.8 7.5 Escondido 47% 49% 5.6 5.6 5.9 Imperial Beach 50% 54% 3.1 3.4 4.0 La Mesa 43% 50% 4.1 4.7 6.2 Lemon Grove 39% 47% 4.4 4 4.7 National City 53% 53% 4.9 4.9 6.9 Oceanside 46% 58% 4.1 4.1 6.3 Poway 65% 63% 5.8 5.5 8.6 San Diego 48% 52% 5.5 6.3 8.4 San Marcos 47% 53% 5.4 4.9 8.9 Santee 33% 54% 5.1 4.6 6.5 Solana Beach 46% 56% 6 5.9 8.9 Unincorporated County 44% 50% 5.8 5.2 6.8 Vista 49% 41% 5.4 5.3 6.5
24
August 2017 San Diego County Five-Year Review Report
Figure 3 - San Diego County Disposal and Per Capita Tons Disposal Trends (1995-2015) Source: CalRecycle: http://www.calrecycle.ca.gov/LGCentral/GoalMeasure/DisposalRate/default.htm
0.4
1.4
2.4
3.4
4.4
5.4
6.4
7.4
8.4
400,000
900,000
1,400,000
1,900,000
2,400,000
2,900,000
3,400,000
3,900,000
4,400,000
Poun
ds P
er P
erso
n Pe
r Day
(PPD
) Dis
pose
d
Was
te D
ispo
sal I
n To
nsSan Diego County Disposal and Per Capita Tons Disposal Trends (1995-2015)
San Diego In-CountyDisposal (Tons)
Pounds Per Person PerDay Disposed (PPD)
25
August 2017 San Diego County Five-Year Review Report
Figure 4 - San Diego and Statewide Per Capita Disposal (2007 – 2015) Source: CalRecycle: http://www.calrecycle.ca.gov/LGCentral/GoalMeasure/DisposalRate/default.htm
3.00
3.50
4.00
4.50
5.00
5.50
6.00
6.50
7.00
7.50
2007 2008 2009 2010 2011 2012 2013 2014 2015
Poun
ds p
er p
erso
n pe
r day
disp
osed
San Diego and Statewide Per Capita Disposal (2007 - 2015) San Diego Countywide Per Capita Disposal Rates StatewidePer Capita Disposal Rates
26
August 2017 San Diego County Five-Year Review Report
Table 8 - San Diego County Landfill Information and Estimated Capacity
Landfill Owner Operator
Current Remaining Capacity
Current Remaining Capacity
Estimated Closure
Date
Date Of Aerial Survey Source
(cubic yards) (tons)
Miramar
US Department
of Navy City of San
Diego 13,327,508 9,462,531 2030
March 31,
2016 City of San Diego LEA
Otay Republic Services
Republic Services 21,194,008 21,405,948 2030
May 2016
County of San Diego LEA/Republic Services
Borrego Republic Services
Republic Services 111,504 55,752 2046
May 2016
County of San Diego LEA/Republic Services
Las Pulgas US Marine
Corps US Marine
Corps 9,503,985 5,702,391 2059
August 31,
2016 County of San Diego LEA
San Onofre US Marine
Corps US Marine
Corps 1,064,500 425,800 2045 March 2010
County of San Diego LEA
Sycamore Republic Services
Republic Services 110,000,000 85,800,000 2054
May 2016
Republic Services/City of San Diego LEA
Total Remaining 155,201,505
122,852,422
27
August 2017 San Diego County Five-Year Review Report
Figure 5 - San Diego Countywide Exports (1995-2015)
1,500,000
2,000,000
2,500,000
3,000,000
3,500,000
4,000,000
4,500,000
Disp
osal
In T
ons
San Diego Countywide Exports (1995 - 2015)
Countywide Disposal Trend - All Disposal Countywide In-County Only Disposal
Exports
28
August 2017 San Diego County Five-Year Review Report
Figure 6 - San Diego County Landfill Capacity Projections
0
20,000,000
40,000,000
60,000,000
80,000,000
100,000,000
120,000,000
Tons
San Diego County Landfill Capacity Projections Remaining Landfill System Capacity Disposal Projection In County Permitted Capacity (Anticipated)
Otay and Miramar Landfills estimated to close in 2030
29
August 2017 San Diego County Five-Year Review Report
Figure 7 - San Diego County Landfill Capacity Projections (Detailed)
30
5.3 Changes in Funding Source for Administration of the Siting Element (SE) and Summary Plan (SP)
Since the approval of the last Five-Year CIWMP Review Report in June 2012, the county experienced the following significant changes in funding for the SE or SP:
Analysis There have been no significant changes in funding for administration of the SE and SP or the changes that have occurred do not warrant a revision to any of the countywide planning documents.
5.4 Changes in Administrative Responsibilities
The county experienced significant changes in the following administrative responsibilities since the approval of the last Five-Year CIWMP Review Report in June 2012 1. Analysis
There have been no significant changes in administrative responsibilities or the changes in administrative responsibilities do not warrant a revision to any of the planning documents.
5.5 Programs that were Scheduled to be Implemented but were not
This section addresses programs that were scheduled to be implemented but were not, a statement as to why they were not implemented, the progress of programs that were implemented, a statement as to whether programs are meeting their goals, and if not what contingency measures are being enacted to ensure compliance with Public Resources Code section 41751. Progress of program implementation:
• Source Reduction and Recycling Element (SRRE) and Household Hazardous Waste Element (HHWE) - All program implementation information has been updated in the CalRecycle Electronic Annual Reports (EAR).
• Non-Disposal Facility Element (NDFE) - All jurisdictions are in compliance. The NDFE for the unincorporated areas of the County of San Diego was last updated in September 2013, and will be updated as facilities are permitted.
• Countywide Siting Element (SE) - There have not been any significant changes since the 2013 CIWMP update.
• Summary Plan – There have been no significant information changes that would warrant amendment of the countywide Summary Plan.
Statement regarding whether Programs are Meeting their Goals
The programs are meeting their goals.
31
5.6 Changes in Available Markets for Recyclable Materials
In February 2017, a survey of San Diego recycling markets was distributed to local recycling companies. Overall, recycling markets for the region have improved and market status does not warrant a revision of the planning documents. Responses of the recyclers’ survey were as follows:
• The most limiting factor to recycling markets is the long term demand and quality concerns.
• Overseas markets continue to be fairly stable. Some companies reported challenges as China is increasing its standards to ensure that material received is high quality with little contamination.
• Local recycling companies responded that markets were “Average” when asked to rate the recycling markets as either “Excellent,” “Good,” “Average,” “Fair,” or “Poor.”
5.7 Changes in the Implementation Schedule
No change to the implementation schedule is warranted at this time.
32
6 ANNUAL REPORT REVIEW
Annual Reports for each jurisdiction in the county have been reviewed, specifically those sections that address the adequacy of the CIWMP or RAIWMP elements. No jurisdictions reported the need to revise one or more of these planning documents. See APPENDIX A for letters from jurisdictions confirming this statement.

33
7 APPENDICES A AND B.
Appendix A:
Letters from San Diego County jurisdictions confirming annual report accuracy and updated status.
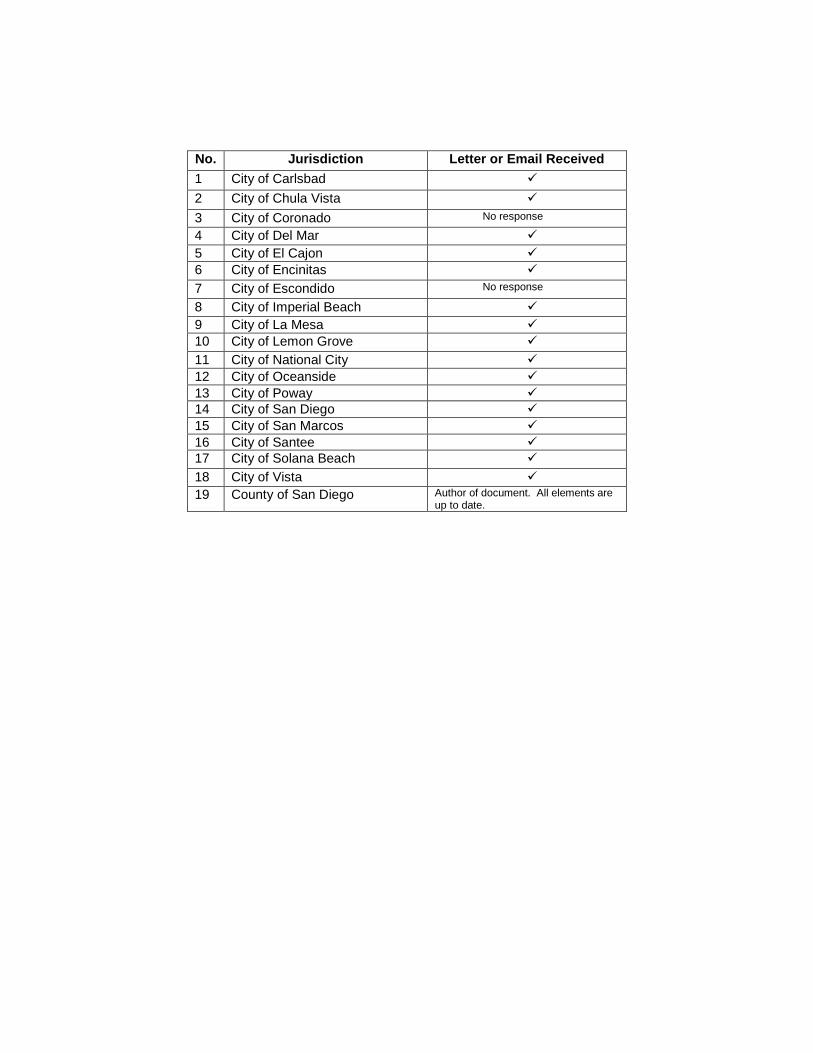
No. Jurisdiction Letter or Email Received 1 City of Carlsbad 2 City of Chula Vista 3 City of Coronado No response
4 City of Del Mar 5 City of El Cajon 6 City of Encinitas 7 City of Escondido No response
8 City of Imperial Beach 9 City of La Mesa 10 City of Lemon Grove 11 City of National City 12 City of Oceanside 13 City of Poway 14 City of San Diego 15 City of San Marcos 16 City of Santee 17 City of Solana Beach 18 City of Vista 19 County of San Diego Author of document. All elements are
up to date.
CITY OF
CHULAVISTAECONOMIC DEVELOPMENT DEPARTMENT
January 25, 2017
Stephanie EwaltRecycling Specialist IICounty of San DiegoSolid Waste Planning and Recycling5510 Overland Ave, Suite 210San Diego, CA 92123(MS 0350)
RE: Certification of Completeness of Integrated Waste Management Plan Documents
Dear Ms. Ewalt:
The City of Chula Vista has reviewed its integrated waste management plan, which includes theSource Reduction and Recycling Element (SRRE), Household Hazardous Waste Element (HHWE),and Non-Disposal Facility Element (NDFE). All Components are adequate and all updates areprovided in the electronic Annual Reports to CalRecycle.
Authorized Signature Title Date
/ -a6-/7
Printed on Recycled Paper, Naturally!276 FOURTH AVENUE , CHULAVISTA CALIFORNIA 91910 , (619)4073545 FAX(619) 691-5006
1/9/2017 Stephanie Ewalt Recycling Specialist II County of San Diego Solid Waste Planning and Recycling 5510 Overland Ave, Suite 210 San Diego, CA 92123 (MS 0350) RE: Certification of Completeness of Integrated Waste Management Plan Documents Dear Ms. Ewalt: The City of Vista has reviewed its integrated waste management plan, which includes the Source Reduction and Recycling Element (SRRE), Household Hazardous Waste Element (HHWE), and Non-Disposal Facility Element (NDFE). All Components are adequate and all updates are provided in the electronic Annual Reports to CalRecycle.
Joshua Sino Cruz
Management Analyst
APPENDIX B
LOCAL TASK FORCE ADVISORY COMMITTEES
MEETING AGENDAS
INTEGRATED WASTE
MANAGEMENT
TECHNICAL ADVISORY
COMMITTEE 5510 Overland Ave
San Diego, CA 92123
Tel: (858) 694-2468
MEMBER JURISDICTIONS
Carlsbad
Chula Vista
Coronado
Del Mar
El Cajon
Encinitas
Escondido
Imperial Beach
La Mesa
Lemon Grove
National City
Oceanside
Poway
San Diego
San Marcos
Santee
Solana Beach
Vista
County of San Diego
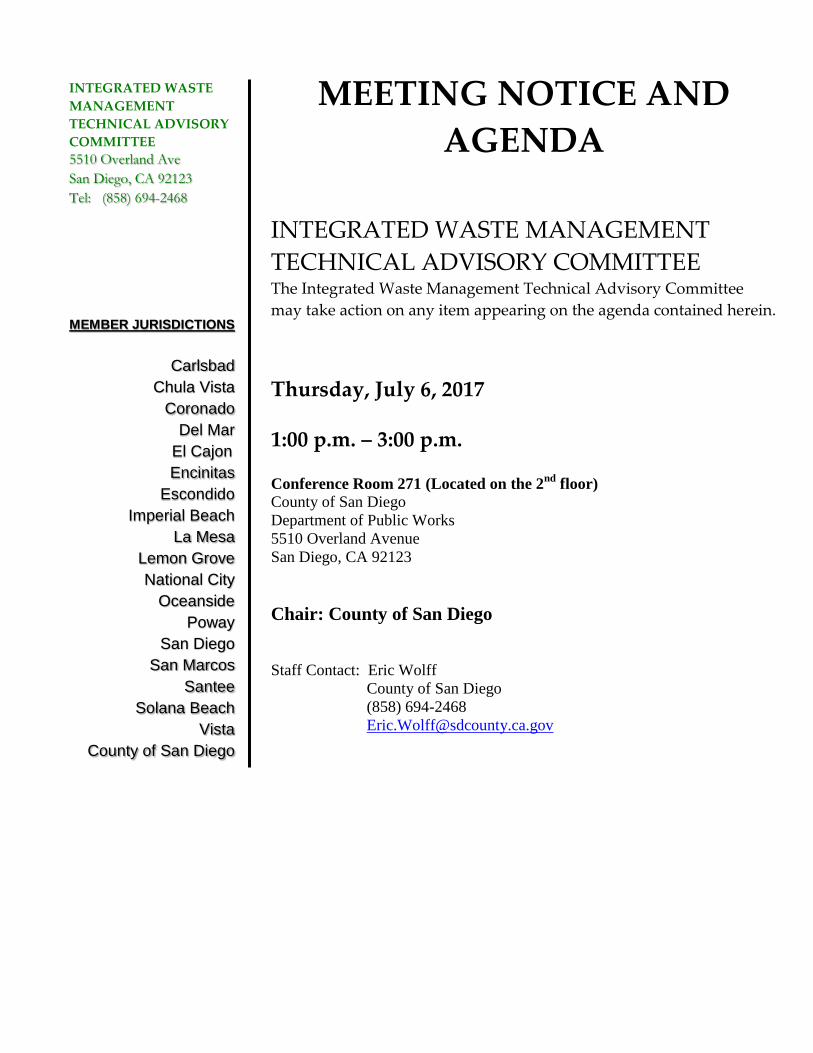
MEETING NOTICE AND
AGENDA
INTEGRATED WASTE MANAGEMENT
TECHNICAL ADVISORY COMMITTEE The Integrated Waste Management Technical Advisory Committee
may take action on any item appearing on the agenda contained herein.
Thursday, July 6, 2017
1:00 p.m. – 3:00 p.m. Conference Room 271 (Located on the 2
nd floor)
County of San Diego
Department of Public Works
5510 Overland Avenue
San Diego, CA 92123
Chair: County of San Diego
Staff Contact: Eric Wolff
County of San Diego
(858) 694-2468
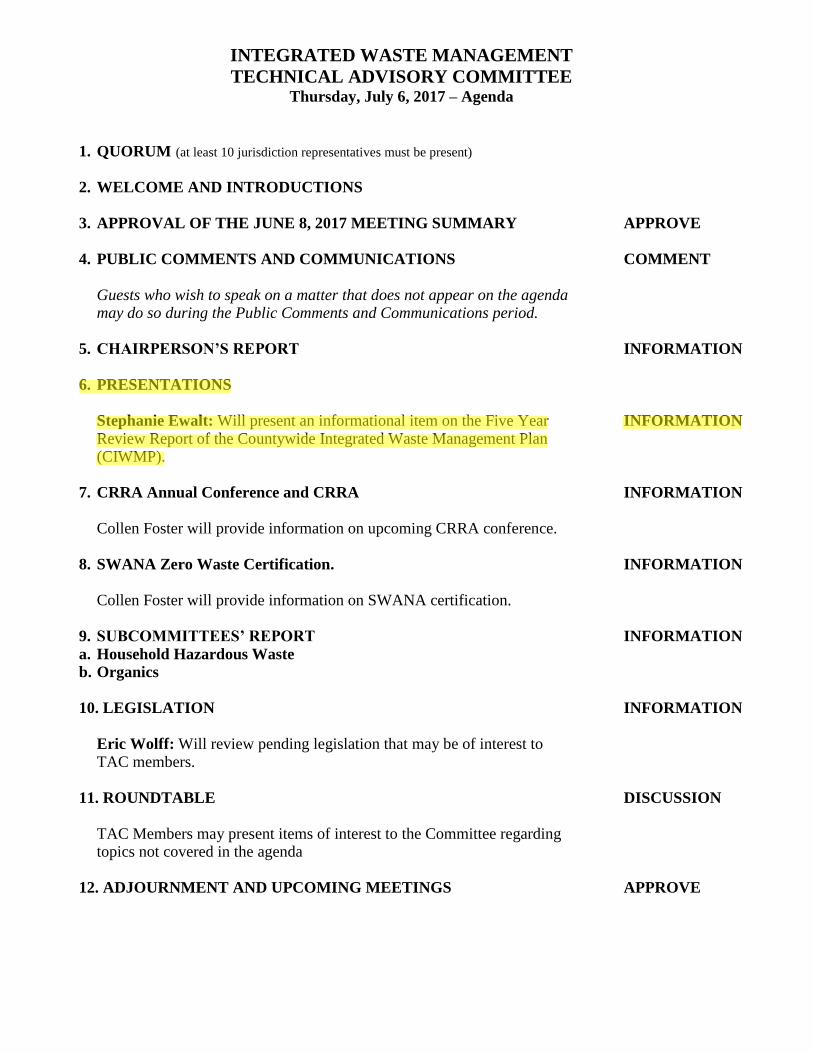
INTEGRATED WASTE MANAGEMENT
TECHNICAL ADVISORY COMMITTEE Thursday, July 6, 2017 – Agenda
1. QUORUM (at least 10 jurisdiction representatives must be present)
2. WELCOME AND INTRODUCTIONS
3. APPROVAL OF THE JUNE 8, 2017 MEETING SUMMARY
4. PUBLIC COMMENTS AND COMMUNICATIONS
Guests who wish to speak on a matter that does not appear on the agenda may do so during the Public Comments and Communications period.
5. CHAIRPERSON’S REPORT
6. PRESENTATIONS
Stephanie Ewalt: Will present an informational item on the Five Year Review Report of the Countywide Integrated Waste Management Plan (CIWMP).
7. CRRA Annual Conference and CRRA
Collen Foster will provide information on upcoming CRRA conference.
8. SWANA Zero Waste Certification.
Collen Foster will provide information on SWANA certification.
9. SUBCOMMITTEES’ REPORT
a. Household Hazardous Waste
b. Organics
10. LEGISLATION
Eric Wolff: Will review pending legislation that may be of interest to TAC members.
11. ROUNDTABLE
TAC Members may present items of interest to the Committee regarding topics not covered in the agenda
12. ADJOURNMENT AND UPCOMING MEETINGS
APPROVE
COMMENT
INFORMATION
INFORMATION
INFORMATION
INFORMATION
INFORMATION
INFORMATION
DISCUSSION
APPROVE
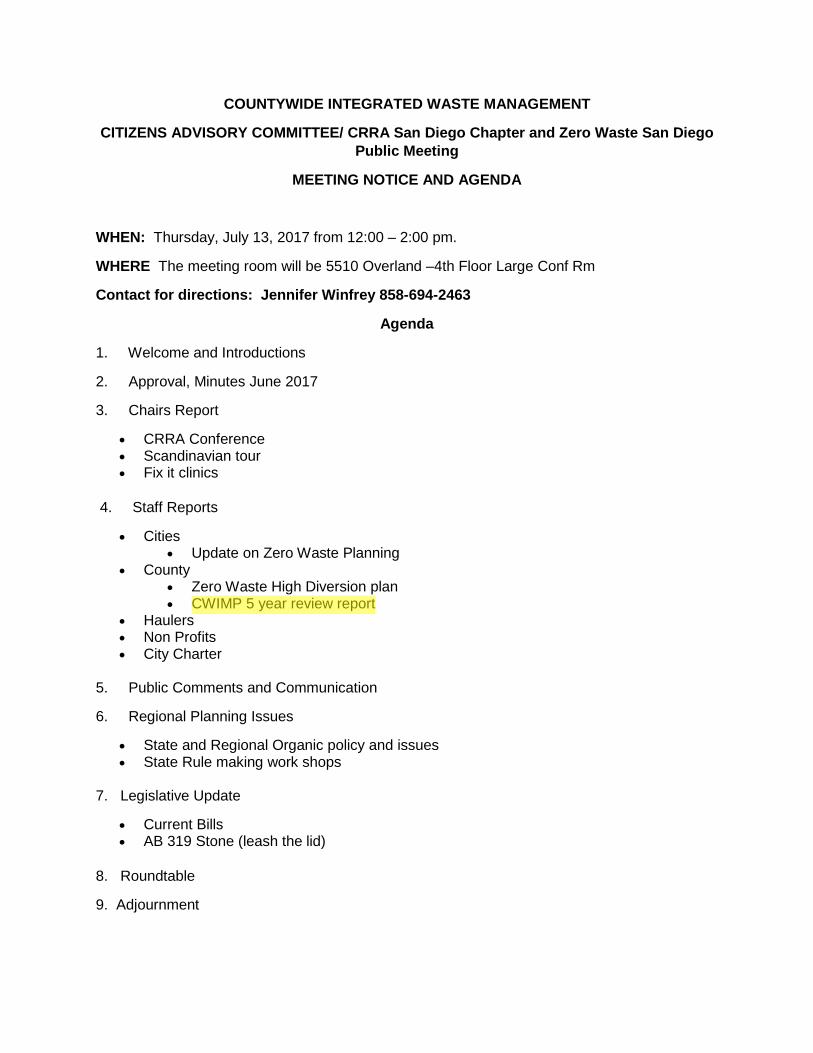
COUNTYWIDE INTEGRATED WASTE MANAGEMENT
CITIZENS ADVISORY COMMITTEE/ CRRA San Diego Chapter and Zero Waste San Diego Public Meeting
MEETING NOTICE AND AGENDA
WHEN: Thursday, July 13, 2017 from 12:00 – 2:00 pm.
WHERE The meeting room will be 5510 Overland –4th Floor Large Conf Rm
Contact for directions: Jennifer Winfrey 858-694-2463
Agenda
1. Welcome and Introductions
2. Approval, Minutes June 2017
3. Chairs Report
• CRRA Conference • Scandinavian tour • Fix it clinics
4. Staff Reports
• Cities • Update on Zero Waste Planning
• County • Zero Waste High Diversion plan • CWIMP 5 year review report
• Haulers • Non Profits • City Charter
5. Public Comments and Communication
6. Regional Planning Issues
• State and Regional Organic policy and issues • State Rule making work shops
7. Legislative Update
• Current Bills • AB 319 Stone (leash the lid)
8. Roundtable
9. Adjournment