Embed Size (px)
Citation preview
DEPARTMENT OF THE NAVY FISCAL YEAR (FY) 2009
BUDGET ESTIMATES
JUSTIFICATION OF ESTIMATES FEBRUARY 2008
OPERATION AND MAINTENANCE,
MARINE CORPS DATA BOOK
Operation and Maintenance, Marine Corps
VOLUME II DATA BOOK
TABLE OF CONTENTS
Exhibit Number Order Table of Contents Manpower Changes in FTEs ........................................................................................................................PB-31Q Major DoD Headquarters Activities .............................................................................................................. PB-22 International Military Headquarters .............................................................................................................. PB-55 Professional Military Education ................................................................................................................... PB-24 Advisory and Assistance Services ................................................................................................................ PB-15 Appropriation Fund Support for MWR Activities......................................................................................... OP-34 Depot Maintenance Program ......................................................................................................................... OP-30 Summary of Budgeted Environmental Projects ............................................................................................ PB-28 Spares and Repair Parts ................................................................................................................................ OP-31
Page 1 of 1
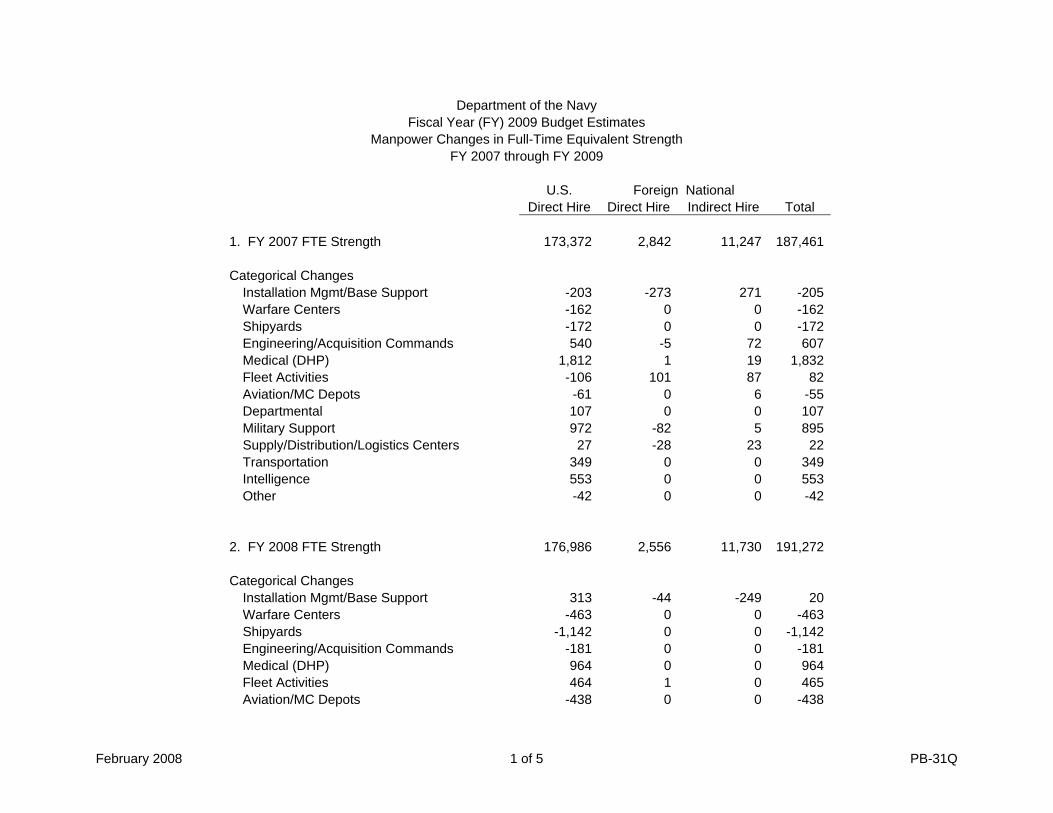
Department of the Navy Fiscal Year (FY) 2009 Budget Estimates
Manpower Changes in Full-Time Equivalent Strength FY 2007 through FY 2009
U.S. Foreign National Direct Hire Direct Hire Indirect Hire Total 1. FY 2007 FTE Strength 173,372 2,842 11,247 187,461 Categorical Changes
Installation Mgmt/Base Support -203 -273 271 -205Warfare Centers -162 0 0 -162Shipyards -172 0 0 -172Engineering/Acquisition Commands 540 -5 72 607Medical (DHP) 1,812 1 19 1,832Fleet Activities -106 101 87 82Aviation/MC Depots -61 0 6 -55Departmental 107 0 0 107Military Support 972 -82 5 895Supply/Distribution/Logistics Centers 27 -28 23 22Transportation 349 0 0 349Intelligence 553 0 0 553Other -42 0 0 -42
2. FY 2008 FTE Strength 176,986 2,556 11,730 191,272 Categorical Changes
Installation Mgmt/Base Support 313 -44 -249 20Warfare Centers -463 0 0 -463Shipyards -1,142 0 0 -1,142Engineering/Acquisition Commands -181 0 0 -181Medical (DHP) 964 0 0 964Fleet Activities 464 1 0 465Aviation/MC Depots -438 0 0 -438
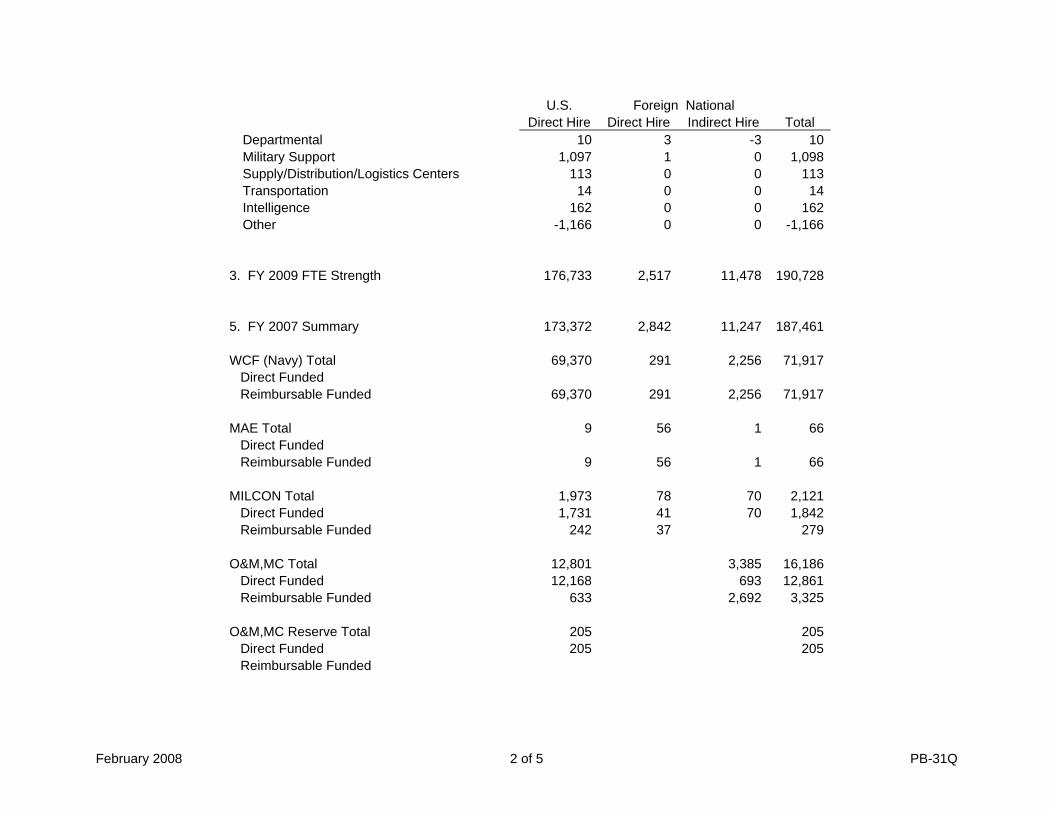
February 2008 1 of 5 PB-31Q
U.S. Foreign National Direct Hire Direct Hire Indirect Hire Total
Departmental 10 3 -3 10Military Support 1,097 1 0 1,098Supply/Distribution/Logistics Centers 113 0 0 113Transportation 14 0 0 14Intelligence 162 0 0 162Other -1,166 0 0 -1,166
3. FY 2009 FTE Strength 176,733 2,517 11,478 190,728 5. FY 2007 Summary 173,372 2,842 11,247 187,461 WCF (Navy) Total 69,370 291 2,256 71,917 Direct Funded Reimbursable Funded 69,370 291 2,256 71,917 MAE Total 9 56 1 66 Direct Funded Reimbursable Funded 9 56 1 66 MILCON Total 1,973 78 70 2,121 Direct Funded 1,731 41 70 1,842 Reimbursable Funded 242 37 279 O&M,MC Total 12,801 3,385 16,186 Direct Funded 12,168 693 12,861 Reimbursable Funded 633 2,692 3,325 O&M,MC Reserve Total 205 205 Direct Funded 205 205 Reimbursable Funded
February 2008 2 of 5 PB-31Q
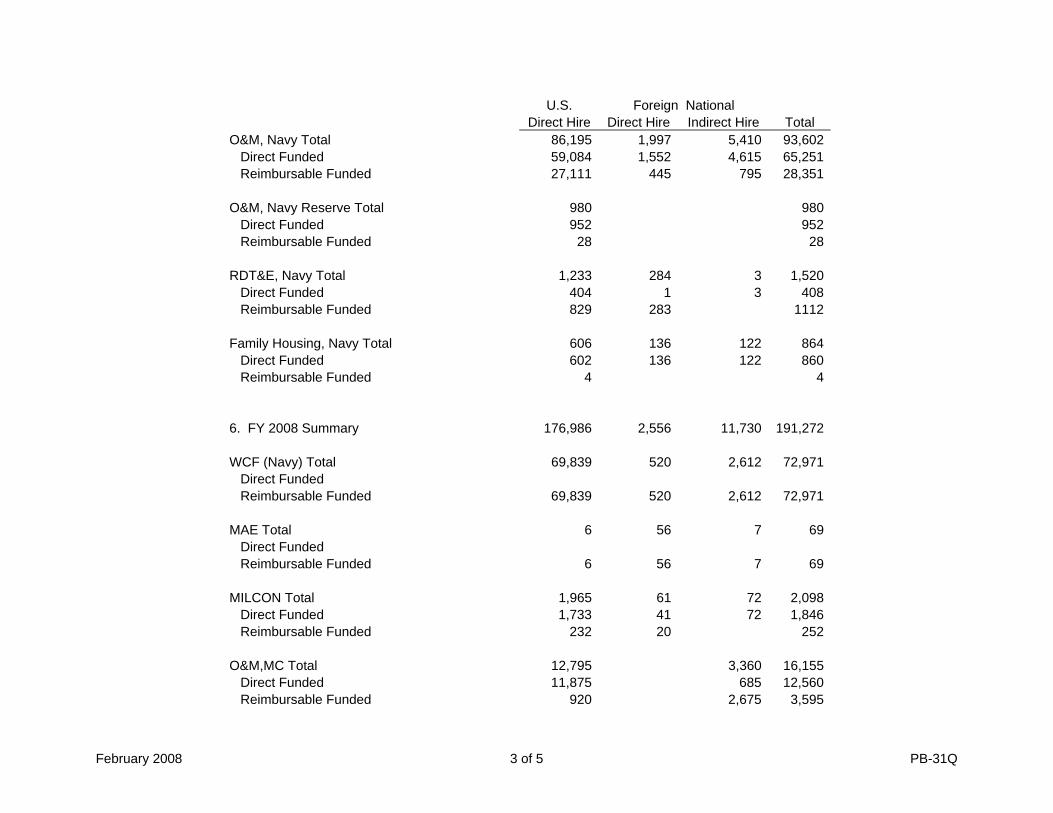
U.S. Foreign National Direct Hire Direct Hire Indirect Hire Total O&M, Navy Total 86,195 1,997 5,410 93,602 Direct Funded 59,084 1,552 4,615 65,251 Reimbursable Funded 27,111 445 795 28,351 O&M, Navy Reserve Total 980 980 Direct Funded 952 952 Reimbursable Funded 28 28 RDT&E, Navy Total 1,233 284 3 1,520 Direct Funded 404 1 3 408 Reimbursable Funded 829 283 1112 Family Housing, Navy Total 606 136 122 864 Direct Funded 602 136 122 860 Reimbursable Funded 4 4 6. FY 2008 Summary 176,986 2,556 11,730 191,272 WCF (Navy) Total 69,839 520 2,612 72,971 Direct Funded Reimbursable Funded 69,839 520 2,612 72,971 MAE Total 6 56 7 69 Direct Funded Reimbursable Funded 6 56 7 69 MILCON Total 1,965 61 72 2,098 Direct Funded 1,733 41 72 1,846 Reimbursable Funded 232 20 252 O&M,MC Total 12,795 3,360 16,155 Direct Funded 11,875 685 12,560 Reimbursable Funded 920 2,675 3,595
February 2008 3 of 5 PB-31Q
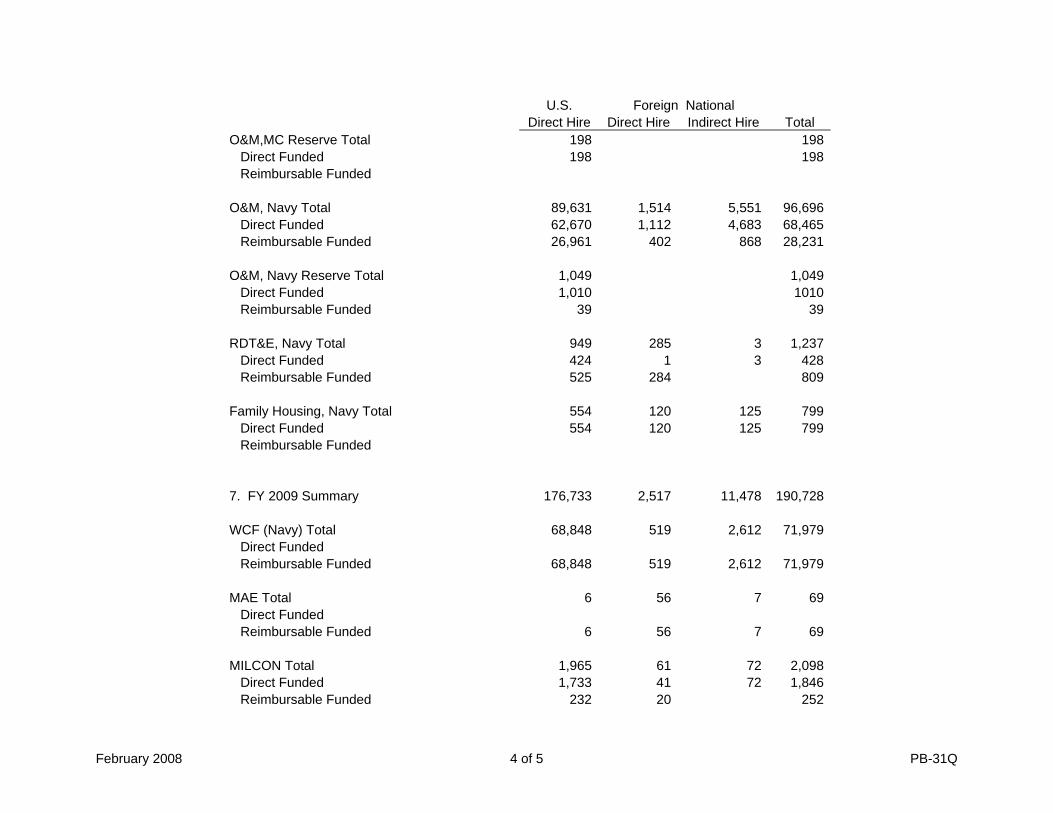
U.S. Foreign National Direct Hire Direct Hire Indirect Hire Total O&M,MC Reserve Total 198 198 Direct Funded 198 198 Reimbursable Funded O&M, Navy Total 89,631 1,514 5,551 96,696 Direct Funded 62,670 1,112 4,683 68,465 Reimbursable Funded 26,961 402 868 28,231 O&M, Navy Reserve Total 1,049 1,049 Direct Funded 1,010 1010 Reimbursable Funded 39 39 RDT&E, Navy Total 949 285 3 1,237 Direct Funded 424 1 3 428 Reimbursable Funded 525 284 809 Family Housing, Navy Total 554 120 125 799 Direct Funded 554 120 125 799 Reimbursable Funded 7. FY 2009 Summary 176,733 2,517 11,478 190,728 WCF (Navy) Total 68,848 519 2,612 71,979 Direct Funded Reimbursable Funded 68,848 519 2,612 71,979 MAE Total 6 56 7 69 Direct Funded Reimbursable Funded 6 56 7 69 MILCON Total 1,965 61 72 2,098 Direct Funded 1,733 41 72 1,846 Reimbursable Funded 232 20 252
February 2008 4 of 5 PB-31Q
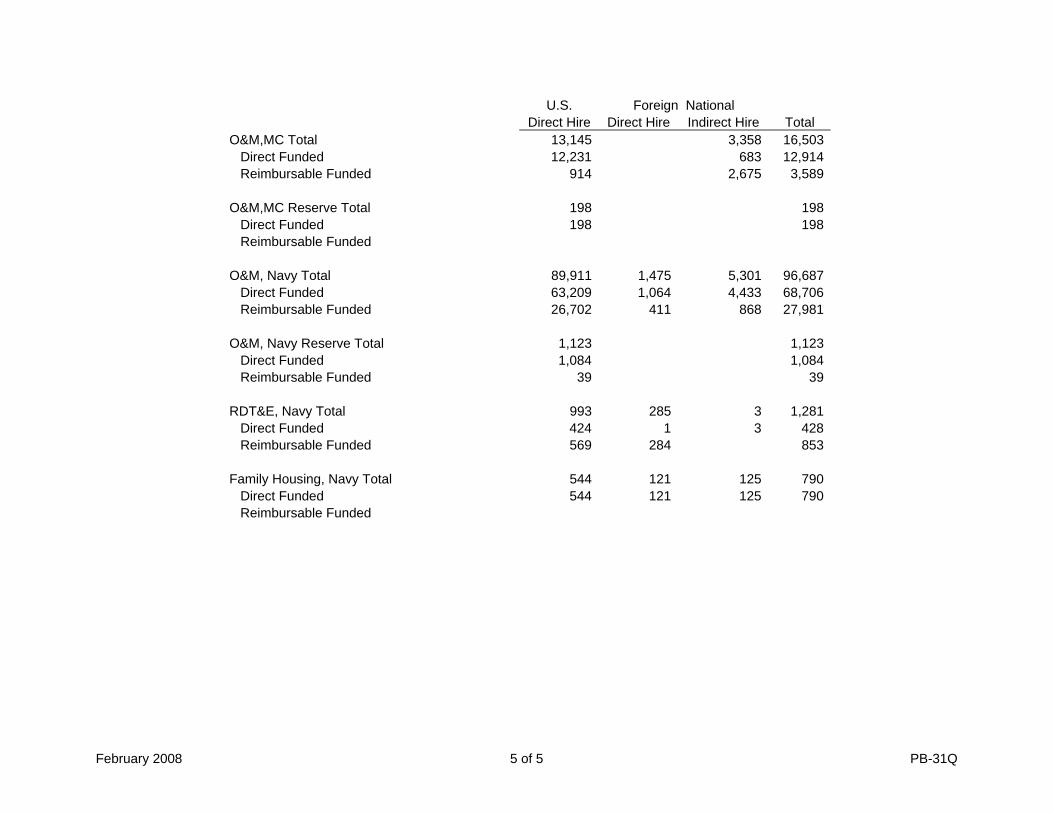
U.S. Foreign National Direct Hire Direct Hire Indirect Hire Total O&M,MC Total 13,145 3,358 16,503 Direct Funded 12,231 683 12,914 Reimbursable Funded 914 2,675 3,589 O&M,MC Reserve Total 198 198 Direct Funded 198 198 Reimbursable Funded O&M, Navy Total 89,911 1,475 5,301 96,687 Direct Funded 63,209 1,064 4,433 68,706 Reimbursable Funded 26,702 411 868 27,981 O&M, Navy Reserve Total 1,123 1,123 Direct Funded 1,084 1,084 Reimbursable Funded 39 39 RDT&E, Navy Total 993 285 3 1,281 Direct Funded 424 1 3 428 Reimbursable Funded 569 284 853 Family Housing, Navy Total 544 121 125 790 Direct Funded 544 121 125 790 Reimbursable Funded
February 2008 5 of 5 PB-31Q
Mil Avg Strength CIV FTEs Total Manpower
Total Oblig ($000)
Mil Avg Strength CIV FTEs Total Manpower
Total Oblig ($000)
Mil Avg Strength CIV FTEs Total Manpower
Total Oblig ($000)
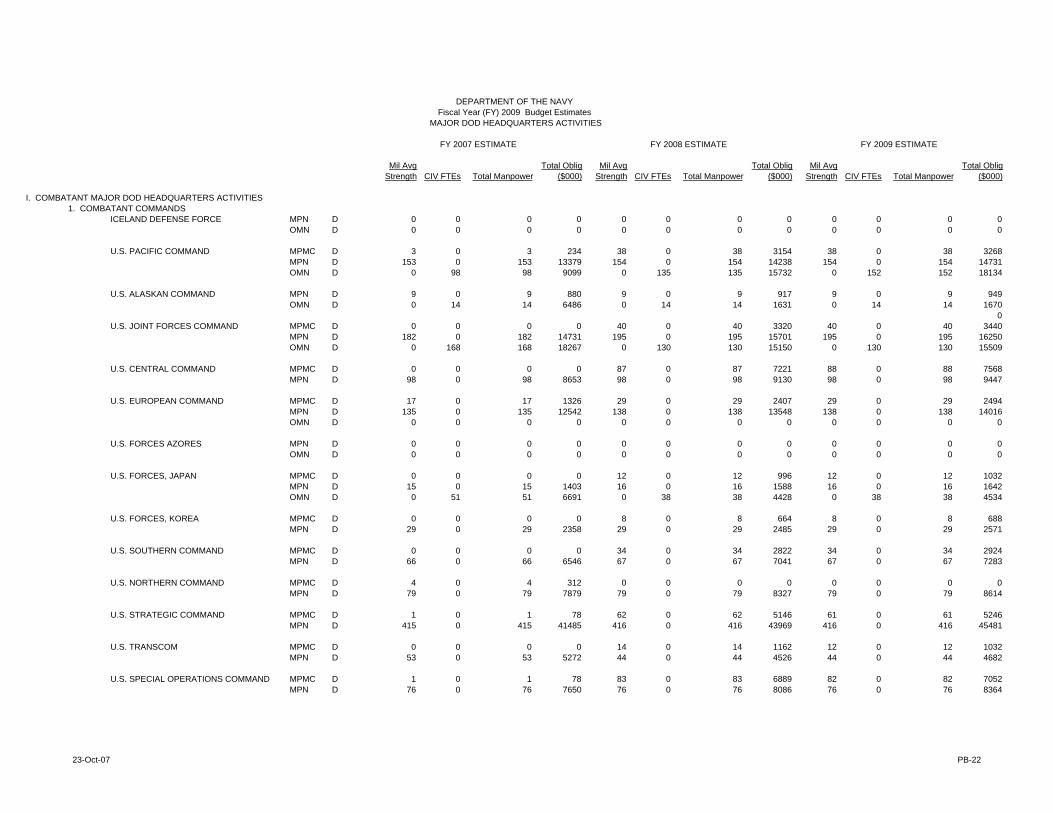
I. COMBATANT MAJOR DOD HEADQUARTERS ACTIVITIES1. COMBATANT COMMANDS
ICELAND DEFENSE FORCE MPN D 0 0 0 0 0 0 0 0 0 0 0 0OMN D 0 0 0 0 0 0 0 0 0 0 0 0
U.S. PACIFIC COMMAND MPMC D 3 0 3 234 38 0 38 3154 38 0 38 3268MPN D 153 0 153 13379 154 0 154 14238 154 0 154 14731OMN D 0 98 98 9099 0 135 135 15732 0 152 152 18134
U.S. ALASKAN COMMAND MPN D 9 0 9 880 9 0 9 917 9 0 9 949OMN D 0 14 14 6486 0 14 14 1631 0 14 14 1670
0U.S. JOINT FORCES COMMAND MPMC D 0 0 0 0 40 0 40 3320 40 0 40 3440
MPN D 182 0 182 14731 195 0 195 15701 195 0 195 16250OMN D 0 168 168 18267 0 130 130 15150 0 130 130 15509
U.S. CENTRAL COMMAND MPMC D 0 0 0 0 87 0 87 7221 88 0 88 7568MPN D 98 0 98 8653 98 0 98 9130 98 0 98 9447
U.S. EUROPEAN COMMAND MPMC D 17 0 17 1326 29 0 29 2407 29 0 29 2494MPN D 135 0 135 12542 138 0 138 13548 138 0 138 14016OMN D 0 0 0 0 0 0 0 0 0 0 0 0
U.S. FORCES AZORES MPN D 0 0 0 0 0 0 0 0 0 0 0 0OMN D 0 0 0 0 0 0 0 0 0 0 0 0
U.S. FORCES, JAPAN MPMC D 0 0 0 0 12 0 12 996 12 0 12 1032MPN D 15 0 15 1403 16 0 16 1588 16 0 16 1642OMN D 0 51 51 6691 0 38 38 4428 0 38 38 4534
U.S. FORCES, KOREA MPMC D 0 0 0 0 8 0 8 664 8 0 8 688MPN D 29 0 29 2358 29 0 29 2485 29 0 29 2571
U.S. SOUTHERN COMMAND MPMC D 0 0 0 0 34 0 34 2822 34 0 34 2924MPN D 66 0 66 6546 67 0 67 7041 67 0 67 7283
U.S. NORTHERN COMMAND MPMC D 4 0 4 312 0 0 0 0 0 0 0 0MPN D 79 0 79 7879 79 0 79 8327 79 0 79 8614
U.S. STRATEGIC COMMAND MPMC D 1 0 1 78 62 0 62 5146 61 0 61 5246MPN D 415 0 415 41485 416 0 416 43969 416 0 416 45481
U.S. TRANSCOM MPMC D 0 0 0 0 14 0 14 1162 12 0 12 1032MPN D 53 0 53 5272 44 0 44 4526 44 0 44 4682
U.S. SPECIAL OPERATIONS COMMAND MPMC D 1 0 1 78 83 0 83 6889 82 0 82 7052MPN D 76 0 76 7650 76 0 76 8086 76 0 76 8364
FY 2007 ESTIMATE FY 2008 ESTIMATE FY 2009 ESTIMATE
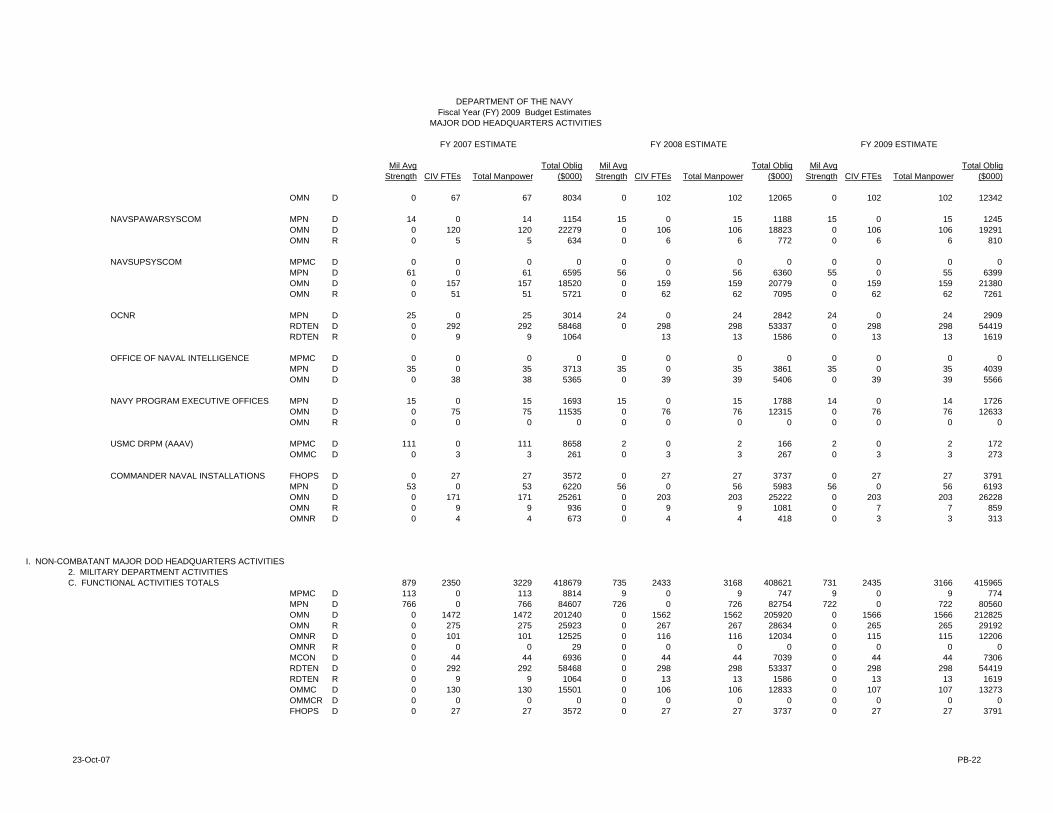
DEPARTMENT OF THE NAVYFiscal Year (FY) 2009 Budget Estimates
MAJOR DOD HEADQUARTERS ACTIVITIES
23-Oct-07 PB-22
Mil Avg Strength CIV FTEs Total Manpower
Total Oblig ($000)
Mil Avg Strength CIV FTEs Total Manpower
Total Oblig ($000)
Mil Avg Strength CIV FTEs Total Manpower
Total Oblig ($000)
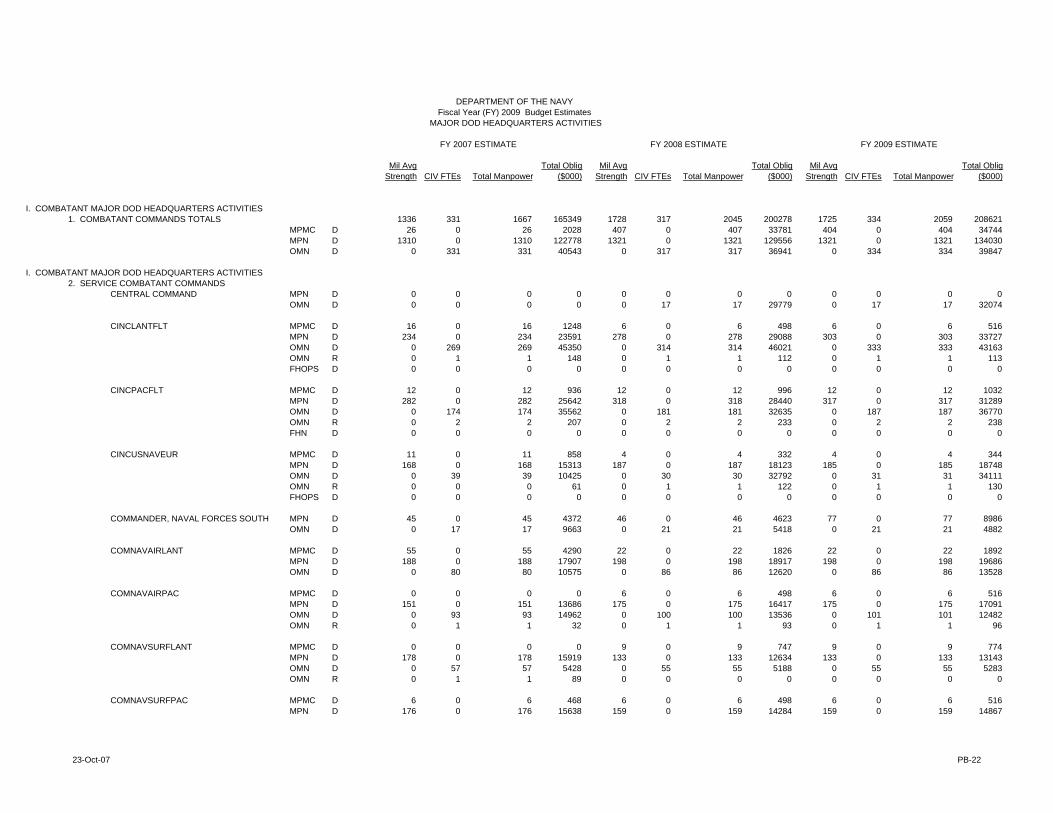
FY 2007 ESTIMATE FY 2008 ESTIMATE FY 2009 ESTIMATE
DEPARTMENT OF THE NAVYFiscal Year (FY) 2009 Budget Estimates
MAJOR DOD HEADQUARTERS ACTIVITIES
I. COMBATANT MAJOR DOD HEADQUARTERS ACTIVITIES1. COMBATANT COMMANDS TOTALS 1336 331 1667 165349 1728 317 2045 200278 1725 334 2059 208621
MPMC D 26 0 26 2028 407 0 407 33781 404 0 404 34744MPN D 1310 0 1310 122778 1321 0 1321 129556 1321 0 1321 134030OMN D 0 331 331 40543 0 317 317 36941 0 334 334 39847
I. COMBATANT MAJOR DOD HEADQUARTERS ACTIVITIES2. SERVICE COMBATANT COMMANDS
CENTRAL COMMAND MPN D 0 0 0 0 0 0 0 0 0 0 0 0OMN D 0 0 0 0 0 17 17 29779 0 17 17 32074
CINCLANTFLT MPMC D 16 0 16 1248 6 0 6 498 6 0 6 516MPN D 234 0 234 23591 278 0 278 29088 303 0 303 33727OMN D 0 269 269 45350 0 314 314 46021 0 333 333 43163OMN R 0 1 1 148 0 1 1 112 0 1 1 113FHOPS D 0 0 0 0 0 0 0 0 0 0 0 0
CINCPACFLT MPMC D 12 0 12 936 12 0 12 996 12 0 12 1032MPN D 282 0 282 25642 318 0 318 28440 317 0 317 31289OMN D 0 174 174 35562 0 181 181 32635 0 187 187 36770OMN R 0 2 2 207 0 2 2 233 0 2 2 238FHN D 0 0 0 0 0 0 0 0 0 0 0 0
CINCUSNAVEUR MPMC D 11 0 11 858 4 0 4 332 4 0 4 344MPN D 168 0 168 15313 187 0 187 18123 185 0 185 18748OMN D 0 39 39 10425 0 30 30 32792 0 31 31 34111OMN R 0 0 0 61 0 1 1 122 0 1 1 130FHOPS D 0 0 0 0 0 0 0 0 0 0 0 0
COMMANDER, NAVAL FORCES SOUTH MPN D 45 0 45 4372 46 0 46 4623 77 0 77 8986OMN D 0 17 17 9663 0 21 21 5418 0 21 21 4882
COMNAVAIRLANT MPMC D 55 0 55 4290 22 0 22 1826 22 0 22 1892MPN D 188 0 188 17907 198 0 198 18917 198 0 198 19686OMN D 0 80 80 10575 0 86 86 12620 0 86 86 13528
COMNAVAIRPAC MPMC D 0 0 0 0 6 0 6 498 6 0 6 516MPN D 151 0 151 13686 175 0 175 16417 175 0 175 17091OMN D 0 93 93 14962 0 100 100 13536 0 101 101 12482OMN R 0 1 1 32 0 1 1 93 0 1 1 96
COMNAVSURFLANT MPMC D 0 0 0 0 9 0 9 747 9 0 9 774MPN D 178 0 178 15919 133 0 133 12634 133 0 133 13143OMN D 0 57 57 5428 0 55 55 5188 0 55 55 5283OMN R 0 1 1 89 0 0 0 0 0 0 0 0
COMNAVSURFPAC MPMC D 6 0 6 468 6 0 6 498 6 0 6 516MPN D 176 0 176 15638 159 0 159 14284 159 0 159 14867
23-Oct-07 PB-22
Mil Avg Strength CIV FTEs Total Manpower
Total Oblig ($000)
Mil Avg Strength CIV FTEs Total Manpower
Total Oblig ($000)
Mil Avg Strength CIV FTEs Total Manpower
Total Oblig ($000)
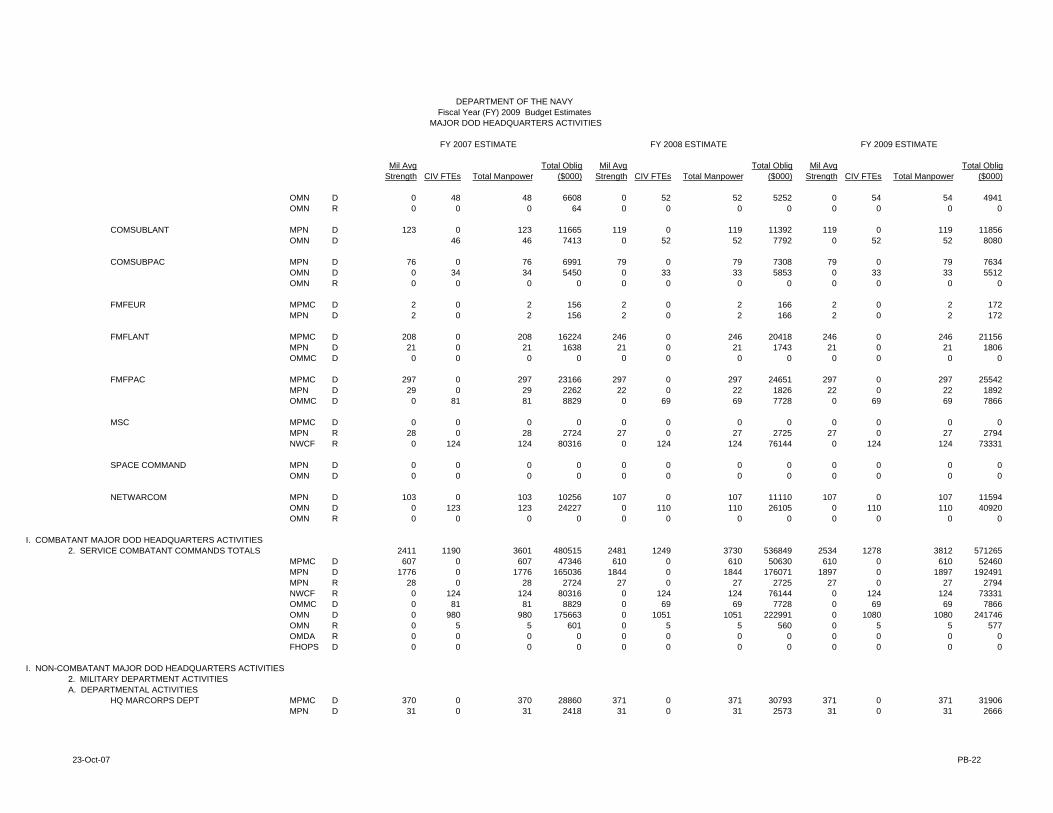
FY 2007 ESTIMATE FY 2008 ESTIMATE FY 2009 ESTIMATE
DEPARTMENT OF THE NAVYFiscal Year (FY) 2009 Budget Estimates
MAJOR DOD HEADQUARTERS ACTIVITIES
OMN D 0 48 48 6608 0 52 52 5252 0 54 54 4941OMN R 0 0 0 64 0 0 0 0 0 0 0 0
COMSUBLANT MPN D 123 0 123 11665 119 0 119 11392 119 0 119 11856OMN D 46 46 7413 0 52 52 7792 0 52 52 8080
COMSUBPAC MPN D 76 0 76 6991 79 0 79 7308 79 0 79 7634OMN D 0 34 34 5450 0 33 33 5853 0 33 33 5512OMN R 0 0 0 0 0 0 0 0 0 0 0 0
FMFEUR MPMC D 2 0 2 156 2 0 2 166 2 0 2 172MPN D 2 0 2 156 2 0 2 166 2 0 2 172
FMFLANT MPMC D 208 0 208 16224 246 0 246 20418 246 0 246 21156MPN D 21 0 21 1638 21 0 21 1743 21 0 21 1806OMMC D 0 0 0 0 0 0 0 0 0 0 0 0
FMFPAC MPMC D 297 0 297 23166 297 0 297 24651 297 0 297 25542MPN D 29 0 29 2262 22 0 22 1826 22 0 22 1892OMMC D 0 81 81 8829 0 69 69 7728 0 69 69 7866
MSC MPMC D 0 0 0 0 0 0 0 0 0 0 0 0MPN R 28 0 28 2724 27 0 27 2725 27 0 27 2794NWCF R 0 124 124 80316 0 124 124 76144 0 124 124 73331
SPACE COMMAND MPN D 0 0 0 0 0 0 0 0 0 0 0 0OMN D 0 0 0 0 0 0 0 0 0 0 0 0
NETWARCOM MPN D 103 0 103 10256 107 0 107 11110 107 0 107 11594OMN D 0 123 123 24227 0 110 110 26105 0 110 110 40920OMN R 0 0 0 0 0 0 0 0 0 0 0 0
I. COMBATANT MAJOR DOD HEADQUARTERS ACTIVITIES
2. SERVICE COMBATANT COMMANDS TOTALS 2411 1190 3601 480515 2481 1249 3730 536849 2534 1278 3812 571265MPMC D 607 0 607 47346 610 0 610 50630 610 0 610 52460MPN D 1776 0 1776 165036 1844 0 1844 176071 1897 0 1897 192491MPN R 28 0 28 2724 27 0 27 2725 27 0 27 2794NWCF R 0 124 124 80316 0 124 124 76144 0 124 124 73331OMMC D 0 81 81 8829 0 69 69 7728 0 69 69 7866OMN D 0 980 980 175663 0 1051 1051 222991 0 1080 1080 241746OMN R 0 5 5 601 0 5 5 560 0 5 5 577OMDA R 0 0 0 0 0 0 0 0 0 0 0 0FHOPS D 0 0 0 0 0 0 0 0 0 0 0 0
I. NON-COMBATANT MAJOR DOD HEADQUARTERS ACTIVITIES2. MILITARY DEPARTMENT ACTIVITIESA. DEPARTMENTAL ACTIVITIES
HQ MARCORPS DEPT MPMC D 370 0 370 28860 371 0 371 30793 371 0 371 31906MPN D 31 0 31 2418 31 0 31 2573 31 0 31 2666
23-Oct-07 PB-22
Mil Avg Strength CIV FTEs Total Manpower
Total Oblig ($000)
Mil Avg Strength CIV FTEs Total Manpower
Total Oblig ($000)
Mil Avg Strength CIV FTEs Total Manpower
Total Oblig ($000)
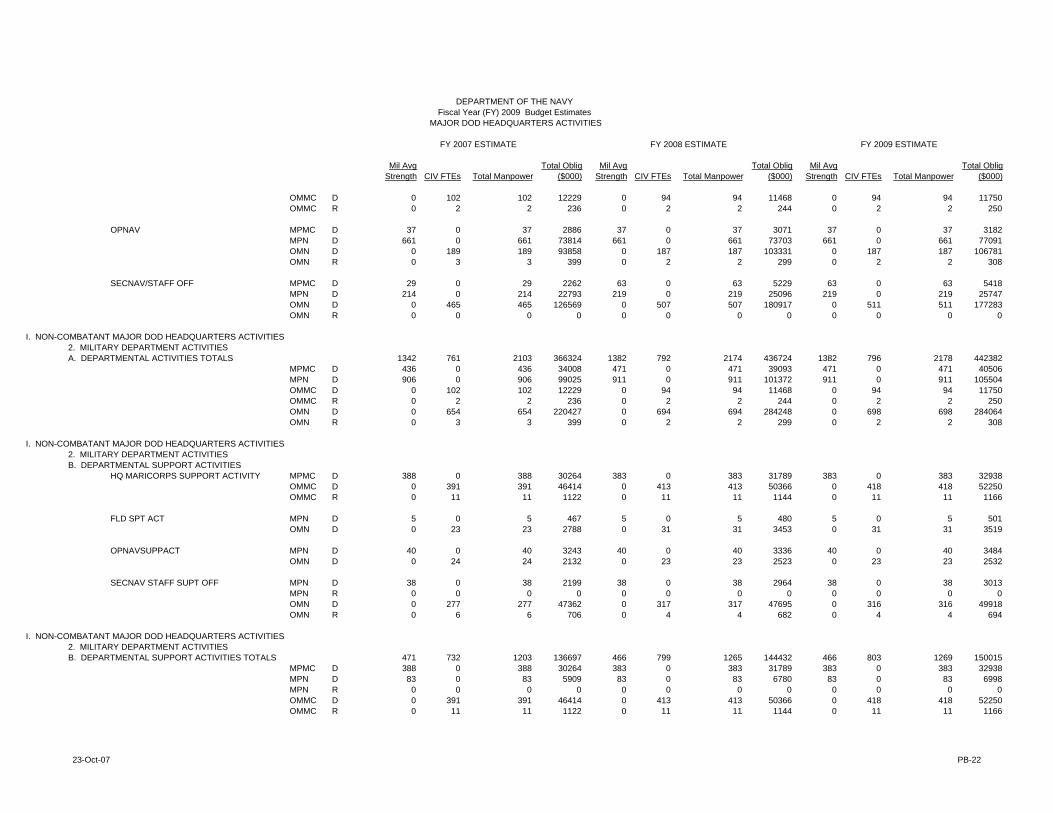
FY 2007 ESTIMATE FY 2008 ESTIMATE FY 2009 ESTIMATE
DEPARTMENT OF THE NAVYFiscal Year (FY) 2009 Budget Estimates
MAJOR DOD HEADQUARTERS ACTIVITIES
OMMC D 0 102 102 12229 0 94 94 11468 0 94 94 11750OMMC R 0 2 2 236 0 2 2 244 0 2 2 250
OPNAV MPMC D 37 0 37 2886 37 0 37 3071 37 0 37 3182MPN D 661 0 661 73814 661 0 661 73703 661 0 661 77091OMN D 0 189 189 93858 0 187 187 103331 0 187 187 106781OMN R 0 3 3 399 0 2 2 299 0 2 2 308
SECNAV/STAFF OFF MPMC D 29 0 29 2262 63 0 63 5229 63 0 63 5418MPN D 214 0 214 22793 219 0 219 25096 219 0 219 25747OMN D 0 465 465 126569 0 507 507 180917 0 511 511 177283OMN R 0 0 0 0 0 0 0 0 0 0 0 0
I. NON-COMBATANT MAJOR DOD HEADQUARTERS ACTIVITIES2. MILITARY DEPARTMENT ACTIVITIESA. DEPARTMENTAL ACTIVITIES TOTALS 1342 761 2103 366324 1382 792 2174 436724 1382 796 2178 442382
MPMC D 436 0 436 34008 471 0 471 39093 471 0 471 40506MPN D 906 0 906 99025 911 0 911 101372 911 0 911 105504OMMC D 0 102 102 12229 0 94 94 11468 0 94 94 11750OMMC R 0 2 2 236 0 2 2 244 0 2 2 250OMN D 0 654 654 220427 0 694 694 284248 0 698 698 284064OMN R 0 3 3 399 0 2 2 299 0 2 2 308
I. NON-COMBATANT MAJOR DOD HEADQUARTERS ACTIVITIES2. MILITARY DEPARTMENT ACTIVITIESB. DEPARTMENTAL SUPPORT ACTIVITIES
HQ MARICORPS SUPPORT ACTIVITY MPMC D 388 0 388 30264 383 0 383 31789 383 0 383 32938OMMC D 0 391 391 46414 0 413 413 50366 0 418 418 52250OMMC R 0 11 11 1122 0 11 11 1144 0 11 11 1166
FLD SPT ACT MPN D 5 0 5 467 5 0 5 480 5 0 5 501OMN D 0 23 23 2788 0 31 31 3453 0 31 31 3519
OPNAVSUPPACT MPN D 40 0 40 3243 40 0 40 3336 40 0 40 3484
OMN D 0 24 24 2132 0 23 23 2523 0 23 23 2532
SECNAV STAFF SUPT OFF MPN D 38 0 38 2199 38 0 38 2964 38 0 38 3013MPN R 0 0 0 0 0 0 0 0 0 0 0 0OMN D 0 277 277 47362 0 317 317 47695 0 316 316 49918OMN R 0 6 6 706 0 4 4 682 0 4 4 694
I. NON-COMBATANT MAJOR DOD HEADQUARTERS ACTIVITIES2. MILITARY DEPARTMENT ACTIVITIESB. DEPARTMENTAL SUPPORT ACTIVITIES TOTALS 471 732 1203 136697 466 799 1265 144432 466 803 1269 150015
MPMC D 388 0 388 30264 383 0 383 31789 383 0 383 32938MPN D 83 0 83 5909 83 0 83 6780 83 0 83 6998MPN R 0 0 0 0 0 0 0 0 0 0 0 0OMMC D 0 391 391 46414 0 413 413 50366 0 418 418 52250OMMC R 0 11 11 1122 0 11 11 1144 0 11 11 1166
23-Oct-07 PB-22

Mil Avg Strength CIV FTEs Total Manpower
Total Oblig ($000)
Mil Avg Strength CIV FTEs Total Manpower
Total Oblig ($000)
Mil Avg Strength CIV FTEs Total Manpower
Total Oblig ($000)
FY 2007 ESTIMATE FY 2008 ESTIMATE FY 2009 ESTIMATE
DEPARTMENT OF THE NAVYFiscal Year (FY) 2009 Budget Estimates
MAJOR DOD HEADQUARTERS ACTIVITIES
OMN D 0 324 324 52282 0 371 371 53671 0 370 370 55969OMN R 0 6 6 706 0 4 4 682 0 4 4 694
I. NON-COMBATANT MAJOR DOD HEADQUARTERS ACTIVITIES2. MILITARY DEPARTMENT ACTIVITIESC. FUNCTIONAL ACTIVITIES
AIR TRNG CMD MPMC D 1 0 1 78 3 0 3 249 3 0 3 258MPN D 27 0 27 2902 23 0 23 2581 23 0 23 2624OMN D 0 54 54 4935 0 64 64 5018 0 70 70 5627
CHIEF OF NAVAL PERSONNEL MPN D 118 0 118 12322 118 0 118 12093 116 0 116 12517OMN D 0 99 99 11310 0 94 94 13438 0 95 95 14353OMNR D 0 0 0 0 0 1 1 0 0 1 1 0
CNAVRESFOR MPN D 22 0 22 1675 22 0 22 1720 22 0 22 1798OMNR D 0 97 97 11852 0 111 111 11616 0 111 111 11893OMNR R 0 0 0 29 0 0 0 0 0 0 0 0
CNET MPMC D 1 0 1 78 4 0 4 332 4 0 4 344MPN D 55 0 55 6326 43 0 43 4967 43 0 43 4425OMN D 0 172 172 19922 0 198 198 18933 0 196 196 19807OMNR D 0 0 0 0 0 0 0 0 0 0 0 0
BUMED MPN D 199 0 199 24632 179 0 179 25198 179 0 179 22286OMN D 0 0 0 0 0 0 0 0 0 0 0 0OMN R 0 192 192 16135 0 169 169 17041 0 169 169 17543
COMNAVMETOCCOM MPN D 0 0 0 0 0 0 0 0 0 0 0 0OMN D 0 0 0 0 0 0 0 0 0 0 0 0OMN R 0 0 0 0 0 0 0 0 0 0 0 0
HQ MARCORPS NON-DEPT MPMC D 0 0 0 0 0 0 0 0 0 0 0 0OMMC D 0 127 127 15240 0 103 103 12566 0 104 104 13000OMMCR D 0 0 0 0 0 0 0 0 0 0 0 0
NAVAIRSYSCOM MPN D 20 0 20 2029 20 0 20 2145 20 0 20 2221OMN D 0 181 181 28860 0 175 175 26905 0 174 174 27436OMN R 0 12 12 1400 0 13 13 1486 0 13 13 1530
NAVFACENGCOM MCON D 0 44 44 6936 0 44 44 7039 0 44 44 7306MPN D 26 0 26 2887 26 0 26 2653 26 0 26 2711OMN D 0 80 80 11158 0 88 88 11928 0 88 88 12144OMN R 0 0 0 0 0 0 0 0 0 0 0 0
NAVSEASYSCOM MPN D 16 0 16 1820 14 0 14 1597 14 0 14 1576OMN D 0 258 258 34061 0 258 258 35088 0 258 258 36018OMN R 0 6 6 1097 0 8 8 1159 0 8 8 1189
NAVSECGRU MPN D 80 0 80 7625 80 0 80 7778 80 0 80 7891
23-Oct-07 PB-22
Mil Avg Strength CIV FTEs Total Manpower
Total Oblig ($000)
Mil Avg Strength CIV FTEs Total Manpower
Total Oblig ($000)
Mil Avg Strength CIV FTEs Total Manpower
Total Oblig ($000)
FY 2007 ESTIMATE FY 2008 ESTIMATE FY 2009 ESTIMATE
DEPARTMENT OF THE NAVYFiscal Year (FY) 2009 Budget Estimates
MAJOR DOD HEADQUARTERS ACTIVITIES
OMN D 0 67 67 8034 0 102 102 12065 0 102 102 12342
NAVSPAWARSYSCOM MPN D 14 0 14 1154 15 0 15 1188 15 0 15 1245OMN D 0 120 120 22279 0 106 106 18823 0 106 106 19291OMN R 0 5 5 634 0 6 6 772 0 6 6 810
NAVSUPSYSCOM MPMC D 0 0 0 0 0 0 0 0 0 0 0 0MPN D 61 0 61 6595 56 0 56 6360 55 0 55 6399OMN D 0 157 157 18520 0 159 159 20779 0 159 159 21380OMN R 0 51 51 5721 0 62 62 7095 0 62 62 7261
OCNR MPN D 25 0 25 3014 24 0 24 2842 24 0 24 2909RDTEN D 0 292 292 58468 0 298 298 53337 0 298 298 54419RDTEN R 0 9 9 1064 13 13 1586 0 13 13 1619
OFFICE OF NAVAL INTELLIGENCE MPMC D 0 0 0 0 0 0 0 0 0 0 0 0MPN D 35 0 35 3713 35 0 35 3861 35 0 35 4039OMN D 0 38 38 5365 0 39 39 5406 0 39 39 5566
NAVY PROGRAM EXECUTIVE OFFICES MPN D 15 0 15 1693 15 0 15 1788 14 0 14 1726OMN D 0 75 75 11535 0 76 76 12315 0 76 76 12633OMN R 0 0 0 0 0 0 0 0 0 0 0 0
USMC DRPM (AAAV) MPMC D 111 0 111 8658 2 0 2 166 2 0 2 172OMMC D 0 3 3 261 0 3 3 267 0 3 3 273
COMMANDER NAVAL INSTALLATIONS FHOPS D 0 27 27 3572 0 27 27 3737 0 27 27 3791MPN D 53 0 53 6220 56 0 56 5983 56 0 56 6193OMN D 0 171 171 25261 0 203 203 25222 0 203 203 26228OMN R 0 9 9 936 0 9 9 1081 0 7 7 859OMNR D 0 4 4 673 0 4 4 418 0 3 3 313
I. NON-COMBATANT MAJOR DOD HEADQUARTERS ACTIVITIES2. MILITARY DEPARTMENT ACTIVITIESC. FUNCTIONAL ACTIVITIES TOTALS 879 2350 3229 418679 735 2433 3168 408621 731 2435 3166 415965
MPMC D 113 0 113 8814 9 0 9 747 9 0 9 774MPN D 766 0 766 84607 726 0 726 82754 722 0 722 80560OMN D 0 1472 1472 201240 0 1562 1562 205920 0 1566 1566 212825OMN R 0 275 275 25923 0 267 267 28634 0 265 265 29192OMNR D 0 101 101 12525 0 116 116 12034 0 115 115 12206OMNR R 0 0 0 29 0 0 0 0 0 0 0 0MCON D 0 44 44 6936 0 44 44 7039 0 44 44 7306RDTEN D 0 292 292 58468 0 298 298 53337 0 298 298 54419RDTEN R 0 9 9 1064 0 13 13 1586 0 13 13 1619OMMC D 0 130 130 15501 0 106 106 12833 0 107 107 13273OMMCR D 0 0 0 0 0 0 0 0 0 0 0 0FHOPS D 0 27 27 3572 0 27 27 3737 0 27 27 3791
23-Oct-07 PB-22
Mil Avg Strength CIV FTEs Total Manpower
Total Oblig ($000)
Mil Avg Strength CIV FTEs Total Manpower
Total Oblig ($000)
Mil Avg Strength CIV FTEs Total Manpower
Total Oblig ($000)
FY 2007 ESTIMATE FY 2008 ESTIMATE FY 2009 ESTIMATE
DEPARTMENT OF THE NAVYFiscal Year (FY) 2009 Budget Estimates
MAJOR DOD HEADQUARTERS ACTIVITIES
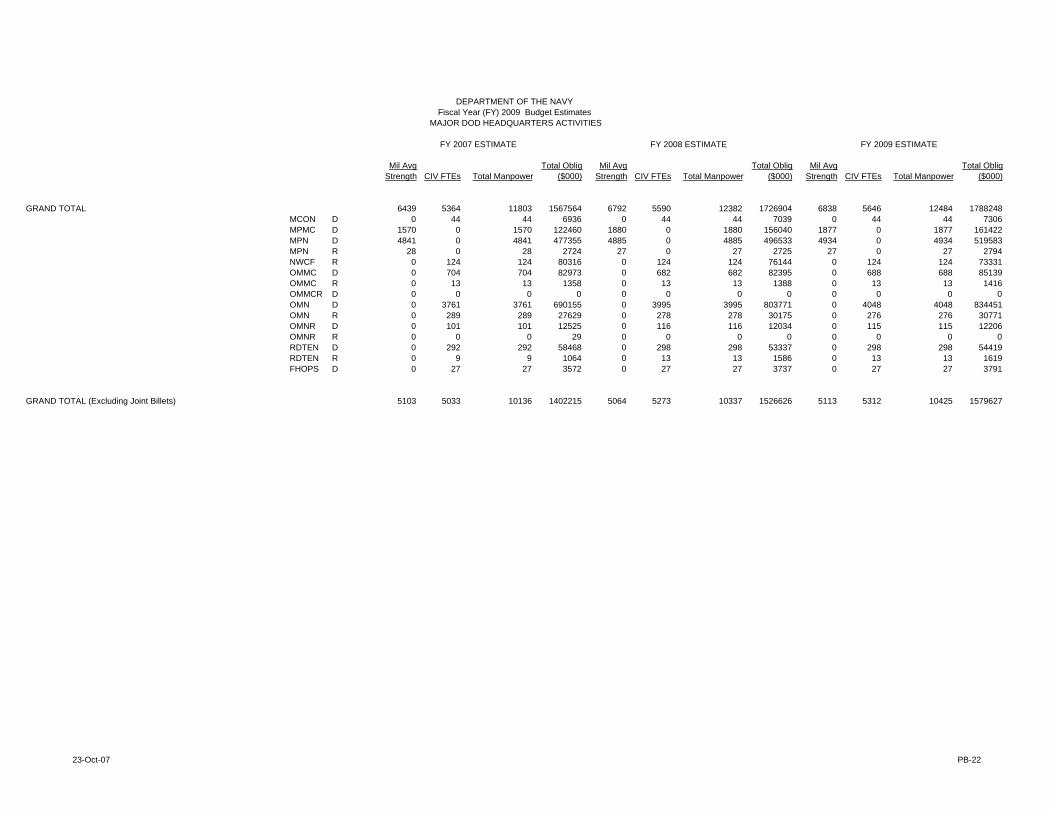
GRAND TOTAL 6439 5364 11803 1567564 6792 5590 12382 1726904 6838 5646 12484 1788248MCON D 0 44 44 6936 0 44 44 7039 0 44 44 7306MPMC D 1570 0 1570 122460 1880 0 1880 156040 1877 0 1877 161422MPN D 4841 0 4841 477355 4885 0 4885 496533 4934 0 4934 519583MPN R 28 0 28 2724 27 0 27 2725 27 0 27 2794NWCF R 0 124 124 80316 0 124 124 76144 0 124 124 73331OMMC D 0 704 704 82973 0 682 682 82395 0 688 688 85139OMMC R 0 13 13 1358 0 13 13 1388 0 13 13 1416OMMCR D 0 0 0 0 0 0 0 0 0 0 0 0OMN D 0 3761 3761 690155 0 3995 3995 803771 0 4048 4048 834451OMN R 0 289 289 27629 0 278 278 30175 0 276 276 30771OMNR D 0 101 101 12525 0 116 116 12034 0 115 115 12206OMNR R 0 0 0 29 0 0 0 0 0 0 0 0RDTEN D 0 292 292 58468 0 298 298 53337 0 298 298 54419RDTEN R 0 9 9 1064 0 13 13 1586 0 13 13 1619FHOPS D 0 27 27 3572 0 27 27 3737 0 27 27 3791
GRAND TOTAL (Excluding Joint Billets) 5103 5033 10136 1402215 5064 5273 10337 1526626 5113 5312 10425 1579627
23-Oct-07 PB-22
MIL AVG STRENGTH CIV FTEs
TOTAL Mpwr
Labor Dollars
Non-Labor Dollars
MIL AVG STRENGTH CIV FTEs
TOTAL Mpwr
Labor Dollars
Non-Labor Dollars
MIL AVG STRENGTH CIV FTEs
TOTAL Mpwr
Labor Dollars
Non-Labor Dollars
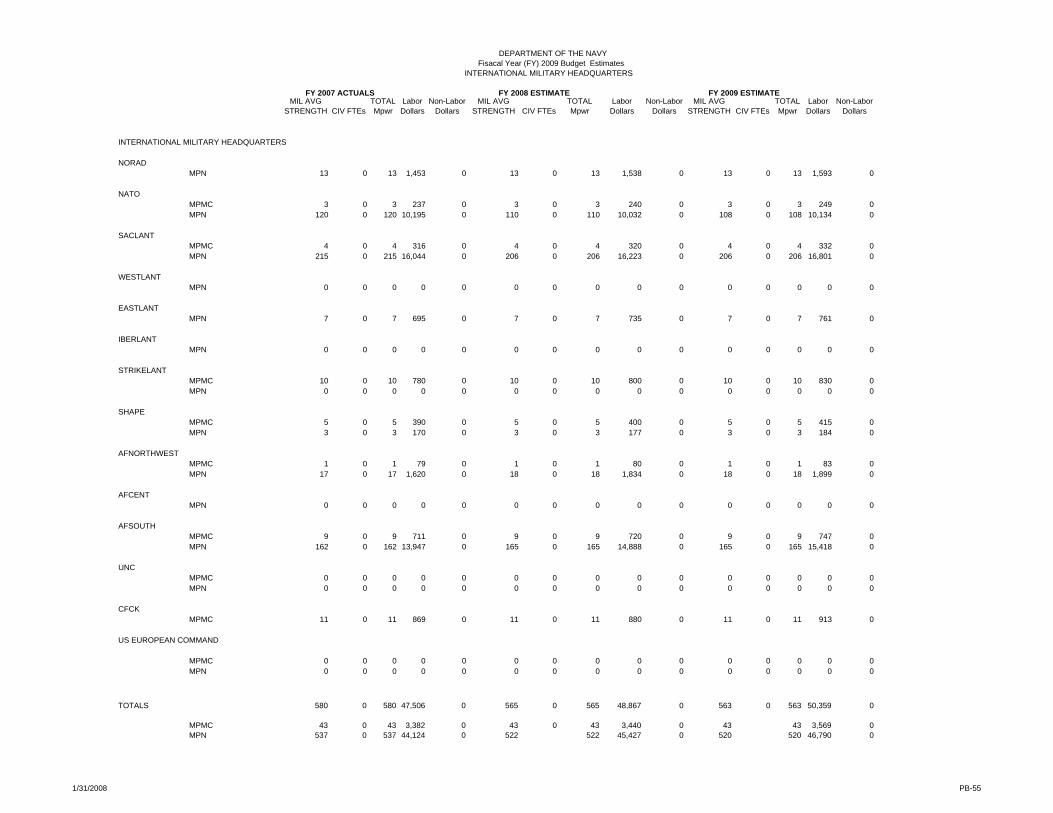
INTERNATIONAL MILITARY HEADQUARTERS
NORADMPN 13 0 13 1,453 0 13 0 13 1,538 0 13 0 13 1,593 0
NATOMPMC 3 0 3 237 0 3 0 3 240 0 3 0 3 249 0MPN 120 0 120 10,195 0 110 0 110 10,032 0 108 0 108 10,134 0
SACLANTMPMC 4 0 4 316 0 4 0 4 320 0 4 0 4 332 0MPN 215 0 215 16,044 0 206 0 206 16,223 0 206 0 206 16,801 0
WESTLANTMPN 0 0 0 0 0 0 0 0 0 0 0 0 0 0 0
EASTLANTMPN 7 0 7 695 0 7 0 7 735 0 7 0 7 761 0
IBERLANTMPN 0 0 0 0 0 0 0 0 0 0 0 0 0 0 0
STRIKELANTMPMC 10 0 10 780 0 10 0 10 800 0 10 0 10 830 0MPN 0 0 0 0 0 0 0 0 0 0 0 0 0 0 0
SHAPEMPMC 5 0 5 390 0 5 0 5 400 0 5 0 5 415 0MPN 3 0 3 170 0 3 0 3 177 0 3 0 3 184 0
AFNORTHWESTMPMC 1 0 1 79 0 1 0 1 80 0 1 0 1 83 0MPN 17 0 17 1,620 0 18 0 18 1,834 0 18 0 18 1,899 0
AFCENTMPN 0 0 0 0 0 0 0 0 0 0 0 0 0 0 0
AFSOUTHMPMC 9 0 9 711 0 9 0 9 720 0 9 0 9 747 0MPN 162 0 162 13,947 0 165 0 165 14,888 0 165 0 165 15,418 0
UNCMPMC 0 0 0 0 0 0 0 0 0 0 0 0 0 0 0MPN 0 0 0 0 0 0 0 0 0 0 0 0 0 0 0
CFCKMPMC 11 0 11 869 0 11 0 11 880 0 11 0 11 913 0
MPMC 0 0 0 0 0 0 0 0 0 0 0 0 0 0 0MPN 0 0 0 0 0 0 0 0 0 0 0 0 0 0 0
TOTALS 580 0 580 47,506 0 565 0 565 48,867 0 563 0 563 50,359 0
MPMC 43 0 43 3,382 0 43 0 43 3,440 0 43 43 3,569 0MPN 537 0 537 44,124 0 522 522 45,427 0 520 520 46,790 0
FY 2009 ESTIMATE
DEPARTMENT OF THE NAVY Fisacal Year (FY) 2009 Budget Estimates
INTERNATIONAL MILITARY HEADQUARTERS
US EUROPEAN COMMAND
FY 2007 ACTUALS FY 2008 ESTIMATE
1/31/2008 PB-55
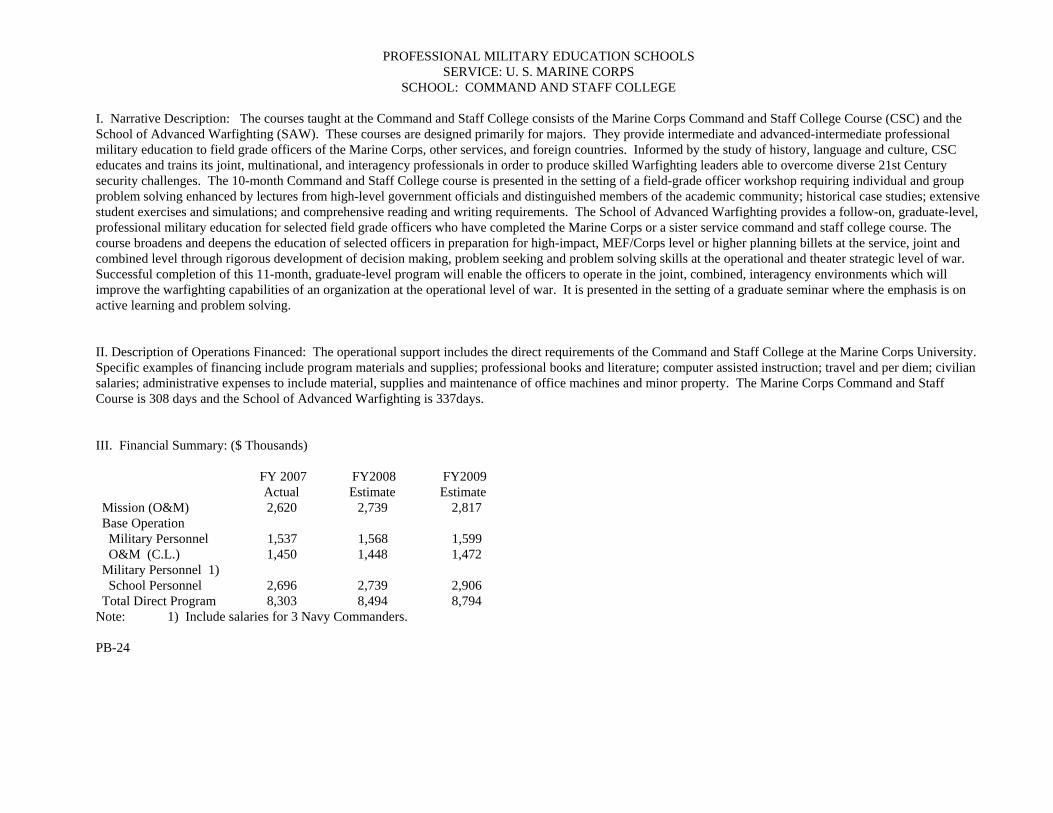
PROFESSIONAL MILITARY EDUCATION SCHOOLS SERVICE: U. S. MARINE CORPS
SCHOOL: COMMAND AND STAFF COLLEGE I. Narrative Description: The courses taught at the Command and Staff College consists of the Marine Corps Command and Staff College Course (CSC) and the School of Advanced Warfighting (SAW). These courses are designed primarily for majors. They provide intermediate and advanced-intermediate professional military education to field grade officers of the Marine Corps, other services, and foreign countries. Informed by the study of history, language and culture, CSC educates and trains its joint, multinational, and interagency professionals in order to produce skilled Warfighting leaders able to overcome diverse 21st Century security challenges. The 10-month Command and Staff College course is presented in the setting of a field-grade officer workshop requiring individual and group problem solving enhanced by lectures from high-level government officials and distinguished members of the academic community; historical case studies; extensive student exercises and simulations; and comprehensive reading and writing requirements. The School of Advanced Warfighting provides a follow-on, graduate-level, professional military education for selected field grade officers who have completed the Marine Corps or a sister service command and staff college course. The course broadens and deepens the education of selected officers in preparation for high-impact, MEF/Corps level or higher planning billets at the service, joint and combined level through rigorous development of decision making, problem seeking and problem solving skills at the operational and theater strategic level of war. Successful completion of this 11-month, graduate-level program will enable the officers to operate in the joint, combined, interagency environments which will improve the warfighting capabilities of an organization at the operational level of war. It is presented in the setting of a graduate seminar where the emphasis is on active learning and problem solving. II. Description of Operations Financed: The operational support includes the direct requirements of the Command and Staff College at the Marine Corps University. Specific examples of financing include program materials and supplies; professional books and literature; computer assisted instruction; travel and per diem; civilian salaries; administrative expenses to include material, supplies and maintenance of office machines and minor property. The Marine Corps Command and Staff Course is 308 days and the School of Advanced Warfighting is 337days. III. Financial Summary: ($ Thousands)
FY 2007
Actual FY2008 Estimate
FY2009 Estimate
Mission (O&M) 2,620 2,739 2,817 Base Operation Military Personnel 1,537 1,568 1,599 O&M (C.L.) 1,450 1,448 1,472 Military Personnel 1) School Personnel 2,696 2,739 2,906 Total Direct Program 8,303 8,494 8,794
Note: 1) Include salaries for 3 Navy Commanders. PB-24
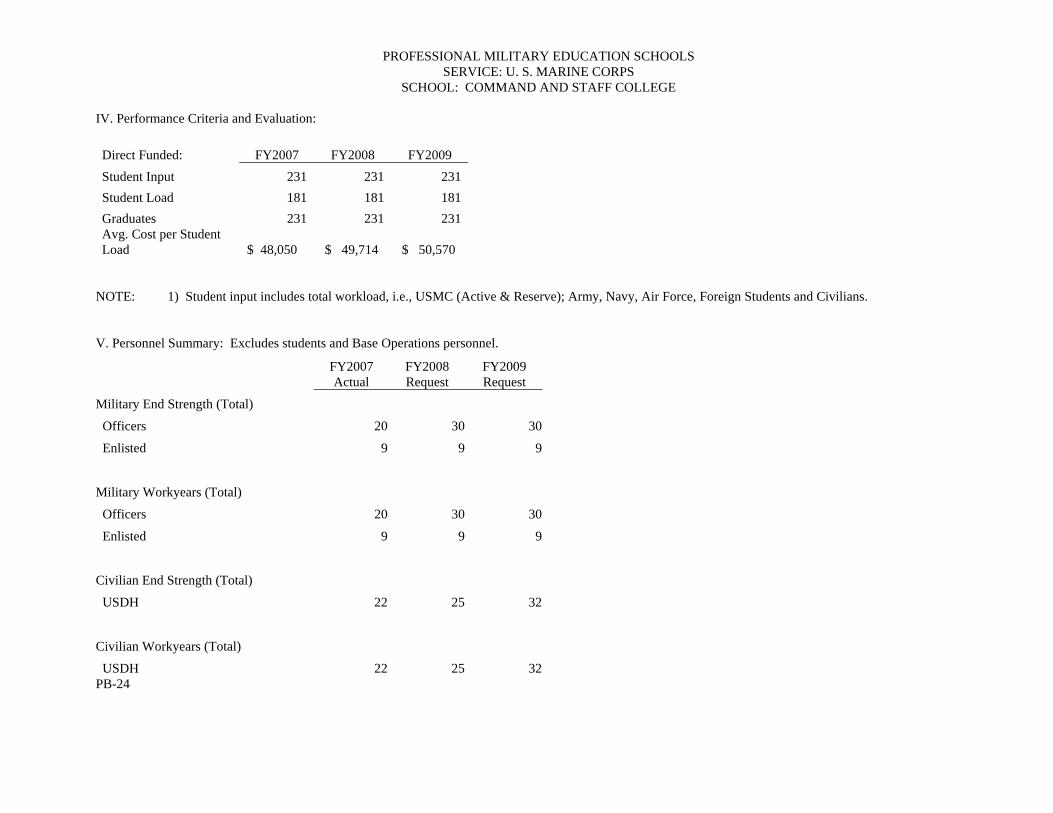
PROFESSIONAL MILITARY EDUCATION SCHOOLS SERVICE: U. S. MARINE CORPS
SCHOOL: COMMAND AND STAFF COLLEGE IV. Performance Criteria and Evaluation: Direct Funded: FY2007 FY2008 FY2009 Student Input 231 231 231 Student Load 181 181 181 Graduates 231 231 231 Avg. Cost per Student Load $ 48,050 $ 49,714 $ 50,570
NOTE: 1) Student input includes total workload, i.e., USMC (Active & Reserve); Army, Navy, Air Force, Foreign Students and Civilians.
V. Personnel Summary: Excludes students and Base Operations personnel.
FY2007 Actual
FY2008 Request
FY2009 Request
Military End Strength (Total)
Officers 20 30 30
Enlisted 9 9 9
Military Workyears (Total)
Officers 20 30 30
Enlisted 9 9 9
Civilian End Strength (Total)
USDH 22 25 32
Civilian Workyears (Total)
USDH 22 25 32PB-24
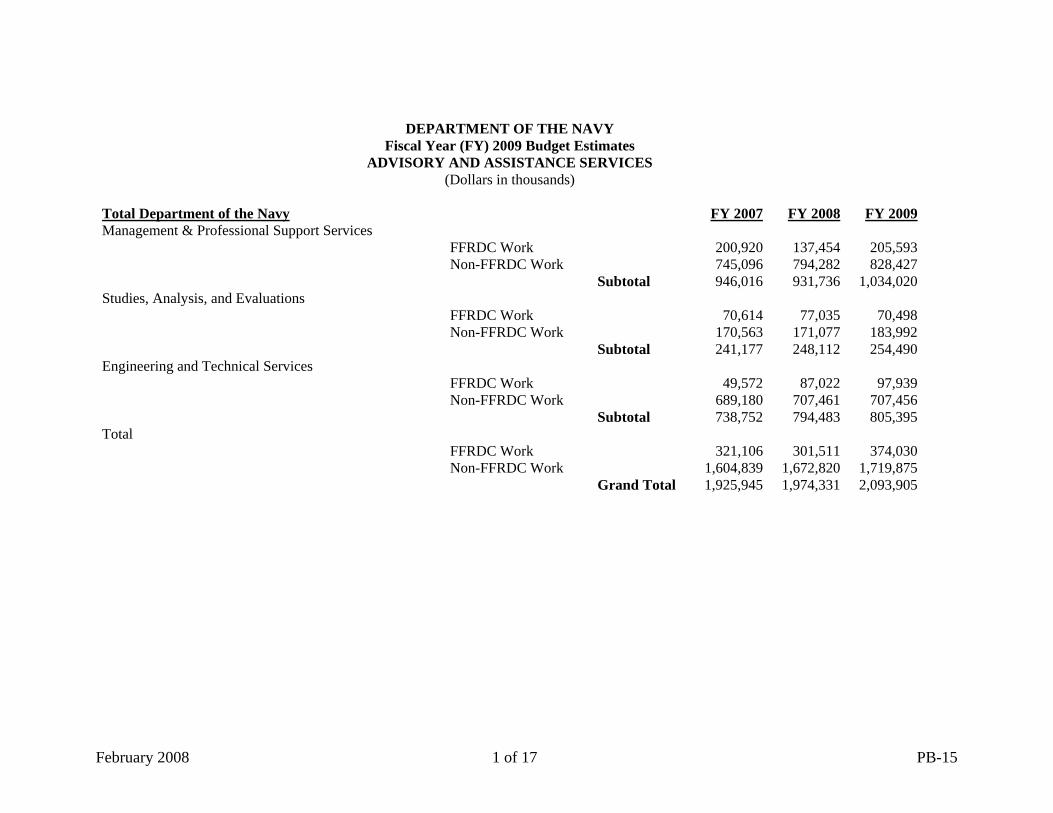
DEPARTMENT OF THE NAVY Fiscal Year (FY) 2009 Budget Estimates
ADVISORY AND ASSISTANCE SERVICES (Dollars in thousands)
Total Department of the Navy FY 2007 FY 2008 FY 2009
Management & Professional Support Services FFRDC Work 200,920 137,454 205,593 Non-FFRDC Work 745,096 794,282 828,427 Subtotal 946,016 931,736 1,034,020Studies, Analysis, and Evaluations FFRDC Work 70,614 77,035 70,498 Non-FFRDC Work 170,563 171,077 183,992 Subtotal 241,177 248,112 254,490Engineering and Technical Services FFRDC Work 49,572 87,022 97,939 Non-FFRDC Work 689,180 707,461 707,456 Subtotal 738,752 794,483 805,395Total FFRDC Work 321,106 301,511 374,030 Non-FFRDC Work 1,604,839 1,672,820 1,719,875 Grand Total 1,925,945 1,974,331 2,093,905
February 2008 1 of 17 PB-15
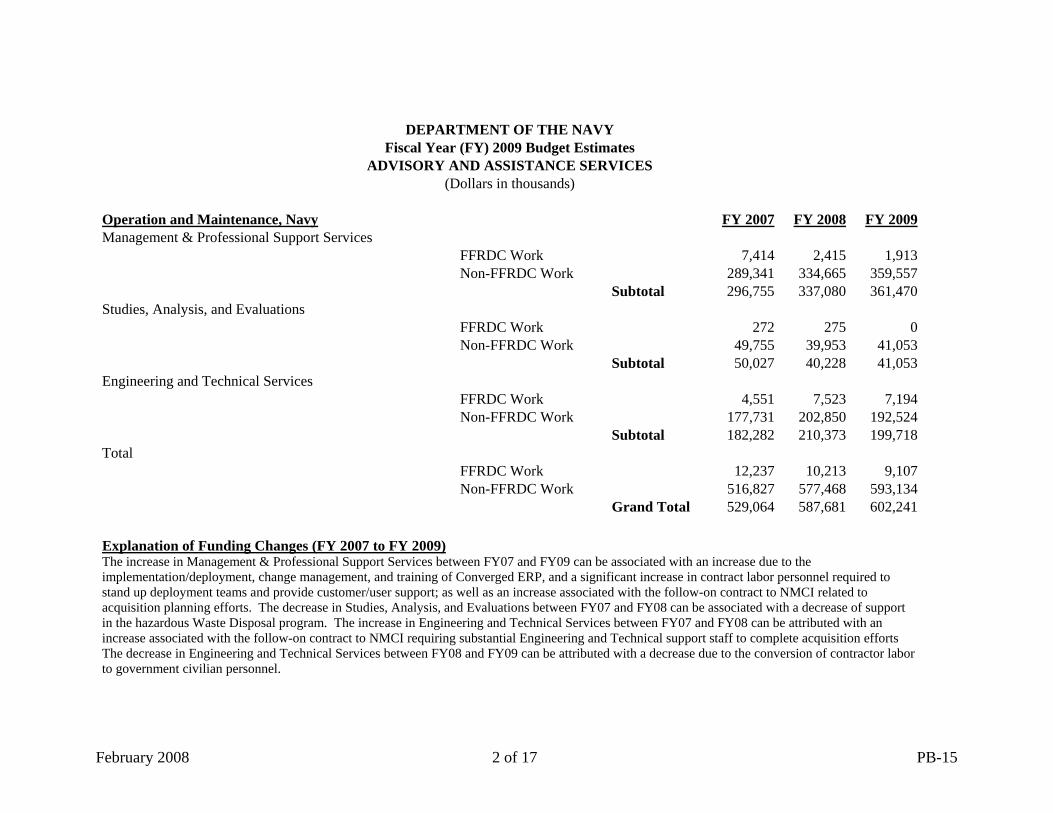
DEPARTMENT OF THE NAVY Fiscal Year (FY) 2009 Budget Estimates
ADVISORY AND ASSISTANCE SERVICES (Dollars in thousands)
Operation and Maintenance, Navy FY 2007 FY 2008 FY 2009
Management & Professional Support Services FFRDC Work 7,414 2,415 1,913 Non-FFRDC Work 289,341 334,665 359,557 Subtotal 296,755 337,080 361,470Studies, Analysis, and Evaluations FFRDC Work 272 275 0 Non-FFRDC Work 49,755 39,953 41,053 Subtotal 50,027 40,228 41,053Engineering and Technical Services FFRDC Work 4,551 7,523 7,194 Non-FFRDC Work 177,731 202,850 192,524 Subtotal 182,282 210,373 199,718Total FFRDC Work 12,237 10,213 9,107 Non-FFRDC Work 516,827 577,468 593,134 Grand Total 529,064 587,681 602,241 Explanation of Funding Changes (FY 2007 to FY 2009) The increase in Management & Professional Support Services between FY07 and FY09 can be associated with an increase due to the implementation/deployment, change management, and training of Converged ERP, and a significant increase in contract labor personnel required to stand up deployment teams and provide customer/user support; as well as an increase associated with the follow-on contract to NMCI related to acquisition planning efforts. The decrease in Studies, Analysis, and Evaluations between FY07 and FY08 can be associated with a decrease of support in the hazardous Waste Disposal program. The increase in Engineering and Technical Services between FY07 and FY08 can be attributed with an increase associated with the follow-on contract to NMCI requiring substantial Engineering and Technical support staff to complete acquisition efforts The decrease in Engineering and Technical Services between FY08 and FY09 can be attributed with a decrease due to the conversion of contractor labor to government civilian personnel.
February 2008 2 of 17 PB-15
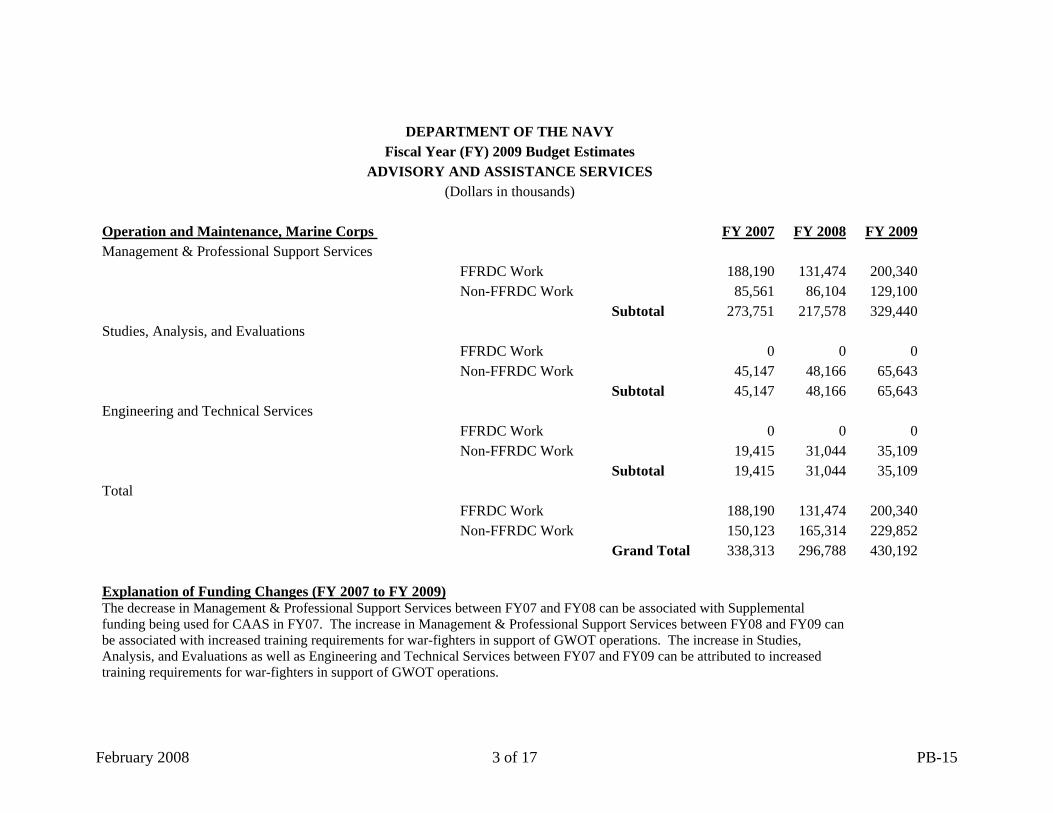
DEPARTMENT OF THE NAVY Fiscal Year (FY) 2009 Budget Estimates
ADVISORY AND ASSISTANCE SERVICES (Dollars in thousands)
Operation and Maintenance, Marine Corps FY 2007 FY 2008 FY 2009
Management & Professional Support Services FFRDC Work 188,190 131,474 200,340 Non-FFRDC Work 85,561 86,104 129,100 Subtotal 273,751 217,578 329,440Studies, Analysis, and Evaluations FFRDC Work 0 0 0 Non-FFRDC Work 45,147 48,166 65,643 Subtotal 45,147 48,166 65,643Engineering and Technical Services FFRDC Work 0 0 0 Non-FFRDC Work 19,415 31,044 35,109 Subtotal 19,415 31,044 35,109Total FFRDC Work 188,190 131,474 200,340 Non-FFRDC Work 150,123 165,314 229,852 Grand Total 338,313 296,788 430,192 Explanation of Funding Changes (FY 2007 to FY 2009) The decrease in Management & Professional Support Services between FY07 and FY08 can be associated with Supplemental funding being used for CAAS in FY07. The increase in Management & Professional Support Services between FY08 and FY09 can be associated with increased training requirements for war-fighters in support of GWOT operations. The increase in Studies, Analysis, and Evaluations as well as Engineering and Technical Services between FY07 and FY09 can be attributed to increased training requirements for war-fighters in support of GWOT operations.
February 2008 3 of 17 PB-15
DEPARTMENT OF THE NAVY Fiscal Year (FY) 2009 Budget Estimates
ADVISORY AND ASSISTANCE SERVICES (Dollars in thousands)
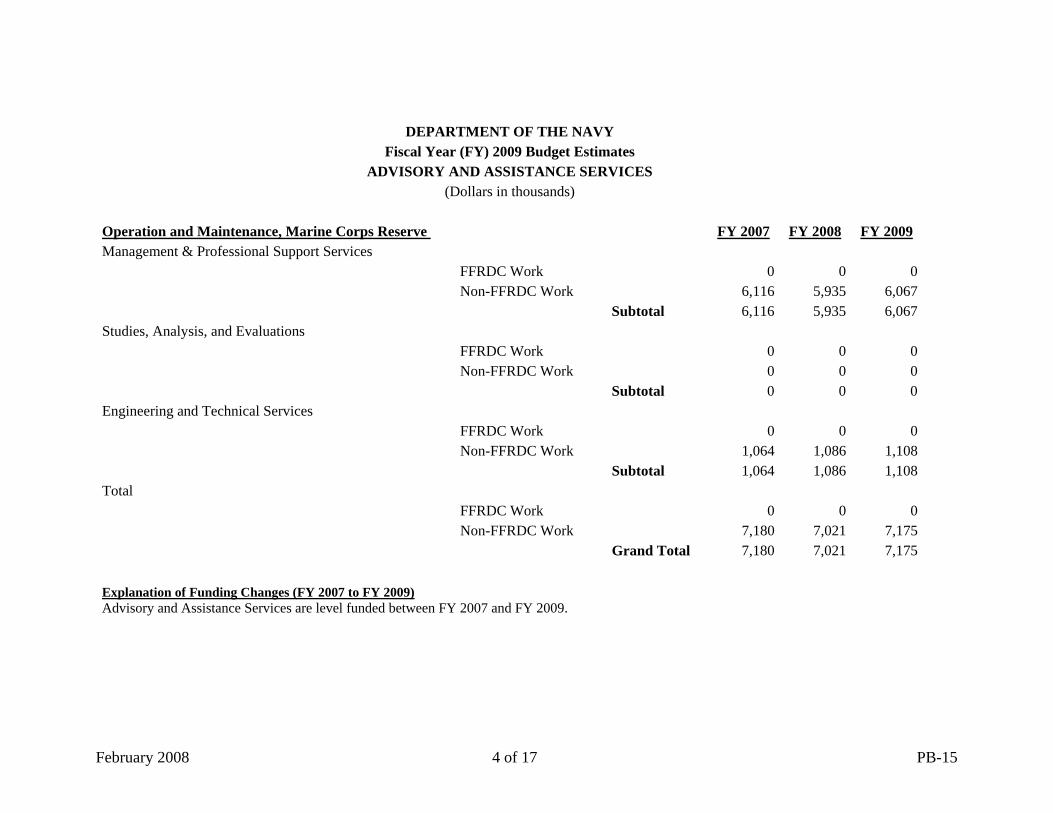
Operation and Maintenance, Marine Corps Reserve FY 2007 FY 2008 FY 2009
0 0 0
Management & Professional Support Services FFRDC Work 0 0 0 Non-FFRDC Work 6,116 5,935 6,067 Subtotal 6,116 5,935 6,067Studies, Analysis, and Evaluations FFRDC Work 0 0 0 Non-FFRDC Work 0 0 0 Subtotal Engineering and Technical Services FFRDC Work 0 0 0 Non-FFRDC Work 1,064 1,086 1,108 Subtotal 1,064 1,086 1,108Total FFRDC Work 0 0 0 Non-FFRDC Work 7,180 7,021 7,175 Grand Total 7,180 7,021 7,175 Explanation of Funding Changes (FY 2007 to FY 2009)
Advisory and Assistance Services are level funded between FY 2007 and FY 2009.
February 2008 4 of 17 PB-15
DEPARTMENT OF THE NAVY Fiscal Year (FY) 2009 Budget Estimates
ADVISORY AND ASSISTANCE SERVICES (Dollars in thousands)
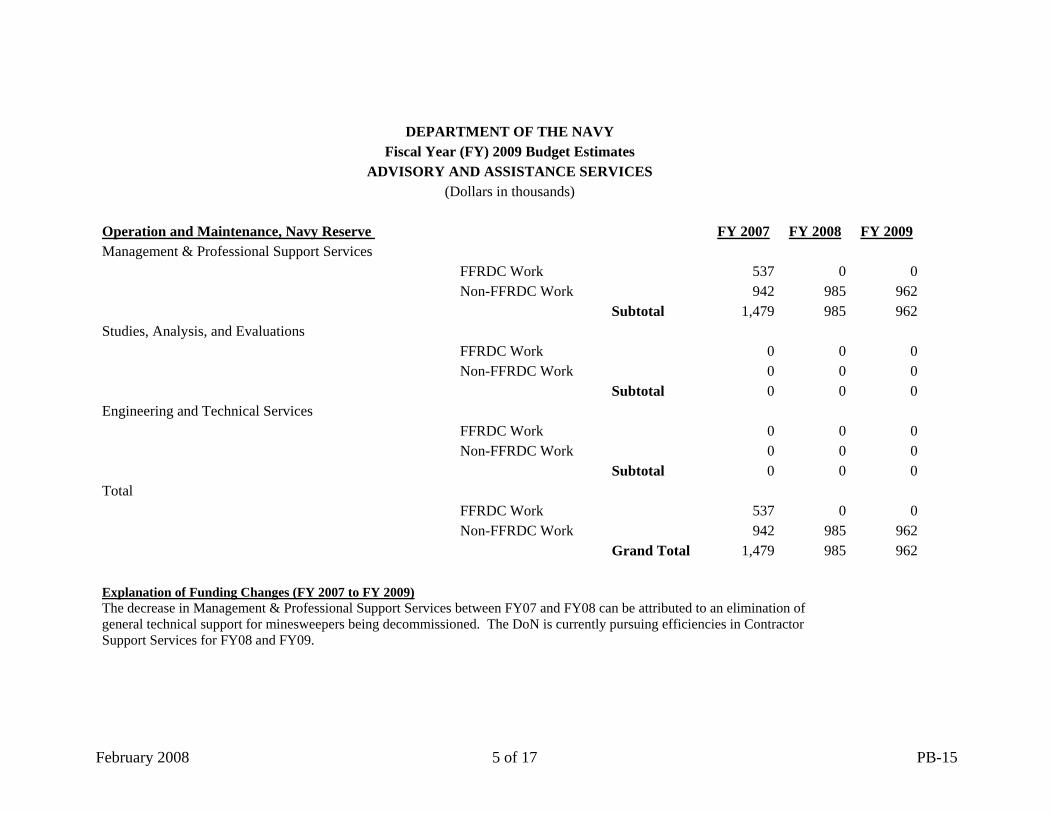
Operation and Maintenance, Navy Reserve FY 2007 FY 2008 FY 2009
0 0 0
0 0 0
Management & Professional Support Services FFRDC Work 537 0 0 Non-FFRDC Work 942 985 962 Subtotal 1,479 985 962Studies, Analysis, and Evaluations FFRDC Work 0 0 0 Non-FFRDC Work 0 0 0 Subtotal Engineering and Technical Services FFRDC Work 0 0 0 Non-FFRDC Work 0 0 0 Subtotal Total FFRDC Work 537 0 0 Non-FFRDC Work 942 985 962 Grand Total 1,479 985 962 Explanation of Funding Changes (FY 2007 to FY 2009)
The decrease in Management & Professional Support Services between FY07 and FY08 can be attributed to an elimination of general technical support for minesweepers being decommissioned. The DoN is currently pursuing efficiencies in Contractor Support Services for FY08 and FY09.
February 2008 5 of 17 PB-15
DEPARTMENT OF THE NAVY Fiscal Year (FY) 2009 Budget Estimates
ADVISORY AND ASSISTANCE SERVICES (Dollars in thousands)
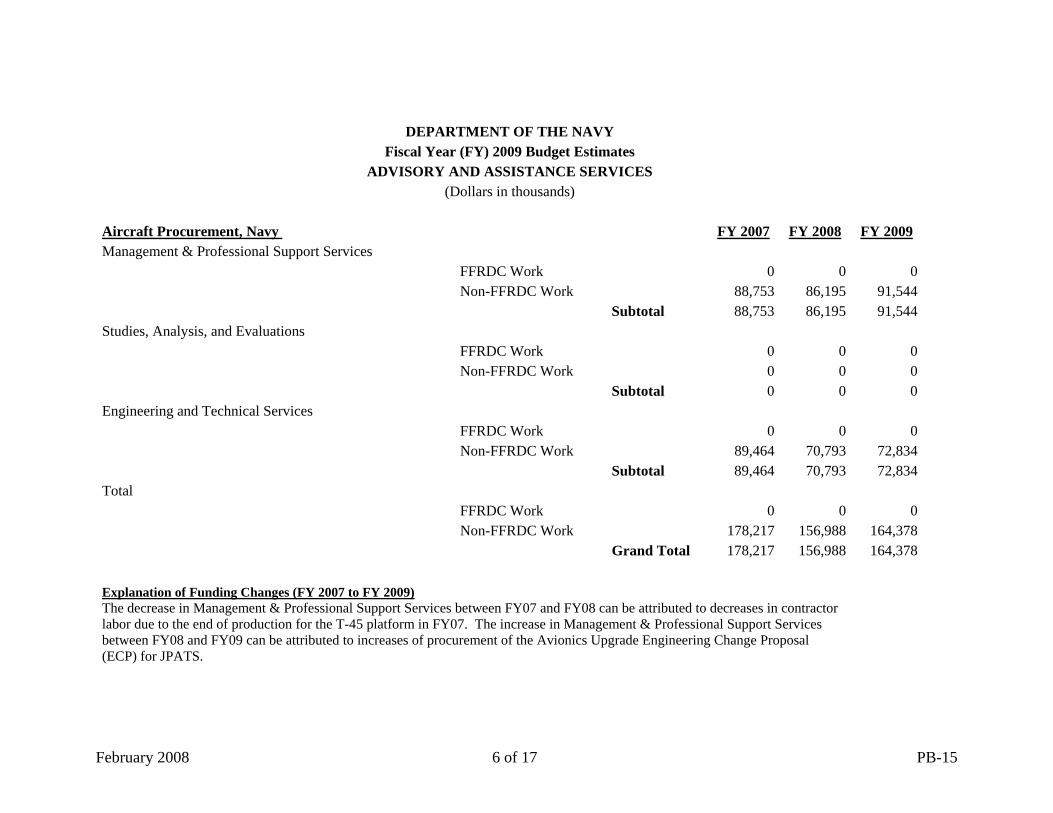
Aircraft Procurement, Navy FY 2007 FY 2008 FY 2009
0 0 0
Management & Professional Support Services FFRDC Work 0 0 0 Non-FFRDC Work 88,753 86,195 91,544 Subtotal 88,753 86,195 91,544Studies, Analysis, and Evaluations FFRDC Work 0 0 0 Non-FFRDC Work 0 0 0 Subtotal Engineering and Technical Services FFRDC Work 0 0 0 Non-FFRDC Work 89,464 70,793 72,834 Subtotal 89,464 70,793 72,834Total FFRDC Work 0 0 0 Non-FFRDC Work 178,217 156,988 164,378 Grand Total 178,217 156,988 164,378 Explanation of Funding Changes (FY 2007 to FY 2009)
The decrease in Management & Professional Support Services between FY07 and FY08 can be attributed to decreases in contractor labor due to the end of production for the T-45 platform in FY07. The increase in Management & Professional Support Services between FY08 and FY09 can be attributed to increases of procurement of the Avionics Upgrade Engineering Change Proposal (ECP) for JPATS.
February 2008 6 of 17 PB-15

DEPARTMENT OF THE NAVY Fiscal Year (FY) 2009 Budget Estimates
ADVISORY AND ASSISTANCE SERVICES (Dollars in thousands)
Weapons Procurement, Navy FY 2007 FY 2008 FY 2009
0 0 0
Management & Professional Support Services FFRDC Work 0 0 0 Non-FFRDC Work 10,213 8,555 8,668 Subtotal 10,213 8,555 8,668Studies, Analysis, and Evaluations FFRDC Work 0 0 0 Non-FFRDC Work 0 0 0 Subtotal Engineering and Technical Services FFRDC Work 0 0 0 Non-FFRDC Work 14,482 8,595 9,507 Subtotal 14,482 8,595 9,507Total FFRDC Work 0 0 0 Non-FFRDC Work 24,695 17,150 18,175 Grand Total 24,695 17,150 18,175 Explanation of Funding Changes (FY 2007 to FY 2009)
The decrease in Management & Professional Support Services between FY07 and FY08 can be attributed to increased funding in FY 2007 for analytical and technical engineering support associated with MK 698 test equipment upgrades, the automated plate test line, produce-ability and parts obsolescence issues and associated redesign efforts. The decrease in Engineering and Technical Services between FY07 and FY08 can be attributed to decreases in support for Sidewinder missile production and modification; as well as a reduction in classified program funding, which could not be identified due to its classification.
February 2008 7 of 17 PB-15
DEPARTMENT OF THE NAVY Fiscal Year (FY) 2009 Budget Estimates
ADVISORY AND ASSISTANCE SERVICES (Dollars in thousands)
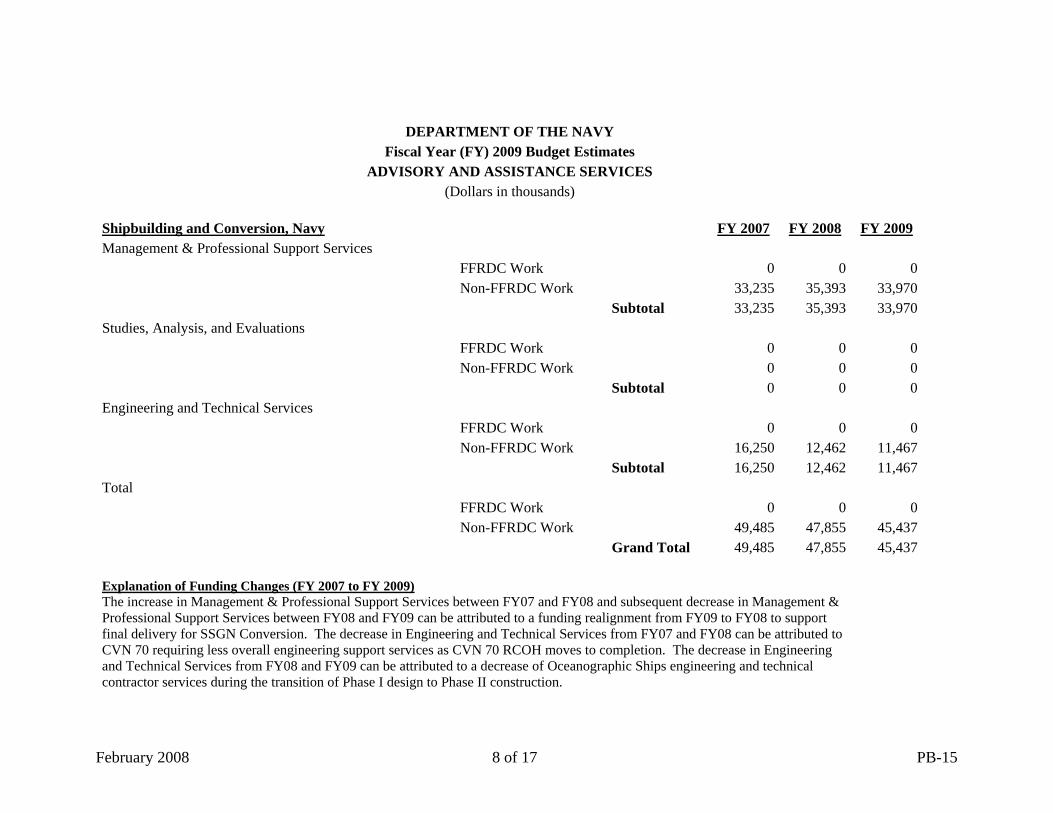
Shipbuilding and Conversion, Navy FY 2007 FY 2008 FY 2009
0 0 0
Management & Professional Support Services FFRDC Work 0 0 0 Non-FFRDC Work 33,235 35,393 33,970 Subtotal 33,235 35,393 33,970Studies, Analysis, and Evaluations FFRDC Work 0 0 0 Non-FFRDC Work 0 0 0 Subtotal Engineering and Technical Services FFRDC Work 0 0 0 Non-FFRDC Work 16,250 12,462 11,467 Subtotal 16,250 12,462 11,467Total FFRDC Work 0 0 0 Non-FFRDC Work 49,485 47,855 45,437 Grand Total 49,485 47,855 45,437 Explanation of Funding Changes (FY 2007 to FY 2009)
The increase in Management & Professional Support Services between FY07 and FY08 and subsequent decrease in Management & Professional Support Services between FY08 and FY09 can be attributed to a funding realignment from FY09 to FY08 to support final delivery for SSGN Conversion. The decrease in Engineering and Technical Services from FY07 and FY08 can be attributed to CVN 70 requiring less overall engineering support services as CVN 70 RCOH moves to completion. The decrease in Engineering and Technical Services from FY08 and FY09 can be attributed to a decrease of Oceanographic Ships engineering and technical contractor services during the transition of Phase I design to Phase II construction.
February 2008 8 of 17 PB-15
DEPARTMENT OF THE NAVY Fiscal Year (FY) 2009 Budget Estimates
ADVISORY AND ASSISTANCE SERVICES (Dollars in thousands)
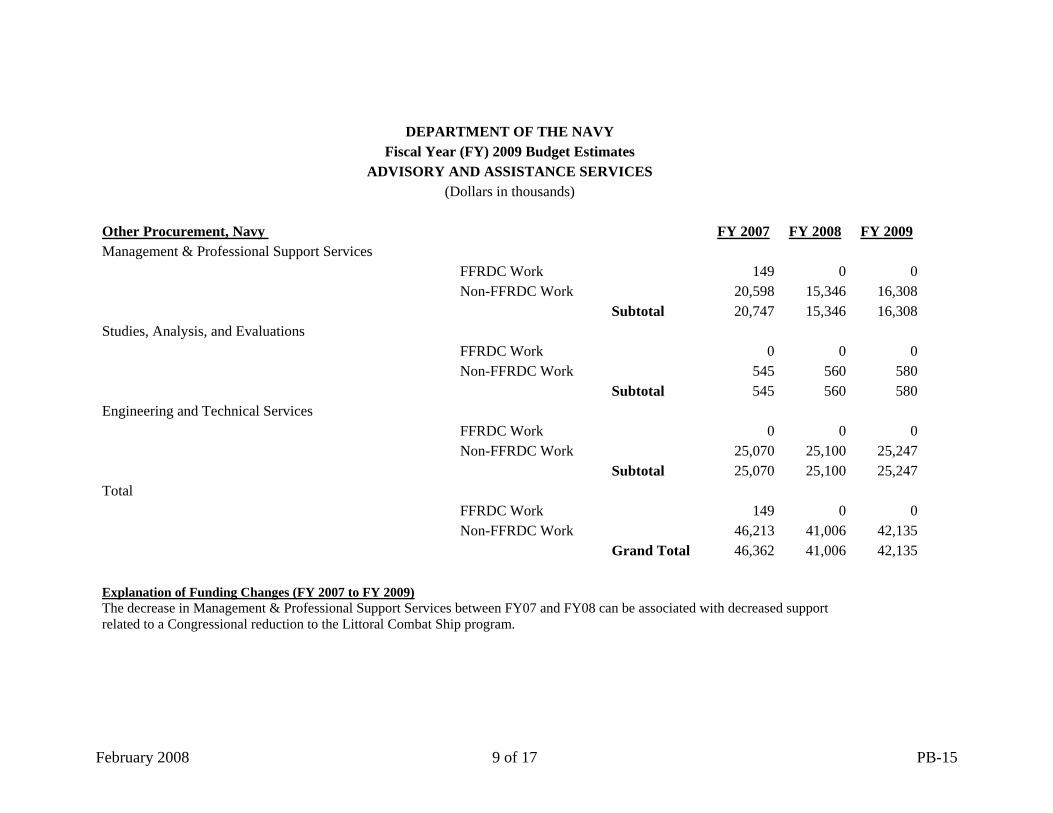
Other Procurement, Navy FY 2007 FY 2008 FY 2009
Management & Professional Support Services FFRDC Work 149 0 0 Non-FFRDC Work 20,598 15,346 16,308 Subtotal 20,747 15,346 16,308Studies, Analysis, and Evaluations FFRDC Work 0 0 0 Non-FFRDC Work 545 560 580 Subtotal 545 560 580Engineering and Technical Services FFRDC Work 0 0 0 Non-FFRDC Work 25,070 25,100 25,247 Subtotal 25,070 25,100 25,247Total FFRDC Work 149 0 0 Non-FFRDC Work 46,213 41,006 42,135 Grand Total 46,362 41,006 42,135 Explanation of Funding Changes (FY 2007 to FY 2009)
The decrease in Management & Professional Support Services between FY07 and FY08 can be associated with decreased support related to a Congressional reduction to the Littoral Combat Ship program.
February 2008 9 of 17 PB-15
DEPARTMENT OF THE NAVY Fiscal Year (FY) 2009 Budget Estimates
ADVISORY AND ASSISTANCE SERVICES (Dollars in thousands)
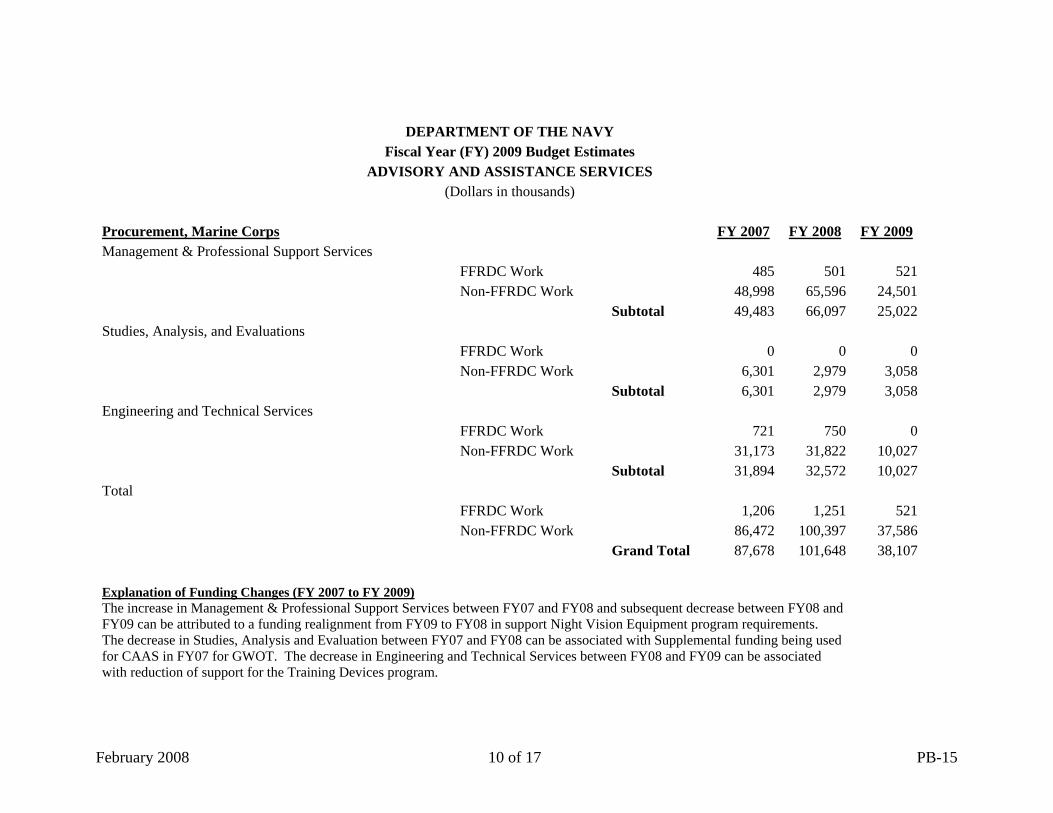
Procurement, Marine Corps FY 2007 FY 2008 FY 2009
Management & Professional Support Services FFRDC Work 485 501 521 Non-FFRDC Work 48,998 65,596 24,501 Subtotal 49,483 66,097 25,022Studies, Analysis, and Evaluations FFRDC Work 0 0 0 Non-FFRDC Work 6,301 2,979 3,058 Subtotal 6,301 2,979 3,058Engineering and Technical Services FFRDC Work 721 750 0 Non-FFRDC Work 31,173 31,822 10,027 Subtotal 31,894 32,572 10,027Total FFRDC Work 1,206 1,251 521 Non-FFRDC Work 86,472 100,397 37,586 Grand Total 87,678 101,648 38,107 Explanation of Funding Changes (FY 2007 to FY 2009)
The increase in Management & Professional Support Services between FY07 and FY08 and subsequent decrease between FY08 and FY09 can be attributed to a funding realignment from FY09 to FY08 in support Night Vision Equipment program requirements. The decrease in Studies, Analysis and Evaluation between FY07 and FY08 can be associated with Supplemental funding being used for CAAS in FY07 for GWOT. The decrease in Engineering and Technical Services between FY08 and FY09 can be associated with reduction of support for the Training Devices program.
February 2008 10 of 17 PB-15
DEPARTMENT OF THE NAVY Fiscal Year (FY) 2009 Budget Estimates
ADVISORY AND ASSISTANCE SERVICES (Dollars in thousands)
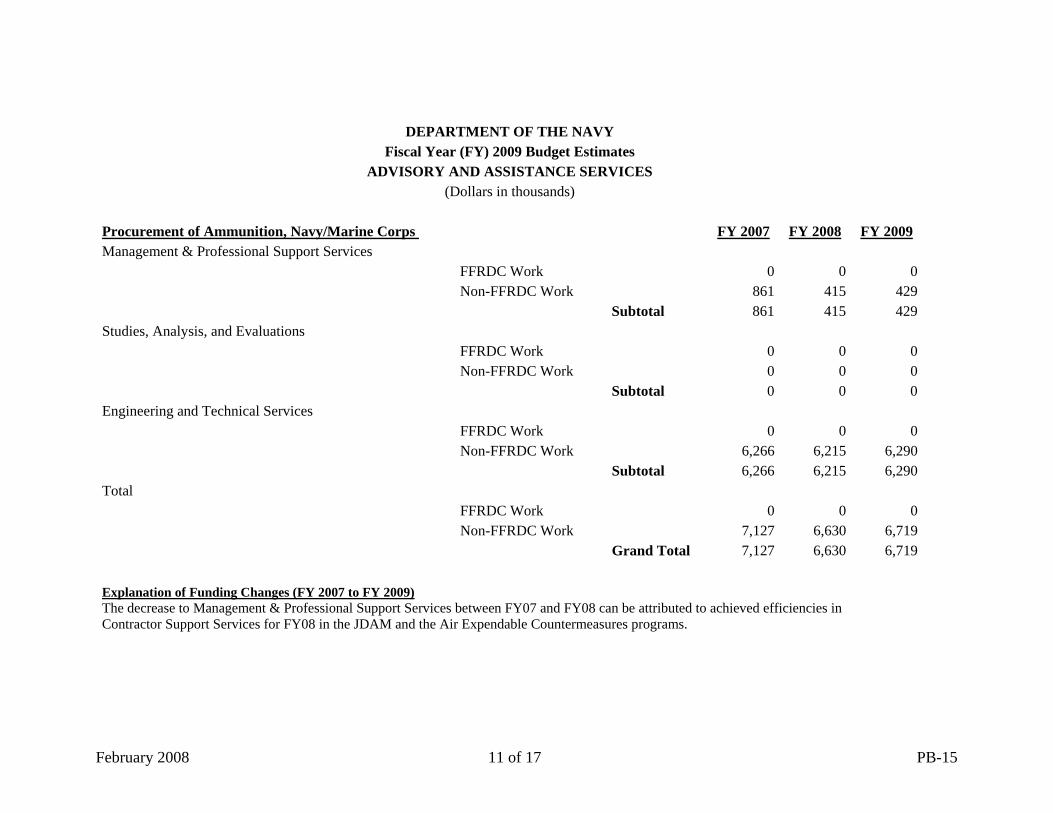
Procurement of Ammunition, Navy/Marine Corps FY 2007 FY 2008 FY 2009
0 0 0
Management & Professional Support Services FFRDC Work 0 0 0 Non-FFRDC Work 861 415 429 Subtotal 861 415 429Studies, Analysis, and Evaluations FFRDC Work 0 0 0 Non-FFRDC Work 0 0 0 Subtotal Engineering and Technical Services FFRDC Work 0 0 0 Non-FFRDC Work 6,266 6,215 6,290 Subtotal 6,266 6,215 6,290Total FFRDC Work 0 0 0 Non-FFRDC Work 7,127 6,630 6,719 Grand Total 7,127 6,630 6,719 Explanation of Funding Changes (FY 2007 to FY 2009)
The decrease to Management & Professional Support Services between FY07 and FY08 can be attributed to achieved efficiencies in Contractor Support Services for FY08 in the JDAM and the Air Expendable Countermeasures programs.
February 2008 11 of 17 PB-15
DEPARTMENT OF THE NAVY Fiscal Year (FY) 2009 Budget Estimates
ADVISORY AND ASSISTANCE SERVICES (Dollars in thousands)
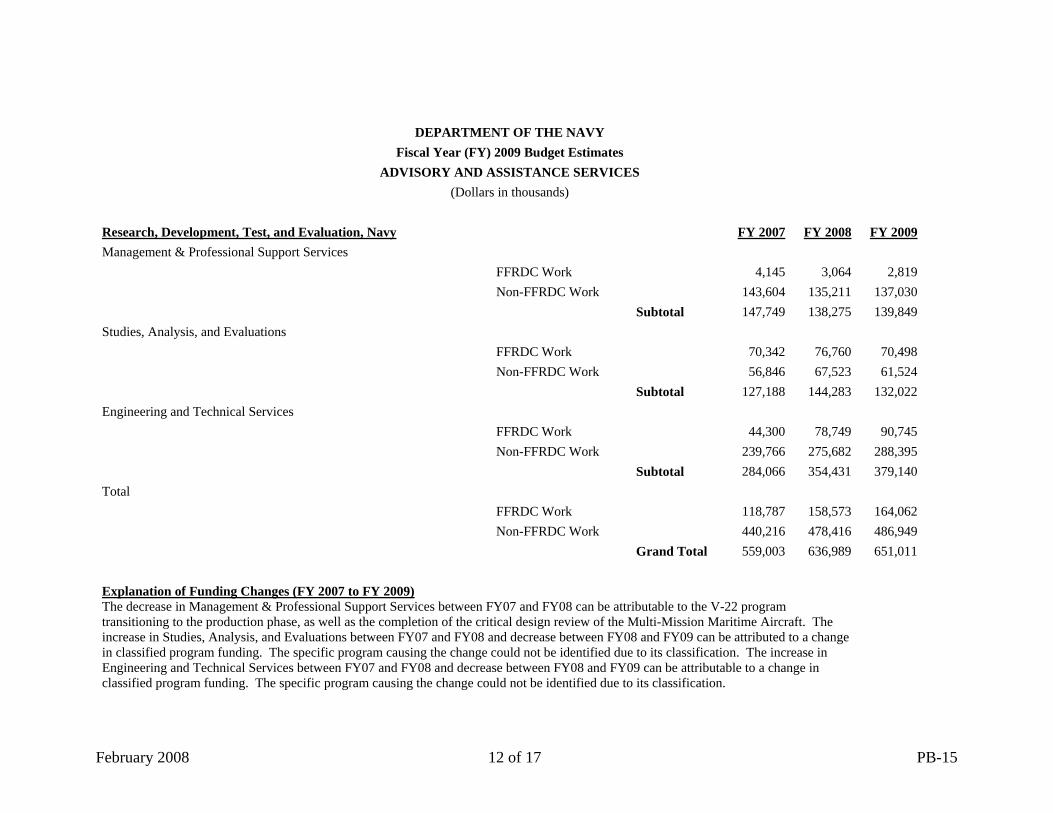
Research, Development, Test, and Evaluation, Navy FY 2007 FY 2008 FY 2009
Management & Professional Support Services FFRDC Work 4,145 3,064 2,819 Non-FFRDC Work 143,604 135,211 137,030 Subtotal 147,749 138,275 139,849 Studies, Analysis, and Evaluations FFRDC Work 70,342 76,760 70,498 Non-FFRDC Work 56,846 67,523 61,524 Subtotal 127,188 144,283 132,022 Engineering and Technical Services FFRDC Work 44,300 78,749 90,745 Non-FFRDC Work 239,766 275,682 288,395 Subtotal 284,066 354,431 379,140 Total FFRDC Work 118,787 158,573 164,062 Non-FFRDC Work 440,216 478,416 486,949 Grand Total 559,003 636,989 651,011 Explanation of Funding Changes (FY 2007 to FY 2009)
The decrease in Management & Professional Support Services between FY07 and FY08 can be attributable to the V-22 program transitioning to the production phase, as well as the completion of the critical design review of the Multi-Mission Maritime Aircraft. The increase in Studies, Analysis, and Evaluations between FY07 and FY08 and decrease between FY08 and FY09 can be attributed to a change in classified program funding. The specific program causing the change could not be identified due to its classification. The increase in Engineering and Technical Services between FY07 and FY08 and decrease between FY08 and FY09 can be attributable to a change in classified program funding. The specific program causing the change could not be identified due to its classification.
February 2008 12 of 17 PB-15
DEPARTMENT OF THE NAVY Fiscal Year (FY) 2009 Budget Estimates
ADVISORY AND ASSISTANCE SERVICES (Dollars in thousands)
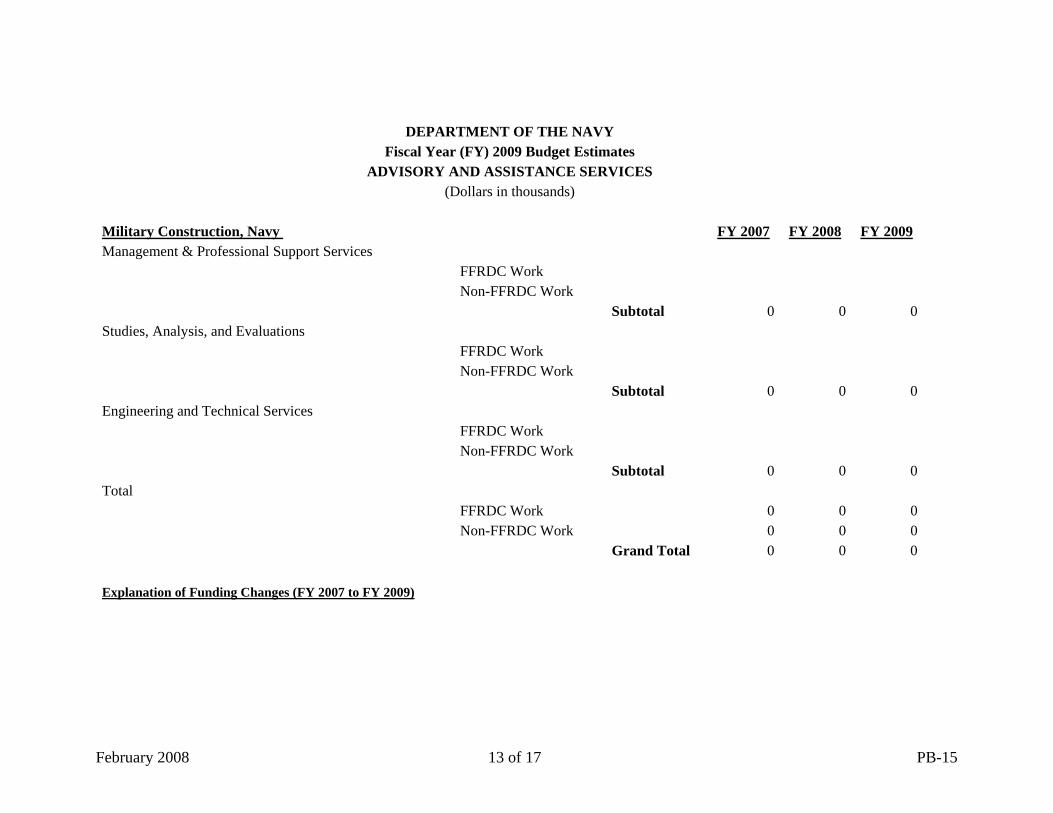
Military Construction, Navy FY 2007 FY 2008 FY 2009
0 0 0
0 0 0
0 0 0
0 0 0
Management & Professional Support Services FFRDC Work Non-FFRDC Work Subtotal Studies, Analysis, and Evaluations FFRDC Work Non-FFRDC Work Subtotal Engineering and Technical Services FFRDC Work Non-FFRDC Work Subtotal Total FFRDC Work 0 0 0 Non-FFRDC Work 0 0 0 Grand Total Explanation of Funding Changes (FY 2007 to FY 2009)
February 2008 13 of 17 PB-15
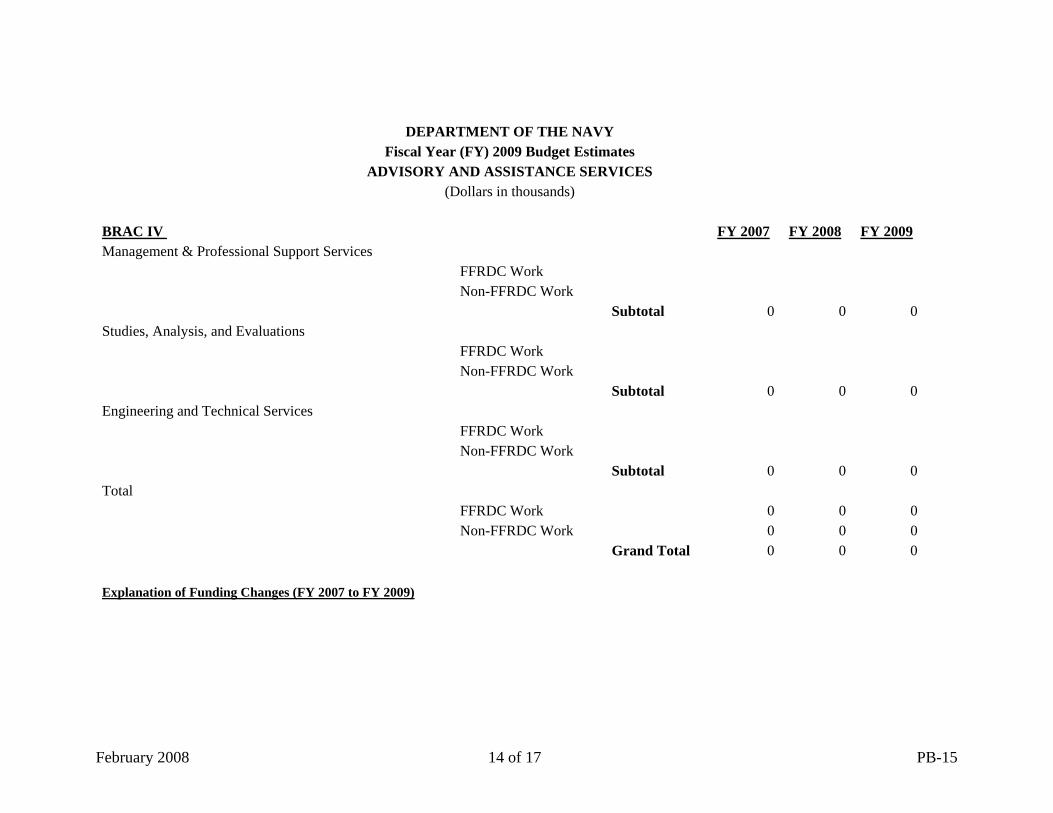
DEPARTMENT OF THE NAVY Fiscal Year (FY) 2009 Budget Estimates
ADVISORY AND ASSISTANCE SERVICES (Dollars in thousands)
BRAC IV FY 2007 FY 2008 FY 2009
0 0 0
0 0 0
0 0 0
0 0 0
Management & Professional Support Services FFRDC Work Non-FFRDC Work Subtotal Studies, Analysis, and Evaluations FFRDC Work Non-FFRDC Work Subtotal Engineering and Technical Services FFRDC Work Non-FFRDC Work Subtotal Total FFRDC Work 0 0 0 Non-FFRDC Work 0 0 0 Grand Total Explanation of Funding Changes (FY 2007 to FY 2009)
February 2008 14 of 17 PB-15
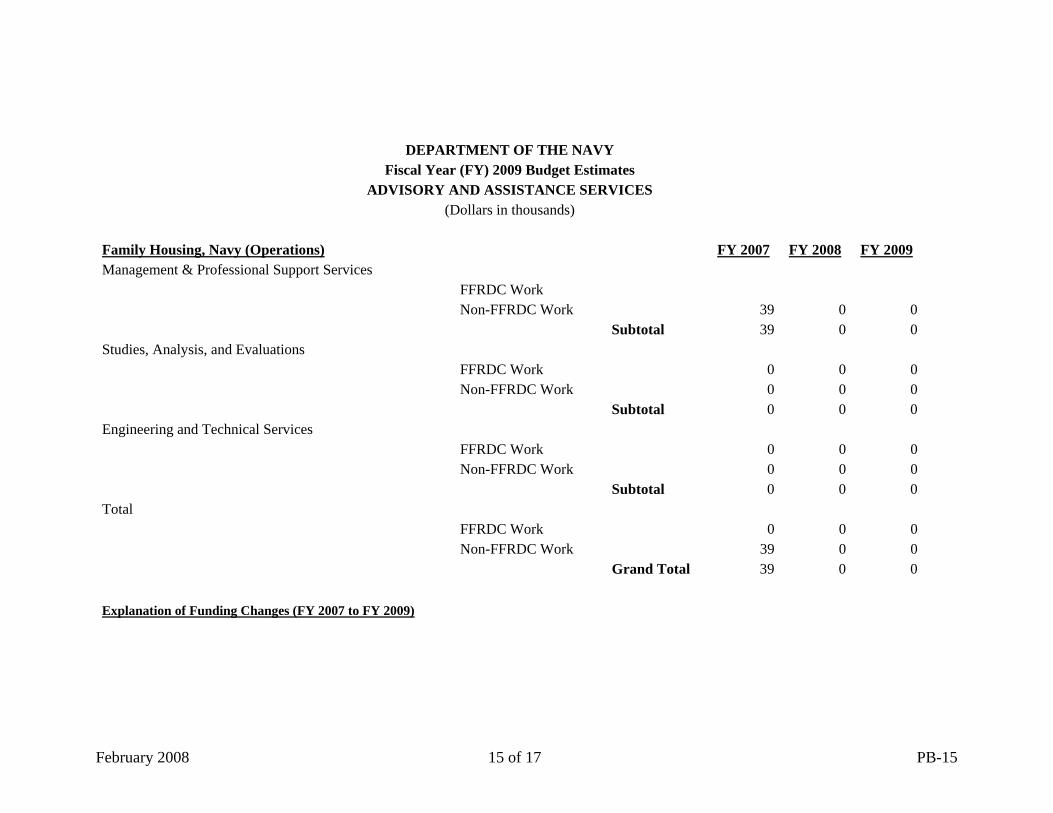
DEPARTMENT OF THE NAVY
Fiscal Year (FY) 2009 Budget Estimates ADVISORY AND ASSISTANCE SERVICES
(Dollars in thousands) Family Housing, Navy (Operations) FY 2007 FY 2008 FY 2009
39 0 0
0 0 0
0 0 0
39 0 0
Management & Professional Support Services FFRDC Work Non-FFRDC Work 39 0 0 Subtotal Studies, Analysis, and Evaluations FFRDC Work 0 0 0 Non-FFRDC Work 0 0 0 Subtotal Engineering and Technical Services FFRDC Work 0 0 0 Non-FFRDC Work 0 0 0 Subtotal Total FFRDC Work 0 0 0 Non-FFRDC Work 39 0 0 Grand Total Explanation of Funding Changes (FY 2007 to FY 2009)
February 2008 15 of 17 PB-15
DEPARTMENT OF THE NAVY Fiscal Year (FY) 2009 Budget Estimates
ADVISORY AND ASSISTANCE SERVICES (Dollars in thousands)
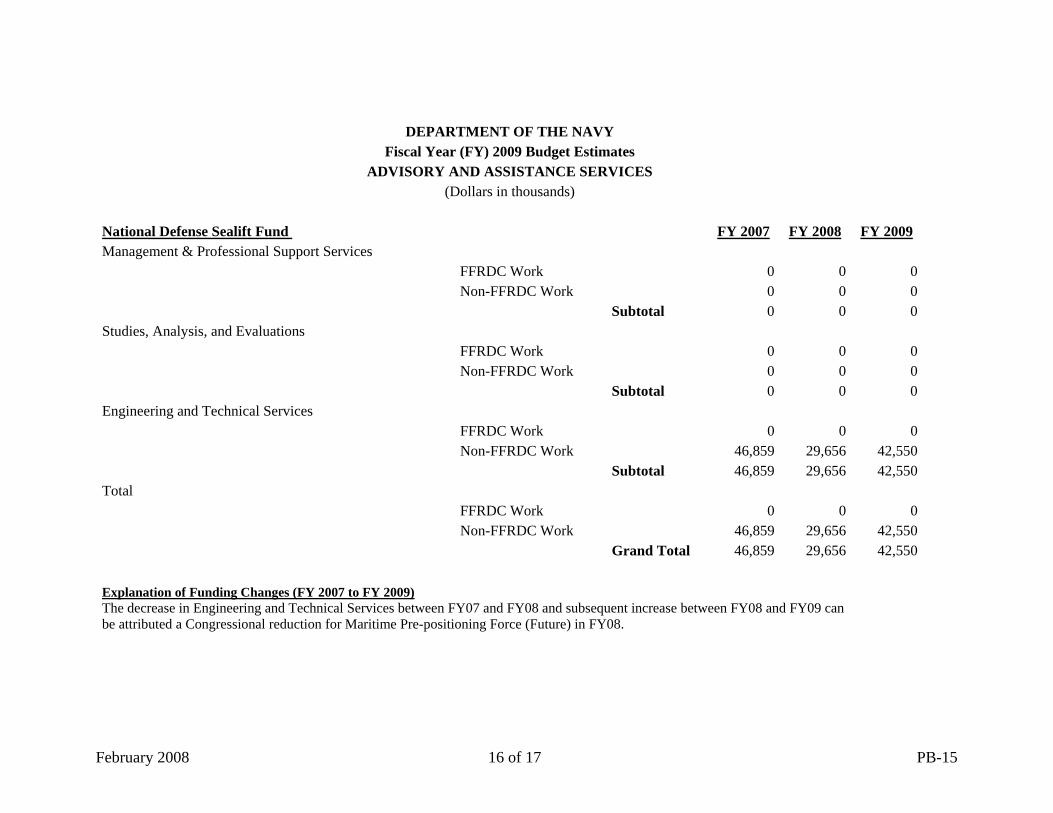
National Defense Sealift Fund FY 2007 FY 2008 FY 2009
0 0 0
0 0 0
Management & Professional Support Services FFRDC Work 0 0 0 Non-FFRDC Work 0 0 0 Subtotal Studies, Analysis, and Evaluations FFRDC Work 0 0 0 Non-FFRDC Work 0 0 0 Subtotal Engineering and Technical Services FFRDC Work 0 0 0 Non-FFRDC Work 46,859 29,656 42,550 Subtotal 46,859 29,656 42,550Total FFRDC Work 0 0 0 Non-FFRDC Work 46,859 29,656 42,550 Grand Total 46,859 29,656 42,550 Explanation of Funding Changes (FY 2007 to FY 2009)
The decrease in Engineering and Technical Services between FY07 and FY08 and subsequent increase between FY08 and FY09 can be attributed a Congressional reduction for Maritime Pre-positioning Force (Future) in FY08.
February 2008 16 of 17 PB-15
DEPARTMENT OF THE NAVY Fiscal Year (FY) 2009 Budget Estimates
ADVISORY AND ASSISTANCE SERVICES (Dollars in thousands)
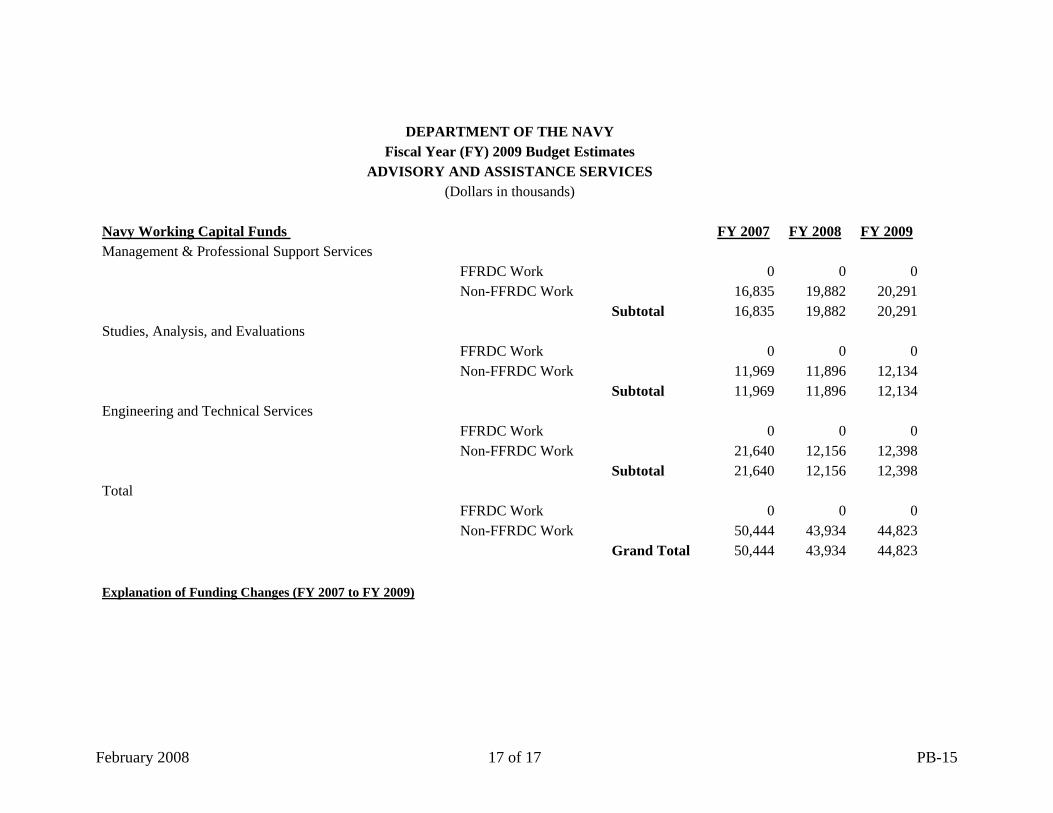
Navy Working Capital Funds FY 2007 FY 2008 FY 2009
Management & Professional Support Services FFRDC Work 0 0 0 Non-FFRDC Work 16,835 19,882 20,291 Subtotal 16,835 19,882 20,291Studies, Analysis, and Evaluations FFRDC Work 0 0 0 Non-FFRDC Work 11,969 11,896 12,134 Subtotal 11,969 11,896 12,134Engineering and Technical Services FFRDC Work 0 0 0 Non-FFRDC Work 21,640 12,156 12,398 Subtotal 21,640 12,156 12,398Total FFRDC Work 0 0 0 Non-FFRDC Work 50,444 43,934 44,823 Grand Total 50,444 43,934 44,823 Explanation of Funding Changes (FY 2007 to FY 2009)
February 2008 17 of 17 PB-15
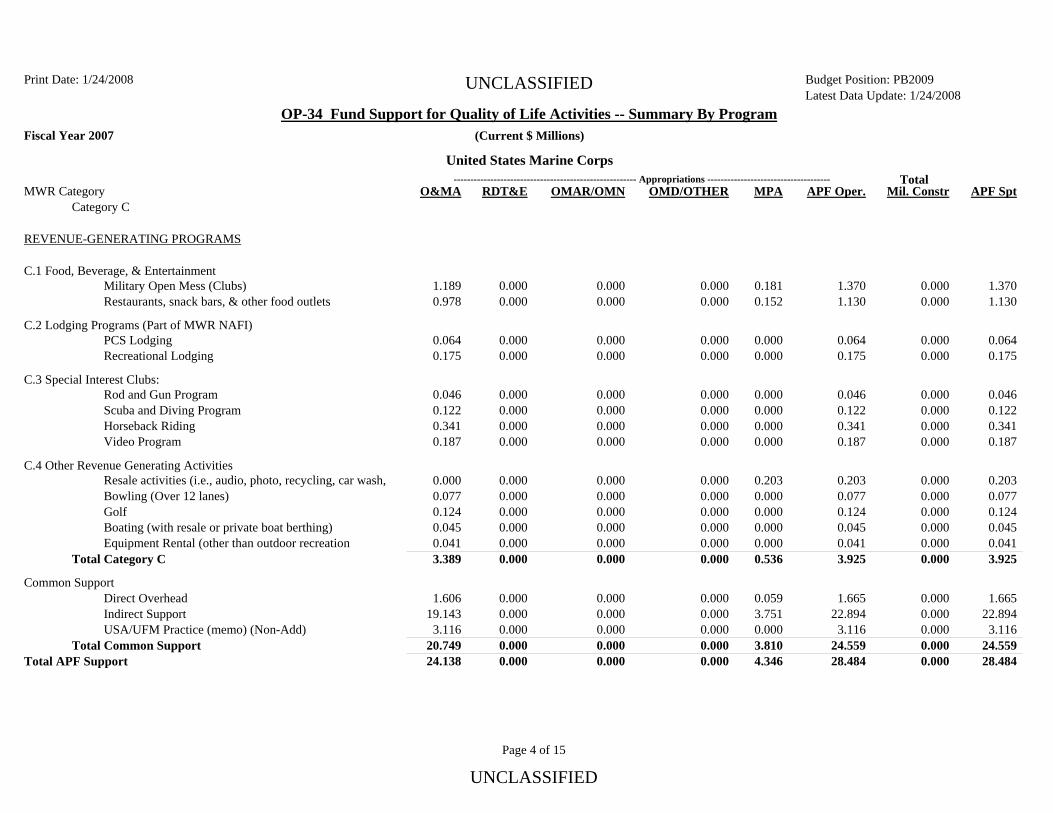
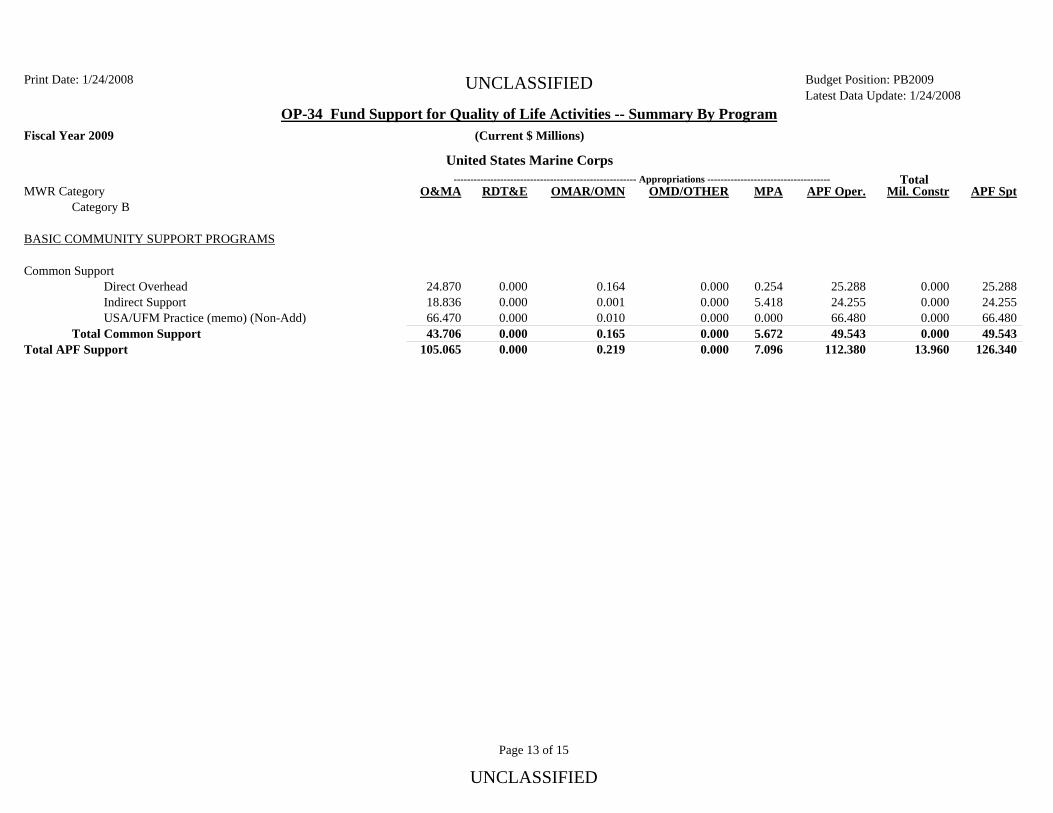
Print Date: 1/24/2008 UNCLASSIFIED Latest Data Update: 1/24/2008Budget Position: PB2009
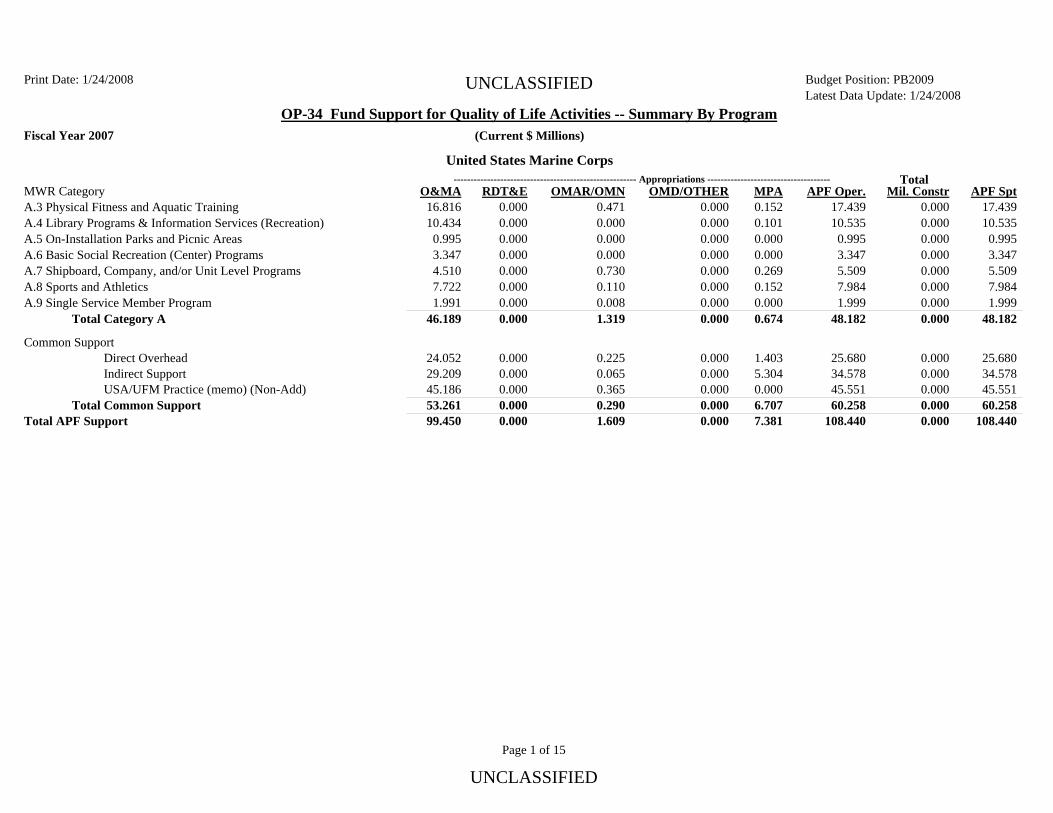
OP-34 Fund Support for Quality of Life Activities -- Summary By Program Fiscal Year 2007 (Current $ Millions)
United States Marine Corps
Mil. ConstrTotal
0.000 0.000 0.000 0.000 0.000 0.000 0.000 0.000
APF Spt 17.439 10.535 0.995 3.347 5.509 7.984 1.999
48.182
O&MA 16.816 10.434 0.995 3.347 4.510 7.722 1.991
46.189
RDT&E OMAR/OMN OMD/OTHER 0.000 0.000 0.000 0.000 0.000 0.000 0.000 0.000
0.471 0.000 0.000 0.000 0.730 0.110 0.008 1.319
0.000 0.000 0.000 0.000 0.000 0.000 0.000 0.000
MPA APF O 0.152 0.101 0.000 0.000 0.269 0.152 0.000 0.674
per. 17.439 10.535 0.995 3.347 5.509 7.984 1.999
48.182
------------------------------------------------------- Appropriations -------------------------------------MWR Category A.3 Physical Fitness and Aquatic Training A.4 Library Programs & Information Services (Recreation) A.5 On-Installation Parks and Picnic Areas A.6 Basic Social Recreation (Center) Programs A.7 Shipboard, Company, and/or Unit Level Programs A.8 Sports and Athletics A.9 Single Service Member Program
Total Category A Common Support
Direct Overhead Indirect Support USA/UFM Practice (memo) (Non-Add)
Total Common Support Total APF Support
25.680 34.578 45.551 60.258
108.440
0.000 0.000 0.000 0.000 0.000
25.680 34.578 45.551 60.258
108.440
1.403 5.304 0.000 6.707 7.381
0.000 0.000 0.000 0.000 0.000
0.225 0.065 0.365 0.290 1.609
0.000 0.000 0.000 0.000 0.000
24.052 29.209 45.186 53.261 99.450
Page 1 of 15
UNCLASSIFIED
Print Date: 1/24/2008 UNCLASSIFIED Latest Data Update: 1/24/2008Budget Position: PB2009
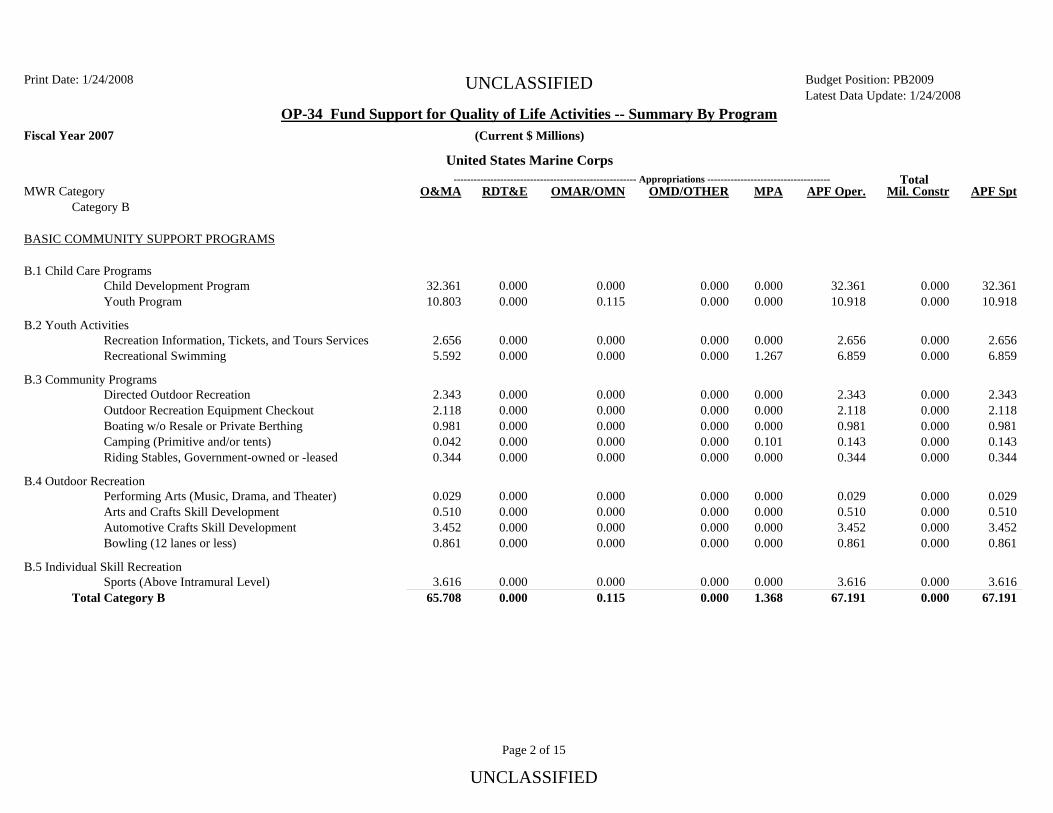
OP-34 Fund Support for Quality of Life Activities -- Summary By Program Fiscal Year 2007 (Current $ Millions)
United States Marine Corps
Mil. ConstrTotal
O&MA RDT&E OMAR/OMN OMD/OTHER MPA APF O------------------------------------------------------- Appropriations -------------------------------------
per.MWR Category Category B
APF Spt
BASIC COMMUNITY SUPPORT PROGRAMS
B.1 Child Care Programs Child Development Program Youth Program
0.000 0.115
32.361 10.918
32.361 10.803
0.000 0.000
0.000 0.000
0.000 0.000
32.361 10.918
0.000 0.000
B.2 Youth Activities Recreation Information, Tickets, and Tours ServicesRecreational Swimming
0.000 0.000
2.656 6.859
2.656 5.592
0.000 0.000
0.000 0.000
0.000 1.267
2.656 6.859
0.000 0.000
B.3 Community Programs Directed Outdoor Recreation Outdoor Recreation Equipment Checkout Boating w/o Resale or Private Berthing Camping (Primitive and/or tents) Riding Stables, Government-owned or -leased
0.000 0.000 0.000 0.000 0.000
2.343 2.118 0.981 0.143 0.344
2.343 2.118 0.981 0.042 0.344
0.000 0.000 0.000 0.000 0.000
0.000 0.000 0.000 0.000 0.000
0.000 0.000 0.000 0.101 0.000
2.343 2.118 0.981 0.143 0.344
0.000 0.000 0.000 0.000 0.000
B.4 Outdoor Recreation Performing Arts (Music, Drama, and Theater)Arts and Crafts Skill Development Automotive Crafts Skill Development Bowling (12 lanes or less)
0.000 0.000 0.000 0.000
0.029 0.510 3.452 0.861
0.029 0.510 3.452 0.861
0.000 0.000 0.000 0.000
0.000 0.000 0.000 0.000
0.000 0.000 0.000 0.000
0.029 0.510 3.452 0.861
0.000 0.000 0.000 0.000
B.5 Individual Skill Recreation Sports (Above Intramural Level)
Total Category B 3.616
67.191 0.000 0.000
3.616 67.191
0.000 1.368
0.000 0.000
0.000 0.115
0.000 0.000
3.616 65.708
Page 2 of 15
UNCLASSIFIED
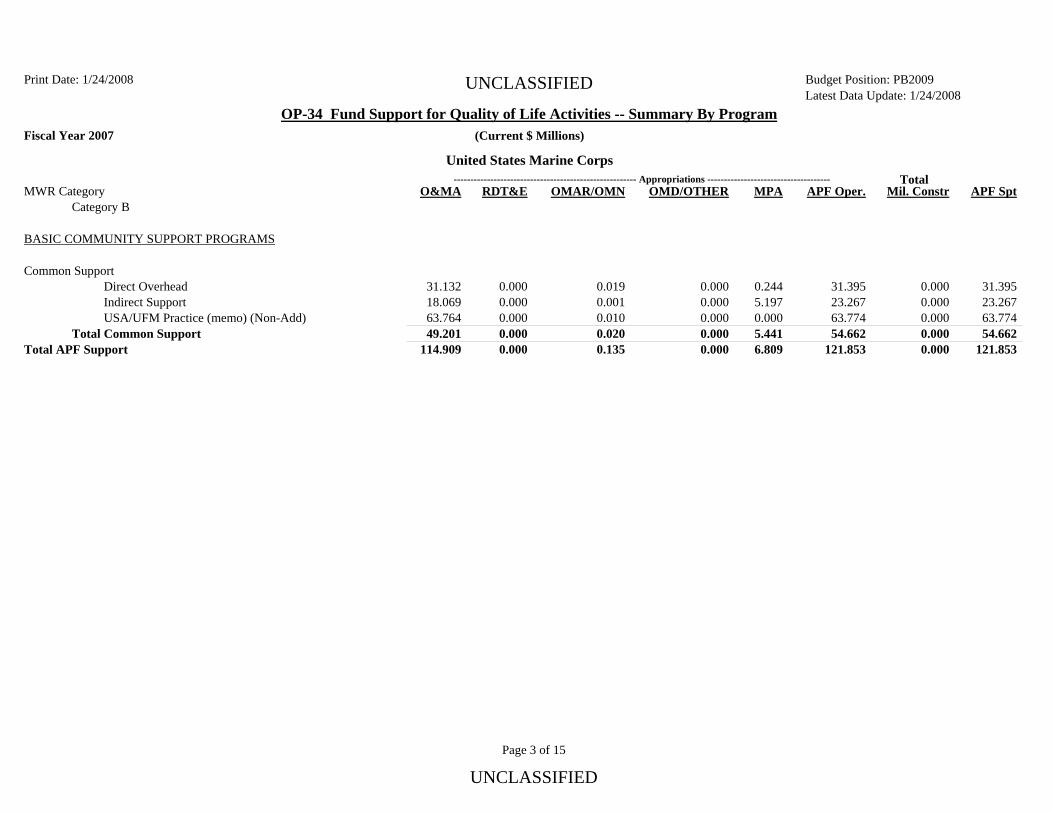
Print Date: 1/24/2008 UNCLASSIFIED Latest Data Update: 1/24/2008Budget Position: PB2009
OP-34 Fund Support for Quality of Life Activities -- Summary By Program Fiscal Year 2007 (Current $ Millions)
United States Marine Corps
Mil. ConstrTotal
O&MA RDT&E OMAR/OMN OMD/OTHER MPA APF O------------------------------------------------------- Appropriations -------------------------------------
per.MWR Category Category B
APF Spt
BASIC COMMUNITY SUPPORT PROGRAMS
Common Support Direct Overhead Indirect Support USA/UFM Practice (memo) (Non-Add)
Total Common Support Total APF Support
31.395 23.267 63.774 54.662
121.853
0.000 0.000 0.000 0.000 0.000
31.395 23.267 63.774 54.662
121.853
0.244 5.197 0.000 5.441 6.809
0.000 0.000 0.000 0.000 0.000
0.019 0.001 0.010 0.020 0.135
0.000 0.000 0.000 0.000 0.000
31.132 18.069 63.764 49.201
114.909
Page 3 of 15
UNCLASSIFIED
Print Date: 1/24/2008 UNCLASSIFIED Latest Data Update: 1/24/2008Budget Position: PB2009
OP-34 Fund Support for Quality of Life Activities -- Summary By Program Fiscal Year 2007 (Current $ Millions)
United States Marine Corps
Mil. ConstrTotal
O&MA RDT&E OMAR/OMN OMD/OTHER MPA APF O------------------------------------------------------- Appropriations -------------------------------------
per.MWR Category Category C
APF Spt
REVENUE-GENERATING PROGRAMS
C.1 Food, Beverage, & Entertainment Military Open Mess (Clubs) Restaurants, snack bars, & other food outlets
0.000 0.000
1.370 1.130
1.189 0.978
0.000 0.000
0.000 0.000
0.181 0.152
1.370 1.130
0.000 0.000
C.2 Lodging Programs (Part of MWR NAFI) PCS Lodging Recreational Lodging
0.000 0.000
0.064 0.175
0.064 0.175
0.000 0.000
0.000 0.000
0.000 0.000
0.064 0.175
0.000 0.000
C.3 Special Interest Clubs: Rod and Gun Program Scuba and Diving Program Horseback Riding Video Program
0.000 0.000 0.000 0.000
0.046 0.122 0.341 0.187
0.046 0.122 0.341 0.187
0.000 0.000 0.000 0.000
0.000 0.000 0.000 0.000
0.000 0.000 0.000 0.000
0.046 0.122 0.341 0.187
0.000 0.000 0.000 0.000
C.4 Other Revenue Generating Activities Resale activities (i.e., audio, photo, recycling, car wash, Bowling (Over 12 lanes) Golf Boating (with resale or private boat berthing)Equipment Rental (other than outdoor recreation
Total Category C
0.203 0.077 0.124 0.045 0.041 3.925
0.000 0.000 0.000 0.000 0.000 0.000
0.203 0.077 0.124 0.045 0.041 3.925
0.203 0.000 0.000 0.000 0.000 0.536
0.000 0.000 0.000 0.000 0.000 0.000
0.000 0.000 0.000 0.000 0.000 0.000
0.000 0.000 0.000 0.000 0.000 0.000
0.000 0.077 0.124 0.045 0.041 3.389
Common Support Direct Overhead Indirect Support USA/UFM Practice (memo) (Non-Add)
Total Common Support Total APF Support
1.665 22.894 3.116
24.559 28.484
0.000 0.000 0.000 0.000 0.000
1.665 22.894 3.116
24.559 28.484
0.059 3.751 0.000 3.810 4.346
0.000 0.000 0.000 0.000 0.000
0.000 0.000 0.000 0.000 0.000
0.000 0.000 0.000 0.000 0.000
1.606 19.143 3.116
20.749 24.138
Page 4 of 15
UNCLASSIFIED

Print Date: 1/24/2008 UNCLASSIFIED Latest Data Update: 1/24/2008Budget Position: PB2009
OP-34 Fund Support for Quality of Life Activities -- Summary By Program Fiscal Year 2007 (Current $ Millions)
United States Marine Corps
Mil. ConstrTotal
O&MA RDT&E OMAR/OMN OMD/OTHER MPA APF O------------------------------------------------------- Appropriations -------------------------------------
per. APF Spt
OTHER PROGRAMS
Lodging Program
TDY Lodging PCS Lodging (Not MWR Category C)
Total Lodging Program
MTF Lodging 0.000 0.000 0.146 0.146
0.000 0.000 8.385 8.385
0.000 0.000 0.461 0.461
0.000 0.000 0.000 0.000
0.000 0.000 8.531 8.531
0.000 0.000 0.000 0.000
0.000 0.000 0.000 0.000
0.000 0.000 7.924 7.924
Armed Services Exchange 0.000 12.160 7.564 0.000 0.000 4.596 12.160 0.000
Special Purpose Central Funding 0.000 0.000 0.000 0.000 0.000 0.000 0.000 0.000
Family Support 0.398 32.548 31.281 0.000 0.000 0.869 32.548 0.000
Off Duty and Voluntary Education
Tuition Assistance Other Voluntary Education Programs
Total Off Duty and Voluntary Education TOTAL OTHER PROGRAMS
0.000 0.000 0.146
49.516 58.080
111.173
0.000 0.000 0.000
0.000 0.000 0.000
49.516 57.928
104.697
8.564 49.516 58.080
111.319
0.000 8.564 0.152 0.000 0.152 6.078
0.000 0.000 0.000 0.000 0.398
0.000 8.412
Page 5 of 15
UNCLASSIFIED
Print Date: 1/24/2008 UNCLASSIFIED Latest Data Update: 1/24/2008Budget Position: PB2009
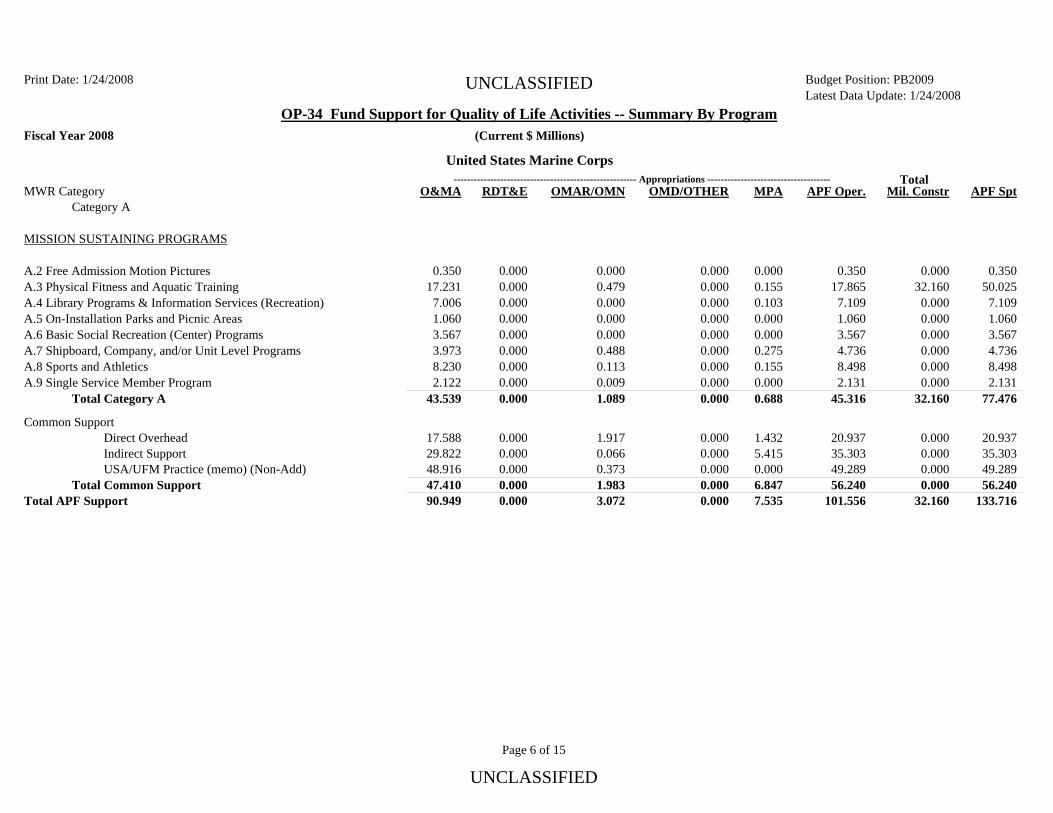
OP-34 Fund Support for Quality of Life Activities -- Summary By Program Fiscal Year 2008 (Current $ Millions)
United States Marine Corps
Mil. ConstrTotal
O&MA RDT&E OMAR/OMN OMD/OTHER MPA APF O------------------------------------------------------- Appropriations -------------------------------------
per.MWR Category Category A
APF Spt
MISSION SUSTAINING PROGRAMS
0.350 50.025 7.109 1.060 3.567 4.736 8.498 2.131
77.476
0.000 32.160 0.000 0.000 0.000 0.000 0.000 0.000
32.160
0.350 17.865 7.109 1.060 3.567 4.736 8.498 2.131
45.316
0.000 0.155 0.103 0.000 0.000 0.275 0.155 0.000 0.688
0.000 0.000 0.000 0.000 0.000 0.000 0.000 0.000 0.000
0.000 0.479 0.000 0.000 0.000 0.488 0.113 0.009 1.089
0.000 0.000 0.000 0.000 0.000 0.000 0.000 0.000 0.000
0.350 17.231 7.006 1.060 3.567 3.973 8.230 2.122
43.539
A.2 Free Admission Motion Pictures A.3 Physical Fitness and Aquatic Training A.4 Library Programs & Information Services (Recreation) A.5 On-Installation Parks and Picnic Areas A.6 Basic Social Recreation (Center) Programs A.7 Shipboard, Company, and/or Unit Level Programs A.8 Sports and Athletics A.9 Single Service Member Program
Total Category A Common Support
Direct Overhead Indirect Support USA/UFM Practice (memo) (Non-Add)
Total Common Support Total APF Support
20.937 35.303 49.289 56.240
133.716
0.000 0.000 0.000 0.000
32.160
20.937 35.303 49.289 56.240
101.556
1.432 5.415 0.000 6.847 7.535
0.000 0.000 0.000 0.000 0.000
1.917 0.066 0.373 1.983 3.072
0.000 0.000 0.000 0.000 0.000
17.588 29.822 48.916 47.410 90.949
Page 6 of 15
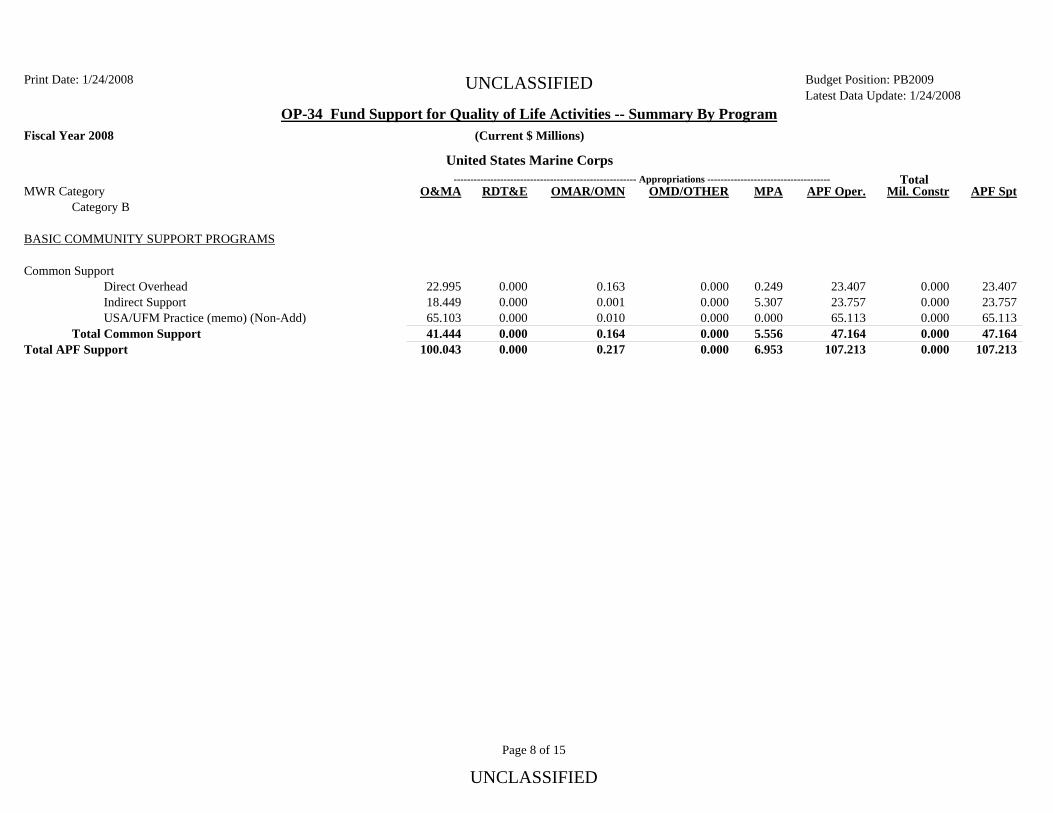
UNCLASSIFIED

Print Date: 1/24/2008 UNCLASSIFIED Latest Data Update: 1/24/2008Budget Position: PB2009
OP-34 Fund Support for Quality of Life Activities -- Summary By Program Fiscal Year 2008 (Current $ Millions)
United States Marine Corps
Mil. ConstrTotal
O&MA RDT&E OMAR/OMN OMD/OTHER MPA APF O------------------------------------------------------- Appropriations -------------------------------------
per.MWR Category Category B
APF Spt
BASIC COMMUNITY SUPPORT PROGRAMS
B.1 Child Care Programs Child Development Program Youth Program
0.000 0.053
27.770 8.438
27.770 8.385
0.000 0.000
0.000 0.000
0.000 0.000
27.770 8.438
0.000 0.000
B.2 Youth Activities Recreation Information, Tickets, and Tours ServicesRecreational Swimming
0.000 0.000
2.215 6.914
2.215 5.620
0.000 0.000
0.000 0.000
0.000 1.294
2.215 6.914
0.000 0.000
B.3 Community Programs Directed Outdoor Recreation Outdoor Recreation Equipment Checkout Boating w/o Resale or Private Berthing Camping (Primitive and/or tents) Riding Stables, Government-owned or -leased
0.000 0.000 0.000 0.000 0.000
2.497 2.257 1.046 0.148 0.351
2.497 2.257 1.046 0.045 0.351
0.000 0.000 0.000 0.000 0.000
0.000 0.000 0.000 0.000 0.000
0.000 0.000 0.000 0.103 0.000
2.497 2.257 1.046 0.148 0.351
0.000 0.000 0.000 0.000 0.000
B.4 Outdoor Recreation Performing Arts (Music, Drama, and Theater)Arts and Crafts Skill Development Automotive Crafts Skill Development Bowling (12 lanes or less)
0.000 0.000 0.000 0.000
0.028 0.478 2.961 0.806
0.028 0.478 2.961 0.806
0.000 0.000 0.000 0.000
0.000 0.000 0.000 0.000
0.000 0.000 0.000 0.000
0.028 0.478 2.961 0.806
0.000 0.000 0.000 0.000
B.5 Individual Skill Recreation Sports (Above Intramural Level)
Total Category B 4.140
60.049 0.000 0.000
4.140 60.049
0.000 1.397
0.000 0.000
0.000 0.053
0.000 0.000
4.140 58.599
Page 7 of 15
UNCLASSIFIED
Print Date: 1/24/2008 UNCLASSIFIED Latest Data Update: 1/24/2008Budget Position: PB2009
OP-34 Fund Support for Quality of Life Activities -- Summary By Program Fiscal Year 2008 (Current $ Millions)
United States Marine Corps
Mil. ConstrTotal
O&MA RDT&E OMAR/OMN OMD/OTHER MPA APF O------------------------------------------------------- Appropriations -------------------------------------
per.MWR Category Category B
APF Spt
BASIC COMMUNITY SUPPORT PROGRAMS
Common Support Direct Overhead Indirect Support USA/UFM Practice (memo) (Non-Add)
Total Common Support Total APF Support
23.407 23.757 65.113 47.164
107.213
0.000 0.000 0.000 0.000 0.000
23.407 23.757 65.113 47.164
107.213
0.249 5.307 0.000 5.556 6.953
0.000 0.000 0.000 0.000 0.000
0.163 0.001 0.010 0.164 0.217
0.000 0.000 0.000 0.000 0.000
22.995 18.449 65.103 41.444
100.043
Page 8 of 15
UNCLASSIFIED

Print Date: 1/24/2008 UNCLASSIFIED Latest Data Update: 1/24/2008Budget Position: PB2009
OP-34 Fund Support for Quality of Life Activities -- Summary By Program Fiscal Year 2008 (Current $ Millions)
United States Marine Corps
Mil. ConstrTotal
O&MA RDT&E OMAR/OMN OMD/OTHER MPA APF O------------------------------------------------------- Appropriations -------------------------------------
per.MWR Category Category C
APF Spt
REVENUE-GENERATING PROGRAMS
C.1 Food, Beverage, & Entertainment Military Open Mess (Clubs) Restaurants, snack bars, & other food outlets
0.000 0.000
1.027 0.824
0.842 0.669
0.000 0.000
0.000 0.000
0.185 0.155
1.027 0.824
0.000 0.000
C.2 Lodging Programs (Part of MWR NAFI) PCS Lodging Recreational Lodging
0.000 0.000
0.060 0.164
0.060 0.164
0.000 0.000
0.000 0.000
0.000 0.000
0.060 0.164
0.000 0.000
C.3 Special Interest Clubs: Rod and Gun Program Scuba and Diving Program Horseback Riding Video Program
0.000 0.000 0.000 0.000
0.043 0.114 0.319 0.175
0.043 0.114 0.319 0.175
0.000 0.000 0.000 0.000
0.000 0.000 0.000 0.000
0.000 0.000 0.000 0.000
0.043 0.114 0.319 0.175
0.000 0.000 0.000 0.000
C.4 Other Revenue Generating Activities Resale activities (i.e., audio, photo, recycling, car wash, Bowling (Over 12 lanes) Golf Boating (with resale or private boat berthing)Equipment Rental (other than outdoor recreation
Total Category C
0.207 0.072 0.116 0.042 0.038 3.201
0.000 0.000 0.000 0.000 0.000 0.000
0.207 0.072 0.116 0.042 0.038 3.201
0.207 0.000 0.000 0.000 0.000 0.547
0.000 0.000 0.000 0.000 0.000 0.000
0.000 0.000 0.000 0.000 0.000 0.000
0.000 0.000 0.000 0.000 0.000 0.000
0.000 0.072 0.116 0.042 0.038 2.654
Common Support Direct Overhead Indirect Support USA/UFM Practice (memo) (Non-Add)
Total Common Support Total APF Support
0.551 23.375 3.181
23.926 27.127
0.000 0.000 0.000 0.000 0.000
0.551 23.375 3.181
23.926 27.127
0.060 3.830 0.000 3.890 4.437
0.000 0.000 0.000 0.000 0.000
0.000 0.000 0.000 0.000 0.000
0.000 0.000 0.000 0.000 0.000
0.491 19.545 3.181
20.036 22.690
Page 9 of 15
UNCLASSIFIED

Print Date: 1/24/2008 UNCLASSIFIED Latest Data Update: 1/24/2008Budget Position: PB2009
OP-34 Fund Support for Quality of Life Activities -- Summary By Program Fiscal Year 2008 (Current $ Millions)
United States Marine Corps
Mil. ConstrTotal
O&MA RDT&E OMAR/OMN OMD/OTHER MPA APF O------------------------------------------------------- Appropriations -------------------------------------
per. APF Spt
OTHER PROGRAMS
Lodging Program
TDY Lodging PCS Lodging (Not MWR Category C)
Total Lodging Program
MTF Lodging 0.000 0.000 0.149 0.149
0.000 0.000 8.554 8.554
0.000 0.000 0.470 0.470
0.000 0.000 0.000 0.000
0.000 0.000 8.703 8.703
0.000 0.000 0.000 0.000
0.000 0.000 0.000 0.000
0.000 0.000 8.084 8.084
Armed Services Exchange 0.000 12.415 7.722 0.000 0.000 4.693 12.415 0.000
Special Purpose Central Funding 0.000 0.000 0.000 0.000 0.000 0.000 0.000 0.000
Family Support 0.027 35.762 34.866 0.000 0.000 0.869 35.762 0.000
Off Duty and Voluntary Education
Tuition Assistance Other Voluntary Education Programs
Total Off Duty and Voluntary Education TOTAL OTHER PROGRAMS
0.000 0.000 0.149
51.595 64.124
120.855
0.000 0.000 0.000
0.000 0.000 0.000
51.595 63.969
114.641
12.529 51.595 64.124
121.004
0.000 12.529 0.155 0.000 0.155 6.187
0.000 0.000 0.000 0.000 0.027
0.000 12.374
Page 10 of 15
UNCLASSIFIED
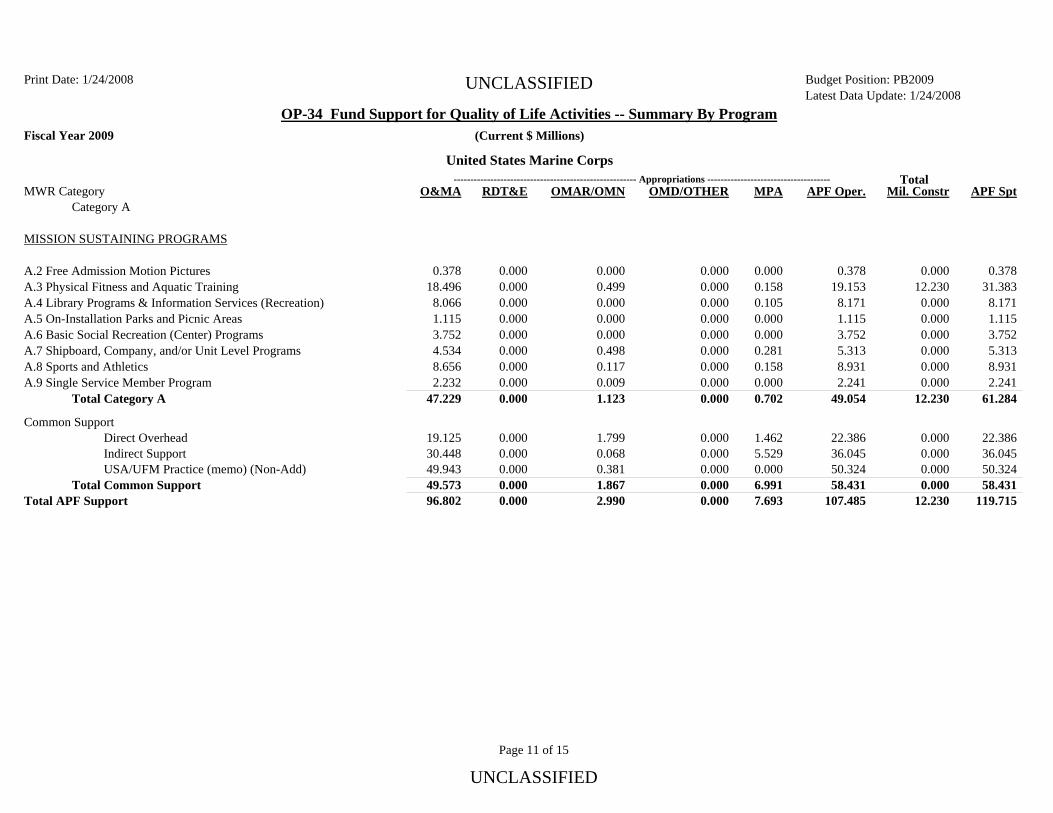
Print Date: 1/24/2008 UNCLASSIFIED Latest Data Update: 1/24/2008Budget Position: PB2009
OP-34 Fund Support for Quality of Life Activities -- Summary By Program Fiscal Year 2009 (Current $ Millions)
United States Marine Corps
Mil. ConstrTotal
O&MA RDT&E OMAR/OMN OMD/OTHER MPA APF O------------------------------------------------------- Appropriations -------------------------------------
per.MWR Category Category A
APF Spt
MISSION SUSTAINING PROGRAMS
0.378 31.383 8.171 1.115 3.752 5.313 8.931 2.241
61.284
0.000 12.230 0.000 0.000 0.000 0.000 0.000 0.000
12.230
0.378 19.153 8.171 1.115 3.752 5.313 8.931 2.241
49.054
0.000 0.158 0.105 0.000 0.000 0.281 0.158 0.000 0.702
0.000 0.000 0.000 0.000 0.000 0.000 0.000 0.000 0.000
0.000 0.499 0.000 0.000 0.000 0.498 0.117 0.009 1.123
0.000 0.000 0.000 0.000 0.000 0.000 0.000 0.000 0.000
0.378 18.496 8.066 1.115 3.752 4.534 8.656 2.232
47.229
A.2 Free Admission Motion Pictures A.3 Physical Fitness and Aquatic Training A.4 Library Programs & Information Services (Recreation) A.5 On-Installation Parks and Picnic Areas A.6 Basic Social Recreation (Center) Programs A.7 Shipboard, Company, and/or Unit Level Programs A.8 Sports and Athletics A.9 Single Service Member Program
Total Category A Common Support
Direct Overhead Indirect Support USA/UFM Practice (memo) (Non-Add)
Total Common Support Total APF Support
22.386 36.045 50.324 58.431
119.715
0.000 0.000 0.000 0.000
12.230
22.386 36.045 50.324 58.431
107.485
1.462 5.529 0.000 6.991 7.693
0.000 0.000 0.000 0.000 0.000
1.799 0.068 0.381 1.867 2.990
0.000 0.000 0.000 0.000 0.000
19.125 30.448 49.943 49.573 96.802
Page 11 of 15
UNCLASSIFIED

Print Date: 1/24/2008 UNCLASSIFIED Latest Data Update: 1/24/2008Budget Position: PB2009
OP-34 Fund Support for Quality of Life Activities -- Summary By Program Fiscal Year 2009 (Current $ Millions)
United States Marine Corps
Mil. ConstrTotal
O&MA RDT&E OMAR/OMN OMD/OTHER APF Spt MPA APF O------------------------------------------------------- Appropriations -------------------------------------
MWR Category per.Category B
BASIC COMMUNITY SUPPORT PROGRAMS
B.1 Child Care Programs Child Development Program 0.000 41.431 27.471 0.000 0.000 0.000 27.471 13.960Youth Program 0.054 9.225 9.171 0.000 0.000 0.000 9.225 0.000
B.2 Youth Activities 0.000 2.687 Recreation Information, Tickets, and Tours Services 2.687 0.000 0.000 0.000 2.687 0.000
Recreational Swimming 0.000 7.589 6.268 0.000 0.000 1.321 7.589 0.000
B.3 Community Programs Directed Outdoor Recreation 0.000 2.626 2.626 0.000 0.000 0.000 2.626 0.000Outdoor Recreation Equipment Checkout 0.000 2.374 2.374 0.000 0.000 0.000 2.374 0.000Boating w/o Resale or Private Berthing 0.000 1.099 1.099 0.000 0.000 0.000 1.099 0.000Camping (Primitive and/or tents) 0.000 0.149 0.046 0.000 0.000 0.103 0.149 0.000
0.000 0.358 Riding Stables, Government-owned or -leased 0.358 0.000 0.000 0.000 0.358 0.000
B.4 Outdoor Recreation 0.000 0.030 Performing Arts (Music, Drama, and Theater) 0.030 0.000 0.000 0.000 0.030 0.000
Arts and Crafts Skill Development 0.000 0.516 0.516 0.000 0.000 0.000 0.516 0.000Automotive Crafts Skill Development 0.000 3.492 3.492 0.000 0.000 0.000 3.492 0.000Bowling (12 lanes or less) 0.000 0.871 0.871 0.000 0.000 0.000 0.871 0.000
B.5 Individual Skill Recreation Sports (Above Intramural Level) 0.000 4.350 4.350 0.000 0.000 0.000 4.350 0.000
Total Category B 0.054 76.797 61.359 0.000 0.000 1.424 62.837 13.960
Page 12 of 15
UNCLASSIFIED
Print Date: 1/24/2008 UNCLASSIFIED Latest Data Update: 1/24/2008Budget Position: PB2009
OP-34 Fund Support for Quality of Life Activities -- Summary By Program Fiscal Year 2009 (Current $ Millions)
United States Marine Corps
Mil. ConstrTotal
O&MA RDT&E OMAR/OMN OMD/OTHER MPA APF O------------------------------------------------------- Appropriations -------------------------------------
per.MWR Category Category B
APF Spt
BASIC COMMUNITY SUPPORT PROGRAMS
Common Support Direct Overhead Indirect Support USA/UFM Practice (memo) (Non-Add)
Total Common Support Total APF Support
25.288 24.255 66.480 49.543
126.340
0.000 0.000 0.000 0.000
13.960
25.288 24.255 66.480 49.543
112.380
0.254 5.418 0.000 5.672 7.096
0.000 0.000 0.000 0.000 0.000
0.164 0.001 0.010 0.165 0.219
0.000 0.000 0.000 0.000 0.000
24.870 18.836 66.470 43.706
105.065
Page 13 of 15
UNCLASSIFIED

Print Date: 1/24/2008 UNCLASSIFIED Latest Data Update: 1/24/2008Budget Position: PB2009
OP-34 Fund Support for Quality of Life Activities -- Summary By Program Fiscal Year 2009 (Current $ Millions)
United States Marine Corps
Mil. ConstrTotal
O&MA RDT&E OMAR/OMN OMD/OTHER MPA APF O------------------------------------------------------- Appropriations -------------------------------------
per.MWR Category Category C
APF Spt
REVENUE-GENERATING PROGRAMS
C.1 Food, Beverage, & Entertainment Military Open Mess (Clubs) Restaurants, snack bars, & other food outlets
0.000 0.000
1.392 0.880
1.203 0.722
0.000 0.000
0.000 0.000
0.189 0.158
1.392 0.880
0.000 0.000
C.2 Lodging Programs (Part of MWR NAFI) PCS Lodging Recreational Lodging
0.000 0.000
0.064 0.177
0.064 0.177
0.000 0.000
0.000 0.000
0.000 0.000
0.064 0.177
0.000 0.000
C.3 Special Interest Clubs: Rod and Gun Program Scuba and Diving Program Horseback Riding Video Program
0.000 0.000 0.000 0.000
0.047 0.123 0.345 0.189
0.047 0.123 0.345 0.189
0.000 0.000 0.000 0.000
0.000 0.000 0.000 0.000
0.000 0.000 0.000 0.000
0.047 0.123 0.345 0.189
0.000 0.000 0.000 0.000
C.4 Other Revenue Generating Activities Resale activities (i.e., audio, photo, recycling, car wash, Bowling (Over 12 lanes) Golf Boating (with resale or private boat berthing)Equipment Rental (other than outdoor recreation
Total Category C
0.211 0.078 0.125 0.045 0.041 3.717
0.000 0.000 0.000 0.000 0.000 0.000
0.211 0.078 0.125 0.045 0.041 3.717
0.211 0.000 0.000 0.000 0.000 0.558
0.000 0.000 0.000 0.000 0.000 0.000
0.000 0.000 0.000 0.000 0.000 0.000
0.000 0.000 0.000 0.000 0.000 0.000
0.000 0.078 0.125 0.045 0.041 3.159
Common Support Direct Overhead Indirect Support USA/UFM Practice (memo) (Non-Add)
Total Common Support Total APF Support
1.155 23.866 3.248
25.021 28.738
0.000 0.000 0.000 0.000 0.000
1.155 23.866 3.248
25.021 28.738
0.061 3.910 0.000 3.971 4.529
0.000 0.000 0.000 0.000 0.000
0.000 0.000 0.000 0.000 0.000
0.000 0.000 0.000 0.000 0.000
1.094 19.956 3.248
21.050 24.209
Page 14 of 15
UNCLASSIFIED
Print Date: 1/24/2008 UNCLASSIFIED Latest Data Update: 1/24/2008Budget Position: PB2009
OP-34 Fund Support for Quality of Life Activities -- Summary By Program Fiscal Year 2009 (Current $ Millions)
United States Marine Corps
Mil. ConstrTotal
O&MA RDT&E OMAR/OMN OMD/OTHER MPA APF O------------------------------------------------------- Appropriations -------------------------------------
per. APF Spt
OTHER PROGRAMS
Lodging Program
TDY Lodging PCS Lodging (Not MWR Category C)
Total Lodging Program
MTF Lodging 0.000 0.000 0.000 0.000
0.000 0.000 8.877 8.877
0.000 0.000 8.246 8.246
0.000 0.000 0.000 0.000
0.000 0.000 0.000 0.000
0.000 0.000 0.479 0.479
0.000 0.000 8.725 8.725
0.000 0.000 0.152 0.152
Armed Services Exchange 0.000 12.677 7.885 0.000 0.000 4.792 12.677 0.000
Special Purpose Central Funding 0.000 0.000 0.000 0.000 0.000 0.000 0.000 0.000
Family Support 0.028 36.681 35.766 0.000 0.000 0.887 36.681 0.000
Off Duty and Voluntary Education
Tuition Assistance Other Voluntary Education Programs
Total Off Duty and Voluntary Education TOTAL OTHER PROGRAMS
0.000 0.000 0.000 0.028
12.286 57.574 69.860
128.095
12.128 0.000 0.000 12.286 0.000 0.158 0.000 0.158 6.316
57.574 69.702
121.599
0.000 0.000 0.000
0.000 0.000 0.000
57.574 69.860
127.943
0.000 0.000 0.152
Page 15 of 15
UNCLASSIFIED
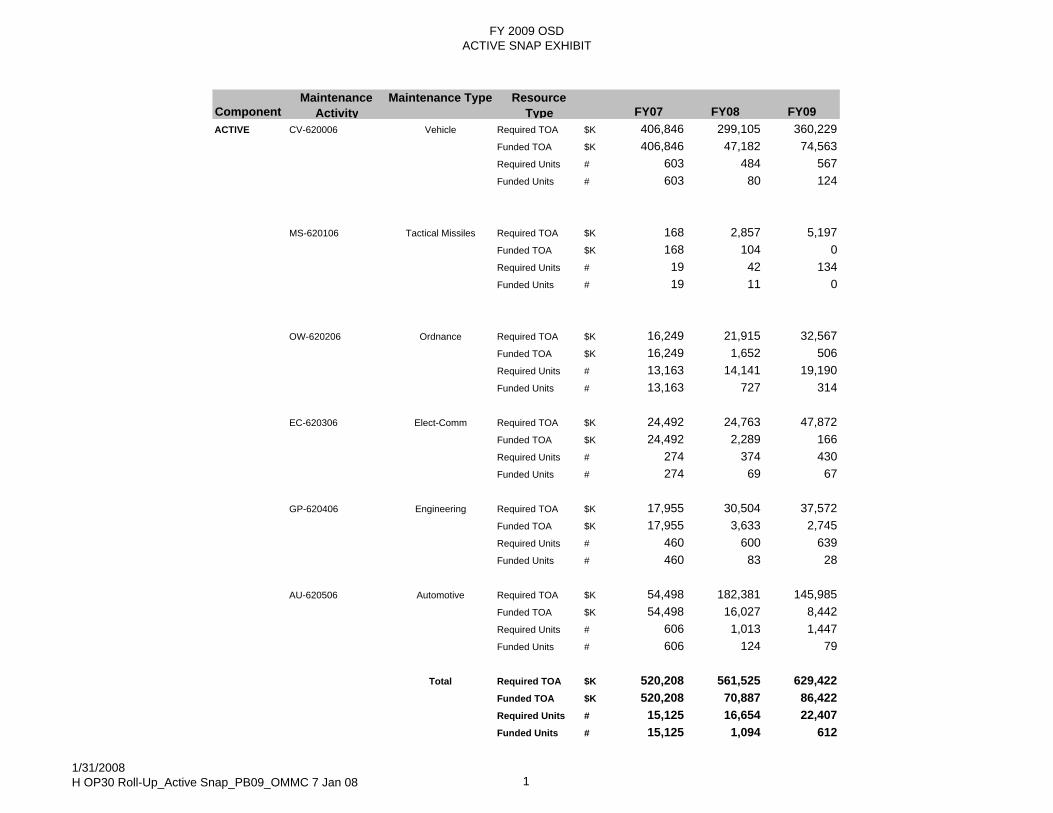
FY 2009 OSDACTIVE SNAP EXHIBIT
ComponentMaintenance
ActivityMaintenance Type Resource
Type FY07 FY08 FY09ACTIVE CV-620006 Vehicle Required TOA $K 406,846 299,105 360,229
Funded TOA $K 406,846 47,182 74,563Required Units # 603 484 567Funded Units # 603 80 124
MS-620106 Tactical Missiles Required TOA $K 168 2,857 5,197Funded TOA $K 168 104 0Required Units # 19 42 134Funded Units # 19 11 0
OW-620206 Ordnance Required TOA $K 16,249 21,915 32,567Funded TOA $K 16,249 1,652 506Required Units # 13,163 14,141 19,190Funded Units # 13,163 727 314
EC-620306 Elect-Comm Required TOA $K 24,492 24,763 47,872Funded TOA $K 24,492 2,289 166Required Units # 274 374 430Funded Units # 274 69 67
GP-620406 Engineering Required TOA $K 17,955 30,504 37,572
Funded TOA $K 17,955 3,633 2,745Required Units # 460 600 639Funded Units # 460 83 28
AU-620506 Automotive Required TOA $K 54,498 182,381 145,985Funded TOA $K 54,498 16,027 8,442Required Units # 606 1,013 1,447Funded Units # 606 124 79
Total Required TOA $K 520,208 561,525 629,422Funded TOA $K 520,208 70,887 86,422Required Units # 15,125 16,654 22,407Funded Units # 15,125 1,094 612
1/31/2008H OP30 Roll-Up_Active Snap_PB09_OMMC 7 Jan 08 1
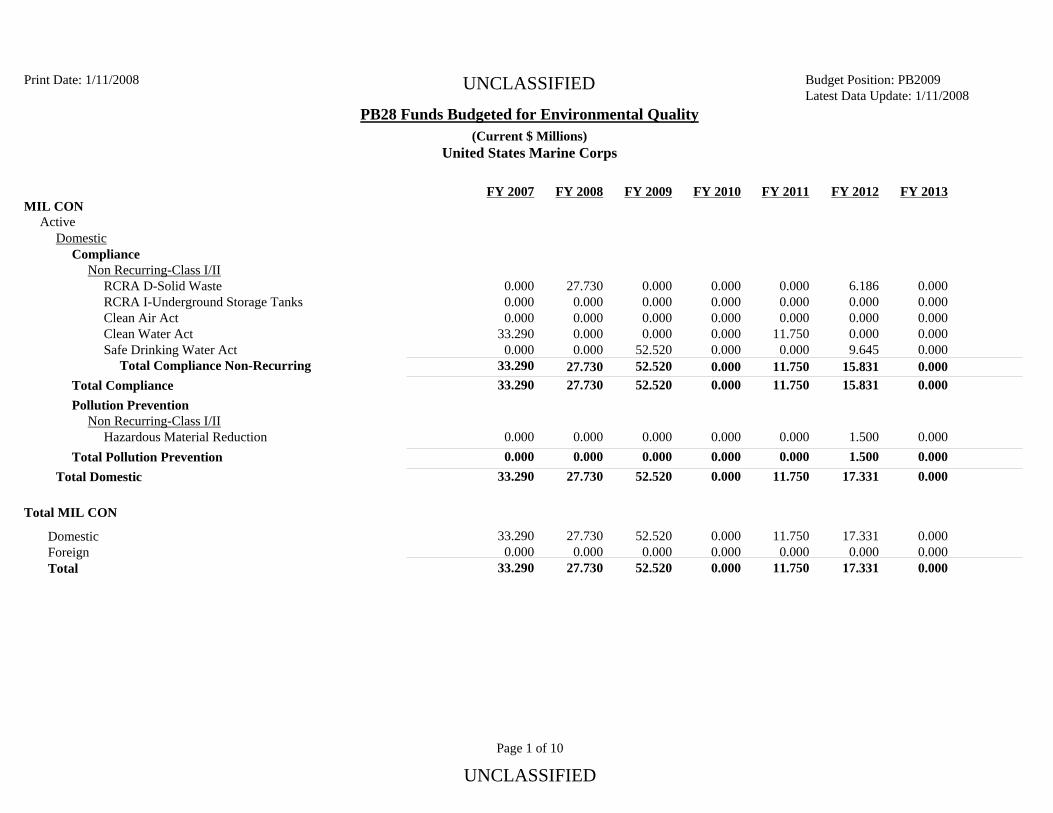
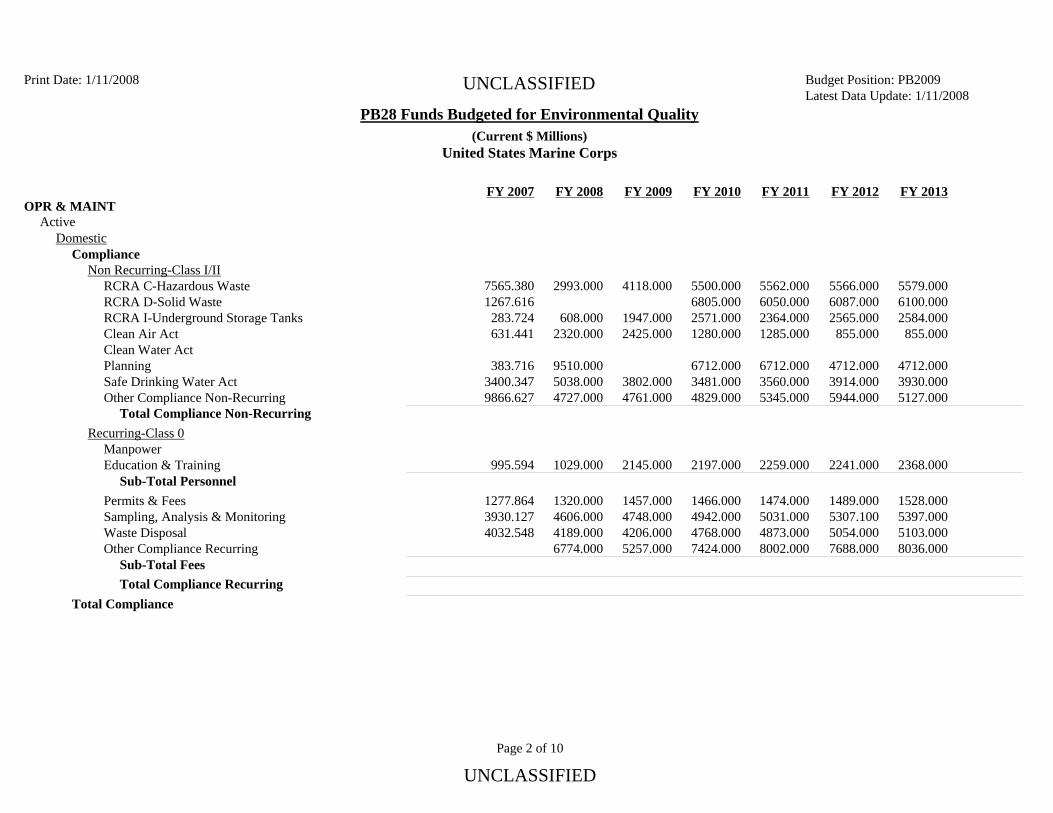
Print Date: 1/11/2008 UNCLASSIFIED Latest Data Update: 1/11Budget Position: PB2009
/2008PB28 Funds Budgeted for Environmental Quality
(Current $ Millions)United States Marine Corps
FY 2007 FY 2008 FY 2009 FY 2010 FY 2011 FY 2012 FY 2013MIL CON
Active Domestic
Compliance Non Recurring-Class I/II
RCRA D-Solid Waste RCRA I-Underground Storage Tanks Clean Air Act Clean Water Act Safe Drinking Water Act
Total Compliance Non-Recurring Total Compliance Pollution Prevention
Non Recurring-Class I/II Hazardous Material Reduction
Total Pollution Prevention Total Domestic
0.000 0.000 0.000 0.000 0.000
0.000
6.186 0.000 0.000 0.000 9.64515.831
0.000 0.000 0.000
11.750 0.00011.750
0.000 0.000 0.000 0.000 0.000
0.000
0.000 0.000 0.000 0.000
52.520 52.520
27.730 0.000 0.000 0.000 0.00027.730
0.000 0.000 0.000
33.290 0.00033.290
0.000 15.831 11.750 0.000 27.730 33.290 52.520
0.000 0.000 0.000 0.000 0.000 1.500 0.000 0.000 1.500 0.000 0.000 0.000 0.000 0.000 0.000 17.331 11.750 0.000 52.520 27.730 33.290
Total MIL CON Domestic Foreign Total
0.000
0.0000.000
17.331
17.3310.000
11.750
11.7500.000
0.000
0.0000.000
52.520
52.520 0.000
27.730
27.7300.000
33.290
33.2900.000
Page 1 of 10
UNCLASSIFIED
Print Date: 1/11/2008 UNCLASSIFIED Latest Data Update: 1/11Budget Position: PB2009
/2008PB28 Funds Budgeted for Environmental Quality
(Current $ Millions)United States Marine Corps
FY 2007 FY 2008 FY 2009 FY 2010 FY 2011 FY 2012 FY 2013OPR & MAINT
Active Domestic
Compliance Non Recurring-Class I/II
RCRA C-Hazardous Waste RCRA D-Solid Waste RCRA I-Underground Storage Tanks Clean Air Act Clean Water Act Planning Safe Drinking Water Act Other Compliance Non-Recurring
Total Compliance Non-Recurring Recurring-Class 0
Manpower Education & Training
Sub-Total Personnel Permits & Fees Sampling, Analysis & Monitoring Waste Disposal Other Compliance Recurring
Sub-Total Fees Total Compliance Recurring
Total Compliance
7565.380 1267.616 283.724 631.441
2993.000 4118.000 5500.000 6805.000 2571.000 1280.000
5562.000 6050.000 2364.000 1285.000
5566.000 6087.000 2565.000 855.000
5579.000 6100.000 2584.000 855.000
608.000 2320.000
1947.000 2425.000
3802.000 4761.000
4712.000 3930.000 5127.000
4712.000 3914.000 5944.000
6712.000 3560.000 5345.000
6712.000 3481.000 4829.000
9510.000 5038.000 4727.000
383.716 3400.347 9866.627
2368.000 2241.000 2259.000 2197.000 2145.000 1029.000 995.594
1528.000 5397.000 5103.000 8036.000
1489.000 5307.100 5054.000 7688.000
1474.000 5031.000 4873.000 8002.000
1466.000 4942.000 4768.000 7424.000
1457.000 4748.000 4206.000 5257.000
1320.000 4606.000 4189.000 6774.000
1277.864 3930.127 4032.548
Page 2 of 10
UNCLASSIFIED
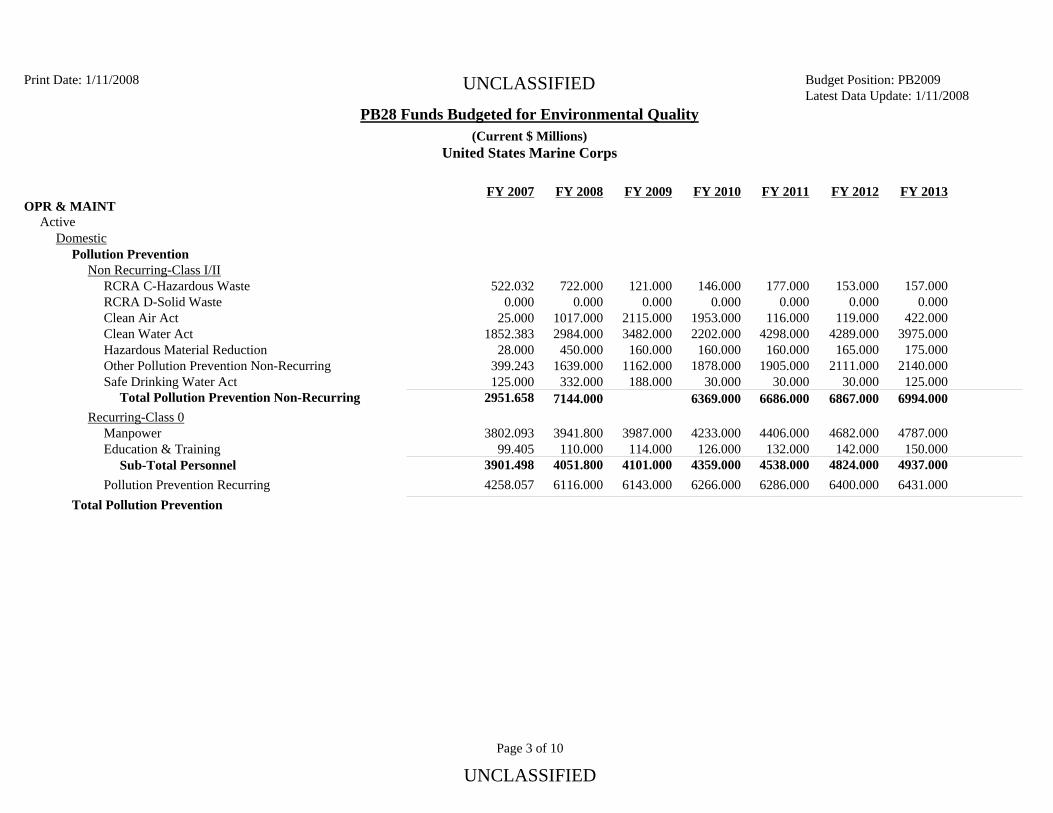
Print Date: 1/11/2008 UNCLASSIFIED Latest Data Update: 1/11Budget Position: PB2009
/2008PB28 Funds Budgeted for Environmental Quality
(Current $ Millions)United States Marine Corps
FY 2007 FY 2008 FY 2009 FY 2010 FY 2011 FY 2012 FY 2013OPR & MAINT
Active Domestic
Pollution Prevention Non Recurring-Class I/II
RCRA C-Hazardous Waste RCRA D-Solid Waste Clean Air Act Clean Water Act Hazardous Material Reduction Other Pollution Prevention Non-RecurringSafe Drinking Water Act
Total Pollution Prevention Non-RecurringRecurring-Class 0
Manpower Education & Training
Sub-Total Personnel Pollution Prevention Recurring
Total Pollution Prevention
157.000 0.000
422.000 3975.000 175.000
2140.000 125.0006994.000
153.000 0.000
119.000 4289.000 165.000
2111.000 30.000
6867.000
177.000 0.000
116.000 4298.000 160.000
1905.000 30.000
6686.000
146.000 0.000
1953.000 2202.000 160.000
1878.000 30.000
6369.000
121.000 0.000
2115.000 3482.000 160.000
1162.000 188.000
722.000 0.000
1017.000 2984.000 450.000
1639.000 332.0007144.000
522.032 0.000
25.000 1852.383
28.000 399.243 125.0002951.658
4787.000 150.0004937.000
4682.000 142.0004824.000
4406.000 132.0004538.000
4233.000 126.0004359.000
3987.000 114.000
4101.000
3941.800 110.0004051.800
3802.093 99.405
3901.498 4258.057 6116.000 6143.000 6266.000 6286.000 6400.000 6431.000
Page 3 of 10
UNCLASSIFIED
Print Date: 1/11/2008 UNCLASSIFIED Latest Data Update: 1/11Budget Position: PB2009
/2008PB28 Funds Budgeted for Environmental Quality
(Current $ Millions)United States Marine Corps
FY 2007 FY 2008 FY 2009 FY 2010 FY 2011 FY 2012 FY 2013OPR & MAINT
Active Domestic
Conservation Non Recurring-Class I/II
Threatened & Endangered Species Wetlands Other Natural Resources Non-Recurring Historical & Cultural Resources
Total Conservation Non-Recurring Recurring-Class 0
Manpower Education & Training
Sub-Total Personnel Conservation Recurring
Total Conservation Total Domestic Foreign
1555.000 325.000
2160.000 2916.000
6956.000
1527.000 378.000
2046.000 2842.000
6793.000
1542.000 358.000
2310.000 2806.000
7016.000
1897.000 433.000
1921.000 2714.000
6965.000
1299.000 1122.000 2093.000 2677.000
1458.000 244.000
2489.000 2652.000
6843.000
5635.651 302.383
2226.510 3435.358
8157.000 198.0008355.000
7889.000 191.0008080.000
7786.000 183.0007969.000
7653.000 166.0007819.000
7431.000 163.000
7594.000
7350.000 158.0007508.000
7152.239 143.5787295.817
5054.407 5037.000 5061.000 5135.000 5155.000 5182.000 5291.000
Page 4 of 10
UNCLASSIFIED
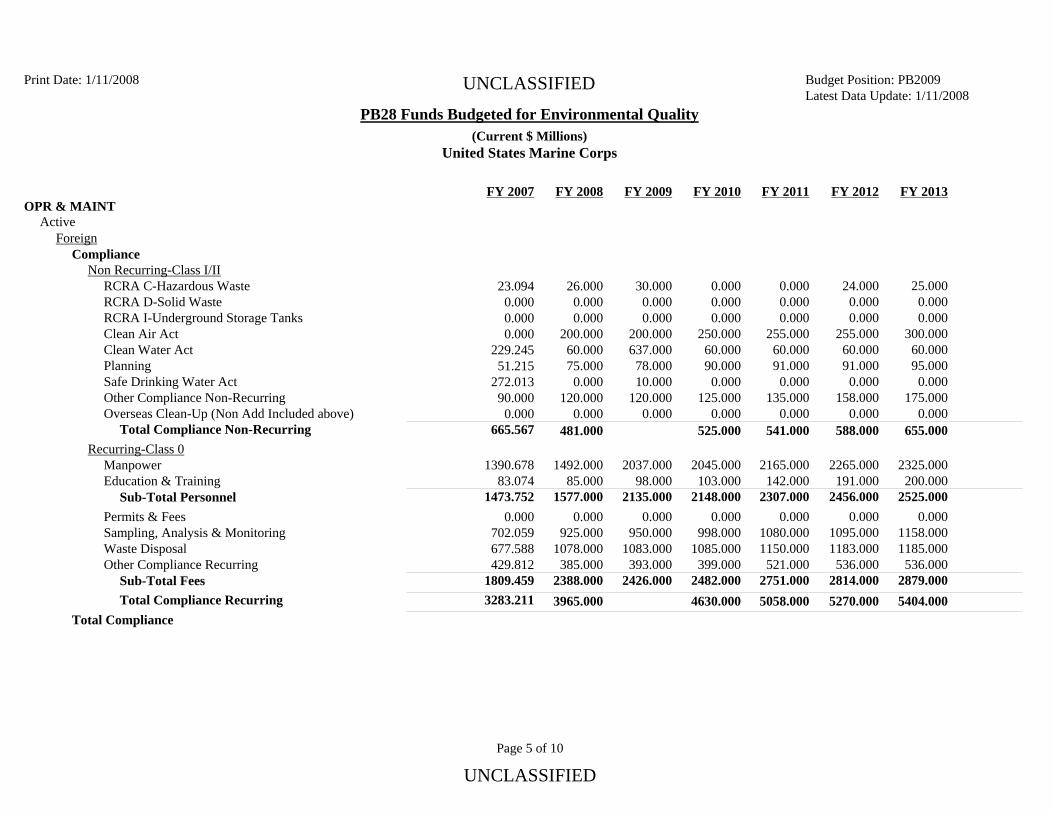
Print Date: 1/11/2008 UNCLASSIFIED Latest Data Update: 1/11Budget Position: PB2009
/2008PB28 Funds Budgeted for Environmental Quality
(Current $ Millions)United States Marine Corps
FY 2007 FY 2008 FY 2009 FY 2010 FY 2011 FY 2012 FY 2013OPR & MAINT
Active Foreign
Compliance Non Recurring-Class I/II
RCRA C-Hazardous Waste RCRA D-Solid Waste RCRA I-Underground Storage Tanks Clean Air Act Clean Water Act Planning Safe Drinking Water Act Other Compliance Non-Recurring Overseas Clean-Up (Non Add Included above)
Total Compliance Non-Recurring Recurring-Class 0
Manpower Education & Training
Sub-Total Personnel Permits & Fees Sampling, Analysis & Monitoring Waste Disposal Other Compliance Recurring
Sub-Total Fees Total Compliance Recurring
Total Compliance
25.000 0.000 0.000
300.000 60.000 95.000
0.000 175.000
0.000655.000
24.000 0.000 0.000
255.000 60.000 91.000
0.000 158.000
0.000588.000
0.000 0.000 0.000
255.000 60.000 91.000
0.000 135.000
0.000541.000
0.000 0.000 0.000
250.000 60.000 90.000
0.000 125.000
0.000525.000
30.000 0.000 0.000
200.000 637.000 78.000 10.000
120.000 0.000
26.000 0.000 0.000
200.000 60.000 75.000
0.000 120.000
0.000481.000
23.094 0.000 0.000 0.000
229.245 51.215
272.013 90.000
0.000665.567
2325.000 200.0002525.000
2265.000 191.0002456.000
2165.000 142.0002307.000
2045.000 103.0002148.000
2037.000 98.000
2135.000
1492.000 85.000
1577.000
1390.678 83.074
1473.752 0.000
1158.000 1185.000 536.0002879.000
0.000 1095.000 1183.000 536.0002814.000
0.000 1080.000 1150.000 521.0002751.000
0.000 998.000
1085.000 399.0002482.000
0.000 950.000
1083.000 393.000
2426.000
0.000 925.000
1078.000 385.0002388.000
0.000 702.059 677.588 429.8121809.459
5404.0005270.0005058.0004630.0003965.0003283.211
Page 5 of 10
UNCLASSIFIED
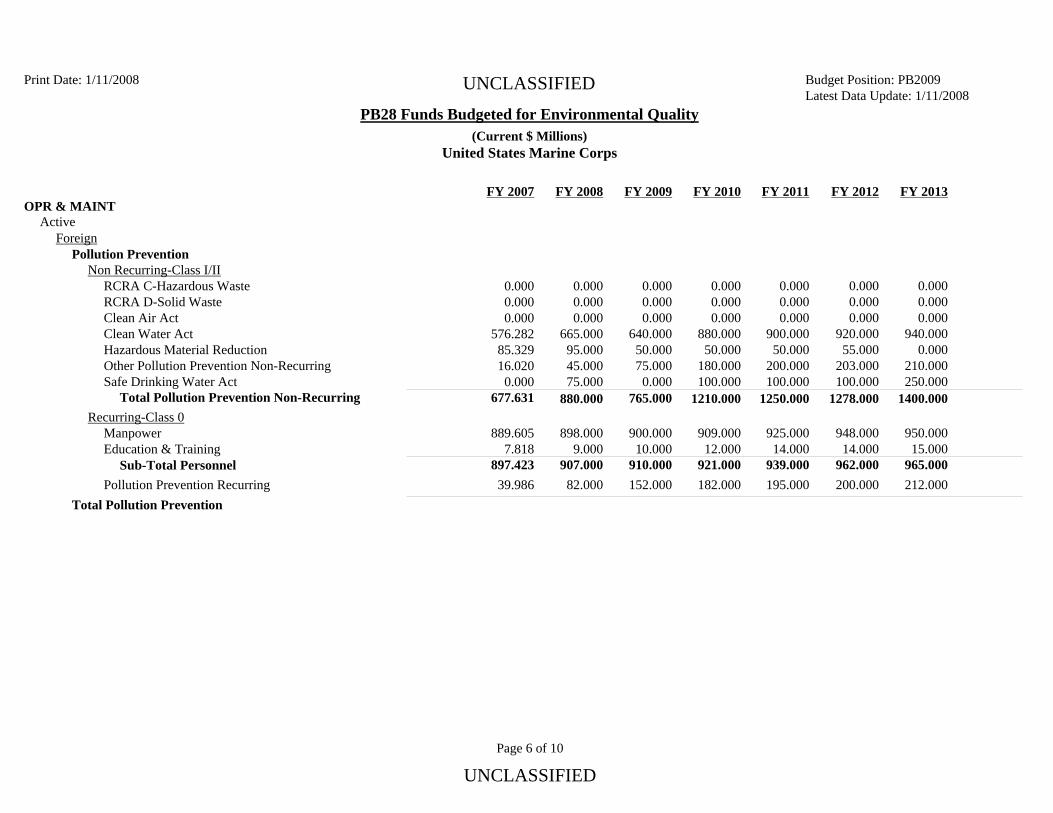
Print Date: 1/11/2008 UNCLASSIFIED Latest Data Update: 1/11Budget Position: PB2009
/2008PB28 Funds Budgeted for Environmental Quality
(Current $ Millions)United States Marine Corps
FY 2007 FY 2008 FY 2009 FY 2010 FY 2011 FY 2012 FY 2013OPR & MAINT
Active Foreign
Pollution Prevention Non Recurring-Class I/II
RCRA C-Hazardous Waste RCRA D-Solid Waste Clean Air Act Clean Water Act Hazardous Material Reduction Other Pollution Prevention Non-RecurringSafe Drinking Water Act
Total Pollution Prevention Non-RecurringRecurring-Class 0
Manpower Education & Training
Sub-Total Personnel Pollution Prevention Recurring
Total Pollution Prevention
0.000 0.000 0.000
940.000 0.000
210.000 250.0001400.000
0.000 0.000 0.000
920.000 55.000
203.000 100.0001278.000
0.000 0.000 0.000
900.000 50.000
200.000 100.0001250.000
0.000 0.000 0.000
880.000 50.000
180.000 100.0001210.000
0.000 0.000 0.000
640.000 50.000 75.000
0.000 765.000
0.000 0.000 0.000
665.000 95.000 45.000 75.000880.000
0.000 0.000 0.000
576.282 85.329 16.020
0.000677.631
950.000 15.000965.000
948.000 14.000962.000
925.000 14.000939.000
909.000 12.000921.000
900.000 10.000
910.000
898.000 9.000
907.000
889.605 7.818
897.423 39.986 82.000 152.000 182.000 195.000 200.000 212.000
Page 6 of 10
UNCLASSIFIED
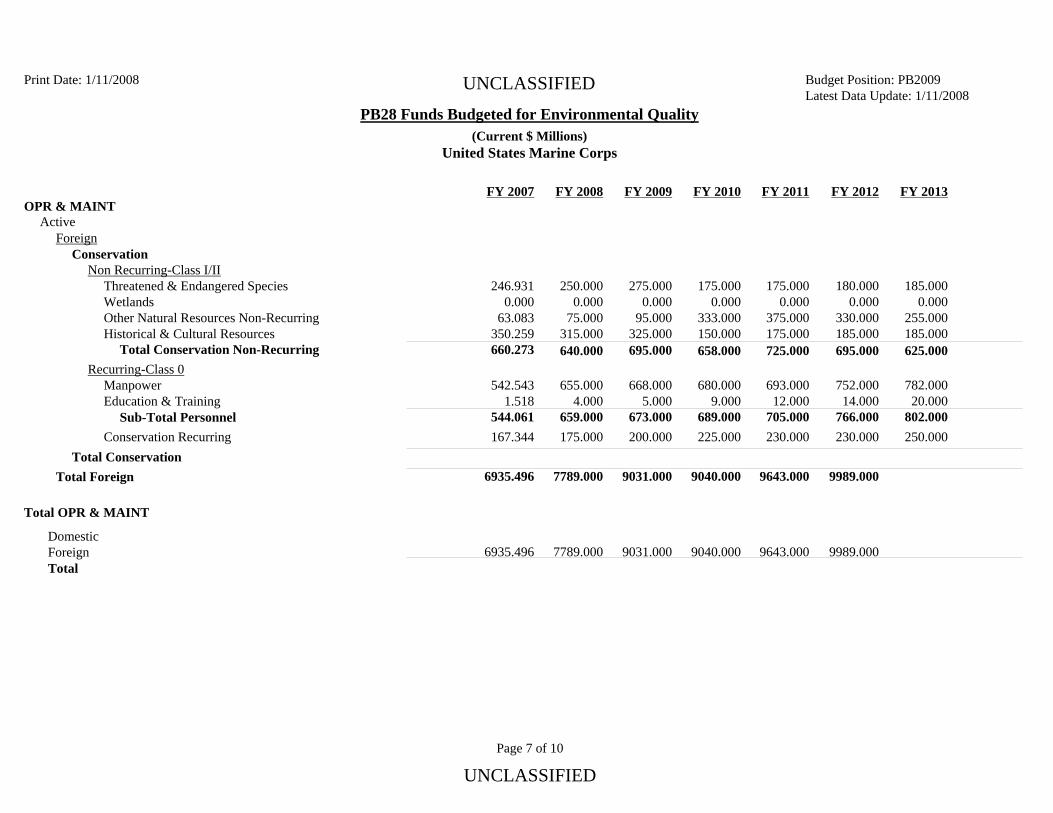
Print Date: 1/11/2008 UNCLASSIFIED Latest Data Update: 1/11Budget Position: PB2009
/2008PB28 Funds Budgeted for Environmental Quality
(Current $ Millions)United States Marine Corps
FY 2007 FY 2008 FY 2009 FY 2010 FY 2011 FY 2012 FY 2013OPR & MAINT
Active Foreign
Conservation Non Recurring-Class I/II
Threatened & Endangered Species Wetlands Other Natural Resources Non-Recurring Historical & Cultural Resources
Total Conservation Non-Recurring Recurring-Class 0
Manpower Education & Training
Sub-Total Personnel Conservation Recurring
Total Conservation Total Foreign
185.000 0.000
255.000 185.000
625.000
180.000 0.000
330.000 185.000
695.000
175.000 0.000
375.000 175.000
725.000
175.000 0.000
333.000 150.000
658.000
275.000 0.000
95.000 325.000 695.000
250.000 0.000
75.000 315.000
640.000
246.931 0.000
63.083 350.259
660.273
782.000 20.000802.000
752.000 14.000766.000
693.000 12.000705.000
680.000 9.000
689.000
668.000 5.000
673.000
655.000 4.000
659.000
542.543 1.518
544.061 167.344 175.000 200.000 225.000 230.000 230.000 250.000
9989.000 9643.000 9040.000 9031.000 7789.000 6935.496
Total OPR & MAINT Domestic Foreign Total
9989.0009643.0009040.000 9031.0007789.0006935.496
Page 7 of 10
UNCLASSIFIED
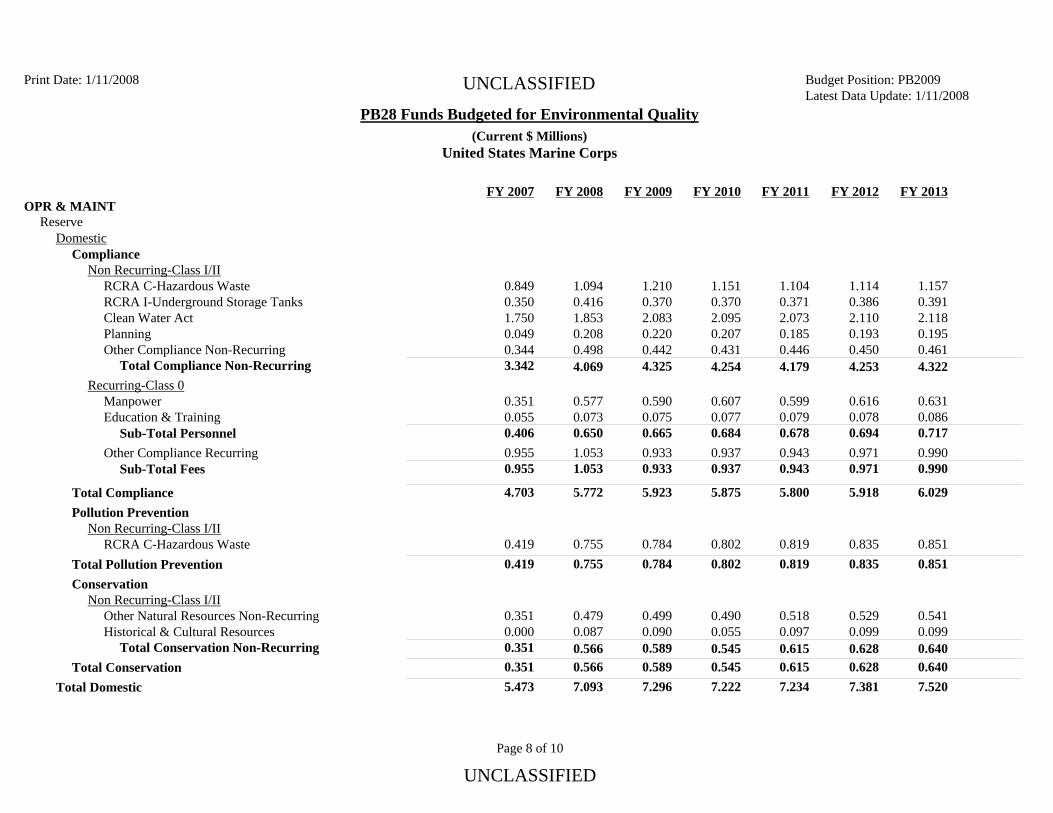
Print Date: 1/11/2008 UNCLASSIFIED Latest Data Update: 1/11Budget Position: PB2009
/2008PB28 Funds Budgeted for Environmental Quality
(Current $ Millions)United States Marine Corps
FY 2007 FY 2008 FY 2009 FY 2010 FY 2011 FY 2012 FY 2013OPR & MAINT
Reserve Domestic
Compliance Non Recurring-Class I/II
RCRA C-Hazardous Waste RCRA I-Underground Storage Tanks Clean Water Act Planning Other Compliance Non-Recurring
Total Compliance Non-Recurring Recurring-Class 0
Manpower Education & Training
Sub-Total Personnel Other Compliance Recurring
Sub-Total Fees
1.157 0.391 2.118 0.195 0.461
4.322
1.114 0.386 2.110 0.193 0.450
4.253
1.104 0.371 2.073 0.185 0.446
4.179
1.151 0.370 2.095 0.207 0.431
4.254
1.210 0.370 2.083 0.220 0.442 4.325
1.094 0.416 1.853 0.208 0.498
4.069
0.849 0.350 1.750 0.049 0.344
3.342
0.631 0.086
0.717
0.616 0.078
0.694
0.599 0.079
0.678
0.607 0.077
0.684
0.590 0.075 0.665
0.577 0.073
0.650
0.351 0.055
0.406 0.990
0.990 0.971
0.971 0.943
0.943 0.937
0.937 0.933 0.933
1.0531.053
0.9550.955
Total Compliance Pollution Prevention
Non Recurring-Class I/II RCRA C-Hazardous Waste
Total Pollution Prevention Conservation
Non Recurring-Class I/II Other Natural Resources Non-Recurring Historical & Cultural Resources
Total Conservation Non-Recurring Total Conservation
Total Domestic
6.029 5.918 5.800 5.875 5.772 4.703 5.923
0.419 0.755 0.784 0.802 0.819 0.835 0.851 0.851 0.835 0.819 0.802 0.755 0.419 0.784
0.541 0.099
0.640
0.529 0.099
0.628
0.518 0.097
0.615
0.490 0.055
0.545
0.499 0.090 0.589
0.479 0.087
0.566
0.351 0.000
0.351 0.640 0.628 0.615 0.545 0.566 0.351 0.589 7.520 7.381 7.234 7.222 7.296 7.093 5.473
Page 8 of 10
UNCLASSIFIED
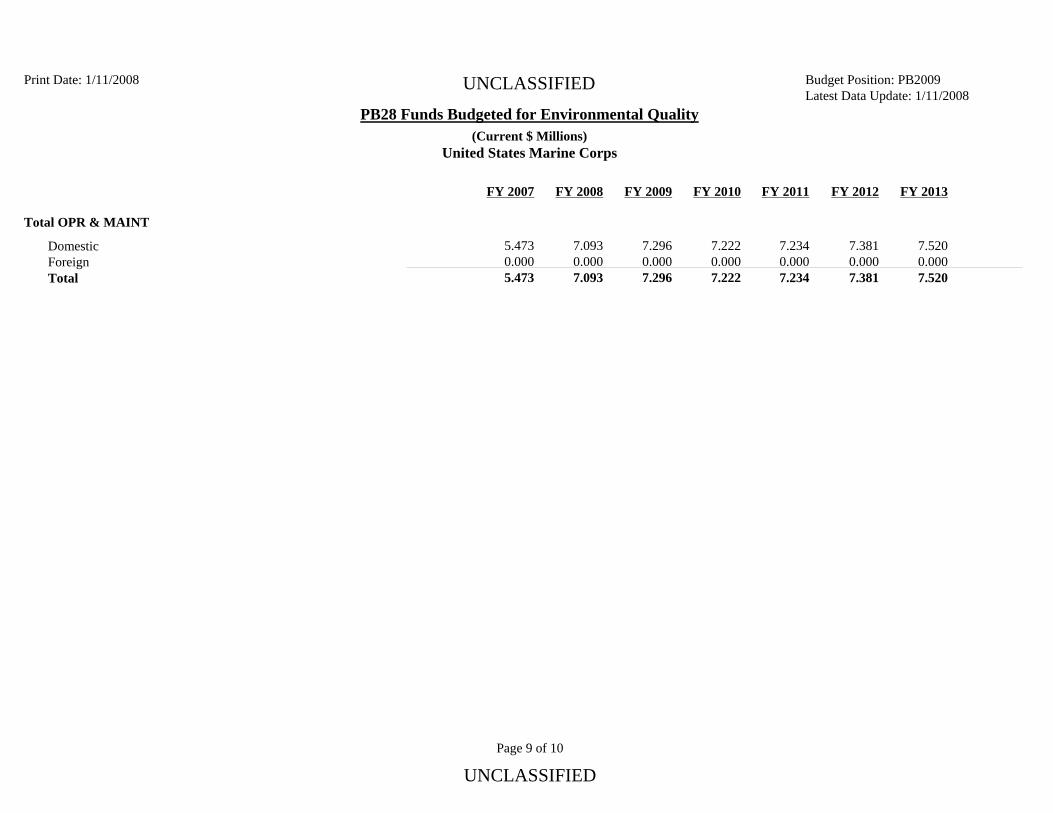
Print Date: 1/11/2008 UNCLASSIFIED Latest Data Update: 1/11Budget Position: PB2009
/2008PB28 Funds Budgeted for Environmental Quality
(Current $ Millions)United States Marine Corps
FY 2007 FY 2008 FY 2009 FY 2010 FY 2011 FY 2012 FY 2013
Total OPR & MAINT Domestic Foreign Total
7.520
7.5200.000
7.381
7.3810.000
7.234
7.2340.000
7.222
7.2220.000
7.296
7.296 0.000
7.093
7.0930.000
5.473
5.4730.000
Page 9 of 10
UNCLASSIFIED
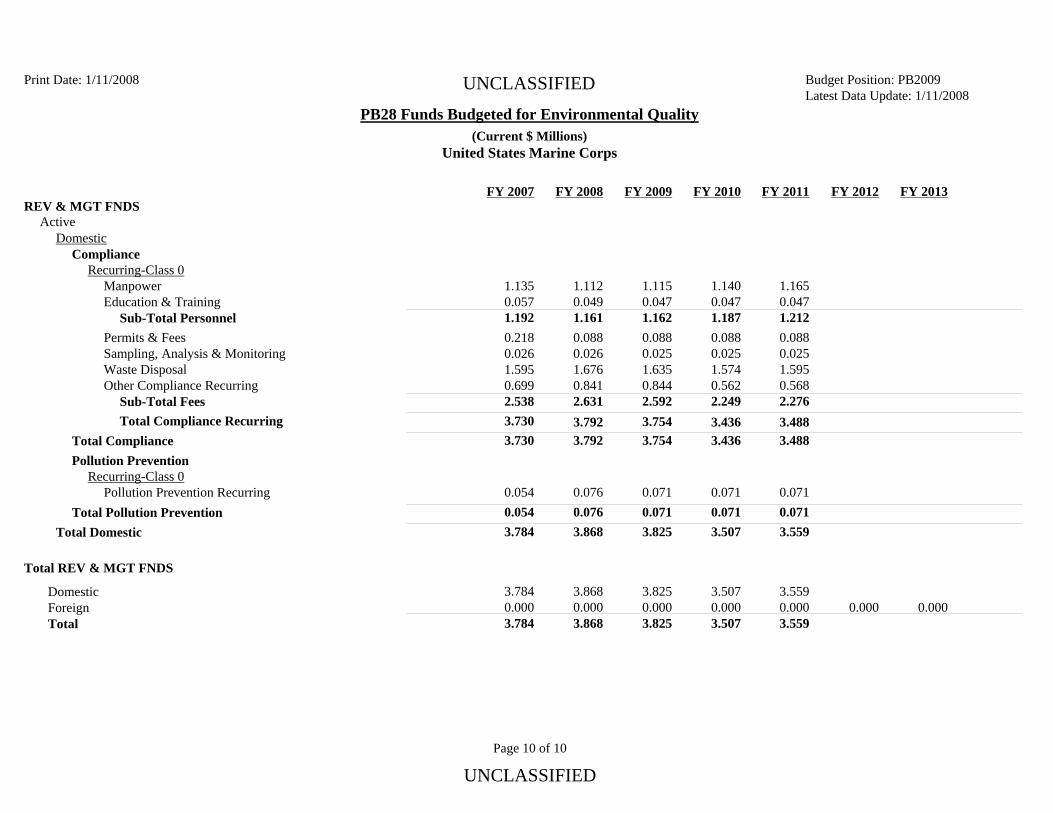
1.165 0.047
1.212
1.140 0.047
1.187
1.115 0.047 1.162
1.112 0.049
1.161
1.135 0.057
1.192 0.088 0.025 1.595 0.568
2.276
0.088 0.025 1.574 0.562
2.249
0.088 0.025 1.635 0.844 2.592
0.088 0.026 1.676 0.841
2.631
0.218 0.026 1.595 0.699
2.5383.4883.4363.7923.730 3.754
3.488 3.436 3.792 3.730 3.754
0.071 0.071 0.076 0.054 0.071 3.559 3.507 3.825 3.868 3.784
0.0000.0003.559
3.5590.000
3.507
3.5070.000
3.825
3.825 0.000
3.868
3.8680.000
3.784
3.7840.000
Latest Data Update: 1/11Budget Position: PB2009
/2008
FY 2013FY 2012FY 2011
0.071
FY 2010
0.071
PB28 Funds Budgeted for Environmental Quality
FY 2009
0.071
(Current $ Millions)United States Marine Corps
FY 2008
0.076
UNCLASSIFIED
UNCLASSIFIED
Page 10 of 10
FY 2007
0.054
REV & MGT FNDS Active
Domestic Compliance
Recurring-Class 0 Manpower Education & Training
Sub-Total Personnel Permits & Fees Sampling, Analysis & Monitoring Waste Disposal Other Compliance Recurring
Sub-Total Fees Total Compliance Recurring
Total Compliance Pollution Prevention
Recurring-Class 0 Pollution Prevention Recurring
Total Pollution Prevention Total Domestic
Total REV & MGT FNDS
Print Date: 1/11/2008
Domestic Foreign Total
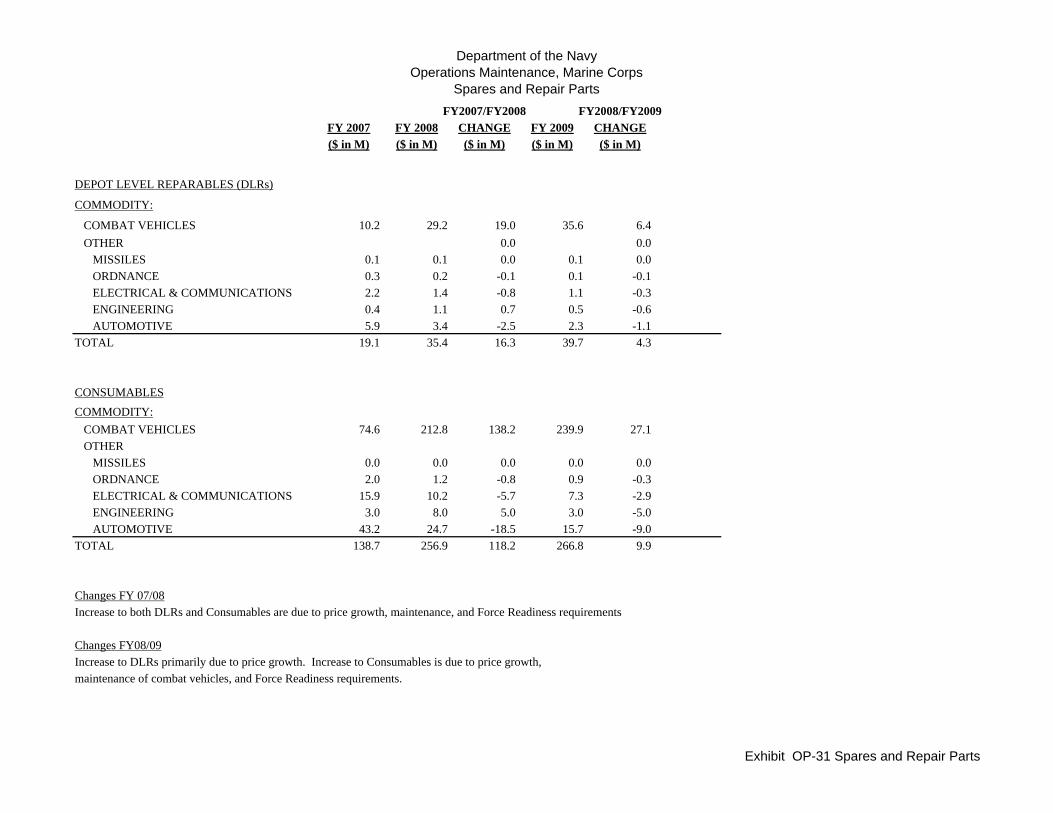
Department of the NavyOperations Maintenance, Marine Corps
Spares and Repair PartsFY2007/FY2008 FY2008/FY2009
FY 2007 FY 2008 CHANGE FY 2009 CHANGE($ in M) ($ in M) ($ in M) ($ in M) ($ in M)
DEPOT LEVEL REPARABLES (DLRs)
COMMODITY:
COMBAT VEHICLES 10.2 29.2 19.0 35.6 6.4 OTHER 0.0 0.0 MISSILES 0.1 0.1 0.0 0.1 0.0 ORDNANCE 0.3 0.2 -0.1 0.1 -0.1 ELECTRICAL & COMMUNICATIONS 2.2 1.4 -0.8 1.1 -0.3 ENGINEERING 0.4 1.1 0.7 0.5 -0.6 AUTOMOTIVE 5.9 3.4 -2.5 2.3 -1.1TOTAL 19.1 35.4 16.3 39.7 4.3
CONSUMABLESCOMMODITY: COMBAT VEHICLES 74.6 212.8 138.2 239.9 27.1 OTHER MISSILES 0.0 0.0 0.0 0.0 0.0 ORDNANCE 2.0 1.2 -0.8 0.9 -0.3 ELECTRICAL & COMMUNICATIONS 15.9 10.2 -5.7 7.3 -2.9 ENGINEERING 3.0 8.0 5.0 3.0 -5.0 AUTOMOTIVE 43.2 24.7 -18.5 15.7 -9.0TOTAL 138.7 256.9 118.2 266.8 9.9
Changes FY 07/08Increase to both DLRs and Consumables are due to price growth, maintenance, and Force Readiness requirements
Changes FY08/09Increase to DLRs primarily due to price growth. Increase to Consumables is due to price growth,maintenance of combat vehicles, and Force Readiness requirements.
Exhibit OP-31 Spares and Repair Parts