Embed Size (px)
Citation preview
DEPARTMENT OF THE NAVY FISCAL YEAR (FY) 2011
BUDGET ESTIMATES
JUSTIFICATION OF ESTIMATES FEBRUARY 2010
NAVY WORKING CAPITAL FUND

February 2010 Navy Working Capital Fund
NAVY WORKING CAPITAL FUND (NWCF)
The NWCF is a revolving fund that finances Department of the Navy activities that
provide products and services on a reimbursable basis, based on a customer‐
provider relationship between operating units and support organizations.
Customers send funded orders to the NWCF providers who furnish the services or
products, pay for incurred expenses, and bill the customers, who in turn authorize
payment. Unlike profit‐oriented commercial businesses, working capital fund
activities strive to break even over the budget cycle.
The five NWCF activity groups, Supply Management, Depot Maintenance, Research
and Development, Base Support, and Transportation, provide a wide range of goods
and services to support the Department’s ongoing operations to maintain overall
military readiness and Overseas Contingency Operations (OCO). NWCF activity
groups will deliver goods and services valued at approximately $27 billion to their
customers in FY 2011. No major changes to the business base are expected in
FY 2011 over FY 2010 levels.
Supply Management
Supply Management performs inventory management functions that result in the
sale of aviation and shipboard components, ship’s store stock, and consumables to a
wide variety of customers. A key component of the logistics capability area, Supply
Management is central to assuring that DON and DoD operating forces and their
equipment have the necessary supplies, spare parts, and components to conduct
OCO engagements, various types of training,
and any potential contingencies. Supply
Management also supports contracting,
resale, transportation, food service, and
other quality of life programs. Warfighting
units rely on provision of the right material
at the proper place, time, and cost. Supply
Management recoups its costs through
stabilized rates.
Navy Supply continues deployment of the Navy Enterprise Resource Planning
(ERP) system, using a phased implementation schedule to minimize impact to the
fleet. Implementation at the Naval Inventory Control Point began in FY 2010 and
continues through FY 2011. Three Fleet Industrial Supply Centers (FISCs) will also

February 2010 Navy Working Capital Fund
complete implementation in FY 2011 and the final FISCs, Yokosuka and Sigonella,
go live in FY 2012.
Major cost drivers in the Supply Management inventory are aviation weapons
systems for the F/A‐18, H‐60, and the H‐53, and inventory for aircraft engines.
Additionally, repair and parts demand for the newly supported V‐22 Osprey have
exceeded original forecasts and significantly increased anticipated costs. The
Marine Corps is leading a joint program for procurement of spares for the Mine
Resistant Ambush Protected (MRAP) vehicles while also supporting increased
customer provisioning and replenishment spares requirements for other systems.
Depot Maintenance
The Fleet Readiness Centers (FRCs) and Marine Corps Depots perform depot
maintenance functions to ensure repair, overhaul, and timely updates of the right
types and quantities of weapons systems and support equipment so that deployed
and soon‐to‐deploy units have the battle‐ready items they need to fight and win
both ongoing OCO engagements and any
potential confrontations. Forward‐deployed
individuals perform time‐critical repair and
upgrade functions in‐theater, alongside the
service members they support.
The FRCs are essential for mobilization; repair of
aircraft, engines, and components; and the
manufacture of parts and assemblies. They provide engineering services in the
development of hardware design changes and furnish technical and other
professional services on maintenance and logistics issues. The FRCs overhaul and
repair a wide range of equipment and components. Workload budgeted in FY 2011
is often material intensive, requiring fewer direct labor hours to repair. Contractors
are used to supplement the organic workforce during workload peaks.
MRAP vehicle workload continues to grow
at the Marine Corps Depots and includes
repairs and upgrades to vehicles in‐theater
as well as some work at the depots.
Current projections of other workload
includes repair of combat‐damaged
equipment and weapons systems returning
from OIF/OEF as well as armor/ballistic
protection upgrades prior to OCO
February 2010 Navy Working Capital Fund
deployments. The impacts of the changing force levels associated with OCO
continue to develop and will have an impact on depot maintenance operations.
Increases in workload over current projections can be accommodated by deferring
or canceling planned FY 2011 civilian workforce reductions.
Research and Development
Research and Development includes the Warfare Centers and the Naval Research
Laboratory. R&D activities are very heavily involved in the development,
engineering, acquisition and in‐service support of weapons systems and equipment
for the air, land, sea, and space operating environments that are the key to DON and
DoD success in the force application area now and in the future. Other capability
areas where the R&D activities make major contributions are battlespace awareness,
net‐centric (connectivity and interoperability), and command and control. Their
contributions are evidenced through their research, engineering and testing efforts
in the fields of space, aerial, surface and sub‐surface sensors, communications
systems, multi‐media data fusion, and battle management systems. R&D activities
are also implementing improvements and greater standardization among their
acquisition workforces, thereby contributing to the progression of overall acquisition
process and execution improvement under the corporate management and support
area.
Certain R&D activities support the logistics capability through the repair and
maintenance of select items of operating forces weapons and equipment. This is
done in those instances in which the work is limited in scope, irregular in schedule
and/or very specialized (and therefore not sufficient to warrant fully dedicated
depot facilities or commercial source interest). Success in the logistics area enables
the achievement of force application capability area goals by the operating forces.
Workload at R&D activities remains robust and relatively constant between FY 2009
and FY 2011, of approximately $12 billion annually.
Additionally, NWCF R&D activities have been at the forefront of implementing
Navy ERP. Navy ERP came on‐line at Naval Air Warfare Center in FY 2008. Space
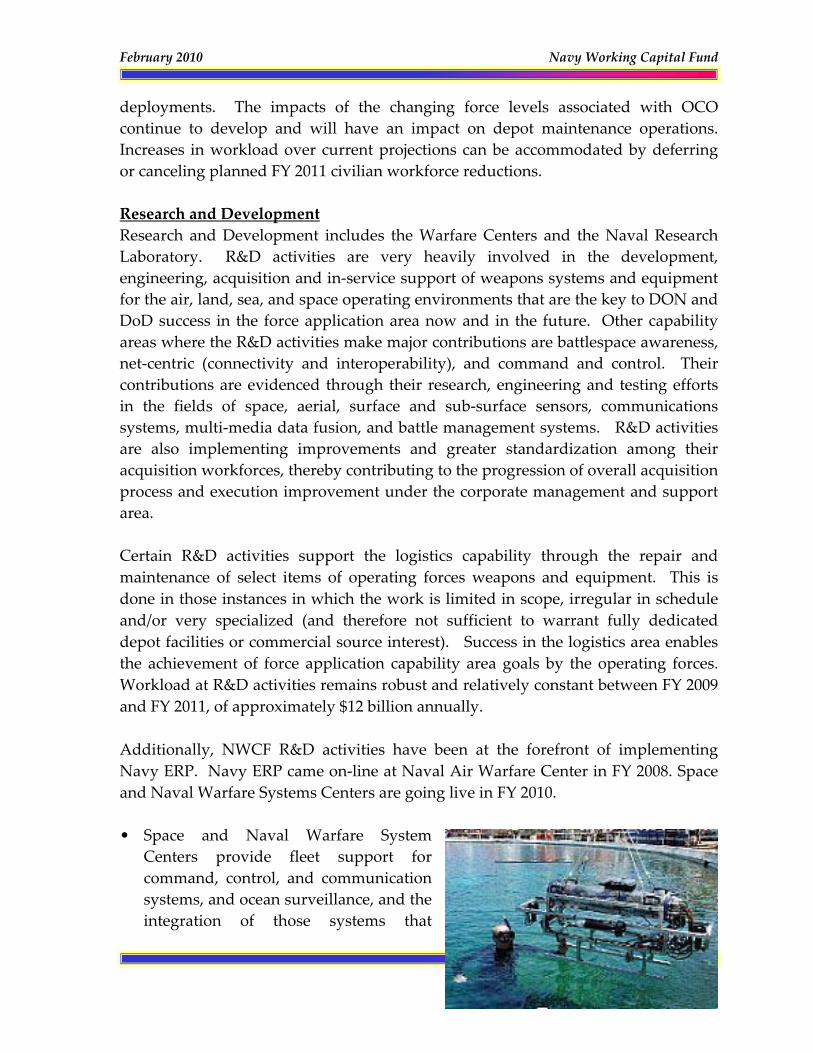
and Naval Warfare Systems Centers are going live in FY 2010.
• Space and Naval Warfare System
Centers provide fleet support for
command, control, and communication
systems, and ocean surveillance, and the
integration of those systems that

February 2010 Navy Working Capital Fund
overarch platforms. The current estimate reflects the impact of the Base
Realignment and Closure V recommendation to consolidate maritime command,
control, communications, computers, intelligence, surveillance, and
reconnaissance (C4ISR) research, development and acquisition, test and
evaluation functions.
• Naval Air Warfare Center provides fleet support for naval aircraft, engines,
avionics, aircraft support systems and ship/shore/air operations. This budget
reflects the realignment of the Naval Air Warfare Center Training Systems
Division (NAWCTSD) from mission funding to the NWCF beginning in FY 2011.
NAWCTSD provides a full range of innovative training solutions, products, and
services. Their core competencies include requirements analysis, systems
engineering, systems acquisition, fielding and sustainment over the training
systems life cycle. Customers include Navy, Army, Air Force, Department of
Defense, and Coast Guard.
• Naval Surface Warfare Center provides fleet support for hull, mechanical, and
electrical systems, surface combat systems, coastal warfare systems, and other
offensive and defensive systems associated with surface warfare.
• Naval Undersea Warfare Center provides fleet support for submarines,
autonomous underwater systems, and offensive and defensive systems
associated with undersea warfare.
• Naval Research Laboratory operates as the DON’s full spectrum corporate
laboratory, conducting a broadly based multidisciplinary program of scientific
research and advanced technological development directed toward maritime
applications of new and improved materials, techniques, equipment, systems,
and ocean, atmospheric, and space sciences and related technologies.
Base Support
The Base Support business area is comprised of the Facilities Engineering
Commands (FECs) and the Naval Facilities Engineering Service Center (NFESC).
The FECs provide a broad range of services in the force support area by ensuring
that DON and DoD facilities and installations have reliable access to utilities services
such as electricity, water, steam and natural gas and building/facilities repair,
maintenance and modernization services. NFESC is a DON‐wide technical center
delivering quality products and services in energy and utilities, amphibious and
expeditionary systems, environment and shore, and ocean and waterfront facilities.
In addition, energy efficiency improvements in both buildings and support vehicles
are being implemented by Base Support activities in order to conserve DON and
DoD resources. Facility‐related technology development and environmental testing
is also performed by this group.

February 2010 Navy Working Capital Fund
Even though the FECs are impacted by higher purchased utilities costs and the
addition of new customer workload due to Joint Basing initiatives, they are
implementing energy conservation measures that are expected to limit the growth in
the quantities of electricity and natural gas consumed. They have also incorporated
initiatives to standardize and contain vehicle and equipment operating costs. With
regard to facility management and services, the FECs are curbing the cost growth
associated with facility service contracts by maximizing the use of regional contracts
and seeking fewer and longer term contracts while still maintaining small business
commitments. Transportation
The DON cannot succeed in the logistics area without the contributions of the
Transportation group. While over‐ocean movement of supplies and provisions to
the operating forces is a primary focus of this group, it also maintains prepositioned
equipment and supplies as well as other special mission services, and thereby is
another example of enabling the DON to achieve force application goals whenever
and wherever necessary.
Transportation is comprised of the Military
Sealift Command (MSC) which supports the
fleets, Naval Sea Systems Command, Space
and Naval Warfare Systems and programs.
The three programs budgeted by MSC
through the NWCF are: 1) Naval Fleet
Auxiliary Force which provides support
utilizing civilian mariner manned non‐
combatant ships for material support and
ocean going tugs and salvage ships; 2) Special Mission Ships which provide unique
seagoing platforms, operation of Navy command ships, and contracted harbor tugs;
and 3) Afloat Prepositioning Force Navy which deploys advance material for
strategic lift for the Marine Expeditionary Forces.
Activation changes in FY 2011 are for the delivery of two T‐AKEs. Deactivation
changes in FY 2011 are for three T‐AE Ammunition Ships, and two T‐AOT Tanker
Ships.
NWCF Cash
The Departmentʹs goal is to maintain the cash balance in the seven to ten day range
based on the average daily expenditure rate plus a six month projection of outlays to

February 2010 Navy Working Capital Fund
procure capital investments. The cash forecast of collections and disbursements
considers cyclical timing (i.e. payroll disbursements based on payroll periods;
timing of major disbursements including capital purchases, vendor payments within
and outside government, long lead contract accruals, and transfers if known). The
NWCF cash balance fluctuates due primarily to the return of excess accumulated
operating results for prior year gains and the transition to Navy ERP.

February 2010 Navy Working Capital Fund
(Dollars in millions)
New Orders FY 2009 FY 2010 FY 2011
Supply ‐ Navy 5,955.6 5,712.7 5,979.4
Supply ‐ Marine Corps 130.0 126.8 136.5
Depot Maintenance ‐ Ships 0.0 0.0 0.0
Depot Maintenance ‐ Aircraft 2,238.4 1,856.8 1,976.0
Depot Maintenance ‐ Marine Corps 551.4 275.0 295.3
R&D ‐ Air Warfare Center 3,506.3 3,563.2 3,647.6
R&D ‐ Surface Warfare Center 3,850.4 3,759.1 3,870.3
R&D ‐ Undersea Warfare Center 1,128.2 1,013.8 1,024.6
R&D ‐ SPAWAR Systems Center 2,719.5 2,704.8 2,646.9
R&D ‐ Naval Research Laboratory 698.0 675.3 699.2
Transportation ‐ MSC 2,445.2 2,715.0 2,654.4
Base Support ‐ FECs 2,719.7 2,780.2 2,922.2
Base Support ‐ NFESC 125.8 104.3 104.1
Totals 26,068.3 25,287.0 25,956.6
(Dollars in millions)
Revenue FY 2009 FY 2010 FY 2011
Supply ‐ Navy 5,926.7 6,021.2 6,347.5
Supply ‐ Marine Corps 119.8 121.6 129.9
Depot Maintenance ‐ Ships 17.3 0.0 0.0
Depot Maintenance ‐ Aircraft 2,161.2 1,849.3 1,895.1
Depot Maintenance ‐ Marine Corps 589.2 440.1 355.5
R&D ‐ Air Warfare Center 3,468.1 3,557.1 3,719.1
R&D ‐ Surface Warfare Center 3,816.2 3,846.0 3,947.1
R&D ‐ Undersea Warfare Center 1,147.0 1,022.1 1,048.6
R&D ‐ SPAWAR Systems Center 2,523.0 2,759.0 2,653.8
R&D ‐ Naval Research Laboratory 675.9 680.3 706.7
Transportation ‐ MSC 2,367.9 2,715.0 2,654.4
Base Support ‐ FECs 2,676.9 2,776.1 2,920.1
Base Support ‐ NFESC 104.0 102.5 104.9
Totals 25,593.2 25,890.3 26,482.7

February 2010 Navy Working Capital Fund
Cost of Goods Sold: (Operating)
Total operating obligations for supply functions and cost of good and services sold for
industrial functions are as follows:
(Dollars in millions)
Operating Costs FY 2009 FY 2010 FY 2011
Supply ‐ Navy 6,156.5 6,486.0 6,635.3
Supply ‐ Marine Corps 108.3 141.7 149.8
Depot Maintenance ‐ Ships 10.9 0.0 0.0
Depot Maintenance ‐ Aircraft 2,150.5 1,842.3 1,871.3
Depot Maintenance ‐ Marine Corps 591.8 448.3 348.2
R&D ‐ Air Warfare Center 3,486.5 3,553.0 3,712.7
R&D ‐ Surface Warfare Center 3,794.3 3,873.1 3,987.5
R&D ‐ Undersea Warfare Center 1,146.2 1,032.6 1,055.1
R&D ‐ SPAWAR Systems Center 2,464.6 2,749.5 2,704.2
R&D ‐ Naval Research Laboratory 670.7 693.7 711.4
Transportation ‐ MSC 2,438.2 2,766.4 2,740.3
Base Support ‐ FECs 2,725.4 2,726.4 2,832.9
Base Support ‐ NFESC 105.1 102.5 104.6
Totals 25,849.1 26,415.6 26,853.2

February 2010 Navy Working Capital Fund
Net Operating Results:
Revenue, excluding surcharge collections and extraordinary expenses, less the cost of goods and services sold to customers is as follows:
(Dollars in millions)
Net Operating Results FY 2009 FY 2010 FY 2011
Supply ‐ Navy ‐75.7 ‐55.9 164.5
Supply ‐ Marine Corps ‐2.5 0.0 7.6
Depot Maintenance ‐ Ships 6.4 0.0 0.0
Depot Maintenance ‐ Aircraft 10.7 7.1 23.8
Depot Maintenance ‐ Marine Corps ‐2.6 ‐8.2 3.6
R&D ‐ Air Warfare Center ‐18.4 4.1 6.4
R&D ‐ Surface Warfare Center 21.9 ‐27.2 ‐40.4
R&D ‐ Undersea Warfare Center 0.8 ‐10.5 ‐6.5
R&D ‐ SPAWAR Systems Center 58.4 9.5 ‐56.4
R&D ‐ Naval Research Laboratory 1.8 ‐13.4 ‐4.7
Transportation ‐ MSC ‐70.4 ‐51.4 ‐86.0
Base Support ‐ FECs ‐48.5 49.7 87.3
Base Support ‐ NFESC ‐1.1 0.0 0.4
Totals ‐119.3 ‐96.3 99.6 (Dollars in millions)
Accumulated Operating Results FY 2009 FY 2010 FY 2011
Supply ‐ Navy ‐108.5 ‐164.5 0.0
Supply ‐ Marine Corps ‐7.6 ‐7.6 0.0
Depot Maintenance ‐ Ships 10.5 0.0 0.0
Depot Maintenance ‐ Aircraft ‐30.9 ‐23.8 0.0
Depot Maintenance ‐ Marine Corps 4.6 ‐3.6 0.0
R&D ‐ Air Warfare Center ‐10.5 ‐6.4 0.0
R&D ‐ Surface Warfare Center 67.5 40.4 0.0
R&D ‐ Undersea Warfare Center 17.0 6.5 0.0
R&D ‐ SPAWAR Systems Center 46.9 56.4 0.0
R&D ‐ Naval Research Laboratory 18.2 4.7 0.0
Transportation ‐ MSC 137.3 86.0 0.0
Base Support ‐ FECs ‐137.0 ‐87.3 0.0
Base Support ‐ NFESC ‐0.4 ‐0.4 0.0
Totals 7.3 ‐99.5 0.0

February 2010 Navy Working Capital Fund
Workload:
Workload projections for NWCF activities are consistent with Navy force structure and
attendant support levels as well as those factors unique to each group. The table below
displays year‐to‐year percentage changes in transportation ship days for MSC, changes in
program costs for Base Support – FECs, and change in direct labor hours for all other
industrial activity groups. For supply business areas, workload changes are indicated by
gross sales:
Workload FY 2010 FY 2011
Supply ‐ Navy 0.2% 4.3%
Supply ‐ Marine Corps 4.2% 6.5%
Depot Maintenance ‐ Ships na na
Depot Maintenance ‐ Aircraft ‐13.3% 1.1%
Depot Maintenance ‐ Marine Corps ‐27.8% ‐30.6%
R&D ‐ Air Warfare Center ‐0.5% 8.2%
R&D ‐ Surface Warfare Center 0.4% 0.1%
R&D ‐ Undersea Warfare Center ‐0.2% 0.0%
R&D ‐ SPAWAR Systems Center ‐1.1% 1.1%
R&D ‐ Naval Research Laboratory ‐0.9% 0.0%
Transportation ‐ MSC 6.6% ‐2.7%
Base Support ‐ FECs 0.0% 3.9%
Base Support ‐ NFESC ‐12.4% 0.0%

February 2010 Navy Working Capital Fund
(Dollars in millions)
Treasury Cash FY 2009 FY 2010 FY 2011
Beginning Cash Balance 784.6 1,171.1 907.3
Collections 26,097.6 25,873.3 26,443.6
Disbursements 25,696.1 26,185.0 26,506.4
MSC Capital Hire Purchases ‐16.6 0.0 0.0
Inventory Augmentation 1.6 0.0 0.0
Consumable Item Transfer 0.0 48.0 60.0
Ending Cash Balance 1,171.1 907.3 904.6

February 2010 Navy Working Capital Fund
Customer Rate Changes: Approved composite rate changes from FY 2008 to FY 2009 and from FY 2009 to FY 2010 are
displayed below. Proposed composite rate changes FY 2010 to FY 2011 (designed to achieve
an accumulated operating result of zero) are as follows:
(Percent Change)
Customer Rate Change FY 2009 FY 2010 FY 2011
Supply:
Navy ‐ Aviation Consumables 1.7% ‐3.1% ‐2.6%
Navy ‐ Shipboard Consumables 1.2% 1.6% 4.2%
Navy ‐ Aviation Repairables 1.9% 2.2% 3.7%
Navy ‐ Shipboard Repairables 1.2% 1.6% 4.2%
MARCORPS Repairables 8.0% 6.4% 5.6%
Depot Maintenance ‐ Ships na na na
Depot Maintenance ‐ Aircraft 7.8% ‐0.6% 0.4%
Depot Maintenance ‐ Marine Corps 5.7% 0.5% ‐3.1%
R&D ‐ Air Warfare Center 4.2% 2.7% 1.3%
R&D ‐ Surface Warfare Center 2.9% 2.2% 2.4%
R&D ‐ Undersea Warfare Center 2.8% 1.2% 3.2%
R&D ‐ SPAWAR Systems Center 6.8% 2.1% ‐2.1%
R&D ‐ Naval Research Laboratory 3.8% 4.6% 3.9%
Transportation ‐ MSC
Fleet Auxiliary 2.6% 3.0% 7.5%
Special Mission Ships 18.8% 4.0% 6.0%
Afloat Prepositioning Ships ‐33.1% 11.4% 8.6%
Base Support ‐ FECs
East Coast Utilities 9.7% 1.7% 8.5%
East Coast ‐ Other 3.2% ‐0.4% 2.0%
West Coast Utilities 6.2% 4.4% 12.1%
West Coast ‐ Other 0.3% 1.5% 1.2%
Base Support ‐ NFESC 1.5% 1.9% 1.8%

February 2010 Navy Working Capital Fund
Unit Costs:
Unit Cost is the method established to authorize and control costs. Unit cost goals allow
activities to respond to workload changes in execution by encouraging reduced costs when
workload declines and allowing appropriate increases in costs when their customers request
additional services.
Unit Cost FY 2009 FY 2010 FY 2011
Supply ‐ Navy (cost per unit of sales1):
Wholesale 1.032 1.042 0.986
Retail 0.899 1.001 1.001
Supply ‐ Marine Corps (cost per unit of sales1):
Wholesale 0.899 0.867 0.840
Retail 0.910 0.981 0.981
Depot Maintenance ‐ Ships ($/Direct Labor Hour2) na na na
Depot Maintenance ‐ Aircraft ($/Direct Labor Hour) 180.92 177.58 178.46
Depot Maintenance ‐ Marine Corps ($/Direct Labor Hour) 121.57 127.52 142.66
R&D ‐ Air Warfare Center ($/Direct Labor Hour2) 92.19 91.86 95.19
R&D ‐ Surface Warfare Center ($/Direct Labor Hour2) 95.97 100.31 104.06
R&D ‐ Undersea Warfare Center ($/Direct Labor Hour2) 98.12 101.95 105.61
R&D ‐ SPAWAR Systems Center ($/Direct Labor Hour2) 101.27 106.40 107.13
R&D ‐ Naval Research Laboratory ($/Direct Labor Hour2) 133.42 140.55 145.23
Transportation ‐ MSC
Fleet Auxiliary ($/day) 85,769 96,603 105,044
Special Mission Ships ($/day) 19,840 24,422 26,595
Afloat Prepositioning Ships ($/day) 61,117 66,756 71,858
Base Support ‐ FECs Cost of Services various various various
Base Support ‐ NFESC ($/direct Labor Hour2) 101.38 97.93 99.30
1 excludes inventory augmentation and war reserve material obligations2 includes direct labor plus overhead costs

February 2010 Navy Working Capital Fund
Staffing:
Total civilian and military personnel employed at NWCF activities are displayed in the
following tables.
(Strength in Whole Numbers)
Civilian End Strength FY 2009 FY 2010 FY 2011
Supply ‐ Navy 7,069 6,323 6,300
Supply ‐ Marine Corps 24 24 24
Depot Maintenance ‐ Ships 0 0 0
Depot Maintenance ‐ Aircraft 9,115 8,660 8,695
Depot Maintenance ‐ Marine Corps 2,742 2,266 1,995
R&D ‐ Air Warfare Center 11,410 11,364 12,447
R&D ‐ Surface Warfare Center 15,119 14,836 14,857
R&D ‐ Undersea Warfare Center 4,186 4,115 4,182
R&D ‐ SPAWAR Systems Center 6,860 6,660 6,717
R&D ‐ Naval Research Laboratory 2,415 2,357 2,357
Transportation ‐ MSC 5,947 6,372 6,195
Base Support ‐ FECs 9,497 9,447 9,548
Base Support ‐ NFESC 397 384 384
Totals 74,781 72,808 73,701
(Workyears in Whole Numbers)
Civilian Workyears FY 2009 FY 2010 FY 2011
Supply ‐ Navy 7,309 6,318 6,293
Supply ‐ Marine Corps 24 24 24
Depot Maintenance ‐ Ships 0 0 0
Depot Maintenance ‐ Aircraft 9,135 8,733 8,749
Depot Maintenance ‐ Marine Corps 2,431 2,316 2,046
R&D ‐ Air Warfare Center 10,912 10,992 12,046
R&D ‐ Surface Warfare Center 14,462 14,778 14,858
R&D ‐ Undersea Warfare Center 4,057 4,073 4,113
R&D ‐ SPAWAR Systems Center 6,534 6,547 6,604
R&D ‐ Naval Research Laboratory 2,301 2,301 2,301
Transportation ‐ MSC 7,736 8,325 8,006
Base Support ‐ FECs 9,339 9,412 9,495
Base Support ‐ NFESC 381 373 373
Totals 74,621 74,192 74,908

February 2010 Navy Working Capital Fund
(Strength in Whole Numbers)
Military End Strength FY 2009 FY 2010 FY 2011
Supply ‐ Navy 369 369 369
Supply ‐ Marine Corps 0 0 0
Depot Maintenance ‐ Ships 0 0 0
Depot Maintenance ‐ Aircraft 109 122 123
Depot Maintenance ‐ Marine Corps 15 11 12
R&D ‐ Air Warfare Center 140 190 232
R&D ‐ Surface Warfare Center 201 232 231
R&D ‐ Undersea Warfare Center 33 40 40
R&D ‐ SPAWAR Systems Center 70 78 79
R&D ‐ Naval Research Laboratory 69 67 69
Transportation ‐ MSC 317 368 407
Base Support ‐ FECs 78 78 78
Base Support ‐ NFESC 3 3 3
Totals 1,404 1,558 1,643
(Workyears in Whole Numbers)
Military Workyears FY 2009 FY 2010 FY 2011
Supply ‐ Navy 369 369 369
Supply ‐ Marine Corps 0 0 0
Depot Maintenance ‐ Ships 0 0 0
Depot Maintenance ‐ Aircraft 95 122 123
Depot Maintenance ‐ Marine Corps 16 11 12
R&D ‐ Air Warfare Center 130 140 176
R&D ‐ Surface Warfare Center 175 235 231
R&D ‐ Undersea Warfare Center 35 38 38
R&D ‐ SPAWAR Systems Center 70 78 79
R&D ‐ Naval Research Laboratory 69 67 69
Transportation ‐ MSC 355 344 380
Base Support ‐ FECs 78 78 78
Base Support ‐ NFESC 3 3 3
Totals 1,395 1,485 1,558

February 2010 Navy Working Capital Fund
Performance Budgeting. The NWCF utilizes a wide range of cascading performance
information in support of a broad spectrum of financial and program performance metrics
employed in the Department of Defense. By its very nature as a revolving fund, the NWCF
budget can be viewed as a performance budget that routinely identifies the full cost of
specific business activity (such as Fleet Readiness Centers or Supply Management)
including identification of all financing sources to meet customer driven workload. As
such, performance indicators (financial and programmatic) listed throughout the NWCF
justification book, as well as the myriad of performance information contained in the
various appropriation justification books, have supported the hierarchical composition
starting with the Department of the Navy Balanced Scorecard, and merging with the DoD
Balanced Scorecard, the OMB Program Assessment Rating Tool (PART), and culminating
with the President’s Management Agenda. Key financial/program indicators include: Net
Operating Result (NOR), Accumulated Operating Result (AOR), Sources of Revenue,
NWCF Cash, Manpower Staffing, Unit Cost, Cost of Goods Sold, and Capital Investment
Program.
Key NWCF Performance Integration: DON DoD OMB President’s
Scorecard Scorecard PART Mgmt Agenda Fleet Readiness Centers: Combat Capability Operational Risk Aircraft Maintenance Budget Integration Marine Corps Depots: Combat Capability Operational Risk Depot Maintenance Budget Integration R&D Warfare Centers: Tech Insertion Future Challenges Multiple R&D Budget Integration Military Sealift: Combat Capability Operational Risk Ship Operations Budget Integration Facilities Engineering: Improved Business Institutional Risk Base Support Budget Integration Supply Management: Combat Capability Operational Risk Spares & Repair Parts Budget Integration

February 2010 Navy Working Capital Fund
(Dollars in Millions)
Capital Purchase Program FY 2009 FY 2010 FY 2011
Supply ‐ Navy 14.7 9.1 7.3
Supply ‐ Marine Corps 0.0 0.0 0.0
Depot Maintenance ‐ Ships na na na
Depot Maintenance ‐ Aircraft 33.2 44.8 45.3
Depot Maintenance ‐ Marine Corps 10.1 10.1 10.1
R&D ‐ Air Warfare Center 34.0 38.1 38.1
R&D ‐ Surface Warfare Center 29.6 33.6 39.2
R&D ‐ Undersea Warfare Center 15.2 17.1 18.5
R&D ‐ SPAWAR Systems Center 8.2 11.8 16.5
R&D ‐ Naval Research Laboratory 13.4 14.3 14.5
Transportation ‐ MSC 10.9 16.6 15.9
Base Support ‐ FECs 19.1 29.4 19.8
Base Support ‐ NFESC 0.0 0.5 0.0
Totals 188.2 225.3 225.2
Equipment (Non‐ADPE/Telecom) 92.644 124.524 115.156
ADPE and Telecommunications Equip 31.965 41.434 42.619
Software Development 22.724 14.846 16.488
Minor Construction 40.905 44.468 50.963
Totals 188.2 225.3 225.2

February 2010 Navy Working Capital Fund
FY 2009 FY 2010 FY 2011
06‐08 07‐09 08‐10 FY 2009 FY 2010 FY 2011 6% 6% 6%
Revenue
Working Capital Fund 2,468.1 2,603.4 2,553.2 135.6 120.8 122.7
Appropriations 0.0 0.0 0.0
Total Revenue 2,468.1 2,603.4 2,553.2 148.1 156.2 153.2
Working Capital Fund Depot Maintenance Investment
WCF Capital Investment Program 43.3 54.9 55.4
Facilities Sustainment, Restoration and Modernization 49.9 37.5 41.2
Equipment 18.4 18.4 16.1
Equip purchase by Depots < Exp/Invest Threshold 13.9 14.0 11.7
Equip purchase by Other Orgs < Exp/Invest Threshold 3.3 3.7 3.7
Equip purchase by Other Ors >Exp/Invest Threshold 1.2 0.7 0.7
Productivity Enhancements 0.0 0.0 0.0
Total WCF Investment 111.6 110.8 112.7
Appropriated Funding
Facility Sustainment, Restoration and Modernization 0.0 0.0 0.0
Equipment 7.2 10.0 10.0
Equip purchase by Depots < Exp/Invest Threshold 0.0 0.0 0.0
Equip purchase by Other Orgs < Exp/Invest Threshold 5.2 5.0 5.0
Equip purchase by Other Ors >Exp/Invest Threshold 2.0 5.0 5.0
Capital Investment Program (Other Procurement, Navy) 0.0 0.0 0.0
Productivity Enhancements 0.0 0.0 0.0
Military Construction (MILCON) 16.8 0.0 0.0
Total Appropriated Funding 24.0 10.0 10.0
Component Total 135.6 120.8 122.7 ‐12.5 ‐35.4 ‐30.5
Revenue Difference
Percent of Revenue
FEBRUARY 2010
AMOUNT IN MILLIONS
Revenue 3‐Year Average Budgeted Capital
Budget Minus 6 Percent of
DEPOT MAINTENANCE SIX PERCENT CAPITAL INVESTMENT PLAN
DEPARTMENT OF THE NAVY
COMPONENT: TOTAL NAVY WORKING CAPITAL FUND DEPOTS
FISCAL YEAR (FY) 2011 BUDGET ESTIMATES
The table above reflects data for two NWCF activity groups: the Fleet Readiness Centers and the Marine Corps Depots. The six percent threshold is applicable at the Department of the Navy level, to include both NWCF and appropriated fund (shipyard) activities. When shipyard results are added to the NWCF profile, the DON exceeds the threshold.
Fleet Readiness Centers

NARRATIVE SUMMARY OF OPERATIONS
DEPARTMENT OF THE NAVY
DEPOT MAINTENANCE
FLEET READINESS CENTERS
FISCAL YEAR (FY) 2010 BUDGET ESTIMATES
FEBRUARY 2010
ACTIVITY GROUP FUNCTION
To provide responsive worldwide maintenance, engineering, and logistics support to the Naval
Aviation Enterprise. The Fleet Readiness Centers (FRCs) ensure a core industrial resource base
essential for mobilization; repair aircraft, engines, and components, and manufacture parts and
assemblies; provide engineering services in the development of hardware design changes, and
furnish technical and other professional services on maintenance and logistics problems.
ACTIVITY GROUP COMPOSITION
Activities Location
FRC, EAST Cherry Point, NC
FRC, SOUTHEAST Jacksonville, FL
FRC, SOUTHWEST San Diego, CA
BUDGET HIGHLIGHTS
General
The FRCs provide significant support to Fleet operations by overhauling and repairing a wide
range of equipment and components. Their efforts include important workload related to the
Overseas Contingency Operations (OCO) such as the repair of crash damaged AV‐8B and F/A‐
18 aircraft. The FRCs are also restoring “mothballed” CH‐53 helicopters to operational status.
The FY 2010 budget estimate reflects a positive $7.1 million NOR and FY 2011 is budgeted for a
zero AOR.
Summary of Operations – Fleet Readiness Centers
($ in Millions)
FY 2009 FY 2010 FY 2011
Orders 2,238.4 1,856.8 1,976.0
Revenue 2,161.2 1,849.3 1,895.1
Cost of Goods and Services Sold 2,150.5 1,842.3 1,871.3
Revenue less Costs 10.7 7.1 23.8
Other Adjustments 0.0 0.0 0.0
Net Operating Result (NOR) 10.7 7.1 23.8
Accumulated Operating Result (AOR) ‐30.9 ‐23.8 0.0

NARRATIVE SUMMARY OF OPERATIONS
DEPARTMENT OF THE NAVY
DEPOT MAINTENANCE
FLEET READINESS CENTERS
FISCAL YEAR (FY) 2010 BUDGET ESTIMATES
FEBRUARY 2010
Orders. New reimbursable orders for FY 2009, FY 2010, and FY2011 are $2,238.4M, $1,856.8M,
and $1,976.0M respectively. FY 2009 new orders increased $338.8M from the FY 2010
President’s Budget. The FY 2009 New Orders increase is mainly attributed to the airframes and
engines programs due to the receipt of OCO funding. FY 2010 new orders decreased $1.8M
from the President’s Budget.
Revenue. Revenue is $2,161.2M for FY 2009, $1,849.3M for FY 2010, and $1,895.1M for FY 2011.
FY 2010 revenue increased $1.7M from the FY 2010 President’s Budget. FY 2011 includes
$23.8M in AOR recovery (primarily due to FY 2009 losses in the engines program) to achieve a
zero AOR. The FY 2010 prices for fuel in this submission are calculated using the current fuel
composite rate of $118.02 per barrel versus the FY 2010 Presidentʹs Budget rate of $89.46. This
will result in a projected revenue shortfall of $1.696M; $1.476M of this amount is being
requested as a direct Working Capital Fund (WCF) appropriation in the FY 2010 supplemental
and the remainder will be handled from either WCF cash balances or through an additional
customer surcharge.
Cost of Goods & Services Sold. Cost of Goods and Services Sold is $2,150.5M in FY 2009,
$1,842.3M in FY 2010, and $1,871.3M in FY 2011.
Revenue Less Cost of Goods and Services Sold. Revenue less cost of goods and services sold
for FY 2009, FY 2010, and FY 2011 is $10.7M, $7.1M, and $23.8M, respectively.
Treasury Cash. Treasury Cash is $78.1M in FY 2009, $4.6M in FY 2010, and $36.9M in FY 2011.
($ in Millions)
FY 2009 FY 2010 FY 2011
Disbursements $2,141.1 $1,902.8 $1,832.3
Collections $2,219.2 $1,846.3 $1,869.2
Net Outlays ‐$78.1 $56.5 ‐$36.9
Stabilized Customer Rates.
($ in Millions)
FY 2009 FY 2010 FY 2011
Composite Hourly Rate $193.44 $192.19 $192.93
Percent Year to Year Change ‐0.6% 0.4%
The FY 2011 hourly composite rate reflects an increase of $0.74 from FY 2010.

NARRATIVE SUMMARY OF OPERATIONS
DEPARTMENT OF THE NAVY
DEPOT MAINTENANCE
FLEET READINESS CENTERS
FISCAL YEAR (FY) 2010 BUDGET ESTIMATES
FEBRUARY 2010
Unit Cost Goals. The budget reflects the following FY 2009‐2011 unit cost goals:
($ and DLHs in Millions)
FY 2009 FY 2010 FY 2011
Total Operating Cost $2,164.9 $1,842.0 $1,871.1
Direct Labor Hours (DLH) 11.966 10.373 10.485
Unit Cost $180.92 $177.58 $178.46
% Change
Workload/DLHs ‐13.31% 1.08%
% Change Unit Cost ‐1.85% 0.50%
DLH includes direct labor hours worked by civilians, contractors and military personnel.
SUMMARY OF PERSONNEL RESOURCES
FY 2009 FY 2010 FY 2011
Civilian Personnel:
End Strength 9,115 8,660 8,695
FTE Workyears 9,135 8,733 8,749
Military Personnel:
End Strength 109 122 123
Workyears 95 122 123
Contractor Personnel:
Workyears 1,007 1,120 1,209
The FRCs budget reflects civilian workforce levels necessary to accommodate firm workload
without the use of excessive overtime. Contract personnel are used by the FRCs to address
perturbations in workload.

NARRATIVE SUMMARY OF OPERATIONS
DEPARTMENT OF THE NAVY
DEPOT MAINTENANCE
FLEET READINESS CENTERS
FISCAL YEAR (FY) 2010 BUDGET ESTIMATES
FEBRUARY 2010
SUMMARY OF WORKLOAD INDICATORS:
(Inducted Units)
FY 2009 FY 2010 FY 2011
AIRFRAMES 499 383 468
O&M,N 444 330 424
O&M,NR 35 38 27
RDT&E 13 12 14
Other 7 3 3
ENGINES 1,396 1,134 1,524
O&M,N 1,317 1,064 1,455
O&M,NR 30 13 12
RDT&E 13 14 14
Other 36 43 43 PERFORMANCE INDICATORS:
(Units)
Goal FY 2009 FY 2010 FY 2011
Aircraft Scheduled 503 422 493
Aircraft Completed on Time 453 380 444
% Scheduled Work Completed on Time 90% 90% 90% 90%
Engines Scheduled 1,513 1,106 1,501
Engines Completed on Time 1,362 995 1,351
% Scheduled Work Completed on Time 90% 90% 90% 90%
Components Scheduled 39,124 47,026 47,026
Components Completed on Time 37,168 44,675 44,675
% Scheduled Work Completed on Time 95% 95% 95% 95%

NARRATIVE SUMMARY OF OPERATIONS
DEPARTMENT OF THE NAVY
DEPOT MAINTENANCE
FLEET READINESS CENTERS
FISCAL YEAR (FY) 2010 BUDGET ESTIMATES
FEBRUARY 2010
CARRYOVER: The FRCs were authorized to exceed the outlay‐based carryover ceiling for FY 2009 due to crash
damage aircraft workload. FY 2010 and FY 2011 are below the ceiling. ($ in Millions)
Depot Maintenance ‐ Aircraft FY 2009 FY 2010 FY 2011
New Orders $2,238.4 $1,856.8 $1,976.0
Less Exclusions:
Foreign Military Sales $42.9 $28.2 $28.1
Base Realignment & Closure $0.0 $0.9 $0.9
Other Federal Depts & Agencies $6.2 $2.7 $2.7
Non‐Federal & Others $79.3 $113.7 $97.6
Major Range & Test Facility Base $0.0 $0.0 $0.0
Orders for Carryover Calculation $2,110.0 $1,711.3 $1,846.7
Composite Outlay Rate 64.2% 62.4% 63.5%
Carryover Ceiling Rate 35.8% 37.6% 36.5%
Carryover Ceiling $755.9 $642.8 $674.4
Balance of Customer Orders at Yr End $890.0 $897.5 $978.3
Less WIP $50.6 $51.7 $51.0
Less Exclusions:
Foreign Military Sales $32.5 $60.5 $66.9
Base Realignment & Closure $0.9 $1.2 $1.9
Other Federal Depts & Agencies $12.4 $14.9 $16.3
Non‐Federal & Others $22.9 $126.5 $180.9
Major Range & Test Facility Base $0.0 $0.0 $0.0
Carryover Budget $770.7 $642.7 $661.3

NARRATIVE SUMMARY OF OPERATIONS
DEPARTMENT OF THE NAVY
DEPOT MAINTENANCE
FLEET READINESS CENTERS
FISCAL YEAR (FY) 2010 BUDGET ESTIMATES
FEBRUARY 2010
SUMMARY OF CAPITAL INVESTMENT PROGRAM (CIP):
($ in Millions)
FY 2009 FY 2010 FY 2011
Equipment‐non ADPE &TELECOM 22.3 37.0 32.6
Minor Construction 4.6 3.9 8.1
Equipment‐ADPE &TELECOM 3.3 3.9 4.6
Software Development 3.0 0.0 0.0
Total $33.2 $44.8 $45.3

FY 2009 FY 2010 FY 2011
Operations 2122.9 1804.5 1849.9 Surcharges 0 0 0 Depreciation excluding Major Construction 38.3 44.8 45.3
Total Income 2161.2 1849.3 1895.1
Military Personnel 9.7 10.1 10.4 Civilian Personnel 821.1 796.5 802 Travel and Transportation of Personnel 23 23.5 24.2 Material & Supplies (Internal Operations) 586.7 397.9 421.6 Equipment 333.1 265.8 260.9 Other Purchases from NWCF 17.7 16.3 15.7 Transportation of Things 3.8 3 3 Depreciation - Capital 38.3 44.8 45.3 Printing and Reproduction 1.6 2.3 2.3 Advisory and Assistance Services 12.2 0.2 0.2 Rent, Communication & Utilities 45.5 44.3 48 Other Purchased Services 272.2 237.4 237.6 Total Expenses 2164.9 1842.1 1871.1
Work in Process Adjustment -10.7 0.2 0.2 Comp Work for Activity Retention Adjustment -3.7 0 0 Cost of Goods Sold 2150.5 1842.3 1871.3
Operating Result 10.7 7.1 23.8
Less Surcharges 0 0 0 Plus Appropriations Affecting NOR/AOR 0 0 0 Other Changes Affecting NOR/AOR 0 0 0 Extraordinary Expenses Unmatched 0 0 0
Net Operating Result 10.7 7.1 23.8
Other Changes Affecting AOR -0.1 0 0
Accumulated Operating Result -30.9 -23.8 0
Exhibit Fund-14 Revenue and Expense
REVENUE AND EXPENSEDEPARTMENT OF THE NAVY
DEPOT MAINTENANCEFLEET READINESS CENTERS
FISCAL YEAR (FY) 2011 BUDGET ESTIMATESFEBRUARY 2010$ in Millions
Revenue: Gross Sales
Other Income
Expenses Cost of Materiel Sold from Inventory Salaries and Wages:

FY 2009 FY 2010 FY 2011------- ------- -------
1. New Orders 2238.4 1856.8 1976
a. Orders from DoD Components: 1410.6 1155 1264.9
Department of the Navy 1384 1116.6 1225.5 O & M, Navy 995 755.1 873.6 O & M, Marine Corps 0.8 0.7 0.7 O & M, Navy Reserve 53 45.6 43 O & M, Marine Corp Reserve 0 0 0 Aircraft Procurement, Navy 301.1 290.9 281.3 Weapons Procurement, Navy 0 0 0 Ammunition Procurement, Navy/MC 0.4 0.6 0.6 Shipbuilding & Conversion, Navy 0.2 0.6 1.6 Other Procurement, Navy 0.2 0.1 0.2 Procurement, Marine Corps 0 0 0 Family Housing, Navy/MC 0 0 0 Research, Dev., Test, & Eval., Navy 33.1 23 24.6 Military Construction, Navy 0.2 0 0 National Defense Sealift Fund 0 0 0 Other Navy Appropriations 0 0 0 Other Marine Corps Appropriations 0 0 0
Department of the Army 2.6 1 1 Army Operation & Maintenance 1.5 0.4 0.4 Army Res, Dev, Test, Eval 0 0 0 Army Procurement 1.1 0.6 0.6 Army Other 0 0 0
Department of the Air Force 22.2 29.1 30.3 Air Force Operation & Maintenance 20.7 27.1 28.3 Air Force Res, Dev, Test, Eval 0 0 0 Air Force Procurement 1.5 2 2 Air Force Other 0 0 0
DOD Appropriation Accounts 1.9 8.2 8.1 Base Closure & Realignment 0 0.9 0.9 Operation & Maintenance Accounts 1 1.6 1.6 Res, Dev, Test & Eval Accounts 0.6 0.2 0.2 Procurement Accounts 0.3 5.6 5.4 Defense Emergency Relief Fund 0 0 0 DOD Other 0 0 0
b. Orders from other Fund Activity Groups 699.4 557.2 582.7
c. Total DoD 2110 1712.2 1847.6
d. Other Orders: 128.4 144.6 128.4 Other Federal Agencies 6.2 2.7 2.7 Foreign Military Sales 42.9 28.2 28.1 Non Federal Agencies 79.3 113.7 97.6
2. Carry-In Orders 812.8 890 897.5
3. Total Gross Orders 3051.2 2746.8 2873.4
a. Funded Carry-Over before Exclusions 890 897.5 978.3
b. Total Gross Sales 2161.2 1849.3 1895.1
4. End of Year Work-In-Process (-) -50.6 -51.7 -51
5. Non-DoD, BRAC, FMS, Inst. MRTFB (-) -68.7 -203.1 -266
6. Net Funded Carryover 770.7 642.7 661.3
Non-DOD BRAC, FMS, and Institutional MRTFB Exhibit Fund-11 Sources of Revenue
FEBRUARY 2010$ in Millions
Note: Line 4 (End of Year Work-In-Process) is adjusted for
SOURCES OF REVENUEDEPARTMENT OF THE NAVY
DEPOT MAINTENANCE - FLEET READINESS CENTERSFISCAL YEAR (FY) 2011 BUDGET ESTIMATES

CHANGES IN THE COSTS OF OPERATIONS
DEPARTMENT OF THE NAVY
DEPOT MAINTENANCE ‐ FLEET READINESS CENTERS
FISCAL YEAR (FY) 2011 BUDGET ESTIMATE
FEBRUARY 2010
AMOUNT IN MILLIONS
Total Costs
FY 2009 Actuals 2,164.9
FY 2010 Presidentʹs Budget 1,839.3
Pricing Adjustments: 1.4
Fuel Changes 1.7
General Purchase Inflation ‐0.3
Efficiency Initiatives 0.0
Program Changes: 0.0
Other Changes : 1.4
Environmental / Safety Remediation 1.4
FY 2010 Estimate: 1,842.1
Exhibit Fund ‐ 2
Changes in the Costs of Operations

CHANGES IN THE COSTS OF OPERATIONS
DEPARTMENT OF THE NAVY
DEPOT MAINTENANCE ‐ FLEET READINESS CENTERS
FISCAL YEAR (FY) 2011 BUDGET ESTIMATE
FEBRUARY 2010
AMOUNT IN MILLIONS
Total Costs
FY 2010 Estimate: 1,842.1
Pricing Adjustments: 35.0
Annualization of Pay Raises 4.7
Civilian Personnel 4.6
Military Personnel 0.1
Pay Raise 7.8
Civilian Personnel 7.7
Military Personnel 0.1
Fuel Changes 2.2
General Purchase Inflation 17.0
Other Working Capital Fund Purchases 3.3
Efficiency Initiatives 0.0
Program Changes: ‐4.2
Airframes work 49.1
Engines work 13.6
Components work ‐10.3
Other Support work 4.3
Modification work ‐41.2
Logistics/Engineering work ‐19.7
Other Changes: ‐1.8
Depreciation 0.5
DFAS Financial Operations ‐1.1
Environmental / Safety Remediation 1.4
Other Indirect (Matl, Other Purchases, etc.) ‐2.6
FY 2011 Estimate: 1,871.1
Exhibit Fund ‐ 2
Changes in the Costs of Operations

FY 2009
FY 2010
FY 2011
Line #
Description
Quantity
Total Cost
Quantity
Total Cost
Quantity
Total Cost
1Non‐A
DPE and Telecom Equipment
‐ Rep
lacement Cap
ability
3522.281
5733.020
47$26.875
‐ Productivity Cap
ability
0$0.000
0$0.550
0$0.000
‐ N
ew M
ission Cap
ability
0$0.000
1$3.400
0$5.675
‐ Environmental Cap
ability
0$0.000
0$0.000
0$0.000
35$22.281
58$36.970
47$32.550
2 ADPE and Telecom Equipment
‐ Computer Hardware (Production)
0$0.000
0$0.000
0$0.000
‐ Computer Software (O
perating)
0$1.280
0$1.525
0$1.840
‐ Telecommunications
35$0.000
61$2.400
48$0.025
‐ Oth Computer & Telecom Spt Equip
0$2.000
0$0.000
0$2.700
35$3.280
61$3.925
48$4.565
3Software Development
‐ Projects = or > $1M
0$3.000
0$0.000
0$0.000
‐ Projects < $1M
0$0.000
0$0.000
0$0.000
0$3.000
0$0.000
0$0.000
4Minor Construction
‐ Rep
lacement Cap
ability
0$3.899
2$3.765
1$6.570
‐ Productivity Cap
ability
0$0.000
0$0.000
0$0.000
‐ N
ew M
ission Cap
ability
5$0.720
0$0.115
3$1.580
‐ Environmental Cap
ability
0$0.000
0$0.000
0$0.000
5$4.619
2$3.880
4$8.150
Grand Total
75$33.180
121
$44.775
99$45.265
Total Capital Outlays
$24.349
$47.151
$44.978
Total Depreciation Expense
$38.290
$44.775
$45.265
$ in Millions
CAPITAL INVESTMENT SUMMARY
DEPARTMENT OF THE NAVY
DEPOT MAINTENANCE ‐ FLEET READINESS CENTERS
FEBRUARY 2010
FISCAL YEAR (FY) 2011 BUDGET ESTIMATE
Exhibit Fund ‐ 9A, Capital Investment Summary

Dep
artm
ent of the Navy / N
aval Air System
s Comman
d
Quan
tUnit Cost
Total
Cost
Quan
tUnit Cost
Total
Cost
Quan
tUnit Cost
Total
Cost
Replacement Equipment
35637
22,281
57579
33,020
47572
26,875
Total
35637
22,281
57579
33,020
47572
26,875
#001 ‐ N
on‐A
DPE and Telecommunications
Fleet Readiness Centers
FY 2011
Justification:
Non‐A
DPE and Telecommunications Equipment
FY 2010
FY 2009
ACTIVITY GROUP CAPITAL INVESTMENT JUSTIFICATIO
NFISCAL YEAR (FY) 2011 PRES BUDGET ESTIM
ATES
($ in Thousands)
Required follow-on work for Project Cabrillo will be accomplished as follows:
FY 2005: Develop archiving capability in SAP, which is the book of record.
FY 2005: Transition to the DoD mandated Standard Procuement System (SPS).
Contract Information Collaborative Capability Project
FY 2006: Develop new interfaces for existing legacy applications not supported by C-ERP.
FY 2007: Develop new interfaces for remaining legacy applications not supported by C-ERP.
ITEM 1 APPLIES TO ALL EQUIPMENT
1) The existing equipment allows the three Fleet Readiness Centers (FRCs) to achieve our mission by perform
ing routine an
d emergency m
aintenan
ce, rep
air, and m
odifications for
Navy and M
arine aircraft, and associated system
s an
d components. Aircraft supported include the F/A 18 Hornet, E‐2C H
awkeye, C‐2A Greyhound, S‐3 Viking, P‐3 Orion, H‐53 Sea
Stallion, SH‐60 Seahaw
k, E
A‐6B Prowler, UH‐1N H
uey, A
H‐1 Super Cobra, A
V‐8B H
arrier and the CH‐46 Sea Knight.
REPLACEMENT EQUIPMENT
2) The proposed cap
ital investm
ents m
aintain the FRC’s equipment infrastructure by rep
lacing existing plant equipment that has reached the end of their economic life due to age an
d
wear. This equipment includes such items as lathes, m
ills, test stan
ds, and foundry equipment. Rep
lacement of this equipment will continue to m
aintain the Dep
ot’s infrastructure and
their capability to achieve their individual m
issions.
3) Economic analyses have been perform
ed.
4) There are no savings or cost avoidan
ces.
5) If the equipment is not replaced the FRCs would lose the capability to perform their mission.
Exhibit Fund ‐ 9B Cap
ital P
urcah
se Justification

Dep
artm
ent of the Navy / N
aval Air System
s Comman
d
Quan
tUnit Cost
Total
Cost
Quan
tUnit Cost
Total
Cost
Quan
tUnit Cost
Total
Cost
Productivity Equipment
00
1550
550
Total
00
01
550
550
00
0
Justification:
#001 ‐ N
on‐A
DPE and Telecommunications
Fleet Readiness Centers
Non‐A
DPE and Telecommunications Equipment
FY 2009
FY 2010
FY 2011
ACTIVITY GROUP CAPITAL INVESTMENT JUSTIFICATIO
NFISCAL YEAR (FY) 2011 PRES BUDGET ESTIM
ATES
($ in Thousands)
Required follow-on work for Project Cabrillo will be accomplished as follows:
FY 2005: Develop archiving capability in SAP, which is the book of record.
FY 2005: Transition to the DoD mandated Standard Procuement System (SPS).
Contract Information Collaborative Capability Project
FY 2006: Develop new interfaces for existing legacy applications not supported by C-ERP.
FY 2007: Develop new interfaces for remaining legacy applications not supported by C-ERP.
1) The existing equipment allows Fleet Readiness Center North Islan
d (FRC SW) to achieve our mission by perform
ing routine an
d emergency m
aintenan
ce, rep
air, and m
odifications
for Navy and M
arine aircraft, and associated system
s an
d components. Aircraft supported include the F/A 18 Hornet, E‐2C H
awkeye, C‐2A Greyhound, C
H‐53E Sea Stallion, and SH‐
60 Seahaw
k.
2) The new equipment will provide productivity enhan
cements that are not achievable w
ith current equipment. Item to be procured is a Rap
id Prototyping System that w
ill enable us
to quickly prove‐out Computer Aided Design (CAD) models.
3) Economic analysis has been perform
ed.
4) There are no savings, ju
st cost avoidan
ces. T
he new equipment will provide capabilities that are not currently available at FRC SW.
5) If the equipment is not acquired w
e will continue proving out aircraft parts using actual m
aterial.
Exhibit Fund ‐ 9B Cap
ital Purchase Justification

Dep
artm
ent of the Navy / N
aval Air System
s Comman
d
Quan
tUnit Cost
Total
Cost
Quan
tUnit Cost
Total
Cost
Quan
tUnit Cost
Total
Cost
New Mission Equipment
03
1,133
3,400
15,675
5,675
Total
03
1,133
3,400
15,675
5,675
Justification:
#001 ‐ N
on‐A
DPE and Telecommunications
Fleet Readiness Centers
Non‐A
DPE and Telecommunications Equipment
FY 2009
FY 2010
FY 2011
ACTIVITY GROUP CAPITAL INVESTMENT JUSTIFICATIO
NFISCAL YEAR (FY) 2011 PRES BUDGET ESTIM
ATES
($ in Thousands)
Required follow-on work for Project Cabrillo will be accomplished as follows:
FY 2005: Develop archiving capability in SAP, which is the book of record.
FY 2005: Transition to the DoD mandated Standard Procuement System (SPS).
Contract Information Collaborative Capability Project
FY 2006: Develop new interfaces for existing legacy applications not supported by C-ERP.
FY 2007: Develop new interfaces for remaining legacy applications not supported by C-ERP.
1) ) The existing equipment allows Fleet Readiness Center North Islan
d (FRC SW) to achieve our mission by perform
ing routine an
d emergency m
aintenan
ce, rep
air, and m
odifications
for Navy and M
arine aircraft, and associated system
s an
d components. Aircraft supported include the F/A 18 Hornet, E‐2C H
awkeye, C‐2A Greyhound, C
H‐53E Sea Stallion, and SH‐
60 Seahaw
k.
2) The new equipment will provide new cap
ability and cap
acity that can
not be met w
ith current equipment an
d facilities. A noise suppression equipment for engine testing, a vertical
milling m
achine, a 5‐axis m
achining center, and an electron m
icroscope will be procured.
3) Economic analyses have been perform
ed.
4) There are no cost savings or avoidan
ces as the projects are based upon cap
ability or capacity requirem
ents, n
ot dollar savings.
5) If the projects are not im
plemented, the FRCʹs cap
ability and cap
acity w
ill be restricted resulting in longer turn‐around‐tim
es to provide aircraft and parts to the fleet.
Exhibit Fund ‐ 9B Cap
ital Purchase Justification

Dep
artm
ent of the Navy / N
aval Air System
s Comman
d
Quan
tUnit Cost
Total
Cost
Quan
tUnit Cost
Total
Cost
Quan
tUnit Cost
Total
Cost
Computer Hardware (Production)
00
00
Computer Software (Operating System)
3427
1,280
2763
1,525
3613
1,840
Telecommunications
00
02
1,200
2,400
125
25
Other Computer & Telecommunications Spt Equipment
21,000
2,000
00
3900
2,700
Total
51,427
3,280
41,963
3,925
71,538
4,565
ACTIVITY GROUP CAPITAL INVESTMENT JUSTIFICATIO
NFISCAL YEAR (FY) 2011 PRES BUDGET ESTIM
ATES
($ in Thousands)
#002 ‐ ADPE and Telecommunications Cap
abilities
Fleet Readiness Centers
FY 2011
ADPE and Telecommunications Equipment
FY 2010
FY 2009
PROJECTS ABOVE $1M: (All in OTHER EQUIPMENT category)
FY09
1. UPGRADE UNIX SERVER #2 $1.5M FRC SW-NORTH ISLAND
1) The existing system provides Data Management (DM) services to the Fleet Readiness Center.
2) This project will replace the Central Processing Unit (CPU) and memory boards on the RP8400 servers which will stabilize the computer environment,
increase processing power, and refresh servers that have reached end-of-life.
3) An economic analysis has been performed.
4) There will be no cost savings or avoidances. There is no alternative but to upgrade the equipment.
5) If not acquired, there will be increased maintenance and server downtime which will have an adverse effect on F/A-18 C/D and E/F aircraft.
2. STORAGE ARRAY EXPANSION $1.25M FRC SW-NORTH ISLAND
1) The existing equipment provides inventory and labor management data to the Fleet Readiness Center.
2) This project will increase the storage array by 23 terabytes.
3) An economic analysis has been performed.
4) There will be no cost savings or avoidances. There is no alternative but to increase the storage capacity.
5) If not acquired, important DM systems will not function properly.
CONTINUE ON NEXT PAGE
Exhibit Fund - 9B Capital Purchase Justification

PROJECTS ABOVE $1M: (All in OTHER EQUIPMENT category)
FY10
1. LAN EQUIPMENT/TELECOMMUNICATIONS FOR P-974 $1.60M FRC EAST-CHERRY POINT
1) New facility that has no access to the depot's Local Area Network (LAN) and telecommunications resources.
2) This project will provide data communications and telecommunications capability for the corresponding MILCON to construct Engineering Product
Support Facility P-974.
3) An economic analysis has not been performed.
4) There are no cost savings or avoidances associated with this project.
5) If not implemented, personnel will have no access to telecommunications or Local Area Network (LAN) services.
FY10
2. UPGRADE WORKLOAD MANAGEMENT SYSTEM FRC EAST-CHERRY POINT AND FRC SW-NORTH ISLAND
1) The existing In-Service Support Centers (ISSCs) Fast Forward (FF) software application provides for workload management and performance
measurement at the FRCs.
2) This project will upgrade the aging ISSC FF application to enable the use of factual data for the management and measurement of workload
projections against actual to improve quality of products and services, increase productivity, reduce costs, and to forecast impact of changes.
3) A qualitative economic analysis was performed.
4) There will be no cost savings or avoidances. There is no alternative but to upgrade the system.
5) Denial of this effort will adversely impact the FRC's ability to effectively manage and measure workflow.
FY11
1. AUTOMATION OF FRC DATA PHASE I $1.50M FRC EAST-CHERRY POINT
1) The existing system provides technical data and information to production personnel at the Fleet Readiness Center.
2) This project will modernize and allow for the digitization of maintenance data and technical information for integration with automated systems.
3) An economic analysis has not been performed.
4) There will be no cost savings or avoidances. There is no alternative but to upgrade the system.
5) If not implemented, maintenance data and technical information will continue to be maintained outside of newly acquired configuration controlled
electronic systems.
2. UPGRADE WORKLOAD MANAGEMENT SYSTEM FRC EAST-CHERRY POINT AND FRC SW-NORTH ISLAND
1) The existing In-Service Support Centers (ISSCs) Fast Forward (FF) software application provides for workload management and performance
measurement at the FRCs.
2) This project will upgrade the aging ISSC FF application to enable the use of factual data for the management and measurement of workload
projections against actual to improve quality of products and services, increase productivity, reduce costs, and to forecast impact of changes.
3) A qualitative economic analysis was performed.
4) There will be no cost savings or avoidances. There is no alternative but to upgrade the system.
5) Denial of this effort will adversely impact the FRC's ability to effectively manage and measure workflow.
CONTINUE ON NEXT PAGE
Exhibit Fund - 9B Capital Purchase Justification

PROJECTS ABOVE $1M: (All in OTHER EQUIPMENT category)
COMPUTER SOFTWARE (OPERATING SYSTEM) CAPABILITY
1) The existing software provides various data management services to the Fleet Readiness Center.
2) The subject projects will provide a complete enterprise monitoring solution for the Data Management (DM) system and also provide a means to track
and document internal audits within the FRC.
3) Economic analyses have been performed.
4) There are no cost savings or avoidances associated with these projects.
5) If not implemented, the FRC will be greatly restricted in its DM operations.
TELECOMMUNICATIONS CAPABILITY
1) The existing equipment provides various telecommunications and Data Management (DM) services throughout the Fleet Readiness Centers.
2) The subject projects will provide enhancements and equipment to the telecommunications system.
3) Economic analyses have been performed to determine the least costly methods.
4) There are no cost savings or avoidances associated with these projects.
5) If not implemented, the FRCs will experience diminished DM and communication capabilities which will have a detrimental effect on day to day
operations.
OTHER COMPUTER & TELECOMMUNICATION SUPPORT EQUIPMENT CAPABILITY
1) The existing equipment provides various telecommunications and Data Management (DM) services throughout the Fleet Readiness Centers.
2) The subject projects will provide enhancements to various business process applications, replacement of aging servers, upgrades to the Video
Telephone Communication (VTC) system, and data center upgrades.
3) Economic analyses have been performed to determine the least costly metho ds.
4) There are no cost savings or avoidances associated with these projects.
5) If not implemented, the FRCs will experience diminished DM and communication capabilities which will have a detrimental effect on day to day
operations.
Exhibit Fund - 9B Capital Purchase Justification

Dep
artm
ent of the Navy / N
aval Air System
s Comman
d
Quan
tUnit Cost
Total
Cost
Quan
tUnit Cost
Total
Cost
Quan
tUnit Cost
Total
Cost
I & D INTEGRATION, PHASE II
31,000
3,000
TOTAL
31,000
3,000
ACTIVITY GROUP CAPITAL INVESTMENT JUSTIFICATIO
NFISCAL YEAR (FY) 2011 PRES BUDGET ESTIM
ATES
($ in Thousands)
#003 ‐ Software (I & D INTEGRATIO
N, P
HASE II)
Fleet Readiness Centers
FY 2011
Justification:
Software
FY 2010
FY 2009
1) The existing system provides N
avy Dep
ot Man
agem
ent System
s (N
DMS) for the Fleet Readiness Centers (FRCs).
2) This project supports FRCʹs m
igration toward a single set of Business Rules an
d Processes and continues the effort to support, interface, and m
erge FRC level m
anagem
ent
inform
ation system
s into a comprehensive Naval Aviation Enterprise (NAE) maintenan
ce and rep
air solution.
3) An economic analysis has been perform
ed.
4) The total combined Phase I an
d Phase II project is expected to show savings of $349,376 and cost avoidan
ce of $107,503 per year to begin in FY10.
5) Denial of this effort w
ill im
pact the ability of the NAE community to m
ake time‐critical supply chain m
anagem
ent an
d production decisions resulting in aircraft entering a N
ot
Mission Cap
able M
aintenan
ce/Supply (NMCM/N
MCS) status.
6) Integration is expected to be completed by end of FY09.
7) N
ot Applicable.
8) The software is Internally developed w
ith contractor support services.
9) There are no applicable license fees.
Exhibit Fund ‐ 9B Cap
ital Purchase Justification

Dep
artm
ent of the Navy / N
aval Air System Comman
d
Quan
tUnit Cost
Total
Cost
Quan
tUnit Cost
Total
Cost
Quan
tUnit Cost
Total
Cost
Replacement
13300
3,899
20188
3,765
18365
6,570
Productivity
00
00
00
00
0
New Mission
1720
720
338
115
5316
1,580
Environmental
00
00
00
00
0
Total
14330
4,619
23169
3,880
23354
8,150
#004 ‐ M
inor Construction
Fleet Readiness Centers
FY 2011
Justification:
Minor Construction
FY 2010
FY 2009
ACTIVITY GROUP CAPITAL INVESTMENT JUSTIFICATIO
NFISCAL YEAR (FY) 2011 PRES BUDGET ESTIM
ATES
($ in Thousands)
Required follow-on work for Project Cabrillo will be accomplished as follows:
FY 2005: Develop archiving capability in SAP, which is the book of record.
FY 2005: Transition to the DoD mandated Standard Procuement System (SPS).
Contract Information Collaborative Capability Project
FY 2006: Develop new interfaces for existing legacy applications not supported by C-ERP.
FY 2007: Develop new interfaces for remaining legacy applications not supported by C-ERP.
1) The existing facilities allows the three Naval Air Fleet Readiness Centers(FRCs) to achieve our mission by perform
ing routine an
d emergency m
aintenan
ce, rep
air, and
modifications for Navy and M
arine aircraft, and associated system
s an
d components. Aircraft supported include the F/A 18 Hornet, E‐2C H
awkeye, C‐2A Greyhound, S‐3 Viking, P‐3
Orion, H‐53 Sea Stallion, SH‐60 Seahaw
k, E
A‐6B Prowler, UH‐1N H
uey, A
H‐1 Super Cobra, A
V‐8B H
arrier and the CH‐46 Sea Knight.
2) N
ew m
inor construction projects will allow the FRCs to design, construct, u
pgrade, restore, and rep
lace the facilities and structures that are required to achieve their mission. No
project is greater than the $750,000 m
axim
um threshold.
3) Economic analyses were perform
ed to determine the least costly m
ethod to achieve the desired results.
4) N
o cost avoidan
ce or savings were estimated
. Minor construction projects provide the facilities in w
hich w
ork is to be perform
ed, n
ot to provide savings.
5) If minor projects are not ap
proved the facilities w
ill deteriorate and adversely affect mission achievem
ent.
Exhibit Fund ‐ 9B Cap
ital Purchase Justification

Projects in the FY 2010 Presidentʹs Budget
Approved
Approved
Current
Asset/
Explanation/
FY
Project
Reprogs
Proj Cost
Proj Cost
Deficiency
Reason for Change
2010
Equipment (N
on‐ ADPE)
1.100
$
35.870
$
36.970
$
(1.100)
$
Two p
rojects cost estim
ates have decreased
.
Twenty three projects cost estim
ates have increased.
Six projects were cancelled
.
Five ad
ditional projects were ad
ded due to emergent req.
One project w
as deferred to FY11
2010
Equipment ‐ ADPE
‐1.350
5.275
3.925
1.350Three projects were cancelled
One project w
as deferred
Two projects were ad
ded due to emergent requirem
ents.
2010
Software Development
0.000
0.000
0.000
0.000
2010
Minor Construction
0.250
3.630
3.880
‐0.250
Seven projects had price increases.
Four projects had price decreases.
Two projects were ad
ded due to emergent requirem
ents.
Total FY 2010 Cap
ital Program
‐$
44.775
$
44.775
$
‐$
FEBRUARY 2010
$ in Millions
CAPITAL BUDGET EXECUTION
DEPARTMENT OF THE NAVY
DEPOT MAINTENANCE ‐ FLEET READINESS CENTERS
FISCAL YEAR (FY) 2011 BUDGET ESTIMATE
Exhibit Fund ‐ 9C, C
apital Budget Execution

MATERIAL INVENTORY DATA
DEPARTMENT OF THE NAVY
DEPOT MAINTENANCE ‐ FLEET READINESS CENTERS
FISCAL YEAR (FY) 2011 BUDGET ESTIMATES
FEBRUARY 2010
AMOUNT IN MILLIONS
FY 2009
‐‐‐‐‐ Peacetime ‐‐‐‐‐
Total Mobilization Operating Other
Material Inventory BOP $ 43.0 $ ‐ $ 43.0 $ ‐
Purchases
A. Purchases to Support Customer Orders $ 920.0 $ ‐ $ 920.0 $ ‐
B. Purchase of long lead items in advance ‐ ‐ ‐ ‐
of customer orders ‐
C. Other Purchases ‐ ‐ ‐ ‐
D. Total Purchases $ 920.0 $ ‐ $ 920.0 $ ‐
Material Inventory Adjustments
A. Material Used in Maintenance $ 919.8 $ ‐ $ 919.8 $ ‐
B. Disposals, theft, losses due to damages ‐ ‐ ‐ ‐
C. Other reductions ‐ ‐ ‐ ‐
D. Total inventory adjustments $ 919.8 $ ‐ $ 919.8 $ ‐
Material Inventory EOP $ 43.2 $ ‐ $ 43.2 $ ‐
Fund ‐ 16 Material Inventory Data

MATERIAL INVENTORY DATA
DEPARTMENT OF THE NAVY
DEPOT MAINTENANCE ‐ FLEET READINESS CENTERS
FISCAL YEAR (FY) 2011 BUDGET ESTIMATES
FEBRUARY 2010
AMOUNT IN MILLIONS
FY 2010
‐‐‐‐‐ Peacetime ‐‐‐‐‐
Total Mobilization Operating Other
Material Inventory BOP $ 43.2 $ ‐ $ 43.2 $ ‐
Purchases
A. Purchases to Support Customer Orders $ 664.2 $ ‐ $ 664.2 $ ‐
B. Purchase of long lead items in advance ‐ ‐ ‐ ‐
of customer orders ‐
C. Other Purchases ‐ ‐ ‐ ‐
D. Total Purchases $ 664.2 $ ‐ $ 664.2 $ ‐
Material Inventory Adjustments
A. Material Used in Maintenance $ 663.8 $ ‐ $ 663.8 $ ‐
B. Disposals, theft, losses due to damages ‐ ‐ ‐ ‐
C. Other reductions ‐ ‐ ‐ ‐
D. Total inventory adjustments $ 663.8 $ ‐ $ 663.8 $ ‐
Material Inventory EOP $ 43.6 $ ‐ $ 43.6 $ ‐
Fund ‐ 16 Material Inventory Data

MATERIAL INVENTORY DATA
DEPARTMENT OF THE NAVY
DEPOT MAINTENANCE ‐ FLEET READINESS CENTERS
FISCAL YEAR (FY) 2011 BUDGET ESTIMATES
FEBRUARY 2010
AMOUNT IN MILLIONS
FY 2011
‐‐‐‐‐ Peacetime ‐‐‐‐‐
Total Mobilization Operating Other
Material Inventory BOP $ 43.6 $ ‐ $ 43.6 $ ‐
Purchases
A. Purchases to Support Customer Orders $ 682.4 $ ‐ $ 682.4 $ ‐
B. Purchase of long lead items in advance ‐ ‐
of customer orders ‐
C. Other Purchases ‐ ‐ ‐ ‐
D. Total Purchases $ 682.4 $ ‐ $ 682.4 $ ‐
Material Inventory Adjustments
A. Material Used in Maintenance $ 682.5 $ ‐ $ 682.5 $ ‐
B. Disposals, theft, losses due to damages ‐ ‐ ‐ ‐
C. Other reductions ‐ ‐ ‐ ‐
D. Total inventory adjustments $ 682.5 $ ‐ $ 682.5 $ ‐
Material Inventory EOP $ 43.5 $ ‐ $ 43.5 $ ‐
Fund ‐ 16 Material Inventory Data

Total
FY 2009
FY 2010
FY 2011
06‐08
07‐09
08‐10
FY 2009
FY 2010
FY 2011
6%6%
6%
Revenue
Working Cap
ital Fund
1,958.2
2,066.2
2,025.9
114.3
102.5
106.1
Appropriations
0.0
0.0
0.0
Total Revenue
1,958.2
2,066.2
2,025.9
117.5
124.0
121.6
Working Cap
ital Fund Dep
ot Maintenan
ce Investm
ent
WCF Cap
ital Investm
ent Program
33.2
44.8
45.3
Facilities Sustainment, Restoration and M
odernization
38.7
29.7
34.8
Equipment
18.4
18.0
16.0
Equipment purchase by Dep
ots under Expense/Investm
ent Threshold
13.9
13.6
11.6
Equipment purchase by Other Organ
izations under Expense/Investm
ent Threshold
3.3
3.7
3.7
Equipment purchase by Other Organ
izations above Expense/Investm
ent Threshold
1.2
0.7
0.7
Productivity Enhan
cements
0.0
0.0
0.0
Total WCF Investm
ent
90.3
92.5
96.1
Appropriated Funding
Facility Sustainment, Restoration and M
odernization
0.0
0.0
0.0
Equipment
7.2
10.0
10.0
Equipment purchase by Dep
ots under Expense/Investm
ent Threshold
0.0
0.0
0.0
Equipment purchase by Other Organ
izations under Expense/Investm
ent Threshold (Aircraft Procurement)
5.2
5.0
5.0
Equipment purchase by Other Organ
izations above Expense/Investm
ent Threshold (Aircraft Procurement)
2.0
5.0
5.0
Cap
ital Investm
ent Program (Other Procurement, N
avy)
0.0
0.0
0.0
Productivity Enhan
cements
0.0
0.0
0.0
Military Construction (MILCON)
16.8
0.0
0.0
Total Appropriated Funding
24.0
10.0
10.0
Component Total
114.3
102.5
106.1
‐3.2
‐21.5
‐15.5
Percent of Revenue
FEBRUARY 2010
AMOUNT IN MILLIONS
DEPOT MAINTENANCE SIX PERCENT CAPITAL INVESTMENT PLAN
DEPARTMENT OF THE NAVY
COMPONENT: DEPOT MAINTENANCE ‐ FLEET READINESS CENTERS
FISCAL YEAR (FY) 2011 BUDGET ESTIMATES
of Revenue Difference
Revenue 3‐Year Average
Budgeted Cap
ital
Budget M
inus Six Percent
Exhibit Fund‐6
Dep
ot Maintenan
ce 6% Cap
ital Investm
ent Plan

Marine Corps Depots
Narrative Summary of Operations Department of Navy/ Navy Working Capital Fund
Depot Maintenance – Marine Corps Depots
Fiscal Year (FY) 2011 Budget Estimates
February 2010
Activity Group Functions:
To provide quality products and responsive maintenance support services required to
maintain a core industrial base in support of mobilization, surge and reconstitution
requirements. The maintenance functions, performed by the Depot Maintenance
Activity Group (DMAG) include repair, rebuild, modification, and Inspect and Repair
Only as Necessary (IROAN) for all types of ground combat and combat support
equipment. Marine Corps, other Department of Defense (DOD) activities, as well as
Foreign Military Sales (FMS) customers utilize the DMAG maintenance services.
Performance of maintenance related services such as preservation, testing, technical
evaluation, calibration, and fabrication of automated test equipment are examples of
other functions performed.
Activity Group Composition:
Activities Location
MC Maintenance Center Albany, GA
MC Maintenance Center Barstow, CA .
Significant Changes in Activity Group:
There are no significant changes in the activity group or composition since the FY 2010
President’s Budget.
Special Interest Items
Consistent with estimates in the FY 2010 President’s Budget, the impact of Base
Realignment and Closure (BRAC) 2005 Recommendations #57 and #177 on Marine
Corps depot maintenance operations are reflected in this budget. BRAC
Recommendation #57 disestablishes and consolidates specified workload to Anniston
Army Depot, AL and Letterkenny Army Depot, PA. BRAC Recommendation #177 also
impacts Marine Corps depot maintenance operations since it realigns some inventory,
storage and distribution personnel at Albany, GA and Barstow, CA to the Defense
Logistics Agency (DLA).

BUDGET HIGHLIGHTS
General
The DMAG Fiscal Year (FY) 2011 President’s Budget submission continues to reflect
significant fluctuations in workload as a result of battle‐damaged equipment and
weapons systems returning from the current Overseas Contingency Operations (OCO).
Marine Corps equipment requires timely repair in order to reconstitute the Operating
Forces and the Marine Corps’ Maritime Prepositioning Forces (MPF) Program.
Although OCO funded workload for DMAG in FY 2011 may increase above the current
projection, there should be no difficulty in accommodating the requirement. The
DMAG has regularly employed on‐site contractor personnel to address workload surges
and will continue to do so.
FY 2009 Operating Results actuals were negative $2.6 million, an increase of $13.7
million from the FY 2010 President’s Budget that occurred primarily due to increased
workload in support of OCO. DMAG budget projections include a negative operating
result of $8.2 million in FY 2010 and a positive operating result of $3.6 million in FY 2011
(to achieve a zero AOR).
Summary of Operations
($ in Millions)
FY 2009 FY 2010 FY 2011
Orders 551.4 275.0 295.3
Revenue 589.2 440.1 355.5
Cost of Goods Sold 591.8 448.3 348.2
Operating Results ‐2.6 ‐8.2 7.3
Surcharges (CIP) 0 0 ‐3.7
Accumulated Operating Result (AOR) 4.6 ‐3.6 0.0
Orders. New reimbursable orders for FY 2009, FY 2010, and FY 2011 are $551.4 million,
$275.0 million, and $295.3 million respectively. FY 2010 through FY 2011 new
reimbursable orders includes the anticipated receipt of OCO funding. FY 2009 new
reimbursable orders increased $209.1 million from the FY 2010 President’s Budget
mainly due to receipt of funding for the repair of combat‐ravaged equipment and
weapons systems returning from the current OCO. FY 2010 and FY 2011 new orders
decline $128.7 and $14.4 million respectively from the FY 2010 President’s Budget.
FY 2010 and FY 2011 new orders have been conservatively estimated, but the DMAG is
prepared to perform additional OCO‐related workload if required.
Revenue. Revenue is $589.2 million for FY 2009, $440.1 million for FY 2010, and $355.5
million for FY 2011.

Costs of Goods Sold. Cost of Operations is $591.8 million in FY 2009, $448.3 million in
FY 2010, and $348.2 million in FY 2011.
Revenue less cost. Revenue less cost of goods sold for FY 2009, FY 2010, and FY 2011 is
‐$2.6 million, ‐$8.2 million, and $7.3 million respectively.
Surcharge. The $3.7 million surcharge reflected for FY 2011 is for the Capital Investment
Program.
Net Cash Outlays
($ in Millions)
FY 2009 FY 2010 FY 2011
Collections $582.0 $432.9 $361.4
Disbursements $568.6 $480.6 $353.3
Net Outlays ‐$13.4 $47.7 ‐$8.1
Performance Indicators
FY 2009 FY 2010 FY 2011
Schedule Conformance 99.8% 99.8% 99.8%
Quality Deficiency Reports 0.1% 0.1% 0.1%
Inventory Turnover Ratio 5.6:1 4.9:1 4.2:1
Stabilized Customer Rates
FY 2009 FY 2010 FY 2011
Composite Hourly Rate $130.88 $131.47 $127.37
Percent Year to Year Change 5.66% .45% ‐3.12%
Unit Cost Goals. The budget reflects the following FY 2009‐2011 unit cost goals:
($ and DLHs in Millions)
DLH and unit cost based on civilian and contractor personnel direct labor hours.
FY 2009 FY 2010 FY 2011
Total Operating Cost $592.2 $448.3 $348.1
Direct Labor Hours (DLH) 4.871 3.516 2.440
Unit Cost $121.57 $127.52 $142.66
% Change Workload/DLHs 10.0% ‐27.8% ‐30.6%
% Change Unit Cost ‐7.1% 4.9% 11.9%

SUMMARY OF PERSONNEL RESOURCES
FY 2009 FY 2010 FY 2011
Civilian Personnel:
End Strength 2,742 2,266 1,995
FTE Workyears 2,431 2,316 2,046
Military Personnel:
End Strength 15 11 12
Workyears 16 11 12
The DMAG budget reflects civilian workforce levels necessary to accommodate planned
workload without the use of excessive overtime. The Maintenance Centers are using
contract personnel to supplement their workforce and meet demand fluctuations in
workload.
CARRYOVER
Marine Corps DMAG is below the outlay‐based carryover ceiling for FY 2010 and FY
2011. In FY 2009, the carryover ceiling was exceeded by a small amount due to OCO
related workload and some delay in receipt of parts and components necessary to
complete overhauls or ballistic protection upgrades.
(Dollars in Millions)
Carryover ($M) FY 2009 FY 2010 FY 2011
New Orders $551.4 $275.0 $295.3
Less Exclusions:
FMS ‐$0.4 $0.0 $0.0
BRAC $5.3 $0.0 $0.0
Other Federal Depts. & Agencies $0.0 $0.0 $0.0
Non‐Federal & Others ‐$0.2 $0.0 $0.0
Orders for Carryover Calculation $546.7 $275.0 $295.3
Composite Outlay Rate (SSRCO) 44.6% 43.0% 42.7%
Carryover Ceiling Rate 55.4% 57.0% 57.3%
Carryover Ceiling $243.8 $118.2 $126.1
Balance of Customer Orders at Yr
End $287.8 $122.7 $62.6
Less Work in Process $0.5 $0.7 $0.6
Less Exclusions

FMS $0.5 $0.5 $0.5
BRAC $5.2 $3.2 $3.2
Other Federal Depts. & Agencies $0.0 $0.0 $0.0
Non‐Federal & Others $0.1 $0.1 $0.1
Carryover Budget $281.4 $118.2 $58.1

FY 2009 FY 2010 FY 2011
Operations 586.1 434.3 345.4 Surcharges 0 0 -3.7 Depreciation excluding Major Construction 3 5.8 6.4
Total Income 589.2 440.1 355.5
Military Personnel 1 0.9 1 Civilian Personnel 218.1 202.8 171.6 Travel and Transportation of Personnel 5.2 3.5 3 Material & Supplies (Internal Operations) 233.4 166 117.8 Equipment 0 0.4 0.1 Other Purchases from NWCF 2.6 1.8 1.6 Transportation of Things 0 0 0 Depreciation - Capital 3 5.8 6.4 Printing and Reproduction 0.1 0.1 0.1 Advisory and Assistance Services 0 0 0 Rent, Communication & Utilities 9.1 9.1 9.1 Other Purchased Services 119.5 57.8 37.5 Total Expenses 592.2 448.3 348.1
Work in Process Adjustment -0.4 0 0 Comp Work for Activity Retention Adjustment 0 0 0 Cost of Goods Sold 591.8 448.3 348.2
Operating Result -2.6 -8.2 7.3
Less Surcharges 0 0 -3.7 Plus Appropriations Affecting NOR/AOR 0 0 0 Other Changes Affecting NOR/AOR 0 0 0 Extraordinary Expenses Unmatched 0 0 0
Net Operating Result -2.6 -8.2 3.6
Other Changes Affecting AOR 0 0 0
Accumulated Operating Result 4.6 -3.6 0
Exhibit Fund-14 Revenue and Expenses
Fiscal Year (FY) 2011 Budget Estimates
Expenses Cost of Materiel Sold from Inventory
Revenue: Gross Sales
Other Income
$ in Millions
Salaries and Wages:
Revenue and ExpensesDepartment of the Navy/ Navy Working Capital Fund
Depot Maintenance - Marine Corps DepotsFebruary 2010

FY 2009 FY 2010 FY 2011------- ------- -------
1. New Orders 551.4 275.0 295.3
a. Orders from DoD Components: 532.7 265.1 286.0
Department of the Navy 509.6 228.2 248.7 O & M, Navy 1 0 0 O & M, Marine Corps 425.7 192.1 213.2 O & M, Navy Reserve 0 0 0 O & M, Marine Corp Reserve 11.8 8.1 8.7 Aircraft Procurement, Navy 0 0 0 Weapons Procurement, Navy 0 0 0 Ammunition Procurement, Navy/MC 0 0 0 Shipbuilding & Conversion, Navy 0 0 0 Other Procurement, Navy 17.4 0 0 Procurement, Marine Corps 51.3 26.6 25.8 Family Housing, Navy/MC 0 0 0 Research, Dev., Test, & Eval., Navy 2.3 0 0 Military Construction, Navy 0 0 0 National Defense Sealift Fund 0 0 0 Other Navy Appropriations 0 1.0 0.5 Other Marine Corps Appropriations 0 0.5 0.5
Department of the Army 10.0 35.6 36.6 Army Operation & Maintenance 9.6 34.7 35.6 Army Res, Dev, Test, Eval 0 0 0 Army Procurement 0.9 0 0 Army Other -0.5 0.9 1
Department of the Air Force 4.6 1.2 0.7 Air Force Operation & Maintenance 4.6 1.2 0.7 Air Force Res, Dev, Test, Eval 0 0 0 Air Force Procurement 0 0 0 Air Force Other 0 0 0
DOD Appropriation Accounts 8.6 0 0 Base Closure & Realignment 5.3 0 0 Operation & Maintenance Accounts 0 0 0 Res, Dev, Test & Eval Accounts 0 0 0 Procurement Accounts 0.6 0 0 Defense Emergency Relief Fund 0 0 0 DOD Other 2.7 0 0
b. Orders from other Fund Activity Groups 19.3 10.0 9.4
c. Total DoD 552.0 275.0 295.3
d. Other Orders: -0.7 0 0 Other Federal Agencies 0 0 0 Foreign Military Sales -0.4 0 0 Non Federal Agencies -0.2 0 0
2. Carry-In Orders 326.0 287.8 122.7
3. Total Gross Orders 877.4 562.8 418.0
a. Funded Carry-Over before Exclusions 287.8 122.7 62.6
b. Total Gross Sales 589.6 440.1 355.5
4. End of Year Work-In-Process (-) -0.5 -0.7 -0.6
5. Non-DoD, BRAC, FMS, Inst. MRTFB (-) -5.9 -3.9 -3.9
6. Net Funded Carryover 281.4 118.2 58.1
Sources of New Orders & RevenueDepartment of the Navy/ Navy Working Capital Fund
Depot Maintenance - Marine Corps DepotsFebruary 2010
Amount in Millions
Exhibit Fund-11
Fiscal Year (FY) 2011 Budget Estimates
Note: Line 4 (End of Year Work-In-Process) is adjusted for Non-DOD BRAC, FMS, and Institutional MRTFB

Total Cost
FY 2009 Actuals 592.2
FY 2010 Presidentʹs Budget: 460.3
Estimated Impact in FYCY of Actual FYPY Experience: ‐0.1
Pricing Adjustments:
a. Fuel 0.5
b. General Inflation ‐0.1
Program Changes:
a. Workload Changes
(1) Direct Labor ‐6.2
(2) Direct Materiel & Supplies ‐0.1
(3) Direct Contract/Other Purchases 6.9
Other Changes
a. Indirect Labor ‐0.5
b. Indirect Materiel ‐4.6
c. Depreciation 0.3
d. Indirect Contract Services ‐7.9
e. Other ‐0.2
FY 2010 Current Estimate: 448.3
Pricing Adjustments:
a. FY 2011 Pay raise
(1) Civilian Personnel 1.7
(2) Military Personnel 0.0
b. Annualization of Prior Year Pay Raise
(1) Civilian Personnel 1.0
(2) Military Personnel 0.0
c. General Inflation 4.9
Program Changes:
a. Workload Changes
(1) Direct Labor ‐22.1
(2) Direct Material & Supplies ‐50.9
(3) Direct Contract/Other Purchases ‐14.0
Other Changes
a. Indirect Labor ‐11.8
b. Indirect Materiel ‐1.5
c. Depreciation 0.5
d. Indirect Contract Services ‐6.5
e. Other ‐1.5
FY 2011 Current Estimate 348.1
February 2010
($ʹs in Millions)
Changes in the Costs of Operation
Department of the Navy
Depot Maintenance ‐ Marine Corps
Fiscal Year (FY) 2011 Budget Estimates
Exhibit Fund‐2 Changes in the Costs of Operation

FY 2009
Line #
Description
Quantity
Total Cost
Quantity
Total Cost
Quantity
Total Cost
1Non‐ADPE and Telecom Equipment
6$4.189
7$4.782
7$5
.750
‐ Rep
lacement Cap
ability
0$0.000
0$0.000
7$5.750
‐ Productivity Cap
ability
6$4.189
7$4.782
0$0.000
‐ N
ew M
ission Cap
ability
0$0.000
0$0.000
0$0.000
‐ Environmental Cap
ability
0$0.000
0$0.000
0$0.000
2 ADPE and Telecom Equipment
0$0
.000
0$0
.000
1$0
.745
‐ Computer Hardware (Production)
0$0.000
0$0.000
0$0.000
‐ Computer Software (O
perating)
0$0.000
0$0.000
0$0.000
‐ Telecommunications
0$0.000
0$0.000
0$0.000
‐ Oth Computer & Telecom Spt Equip
0$0.000
0$0.000
1$0.745
3Software Development
0$0
.000
0$0
.000
0$0
.000
‐ Projects = or > $1M (List Sep
arately)
0$0.000
0$0.000
0$0.000
‐ Projects < $1M
0$0.000
0$0.000
0$0.000
4Minor Construction
9$5.935
8$5.280
5$3.605
‐ Rep
lacement Cap
ability
0$0.000
0$0.000
0$0.000
‐ Productivity Cap
ability
7$4.470
8$5.280
4$2.905
‐ N
ew M
ission Cap
ability
1$0.745
0$0.000
0$0.000
‐ Environmental Cap
ability
1$0.720
0$0.000
1$0.700
Grand Total
15$10.124
15$10.062
13$1
0.10
0
Total Capital Outlays
0$3.775
0$8.635
0$9.384
Total Depreciation Expense
0$3.048
0$5
.838
0$6
.371
FY 2
010
FY 2
011
Activity Group Capital Investment Summary
$ in Millions
Department of the Navy/ Navy Working Capital Fund
Depot Maintenance ‐ Marine Corps Depots
Fiscal Year (FY) 2011 Budget Estimates
February 2010
Fund 9A Activity Group Cap
ital Investm
ent Summary
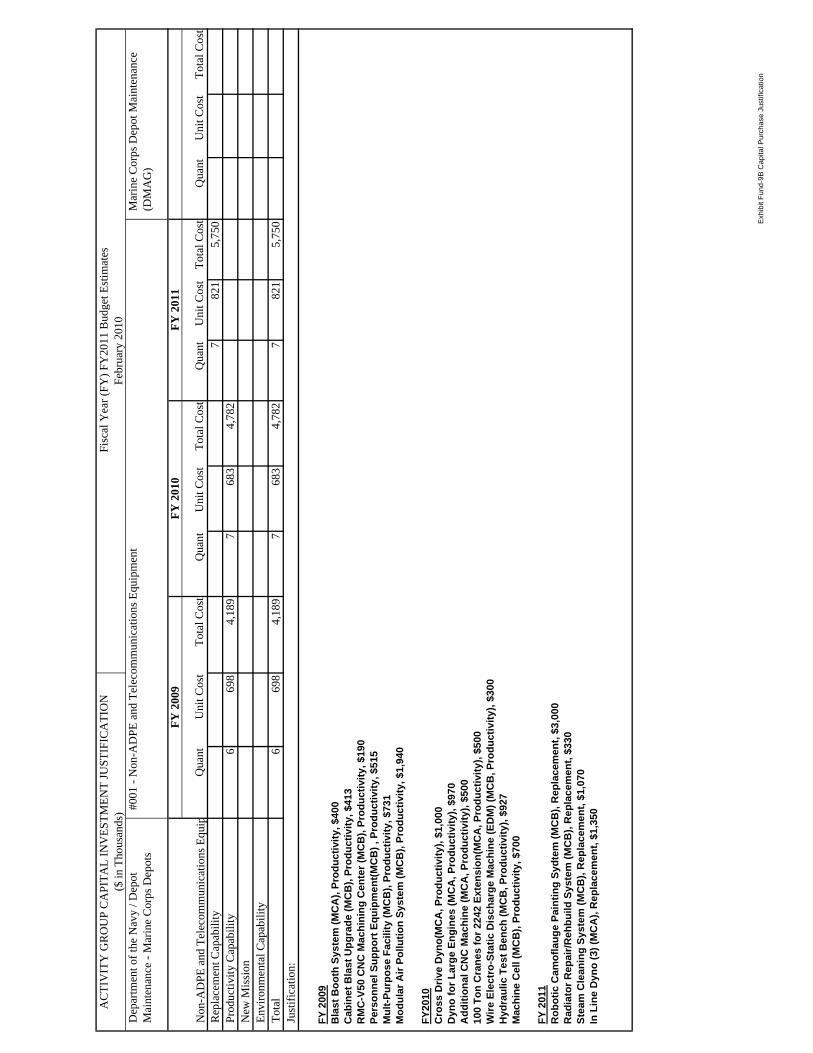
Dep
artm
ent o
f the
Nav
y / D
epot
M
aint
enan
ce -
Mar
ine
Cor
ps D
epot
s
Qua
ntU
nit C
ost
Tota
l Cos
tQ
uant
Uni
t Cos
tTo
tal C
ost
Qua
ntU
nit C
ost
Tota
l Cos
tQ
uant
Uni
t Cos
tTo
tal C
ost
Rep
lace
men
t Cap
abili
ty0
00
07
821
5,75
00
0Pr
oduc
tivity
Cap
abili
ty6
698
4,18
97
683
4,78
20
00
00
0N
ew M
issi
on0
Envi
ronm
enta
l Cap
abili
ty0
00
00
Tota
l6
698
4,18
97
683
4,78
27
821
5,75
00
00
#001
- N
on-A
DPE
and
Tel
ecom
mun
icat
ions
Equ
ipm
ent
Mar
ine
Cor
ps D
epot
Mai
nten
ance
(D
MA
G)
Just
ifica
tion:
Non
-AD
PE a
nd T
elec
omm
unic
atio
ns E
qui p
FY
201
1F
Y 2
009
FY
201
0
AC
TIV
ITY
GR
OU
P C
API
TAL
INV
ESTM
ENT
JUST
IFIC
ATI
ON
Fisc
al Y
ear (
FY) F
Y20
11 B
udge
t Est
imat
es($
in T
hous
ands
)Fe
brua
ry 2
010
FY 2
009
Bla
st B
ooth
Sys
tem
(MC
A),
Prod
uctiv
ity, $
400
Cab
inet
Bla
st U
pgra
de (M
CB
), Pr
oduc
tivity
, $41
3R
MC
-V50
CN
C M
achi
ning
Cen
ter (
MC
B),
Prod
uctiv
ity, $
190
Pers
onne
l Sup
port
Equ
ipm
ent(M
CB
) , P
rodu
ctiv
ity, $
515
Mul
t-Pur
pose
Fac
ility
(MC
B),
Prod
uctiv
ity, $
731
Mod
ular
Air
Pollu
tion
Syst
em (M
CB
), Pr
oduc
tivity
, $1,
940
FY20
10C
ross
Driv
e D
yno(
MC
A, P
rodu
ctiv
ity),
$1,0
00D
yno
for L
arge
Eng
ines
(MC
A, P
rodu
ctiv
ity),
$970
Add
ition
al C
NC
Mac
hine
(MC
A, P
rodu
ctiv
ity),
$500
100
Ton
Cra
nes
for 2
242
Exte
nsio
n(M
CA
, Pro
duct
ivity
), $5
00W
ire E
lect
ro-S
tatic
Dis
char
ge M
achi
ne (E
DM
) (M
CB
, Pro
duct
ivity
), $3
00H
ydra
ulic
Tes
t Ben
ch (M
CB
, Pro
duct
ivity
), $9
27M
achi
ne C
ell (
MC
B),
Prod
uctiv
ity, $
700
FY 2
011
Rob
otic
Cam
ofla
uge
Pain
ting
Sydt
em (M
CB
), R
epla
cem
ent,
$3,0
00R
adia
tor R
epai
r/Reh
build
Sys
tem
(MC
B),
Rep
lace
men
t, $3
30St
eam
Cle
anin
g Sy
stem
(MC
B),
Rep
lace
men
t, $1
,070
In L
ine
Dyn
o (3
) (M
CA
), R
epla
cem
ent,
$1,3
50
Exh
ibit
Fund
-9B
Cap
ital P
urch
ase
Just
ifica
tion

Dep
artm
ent o
f the
Nav
y / D
epot
Mai
nten
ance
- M
arin
e C
orps
Dep
ots
Qua
ntU
nit C
ost
Tota
l Cos
tQ
uant
Uni
t Cos
tTo
tal C
ost
Qua
ntU
nit C
ost
Tota
l Cos
tQ
uant
Uni
t Cos
tTo
tal C
ost
Com
pute
r Har
dwar
e (P
rodu
ctio
n)0
00
00
00
00
00
0C
ompu
ter S
oftw
are
(Ope
ratin
g Sy
stem
)0
00
00
00
00
00
0Te
leco
mm
unic
atio
ns0
00
00
00
00
00
0O
ther
Com
pute
r & T
elec
omm
unic
atio
ns S
pt E
quip
men
t0
00
00
01
745
745
00
0To
tal
00
00
00
174
574
50
00
AC
TIV
ITY
GR
OU
P C
API
TAL
INV
ESTM
ENT
JUST
IFIC
ATI
ON
Fisc
al Y
ear (
FY) F
Y20
11 B
udge
t Est
imat
es($
in T
hous
ands
)Fe
brua
ry 2
010
#002
- A
DPE
and
Tel
ecom
mun
icat
ions
Equ
ipm
ent
Mar
ine
Cor
ps D
epot
Mai
nten
ance
FY
Just
ifica
tion:
AD
PE a
nd T
elec
omm
unic
atio
ns E
quip
men
tF
Y 2
011
FY
200
9F
Y 2
010
2011
Wire
less
LA
N (M
CA
), $7
45
Exh
ibit
Fund
-9B
Cap
ital P
urch
ase
Just
ifica
tion

Dep
artm
ent o
f the
Nav
y / D
epot
Mai
nten
ance
- M
arin
e C
orps
Dep
ots
Qua
ntU
nit C
ost
Tota
l Cos
tQ
uant
Uni
t Cos
tTo
tal C
ost
Qua
ntU
nit C
ost
Tota
l Cos
tQ
uant
Uni
t Cos
tTo
tal C
ost
Rep
lace
men
t Cap
abili
ty0
00
0Pr
oduc
tivity
Cap
abili
ty7
639
4,47
08
660
5,28
04
726
2,90
50
0N
ew M
issi
on1
745
745
00
00
00
00
0En
viro
nmen
tal
172
072
00
00
170
070
00
00
Tota
l9
659
5,93
58
660
5,28
05
721
3,60
50
00
Just
ifica
tion:
#004
- M
inor
Con
stru
ctio
n M
arin
e C
orps
Dep
ot M
aint
enan
ce
Min
or C
onst
ruci
ton
FY
201
1F
Y 2
009
FY
201
0
Fi
scal
Yea
r (FY
) FY
2011
Bud
get E
stim
ates
($ in
Tho
usan
ds)
Febr
uary
201
0
Min
or C
onst
ruct
ion:
FY
200
9C
onst
ruct
CR
S Sh
op (M
CA
, Pro
duct
ivity
), $7
44M
ulti-
purp
ose
Cle
ar S
pan
(MC
A P
rodu
ctiv
ity),
$457
M
aint
enan
ce S
uppo
rt F
acili
ty (M
CA
) Pro
duct
ivity
), $7
45A
dditi
on to
Bui
ldin
g 22
42 (M
CA
), Pr
oduc
tivity
, $74
5B
last
Boo
th 5
Ext
ensi
on (M
CA
), Pr
oduc
tivity
, $41
6A
dditi
on to
Pro
gram
Man
agem
ent (
MC
A, P
rodu
ctiv
ity),
$693
B22
03 /A
dditi
on fo
r /tw
o In
-Lin
e D
ynos
(MC
A, P
rodu
ctiv
ity),
$669
Dec
onta
min
atio
n Fa
cilit
y (M
CB
, Env
ironm
enta
l), $
720
Non
Des
truc
tive
Test
Fac
ility
(MC
B, P
rodu
ctiv
ity),
746
FY 2
010
Aut
omot
ive
Faci
lity(
MC
B, P
rodu
ctiv
ity),
$725
Ligh
t Arm
or F
acili
ty(M
CB
, Pro
duct
ivity
), $7
10Se
curit
y C
ontr
ol F
acili
ty, (
MC
B) P
rodu
ctiv
ity, $
300
Forw
ard
Kit
Stag
ing
Faci
lity
(MC
B),
Prod
uctiv
ity, $
700
Arm
or D
isas
sem
bly/
Rep
air F
acili
ty (M
CB
), Pr
oduc
tivity
, $70
0A
lleyw
ay C
lear
span
(MC
A),
Prod
uctiv
ity, $
150
Touc
h U
p Pa
int F
acili
ty (M
CA
), Pr
oduc
tivity
, $74
5Te
st T
rack
Ren
ovat
ion,
(MC
A),
Prod
uctiv
ity, $
1.25
0
FY20
11C
onst
ruct
Cle
arsp
an, W
este
nd B
2200
(MC
A, P
rodu
ctiv
ity),
$745
Floo
r and
Enc
lose
bui
ldin
g 24
60(M
CA
, Rep
lace
men
t), $
745
Con
stru
ct C
lear
span
Wes
tend
B22
53 (M
CA
,Pro
duct
ivity
), $7
45Ve
hicl
e Ye
llow
/Gre
en T
ag F
acili
ty (M
CA
, Pro
duct
ivity
), $6
70Fl
uid
Rec
over
y Fa
cilit
y (M
CB
, Env
ironm
enta
l), $
700
Exh
ibit
Fund
-9B
Cap
ital P
urch
ase
Just
ifica
tion

Approved
Current
Asset/
FY
Reprogs
Project Cost
Project Cost
Deficiency
Explanation
Approved Project
Title
Equipment except ADPE and TELECOM
2010
Cross Drive dynam
ometer (MCA)
0.000
1.000
1.000
0.000Productivity
2010
Dyno for Large Engines (MCA)
0.120
0.850
0.970
0.000Productivity
2010
Additional CNC M
achine (M
CA)
0.085
0.300
0.385
0.000Productivity
2010
100 ton Cranes for 2242 Extension (MCA)
0.000
0.500
0.500
0.000Productivity
2010
Wire Electro‐Static discharge Machine(EMD) (M
CB)
0.000
0.300
0.300
0.000Rep
lacement
2010
Hydraulic Test Bench(M
CB)
0.117
0.810
0.927
0.000Productivity
2010
Machine Cell (M
CB)
0.700
0.000
0.700
0.000Productivity
Sub‐total Equipment
1.022
3.760
4.782
0.000
Equipment ‐ ADPE and TELECOM
0.000
0.000
0.000
0.000
Subtotal Equip ‐ ADPE and TELECOM
0.000
0.000
0.000
0.000
Software Development
0.000
0.000
0.000
0.000
Subtotal Software
0.000
0.000
0.000
0.000
Minor Construction
2010
Automotive Facility (MCB)
0.000
0.725
0.725
0.000Productivity
2010
Light Arm
or Facility(M
CB)
0.000
0.710
0.710
0.000Productivity
2010
Security Control Facility (MCB)
0.300
0.000
0.300
0.000Productivity
2010
Forw
ard Kit Staging Facility (MCB)
0.700
0.000
0.700
0.000Productivity
2010
Arm
or Disassembly/Rep
air Facility (MCB)
0.700
0.000
0.700
0.000Productivity
2010
Alleyway Clearspan (MCA)
0.150
0.000
0.150
0.000Productivity
2010
Touch Up Paint Facility (MCA)
0.745
0.000
0.745
0.000Productivity
2010
Test Track Renovocation (MCA)
1.250
0.000
1.250
0.000Productivity
Sub‐total Minor Construction
3.845
1.435
5.280
0.000
FY 2010 Estimate
4.867
5.195
10.062
0.000
(Dollars in Millions)
February 2010
Department of the Navy/ Navy Working Capital Fund
Depot Maintenance ‐ Marine Corps Depots
Capital Budget Execution
Fiscal Year (FY) 2011 Budget Estimates
Fund 9C Cap
ital Budget Execution

Fiscal Year 2009
Peacetime
Total Mobilization Operating Other
Material Inventory BOP 114.6 0.0 114.6 0.0
Purchases
A. Purchases to Support Customer Orders 173.3 0.0 173.3 0.0
B. Purchases of long lead times in advance of customer orders (+) 0.0 0.0 0.0 0.0
C. Other Purchases (list) (+)
Materials & Supplies 0.0 0.0 0.0 0.0
D. Total Purchases 173.3 0.0 173.3 0.0
Material Inventory Adjustment
A. Material Used in Maintenance (and billed/charged to customer orders 192.7 0.0 192.7 0.0
B. Disposals, theft, losses due to damage (‐)* 0.0 0.0 0.0 0.0
C. Other reductions (list) (‐) 0.0 0.0 0.0 0.0
D. Total inventory adjustment 192.7 0.0 192.7 0.0
Material Inventory EOP* 95.2 0.0 95.2 0.0
*Inventory (DBC 1400) less Work In Process ( DBC 1414)
Fiscal Year (FY) 2011 Budget Estimates
February 2010
($ʹs in Millions)
Department of the Navy/ Navy Working Capital Fund
Depot Maintenance ‐ Marinc Corps Depots
Material Inventory Data
Exhibit Fund‐16 Material Inventory Data

Fiscal Year 2010
Peacetime
Total Mobilization Operating Other
Material Inventory BOP* 95.2 0.0 95.2 0.0
Purchases
A. Purchases to Support Customer Orders 142.3 0.0 142.3 0.0
B. Purchases of long lead times in advance of customer orders (+) 0.0 0.0 0.0 0.0
C. Other Purchases (list) (+)
Materials & Supplies 0.0 0.0 0.0 0.0
D. Total Purchases 142.3 0.0 142.3 0.0
Material Inventory Adjustment
A. Material Used in Maintenance (and billed/charged to customer orders 151.1 0.0 151.1 0.0
B. Disposals, theft, losses due to damage (‐)* 0.0 0.0 0.0 0.0
C. Other reductions (list) (‐) 0.0 0.0 0.0 0.0
D. Total inventory adjustment 151.1 0.0 151.1 0.0
Material Inventory EOP* 86.4 0.0 86.4 0.0
*Inventory (DBC 1400) less Work In Process ( DBC 1414)
February 2010
($ʹs in Millions)
Department of the Navy/ Navy Working Capital Fund
Depot Maintenance ‐ Marinc Corps Depots
Material Inventory Data
Fiscal Year (FY) 2011 Budget Estimates
Exhibit Fund‐16 Material Inventory Data

Fiscal Year 2011
Peacetime
Total Mobilization Operating Other
Material Inventory BOP* 86.4 0.0 86.4 0.0
Purchases
A. Purchases to Support Customer Orders 94.9 0.0 94.9 0.0
B. Purchases of long lead times in advance of customer orders (+) 0.0 0.0 0.0 0.0
C. Other Purchases (list) (+)
Materials & Supplies 0.0 0.0 0.0 0.0
D. Total Purchases 94.9 0.0 94.9 0.0
Material Inventory Adjustment
A. Material Used in Maintenance (and billed/charged to customer orders 103.6 0.0 103.6 0.0
B. Disposals, theft, losses due to damage (‐)* 0.0 0.0 0.0 0.0
C. Other reductions (list) (‐) 0.0 0.0 0.0 0.0
D. Total inventory adjustment 103.6 0.0 103.6 0.0
Material Inventory EOP* 77.7 0.0 77.7 0.0
*Inventory (DBC 1400) less Work In Process ( DBC 1414)
February 2010
($ʹs in Millions)
Depot Maintenance ‐ Marinc Corps Depots
Material Inventory Data
Fiscal Year (FY) 2011 Budget Estimates
Department of the Navy/ Navy Working Capital Fund
Exhibit Fund‐16 Material Inventory Data

Total
FY 2009
FY 2010
FY 2011
06‐08
07‐09
08‐10
FY 2009
FY 2010
FY 2011
6%6%
6%
Revenue
Working Cap
ital Fund
509.9
537.2
527.3
21.3
18.3
16.6
Appropriations
0.0
0.0
0.0
Total Revenue
509.9
537.2
527.3
30.6
32.2
31.6
Working Cap
ital Fund Dep
ot Maintenan
ce Investm
ent
WCF Cap
ital Investm
ent Program
10.1
10.1
10.1
Facility Sustainment, Restoration and M
odernization
11.2
7.8
6.4
Equipment
0.0
0.4
0.1
Equipment purchase by Dep
ots under Expense/Investm
ent Threshold
0.0
0.4
0.1
Equipment purchase by Other Organ
izations under Expense/Investm
ent Threshold
0.0
0.0
0.0
Equipment purchase by Other Organ
izations above Expense/Investm
ent Threshold
0.0
0.0
0.0
Productivity Enhan
cements
0.0
0.0
0.0
Total WCF Investm
ent
21.3
18.3
16.6
Appropriated Funding
Facility Sustainment, Restoration and M
odernization
0.0
0.0
0.0
Equipment
0.0
0.0
0.0
Equipment purchase by Dep
ots under Expense/Investm
ent Threshold
0.0
0.0
0.0
Equipment purchase by Other Organ
izations under Expense/Investm
ent Threshold
0.0
0.0
0.0
Equipment purchase by Other Organ
izations above Expense/Investm
ent Threshold
0.0
0.0
0.0
Cap
ital Investm
ent Program (Other Procurement, N
avy)
0.0
0.0
0.0
Productivity Enhan
cements
0.0
0.0
0.0
Military Construction (MILCON)
0.0
0.0
0.0
Total Appropriated Funding
0.0
0.0
0.0
Component Total
21.3
18.3
16.6
-9.3
-13.
9-1
5.0
Budget M
inus 6 Percent
of Revenue Difference
Percent of Revenue
Revenue 3‐Year Average
Budgeted Cap
ital
AMOUNT IN MILLIONS
DEPOT MAINTENANCE SIX PERCENT CAPITAL INVESTMENT PLAN
DEPARTMENT OF THE NAVY
COMPONENT: DEPOT MAINTENANCE ‐ MCDEPOTS
FISCAL YEAR (FY) 2011 BUDGET ESTIMATES
FEBRUARY 2010
Exh
ibit
Fu
nd
- 6
Dep
ot M
ain
ten
ance
-Six
Per
cen
t C
apit
al I
nve
stm
ent
Pla
n

Naval Air Warfare Center

DEPARTMENT OF THE NAVY
NAVY WORKING CAPITAL FUND
RESEARCH AND DEVELOPMENT
NAVAL AIR WARFARE CENTER
FISCAL YEAR (FY) 2011 BUDGET ESTIMATES
February 2010
Mission Statement / Overview
The Naval Air Warfare Center (NAWC) budget submission includes the Aircraft
Division (AD) and the Weapons Division (WD). The NAWCAD mission is to remain the
Navy’s principal RDT&E, engineering and Fleet support activity for naval aircraft
engines, avionics, aircraft support systems and ship/shore/air operations. The scope of
the Aircraft Division mission includes the acquisition and in‐service support of manned
and unmanned air vehicles (UAVs) as well as air operations ashore and afloat. The
NAWCWD mission is to be the Navy’s full spectrum research, development, test,
evaluation, and in‐service engineering center for weapons systems associated with air
warfare (except antisubmarine warfare systems), missiles and missile subsystems,
aircraft weapons integration, and assigned airborne electronic warfare systems, and to
maintain and operate the air, land, and sea Naval Western Test Range complex. NAWC
receives Major Range Test Facility Base funding (RDT&E,N appropriation) to maintain
and support designated range facilities.
Financial Highlights/Assumptions
The budget reflects workload changes as indicated from NAWC customers. The
increase of workload over the FY 2010 President’s Budget required increases to
direct workforce, direct costs, and revenue.
Carryover estimates are within the allowable ceilings. Management of carryover
continues to be a high priority of the NAWC.
Activity Group Composition:
The NAWC is comprised of two business units, the Aircraft Division (AD), with the
primary location at Patuxent River, MD, and the Weapons Division (WD), with the
primary location at China Lake, CA and Point Mugu, CA.
Significant Changes Since the FY 2010 President’s Budget:
The budget proposes to realign the Naval Air Warfare Center Training Systems Division
(NAWCTSD) from mission funding to the NWCF beginning in FY 2011. NAWCTSD
provides a full range of innovative training solutions products and services. Their core
competencies include requirements analysis, systems engineering, systems acquisition,
fielding and sustainment over the training systems life cycle. Customers include Navy,
Department of Defense (DoD), Army, Air Force, and Coast Guard. NAWCTSD is the
only NAWC activity that is mission funded. However, in recent years the majority of
NAWCTSD’s workload has become reimbursable. The NWCF financial management
offers the most advantageous alignment for NAWCTSD by making it possible to

NAVAL AIR WARFARE CENTER
FISCAL YEAR (FY) 2011 BUDGET ESTIMATES
February 2010
identify and bill the full costs of operations to NAWCTSD customers. NAWCTSD will
be aligned with NAWCAD. This realignment will increase revenue and costs by
approximately 5%. NAWCTSD adds 995 civilian personnel and 36 military personnel to
NAWCAD.
Base Realignment and Closure:
As was true of the FY 2010 President’s Budget, this submission reflects the impact of the
Base Realignment and Closure (BRAC) V recommendation to consolidate the Weapons
& Armaments (W&A) Research, Development & Acquisition, and Test and Evaluation
(RDTA&E) into a Naval Integrated RDAT&E center at NAWC, China Lake, CA. China
Lake provides a diverse set of open air‐range and test environments to support
RDTA&E functions. The consolidation will provide synergy between the mission and
lifecycle/sustainment functions in air‐to‐air, air‐to‐ground, and surface launched mission
areas.
Also, consistent with the FY 2010 President’s Budget, this submission reflects the impact
of the BRAC V recommendation to consolidate Aircraft Maintenance within the Fleet
Readiness Centers (FRCs). This involves disestablishing the Aircraft Intermediate
Maintenance Departments (AIMDs) at NAWCAD and NAWCWD and transferring
them to the mission funded portion of the FRCs (which execute intermediate
maintenance for the Fleets). The recommendation also transfers the NAWCAD
Lakehurst Voyage Repair Team Detachment to the NWCF portion of the FRCs (which
already performs a similar function).
The recommendation results in a small net decrease in the manpower profiles and is not
expected to have a material financial impact on the total NAWC operations.
Financial Profile:
Revenue/Expense/Operating Results ($Millions) FY 2009 FY 2010 FY 2011
Revenue $3,468.1 $3,557.1 $3,719.1
Expense 3,486.5 3,553.0 3,712.7
Operating Results ‐$18.4 $4.1 $6.4
Other Changes Affecting AOR 0.0 0.0 0.0
Accumulated Operating Results (AOR) ‐$10.5 ‐$6.4 $0.0
Revenue and Expense: The trend in revenue and expense across the budget years
reflects updated estimates for workload and pricing adjustments.

NAVAL AIR WARFARE CENTER
FISCAL YEAR (FY) 2011 BUDGET ESTIMATES
February 2010
Collections/Disbursements/Outlays ($Millions) FY 2009 FY 2010 FY 2011
Collections $3,548.3 $3,560.9 $3,718.8
Disbursements 3,480.1 3,532.9 3,692.6
Outlays ‐$68.2 ‐$28.0 ‐$26.2
Reimbursable Orders ($Millions) FY 2009 FY 2010 FY 2011
Current Estimate $3,506.3 $3,563.2 $3,647.6
Direct Labor Hours (000) FY 2009 FY 2010 FY 2011
Current Estimate 16,574 16,489 17,834
Performance Indicator:
Unit Cost FY 2009 FY 2010 FY 2011
Total Stabilized Cost ($Millions) $1,527.9 $1,514.7 $1,697.7
Workload (DLHs) (000) 16,574 16,489 17,834
Unit cost (per DLH) $92.19 $91.86 $95.19
Unit cost is the method established to authorize and control costs. Unit cost goals allow
activities to respond to workload changes in execution by encouraging reduced costs
when workload declines and allowing appropriate increases in costs when their
customers request additional services.
Stabilized / Composite Rates FY 2009 FY 2010 FY 2011
Stabilized Rate $102.57 $108.29 $109.57
Change from Prior Year +5.57% +1.19%
Composite Rate Change +2.72% +1.32%
Rate changes reflect adjustments to direct workload and pricing changes.
Staffing Profile:
Civilian/Military ES & Workyears FY 2009 FY 2010 FY 2011
Civilian End Strength 11,410 11,364 12,447
Civilian Workyears (Less OT) 10,912 10,992 12,046
Military End Strength 140 190 232
Military Workyears 130 140 176

NAVAL AIR WARFARE CENTER
FISCAL YEAR (FY) 2011 BUDGET ESTIMATES
February 2010
Civilian Personnel: Civilian end strength and workyear data is based on coordination
with customers. Hiring actions are also kept in synchronization with customer demand.
Military Personnel: Military end strength and workyear numbers are relatively stable.
Capital Investment Program (CIP):
CIP Authority ($Millions) FY 2009 FY 2010 FY 2011
Equipment, Non‐ADPE / Telecom $18.0 $20.3 $22.5
Equipment, ADPE / Telecom 7.9 7.9 10.0
Software Development 0.7 1.9 0.3
Minor Construction 7.4 8.0 5.3
Total $34.0 $38.1 $38.1
Carryover Compliance:
Carryover ($Millions) FY 2009 FY 2010 FY 2011
New Orders $3,506.3 $3,563.2 $3,647.6
Less Exclusions:
Foreign Military Sales 138.1 131.4 133.1
Base Realignment and Closure 21.4 20.0 19.5
Other Federal Departments & Agencies 57.7 45.7 36.7
Non‐Federal Agencies & others 21.6 19.2 19.2
Major Range & Test Facility Base 306.7 340.4 315.7
Orders for Carryover Calculation $2,960.8 $3,006.5 $3,123.4
Composite Outlay Rate 53.9% 53.5% 53.3%
Carryover Ceiling Rate 46.1% 46.5% 46.7%
Carryover Ceiling $1,363.8 $1,397.3 $1,459.3
Balance of Customer Orders at Year End $1,620.6 $1,626.7 $1,555.2
Less Work‐in‐Process 0.0 0.0 0.0
Less Exclusions
Foreign Military Sales 145.9 157.2 100.6
Base Realignment and Closure 5.4 8.4 9.4
Other Federal Departments & Agencies 48.8 63.7 62.2
Non‐Federal Agencies & Others 21.7 24.5 16.8
Major Range & Test Facility Base 131.2 108.9 84.7
Carryover Budget $1,267.6 $1,264.0 $1,281.5
Budgeted carryover is within the ceiling allowed by outlay rates.

FY 2009 FY 2010 FY 2011
Operations 3,425.4 3,518.6 3,680.6 Surcharges - - - Depreciation excluding Major Construction 42.7 38.5 38.4
Total Income 3,468.1 3,557.1 3,719.1
Military Personnel 11.5 9.5 13.9 Civilian Personnel 1,316.3 1,377.7 1,529.2 Travel and Transportation of Personnel 80.3 61.7 62.5 Material & Supplies (Internal Operations) 321.8 333.5 334.0 Equipment 22.4 15.5 15.0 Other Purchases from NWCF 86.8 108.4 111.3 Transportation of Things 3.0 2.9 2.9 Depreciation - Capital 42.7 38.5 38.4 Printing and Reproduction 1.4 1.1 1.1 Advisory and Assistance Services 0.6 0.7 0.8 Rent, Communication & Utilities 74.1 69.3 84.0 Other Purchased Services 1,525.6 1,534.0 1,519.6 Total Expenses 3,486.5 3,553.0 3,712.7
Work in Process Adjustment - - - Comp Work for Activity Retention Adjustment - - - Cost of Goods Sold 3,486.5 3,553.0 3,712.7
Operating Result (18.4) 4.1 6.4
Less Surcharges - - - Plus Appropriations Affecting NOR/AOR - - - Other Changes Affecting NOR/AOR - - - Extraordinary Expenses Unmatched - - -
Net Operating Result (18.4) 4.1 6.4
Other Changes Affecting AOR - - -
Accumulated Operating Result (10.5) (6.4) -
Revenue: Gross Sales
Other Income
Expenses Cost of Materiel Sold from Inventory Salaries and Wages:
Revenue and ExpensesDepartment of the NavyResearch and DevelopmentNaval Air Warfare Center
Fiscal Year (FY) 2011 Budget EstimatesFebruary 2010($ in Millions)
Exhibit Fund-14, Revenue and Expenses

FY 2009 FY 2010 FY 2011------- ------- -------
1. New Orders 3,506.3 3,563.2 3,647.6
a. Orders from DoD Components: 3,205.3 3,289.2 3,379.2
Department of the Navy 2,693.6 2,832.9 2,916.9 O & M, Navy 567.4 456.2 448.7 O & M, Marine Corps 4.7 4.7 10.3 O & M, Navy Reserve 1.2 0.8 0.9 O & M, Marine Corp Reserve - - - Aircraft Procurement, Navy 528.2 573.5 617.2 Weapons Procurement, Navy 65.7 48.1 52.6 Ammunition Procurement, Navy/MC 25.2 28.5 25.6 Shipbuilding & Conversion, Navy 67.1 54.4 55.8 Other Procurement, Navy 108.7 85.1 88.6 Procurement, Marine Corps 7.1 4.9 6.2 Family Housing, Navy/MC - - - Research, Dev., Test, & Eval., Navy 1,316.9 1,576.0 1,610.4 Military Construction, Navy 0.1 - - National Defense Sealift Fund 0.6 0.7 0.7 Other Navy Appropriations 0.6 - - Other Marine Corps Appropriations - - -
Department of the Army 105.5 92.9 96.7 Army Operation & Maintenance 32.5 31.2 30.8 Army Res, Dev, Test, Eval 50.0 39.3 40.5 Army Procurement 22.6 22.1 25.0 Army Other 0.3 0.4 0.4
Department of the Air Force 132.2 121.4 121.7 Air Force Operation & Maintenance 23.0 19.1 19.2 Air Force Res, Dev, Test, Eval 38.6 34.3 35.7 Air Force Procurement 70.3 67.5 66.3 Air Force Other 0.2 0.4 0.5
DOD Appropriation Accounts 274.1 242.1 243.9 Base Closure & Realignment 21.5 20.0 19.5 Operation & Maintenance Accounts 48.3 50.1 51.9 Res, Dev, Test & Eval Accounts 120.9 104.4 106.0 Procurement Accounts 77.8 61.7 60.6 Defense Emergency Relief Fund - - - DOD Other 5.7 5.8 5.8
b. Orders from other Fund Activity Groups 83.6 77.6 79.4
c. Total DoD 3,288.9 3,366.9 3,458.6
d. Other Orders: 217.4 196.3 189.0 Other Federal Agencies 57.7 45.7 36.7 Foreign Military Sales 138.1 131.4 133.1 Non Federal Agencies 21.6 19.2 19.3
2. Carry-In Orders 1,571.6 1,620.6 1,626.7
3. Total Gross Orders 5,077.9 5,183.8 5,274.3
a. Funded Carry-Over before Exclusions 1,620.6 1,626.7 1,555.2
b. Total Gross Sales 3,457.3 3,557.1 3,719.1
4. End of Year Work-In-Process (-) - - -
5. Non-DoD, BRAC, FMS, Inst. MRTFB (-) (353.0) (362.7) (273.7)
6. Net Funded Carryover 1,267.6 1,264.0 1,281.5
Exhibit Fund-11, Sources of Revenue
Sources of RevenueDepartment of the NavyResearch and DevelopmentNaval Air Warfare Center
Fiscal Year (FY) 2011 Budget EstimatesFebruary 2010($ in Millions)
Note: Line 4 (End of Year Work-In-Process) is adjusted for Non-DOD BRAC, FMS, and Institutional MRTFB

Total Costs
FY 2009 Actual 3,486.5$
FY 2010 Presidentʹs Budget 3,246.6$
Pricing Adjustments
Fuel Price Changes 19.5
Generall Purchase Inflation (1.8)
Program Changes
Fixed Wing Aircraft 167.6
Guided Weapons 3.0
Rotor Craft 14.5
Avionics 22.1
Other 75.4
Other Changes
BRAC Workload Realignment 6.6
FECA (0.1)
Defense Finance and Accounting Service (0.5)
Integrated Logistics Support 0.1
FY 2010 Current Estimate 3,553.0$
Pricing Adjustments
Annualization of Pay Raises
Civilian Personnel 7.0
Military Personnel 0.1
Pay Raise
Civilian Personnel 14.3
Military Personnel 0.1
Working Capital Fund Price Changes 6.8
General Purchases Inflation 30.5
Program Changes
Fixed Wing Aircraft (5.2)
Guided Weapons (3.4)
Rotor Craft (10.8)
Avionics (17.5)
Other (22.2)
Other Changes
TSD Orlando realignment from mission funding 172.9
Base Realignment and Closure (13.0)
FECA 0.3
Defense Finance and Accounting Service 0.3
VSIP (0.3)
Depreciation (0.1)
FY 2011 Current Estimate 3,712.7$
Februay 2010
($ in Millions)
Department of the Navy
Changes in Cost of Operations
Research and Development/Naval Air Warfare Center
Fiscal Year (FY) 2011 Budget Estimates
Exhibit Fund‐2, Changes in the Cost of Operations

FY 2009
FY 2010
FY 2011
Line #
Description
Quantity
Total Cost
Quantity
Total Cost
Quantity
Total Cost
1Non‐A
DPE and Telecom Equipment
‐ Rep
lacement Cap
ability
27$13.504
16$8.709
10$5.142
‐ Productivity Cap
ability
7$2.593
12$7.511
16$8.915
‐ N
ew M
ission Cap
ability
6$1.874
9$4.109
16$8.373
‐ Environmental Cap
ability
0$0.000
0$0.000
0$0.000
40$17.971
37$20.329
42$22.430
2 ADPE and Telecom Equipment
‐ Computer Hardware (Production)
6$3.336
1$0.600
5$1.700
‐ Computer Software (O
perating)
3$1.561
3$1.725
2$0.841
‐ Telecommunications
1$0.650
9$4.114
9$7.493
‐ Oth Computer & Telecom Spt Equip
4$2.352
3$1.435
0$0.000
14$7.899
16$7.874
16$10.034
3Software Development
‐ Projects = or > $1M (List Sep
arately)
0$0.000
0$0.000
0$0.000
‐ Projects < $1M
2$0.745
3$1.845
1$0.300
2$0.745
3$1.845
1$0.300
4Minor Construction
‐ Rep
lacement Cap
ability
3$1.901
1$1.800
0$0.000
‐ Productivity Cap
ability
0$0.000
0$0.000
0$0.000
‐ N
ew M
ission Cap
ability
8$5.472
11$6.235
8$5.319
‐ Environmental Cap
ability
0$0.000
0$0.000
0$0.000
11$7.373
12$8.035
8$5.319
Grand Total
67$33.988
68$38.083
67$38.083
Total Capital Outlays
$31.968
$33.687
$33.767
Total Depreciation Expense
$42.681
$38.543
$38.448
$ in Millions
Capital Investment Summary
Department of the Navy
Research and Development / Naval Air Warfare Center
February 2010
Fiscal Year (FY) 2011 Budget Estimates
Exhibit Fund‐9a, Capital Investment Summary

Dep
artm
ent of the Navy / N
aval Air System
s Comman
d
Quan
t
Unit
Cost
Total
Cost
Quan
t
Unit
Cost
Total
Cost
Quan
t
Unit
Cost
Total
Cost
Quan
tUnit Cost
Total Cost
Rep
lacement Equipment
270
13,504
160
8,709
105,142
Productivity Equipment
70
2,593
120
7,511
160
8,915
New M
ission Equipment
60
1,874
90
4,109
168,373
Environmental Complian
ce0
00
00
00
00
00
0
Total
00
040
17,971
3720,329
4222,430
Cap
ital Investm
ent Justification
Fiscal Year (FY) 2011 Budget Estim
ates
($ in Thousands)
February 2010
#001 ‐ N
on‐A
DPE and Telecommunications
NAWC
FY 2011
Justification:
Non‐A
DPE and Telecommunications Equipment
FY 2010
FY 2009
1 . Projects within this cap
ability w
ill assist N
AWC in creating solutions that w
ill ad
dress deficiencies in cap
abilities that w
ill allow us to better perform m
ission efforts. Existing equipment provides lim
ited cap
abilities due
to age of equipment, speed of operation, and technological advan
ces. N
ew technologies, processes, and advan
ces in various areas of engineering, research and development, and testing that is done at N
AWC creates a
need to procure investm
ent equipment.
Equipment replacement will benefit support equipment such as a universal lathe an
d boring m
ill, various system
s an
d equipment for mechan
ical, electronic, acoustic, and tem
perature/altitude testing efforts, as well as,
several areas of the aircraft lau
nch and recovery equipment work. Additionally, equipment processors and m
echan
ical system
s are slow and afford lim
ited abilities to record, m
ix and/or process energetic m
aterials and test
processes. Increased w
ork load
s in laser technology and high energy lasers have exceed
ed the capacity and cap
abilities of current equipment. Improved equipment is required to characterize and coat dielectric an
d optical
windows used in advan
ced seeker, sensor an
d directed energy components. Expan
sion in surveillan
ce and communications projects have created a need for a ground terminal providing w
ideban
d, line of site cap
ability.
Electromagnetic testing cap
abilities need to be expan
ded to higher frequencies to m
eet the requirem
ents of future system
s. A
irborne instrumentation cap
ability for testing of counterm
easure system
s is lim
ited by the
unavailability of suitable aircraft. T
esting of electronic w
arfare equipment is lim
ited by an insufficient number of radar environment simulators. New equipment will provide process control of energetic operations, test
operations an
d data collection; signal processing cap
abilities for continued development of test equipment an
d flight hardware to support m
issile development; installation of new controllers for clim
atic cham
bers for
continued test of operational hardware an
d fleet approved w
eapons; continued development of guidan
ce equipment various weapon system
s. A high energy laser laboratory and improved laser characterization
equipment will provide an increased ability to develop and evaluate the effects of directed energy devices. A portable ground terminal equipped w
ith advan
ced antenna an
d communication gear will allow interfaces w
ith
man
ned and unman
ned surveillan
ce platform
s an
d support of numerous customers. T
he third phase of the Electromagnetic Laboratory upgrade will include receiver and amplifier system
s that increase the laboratoryʹs
frequency cap
ability to the level that w
ill be required by future platform
s. A
n additional Advan
ced M
ultiple Environment Sim
ulator will provide an enhan
ced cap
ability to support the development of EW suites in a m
ore
cost effective an
d tim
ely m
anner. Increased cap
acity w
ill allow longer run tim
es for testing of high speed propulsion system
s an
d components. An expan
ded cap
ability w
ill allow m
ore effective testing of electronic safe
arm devices.
Upgrades to productivity equipment will benefit support equipment for an
tennas, rad
ars, networks, ID Friend or Foe, heat treatm
ent, hydraulic press, valve plug lathe an
d night vision testing efforts. L
aboratories that w
ill
be upgraded include the mobile lighting lab, antenna lab, and battery lab. Other cap
abilities to be upgraded include the ejection tower, w
indblast efforts, avionics, and sensor integration w
ork.
New m
ission equipment will support various NAWC efforts, including pulsed power load ban
ks, the materials lab, the synthetic lab, n
ight vision photometrics, rad
io frequency and m
icrowave electronic system
s,
crashworthy system
s, cold atom m
agnetometers, and highly accelerated life tests. A
dditional efforts will assist in developing w
eaponization of unman
ned vehicles an
d development of new high energy laser system
s in
support of war fighter operations. U
tilizing new
ly developed m
aterials and components, w
ar fighters w
ill be able to find, track, target and destroy enem
y assets out of harms way. New cap
abilities in photonics will also
be initiated.
2. T
he investm
ent will enable N
AWC to m
eet customer’s expectations, improve in operational efficiencies, and provide new state‐of‐the‐art technology to increase N
AWC’s customer support for all mission efforts.
3. Economic analysis were perform
ed.
4. Cost avoidan
ce w
ill begin upon project completion.
5. If investm
ent is not mad
e, N
AWC w
ould be limited in the ability to increase cap
abilities in support of aircraft carriers, networks, sensors, w
eapons, platform
s an
d have a significan
t negative result on the success,
efficiency and w
ar fighting effectiveness of the Navy. This w
ill also decrease innovative affordable technologies to the Fleet w
hich support our nationʹs defense strategy and goals, and red
uce overall Naval w
arfighting
effectiveness.
Exhibit Fund‐9c, Capital Budget Justification

Dep
artm
ent of the Navy / Research and Development / Naval
Air W
arfare Center
Quan
tUnit Cost
Total Cost
Quan
tUnit Cost
Total Cost
Quan
tUnit Cost
Total Cost
Computer Hardware (Production)
60
3,336
1
‐
600
5
‐
1,700
Computer Software (O
perating System
)3
01,561
3
‐
1,725
2
‐
841
Telecommunications
10
650
9
‐
4,114
9
‐
7,493
Other Computer & Telecommunications Spt Equipment
40
2,352
3
‐
1,435
‐
‐
‐
Total
147,899
16
7,874
16
10,034
Justification:
FY 2009
NAWC
FY 2010
Fiscal Year (FY) 2011 Budget Estim
ates
February 2010
FY 2011
#002 ‐ ADPE and Telecommunications Cap
abilities
Cap
ital Investm
ent Justification
($ in Thousands)
ADPE and Telecommunications Equipment
ADPE and Telecommunications: FY 2009‐FY 2011
1. Projects will support various NAWC areas to include networks, ADPE security, analysis tools, sim
ulators, acoustic w
arfare, m
odeling and sim
ulation, servers, technology enhan
cement an
d engineering
computer upgrades. Current capability in network connectivity is inad
equate to participate to the extent required in network centric operations. Improvem
ents are required to upgrade inform
ation
sharing cap
ability for developing and testing of network centric system
s. N
AWC w
ill develop an open architecture, h
igh ban
dwidth, secure network w
hich w
ill provide the desired cap
ability and provide
connectivity w
ith networks such as the Global Inform
ation Grid. Cap
ability w
ill also be developed to support w
eaponization of unman
ned aerial vehicles. Safe operation requires continuous
communication links between the air vehicles an
d ground operations. W
hile interim solutions are being pursued for near term testing, a beyond the line of sight communication link is ultim
ately required
to provide this cap
ability. An instrumentation system w
ill be put in place that allows direct communications with airborne system
s throughout the test complex. Several isolated laboratories currently
perform electronic combat sim
ulation functions, leading to the inefficient use of resources. A centralized data center with servers an
d terminals will be developed to provide more cost effective support to
a broad ran
ge of programs. C
omputer hardware assets currently used in support of unman
ned system w
eaponization studies are either being shared w
ith other projects or are in need of upgrade. W
ith
the tran
sition of this w
ork to the Unman
ned System
s Weaponization Lab in FY 2008, ded
icated resources w
ill be required
. High end PC and networking equipment will be installed to support w
eapons
control station, stores man
agem
ent suites, safe separation analysis, real time operating system
s, and data link and ground station suites. Present computer assets do not permit full application of current
and future tools used in advan
ced computational fluid dynam
ics, aerodynam
ic analysis, and thermal analysis. C
urrent system
s for these an
alyses are at full cap
acity, w
ith no cap
ability to support
additional customer needs. T
he current system w
ill be upgraded w
ith additional CPU nodes, storage an
d related hardware provided required additional cap
acity.
2. T
he projects will enable N
AWC to m
eet customer’s expectations, improve in operational efficiencies, and provide new state‐of‐the‐art technology to increase N
AWC’s customer support for all mission
efforts.
3. Economic analysis were developed and included w
ith individual project submissions.
4. Cost avoidan
ce for the equipment in this cap
ability w
ill begin upon project completion.
5. If investm
ent is not mad
e, N
AWC w
ould be limited in the ability to increase our existing cap
abilities in support of aircraft carriers, networks, sensors, w
eapons, platform
s an
d have a significan
t negative
result on the success, efficiency and w
ar fighting effectiveness of the Navy. This w
ill also decrease innovative affordable technologies to the Fleet w
hich support our nationʹs defense strategy and goals
and red
uce overall Naval w
arfighting effectiveness.
Exhibit Fund 9b Capital Investment Justification

FY2009
Greater than $1M:
Advanced Diagnostic Simulator
1. T
he purpose of this project is to procure an advan
ced avionic sim
ulator to enhan
ce the development of avionic diagnostics across all N
aval Air W
arfare Center Aircraft Division (NAWCAD) platform
s.
An M
H‐60S/R sim
ulator will be built an
d reside in the state of the art laboratory at NAWCAD. T
his sim
ulator will enable the development of innovative diagnostic procedures which w
ill include tools
such as case based reasoned
, neu
ral networks an
d synthetic instrument ap
plications. The aim of the research is to develop an advan
ced diagnostics tool that can be used across all N
AWCAD platform
s.
2. P
resently there is a great disparity across N
AWCAD platform
s when it comes to diagnostics. Some platform
s, like the H‐60, are developing advan
ced diagnostics, w
hile other platform
s like the E‐2C, or
V‐22 have none. The plan is to use the diagnostics developed by the H‐60 program as a springboard for future advan
cements in the diagnostics field, w
ith the goal being the development of diagnostics
that can be ap
plied to any platform
.
3. An economic analysis has been perform
ed for this project included in this cap
ability.
4. The an
ticipated cost avoidan
ce for the equipment in this cap
ability w
ill begin in the next fiscal year.
5. If investm
ent is not mad
e, N
AWC w
ill not be able to support increasing cap
abilities the diagnostics field, w
hich w
ill have a significan
t negative result on the success, efficiency and w
ar fighting
effectiveness of the Navy.
FY2009
Greater than $1M:
Platform Laboratories Maritime Surveillance Aircraft Upgrade Program
1. N
aval Air W
arfare Center Aircraft Division (NAWCAD) is responsible for the im
plementation of system an engineering resource center to support the Naval Air System
s Comman
d (NAVAIR). As a
result, N
AWCAD w
ill continue to support the development an
d m
aintenan
ce of distributed facilities to implement an
d validate the C5ISR architectures that w
ill be required in the 21st century to support
asynchronous warfare. These include facilities for platform validation, m
odeling and sim
ulation. The facilities w
ill also support Battlespace Engineering and Airship Integration and Development, as well
as, p
latform cap
abilities. P
latform
s include the Multi Mission Aircraft (M
MA), Joint Strike Fighter (JSF) an
d H
awkeye 2000, as well as, legacy platform
s such as the P‐3, E‐2C and E‐6B. Each of the major
platform
s is driving technology towards what industry offers under Commercial Off‐the‐Shelf (COTS)/Non Development Item (NDI). In order for these multi‐million dollar facilities to keep pace with the
chan
ging technological environment, system
s need to be upgraded and new system
s ad
ded to the inventory. This project covers all the major Platform labs at N
AWCAD and w
ill benefit both N
AWCAD
and the War Fighter.
2. C
urrent Commercial‐O
ff‐the‐Shelf Software (COTS)/NDI Lab assets are/or will be aging out over the next few years. T
echnology is chan
ging at a more rap
id pace, further rendering these system
s out‐of‐
date. T
he platform
s NAWC supports are integrating m
ore and m
ore of this technology into their trad
itional proprietary platform
s an
d increasing their dep
endence on networked system
s. U
pgrading
facilities into m
ulti‐use facilities provides customers an
d Fleet users assets to m
ake their job easier an
d give the war fighter the tools he needs.
3. An economic analysis has been perform
ed for this project included in this cap
ability.
4. The an
ticipated cost avoidan
ce for the equipment in this cap
ability w
ill begin in the next fiscal year.
5. If investm
ent is not mad
e, N
AWC w
ill be unable to support the programs aimed at increasing the capabilities of networks, sensors, w
eapons, and related platform
s an
d there will be a significan
t
negative result on the success, efficiency and w
ar fighting effectiveness of the aviation platform
s an
d system
s within the Navy.
Exhibit Fund 9b Capital Investment Justification

FY2009‐FY2010
Greater than $1M:
Operations Research Immersive & Optimization Network
1. O
perations Research Immersive an
d Optimization N
etwork (ORIO
N) is necessary to support N
aval Air W
arfare Center Aircraft Divisionʹs (NAWCAD) effort to use m
odeling and sim
ulation to analyze
and streamline aviation shipboard operations. O
RIO
N provides the resources to visualize the ship state dynam
ically as various ship system
s are exercised, straining both physical space an
d personnel
resources. An immersive presentation technique allows subject m
atter experts (SMEs) to easily see w
hat is going on, experience the problem, and possibly form
ulate a solution w
ithout ever reading a
simulation rep
ort, or viewing m
odel data.
2. T
he Im
mersive Design and Optimization Environment (IDOS) system currently employed to accomplish m
uch of the visualization tasks at N
AWCAD provides only one of a set of solutions to
accomplish the visualization, and is currently cap
able of only helping a single customer at a time. O
RIO
N w
ill provide ad
ditional services for more sim
ultan
eous customers, and w
ill be less expensive
than before. The Modeling and Sim
ulation spaces at Lakehurst will be revitalized w
ith the ad
dition of more resolute projectors and m
odern computer system
s. ORIO
N w
ill au
gment this w
ith new
technologies such as stereo projection, h
ead m
ounted displays, 3D plasm
a displays (w
hich do not require glasses), V
irtual Reality (VR) tablets, and W
eb technologies. A
ll enhan
cements w
ill enable the
proper level of em
ersion to be provided to the customer, in a less restrictive man
ner than is currently possible, and in the location w
here the system is being tested. Two specific areas can finally be
addressed
. They are the maintenan
ce and team VR. In addressing m
aintenan
ce, V
R can help w
ith assem
bly issues, p
arts and tool placement, and space arrangem
ent (as in w
eapon assem
bly m
agazines).
Team VR allows each person to see the others but move an
d act indep
endently in the environment. T
his w
ill allow several designers to use the VR space as a team w
ould on the ship. Currently, V
R is
generally used from a single person perspective. W
eb technologies will also be available in ORIO
N. VR can then be more easily shared w
ith rem
ote sites w
ith little or no specialized equipment, allowing
more broad based collaboration. Through the use of the existing network, these views of the shipʹs state w
ill be synchronized
, and present the same view to all those participating. T
hese views of ship state
will be generated by a series of process m
odels, starting w
ith the flight deck and w
orking down to the lower levels of the ship (as in the case for weapons).
3. An economic analysis has been perform
ed for this project included in this cap
ability.
4. The an
ticipated cost avoidan
ce for the equipment in this cap
ability w
ill begin in the next fiscal year.
5. If investm
ent is not mad
e, N
AWC w
ill be limited in the ability to support the programs for developing enhan
ced cap
abilities in m
odeling and sim
ulation and virtual reality.
FY2009
Greater than $1M:
Integrated Battlespace Arena (IBAR) Computer Replacements/UAV Lab (Phase 1 of 4)
1. T
he Integrated Battlespace Arena is a collection of several laboratories and facilities that are ded
icated to battlespace engineering investigations at all levels of Research, D
evelopment, Test an
d
Evaluation (RDT&E). T
he limitations of current computational equipment in terms of capability and supportability are taxing the ability of the Integrated Battlespace Arena to m
eet the needs of current
and future program requirem
ents. The multiyear equipment upgrade program w
ill provide the needed processing, scene generation, and data backup improvem
ents.
2. T
he current simulation requirem
ents from the broad IBAR customer base continues to tax the current capability of the various IBAR components. The high perform
ance computing cap
ability acquired
in 1999 has an average lifespan of three to five years. For seven years, this computing cap
ability has been relied upon by not only the IBAR, but by other science and technology initiatives. These Silicon
Graphics, Inc. (SGI) computers procured in 1999 are no longer supported by SGI an
d m
ust be replaced. In addition, as program dollars become increasingly scarce an
d the need to red
uce the number of in‐
flight an
d live‐fire tests increases, reliance on the IBAR w
ill also increase.
3. An economic analysis has been perform
ed for this project included in this cap
ability.
4. The an
ticipated cost avoidan
ce for the equipment in this cap
ability w
ill begin in the next fiscal year.
5. If investm
ent is not mad
e, N
AWC w
ill continue to use outdated equipment to support operations an
d critical tests.
Exhibit Fund 9b Capital Investment Justification

FY2009‐FY2010
Greater than $1M:
SE & ALRE Design & Analysis Lab
1. The Support Equipment (SE) an
d Aircraft Lau
nch and Recovery Equipment (A
LRE) Design and Analysis Lab provides engineers w
ith the latest state of the art design tools to perform complex designs
and engineering analysis to support critical Fleet requirem
ents. This project expan
ds the high powered design and analysis capability from the initial lab to engineers perform
ing complex design and
engineering analysis located at Lakehurst an
d Patuxent River. This expan
ded cap
ability w
ill link N
AVAIR sites, C
arrier Suitability, lan
d based Fleet Readiness Centers (FRCs), A
ircraft Interm
ediate
Maintenan
ce Dep
artm
ents (AIM
Ds), and dep
loyed ships for support of ALRE and SE In‐Service Engineering functions. For exam
ple, p
erform
ance, d
iagnostic, testing and/or engineering data will be
tran
smitted real‐time or near real‐tim
e for evaluation among engineering and/or maintenan
ce facilities. D
eployed ships at sea w
ill also have the capability to transm
it real‐time or near real‐tim
e
perform
ance and diagnostic data for evaluation by engineers to prevent system problems or failures before they occur.
2. C
urrently, D
esign and In‐Service Engineers do not have a sufficient number of high powered engineering w
orkstations, software an
d system software interfaces to perform complex designs or
engineering analysis on assigned projects. This results in delays in design project sched
ules an
d engineering investigations. H
igh end engineering w
ork stations, analytical software, and interfaces to
SE/A
LRE system software are necessary to perform the complex designs an
d engineering analysis. W
ith an adequate number of high powered w
ork stations an
d software, design projects an
d engineering
investigations can be perform
ed quickly w
ithout having to share work stations or having to utilize contract support services. W
ith adequate engineering tools, engineers w
ill be able to execute design and
engineering investigations more efficiently. T
oday, engineers m
ust travel to testing facilities, AIM
Ds, and ships to assess an
d trouble shoot SE/A
LRE system perform
ance problems. The new hardware an
d
software will enable engineers to analyze system perform
ance and diagnostics at their desk top rather then traveling to testing sites and ships.
3. Economic analysis were developed and included w
ith individual project submissions.
4. Cost avoidan
ce for the equipment in this cap
ability w
ill begin upon project completion.
5. If the investm
ent is not mad
e, N
AWC engineers w
ill not be able to perform design and in‐service engineering functions across these NAVAIR sites, A
IMDs, Competencies, D
eployed Ships, etc. as
efficiently and effectively as is possible. Being able to assess system perform
ance data at their desk top w
ill enable engineers to assess multi‐ship problems at once resulting in m
ajor im
provem
ents to
Fleet Readiness.
FY2009‐FY2010
Greater than $1M:
Video Technologies Refreshment
1. T
he purpose of this project is to install the hardware an
d software required for technology refreshment of video services to N
aval Air W
arfare Center Aircraft Division (NAWCAD) customers. T
his
application w
ill allow for the following types of services: video teleconferencing (VTC), data collaboration, C
losed Circuit Television (CCTV), Visions (N
AS Patuxent River’s ded
icated training chan
nel),
networked distance learning, streaming audio and video broad
casts. U
pgrading, m
odernizing and increasing the capacity of existing system
s will facilitate the use of video technologies to conduct long‐
distance m
eetings an
d training thereby red
ucing travel.
2. NAWC continues to benefit from efficiencies realized by the centralization of video services. T
o ensure the delivery of reliable services, video hardware an
d software must be periodically refreshed
.
This refresh includes end user system
s, conference bridges, and gatew
ay servers. T
he goal is to sustain reliable services, m
aintain compatibility among system
s, m
inim
ize hardware maintenan
ce costs, and
reduce the mean tim
e between failures for all video system components.
3. Economic analysis were developed and included w
ith individual project submissions.
4. Cost avoidan
ce for the equipment in this cap
ability w
ill begin upon project completion.
5. If investm
ent is not mad
e, N
AWCAD w
ould be limited in our ability to increase our capabilities in support of aircraft carriers, networks, sensors, w
eapons, platform
s an
d have a significan
t negative
result on the success, efficiency and w
ar fighting effectiveness of the Navy.
Exhibit Fund 9b Capital Investment Justification

FY2010‐2011
Greater than $1M:
SE/ALRE Integrated Supt Environment Information System
1. T
he Support Equipment (SE) an
d Aircraft Lau
nch and Recovery Equipment (A
LRE) Integrated Support Environment (ISE) Inform
ation System (IS) project w
ill provide an over‐arching environment
that links SE/A
LRE System design, tech data, training and system
/equipment existing and future inform
ation system
s into one cohesive integrated system
. This project w
ill leverage the existing and future
fleet support initiatives being implemented. ISE IS w
ill create a support infrastructure for new and legacy system
s that can be ad
aptable to ALRE and SE system
s of varying complexity. T
he ISE IS w
ill be
an environment built upon near an
d real time inform
ation exchan
ge between design, supply, and m
aintenan
ce environments utilizing contemporary engineering, acquisition, p
rognostics, and supply
chain m
anagem
ent methodologies. The integration of SE/A
LRE ISE IS System
s will enable the efficient tran
smitting of needed inform
ation throughout the SE/A
LRE community including engineering,
program m
anagem
ent, logistics, and the Fleet. ISE IS effort w
ill be targeted to the ad
van
ced recovery control system
, exped
itionary airfield (EAF) system
s, and consolidated automated support system
.
2. C
urrently the numerous SE/A
LRE design, technical data, training, and system support inform
ation system
s are not integrated or linked
. This results in fragmented, out dated
, or conflicting inform
ation
being provided to system users. C
urrent integrated support solutions being developed for weapons system
s platform
s, such as au
tonomic logistics, h
ave created fleet expectations of support levels that are
unable to be achieved by the current ALRE/SE support infrastructure. Without a comprehensive program to create an overarching support environment for the man
y individual ALRE/SE system
s, m
any
sub‐optimized support approaches w
ill be developed
.
3. Economic analysis were developed and included w
ith individual project submissions.
4. Cost avoidan
ce for the equipment in this cap
ability w
ill begin upon project completion.
5. W
ithout a comprehensive program to create an overarching support environment for the man
y individual ALRE/SE system
s, m
any sub‐optimized support approaches w
ill be developed
.
FY2009‐2011
Greater than $1M:
Secure Horizontal Access to RDT&E Enterprise Network
1. The Secure H
orizontal Access to RDT&E Enterprise N
etwork (SHARE‐N
et) project w
ill build on a streamlined inform
ation architecture w
ithin the NAWCAD RDT&E enterprise by tying together a
significan
tly red
uced number of websites, servers, applications, and databases in a secure, Intran
et environment using commercial w
eb services and sophisticated, m
ulti‐level inform
ation assurance
technologies. T
he result w
ill be a shared data environment that facilitates RDT&E collaboration on technical engineering and testing inform
ation across the NAWCAD enterprise, as well as w
ith other
Naval system
s an
d operational comman
ds. This alternative will provide significan
tly red
uced operating and support costs, w
hen compared w
ith other m
ethods of operation.
2. W
ith increased pressure for system
s interoperability across N
aval Aviation and other N
aval and Joint Warfare communities, technical collaboration had become extrem
ely importan
t. H
owever,
current methods for sharing technical inform
ation tend to be cumbersome, inefficient an
d costly, d
ue to an inform
ation infrastructure that is unable to fully exploit emerging commercial Internet‐based
technologies. T
he SHARE‐N
et project converts existing databases to XML form
at and enables full connectivity of technical inform
ation sources via powerful an
d cost‐effective web services technologies.
The result is shared RDT&E technical communication in a secure, easily‐m
aintainable operating environment.
3. Economic analysis were developed
.
4. Cost avoidan
ce for the equipment in this cap
ability w
ill begin upon project completion.
5. If investm
ent is not mad
e, N
AWCAD w
ould be limited in the ability to increase our capabilities in support of aircraft carriers, networks, sensors, w
eapons, platform
s an
d have a significan
t negative
result on the success, efficiency and w
ar fighting effectiveness of the Navy. This w
ill also decrease innovative affordable technologies to the Fleet w
hich support our nationʹs defense strategy and goals an
d
reduce overall Naval w
arfighting effectiveness.
Exhibit Fund 9b Capital Investment Justification

FY2011
Greater than $1M:
SUN Server/SAN Upgrade
1. The purpose of this project is to upgrade an
d consolidate selected N
aval Air W
arfare Center Aircraft Division (NAWCAD) SUN servers an
d Storage Area Network (SAN) hardware. The SUN
enterprise series servers offer dynam
ic system domains an
d system partitioning that creates self‐contained servers within a single physical server. Processors, m
emory, and input/output (I/O
) can be
expan
ded seamlessly and transparently, w
ith non‐linear increases in overall system
, user, and application perform
ance. Mainfram
e like partition cap
abilities permit extrem
ely flexible processor an
d
mem
ory configurations that improve resource man
agem
ent an
d availability. SAN technology provides for the height availability, p
rotection, m
anagem
ent, and retrieval of corporate data. SAN
technology red
uces processor load
ing on servers allowing for more efficient use of hardware resources. T
his upgrade effort w
ill provide robust platform
s for the hosting of corporate applications an
d data,
while reducing the overall IT footprint required in the B1490 data center.
2. M
any of the current SUN and SAN system
s will ap
proach end of life in FY 2011. N
AWCʹs data center continues to grow as our IT office takes on new w
ork for customers throughout the comman
d.
Investm
ent in new system
s will permit the data center to efficiently respond to new hosting requirem
ents w
hile controlling support costs an
d m
aking the best use of facility resources. The goal of this
project is to m
anage resources at an optimal service level for the lowest possible cost to the organ
ization, thereby improving efficiencies. W
hen system
s are consolidated and new technology is dep
loyed
,
an experienced system administrator can do a m
uch better job of bringing together m
ultiple, d
isparate platform
s an
d run them as a single, seamless environment.
3. Economic analysis were developed and included w
ith individual project submissions.
4. Cost avoidan
ce for the equipment in this cap
ability w
ill begin upon project completion.
5. If investm
ent is not mad
e, N
AWCAD w
ould be limited in the ability to increase cap
abilities in support of aircraft carriers, networks, sensors, w
eapons, platform
s an
d have a significan
t negative result
on the success, efficiency and w
ar fighting effectiveness of the Navy. This w
ill also decrease innovative affordable technologies to the Fleet w
hich support our nationʹs defense strategy and goals an
d
reduce overall Naval w
arfighting effectiveness.
FY2011
Greater than $1M:
SIPRNET Web and Database Environment
1. The SIPRNET w
eb and database environment/services initiative will upgrade the classified network by including necessities such as document man
agem
ent, collaboration, w
orkflow, d
atabase, w
eb
application development platform
, and w
eb development services. Currently these services are not read
ily available on SIPRNET due to lack of infrastructure and software. T
he result is redundan
cies
and/or development using non‐standard technologies that are not complian
t with functional area man
ager (FAM), cyber asset red
uction security (CARS), and other N
avy level consolidation efforts. T
his
initiative will provide the infrastructure to greatly increase efficiencies and interoperability among m
any disparate platform
s, system
s, databases, and applications by leveraging new technology standards
on the classified side.
2. There is neither the capability, m
echan
ism, n
or infrastructure in place on SIPRNET to build & m
aintain the web services described above that automate business processes, consolidate an
d portalize
redundan
t ap
plications, and red
uce the IT footprint using existing technologies. T
his project w
ill provide the hardware, software, and resources necessary to build and m
aintain an infrastructure w
hich
enables developing & hosting m
ultiple w
eb services in direct support of warfighter initiatives. Disparate pockets of personnel are addressing this problem in an isolated and stovep
iped m
anner.
Consolidation of these efforts is essential for security, cost savings an
d interoperability.
3. Economic analysis were developed and included w
ith individual project submissions.
4. Cost avoidan
ce for the equipment in this cap
ability w
ill begin upon project completion.
5. If investm
ent is not mad
e, N
AWCAD w
ould be limited in the ability to increase cap
abilities in support of aircraft carriers, networks, sensors, w
eapons, platform
s an
d have a significan
t negative result
on the success, efficiency and w
ar fighting effectiveness of the Navy. This w
ill also decrease innovative affordable technologies to the Fleet w
hich support our nationʹs defense strategy and goals an
d
reduce overall Naval w
arfighting effectiveness.
Exhibit Fund 9b Capital Investment Justification

FY2011
Greater than $1M:
IBAR INFRASTRUCTURE (1 of 4 PHASES)
1. The IBAR supports NAWCWD w
ith connectivity via m
ultiple networks i.e. DREN, D
ISA, SIPRNET, N
IPRNET, JTEN, JMTIC and coalition forces. T
his requires a very expan
sive video and data
network, to keep up w
ith the expan
sion of 4 new large labs an
d system
s. C
urrently there are multiple arenas’ that are not able to communicate due to various age of technology. There is a requirem
ent for
connectivity from the existing IBAR to accommodate the new building/labs infrastructure. R
outers, switches, video networking to pass along imagery do not exist to support this requirem
ent.
2. T
his project is to build the Interconnectivity w
ith Existing Integrated Battle Space Arena (IBAR) Network video/data. This w
ill also assist in the infrastructure for the Security system
s to accommodate
System Under Test (SUT) in Bldg 745, Security for access, basic stabilizing infrastructure to connect the separated labs, Bldg 5 IBAR and Engineering Bldg. 745. The current IBAR security system is not
compatible w
ith the proposed system associated w
ith Bldg 745, it will require an upgrade to interconnect the buildings.
3. A
n economic analysis has been perform
ed for this project included in this cap
ability.
4. Cost avoidan
ce for the equipment in this cap
ability w
ill begin upon project completion.
5 If investm
ent is not mad
e, old outdated equipment will continue to be used to support operations an
d critical tests.
Exhibit Fund 9b Capital Investment Justification

Dep
artm
ent of the Navy / Research and Development /
Naval Air W
arfare Center
Quan
tUnit Cost
Total
Cost
Quan
tUnit Cost
Total
Cost
Quan
tUnit Cost
Total
Cost
Projects <$1M
20
745
30
1,845
10
300
Projects = or > $1M
00
00
00
00
0
TOTAL
2745
31,845
1300
Cap
ital Investm
ent Justification
($ in Thousands)
Software
FY 2011
FY 2009
Fiscal Year (FY) 2011 Budget Estim
ates
February 2010
Justification:
#003 ‐ Software
NAWC
FY 2010
Software: FY2009‐FY2011
1. Projects within this category and cap
ability w
ill assist N
AWC in creating solutions to address deficiencies in cap
abilities an
d better perform m
ission efforts. N
ew technologies, processes,
and advan
ces in various areas of engineering, research and development, and testing that is done at N
AWC creates a need for mission efforts. P
rojects will support various NAWCAD areas to
include test m
anagem
ent an
d rep
orting tools, rad
ar and computational electromagnetics modeling lab, m
ultispectral image processing and advan
ced tracking, as well as, d
ocument
man
agem
ent efforts.
2. T
he projects will enable N
AWC to m
eet customersʹ expectations, improve operational efficiencies, and provide new state‐of‐the‐art technology to increase N
AWC customer support for all
mission efforts.
3. Economic analysis were developed and included w
ith individual project submissions.
4. Cost avoidan
ce for the equipment in this cap
ability w
ill begin upon project completion.
5. If investm
ent is not mad
e, N
AWC w
ould be limited in the ability to increase capabilities in support of aircraft carriers, networks, sensors, w
eapons, platform
s an
d w
ill have a significan
t
negative result on the success, efficiency and w
ar fighting effectiveness of the Navy.
Exhibit Fund 9b Capital Investment Justification

Dep
artm
ent of the Navy / Research and Development / Naval
Air W
arfare Center
Quan
tUnit Cost
Total Cost
Quan
tUnit Cost
Total
Cost
Quan
tUnit Cost
Total
Cost
Rep
lacement
31,901
11,800
00
Productivity
00
00
00
New M
ission
85,472
116,235
85,319
Environmental
00
00
00
Total
117,373
128,035
85,319
FY 2009
NAWC
FY 2010
Justification:
Cap
ital Investm
ent Justification
($ in Thousands)
Fiscal Year (FY) 2011 Budget Estim
ates
FY 2011
February 2010
#004 ‐ M
inor Construction
Minor Construction
Minor Construction: FY2009‐FY2011
1. Projects within this category and these capabilities will assist N
AWC in creating solutions to address deficiencies in cap
abilities an
d enhan
ce the perform
ance of mission efforts. M
inor
Construction projects work to m
odify existing spaces, rep
lace obsolete facilities, and contruct new facilities that allow for im
proved efficiencies and provide greater security and suitable space to
research, d
evelop, acquire, test an
d evaluate aircraft system
s (often in a secure environment) for the War fighter. P
rojects will support various NAWC areas including an integration lab facility,
antenna test tower, test team facilities, control station center, sonobuoy test site, annodize lab facility, T
hermal Detonation Characteristics lab, the Optical Coating lab, W
eapons system
s control
facility, and System
s integration facility. Additional projects will construct laboratory and engineering spaces for a Multi‐level Casting facility, T
est Article Towpath, and a Detonation Sciences
Spectroscopy lab. Finally, p
rojects are planned to support w
eapons system
s research such as the Hydrostatic Test Room. Suitable spaces do not exist to house these functions.
2. The following M
inor Construction projects exceed the current Military Construction threshold levels of $750K, u
sing Laboratory Revitalization Program authority.
Project N
ame
FY 2010 Han
gar 101 Test Team Facility $2.0M
FY 2010 Multi‐Level Casting Facility $1.8M
FY 2011 Mission System
s T&E Facility $2.0M
3. If investm
ent is not mad
e, N
AWC w
ould be limited in our ability to increase our capabilities in support of aircraft carriers, networks, sensors, w
eapons, platform
s an
d have a significan
t negative
result on the success, efficiency and w
ar fighting effectiveness of the Navy. This w
ill also decrease innovative affordable technologies to the Fleet w
hich support our nationʹs defense strategy and
goals an
d red
uce overall Naval w
arfighting effectiveness.
Exhibit Fund 9b Capital Investment Justification

Projects on the FY 2010 Presidentʹs Budget
Approved
Approved
Current
Asset/
Explanation/
FY
Project
Reprogs
Proj Cost
Proj Cost
Deficiency
Reason for Change
2010
Equipment except ADPE and TELECOM
1.373
$
18.956
$
20.329
$
(1.373)
$
Two p
rojects cost estim
ates have decreased
.
Four projects cost estim
ates have increased.
One project w
as can
celled
.
Five ad
ditional projects were ad
ded due to emergent
requirem
ents.
2010
Equipment ‐ ADPE and TELECOM
0.142
7.732
7.874
‐0.142
Three projects cost estim
ates have decreased
.
Three ad
ditional projects were ad
ded due to emergent
requirem
ents.
One project cost estim
ate increased.
2010
Software Development
0.000
1.845
1.845
0.000
2010
Minor Construction
‐1.515
9.550
8.035
1.515One project can
celled
.
Five ad
ditional projects were ad
ded due to emergent
requirem
ents.
One project cost estim
ate decreased
.
Total FY 2010 Cap
ital Purchase Program
‐$
38.083
$
38.083
$
‐$
February 2010
($ in Millions)
Capital Budget Execution
Department of the Navy
Research and Development/Naval Air Warfare Center
Fiscal Year (FY) 2011 Budget Estimates
Exhibit Fund‐9c, Capital Budget Execution

Naval Surface Warfare Center

DEPARTMENT OF THE NAVY
NAVY WORKING CAPITAL FUND
RESEARCH AND DEVELOPMENT
NAVAL SURFACE WARFARE CENTER
FISCAL YEAR (FY) 2011 BUDGET ESTIMATES
February 2010
Mission Statement / Overview
The Naval Surface Warfare Center provides research, development, test and evaluation;
in‐service engineering; and fleet and integrated logistic support for surface ship combat
systems, surface and mine warfare combat systems, ordnance, explosive ordnance
disposal technology, mines, amphibious warfare systems, mine countermeasures,
special warfare and strategic systems, systems interfaces, weapon systems and
subsystems, unique equipment and related expendable ordnance of the Navy surface
fleet. In addition, they provide primary technical capability in energetics through
engineering, fleet and operational support, manufacturing technology, limited
production, industrial base support and research, development, test and evaluation for
energetic materials, ordnance devices and components and related ordnance
engineering standards.
Activity Group Composition:
The Center is comprised of eight operating divisions whose operations and locations are
described briefly below.
CARDEROCK DIVISION: The mission of this division is to provide research,
development, test and evaluation, analysis, acquisition support, in‐service engineering,
logistics and integration of surface and undersea vehicles and associated systems.
Carderock develops and applies science and technology associated with naval
architecture and marine engineering, and provides support to the maritime industry.
Additionally, it also executes other responsibilities as assigned by the Commander,
Naval Surface Warfare Center. The division has major operating sites at Carderock, MD
and Philadelphia, PA with smaller operating sites at Ft. Lauderdale, FL, Memphis, TN,
Norfolk, VA, Bremerton, WA, and Bayview, ID.
CORONA DIVISION: The mission of this division is to serve warfighters and program
managers as the Navy’s independent performance assessment agent throughout
systems’ lifecycles by gauging the Navy’s warfighting capability of weapons and
integrated combat systems, from unit to force level, through assessment of those
systems’ performance, readiness, quality, supportability, and the adequacy of training.
It also executes other responsibilities as assigned by the Commander, Naval Surface
Warfare Center. The division has one primary operating site, Corona, CA, with a small
engineering site at Seal Beach, CA.
CRANE DIVISION: The mission of this division is to provide acquisition engineering,
in‐service engineering and technical support for sensors, electronics, electronic warfare

NAVAL SURFACE WARFARE CENTER
FISCAL YEAR (FY) 2011 BUDGET ESTIMATES
February 2010
and special warfare weapons. It also applies component and system level product and
industrial engineering to surface sensors, strategic systems, special warfare devices and
electronic warfare/information operations systems and executes other responsibilities as
assigned by the Commander, Naval Surface Warfare Center. The division has one
primary operating site, Crane, IN, with a small engineering site at Fallbrook, CA.
DAHLGREN DIVISION: The mission of this division is to provide research,
development, test and evaluation, analysis, systems engineering, integration and
certification of complex naval warfare systems related to surface warfare, strategic
systems, combat and weapons systems associated with surface warfare. The division
also provides system integration and certification for weapons, combat systems and
warfare systems and executes other responsibilities as assigned by the Commander,
Naval Surface Warfare Center. The division has two primary operating sites, Dahlgren,
VA, and Dam Neck, VA. The division also operates a small detachment in San Diego,
CA.
INDIAN HEAD DIVISION: The mission of this division is to provide research,
development, test and evaluation and in‐service support of energetics and energetic
materials for warheads, propulsion systems, ordnance and pyrotechnic devices and
fuzing for Navy, Joint Forces, and the Nation, to include research, test, and engineering
of chemicals, propellants, explosives, related electronic devices, associated ordnance
equipment and special weapons support. It also carries out other responsibilities as
assigned by the Commander, Naval Surface Warfare Center. The primary site of
operations is Indian Head, MD, with smaller operations at Yorktown, VA, MacAlester,
OK, and Earle, NJ.
PORT HUENEME DIVISION: The mission of this division is to provide test and
evaluation, systems engineering, integrated logistics support, in‐service engineering and
integration of surface ship weapons, combat systems and warfare systems. Port
Hueneme Division also provides the leading interface to the surface force for in‐service
maintenance and engineering support provided by the Warfare Centers and executes
other responsibilities as assigned by the Commander, Naval Surface Warfare Center.
The primary operating site is Port Hueneme, CA. The division also operates small
detachments in, Louisville, KY and Dam Neck, VA.
EXPLOSIVE ORDNANACE DISPOSAL (EOD) TECHNOLOGY DIVISION: The
mission of this division is to provide EOD technology and logistics management for the
Joint Services, and developing war essential elements of intelligence, equipment, and
procedures to counter munitions, both U.S. and foreign, as required to support DoD
components and the security needs of other agencies; to provide ground based Counter
Radio‐Controlled IED Electronic Warfare (CREW) Technology; and to support the

NAVAL SURFACE WARFARE CENTER
FISCAL YEAR (FY) 2011 BUDGET ESTIMATES
February 2010
Executive Manager for EOD Technology and Training in his Joint Forces role. The
primary operating site is Rison, MD.
PANAMA CITY DIVISION: The mission of this division is to conduct research,
development, test and evaluation and in‐service support of mine warfare systems,
mines, Naval Special Warfare Systems, diving and life support systems, amphibious
/expeditionary maneuver warfare systems and other missions that occur primarily in
coastal (littoral) regions. It also executes other responsibilities as assigned by
Commander, Naval Surface Warfare Center. The primary operating site is Panama City,
FL.
Significant Changes Since the FY 2010 President’s Budget:
NSWC has increased end strength and workyear levels above the FY 2010 President’s
Budget to address customer demand and critical knowledge deficiencies.
Financial Profile:
Revenue/Expense/Operating Results ($Millions) FY 2009 FY 2010 FY 2011
Revenue $3,816.2 $3,846.0 $3,947.1
Expense 3,794.3 3,873.1 3,987.5
Operating Results $21.9 ‐$27.1 ‐$40.4
Other Changes Affecting AOR 0.0 0.0 0.0
Accumulated Operating Results (AOR) $67.5 $40.4 $0.0
Revenue and Expense: The trend in revenue and expense from year‐to‐year reflects
the Center’s efforts to size itself to meet customer demand while becoming more
efficient. The FY 2009 operating results figure reflects a gain of $39.9M from the FY 2010
President’s Budget. The negative AOR recoupment in FY 2011 will return projected
cumulative gains and will achieve a zero Accumulated Operating Result balance in
FY 2011.
The FY 2010 prices for fuel in this submission are calculated using the current fuel
composite rate of $118.02 per barrel versus the FY 2010 President’s Budget rate of $89.46.
This will result in a projected revenue shortfall of $1.7M; $1.5M of this amount is being
requested as a direct Working Capital Fund (WCF) appropriation in the FY 2010
supplemental and the remainder will be handled from either WCF cash balances or
through an additional customer surcharge.

NAVAL SURFACE WARFARE CENTER
FISCAL YEAR (FY) 2011 BUDGET ESTIMATES
February 2010
Collections/Disbursements/Outlays ($Millions) FY 2009 FY 2010 FY 2011
Collections $3,807.0 $3,845.9 $3,947.1
Disbursements 3,745.1 3,869.9 $3,988.2
Outlays ‐$61.9 $24.0 $41.1
Budgeted collections and disbursements are based on revenue, cost, and Capital
Investment Program (CIP) outlay estimates.
Workload:
Reimbursable Orders ($Millions) FY 2009 FY 2010 FY 2011
Current Estimate $3,850.4 $3,759.1 $3,870.3
For FY 2009 through FY 2011, NSWC has estimated reimbursable orders in coordination
with major recurring customers.
Direct Labor Hours (000) FY 2009 FY 2010 FY 2011
Current Estimate 21,516 21,592 21,618
Direct labor hours are consistent with funded customer demands.
Performance Indicators: The primary performance indicator is unit cost, which
represents the average cost of delivering goods and services to our customers
Unit Cost FY 2009 FY 2010 FY 2011
Total Stabilized Cost ($Millions) $2,064.9 $2,165.8 $2,249.6
Workload (DLHs) (000) 21,516 21,592 21,618
Unit cost (per DLH) $95.97 $100.31 $104.06
The Center’s unit cost reflects a steady increase over the budget period and is primarily
affected by inflation and the cost of implementing Navy Enterprise Resource Planning
(NERP) on 1 October 2011.
Stabilized / Composite Rates FY 2009 FY 2010 FY 2011
Stabilized Rate $96.51 $99.61 $102.88
Change from Prior Year +3.2% +3.3%
Composite Rate Change +2.2% +2.4%

NAVAL SURFACE WARFARE CENTER
FISCAL YEAR (FY) 2011 BUDGET ESTIMATES
February 2010
Staffing:
Civilian/Military ES & Workyears FY 2009 FY 2010 FY 2011
Civilian End Strength 15,119 14,836 14,857
Civilian Workyears (Straightime) 14,462 14,778 14,858
Military End Strength 201 232 231
Military Workyears 175 235 231
Civilian Personnel: Projected end strength estimates for FY 2010 ‐ FY 2011 have
been sized to meet funded customer demand.
Military Personnel: Military workyears remain stable over the budget period.
Capital Investment Program (CIP):
CIP Authority ($Millions) FY 2009 FY 2010 FY 2011
Equipment, Non‐ADP / Telecom $16.5 $21.0 $19.3
Equipment, ADPE / Telecom 7.3 8.1 7.1
Software Development 0.9 0.0 7.3
Minor Construction 4.9 4.5 5.5
Total $29.6 $33.6 $39.2
The NSWC CIP program procures mission essential equipment to support a wide
customer base. The FY 2011 budget request includes six Minor Construction Projects
utilizing the Laboratory Revitalization Program authority.

NAVAL SURFACE WARFARE CENTER
FISCAL YEAR (FY) 2011 BUDGET ESTIMATES
February 2010
Carryover Compliance:
Carryover ($Millions) FY 2009 FY 2010 FY 2011
New Orders $3,850.4 $3,759.1 $3,870.3
Less Exclusions:
Foreign Military Sales 165.8 119.4 137.3
Base Realignment and Closure 6.8 0.0 0.0
Other Federal Departments & Agencies 76.5 50.1 60.1
Non‐Federal Agencies & others 20.6 24.2 26.5
Major Range & Test Facility Base 0.0 0.0 0.0
Orders for Carryover Calculation $3,580.7 $3,565.4 $3,646.4
Composite Outlay Rate 56.1% 55.3% 55.5%
Carryover Ceiling Rate 43.9% 44.7% 44.5%
Carryover Ceiling $1,572.1 $1,593.8 $1,623.7
Balance of Customer Orders at Year End $1,806.1 $1,719.2 $1,642.4
Less Work‐in‐Process 109.1 109.2 109.2
Less Exclusions
Foreign Military Sales 235.4 179.3 147.5
Base Realignment and Closure 1.4 1.4 1.4
Other Federal Departments & Agencies 77.0 75.8 82.5
Non‐Federal Agencies & Others 27.4 22.5 26.6
Major Range & Test Facility Base 0.0 0.0 0.0
Carryover Budget $1,355.8 $1,331.0 $1,275.2
Budgeted carryover is within the ceiling allowed by outlay rates.

FY 2009 FY 2010 FY 2011
Operations 3,782.8 3,810.3 3,910.7 Surcharges - - - Depreciation excluding Major Construction 33.4 35.7 36.4
Total Income 3,816.2 3,846.0 3,947.1
Military Personnel 15.5 15.6 16.0 Civilian Personnel 1,768.4 1,854.7 1,895.8 Travel and Transportation of Personnel 132.5 131.8 135.3 Material & Supplies (Internal Operations) 202.2 271.9 280.1 Equipment 57.8 81.5 83.2 Other Purchases from NWCF 202.2 156.1 159.6 Transportation of Things 2.9 4.3 4.4 Depreciation - Capital 33.4 35.7 36.4 Printing and Reproduction 5.3 7.1 7.2 Advisory and Assistance Services 2.2 2.1 2.2 Rent, Communication & Utilities 93.0 91.1 95.4 Other Purchased Services 1,268.8 1,221.3 1,272.0 Total Expenses 3,784.2 3,873.1 3,987.5
Work in Process Adjustment 10.4 - - Comp Work for Activity Retention Adjustment (0.3) - - Cost of Goods Sold 3,794.3 3,873.1 3,987.5
Operating Result 21.9 (27.1) (40.4)
Less Surcharges - - - Plus Appropriations Affecting NOR/AOR - - - Other Changes Affecting NOR/AOR - - - Extraordinary Expenses Unmatched - - -
Net Operating Result 21.9 (27.1) (40.4)
Other Changes Affecting AOR - - -
Accumulated Operating Result 67.5 40.4 -
Revenue: Gross Sales
Other Income
Expenses Cost of Materiel Sold from Inventory Salaries and Wages:
Revenue and ExpensesDepartment of the NavyResearch and Development
Naval Surface Warfare CenterFiscal Year (FY) 2011 Budget Estimates
February 2010($ in Millions)
Exhibit Fund-14, Revenue and Expenses

FY 2009 FY 2010 FY 2011------- ------- -------
1. New Orders 3,850.4 3,759.1 3,870.3
a. Orders from DoD Components: 3,357.7 3,367.6 3,428.6
Department of the Navy 2,833.3 2,922.7 2,923.9 O & M, Navy 940.0 855.1 867.1 O & M, Marine Corps 20.1 19.8 41.7 O & M, Navy Reserve 3.6 12.8 18.8 O & M, Marine Corp Reserve 0.2 1.0 1.0 Aircraft Procurement, Navy 51.8 53.6 54.1 Weapons Procurement, Navy 88.2 109.9 107.7 Ammunition Procurement, Navy/MC 76.8 81.9 76.4 Shipbuilding & Conversion, Navy 288.0 303.0 293.5 Other Procurement, Navy 367.8 407.7 399.1 Procurement, Marine Corps 63.1 90.5 91.0 Family Housing, Navy/MC - 2.6 0.5 Research, Dev., Test, & Eval., Navy 911.5 974.5 962.6 Military Construction, Navy 0.1 0.4 0.4 National Defense Sealift Fund 16.6 3.0 3.0 Other Navy Appropriations 5.5 7.1 7.1 Other Marine Corps Appropriations - - -
Department of the Army 97.8 88.2 91.2 Army Operation & Maintenance 26.9 23.4 24.9 Army Res, Dev, Test, Eval 23.2 31.3 31.7 Army Procurement 30.5 25.1 26.1 Army Other 17.2 8.4 8.4
Department of the Air Force 60.6 64.3 69.4 Air Force Operation & Maintenance 22.5 22.7 27.3 Air Force Res, Dev, Test, Eval 19.8 21.8 21.0 Air Force Procurement 18.3 19.8 21.1 Air Force Other - - -
DOD Appropriation Accounts 366.0 292.4 344.1 Base Closure & Realignment 6.8 - - Operation & Maintenance Accounts 70.8 64.0 63.4 Res, Dev, Test & Eval Accounts 244.7 191.1 243.2 Procurement Accounts 41.5 35.1 34.8 Defense Emergency Relief Fund (0.2) - - DOD Other 2.4 2.2 2.6
b. Orders from other Fund Activity Groups 229.7 197.9 217.9
c. Total DoD 3,587.4 3,565.4 3,646.5
d. Other Orders: 262.9 193.6 223.8 Other Federal Agencies 76.5 50.1 60.1 Foreign Military Sales 165.8 119.4 137.3 Non Federal Agencies 20.6 24.2 26.5
2. Carry-In Orders 1,772.0 1,806.1 1,719.2
3. Total Gross Orders 5,622.3 5,565.2 5,589.5
a. Funded Carry-Over before Exclusions 1,806.1 1,719.2 1,642.4
b. Total Gross Sales 3,816.2 3,846.0 3,947.1
4. End of Year Work-In-Process (-) (109.1) (109.2) (109.2)
5. Non-DoD, BRAC, FMS, Inst. MRTFB (-) (341.2) (279.1) (258.0)
6. Net Funded Carryover 1,355.8 1,331.0 1,275.2
Sources of RevenueDepartment of the Navy
Research and DevelopmentNaval Surface Warfare Center
Fiscal Year (FY) 2011 Budget EstimatesFebruary 2010
($ in Millions)
Note: Line 4 (End of Year Work-In-Process) is adjusted for Non-DOD BRAC, FMS, and Institutional MRTFB
Exhibit Fund-11, Sources of Revenue

Total Cost
FY 2009 Actual 3,794.3$
FY 2010 Presidentʹs Budget 3,667.5$
Estimated Impact in FY 2010 of Actual FY 2009 Experience 93.6
Pricing Adjustments
Fuel Price Changes 1.7
General Purchase Inflation (1.5)
Program Changes
Additional Customer Workload 82.6
Other Changes
BRAC Workload Realignment 18.2
Sustainment, Restoration and Modernization 7.5
Navy Enterprise Resource Planning 5.9
Defense Finance and Accounting Service (2.4)
FY 2010 Current Estimate 3,873.1$
Pricing Adjustments
Annualization of Prior Year Pay Raises
Military 0.1
Civilian 9.4
FY 2010 Pay Raises
Military 0.2
Civilian 19.4
Working Capital Fund Price Changes 8.7
General Purchase Inflation 25.2
Program Changes
Workload 22.6
Other Changes
Navy Enterprise Resource Planning 35.3
BRAC Workload Realignment (6.5)
FY 2011 Current Estimate 3,987.5$
February 2010
($ in Millions)
Changes in the Cost of Operations
Department of the Navy
Research and Development/Naval Surface Warfare Center
Fiscal Year (FY) 2011 Budget Estimates
Exhibit Fund‐2, Changes in the Cost of Operations

($ in Millions)
FY 2009 FY 2010 FY 2011
Line
Num Description Qty Total Cost Qty Total Cost Qty Total Cost
1 Non ADP
Replacement 14 6.430 16 7.869 9 8.017
Productivity 11 7.338 22 11.229 20 10.833
New Mission 4 2.376 3 1.926 1 0.460
Environmental 1 0.304 0 0.000 0 0.000
Non ADP Total: 30 16.448 41 21.024 30 19.310
2 ADP
Hardware 13 6.333 14 6.616 8 3.853
Telecommunications Equip. 1 0.324 1 0.600 3 2.700
Other Support Equip. 2 0.619 1 0.900 1 0.500
ADP Total: 16 7.276 16 8.116 12 7.053
3 Software
ERP Licenses 0 0.000 0 0.000 1 6.107
Software Projects < $1.000M 1 0.950 0 0.000 2 1.215
Software Total: 1 0.950 0 0.000 3 7.322
4 Minor Construction
Replacement 0 0.000 3 1.173 1 0.866
Productivity 8 3.184 8 2.931 8 4.660
New Mission 3 1.744 0 0.000 0 0.000
Environmental 0 0.000 1 0.400 0 0.000
Minor Construction Total: 11 4.929 12 4.504 9 5.526
Grand Total: 58 29.603 69 33.644 54 39.211
Total Capital Outlays: 30.497 32.523 37.136
Total Depreciation Expense: 33.436 35.719 36.432
February 2010
Capital Investment Summary
Department of the Navy
Research and Development/Naval Surface Warfare Center
Fiscal Year (FY) 2011 Budget Estimates
Exhibit Fund‐9a, Capital Investment Summary

A. B
udget Submission
B. C
omponent/Business Area/Date
C. L
ine# and Description
D. Site Identification
NSWC
FY 2009
FY 2010
FY 2011
Non ADP
Qty
Unit Cost
Total Cost
Qty
Unit Cost
Total
Cost
Qty
Unit Cost
Total
Cost
Rep
lacement
146,430
167,869
98,017
Total
146,430
167,869
98,017
Rep
lacement Equipment:
Non‐A
DP equipment investm
ents support the replacement of mission essential research, d
evelopment, test
an
d evaluation equipment that is unsafe, beyond economical rep
air, technically obsolete, or otherwise
unusable. Rep
lacement equipment supports Warfare Center Core Equities including ship/ship system
s, ship
weapon system
s, ship combat system
s, ordnan
ce, and littoral combat system
s. E
quipment supporting this
mission includes explosive detection equipment, ship hull test equipment, and test an
d evaluation equipment
for various surface ship system
s. B
ased on useful life guidan
ce provided by OMB circular A‐94, all
investm
ents rep
lace equipment beyond the original intended life cycle.
Benefit:
Rep
lacement of research and development equipment that is unsafe, beyond economic rep
air, or unusable.
Mission essential research and development equipment must operate at optimal efficiency to achieve proper
test and evaluation results. E
quipment is rep
laced w
ith m
odern reliable equipment to support the research
an
d development mission of the Naval W
arfare Centers.
Im
pact of not Funding:
The Naval Surface Warfare Center activities are responsible for new product testing as well as system
In‐Service‐Engineering. The ability of the Surface Warfare Centers to provide mission essential research and
development for new system
s Mission essential investm
ents for replacement of equipment will not be mad
e resulting in w
ork that produces obsolete results to the scientific community, economically inefficient
operation, and possible risk to human life.
Economic Analysis: T
here are 5 projects with an individual cost greater than or equal to $1,000K
. An economic analysis
was perform
ed on all individual projects greater than the DoD cap
italization threshold. The useful life for
t hese projects is 10 years and the average payback period is 3.53 years.
Cap
ital Investm
ent Justification
($ in Thousands)
1 ‐ Non ADP ‐ Rep
lacement
Dep
artm
ent of the Navy, R
esearch and Development, N
aval
Surface Warfare Centers, February 2010
Fiscal Year (FY) 2011 Budget Estim
ates
Exhibit Fund‐9b, Capital Investment Justification
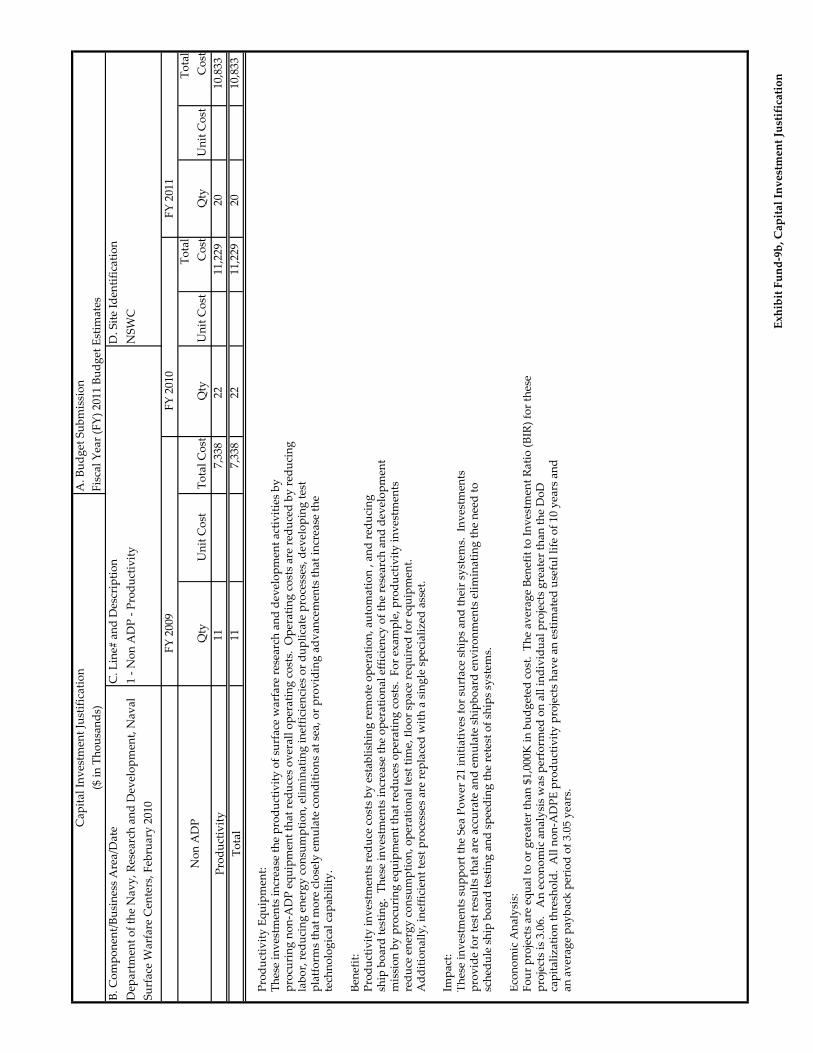
A. B
udget Submission
B. C
omponent/Business Area/Date
C. L
ine# and Description
D. Site Identification
NSWC
FY 2009
FY 2010
FY 2011
Non ADP
Qty
Unit Cost
Total Cost
Qty
Unit Cost
Total
Cost
Qty
Unit Cost
Total
Cost
Productivity
117,338
2211,229
20
10,833
Total
117,338
2211,229
20
10,833
Productivity Equipment:
These investm
ents increase the productivity of surface warfare research and development activities by
procur ing non‐A
DP equipment that red
uces overall operating costs. O
perating costs are reduced by red
ucing
labor, red
ucing energy consumption, eliminating inefficiencies or duplicate processes, d
eveloping test
platform
s that m
ore closely emulate conditions at sea, or providing advan
cements that increase the
tec hnological cap
ability.
Benefit:
Productivity investm
ents red
uce costs by establishing rem
ote operation, automation , an
d red
ucing
s hip board testing. These investm
ents increase the operational efficiency of the research and development
mission by procuring equipment that red
uces operating costs. For exam
ple, p
roductivity investm
ents
reduce energy consumption, operational test time, floor space required for equipment.
Additionally, inefficient test processes are rep
laced w
ith a single specialized asset.
Im
pact:
These investm
ents support the Sea Power 21 initiatives for surface ships an
d their system
s. Investm
ents
provide for test results that are accurate and emulate shipboard environments eliminating the need to
sched
ule ship board testing and speeding the retest of ships system
s.
Economic Analysis:
Four projects are equal to or greater than $1,000K in budgeted cost. The average Benefit to Investm
ent Ratio (BIR) for these
projects is 3.06. An economic analysis was perform
ed on all individual projects greater than the DoD
capitalization threshold. All non‐A
DPE productivity projects have an estim
ated useful life of 10 years and
an average payback period of 3.05 years.
Cap
ital Investm
ent Justification
($ in Thousands)
Fiscal Year (FY) 2011 Budget Estim
ates
1 ‐ Non ADP ‐ Productivity
Dep
artm
ent of the Navy, R
esearch and Development, N
aval
Surface Warfare Centers, February 2010
Exhibit Fund‐9b, Capital Investment Justification

A. B
udget Submission
B. C
omponent/Business Area/Date
C. L
ine# and Description
D. Site Identification
NSWC
FY 2009
FY 2010
FY 2011
Non ADP
Qty
Unit Cost
Total Cost
Qty
Unit Cost
Total
Cost
Qty
Unit Cost
Total
Cost
New M
ission
42,376
31,926
1460
Total
42,376
31,926
1460
New M
ission Equipment:
These Non‐A
DP equipment investm
ents support the acquisition of mission essential research, d
evelopment, test
an
d evaluation equipment that support new research and development initiatives. Equipment
procurements w
ill support initiatives such as:
‐ Advan
ced m
unitions an
d high energy m
aterials
‐ New Shipboard technologies
‐ Hypervelocity penetrating w
eapons an
d kinetic energy w
eapons
‐ Thermobaric and variable yield w
arheads
Benefit:
These investm
ents provide research and development equipment to support new m
ission areas or new test an
d evaluation
tec hniques to enhan
ce the overall effectiveness of the warfare center mission. Investm
ents categorized as
new m
ission are required to support a new cap
ability or capacity that can not be met w
ith current equipment
or capa bilities.
Im
pact:
These investm
ents support the Sea Power 21 initiatives for surface ships an
d their system
s. Investm
ents
provide for new m
ission research and development equipment essential to the test and evaluation of em
erging
s hip‐board technologies.
Economic Analysis:
One project is equal to or greater than $1,000K in budgeted cost. An economic analysis was perform
ed on all individual projects
greater than the DOD cap
italization threshold. All non‐A
DPE new m
ission projects have an estim
ated useful
life of 10 years and an average payback period 0f 5.3 years.
1 ‐ Non ADP ‐ N
ew M
ission
Cap
ital Investm
ent Justification
($ in Thousands)
Dep
artm
ent of the Navy, R
esearch and Development, N
aval
Surface Warfare Centers, February 2010
Fiscal Year (FY) 2011 Budget Estim
ates
Exhibit Fund‐9b, Capital Investment Justification

A. B
udget Submission
B. C
omponent/Business Area/Date
C. L
ine# and Description
D. Site Identification
NSWC
FY 2009
FY 2010
FY 2011
Non ADP
Qty
Unit Cost
Total Cost
Qty
Unit Cost
Total
Cost
Qty
Unit Cost
Total
Cost
Environmental
1304
Total
1304
Environmental Equipment:
These investm
ents are necessary to m
itigate environmental, safety, or workplace deficiencies at the
sur face warfare center activities. E
nvironmental equipment includes control system
s an
d equipment required
to m
eet environmental complian
ce for hexan
e an
d m
ercury red
uctions an
d safety m
easures.
Benefit:
These investm
ents w
ill correct regulatory complian
ce deficiencies, enhan
ce safety in the workplace, or
correct environmental deficiencies. Work processes that involve hazardous materials w
ill be controlled
, reducing the possibility of contamination.
Im
pact:
The im
pact of not making these equipment investm
ents w
ill result in the non complian
ce w
ith environmental,
safety or workplace deficiencies w
ithin the Warfare Center activities.
Economic Analysis:
There are no projects with an individual cost greater than $1,000K
. An economic analysis was perform
ed on all
individual projects greater than the DoD cap
italization threshold. All non‐A
DP environmental projects have
an estim
ated useful life of 10 years and an average payback period 0f 7.3 years.
1 ‐ Non ADP ‐ Environmental
Cap
ital Investm
ent Justification
($ in Thousands)
Dep
artm
ent of the Navy, R
esearch and Development, N
aval
Surface Warfare Centers, February 2010
Fiscal Year (FY) 2011 Budget Estim
ates
Exhibit Fund‐9b, Capital Investment Justification

A. B
udget Submission
B. C
omponent/Business Area/Date
C. L
ine# and Description
D. Site Identification
2 ‐ ADP
NSWC
FY 2009
FY 2010
FY 2011
ADP
Qty
Unit Cost
Total Cost
Qty
Unit Cost
Total
Cost
Qty
Unit Cost
Total
Cost
Hardware
136,333
146,616
83,853
Telecommunications Equip.
1324
1600
32,700
Other Support Equip.
2619
1900
1500
Total
167,276
168,116
127,053
ADP Equipment an
d Telecommunications Equipment an
d Cap
abilities:
These investm
ents w
ill support the acquisition of au
tomated data processing and telecommunications equipment
for the surface ship research and development community. Funds will provide networks/connectivity to all
Naval W
arfare Center activities an
d procurement of hardware for mission essential research and development
comput ing needs an
d centralized system hosting including: B
usiness System Rep
lacement, H
igh Speed Computing,
an
d Research, D
evelopment, Test, and Evaluation N
etworks. Investm
ents w
ill include routers, servers, firew
alls,
etc.
Benefit:
The projected benefits include technology tools for the research and development community and continuity of
operations for stan
dard business system
s throughout the Warfare Center.
Im
pact:
ADP Equipment supporting the research and development community m
ust rem
ain on the cutting edge of
tec hnology for to conduct complex sim
ulations, perform predictive an
alysis, and analyze surface ship system
perform
ance. The capability to conduct cutting edge scientific computing w
ithin the R&D community is in
jeopardy if investm
ents are not mad
e. Current equipment supporting m
ission essential system
s will no longer
be supported by the man
ufacturer. T
o ensure continuity of business operations, new hardware platform
s must
be operational.
Economic Inform
ation: A
n economic analysis was conducted for all projects greater than $1,000K (1 project). A
ll
projects listed below have a useful life of 5 years according to guidan
ce provided in the OMB A‐94 circular.
The payback period for the following projects range from 1.8 to 3.4 years.
Cap
ital Investm
ent Justification
($ in Thousands)
Dep
artm
ent of the Navy, R
esearch and Development, N
aval
Surface Warfare Centers, February 2010
Fiscal Year (FY) 2011 Budget Estim
ates
Exhibit Fund‐9b, Capital Investment Justification

A. B
udget Submission
B. C
omponent/Business Area/Date
C. L
ine# and Description
D. Site Identification
3 ‐ Software
NSWC
FY 2009
FY 2010
FY 2011
Software
Qty
Unit Cost
Total Cost
Qty
Unit Cost
Total
Cost
Qty
Unit Cost
Total
Cost
ERP Licenses
16,107
Enterprise Search and Rep
orting
1950
Software Projects < $1.000M
21,215
Total
1950
37,322
Enterprise Resource Planning (ERP): N
avy ERP is an integrated business man
agem
ent system that m
odernizes and
stan
dardizes N
avy business operations, provides m
anagem
ent visibility across the enterprise, and increases
e ffectiveness an
d efficiency. ERP w
ill provide consistent an
d streamlined business activities that operate
under s single system
. During ERP implementation, business processes w
ill be updated and sim
plified
, redundan
cies w
ill be elim
inated
, and efficiencies realized.
Enterprise Search and Rep
orting: By exploiting emerging data identification and integration technologies,
t his initiative has direct benefit to the inform
ation/content man
agem
ent processes that w
ill support the
delivery of product and services to the warfighter resulting in increased readiness via m
ore rap
id product
delivery. Military value will be provided by improved Operational Readiness at red
uced total ownership cost
t hrough rap
id technical inform
ation delivery to the warfighter.
Benefits: T
hese investm
ents w
ill directly support the tran
sform
ation of the Warfare Centers to become a more
agile support organ
ization. B
y fully integrating authoritative data sources w
ith collaborative tools,
flexible display technologies, and robust content man
agem
ent we will be better able to support the Fleetʹs
war fighters ‐from Force Level leadership, to the sailor on the deck plate ‐at any location and from any
location. T
his evolution of Distance Support cap
ability also enables us to be more proactive in developing
life‐cycle solutions by m
aking the inform
ation required readily available at the workers desktop. All
development will provide the collaborative structure w
hich w
ill contribute to achieving current / planned
customer service levels.
Cap
ital Investm
ent Justification
($ in Thousands)
Dep
artm
ent of the Navy, R
esearch and Development, N
aval
Surface Warfare Centers, February 2010
Fiscal Year (FY) 2011 Budget Estim
ates
Exhibit Fund‐9b, Capital Investment Justification

A. B
udget Submission
B. C
omponent/Business Area/Date
C. L
ine# and Description
D. Site Identification
NSWC
FY 2009
FY 2010
FY 2011
Minor Construction
Qty
Unit Cost
Total Cost
Qty
Unit Cost
Total
Cost
Qty
Unit Cost
Total
Cost
Rep
lacement
31,173
1866
Productivity
83,184
82,931
84,660
New M
ission
31,744
‐
‐
Environmental
‐
1400
‐
Total
114,929
124,504
95,526
Minor Construction
Investm
ents in M
inor Construction enhan
ce the Naval W
arfare Center Mission by developing buildings,
structures or ot her real property. Minor Construction projects will replace obsolete facilities, consolidate
operations for productivity increases, provide state of the art processing areas for new R&D m
issions, and
correct environmental deficiencies. M
inor construction projects include all costs to deliver a complete and
usable project. Minor Construction projects meet the DoD cap
italization criteria, however, 6 projects
exceed the threshold specified by 10 USC 2805. T
hese projects utilize Sec. 2804 of the FY08 N
ational Defense
Authorization Act (NDAA) au
thority for the Laboratory Revitalization Program authority.
Minor Construction is used at the Naval W
arfare Centers to:
‐ modify existing spaces and construct new facilities to provide suitable space to design and test new
equipment for the surface warfare community.
‐ im
prove security m
easures an
d provide increase security for new initiatives
‐ reduce operating expenses by building or im
proving government owned facilities so that leased space, high
ma intenan
ce space, or portable space may be vacated
. ‐ reduce energy consumption by installing energy efficient building system
s ‐ modify existing system
s to bring facilities up to current building, safety, or environmental codes.
The following M
inor Construction Projects exceed the current Military Construction Threshold levels of $750K
using Laboratory Revitalization Program authority.
$ 000
Project N
ame
Total
FY 2009
Mines & Shallow W
ater System
s Facility
0.887
FY 2010
Rad
ar Annex Addition
0.960
FY 2010
CBR Fleet Support & Integration Laboratory
0.997
FY 2011
RDT&E Communication Shed 15
0.866
FY 2011
Enhan
cement of Underwater M
ulti‐Sensor Instr. Bldg.
0.900
FY 2011
Building 4 Shipboard M
achinery Support Space
0.975
Dep
artm
ent of the Navy, R
esearch and Development, N
aval
Surface Warfare Centers, February 2010
4 ‐ Minor Construction
Cap
ital Investm
ent Justification
($ in Thousands)
Fiscal Year (FY) 2011 Budget Estim
ates
Exhibit Fund‐9b, Capital Investment Justification

Line
Approved
Current
Asset /
FY
Item
Cate gory
Capability/Project
Amount
Estimate
Deficiency
Explanation
$2010
1Non ADP
$21.428
$21.024
$0.404
Re p
lacement
$7.098
$7.869
‐$0.771Warfare Ctr. Inv. B
rd. (WCIB) Project Chan
ges
Productivity
$12.254
$11.229
$1.025
Warfare Ctr. Inv. B
rd. (WCIB) Project Chan
ges
New M
ission
$1.816
$1.926
‐$0.110Warfare Ctr. Inv. B
rd. (WCIB) Project Chan
ges
Environmental
$0.260
$0.000
$0.260
Warfare Ctr. Inv. B
rd. (WCIB) Project Chan
ges
2ADP
$7.766
$8.116
‐$0.350
Hardware
$6.266
$6.616
‐$0.350Warfare Ctr. Inv. B
rd. (WCIB) Project Chan
ges
Telecommunications Equip.
$0.600
$0.600
$0.000
Other Support Equip.
$0.900
$0.900
$0.000
3Software
$0.000
$0.000
$0.000
Software Projects < $1.000M
$0.000
$0.000
$0.000
4Minor Construction
$4.453
$4.504
‐$0.051
Re p
lacement
$1.173
$1.173
$0.000
Productivity
$2.880
$2.931
‐$0.051Warfare Ctr. Inv. B
rd. (WCIB) Project Chan
ges
New M
ission
$0.000
$0.000
$0.000
Environmental
$0.400
$0.400
$0.000
All
Total FY 2010
All
$33.647
$33.644
$0.003
February 2010
($ in Millions)
Capital Budget Execution
Department of the Navy
Research and Development/Naval Surface Warfare Center
Fiscal Year (FY) 2011 Budget Estimates
Exhibit Fund‐9c, Capital Budget Execution

Naval Undersea Warfare Center

NARRATIVE SUMMARY OF OPERATIONS
DEPARTMENT OF THE NAVY
RESEARCH AND DEVELOPMENT
NAVAL UNDERSEA WARFARE CENTER
FISCAL YEAR (FY) 2011 BUDGET ESTIMATES
FEBRUARY 2010
Mission Statement/Overview:
The mission of the Naval Undersea Warfare Center (NUWC) is to operate the Navy’s
full spectrum research, development, test and evaluation, engineering and fleet support
center for submarines, autonomous underwater systems and offensive and defensive
weapon systems associated with Undersea Warfare.
Activity Group Composition:
The Naval Undersea Warfare Center was established in January 1992, and is composed
of two divisions, located in Newport, RI and Keyport, WA, and several detachments.
The NUWC Headquarters organization is located at Newport RI.
NEWPORT DIVISION: The mission of this division is to provide research,
development, test and evaluation, engineering, analysis and assessment, and fleet
support capabilities for submarines, autonomous underwater systems, and offensive
and defensive undersea weapon systems. As the steward for existing and emerging
technologies in support of undersea warfare, Newport Division executes responsibilities
as assigned by the Commander, Naval Undersea Warfare Center. The primary
operating site is in Newport, RI with smaller operations at West Palm Beach, FL, Andros
Island Bahamas and Norfolk, VA.
KEYPORT DIVISION: The mission of this division is to provide test and evaluation; in‐
service engineering, maintenance, and repair; Fleet readiness, and industrial‐base
support for undersea warfare systems, countermeasures, and sonar systems. It also
executes other responsibilities as assigned by the Commander, Naval Undersea Warfare
Center. The major operating site is at Keyport WA, with detachments in Hawthorne,
NV, San Diego, CA, Pearl Harbor, Hawaii and Nanoose, British Columbia.
Significant Changes Since the FY 2010 President’s Budget:
NUWC has increased its workforce from the President’s Budget levels to address
customer demand and critical knowledge requirements.

NARRATIVE SUMMARY OF OPERATIONS
DEPARTMENT OF THE NAVY
RESEARCH AND DEVELOPMENT
NAVAL UNDERSEA WARFARE CENTER
FISCAL YEAR (FY) 2011 BUDGET ESTIMATES
FEBRUARY 2010
Financial Profile:
Revenue/Expense/Operating Results
/AOR/($Millions) FY 2009 FY 2010 FY 2011
Revenue $1,147.0 $1,022.1 $1,048.6
Expense $1,146.2 $1,032.6 $1,055.1
Operating Results $0.8 ($10.5) ($6.5)
Other Changes Affecting AOR $0.0 $0.0 $0.0
Accumulated Operating Results (AOR) $17.0 $6.5 ($0.0)
Revenue/Expense: Revenue and cost estimates have increased slightly from the FY 2010
President’s Budget level. Estimates for FYs 2010 and 2011 are in line with our customer
workload, which results in NUWC achieving a zero AOR by FY 2011. The FY 2010 prices
for fuel in this submission are calculated using the current fuel composite rate of $118.02
per barrel versus the FY 2010 Presidentʹs Budget rate of $89.46. This will result in a
projected revenue shortfall of $1.362M; $1.190M of this amount is being requested as a
direct Working Capital Fund (WCF) appropriation in the FY 2010 supplemental and the
remainder will be handled from either WCF cash balances or through an additional
customer surcharge.
Operating Results: NUWC completed FY 2009 with Operating Results of $0.8M. This is
$5.9M better than the President’s budgeted level of ‐$5.1M. In FY 2010, NUWC is
budgeting for an operating result of $‐10.5M, which is $0.6M better than the President’s
budget level. In FY 2011 NUWC will have a $6.5M loss to achieve a zero AOR balance.
Collections/Disbursements/Outlays
($Millions) FY 2009 FY 2010 FY 2011
Collections $1,152.0 $1,021.1 $1,050.7
Disbursements $1,148.8 $1,034.1 $1,060.6
Outlays ($3.2) $13.1 $9.9
Disbursements and collections slightly decreased from FY 2009 to FY 2010 and will
slightly increase in FY 2011 as a result of changes in revenue and expense.

NARRATIVE SUMMARY OF OPERATIONS
DEPARTMENT OF THE NAVY
RESEARCH AND DEVELOPMENT
NAVAL UNDERSEA WARFARE CENTER
FISCAL YEAR (FY) 2011 BUDGET ESTIMATES
FEBRUARY 2010
Workload:
Reimbursable Orders ($Millions): FY 2009 FY 2010 FY 2011
Current Estimate $1,128.2 $1,013.8 $1,024.6
NUWC’s reimbursable orders are budgeted to decrease slightly in FY 2010 then increase
in FY 2011.
Direct Labor Hours (000) FY 2009 FY 2010 FY 2011
Current Estimate 5,695 5,685 5,686
Direct labor hours in FYs 2009, 2010, and 2011 are above those reflected in the FY 2010
President’s budget. The increase in DLHs is consistent with funded customer
workload.
Performance Indicators:
NUWC’s outputs are scientific and engineering designs, developments, tests,
evaluations, analyses, and fleet support in NUWC’s assigned mission areas. The
primary performance indicators are Direct Labor Hours, Unit Cost, Net Operating
Results and Accumulated Operating Results, which are found in various tables
throughout the narrative.
Stabilized Cost ($Millions) $558.8 $579.6 $600.5
Direct Labor Hours (000) 5,695 5,685 5,686
Unit Cost $98.12 $101.95 $105.61
Unit costs are modestly increasing as a result of pay raise, inflation and Navy Enterprise
Resource Planning implementation (primarily FY 2011 impact).
Stabilized/Composite Rates FY 2009 FY 2010 FY 2011
Stabilized Rate $100.45 $101.67 $106.67
Change from Prior Year 4.0% 1.2% 4.9%
Composite Rate Change 2.8% 1.2% 3.2%

NARRATIVE SUMMARY OF OPERATIONS
DEPARTMENT OF THE NAVY
RESEARCH AND DEVELOPMENT
NAVAL UNDERSEA WARFARE CENTER
FISCAL YEAR (FY) 2011 BUDGET ESTIMATES
FEBRUARY 2010
Staffing:
Civilian/Military ES & Workyears FY 2009 FY 2010 FY 2011
Civilian End Strength 4,186 4,115 4,182
Civilian Workyears (Straight time) 4,057 4,073 4,113
Military End Strength 33 40 40
Military Workyears 35 38 38
Civilian Personnel: NUWC’s civilian end strength numbers are higher than those in the
FY 2010 President’s budget and have been set to meet budgeted workload. The budget
includes a small number of SIPs each year to facilitate efforts to balance workforce to
workload.
Military Personnel: Military end strength increased from the FY 2010 President’s budget
by one.
Capital Investment Program (CIP):
CIP Authority ($Millions)
FY 2009 FY 2010 FY 2011
Equipment, Non‐ADP/Telecom $7.5 $6.4 $10.5
Equipment, ADPE/Telecom $3.5 $4.8 $3.9
Software Development $1.4 $2.3 $1.6
Minor Construction $2.8 $3.6 $2.6
Total $15.2 $17.1 $18.5
NUWC’s Capital Purchase Program is used to purchase general purpose mission
essential equipment. This submission reflects one Minor Construction Project, R&D Test
Vehicle Facility Renovation & Consolidation, that is utilizing the Laboratory
Revitalization Program authority.

NARRATIVE SUMMARY OF OPERATIONS
DEPARTMENT OF THE NAVY
RESEARCH AND DEVELOPMENT
NAVAL UNDERSEA WARFARE CENTER
FISCAL YEAR (FY) 2011 BUDGET ESTIMATES
FEBRUARY 2010
Carryover:
($ Millions)
Carryover Compliance:
New Orders $1,128.2 $1,013.8 $1,024.6
Less Exclusions:
Foreign Military Sales $54.8 $35.0 $38.4
Base Realignment and Closure $0.2 $2.7 $4.2
Other Federal Departments & Agencies $2.9 $1.3 $1.3
Non‐Federal Agencies & others $26.0 $21.1 $19.2
Major Range & Test Facility Base $58.7 $55.1 $57.1
Orders for Carryover Calculation $985.6 $898.7 $904.4
Composite Outlay Rate 54.6% 54.7% 54.7%
Carryover Ceiling Rate 45.4% 45.3% 45.3%
Carryover Ceiling $447.4 $407.1 $409.5
Balance of Customer Orders at Year End $518.1 $509.8 $485.8
Less Work‐in‐Process $17.3 $20.1 $20.1
Less Exclusions
Foreign Military Sales $77.0 $75.8 $65.1
Base Realignment and Closure $0.1 $0.9 $1.5
Other Federal Departments & Agencies $3.1 $2.1 $1.7
Non‐Federal Agencies & Others $21.4 $24.3 $14.4
Major Range & Test Facility Base $13.6 $27.8 $24.2
Carryover Budget $385.5 $358.9 $358.8
FY 2011Carryover($M): FY 2009 FY 2010
Budgeted carryover is within the ceiling allowed by outlay rates.

xxxxxxxxxXxxxxxxxxxXxxxxxxxxxXxxxxxxxxxXxxxxX xxx,xxx,xxxx,xxx,xxx,xxxx,xxx,xxx,xxx
FY 2009 FY 2010 FY 2011
Operations 1130.1 1004.5 1032 Surcharges 0 0 0 Depreciation excluding Major Construction 16.9 17.6 16.6
Total Income 1147 1022.1 1048.6
Military Personnel 2.7 2.9 2.8 Civilian Personnel 506.3 525.9 540.2 Travel and Transportation of Personnel 36.1 29.2 29.6 Material & Supplies (Internal Operations) 85.8 90.9 94.3 Equipment 10.6 12.4 13.5 Other Purchases from NWCF 67.1 63.2 64 Transportation of Things 2 2 2 Depreciation - Capital 16.9 17.6 16.6 Printing and Reproduction 1.6 1.6 1.6 Advisory and Assistance Services 0 0 0 Rent, Communication & Utilities 21.1 21.7 22.7 Other Purchased Services 374.6 265.2 267.6 Total Expenses 1124.7 1032.5 1055
Work in Process Adjustment 22.5 0.1 0.1 Comp Work for Activity Retention Adjustment -0.9 0 0 Cost of Goods Sold 1146.2 1032.6 1055.1
Operating Result 0.8 -10.5 -6.5
Less Surcharges 0 0 0 Plus Appropriations Affecting NOR/AOR 0 0 0 Other Changes Affecting NOR/AOR 0 0 0 Extraordinary Expenses Unmatched 0 0 0
Net Operating Result 0.8 -10.5 -6.5
Other Changes Affecting AOR 0 0 0
Accumulated Operating Result 17 6.5 0
Exhibit Fund-14 Revenue and Expense
Expenses Cost of Materiel Sold from Inventory Salaries and Wages:
Revenue: Gross Sales
Other Income
FISCAL YEAR (FY) 2011 BUDGET ESTIMATESFEBRUARY 2010$ in Millions
REVENUE AND EXPENSEDEPARTMENT OF THE NAVYRESEARCH AND DEVELOPMENT
NAVAL UNDERSEA WARFARE CENTER

FY 2009 FY 2010 FY 2011------- ------- -------
1. New Orders 1128.2 1013.8 1024.6
a. Orders from DoD Components: 981.4 887.3 895.7
Department of the Navy 959.1 867 873.7 O & M, Navy 240.7 219.7 226.3 O & M, Marine Corps 0.3 0 0 O & M, Navy Reserve 0.2 0.2 0.2 O & M, Marine Corp Reserve 0 0 0 Aircraft Procurement, Navy 15.3 14.5 14.5 Weapons Procurement, Navy 82.2 62.8 63 Ammunition Procurement, Navy/MC 0 0 0 Shipbuilding & Conversion, Navy 61.9 56.3 57.9 Other Procurement, Navy 216 218.8 224.7 Procurement, Marine Corps 0.4 0 0 Family Housing, Navy/MC 0 0 0 Research, Dev., Test, & Eval., Navy 342 294.4 286.8 Military Construction, Navy 0 0 0 National Defense Sealift Fund 0.1 0 0 Other Navy Appropriations 0 0.2 0.2 Other Marine Corps Appropriations 0 0 0
Department of the Army 4.8 2.5 2.5 Army Operation & Maintenance 0 0 0 Army Res, Dev, Test, Eval 2.6 0.2 0.2 Army Procurement 2.2 2.2 2.2 Army Other 0 0 0
Department of the Air Force 0.4 0.3 0.3 Air Force Operation & Maintenance 0.2 0.2 0.2 Air Force Res, Dev, Test, Eval 0.1 0 0 Air Force Procurement 0 0 0 Air Force Other 0 0 0
DOD Appropriation Accounts 17.2 17.6 19.2 Base Closure & Realignment 0.2 2.7 4.2 Operation & Maintenance Accounts 2.4 1.9 1.9 Res, Dev, Test & Eval Accounts 14.4 12.9 13 Procurement Accounts 0.1 0.1 0.1 Defense Emergency Relief Fund 0 0 0 DOD Other 0 0 0
b. Orders from other Fund Activity Groups 63.1 69.2 70.1
c. Total DoD 1044.5 956.5 965.8
d. Other Orders: 83.7 57.4 58.9 Other Federal Agencies 2.9 1.3 1.3 Foreign Military Sales 54.8 35 38.4 Non Federal Agencies 26 21.1 19.2
2. Carry-In Orders 536.9 518.1 509.8
3. Total Gross Orders 1665.1 1531.9 1534.5
a. Funded Carry-Over before Exclusions 518.1 509.8 485.8
b. Total Gross Sales 1147 1022.1 1048.6
4. End of Year Work-In-Process (-) -17.3 -20.1 -20.1
5. Non-DoD, BRAC, FMS, Inst. MRTFB (-) -115.3 -130.8 -106.9
6. Net Funded Carryover 385.5 358.9 358.8
Note: Line 4 (End of Year Work-In-Process) is adjusted for Non-DOD BRAC, FMS, and Institutional MRTFB
SOURCES OF NEW ORDERS AND REVENUEDEPARTMENT OF THE NAVY
RESEARCH AND DEVELOPMENT - NAVAL UNDERSEA WARFARE CENTERSFISCAL YEAR (FY) 2011 BUDGET ESTIMATES
FEBRUARY 2010$ in Millions
Exhibit Fund - 11 Sources of New Orders and Revenue

CHANGES IN COST OF OPERATIONS
DEPARTMENT OF THE NAVY
RESEARCH AND DEVELOPMENT
NAVAL UNDERSEA WARFARE CENTER
FISCAL YEAR (FY) 2011 BUDGET ESTIMATES
FEBRUARY 2010
AMOUNT IN MILLIONS
Total Cost
FY 2009 Actual $1,146.2
FY 2010 Estimate in FY 2010 Presidentʹs Budget $1,014.3
Estimated Impact in FY 2010 of Actual FY 2009 Experience
Increased civilian workforce due to impact of additional workload $18.4
Price Changes
Change in FY 2010 Fuel Price Assumptions $1.4
Change in FY 2010 General Inflation Assumptions ‐$0.4
Productivity Initiatives and Other Efficiencies
Capital Investment Program Savings ‐$0.1
Program Changes
Customer Workload ‐$1.6
Other Changes
Defense Finance and Accounting Service ‐$0.6
Depreciation ‐$0.5
Navy Enterprise Resource Planning $1.7
FY 2010 Current Estimate $1,032.6
Exhibit Fund - 2 Changes in the Cost of Operations

CHANGES IN COST OF OPERATIONS
DEPARTMENT OF THE NAVY
RESEARCH AND DEVELOPMENT
NAVAL UNDERSEA WARFARE CENTER
FISCAL YEAR (FY) 2011 BUDGET ESTIMATES
FEBRUARY 2010
AMOUNT IN MILLIONS
Total Cost
FY 2010 Current Estimate $1,032.6
Price Changes
Annualization of Prior Year Pay Raises
Military $0.0
Civilian $2.4
FY 2011 Pay Raises
Military ‐$0.1
Civilian $6.2
Fuel Price Changes $0.5
Working Capital Fund Price Changes $2.3
General Purchase Inflation $5.4
Productivity Initiatives and Other Efficiencies
Capital Investment Program Savings ‐$0.7
Lean Six SIGMA ‐$1.5
Program Changes
Other Workload ‐$7.4
Other Changes
Additional workload due to BRAC Tech 0042AR Maritime C4ISR $6.9
Defense Finance and Accounting Service ‐$0.1
Depreciation ‐$1.0
Navy Enterprise Resource Planning $9.6
Sustainment, Restoration, and Modernization $0.2
Other ‐$0.1
FY 2011 Estimate $1,055.1
Exhibit Fund - 2 Changes in the Cost of Operations

FY 2009
FY 2010
FY 2011
Line #
Description
Quantity
Total Cost
Quantity
Total Cost
Quantity
Total Cost
1Non‐ADPE and Telecom Equipment
16$7.499
12$6.358
20$10.450
Rep
lacement Cap
ability
2$1.291
3$1.390
7$3.355
Productivity Cap
ability
11$4.301
5$2.723
10$4.500
New M
ission Cap
ability
3$1.907
4$2.245
3$2.595
Environmental Cap
ability
0$0.000
0$0.000
0$0.000
2 ADPE and Telecom Equipment
8$3.519
11$4.815
9$3.895
Computer Hardware (Production)
6$2.376
8$3.645
7$3.145
Computer Software (O
perating)
0$0.000
1$0.275
2$0.750
Telecommunications
0$0.000
1$0.495
0$0.000
Oth Computer & Telecom Spt Equip
2$1.143
1$0.400
0$0.000
3Software Development
5$1.350
4$2.275
2$1.616
AMHF Control Upgrade
0$0.000
1$1.200
0
Enterprise Resource Planning (ERP)
1$1.068
Projects < $1M
5$1.350
3$1.075
1$0.548
4Minor Construction
8$2.821
9$3.605
7$2.570
Rep
lacement Cap
ability
1$0.415
2$1.180
1$0.120
Productivity Cap
ability
2$0.498
5$1.775
2$0.875
New M
ission Cap
ability
0$0.000
0$0.000
0$0.000
Environmental Cap
ability
5$1.908
2$0.650
4$1.575
Grand Total
37$15.190
36$17.053
38$18.531
Total Capital Outlays
$13.653
$17.707
$17.558
Total Depreciation Expense
$16.912
$17.643
$16.630
AMOUNT IN MILLIONS
CAPITAL INVESTMENT SUMMARY
DEPARTMENT OF THE NAVY
RESEARCH AND DEVELOPMENT ‐ NAVAL UNDERSEA WARFARE CENTER
FEBRUARY 2010
FISCAL YEAR (FY) 2011 BUDGET ESTIMATES
Exhibit Fund ‐ 9A Cap
ital Investm
ent Summary

Dep
artm
ent of the Navy / Research and Development / Naval Undersea Warfare Center
Location
New
port / Keyport
FY 2010
FY 2011
Non ADPE Equipment
Quan
tity
Unit Cost
Total Cost
Quan
tity
Unit Cost
Total Cost
Quan
tity
Unit Cost
Total Cost
Replacement Equipment
2$1,291
3$1,390
7$3,355
Total
2$1,291
3$1,390
7$3,355
ACTIVITY GROUP CAPITAL INVESTMENT JUSTIFICATIO
NFEBRUARY 2010
FY 2009
($ in Thousands)
FISCAL YEAR (FY) 2011 BUDGET ESTIM
ATES
Replacement Equipment:
These investm
ents support the replacement of mission essential non‐A
DPE research and development equipment that is unsafe, beyond economical rep
air, technically obsolete, or unusable. Mission
essential research and development equipment includes automatic test equipment, environmental testing equipment, vibration test equipment, bridge cran
e replacements, industrial services equipment,
and other equipment that support the development of undersea system
s. B
ased on the useful life guidan
ce provided by OPM (via circular A‐94), all investm
ents rep
lace equipment that is beyond the
original intended life cycle.
Benefit:
Rep
lacement of research and development equipment that is unsafe, beyond economic rep
air, or unusable. Mission essential research and development equipment must operate at optimal efficiency to
achieve proper test an
d evaluation results. E
quipment is rep
laced w
ith m
odern reliable equipment to support the research and development mission of the Naval W
arfare Centers. Investm
ent in
replacement equipment also improves efficiencies and enhan
ces system sustainment an
d m
aterial availability for the war‐fighter.
Impact:
Investm
ents for replacement equipment will not be mad
e resulting in w
ork that produces obsolete results to the scientific community, economically inefficient operation, and possible risk to human life. If
investm
ents in rep
lacement equipment are not mad
e, the risk of irreparable failure increases, process downtime increases, and m
aintenan
ce and rep
air costs increases.
Exhibit Fund ‐ 9B Cap
ital Purchase Justification

Dep
artm
ent of the Navy / Research and Development / Naval Undersea Warfare Center
Location
New
port / Keyport
FY 2010
FY 2011
Non ADPE Equipment
Quan
tity
Unit Cost
Total Cost
Quan
tity
Unit Cost
Total Cost
Quan
tity
Unit Cost
Total Cost
Productivity Equipment
11$4,301
5$2,723
10$4,500
Total
11$4,301
5$2,723
10$4,500
FY 2009
FEBRUARY 2010
ACTIVITY GROUP CAPITAL INVESTMENT JUSTIFICATIO
N
($ in Thousands)
FISCAL YEAR (FY) 2011 BUDGET ESTIM
ATES
Productivity Equipment:
These investm
ents increase the productivity of undersea warfare research and development activities by procuring non‐A
DPE equipment that red
uces the overall operating costs, eliminates process
inefficiencies and provides advan
ced technological cap
ability. Productivity investm
ents red
uce labor costs by establishing rem
ote operation, automation and red
uction in testing; operating costs are
lower through efficiency achieved by red
ucing energy consumption, d
eveloping autonomous operation of capability, red
ucing operational development an
d test time, red
ucing floor space required
, and
replacing inefficient test processes w
ith a single specialized asset. Investm
ents in productivity equipment include testing facility upgrades, industrial services equipment, power supply test station, test
sets, rap
id prototyping equipment, power supply equipment, equipment to characterize advan
ced transduction m
aterials, testbed
s for au
tonomous operations including vehicle lau
nch and recovery and
controller system
s, antenna im
ped
ance m
easurement equipment an
d other equipment that support the development of undersea system
s to increase productivity.
Benefit:
The Naval Undersea Warfare Center is the lead N
avy activity ded
icated to operate the Navy’s full spectrum research, d
evelopment, test an
d evaluation, engineering and fleet support center for
submarines, autonomous underwater system
s, and offensive an
d defensive weapon system
s associated w
ith undersea warfare. Constrained budgets necessitate the development of affordable,
innovative, evolving system
s for ap
plications in undersea warfare. Investm
ent in m
ission essential research and development equipment will ensure the warfare operates at optimal efficiency to achieve
proper test an
d evaluation results.
Impact:
If this equipment is not acquired
, the Warfare Center will be unable to support and test critical undersea warfare components and provide the Navy w
ith affordable, innovative capabilities to m
eet future
fleet needs. The Warfare Center can expect to incur loss of personnel productivity, d
ecreased customer satisfaction, rap
idly escalating m
aintenan
ce costs, red
uced services to the technical community, and
technical obsolescence. N
ot being able to test an
d evaluate system
s early in the development phase will increase the cost to the Navy by increasing development time an
d at‐sea testing. Consequently,
the Warfare Center will be unable to protect the fleet an
d m
ake the necessary contributions to prepare for the future.
Exhibit Fund ‐ 9B Cap
ital Purchase Justification

Dep
artm
ent of the Navy / Research and Development / Naval Undersea Warfare Center
Location
New
port / Keyport
FY 2010
FY 2011
Non ADPE Equipment
Quan
tity
Unit Cost
Total Cost
Quan
tity
Unit Cost
Total Cost
Quan
tity
Unit Cost
Total Cost
New Mission Equipment
3$1,907
4$2,245
3$2,595
Total
3$1,907
4$2,245
3$2,595
FISCAL YEAR (FY) 2011 BUDGET ESTIM
ATES
ACTIVITY GROUP CAPITAL INVESTMENT JUSTIFICATIO
N
($ in Thousands)
FEBRUARY 2010
FY 2009
New Mission Equipment:
These investm
ents support the acquisition of non‐A
DPE equipment that is required to support a new cap
ability that can not be met w
ith current equipment or capabilities. These include investm
ents
in equipment to support new m
ission cap
abilities such as testing can
didate persistent power source technologies, developing a testbed for inground and underwater surveillan
ce using advan
ced
sensor technology, experim
entation, sensor technology evaluation and next generation autonomous system
s. Investm
ents in these capabilities will enable the Warfare Center to rap
idly & efficiently
develop and evaluate distributed network and sensor technologies an
d system
s that support future undersea network‐centric w
arfare C4ISR goals.
Benefit: The Navy has identified a strong need for highly‐coordinated
, ʺnetworkedʺ forces w
ith advan
ced sensors and requiring persistent power sources technology. Consistent with N
etwork
Centric W
arfare doctrine, future concepts require significan
t am
ounts of inform
ation (from a variety of sensor types) to be tran
sferred and shared among all contributing N
aval components (other
sensor platform
s, comman
d & control, w
eapons platform
s, etc.). The ease and efficiency of this inform
ation transfer w
ill determine the level of success with w
hich the Navy can execute future
missions. If inform
ation can
not be tran
sferred to the ap
propriate nodes in the operation, then the Navyʹs combat effectiveness is significan
tly constrained
. Investm
ent in these capabilities can
evaluate em
erging technologies, exercised in littoral waters that are equivalent to tactical areas of interest. Investm
ents w
ill enable the Warfare Center an
d the Navy to develop technologies required
to m
eet the challenges associated w
ith Distributed networked system
s (D
NS).
Impact: If equipment is not purchased
, the Warfare Center will be unable to develop and test candidate technologies such as persistent power sources and advan
ced sensors required to m
eet the
challenge associated w
ith DNS. In the DNS functional decomposition, the Sensing, T
ransport, N
etworking and Communications events that take place in the marine environment require innovation
advan
ced concepts. The DNS challenge relies heavily on the development an
d testing of ad
van
ced sensors, p
ower sources and autonomous system
s. If equipment is not purchased
, the Warfare
Center an
d the Navy w
ill be unable to support the needs of the future w
arfighter.
688 CLASS Payload Integration Facility ($1.325M) ‐ Design and m
anufacture a high‐fidelity, ship‐like facility to support 688 Class payload integration resulting in 1/3 of a 688 Class W
eapons
Han
dling System (Torped
o Room). T
he facility w
ill facilitate the land based integration of new and under development submarine weapons an
d payload
s prior to initial shipboard integration. T
he
facility w
ill ensure proper fit, operation and integration of new w
eapons or payload
s prior to initial integration to and dep
loyment from a 688 class submarine. It will provide sponsors & developers
(navy & non navy) a venue to explore & validate payload‐to‐submarine launcher system interfaces w
hile not im
pacting operational availability of fleet assets. T
he payload
s of most concern are the
non‐w
eapon, ISR type payload
s that utilize the Submarine weapons system for their stowage & dep
loyment. T
he current ap
proach to system development requires developers to design & build new
system
s with no m
eans to fully evaluate shipboard lau
ncher interfaces short of an operational submarine. T
he proposed facility allows for this validation and checkout, red
ucing development cost &
time lines, w
hile providing greater probability of first pass success.
Exhibit Fund ‐ 9B Cap
ital Purchase Justification

Dep
artm
ent of the Navy / Research and Development / Naval Undersea Warfare Center
Location
New
port / Keyport
FY 2010
FY 2011
ADPE Equipment
Quan
tity
Unit Cost
Total Cost
Quan
tity
Unit Cost
Total Cost
Quan
tity
Unit Cost
Total Cost
Computer Hardware
6$2,376
8$3,645
7$3,145
Computer Software
0$0
1$275
2$750
Telecommunications
0$0
1$495
0$0
Other Support Equipment
2$1,143
1$400
0$0
Total
80
$3,519
110
$4,815
90
$3,895
FY 2009
FEBRUARY 2010
FISCAL YEAR (FY) 2011 BUDGET ESTIM
ATES
ACTIVITY GROUP CAPITAL INVESTMENT JUSTIFICATIO
N
($ in Thousands)
ADPE and Telecommunications Equipment and Capabilities:
These investm
ents w
ill support the acquisition of au
tomated data processing and telecommunications equipment for the undersea research and development community. Funds will provide
networks/connectivity to W
arfare Center activities procurement of hardware for mission essential research and development scientific computing needs, development of collaborative environment to
support undersea warfare test an
d evaluation, d
evelopment of testbed
s to support undersea warfare inform
ation operations, virtual system
s, decision m
aking and distributed networked system
s.
Investm
ents w
ill include routers, servers, firew
alls, n
etworks, high perform
ance computational/visualization hardware, communications equipment an
d other automated data processing and
telecomms equipment required to support the mission of undersea warfare.
Benefit:
In order to provide the necessary scientific computer resources at the Naval Undersea Warfare Center, adequate resources m
ust be acquired to m
eet the research, d
evelopment, test an
d evaluation
needs. T
hese computational engines, visualization engines, and rep
ositories of DoD high perform
ance computer system
s are required for engineers and scientists to develop innovative undersea
warfare solutions. Rep
lacement of obsolete computer equipment will provide the Warfare Center with m
ore reliable and m
ore cost effective resources w
hich w
ill ensure that the technical areas have
the capabilities they need to m
eet requirem
ents. Increased reliability w
ill reduce m
aintenan
ce costs, increase overall efficiency, and enhan
ce compatibility throughout the Warfare Center. Investm
ent
in equipment will also provide enhan
ced test an
d evaluation cap
abilities which w
ill help the Warfare Center im
plement technologies an
d reach back cap
ability that enables forw
ard dep
loyed technical
resources to be more efficient an
d effective.
Impact:
ADPE Equipment supporting the research and development community m
ust rem
ain on the cutting edge of technology to conduct complex sim
ulations, perform predictive an
alysis, and analyze
Submarine Undersea Warfare System perform
ance. The capability to conduct cutting edge scientific computing w
ithin the R&D community is in jeopardy if investm
ents are not mad
e. Current
equipment supporting m
ission essential system
s will no longer be supported by the man
ufacturer. Investm
ent in network infrastructure to support RDT&E laboratories at the Warfare Center is
required in order to support Fleet customers. Without a network infrastructure in place, the RDT&E laboratories w
ill not be able to function, support their customers or allow the Warfare Center to
pursue its mission.
Exhibit Fund ‐ 9B Cap
ital Purchase Justification

Dep
artm
ent of the Navy / Research and Development / Naval Undersea Warfare Center
Location
New
port / Keyport
FY 2010
FY 2011
Software
Quan
tity
Unit Cost
Total Cost
Quan
tity
Unit Cost
Total Cost
Quan
tity
Unit Cost
Total Cost
Software Projects
5$1,350
4$2,275
2$1,616
Total
5$1,350
4$2,275
2$1,616
FY 2009
ACTIVITY GROUP CAPITAL INVESTMENT JUSTIFICATIO
N
($ in Thousands)
FEBRUARY 2010
FISCAL YEAR (FY) 2011 BUDGET ESTIM
ATES
Benefits:
These investm
ents w
ill directly support the tran
sform
ation of the Warfare Centers to become a more agile support organ
ization. B
y fully integrating authoritative data sources w
ith collaborative tools,
flexible display technologies, and robust content man
agem
ent we will be better able to support the Fleetʹs w
ar fighters‐‐from Force Level leadership, to the sailor at any location and from any location.
This evolution of Distance Support cap
ability also enables us to be more proactive in developing life‐cycle solutions by m
aking the inform
ation required readily available at the workers desktop.
Investm
ents in software development will develop or enhan
ce undersea warfare analysis an
d assessm
ent models, distance support initiatives, and m
odules to support w
arfare center au
thoritative data
sources. All development will provide the collaborative structure w
hich w
ill contribute to achieving current / planned customer service levels. Software development projects include both internally
developed initiatives and externally developed initiatives.
Impact:
Without these investm
ents, the warfare center will be unable to continue im
plementation of DoD and N
avy standard system
s in a common, integrated fashion. Undersea warfare m
odels need to be
reviewed in light of modern computing architectures an
d futuristic ASW concepts such as distributed netted system
s (D
NS) an
d improved
, red
esigned
, or replaced as ap
propriate so that N
UWCʹs
mission‐level USW m
odeling and analysis capability can be sustained for the next generation of an
alysis problems. Without these investm
ents, the undersea simulation environment will not be fully
equipped for high‐level architecture (HLA) operation to support high‐fidelity H
ardware in the Loop (HWIL) Synthetic Ocean for joint warfighting training operations. Furthermore, the simulation
environment will not have the flexibility to tailor training scenarios to any realistic scenario future operational comman
ders need to intensively prepare for an
d strategic/tactical an
alysis. W
ithout
investm
ents, p
rograms will continue to invest in unique software solutions for search and retrieval of inform
ation that is presently accessible only from sep
arate, ʺstove‐pipeʺ data, resulting in increased
life‐cycle costs an
d different levels of technical integrity. Additionally, lack of data sharing w
ill im
pact ability to function as a warfare center enterprise conflicting w
ith Sea Enterprise objectives.
AMHF Control Upgrade ($1.200M) ‐ Upgrade an
d rep
lace the obsolete control system software for the Automated M
aterial Han
dling Facility (AMHF). This software is integral to operation of the
AMHF to locate and deliver hardware from the AMHF high‐rise storage to the Keyport Dep
ot an
d Interm
ediate M
aintenan
ce Activity (IM
A) shops. N
o viable alternative to upgrading the AMHF
control system software exists as the current software cannot be accred
ited beyond the start of FY11. W
ithout this investm
ent, the AMHF w
ould be shutdown and Fleet deliveries could not be mad
e.
Enterprise Resource Planning (ERP) ($1.068M) ‐ N
avy ERP is an integrated business man
agem
ent system that m
odernizes and standardizes N
avy business operations, provides m
anagem
ent
visibility across the enterprise, and increases effectiveness an
d efficiency. ERP w
ill provide consistent an
d streamlined business activities that operate under a single system
. During ERP
implementation, business processes w
ill be updated and sim
plified
, red
undan
cies w
ill be elim
inated
, and efficiencies realized. Economic Analysis has been completed for the Navy ERP program.
Exhibit Fund ‐ 9B Cap
ital Purchase Justification

Dep
artm
ent of the Navy / Research and Development / Naval Undersea Warfare Center
Location
New
port / Keyport
FY 2010
FY 2011
Minor Construction
Quan
tity
Unit Cost
Total Cost
Quan
tity
Unit Cost
Total Cost
Quan
tity
Unit Cost
Total Cost
Replacement
1$415
2$1,180
1$120
Productivit y
2$498
5$1,775
2$875
New Mission
0$0
0$0
0$0
Environmental
5$1,908
2$650
4$1,575
Total
80
$2,821
90
$3,605
70
$2,570
FY 2009
ACTIVITY GROUP CAPITAL INVESTMENT JUSTIFICATIO
N
($ in Thousands)
FISCAL YEAR (FY) 2011 BUDGET ESTIM
ATES
FEBRUARY 2010
Minor Construction
Investm
ents in M
inor Construction enhan
ce the Naval W
arfare Center Mission by developing buildings, structures or other real property. Minor Construction projects will replace obsolete facilities,
consolidate operations for productivity increases, provide state of the art processing areas for new R&D m
issions, and correct environmental deficiencies. M
inor construction projects include all costs to
deliver a complete and usable project. Minor Construction projects meet the D0D cap
italization criteria, however, 1 M
CON project exceed
s the threshold specified by 10 USC 2805. T
his M
CON project
utilizes Sec. 2804 of the FY 2008 National Defense Authorization Act (NDAA) au
thority for the Lab Revitalization Program.
Minor Construction is used at the Naval W
arfare Centers to:
‐ modify existing spaces and construct new facilities to provide suitable space to design and test new equipment for the surface warfare community
‐ im
prove security m
easures an
d provide increase security for new initiatives
‐ reduce operating expenses by building or im
proving government owned facilities so that leased space, high m
aintenan
ce and space, or portable m
ay be vacated
.
‐ reduce energy consumption by installing energy efficient building system
s
‐ modify existing system
s to bring facilities up to current building, safety, or environmental codes.
The following M
inor Construction Project exceed
s the current Military Construction Threshold levels of $750K using Laboratory Revitalization Program authority.
Project N
ame
FY 2010 R&D Test Vehicle Facility Renovation & Consolidation .880
Exhibit Fund ‐ 9B Cap
ital Purchase Justification
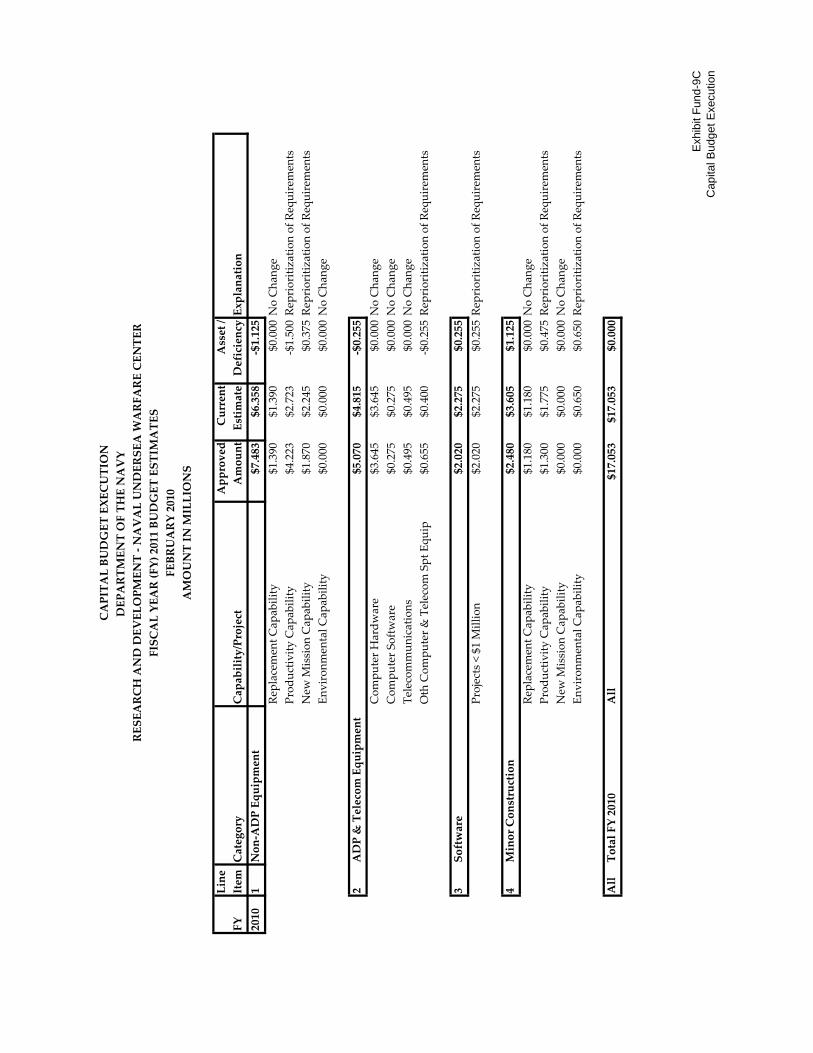
Line
Approved
Current
Asset /
FY
Item
Category
Capability/Project
AmountEstimateDeficiencyExplanation
2010
1Non‐ADP Equipment
$7.483
$6.358
‐$1.125
Rep
lacement Cap
ability
$1.390
$1.390
$0.000
No Chan
ge
Productivity Cap
ability
$4.223
$2.723
‐$1.500Rep
rioritization of Requirem
ents
New M
ission Cap
ability
$1.870
$2.245
$0.375
Rep
rioritization of Requirem
ents
Environmental Cap
ability
$0.000
$0.000
$0.000
No Chan
ge
2ADP & Telecom Equipment
$5.070
$4.815
‐$0.255
Computer Hardware
$3.645
$3.645
$0.000
No Chan
ge
Computer Software
$0.275
$0.275
$0.000
No Chan
ge
Telecommunications
$0.495
$0.495
$0.000
No Chan
ge
Oth Computer & Telecom Spt Equip
$0.655
$0.400
‐$0.255Rep
rioritization of Requirem
ents
3Software
$2.020
$2.275
$0.255
Projects < $1 M
illion
$2.020
$2.275
$0.255
Rep
rioritization of Requirem
ents
4Minor Construction
$2.480
$3.605
$1.125
Rep
lacement Cap
ability
$1.180
$1.180
$0.000
No Chan
ge
Productivity Cap
ability
$1.300
$1.775
$0.475
Rep
rioritization of Requirem
ents
New M
ission Cap
ability
$0.000
$0.000
$0.000
No Chan
ge
Environmental Cap
ability
$0.000
$0.650
$0.650
Rep
rioritization of Requirem
ents
All
Total FY 2010
All
$17.053
$17.053
$0.000
FEBRUARY 2010
AMOUNT IN MILLIONS
CAPITAL BUDGET EXECUTION
DEPARTMENT OF THE NAVY
RESEARCH AND DEVELOPMENT ‐ NAVAL UNDERSEA WARFARE CENTER
FISCAL YEAR (FY) 2011 BUDGET ESTIMATES
Exh
ibit
Fund
-9C
Cap
ital B
udge
t Exe
cutio
n
SPAWAR Systems Center

DEPARTMENT OF THE NAVY
NAVY WORKING CAPITAL FUND
RESEARCH AND DEVELOPMENT
SPACE AND NAVAL WARFARE SYSTEMS CENTERS
FISCAL YEAR (FY) 2011 BUDGET ESTIMATES
FEBRUARY 2010
Activity Group Function:
The Space and Naval Warfare Systems Centers (SSCs) bring knowledge superiority to the
warfighter. Their mission is to provide Naval, Joint and National knowledge superiority
through quality Research, Development, Acquisition, Test and Evaluation (RDAT&E) to rapidly
deploy and provide full cycle support for sustainable, survivable and interoperable Command,
Control, Communication, Computers, Intelligence, Surveillance and Reconnaissance (C4ISR),
Information Operations (IO), Enterprise Information Services (EIS) and Space capabilities. The
Space and Naval Warfare Systems Command is the primary ForceNet systems command and
the SSCs are SPAWAR’s principal technical agent. ForceNet implements the theory of network‐
centric warfare and will dramatically enhance how the Navy acquires, shares, and capitalizes
on information superiority to generate transformational combat effectiveness.
The SSCs are the C4ISR provider of choice for hundreds of customers throughout Navy and
DoD, and play an increasing role in the support of related technologies for Homeland Security,
the Federal Bureau of Investigation, Department of State, and other Federal agencies. As such,
the SSCs must maintain innovative scientific and technical expertise, facilities, and the
understanding of defense requirements to ensure that the Navy can develop, acquire, and
maintain the systems needed to meet customer requirements at an acceptable price. The SSC’s
provide cradle‐to‐grave products and services including:
Warfare systems analysis
Plan and conduct of effective technology programs
Cost conscious systems engineering and technical support to program managers in
all phases of systems development and acquisition
Test and evaluation support including RDT&E and measurement facilities
Technical input to the development of operational tactics
Electronics material support (technical and management) for systems and equipment
Specialized technical support to the Fleet for quick‐reaction requirements
Activity Group Composition:
The SSCs are under the management of the Space and Naval Warfare Systems Command. This
organizational structure facilitates the entire cycle of systems engineering from research and
development through waterfront support. SSC Pacific has its headquarters in San Diego, CA,

SPACE AND NAVAL WARFARE SYSTEMS CENTERS
FISCAL YEAR (FY) 2011 BUDGET ESTIMATES
FEBRUARY 2010
with offices in Philadelphia, Pearl Harbor, Guam, and Japan. SSC Atlantic has its headquarters
in Charleston, SC, with offices in Norfolk, VA, Washington, DC and Pensacola, FL. The
Pensacola office will close in FY 2011 in accordance with planned Base Realignment and
Closure (BRAC) actions.
Significant Changes since FY 2010 Presidentʹs Budget:
There are no significant changes in the activity group or composition since the FY 2010
President’s Budget.
Base Realignment and Closure (BRAC):
As was the case in the FY 2010 President’s Budget, the current submission incorporates the
impact of the Base Realignment and Closure (BRAC) V recommendation to consolidate
Maritime Command, Control, Communications, Computers, Intelligence, Surveillance and
Reconnaissance (C4ISR) and create multifunctional and multidisciplinary Centers of Excellence.
This will reduce overlapping infrastructure, increase the efficiency of operations, support an
integrated approach to maritime C4ISR, and reduce cycle time for fielding systems to the
warfighter.
Workload:
Reimbursable Orders ($Millions) FY 2009 FY 2010 FY 2011
Current Estimate $2,719.5 $2,704.8 $2,646.9
Reimbursable Orders
The SSC’s current new orders estimates for FY 2010 are above projections in the FY 2010
President’s Budget and reflect a robust customer base. New orders projections for FY 2011
reflect a decrease of 2.1% from the prior year. These changes are not a reflection of a reduced
business base, but show the impact of BRAC realignment of C4ISR research and development
functions, as discussed above. The SSC customer base is expected to remain strong.
Direct Labor Hours (000) FY 2009 FY 2010 FY 2011
Current Estimate 8,602 8,507 8,603
Direct Labor Hours
Direct labor hours remain stable over the budget period and reflect the SSCs efforts to establish
the correct balance of organic to contractor expertise to execute the mission. Changes from FY
2010 President’s Budget levels reflect the impact of actual execution, updated estimates and the
impact of BRAC realignments.
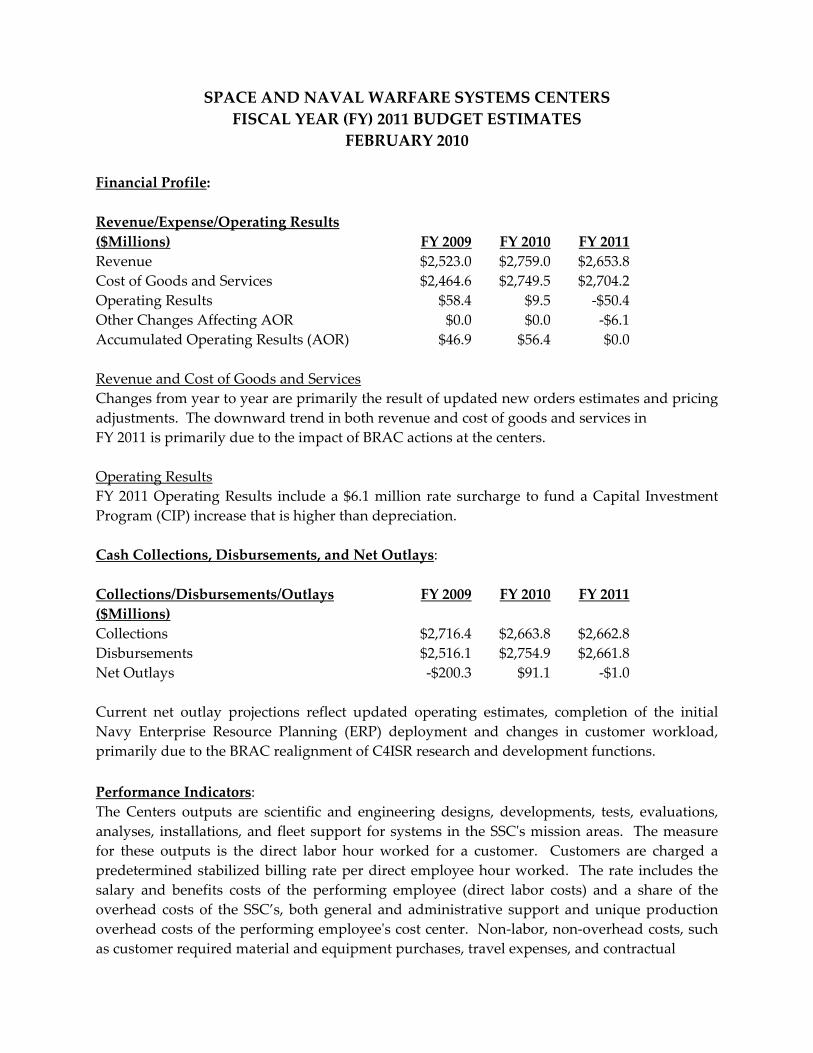
SPACE AND NAVAL WARFARE SYSTEMS CENTERS
FISCAL YEAR (FY) 2011 BUDGET ESTIMATES
FEBRUARY 2010
Financial Profile:
Revenue/Expense/Operating Results
($Millions) FY 2009 FY 2010
FY 2011
Revenue $2,523.0 $2,759.0 $2,653.8
Cost of Goods and Services $2,464.6 $2,749.5 $2,704.2
Operating Results $58.4 $9.5 ‐$50.4
Other Changes Affecting AOR $0.0 $0.0 ‐$6.1
Accumulated Operating Results (AOR) $46.9 $56.4 $0.0
Revenue and Cost of Goods and Services
Changes from year to year are primarily the result of updated new orders estimates and pricing
adjustments. The downward trend in both revenue and cost of goods and services in
FY 2011 is primarily due to the impact of BRAC actions at the centers.
Operating Results
FY 2011 Operating Results include a $6.1 million rate surcharge to fund a Capital Investment
Program (CIP) increase that is higher than depreciation.
Cash Collections, Disbursements, and Net Outlays:
Collections/Disbursements/Outlays
($Millions)
FY 2009 FY 2010
FY 2011
Collections $2,716.4 $2,663.8 $2,662.8
Disbursements $2,516.1 $2,754.9 $2,661.8
Net Outlays ‐$200.3 $91.1 ‐$1.0
Current net outlay projections reflect updated operating estimates, completion of the initial
Navy Enterprise Resource Planning (ERP) deployment and changes in customer workload,
primarily due to the BRAC realignment of C4ISR research and development functions.
Performance Indicators:
The Centers outputs are scientific and engineering designs, developments, tests, evaluations,
analyses, installations, and fleet support for systems in the SSCʹs mission areas. The measure
for these outputs is the direct labor hour worked for a customer. Customers are charged a
predetermined stabilized billing rate per direct employee hour worked. The rate includes the
salary and benefits costs of the performing employee (direct labor costs) and a share of the overhead costs of the SSC’s, both general and administrative support and unique production
overhead costs of the performing employeeʹs cost center. Non‐labor, non‐overhead costs, such as customer required material and equipment purchases, travel expenses, and contractual

SPACE AND NAVAL WARFARE SYSTEMS CENTERS
FISCAL YEAR (FY) 2011 BUDGET ESTIMATES
FEBRUARY 2010
services, are charged to the customer on an actual cost reimbursable basis, and are excluded
from the SSC’s stabilized pricing structure. The SSC’s use total stabilized cost per direct labor
hour as their performance criterion. The composite stabilized rate and the average total
stabilized cost per direct labor hour for the SSC’s are discussed below.
Stabilized / Composite Rate Changes FY 2009 FY 2010 FY 2011
Stabilized Rate $107.11 $111.34 $100.32
Change from Prior Year +3.9% ‐9.9%
Composite Rate Change +2.1% ‐2.1%
Rate changes incorporate adjustments in direct workload as well as overhead adjustments in
support of direct efforts.
Unit Cost FY 2009 FY 2010 FY 2011
Total Stabilized Cost ($Millions) $871.1 $905.1 $921.7
Workload (DLHs) (000) 8,602 8,507 8,603
Unit Cost (per DLH) $101.27 $106.40 $107.13
Staffing:
Civilian/Military ES & Work Years FY 2009 FY 2010 FY 2011
Civilian End Strength 6,860 6,660 6,717
Civilian Work Years 6,534 6,547 6,604
Military End Strength 70 78 79
Military Work Years 70 78 79
Civilian Personnel
The SSCs continue their efforts to revitalize the workforce and balance the skills mix to shape
force capabilities to address current and future threats. A major focus is the hiring of new
professionals, but the recruitment and retention of more experienced personnel is also being
addressed. The Human Capital plan includes attrition through Voluntary Separation Incentives
for a total of 35 in FY 2009, 92 in FY 2010, and 62 in FY 2011.
Military Personnel
Military workforce levels are projected to be stable throughout the budget period.
Capital Investment Program (CIP):

SPACE AND NAVAL WARFARE SYSTEMS CENTERS
FISCAL YEAR (FY) 2011 BUDGET ESTIMATES
FEBRUARY 2010
CIP Authority ($Millions) FY 2009 FY 2010 FY 2011
Equipment, Non‐ADP/Telecommunications $0.7 $2.8 ‐
Equipment, ADPE/Telecommunications $3.2 $3.6 $2.7
Software Development ‐ $0.7 ‐
Minor Construction $4.3 $4.7 $13.9
Total $8.2 $11.8 $16.6
The SSC’s modest investment in capital assets will acquire affordable and technically efficient
capabilities to support customer requirements. The software development investment is to
develop temporary interfaces for existing legacy applications not initially supported by Navy
ERP, and to maintain mission critical functionalities until legacy applications are shut down.
Minor construction includes projects meeting the criteria of the Defense Laboratory
Revitalization Program. The projects will replace aging temporary buildings and upgrade and
expand lab capability to accommodate workload growth and increase efficiency. $6.1 million of
the FY 2011 program is funded through a capital surcharge.
Carryover Compliance: Budgeted carryover is within the ceiling allowed by the approved outlay rates.
Carryover ($Millions) FY 2009 FY 2010
FY 2011
New Orders $2,719.5 $2,704.8 $2,646.9
Less Exclusions:
Foreign Military Sales $54.8 $82.0 $77.4
Base Realignment and Closure $11.1 $5.6 $19.8
Other Federal Departments & Agencies $495.1 $329.5 $339.5
Non‐Federal Agencies & others $14.0 $19.2 $15.3
Major Range & Test Facility Base $0.0 $0.0 $0.0
Orders for Carryover Calculation $2,144.5 $2,268.5 $2,194.9
Carryover Outlay Rate 53.2% 53.9% 53.9%
Balance of Customer Orders at Year End $1,463.8 $1,409.6 $1,402.7
Less Work‐in‐Process $0.0 $0.0 $0.0
Less Exclusions
Foreign Military Sales $54.7 $46.1 $38.0
Base Realignment and Closure $5.6 $6.8 $8.8
Other Federal Departments & Agencies $405.5 $410.9 $426.3
Non‐Federal Agencies & Others $20.5 $12.6 $8.4
Major Range & Test Facility Base $0.0 $0.0 $0.0
Carryover Budget $977.5 $933.3 $921.2

FY 2009 FY 2010 FY 2011
Operations 2,514.2 2,748.9 2,637.3
Surcharges 0.0 0.0 ‐6.1
Depreciation excluding Major Construction 8.7 10.1 10.5
Total Income 2,523.0 2,759.0 2,653.8
Military Personnel 6.8 7.2 7.5
Civilian Personnel 805.4 838.1 860.8
Travel and Transportation of Personnel 58.4 58.0 56.5
Material & Supplies (Internal Operations) 290.8 319.3 301.5
Equipment 110.9 127.4 118.1
Other Purchases from NWCF 72.6 71.9 72.6
Transportation of Things 6.1 7.9 7.6
Depreciation ‐ Capital 8.7 10.1 10.5
Printing and Reproduction 0.6 0.6 0.6
Advisory and Assistance Services 0.0 0.2 0.2
Rent, Communication & Utilities 27.1 34.1 35.8
Other Purchased Services 1,054.3 1,274.8 1,232.6
Total Expenses 2,441.7 2,749.5 2,704.2
Work in Process Adjustment 22.9 0.0 0.0
Comp Work for Activity Retention Adjustment 0.0 0.0 0.0
Cost of Goods Sold 2,464.6 2,749.5 2,704.2
Operating Result 58.4 9.5 ‐50.4
Less Surcharges 0.0 0.0 ‐6.1
Plus Appropriations Affecting NOR/AOR 0.0 0.0 0.0
Other Changes Affecting NOR/AOR 0.0 0.0 0.0
Extraordinary Expenses Unmatched 0.0 0.0 0.0
Net Operating Result 58.4 9.5 ‐56.4
Other Changes Affecting AOR 0.0 0.0 0.0
Accumulated Operating Result 46.9 56.4 0.0
Exhibit Fund‐14 Revenue and Expense
Expenses
Cost of Materiel Sold from Inventory
Salaries and Wages:
Revenue:
Gross Sales
Other Income
February 2010
$ in Millions
Revenue and Expenses
Department of the Navy
Research and Development ‐ Space and Naval Warfare Systems Centers
Fiscal Year (FY) 2011 Budget Estimates

FY 2009 FY 2010 FY 2011
1. New Orders 2,719.5 2,704.8 2,646.9
a. Orders from DoD Components: 2,052.8 2,175.6 2,118.5
Department of the Navy 1,451.9 1,547.8 1,502.1
O & M, Navy 419.7 481.5 470.4
O & M, Marine Corps 32.6 40.8 38.3
O & M, Navy Reserve 3.5 6.0 5.7
O & M, Marine Corp Reserve 0.0 0.0 0.0
Aircraft Procurement, Navy 8.4 7.2 6.9
Weapons Procurement, Navy 4.6 7.5 7.6
Ammunition Procurement, Navy/Marine Corps 0.0 0.0 0.0
Shipbuilding & Conversion, Navy 86.9 83.6 79.3
Other Procurement, Navy 523.2 516.0 496.6
Procurement, Marine Corps 74.4 86.7 83.9
Family Housing, Navy/MC 0.6 0.7 0.6
Research, Development, Test & Evaluation, Navy 282.0 302.7 299.1
Military Construction, Navy 3.3 6.4 6.3
National Defense Sealift Fund 12.5 8.6 7.4
Other Navy Appropriations 0.0 0.0 0.0
Other Marine Corps Appropriations 0.0 0.0 0.0
Department of the Army 68.6 55.1 49.9
Army Operation & Maintenance 28.2 31.7 26.7
Army Research, Development, Test & Evaluation 4.0 2.7 2.7
Army Procurement 32.2 18.5 18.4
Army Other 4.2 2.1 2.1
Department of the Air Force 120.0 136.3 128.4
Air Force Operation & Maintenance 44.2 49.4 45.4
Air Force Research, Development, Test & Evaluation 38.1 44.9 46.1
Air Force Procurement 37.7 38.8 33.7
Air Force Other 0.0 3.2 3.3
DOD Appropriation Accounts 412.2 436.4 438.1
Base Closure & Realignment 11.0 5.6 19.8
Operation & Maintenance Accounts 117.7 94.6 91.4
Research, Development, Test & Evaluation Accounts 149.9 162.6 161.3
Procurement Accounts 104.9 110.7 104.7
Defense Emergency Relief Fund ‐0.1 0.0 0.0
DOD Other 28.7 63.0 60.8
b. Orders from other Fund Activity Groups 102.8 98.5 96.2
c. Total DoD 2,155.6 2,274.1 2,214.7
d. Other Orders: 563.9 430.7 432.2
Other Federal Agencies 495.1 329.5 339.6
Foreign Military Sales 54.8 82.0 77.4
Non Federal Agencies 14.0 19.2 15.3
2. Carry‐In Orders 1,267.3 1,463.8 1,409.6
3. Total Gross Orders 3,986.8 4,168.6 4,056.5
a. Funded Carry‐Over before Exclusions 1,463.8 1,409.6 1,402.7
b. Total Gross Sales 2,523.0 2,759.0 2,653.8
4. End of Year Work‐In‐Process (‐) 0.0 0.0 0.0
5. Non‐DoD, BRAC, FMS, Inst. MRTFB (‐) ‐486.3 ‐476.4 ‐481.5
6. Net Funded Carryover 977.5 933.3 921.2
February 2010
$ in Millions
Sources of New Orders & Revenue
Department of the Navy
Research and Development ‐ Space and Naval Warfare Systems Centers
Fiscal Year (FY) 2011 Budget Estimates
Exhibit Fund‐11 Sources of Revenue
Note: Line 4 (End of Year Work‐In‐Process) is adjusted for Non‐DOD BRAC, FMS, and Institutional MRTFB

Changes in the Cost of Operations
Department of the Navy
Research and Development ‐ Space and Naval Warfare Systems Centers
Fiscal Year (FY) 2011 Budget Estimates
February 2010
$ in Millions
Cost of
Goods/Svcs
FY 2009 Actual Execution $2,464.6
FY 2010 Estimate in FY 2010 Presidentʹs Budget: $2,384.7
Estimated Impact in FY 2010 of Actual FY 2009 Experience $0.0
Price Changes
Change in FY 2010 Fuel Price Assumptions $0.1
Change in FY 2010 General Inflation Assumptions ‐$1.8
Productivity Initiatives and Other Efficiencies
Capital Investment Program Savings ‐$0.6
Program Changes
Customer Workload $366.8
Other Changes
Defense Finance and Accounting Service ‐$0.8
Depreciation ‐$0.3
Facility Sustainment, Restoration, and Modernization $0.4
Purchased Utilities $0.1
Engineering Support and Technical Services ‐$0.6
Communications $0.1
Equipment maintenance $0.1
Training $1.3
FY 2010 Current Estimate $2,749.5
Exhibit Fund‐2 Changes in the Cost of Operations

Changes in the Cost of Operations
Department of the Navy
Research and Development ‐ Space and Naval Warfare Systems Centers
Fiscal Year (FY) 2011 Budget Estimates
February 2010
$ in Millions
Cost of
Goods/Svcs
FY 2010 Current Estimate $2,749.5
Price Changes:
Annualization of Prior Year Pay Raises
Military $0.0
Civilian $4.2
FY 2011 Pay Raise
Military Personnel $0.1
Civilian Personnel $8.8
Fuel Price Changes $0.0
Working Capital Fund Price Changes $3.2
General Purchase Inflation $25.4
Productivity Initiatives and Other Efficiencies
Capital Investment Program Savings ‐$0.4
Program Changes
Customer Workload ‐$76.6
Navy ERP Deployment ‐$10.7
Other Changes:
Defense Finance and Accounting Service (DFAS) ‐$0.2
Depreciation $0.4
Military Labor $0.2
Facility Sustainment, Restoration, and Modernization $0.2
FY 2011 Current Estimate 2,704.2
Exhibit Fund‐2 Changes in the Cost of Operations

Capital Investment Summary
Department of the Navy
Research and Development ‐ Space and Naval Warfare Systems Centers
Fiscal Year (FY) 2011 Budget Estimates
February 2010
$ in Millions
FY 2009
FY 2010
FY 2011
Line #
Description
Quantity
Total Cost
Quantity
Total Cost
Quantity
Total Cost
1Non‐A
DPE and Telecom Equipment > or = $.250M
1$0.686
4$2.790
0$0.000
‐ Rep
lacement Cap
ability
0$0.000
1$0.400
0$0.000
‐ Productivity Cap
ability
0$0.000
1$1.160
0$0.000
‐ N
ew M
ission Cap
ability
1$0.686
2$1.230
0$0.000
‐ Environmental Cap
ability
0$0.000
0$0.000
0$0.000
2 ADPE and Telecom Equipment > or = $.250M
6$3.196
6$3.613
4$2.674
‐ Computer Hardware (Production)
3$2.033
5$1.793
3$1.384
‐ Computer Software (O
perating)
0$0.000
0$0.000
0$0.000
‐ Telecommunications
1$0.331
0$0.000
0$0.000
‐ Oth Computer & Telecom Spt Equip
2$0.832
1$1.820
1$1.290
3Software Development > or = $.250M
0$0.000
1$0.683
0$0.000
‐ Projects = or > $1M (List Sep
arately)
0$0.000
0$0.000
0$0.000
‐ Projects < $1M
0$0.000
1$0.683
0$0.000
4Minor Construction (> or = $.100M and < or = $2.000M)
7$4.297
6$4.674
15$13.867
‐ Rep
lacement Cap
ability
1$1.745
0$0.000
2$2.469
‐ Productivity Cap
ability
4$1.903
5$3.974
5$2.778
‐ N
ew M
ission Cap
ability
2$0.649
1$0.700
7$7.480
‐ Environmental Cap
ability
0$0.000
0$0.000
1$1.140
Grand Total
14$8.179
17$11.760
19$16.541
Total Capital Outlays
$7.356
$13.688
$13.898
Total Depreciation Expense
$8.727
$10.066
$10.470
Exhibit Fund‐9A Cap
ital Investm
ent Summary

Dep
artm
ent of the Navy / Research and Development / Space an
d
Naval W
arfare System
s Centers
Quan
tUnit Cost
Total Cost
Quan
tUnit Cost
Total Cost
Quan
tUnit Cost
Total Cost
Replacement
0‐
$
‐$
1400
$
400
$
0‐
$
‐$
Total
0‐
$
‐$
1400
$
400
$
0‐
$
‐$
FY 2009
FY 2011
FY 2010
Justification:
CAPITAL INVESTMENT JUSTIFICATIO
N
($ in Thousands)
Fiscal Year (FY) 2011 Budget Estim
ates
February 2010
SPAWAR System
s Centers
#001 ‐ N
on‐A
DPE and Telecommunications / Rep
lacement
Cap
abilities
Non‐A
DPE and Telecommunications Equipment
Non‐ADPE and Telecommunications:
REPLACEMENT
Currently, SSC Pacific has lim
ited vibration test capability, thus they are unable to fully m
eet current fleet requirem
ents in the area of non‐A
DPE and telecommunications
support. T
heir capability is further lim
ited by the age of the equipment, m
aking it necessary to m
ake repeated rep
airs. The benefit received from the FY 2010 project w
ill be a
more reliable vibration test capability. This project w
ill result in a red
uction in the need to out‐source to m
eet the needs of the Navy. A cost analysis has been perform
ed on
this project. A cost savings of ap
proxim
ately $99 thousand per year is expected from the FY 2010 project, beginning in FY 2011. N
ot funding this project w
ill have a critical
impact on SSC Pacificʹs ability to deliver quality Comman
d, C
ontrol, Communications, Computers and Intelligence (C4I) products to the fleet in support of their customers.
Exh
ibit
Fund
-9B
Cap
ital I
nves
tmen
t Jus
tific
atio
nN
on-A
DP
E R
epla
cem
ent

Dep
artm
ent of the Navy / Research and Development / Space an
d
Naval W
arfare System
s Centers
Quan
tUnit Cost
Total Cost
Quan
tUnit Cost
Total Cost
Quan
tUnit Cost
Total Cost
Productivity
0‐
$
‐$
11,160
$
1,160
$
Total
0‐
$
‐$
11,160
$
1,160
$
CAPITAL INVESTMENT JUSTIFICATIO
N
($ in Thousands)
Fiscal Year (FY) 2011 Budget Estim
ates
February 2010
Justification:
SPAWAR System
s Centers
Non‐A
DPE and Telecommunications Equipment
FY 2009
FY 2011
FY 2010
#001 ‐ N
on‐A
DPE and Telecommunications / Productivity Cap
abilities
Non‐ADPE and Telecommunications:
PRODUCTIVITY
The FY 2010 project involves the design and build of a cooling system for cooling cap
ability w
ith diesel backup in case of a power loss in SSC Pacificʹs Data Center. A
ny outage
could cau
se servers, network equipment, and disk drives to fail due to overheating. This investm
ent would provide an environment that w
ould utilize the existing building
cooling cap
abilities unless there was an outage in the building cooling system
. Then, an indep
endent system w
ithin the data center would energize an
d be maintained by diesel
power until cooling w
as restored to the building. A cost analysis has been perform
ed. Although cost savings are not envisioned as a result of this project, cost avoidan
ce m
ay
occur. If this project is not im
plemented, loss of service would occur since equipment would need to be turned off if the building cooling system w
as compromised
. This w
ould
necessitate system administrators taking down and restarting applications after cooling w
as restored. The minim
um outage would be ap
proxim
ately 4 hours due to the number
of servers that w
ould need to be restarted, but unexpected failures would extend this outage time.
Exhibit Fund‐9B Cap
ital Investm
ent Justification
Non‐A
DPE Productivity

Dep
artm
ent of the Navy / Research and Development / Space an
d
Naval W
arfare System
s Centers
Quan
tUnit Cost
Total Cost
Quan
tUnit Cost
Total Cost
Quan
tUnit Cost
Total Cost
New Mission
1686
$
686
$
2615
$
1,230
$
Total
1686
$
686
$
2615
$
1,230
$
0‐
$
‐$
CAPITAL INVESTMENT JUSTIFICATIO
N
($ in Thousands)
Fiscal Year (FY) 2011 Budget Estim
ates
February 2010
Justification:
SPAWAR System
s Centers
Non‐A
DPE and Telecommunications Equipment
FY 2009
FY 2011
FY 2010
#001 ‐ N
on‐A
DPE and Telecommunications / New M
ission Cap
abilities
Non‐ADPE and Telecommunications:
NEW MISSION
All equipment will provide new m
ission cap
abilities. N
o equipment currently exists that support the necessary m
ission cap
ability.
This investm
ent involves one project in FY 2009 an
d two in FY 2010.
The FY 2009 ʺUninterrupted Technical Power Supply (UPS) and Backup Generatorʺ
project provides auxiliary “no break” UPS technical power to laboratories and enterprise IT
infrastructure in support of the central communications hub for the SSC Atlan
tic enterprise for C4ISR transport and net‐centric IT system
s. This w
ill create an integrated
connectivity between all administrative an
d technical facilities located at St. Julien’s Creek Annex and support facilities throughout the Tidew
ater Region including other
SPAWAR corporate entities, services, agencies, U
nified Combatan
t Comman
ders, and academ
ia.
The first project in FY 2010, ʺCAEI Corporate Production Operations Support Area (RUBB BLDG)ʺ, p
rovides new cap
ability and cap
acity to support current an
d projected
growth. C
urrent facilities are no longer adequate to support either current or projected w
orkload
s or customers. The new facility w
ould create capacity for projected growth and
realize an increase of efficiency and effectiveness of current work. T
he support area will house the Integrated Intra‐Squad Rad
io System (IIRS)and the Vehicular Rad
io
Communications (VRC)‐110/111 series. Future programs will allow for more efficient organ
ization of material an
d cut down on the time it takes for material storage an
d
retrieval. C4ISR Acquisition Engineering & Integration (CAEI) Corporate Production provides Cable Fabrication, System
s Integration and Logistics Services to the SPAWAR
Technical dep
artm
ents and their programs. T
he second project, ʺChiller Installation, Building 50ʺ installs a single 100 ton air cooled chiller, pumps, controls and electrical pan
els
and constructs a new m
echan
ical enclosure to house it.
A cost savings of ap
proxim
ately $225 thousand per year is expected from the ʺCAEI Corporate Production Operation Support Area (RUBB BLDG)ʺ project beginning in FY
2011. There is also a potential cost avoidan
ce of ap
proxim
ately $540 thousand per annum for the ʺUninterrupted Technical Power Supply (UPS) and Backup Generatorʺ project,
should a power failure occur. W
ithout the ʺUninterrupted Technical Power Supply and Backup Generatorʺ, building 166 could suffer from loss of power and / or loss of
productivity during power outages cau
sing a significan
t negative im
pact to SPAWARʹs support posture to the warfighter. Also, w
ithout the ʺCorporate Production Operations
Support Area (RUBB BLDG)ʺ, off‐site storage facilities w
ould be required
. Continuing CAEI Corporate Production w
ithout increased cap
acity could increase sched
ule risk and
adversely impact customer confidence in SPAWAR.
Exhibit Fund‐9B Cap
ital Investm
ent Justification
Non‐A
DPE N
ew M
ission

Dep
artm
ent of the Navy / Research and Development / Space an
d
Naval W
arfare System
s Centers
Quan
tUnit Cost
Total Cost
Quan
tUnit Cost
Total Cost
Quan
tUnit Cost
Total Cost
Computer Hardware (Production)
2444
$
887
$
4348
$
1,393
$
2475
$
950
$
Computer Software (Operating System)
0‐
$
‐$
0‐
$
‐$
0‐
$
‐$
Telecommunications
1331
$
331
$
0‐
$
‐$
0‐
$
‐$
Other Computer & Telecommunications Spt Equipment
2416
$
832
$
Total
5410
$
2,050
$
4348
$
1,393
$
2475
$
950
$
CAPITAL INVESTMENT JUSTIFICATIO
N
($ in Thousands)
Fiscal Year (FY) 2011 Budget Estim
ates
February 2010
SPAWAR System
s Centers
ADPE and Telecommunications Equipment
FY 2009
FY 2011
FY 2010
#002 ‐ ADPE and Telecommunications (Projects <$1 Million)
Justification:
ADPE and Telecommunications Equipment:
Computer Hardware (Production):
This investm
ent includes two projects in FY 2009, four projects in FY 2010, and two projects in FY 2011.
There is an ʺRDT&E Network Upgradeʺ an
d ʺDatabase Engine Upgrade & License for Clusterʺ project in each of the three years. In addition, FY 2010 includes a ʺGuam Intrusion
Detection System, Building 4175ʺ project and an ʺEnterprise, Engineering, and Certification Video Teleconferencing Systemʺ which w
ill provide new cap
ability.
The ʺDatabase Engine Upgrade & License for Clusterʺ project in its current capability has lim
ited m
emory cap
acity resulting in degraded through‐put for database queries.
The ʺDatabase Engine Upgrade & License for Clusterʺ project w
ill allow for the following cap
abilities:
In FY 2009, the investm
ents resulted in rep
lacement of the existing Storage Area Network (SAN), upgrade of network interfaces, and procurement of a virtual m
achine environment an
d
associated licenses. B
enefits realized w
ill be consolidation of ap
plications, red
uced costs for operating the SAN environment, and improved network throughput. In FY 2010 an
d FY 2011,
funds will provide for the purchase of upgraded server cap
ability via blade technology, additional storage an
d backup cap
ability, and associated licenses.
The ʺRDT&E Network Upgradeʺ project currently provides a local area network for the laboratories of SSC Pacific as well as a high‐speed connection to the Defense Research and
Engineering N
etwork (DREN) an
d N
on‐Classified Internet Protocol Router Network (NIPRNET) using both Transm
ission Control Protocol/Internet Protocol (TCP/IP) an
d Asynchronous
Transfer M
ode (A
TM) protocols. The ʺRDT&E Network Upgradeʺ project in FY 2009, FY 2010, and FY2011 w
ill provide a technology refresh that w
ill allow the network to continue
operations an
d support future needs.
In FY 2010, the ʺGuam Intrusion Detection System, Building 4175ʺ will procure IT and peripheral equipment an
d cap
abilities (intrusion detection and access control system
s) to
accomodate ad
ditional employees an
d equipment . The facility w
as a form
er elementary school, and lacks the access control capabilities required for operations. T
his investm
ent will
support the ad
ditional personnel growth required for the upcoming m
ilitary build‐up on Guam
.
The ʺEnterprise, Engineering, & Certification Video Teleconferencing Systemʺ project w
ill provide the capability to display system
s that are being tested, such as the Global Comman
d
and Control System ‐ M
aritim
e (G
CCS‐M
), in real‐time while they are being tested and to display real‐time network statistics. It will also allow Video Teleconferences to be conducted
between activities supported by video feeds from the Enterprise, E
ngineering and Certification Laboratory. The current Video Teleconferencing System is a very low end point‐to‐point
system that does not possess the technology requirem
ents to achieve the ad
van
ced collaborative environment required w
ith m
ultiple research facilities at the same time.
Exhibit Fund‐9B Cap
ital Investm
ent Justification
ADPE and Telecom Under $1M

Dep
artm
ent of the Navy / Research and Development / Space an
d
Naval W
arfare System
s Centers
SPAWAR System
s Center
CAPITAL INVESTMENT JUSTIFICATIO
N
($ in Thousands)
Fiscal Year (FY) 2011 Budget Estim
ates
Sep
tember 2009
#002 ‐ ADPE and Telecommunications Cap
abilities (Projects <$1
Million)
ADPE and Telecommunications Equipment: (Cont.)
An economic analysis has been perform
ed for all projects. There will be no cost savings as all projects increase productivity.
If the ʺDatabase Engine Upgrade & License for Clusterʺ an
d the ʺRDT&E Network Upgradeʺ projects are not funded
, it would result in continued lim
ited m
emory cap
acity and degraded
unit cap
ability through‐put for database queries. P
ortions of the current RDT&E N
etwork architecture w
ill not support the future networking needs of the Research, D
evelopment, and In‐
service Engineering communities at SPAWAR. If the ʺGuam Intrusion Detection System, Building 4175ʺ is not funded the Guam Facility w
ill not be able to support the required personnel
needed to support the military build‐up.
Telecommunications:
This investm
ent includes one project in FY 2009.
The ʺIntegrated Teleport Upgradeʺ project created new cap
ability that includes combining numerous SATCOM terminals an
d support equipment into a common and integrated
environment. T
his new cap
ability supports SPAWARʹs participation in numerous Navy and Joint exercises an
d dem
onstrations. T
he upgrade will also create a virtual laboratory w
ith global
reach to ensure that any customer or Comman
d requirem
ent for high ban
dwidth communications testing is met. Programs an
d customers will use this resource to help develop, test, and
validate the fundam
ental requirem
ent for reliable, h
igh ban
dwidth communications. T
he development of NetCentric applications, as the Navy pursues a FORCEnet (Fn) vision, requires a
trem
endous am
ount of inform
ation to be rapidly disseminated among w
idely dispersed N
aval assets. T
raditional UHF, V
HF, and H
F chan
nels of communication can
not meet this task. This
project w
ill provide the capability to ensure complete ʺend to endʺ evaluation and testing for high ban
dwidth communications. N
o savings or cost avoidan
ce is expected in the near term
.
Failure to invest in the Integrated Telep
ort Upgrade could expose SSC Atlan
tic to the risk of failing to provide customers with cutting edge engineering services and impact customer
confidence in communication areas.
Other Computer & Telecommunications Spt Equipment:
The FY 2009 projects are a ʺContinuity of Operations (COOP) Initiativeʺ an
d a ʺWideband SATCOM Lab Enhancementʺ.
The ʺContinuity of Operations (COOP) Initiativeʺ provides SSC Atlan
tic with an alternative capability to continue business operations during and after a declared disaster in conjunction
with the comman
dʹs continuity of operations plan (COOP). Final delivery shall provide a fully tested and executable continuity of operations capability w
ith a m
eans an
d m
ethodology to
account for all comman
d personnel and communicate with the SPAWAR chain‐of‐comman
d. SSC Atlan
tic currently lacks a comprehensive strategy and plan to ensure continuity of
operations in the event of hurrican
es, acts of terrorism
, or other types of disasters. Project deliverables shall include but will not be limited to standard operating procedures, alternative
business an
d w
ork process plans, alternative work site design plans, comman
d‐w
ide plans including alternative communication plans, equipment an
d m
aterial acquisition list, documented
network centric network connectivity plans an
d applicable FORCEnet interface requirem
ent plans. A
ll plans an
d requirem
ents shall incorporate DOD/D
ON data storage, inform
ation
sharing, inform
ation assurance, and physical security requirem
ents. No savings or cost avoidan
ce is expected in the near term
, however this initiative supports mission continuan
ce and
safety of comman
d personnel in the event of natural or man‐m
ade catastrophic disaster. N
ot investing in the COOP Initiative could render SSC Atlan
tic incapable of mission readiness in the
wake of a disaster an
d cau
se the incurrence of needless personnel safety risk.
Exhibit Fund‐9B Cap
ital Investm
ent Justification
ADPE and Telecom Under $1M

Dep
artm
ent of the Navy / Research and Development / Space an
d
Naval W
arfare System
s Centers
SPAWAR System
s Center
CAPITAL INVESTMENT JUSTIFICATIO
N
($ in Thousands)
Fiscal Year (FY) 2011 Budget Estim
ates
Sep
tember 2009
#002 ‐ ADPE and Telecommunications Cap
abilities (Projects <$1
Million)
ADPE and Telecommunications Equipment: (Cont.)
The SATCOM lab perform
s satellite communications research and development for both N
avy and Joint Programs of Record. The ʺWideband SATCOM Lab Enhancementʺdeliverables will
increase the capability of In Service Engineering Agent (ISEA) functions to accurately provide test data for an
alysis, run realistic scenarios such as satellite delay and han
d‐over, p
rovide full
insight into the Rad
io Frequency (RF) spectral regions to detect an
omalies, and decompose the SATCOM system
s to facilitate efficient trouble‐shooting efforts. Further, these enhan
cements
will lead to In‐Service Engineering efficiency by red
ucing the am
ount of iterations associated w
ith setting up test scenarios an
d improve the response tim
e to support the FLEET. Net benefits
of this project are estim
ated at $118 thousand per year for FY 2009 through FY 2013.
Exhibit Fund‐9B Cap
ital Investm
ent Justification
ADPE and Telecom Under $1M

Dep
artm
ent of the Navy / Research and Development / Space an
d
Naval W
arfare System
s Centers
Quan
tUnit Cost
Total Cost
Quan
tUnit Cost
Total Cost
Quan
tUnit Cost
Total Cost
Computer Hardware (Production)
11,146
$
1,146
$
1400
$
400
$
1434
$
434
$
Other Computer & Telecommunications Spt Equipment
0‐
$
‐$
11,820
$
1,820
$
11,290
$
1,290
$
Total
11,146
$
1,146
$
21,110
$
2,220
$
2862
$
1,724
$
ADPE and Telecommunications Equipment
FY 2009
FY 2011
FY 2010
Justification:
CAPITAL INVESTMENT JUSTIFICATIO
N
($ in Thousands)
Fiscal Year (FY) 2011 Budget Estim
ates
February 2010
SPAWAR System
s Centers
#002 ‐ ADPE and Telecommunications (Projects = or > $1 M
illion)
ADPE and Telecommunications Equipment:
Computer Hardware (Production):
This investm
ent includes one project in FY 2009, w
ith follow‐on procurements for ad
ditional equipment / capability in FY 2010 an
d FY 2011.
In FY 2009, the ʺData Center Shared Services Environmentʺ procured servers plus licenses to support data center based applications in the Navy M
arine Corps Intran
et
(NMCI) environment. SPAWAR has been identified as a Navy Data Center (N
DC) an
d this procurement will provide sufficient capacity to support current known
requirem
ents for production environments as well as provide an environment with growth potential. In FY 2010 an
d FY 2011 the ʺData Center Shared Services Environmentʺ
will procure additional equipment and provide ad
ditional computing cap
ability to support business growth of the NDC as more Cyber Asset Red
uction and Security (CARS)
cases come in to the data center. T
here are no anticipated cost savings for the ʺData Center Shared Services Environmentʺ becau
se this is a new business initiative an
d the
equipment is required to provide an initial offering of services for the NDC. Without this procurement, the ability to host N
avy applications will be severely lim
ited
.
Other Computer & Telecommunications Spt Equipment:
This investm
ent includes one project in FY 2010 an
d one project in FY 2011.
The current equipment that the ʺOnline Disk Filer Systemʺ an
d the ʺDisk Based Data Backup/Recovery Filer Systemʺ projects will replace and upgrade supports virtual
hosting system
s for Windows, Linux, and Solaris Operation System
s. The current equipment is used daily across all SPAWAR users, sponsors and functions. SPAWAR has
established a Collaboration Solutions Environment (CSE), w
hich includes virtual hosting system
s to support the Windows, Linux, and Solaris Operation System
. The ʺOnline
Disk Filer Systemʺ will provide a clustered disk based subsystem providing storage for all virtual servers an
d load balan
cers to provide a highly fau
lt tolerant hosting system
.
The ʺDisk Based Data Backup/Recovery Filer Systemʺ would provide data backup for all production and development virtual servers an
d an offsite disaster recovery disk
subsystem for corporate production data. T
he cost savings for the ʺOnline Disk Filer Systemʺ is approxim
ately $243 thousand per year for FY 2011 through FY 2015. T
he cost
savings for the ʺDisk Based Data Backup/Recovery Filer Systemʺ are $118 thousand per year for FY 2012 to FY 2016. If the ʺOnline Disk Filer Systemʺ were deconstructed
, it
would equate to greater than 40 indep
endent servers an
d 40 stan
d alone disk subsystem
s. If the ʺDisk Based Data Backup/Recovery Filer Systemʺ were deconstructed
, it
would equate to greater than 20 indep
endent servers, 20 stan
d alone disk subsystem
s, numerous stan
d alone data backup subsystem
s an
d the inability to provide a corporate
offsite disaster recovery solution. The stan
d alone system
s would be much less fault tolerant, be less secure and consume much m
ore power and floor space. The stan
d alone
system
s would require 10 tim
es the system administrative support than the CSE system currently requires. N
umerous Inform
ation Assurance (IA
) documents w
ould be
required for the indep
endent system
s over the single CSE IA System Security Aproval authority (SSAA). The existing equipment is approaching end of life and w
ill become un‐
maintainable by local system administrators or commercial vendor support.
Exhibit Fund‐9B Cap
ital Investm
ent Justification
ADPE and Telecom Over $1M

Dep
artm
ent of the Navy / Research and Development / Naval
Surface Warfare Center
Quan
tUnit Cost
Total Cost
Quan
tUnit Cost
Total Cost
Quan
tUnit Cost
Total Cost
Interface Performance and Application Conversions and
Extensions for N avy ERP
0‐
$
‐$
1683
$
683
$
‐$
TOTAL
0‐
$
‐$
1683
$
683
$
0‐
$
‐$
FY 2011
FY 2010
Justification:
CAPITAL INVESTMENT JUSTIFICATIO
N
($ in Thousands)
Fiscal Year (FY) 2011 Budget Estim
ates
February 2010
SPAWAR System
s Centers
#003 ‐ Software (Projects < $1 M
illion)
Software
FY 2009
Software:
The FY 2010 project proposes an ʺInterface Performance and Application Conversion for Navy ERPʺ. T
his project rep
resents a solution for mission critical services to be
provided to users through a m
ore flexible and controlled environment, w
ith all updated data an
d Rep
orts/Interfaces/Conversions/Extensions (RICE) modifications or
improvem
ents. SSC Atlan
tic will tran
sition to the ap
proved and m
andated standard system
s as directed by DoD and N
avy and w
ill work directly w
ith RICE sub‐team of the
ERP Program’s Technical and Business Process Teams with regard to all site related RICE issues. SSC Atlan
tic will develop interfaces w
ith Virtual System
s Comman
d
representatives to determine Navy enterprise strategy for archiving, legacy data retention and retrieval requirem
ents, architecture and strategy along w
ith the lead site team
’s
resources w
ith regard to validating site reporting requirem
ents, d
ata conversions, system interfaces and any required extensions to ERP solution. T
his project w
ill develop
software tools and interfaces to Commercial off the Shelf (COTS) Bolt‐on applications that interface with the Navy ERP system
, such as Primavera or Artem
is. These products
are generally accep
ted bolt‐on COTS products that complete the SAP application environment to achieve comprehensive project m
anagem
ent, not otherwise provided in the
native SAP application. The data an
d RICE m
odifications/im
provem
ents provided by the Interface Perform
ance and Application Conversion for Navy ERP project are vital to
complete m
ission critical services.
Initiatives began in FY 2008 in preparation for Navy ERP and continue into FY 2010. A spiral development is not ap
plicable for these software projects. A cost analysis has
been perform
ed for this projects. C
ost savings are not expected in the near term
. Projects will be externally developed and license fees are not ap
plicable.
Exhibit Fund‐9B Cap
ital Investm
ent Justification
Software Under $1M

Dep
artm
ent of the Navy / Research and Development / Space an
d
Naval W
arfare System
s
Quan
tUnit Cost
Total Cost
Quan
tUnit Cost
Total Cost
Quan
tUnit Cost
Total Cost
Replacement
11,745
$
1,745
$
0‐
$
‐$
21,235
$
2,469
$
Productivity
4476
$
1,903
$
5795
$
3,974
$
5556
$
2,778
$
New Mission
2325
$
649
$
1700
$
700
$
71,069
$
7,480
$
Environmental
0‐
$
‐$
11,140
$
1,140
$
Total
7614
$
4,297
$
6779
$
4,674
$
15924
$
13,867
$
Justification:
CAPITAL INVESTMENT JUSTIFICATIO
N
($ in Thousands)
Fiscal Year (FY) 2011 Budget Estim
ates
February 2010
SPAWAR System
s Centers
#004 ‐ M
inor Construction
Minor Construction
FY 2009
FY 2011
FY 2010
Minor Construction:
No project described herein exceed
s the current Mlitary Construction (MILCON) threshold.
All projects are within the $2 m
illion threshold for minor construction afforded by the Defense Lab Revitalization Program.
REPLACEMENT
The majority of the replacement projects are for trailers that have seriously deteriorated due to age, w
eather exposure (due to their locations), and m
ultiple past alterations. O
ther existing
perman
ent facility rep
lacements are requested becau
se the building currently in use is unable to m
eet high tech lab requirem
ents. T
he proposed projects will replace unusable or limited use
space with fully functional spaces able to support the type of ad
van
ced technology w
ork done at the SSCs in support of the Overseas Contingency Operations (O
CO). C
ost analyses have been
perform
ed for all projects. D
ue to the replacement nature of these projects, the expected cost savings is m
inim
al. If these projects are not funded
, and space is not available, there may be a
degradation of mission cap
abilities available to the war fighter due to lost opportunities to develop programs an
d emerging technologies.
PRODUCTIVITY
The majority of projects requested are due to SPAWARʹs growth and/or to support technical requirem
ents that are restricted in current facilities. In addition, d
ue to a shortfall in the design of
the Naval Ordnan
ce Test Station (NOTS) Pier , it is necessary to construct a large vessel mooring system
. The proposed projects will ad
d fully functional spaces to support the type of ad
van
ced
technology w
ork done at the SSCʹs. The ad
ditions will also support growth in programs across the Center allowing m
ore rap
id response to requirem
ents and red
ucing safety concerns. T
eams
will be able to be co‐located w
hich w
ill allow improved interaction w
ithin the team and m
ore efficient use of equipment an
d personnel. In addition, the primary benefit of constructing
improvem
ents to N
OTS pier is to provide a safe m
ooring for a large vessel at the pier an
d safe personnel and equipment tran
sfer to/from the vessel to/from the pier. C
ost analyses have been
perform
ed for all projects. T
hese projects are intended to increase productivity rather than red
uce cost so there is no cost savings projected
. If these projects are not funded
, and space is not
available, the Navy w
ill lose the capability of providing needed support to DoD customers, jeopardizing m
ission perform
ance and m
ission cap
abilities that could be available to the war fighter.
If the project to improve NOTS Pier is not funded
, the inefficient, cumbersome an
d risky procedures for vessel‐to‐pier tran
sfers of personnel and equipment will continue.
NEW MISSION
No existing facilities currently support the necessary new m
ission cap
ability.
The minor construction projects outlined below provide ad
ditional production cap
acity and cap
ability to m
eet the commitments m
ade to our customers as w
ell as an enhan
ced security posture
for one of our building complexes. L
ack of production cap
acity w
ould expose the comman
d to sched
ule risk, raise production costs, and red
uce our credibility to customers. Failure to upgrade
our facility security to DoD M
inim
um Antiterrorism Standards for Buildings could expose SPAWARʹs personnel and property to the risk of terrorist attack. A cost analysis has been perform
ed
and estim
ated savings/cost avoidan
ce for the projects over the cost benefit period are m
inim
al.
Exhibit Fund‐9B Cap
ital Investm
ent Justification
Minor Construction

Dep
artm
ent of the Navy / Research and Development / Space an
d
Naval W
arfare System
s
SPAWAR System
s C
enters
CAPITAL INVESTMENT JUSTIFICATIO
N
($ in Thousands)
Fiscal Year (FY) 2011 Budget Estim
ates
February 2010
#004 ‐ M
inor Construction
Minor Construction: (Cont.)
These investm
ents involve tw
o projects in FY 2009, one in FY 2010, and seven in FY 2011.
ʺBuilding 1602 Restroomsʺ (FY09) will provide ad
ditional restrooms, increased w
ater service, and additional operational space to provide suitable w
orking conditions for a 100,000 SF facility used
for protyping, evaluation, testing and electronic integration of military vehicles. C
urrently, the facility does not meet building code or occupational health and safety standards.
ʺBldg 198 HVACʺ (FY09) will provide a sufficient ventilation and air conditioning system to support the work being perform
ed. Production areas lacking proper air conditioning during the
summer could pose health risks for production personnel and degradation risks for equipment being assem
bled.
ʺBldg 198 Capacity Increaseʺ (FY10) will modify an existing facility to m
ake it m
eet needed w
orkspace for the personnel w
orking on C4ISR. T
he facility is currently under‐utilized due to lim
ited
and inad
equate egresses from the facility. T
he ad
ditional egress point will expan
d the occupan
cy of the 2n
d floor of the building by 200 people.
ʺNorth Yard Security Upgradeʺ (FY11) project w
ill greatly enhan
ce the security posture of a complex of buildings at the form
er naval base an
d shipyard sites w
ith the objective of meeting the
unified facility criteria for DoD M
inim
um Antiterrorism Standards for Buildings. The complex currently has no defined perim
eter or security protection norm
ally provided by a naval base or
shipyard.
ʺModernize Labs BLDG 172 St Juliensʺ (FY11) will expan
d m
ission areas by providing additional lab space that w
ill match expan
ding w
orkload and technical requirem
ents for both employees
and customers. Additional lab space provided w
ill enhan
ce personnel interoperability as well as provide optimal FLEET support. Improving this cap
ability w
ill significan
tly improve warfighter
responsiveness an
d contiguous interoperability between SPAWAR and its vital customers. BLDG 172 currently lacks the lab space required to enhan
ce SPAWARʹs current operational posture.
ʺCommand and Emergency Response Centerʺ (FY11) will provide the capability necessary to m
onitor SPAWAR infrastructure to determine the state of read
iness from a centralized facility.
Response Center will collocate an emergency response cap
ability w
ith the comman
d center to provide a single location to coordinate recovery efforts. Response Center will aid SPAWAR in the
state of read
iness against events such as hurrican
es, w
orkplace violence, and acts of terrorism
. Providing this level of situational awareness will maintain SPAWAR business continuity w
ith its
employees an
d customers. T
he facility w
ill be provided w
ith backup services and equipment.
ʺUpgrade BLDG 1621 from Warehouse to Production Facilityʺ (FY11) will provide a capable w
ork area for the SSC Atlan
tic C4ISR Acquisition Engineering & Integration (CAEI) Dep
artm
ent.
BLDG 1621 will be renovated and rem
odeled into 18 cubicles, a conference room, and two lavatories. CAEI will utilize this space for project engineers, finan
cial analysts, and security personnel
and also as a conference location.
ʺMedical Programs Facilityʺ (FY11) will provide a capable w
ork area for personnel, w
hich support m
ultiple m
edical programs. Due to signnifican
t growth, support personnel have been m
oved
off‐site due to insufficient facility resourses impacting execution and team cohesiveness.
Exhibit Fund‐9B Cap
ital Investm
ent Justification
Minor Construction

Dep
artm
ent of the Navy / Research and Development / Space an
d
Naval W
arfare System
s
#004 ‐ M
inor Construction
SPAWAR System
s C
enters
CAPITAL INVESTMENT JUSTIFICATIO
NFiscal Year (FY) 2011 Budget Estim
ates
($ in Thousands)
February 2010
Minor Construction: (Cont.)
ʺNorth Yard Integration Lab Spaceʺ (FY11) will provide ad
ditional cap
ability for the C4I efforts. Current workload projections indicate the capability of Bldg 1648 will be exceed
ed by 2012. This
project w
ill increase the integration and test capability of Bldg 1648 by approxim
ately 5,000 sf by expan
ding the footprint of the building and enclosing an existing unused portion of the building.
This w
orkload increase is driven by DoN shipbuilding policy initiatives designed to assure Fleet interoperability and red
uce the cost of life cycle sustainment efforts by shifting away for unique
Lead System
s Integrator solutions based on Contractor Furnished equipment to Program of Record, G
overnment Furnished equipment.
ʺBldg 166 Lab Expansionʺ (FY11) will provide expan
sion to existing laboratories in bldg 166 located at St. Juliens Creek Annex. T
his facility provides support for a vast array of shipboard and shore
net‐centric C4SIR transport and IT network system
s including Program of Record legacy/extant terrestrial an
d satellite C4ISR system
s. Bldg 166 is the central communications hub for SPAWAR
SSC Atlan
tic enterprise for C4ISR transport and net‐centric IT system
s, peripherals, and ancillaries an
d affords an integrated cap
ability and connectivity between all administrative an
d technical
facilities located at the St. Juliens Creek Annex and support facility.
ENVIRONMENTAL
The ʺAntenna Ground Plane Replacementʺ w
ill remove an
d dispose of the lead ground plane at the Model Ran
ge an
d rep
lace it with a layer of conductive concrete. T
he Antenna Pattern Ran
ge is
used to m
easure the radiation patterns of an
tennas on scale m
odels of Navy ships. Since 1982, there have been no refurbishments of the ground plane an
d the lead surface is deteriorating cau
sing
contamination to the surrounding soil. Cost avoidan
ce w
ill occur of costs for Hazardous Material (H
AZMAT) abatem
ent for the lead contamination as well as costs to m
aintain the existing ground
plane. T
he new ground plane would require little or no m
aintenan
ce. If the current lead ground plane is not replaced it will continue to erode an
d contaminate the surrounding lan
dscap
e an
d
future clean‐ups would be required at substan
tial costs.
Exhibit Fund‐9B Cap
ital Investm
ent Justification
Minor Construction

February 2010
Projects in the FY 2010 Presidentʹs Budget
Approved
Approved
Current
Asset/
Project
Reprogs
Proj Cost
Proj Cost
DeficiencyExplanation
FY 2010
Equipment (N
on‐A
DPE)
3.691
(0.901)
2.790
2.790
0.000
Equipment (A
DPE)
3.140
0.473
3.613
3.613
0.000
Software Development
0.683
0.000
0.683
0.683
0.000
Minor Construction
4.246
0.428
4.674
4.674
0.000
Total FY 2010
11.760
0.000
11.760
11.760
0.000
Non‐ADP Equipment >= $.250M
3.691
(0.901)
2.790
2.790
0.000
Red
uction is primarily due to revised System
s
Centers priorities resulting in the cancellation of
the Signal Characterization Lab.
ADPE and telecommunications resources >= $.250M
3.140
0.473
3.613
3.613
0.000
Increase reflects the im
pact of updated System
s
Centersʹ priorities resulting in the ad
dition of the
Guam Intrusion Detection System and the
Enterprise, E
ngineering, and Certifcation Video
Teleconferencing System
.
Software Development >= $.250M
0.683
0.000
0.683
0.683
0.000
No chan
ge.
Minor Construction (>= $.100M and < = $.750M)
4.246
0.428
4.674
4.674
0.000
Reflects reprioritization of minor construction
requirem
ents based on System
s Centersʹ needs.
($ in Millions)
Capital Budget Execution
Department of the Navy
Research and Development ‐ SPAWAR Systems Centers
Fiscal Year (FY) 2011 Budget Estimates
Exhibit Fund‐9C Cap
ital Budget Execution

Naval Research Laboratory

DEPARTMENT OF THE NAVY
NAVY WORKING CAPITAL FUND
RESEARCH AND DEVELOPMENT
NAVAL RESEARCH LABORATORY
FISCAL YEAR (FY) 2011 BUDGET ESTIMATES
FEBRUARY 2010
Mission Statement / Overview
The Naval Research Laboratory (NRL), the Navy’s single, integrated corporate
laboratory, provides the Navy with a broad foundation of in‐house expertise from
scientific through advanced development activity. Specific leadership responsibilities
are assigned in the following areas:
a. Primary in‐house research in the physical, engineering, space, and
environmental sciences.
b. Broadly based exploratory and advanced development program in response to
identified and anticipated Navy and Marine Corps needs.
c. Broad multidisciplinary support to the Naval Warfare Centers.
d. Space and space systems technology development and support.
NRL operates as the Navy’s full‐spectrum corporate laboratory, conducting a broadly
based multidisciplinary program of scientific research and advanced technological
development directed toward maritime applications of new and improved materials,
techniques, equipment, systems and ocean, atmospheric, and space sciences and related
technologies. In fulfillment of this mission, NRL:
a. Initiates and conducts broad scientific research of a basic and long‐range nature
in scientific areas of interest to the Navy.
b. Conducts exploratory and advanced technological development deriving from or
appropriate to the scientific program areas.
c. Within areas of technological expertise, develops prototype systems applicable to
specific projects.
d. Assumes responsibility as the Navy’s principal R&D activity in areas of unique
professional competence upon designation from appropriate Navy or DoD
authority.
e. Performs scientific research and development for other Navy activities and,
where specifically qualified, for other agencies of the Department of Defense
and, in defense‐related efforts, for other Government agencies.

NAVAL RESEARCH LABORATORY
FISCAL YEAR (FY) 2011 BUDGET ESTIMATES
FEBRUARY 2010
f. Serves as the lead Navy activity for space technology and space systems
development and support.
g. Serves as the lead Navy activity for mapping, charting, and geodesy (MC&G)
research and development for the National Geospatial‐Intelligence Agency.
Activity Group Composition:
In addition to its Washington, D.C. campus of about 131 acres and 85 main buildings,
NRL maintains 14 other research sites, including a vessel for fire research and a Flight
Squadron. The many diverse scientific and technological research and support facilities
include a large facility located at the Stennis Space Center in Bay St. Louis, Mississippi, a
facility at the Naval Support Activity, Monterey Bay in Monterey, California, the
Chesapeake Bay Detachment in Maryland, and additional sites located in Maryland,
Virginia, Alabama, and Florida.
The Scientific Development Squadron One (VXS‐1), located aboard the Patuxent River
Naval Air Station in Lexington Park, Maryland, operates and maintains three uniquely
configured P‐3 Orion and two RC‐12 Huron turboprop aircraft as airborne research
platforms for worldwide scientific research operations.
The Chesapeake Bay Detachment occupies a 168‐acre site near Chesapeake Beach,
Maryland, and provides facilities and support services for research in radar, electronic
warfare, optical devices, materials, communications, and fire rescue. Because of its
location high above the Chesapeake Bay on the western shore, unique experiments can
be performed in conjunction with the Tilghman Island site 16 km across the bay.
The NRL Stennis Space Center (NRL‐SSC) is a tenant activity at NASA’s Stennis Space
Center. Other Navy tenants at the Stennis Space Center include the Naval Meteorology
and Oceanography Command and the Naval Oceanographic Office, who are major
operational users of the oceanographic and atmospheric research and development
performed by the NRL. This unique concentration of operational and research
oceanographies makes NRL‐SSC the center of naval oceanography and the largest such
grouping in the western world.
The Marine Meteorology Division at Monterey, California, a tenant activity of the Naval
Support Activity, Monterey Bay, is collocated with the Fleet Numerical Meteorology and
Oceanography Center to support development of numerical atmospheric prediction
systems and related user products. This collocation allows easy access to a large vector
classified supercomputer mainframe, providing real time as well as archived global
atmospheric and oceanographic databases for research at Monterey and at other NRL
locations.

NAVAL RESEARCH LABORATORY
FISCAL YEAR (FY) 2011 BUDGET ESTIMATES
FEBRUARY 2010
Significant Changes Since the FY 2010 President’s Budget:
There are no significant changes in the activity group composition since the FY 2010
President’s Budget.
Financial Profile:
Revenue/Expense/NOR/AOR ($Millions) FY 2009 FY 2010 FY 2011
Revenue $675.9 $680.3 $706.7
Expense 670.7 693.7 711.4
Operating Results $5.2 ‐$13.4 ‐$4.7
Other Changes Affecting AOR ‐3.5 0.0 0.0
Accumulated Operating Results (AOR) $18.2 $4.7 $0.0
Revenue and Expense: The trend in revenue and expense from year to year is relatively
steady; increases are primarily due to inflation and facility maintenance costs.
Operating Results: The favorable Accumulated Operating Results (AOR) are primarily
due to customer requirements in higher average rate work categories. The FY 2011 rate
is established to achieve an end‐of‐year AOR of zero.
Collections/Disbursements/Outlays ($Millions)
FY 2009
FY 2010 FY 2011
Collections $672.6 $702.1 $705.9
Disbursements 663.1 698.8 719.9
Outlays ‐$9.5 ‐$3.3 $14.0
Fluctuations in Net Outlays primarily reflect the timing of end‐of‐year billings and the
impact of operating results, discussed above.
Workload:
Reimbursable Orders ($Millions) FY 2009 FY 2010 FY 2011
Current Estimate $698.0 $675.3 $699.2
Major NRL customers include the Office of Naval Research, the Naval Sea Systems
Command, the Naval Air Systems Command, the Space and Naval Warfare Systems
Command, the Defense Advanced Research Projects Agency, Naval Warfare Centers,
the Army, the Air Force, other Navy and Department of Defense customers, the

NAVAL RESEARCH LABORATORY
FISCAL YEAR (FY) 2011 BUDGET ESTIMATES
FEBRUARY 2010
Department of Energy, the National Aeronautics and Space Administration, and the
Department of Homeland Security.
Direct Labor Hours (000) FY 2009 FY 2010 FY 2011
Current Estimate 2,791 2,767 2,767
A conservative and steady workforce profile is projected for FY 2010 through FY 2011
given the relatively consistent customer funding plans.
Performance Indicators:
The primary performance indicator is unit cost.
Unit Cost FY 2009 FY 2010 FY 2011
Total Stabilized Cost ($M) $372.4 $388.8 $401.8
Workload (DLHs) (000) 2,790 2,767 2,767
Unit cost (per DLH) $133.42 $140.55 $145.23
The unit cost is a measurement of total direct labor and overhead costs per direct labor
hour. The change in unit cost for FY 2009 through FY 2011 primarily reflects increases
for annual inflation/price changes from year to year. Other performance indicators are
direct labor hours and operating results, discussed above.
Stabilized / Composite Rates FY 2009 FY 2010 FY 2011
Stabilized Rate $126.33 $135.51 $143.52
Change from Prior Year +7.27% +5.91%
Composite Rate Change +4.56% +3.93%
The Stabilized Rate consists of direct labor and applied overhead. Unique direct non‐
labor costs are billed on a reimbursable basis to the benefiting/requiring customer. The
Composite Rate Change incorporates both the stabilized costs and the reimbursable
costs. The FY 2011 rate increase is primarily due to pricing/inflation adjustments, an
increase in facility maintenance costs and a reduction in AOR payback.
Staffing:
Civilian/Military ES & Workyears FY 2009 FY 2010 FY 2011
Civilian End Strength 2,415 2,357 2,357
Civilian Workyears (Straight Time) 2,301 2,301 2,301
Military End Strength 69 67 69
Military Workyears 69 67 69

NAVAL RESEARCH LABORATORY
FISCAL YEAR (FY) 2011 BUDGET ESTIMATES
FEBRUARY 2010
Civilian Personnel: Civilian strength levels, measured by both end strength and full‐
time equivalents (FTEs), reflect a steady workforce.
Military Personnel: Military personnel levels remain relatively steady in the budget
years.
Capital Investment Program (CIP) Budget Authority:
Capital Investment Program ($Millions) FY 2009 FY 2010 FY 2011
Equipment, Non‐ADPE / Telecom $10.7 $9.3 $9.6
Equipment, ADPE / Telecom 0.8 2.3 3.0
Software Development 0.0 0.0 0.0
Minor Construction 1.9 2.8 2.0
Total $13.4 $14.3 $14.5
This CIP plan provides a modest investment level that allows NRL to acquire needed
technology to maintain a state‐of‐the‐art facility to fulfill science and technology mission
areas supporting the DoN, DoD, and related customer programs.

NAVAL RESEARCH LABORATORY
FISCAL YEAR (FY) 2011 BUDGET ESTIMATES
FEBRUARY 2010
Carryover Compliance:
Carryover ($Millions) FY 2009 FY 2010 FY 2011
New Orders $698.0 $675.3 $699.2
Less Exclusions:
Foreign Military Sales 1.9 0.9 1.0
Base Realignment and Closure 0.0 0.0 0.0
Other Federal Departments & Agencies 66.3 68.2 74.8
Non‐Federal Agencies & others 7.3 4.5 4.6
Major Range & Test Facility Base 0.0 0.0 0.0
Orders for Carryover Calculation* $622.5 $601.7 $618.9
Composite Outlay Rate 55.1% 54.6% 54.5%
Carryover Ceiling Rate 44.9% 45.4% 45.5%
Carryover Ceiling $279.8 $273.4 $281.5
Balance of Customer Orders at Year End $276.8 $271.8 $264.4
Less Work‐in‐Process 0.2 0.2 0.2
Less Exclusions
Foreign Military Sales 1.6 0.7 0.5
Base Realignment and Closure 0.0 0.0 0.0
Other Federal Departments & Agencies 40.3 31.0 28.8
Non‐Federal Agencies & Others 5.3 2.8 2.0
Major Range & Test Facility Base 0.0 0.0 0.0
Carryover Budget* $229.4 $237.1 $232.9
Budgeted carryover is within the ceiling allowed via published outlay rates.
*Note: Totals may not add due to rounding.

xxxxxxxxxXxxxxxxxxxXxxxxxxxxxXxxxxxxxxxXxxxxX xx,xxx,xxx,xxx xx,xxx,xxx,xxx xx,xxx,xxx,xxx
FY 2009 FY 2010 FY 2011
Operations 658.0 664.8 690.7 Surcharges 3.5 - - Depreciation excluding Major Construction 14.4 15.5 16.0
Total Income 675.9 680.3 706.7
Military Personnel 3.2 4.0 4.4 Civilian Personnel 296.4 303.6 308.9 Travel and Transportation of Personnel 11.1 9.2 9.3 Material & Supplies (Internal Operations) 36.7 36.7 36.2 Equipment 29.1 25.8 26.2 Other Purchases from NWCF 14.2 15.0 15.3 Transportation of Things 1.3 1.5 1.5 Depreciation - Capital 14.4 15.5 16.0 Printing and Reproduction 0.1 0.1 0.1 Advisory and Assistance Services - - - Rent, Communication & Utilities 28.0 28.2 28.6 Other Purchased Services 236.1 254.1 265.0 Total Expenses 670.6 693.7 711.4
Work in Process Adjustment 0.1 - - Comp Work for Activity Retention Adjustment - - - Cost of Goods Sold 670.7 693.7 711.4
Operating Result 5.2 (13.4) (4.7)
Less Surcharges (3.5) - - Plus Appropriations Affecting NOR/AOR - - - Other Changes Affecting NOR/AOR - - - Extraordinary Expenses Unmatched - - -
Net Operating Result 1.8 (13.4) (4.7)
Other Changes Affecting AOR - - -
Accumulated Operating Result 18.2 4.7 -
Revenue and ExpensesDepartment of the NavyResearch and DevelopmentNaval Research Laboratory
Exhibit Fund-14, Revenue and Expenses
Revenue: Gross Sales
Other Income
Expenses Cost of Materiel Sold from Inventory
Fiscal Year (FY) 2011 Budget Estimates
Salaries and Wages:
February 2010($ in Millions)

xxxxxxxxxXxxxxxxxxxXxxxxxxxxxXxxxxxxxxxXxxxxX xx,xxx,xxx,xxx xx,xxx,xxx,xxx xx,xxx,xxx,xxx
FY 2009 FY 2010 FY 2011------- ------- -------
1. New Orders 698.0 675.3 699.2
a. Orders from DoD Components: 613.4 593.6 610.4
Department of the Navy 418.9 429.2 444.8 O & M, Navy 18.6 17.3 16.7 O & M, Marine Corps 0.5 0.5 0.4 O & M, Navy Reserve - - - O & M, Marine Corp Reserve - - - Aircraft Procurement, Navy 0.8 1.1 1.1 Weapons Procurement, Navy - - - Ammunition Procurement, Navy/MC - - - Shipbuilding & Conversion, Navy 1.4 1.4 1.4 Other Procurement, Navy 1.0 1.9 2.0 Procurement, Marine Corps 0.6 0.4 0.4 Family Housing, Navy/MC - - - Research, Dev., Test, & Eval., Navy 395.9 406.8 422.8 Military Construction, Navy - - - National Defense Sealift Fund - - - Other Navy Appropriations - - - Other Marine Corps Appropriations - - -
Department of the Army 33.0 9.8 7.5 Army Operation & Maintenance 25.5 0.5 0.5 Army Res, Dev, Test, Eval 4.0 3.8 3.9 Army Procurement 0.5 0.5 0.5 Army Other 3.0 5.0 2.6
Department of the Air Force 49.2 52.6 54.5 Air Force Operation & Maintenance 2.1 1.8 1.9 Air Force Res, Dev, Test, Eval 40.6 39.8 41.3 Air Force Procurement 6.5 10.9 11.3 Air Force Other - 0.1 0.1
DOD Appropriation Accounts 112.2 102.0 103.6 Base Closure & Realignment - - - Operation & Maintenance Accounts 8.0 3.5 2.8 Res, Dev, Test & Eval Accounts 102.1 94.0 96.5 Procurement Accounts 0.6 3.1 2.8 Defense Emergency Relief Fund - - - DOD Other 1.5 1.4 1.5
b. Orders from other Fund Activity Groups 9.1 8.1 8.4
c. Total DoD 622.5 601.7 618.9
d. Other Orders: 75.5 73.6 80.4 Other Federal Agencies 66.3 68.2 74.8 Foreign Military Sales 1.9 0.9 1.0 Non Federal Agencies 7.3 4.5 4.6
2. Carry-In Orders 254.8 276.8 271.8
3. Total Gross Orders 952.7 952.1 971.1
a. Funded Carry-Over before Exclusions 276.8 271.8 264.4
b. Total Gross Sales 675.9 680.3 706.7
4. End of Year Work-In-Process (-) (0.2) (0.2) (0.2)
5. Non-DoD, BRAC, FMS, Inst. MRTFB (-) (47.2) (34.5) (31.3)
6. Net Funded Carryover 229.4 237.1 232.9
Exhibit Fund-11, Sources of Revenue
Sources of RevenueDepartment of the Navy
Research and DevelopmentNaval Research Laboratory
Fiscal Year (FY) 2011 Budget EstimatesFebruary 2010
($ in Millions)
Note: Line 4 (End of Year Work-In-Process) is adjusted for Non-DOD, BRAC, FMS, and Institutional MRTFB

Total Costs
FY 2009 Actual 670.6$
FY 2010 Estimate in FY 2010 Presidentʹs Budget: 686.1$
Pricing Adjustments:
General Purchase Inflation (0.3)
Program Changes:
Decreased Depreciation Cost (1.0)
Decreased Defense Finance and Accounting Service Costs (0.2)
Increase in Capital Purchases Below the CIP Threshold 1.0
Increased Service Cost Center Workload 3.5
Increased Facility Maintenance 4.0
Other 0.6
FY 2010 Current Estimate: 693.7$
Pricing Adjustments:
Civilian Personnel Pay Raise
Impact of 2011 Pay Raise 3.7
Annualization of Prior Year Pay Raise 1.5
Military Personnel Pay Raise
Impact of 2011 Pay Raise 0.1
Annualization of Prior Year Pay Raise ‐
Working Capital Fund Price Changes 0.1
General Purchases Inflation 5.1
Program Changes:
Decrease in non‐CIP equipment (1.1)
Military Personnel 0.3
Additional Depreciation Cost 0.5
Increased Facility Maintenance 7.4
Other 0.1
FY 2011 Current Estimate: 711.4$
*Note: Totals may not add due to rounding.
Changes in the Cost of Operations
Fiscal Year (FY) 2011 Budget Estimates
($ in Millions)
Department of the Navy
Research and Development/Naval Research Laboratory
February 2010
Exhibit Fund‐2, Changes in the Cost of Operations

Line #
Description
Quantity
Total Cost
Quantity
Total Cost
Quantity
Total Cost
001
Equipment Cap
abilities
‐ Rep
lacement
5$2.388
0$0.000
0$0.000
‐ Productivity
1$0.279
2$0.520
3$1.123
‐ N
ew M
ission
20$8.044
14$8.743
18$8.446
‐ Environmental
0$0.000
0$0.000
0$0.000
$10.711
$9.263
$9.569
002
ADPE and Telecommunications Equipment Cap
abilities
‐ Computer Hardware (Production)
2$0.801
5$1.812
4$2.973
‐ Computer Software (O
perating System
)0
$0.000
0$0.000
0$0.000
‐ Telecommunications
0$0.000
1$0.460
0$0.000
‐ Oth Computer & Telecom Sup Equip.
0$0.000
0$0.000
0$0.000
$0.801
$2.272
$2.973
003
Software Development
Internally Developed
0$0.000
0$0.000
0$0.000
Externally Developed
0$0.000
0$0.000
0$0.000
$0.000
$0.000
$0.000
004
Minor Construction Cap
abilities
‐ Rep
lacement
0$0.000
0$0.000
1$2.000
‐ Productivity
0$0.000
0$0.000
0$0.000
‐ N
ew M
ission
1$1.857
2$2.750
0$0.000
‐ Environmental
0$0.000
0$0.000
0$0.000
$1.857
$2.750
$2.000
Grand Total
29$13.369
24$14.285
26$14.542
Total Capital Outlays
$13.548
$14.285
$14.542
Total Depreciation Expense
$14.372
$15.500
$16.000
$ in Millions
FY 2009
FY 2010
FY 2011
Capital Investment Summary
Department of the Navy
Research and Development / Naval Research Laboratory
February 2010

Dep
artm
ent of the Navy / Research and Development
Naval Research Laboratory
February 2010
Quan
tUnit Cost
Total
Cost
Quan
tUnit Cost
Total
Cost
Quan
tUnit Cost
Total Cost
Productivity
1279
2
520
3
1,123
00
0.000
Total
10
279
2
520
3
‐
1,123
00
0.000
Cap
ital Investm
ent Justification
Fiscal Year (FY) 2011 Budget Estim
ates
($ in Thousands)
February 2010
#001 ‐ Equipment Productivity Cap
ability
NRL
Washington, D
C
Justification:
Equipment Cap
ability
FY 2009
FY 2011
FY 2010
Non‐A
DPE Equipment:
As part of NRLʹs commitment to research, d
evelopment an
d technology, several investm
ents in the productivity cap
ability are proposed for FY 2010 an
d FY 2011. Two projects in FY 2010
will enhan
ce N
RLʹs cap
ability in the areas of high frequency noise im
aging and ion beam nan
ofabrication. In FY 2011, equipment acquisition w
ill support N
avy and DoD programs in the
areas of projection optical lithography, n
on‐destructive/contactless m
easurement of sample resistivity, electron, h
ole m
obility and density; and generic electrical ground equipment used to
interface, sim
ulate and test on‐board spacecraft system
s. P
re‐investm
ent economic analyses were perform
ed for all projects.
Exhibit Fund‐9b Capital Purchase Justification

Dep
artm
ent of the Navy / Research and Development N
aval
Research Laboratory February
2010
Quan
tUnit Cost
Total Cost
Quan
tUnit Cost
Total Cost
Quan
tUnit Cost
Total Cost
Replacement
52,388
00.000
00
Total
50
2,388
00.000
00
0.000
00
0.000
Justification:
#001 ‐ Equipment Rep
lacement Cap
ability
NRL
Washington, D
C
Equipment Cap
ability
FY 2009
FY 2010
FY 2011
Cap
ital Investm
ent Justification
Fiscal Year (FY) 2011 Budget Estim
ates
($ in Thousands)
February 2010
Non‐A
DPE Equipment:
There are no proposed projects in the replacement category for FY 2010 an
d FY 2011.
Exhibit Fund‐9b Capital Purchase Justification

Dep
artm
ent of the Navy / Research and Development
Naval Research Laboratory
February 2010
Quan
tUnit Cost
Total Cost
Quan
tUnit Cost
Total
Cost
Quan
tUnit Cost
Total Cost
New Mission
208,044
148,743
188,446
00.000
Total
200
8,044
140
8,743
180
8,446
00
0.000
#001 ‐ Equipment New M
ission Cap
ability
NRL
Washington, D
C
Justification:
Equipment Cap
ability
FY 2009
FY 2011
FY 2010
Cap
ital Investm
ent Justification
Fiscal Year (FY) 2011 Budget Estim
ates
($ in Thousands)
February 2010
Non‐A
DPE Equipment:
Equipment acquisition in the new m
ission cap
ability for FY 2010 an
d FY 2011 will preserve an
d enhan
ce requirem
ents to m
aintain a technologically advan
ced, state‐of‐the‐art laboratory and
are tied directly to N
RLʹs science and technology m
ission. These include the ʺA
dvan
ced Optical Materials Fabrication Laboratoryʺ project w
hich w
ill provide the ability to characterize a w
ide
range of optical device param
eters critical for the development of ultra‐low‐noise fiber optic sensor system
s. A
dditional investm
ents for all years w
ill be mad
e in the following research areas:
solid state data recording for im
proved ran
ge resolution of radar system
s, photonic true time generation and rem
oting, fiber optic sensor array, laser illumination, d
evelopment of insulators
and oxides for next generation electronics, optical biosensing, tim
e‐ and frequency‐domain m
easurement, x‐ray characterization of nan
o‐dim
ensional m
aterials, thermal conductivity, flash x‐
radiography for nuclear weapon physics studies, m
olecular an
d bio‐m
olecular science and engineering, u
nderwater digital acoustic communications, atomic layer dep
osition synthesis,
nan
ophotonics, m
agnetic m
aterials design and processing, and thermal imaging of semiconductor devices. Pre‐investm
ent economic analyses were perform
ed for all projects.
Exhibit Fund‐9b Capital Purchase Justification

Dep
artm
ent of the Navy / Research and Development
Naval Research Laboratory
February 2010
Quan
tUnit Cost
Total
Cost
Quan
tUnit Cost
Total Cost
Quan
tUnit Cost
Total Cost
Computer Hardware (Production)
2801
51,812
42,973
00.000
Computer Software (Operating System)
00
00
Telecommunications
00
1460
00
00.000
Other Computer & Telecommunications Spt Equipment
00
00
0.000
Total
2801
62,272
42,973
00.000
Justification:
#002 ‐ ADPE and Telecommunications Equipment Cap
abilities
NRL
Washington, D
C
ADPE and Telecommunications Equipment Cap
abilities
FY 2009
FY 2011
FY 2010
Cap
ital Investm
ent Justification
Fiscal Year (FY) 2011 Budget Estim
ates
($ in Thousands)
February 2010
ADPE and Telecommunications Equipment:
Computer Hardware (Production)
Several investm
ents in computer hardware (production) are proposed for FY 2010 an
d FY 2011. In FY 2010, investm
ents w
ill be mad
e in the following research areas: real‐time algorithm
technology to enhan
ce the perform
ance of existing and new N
aval rad
ar system
s; state‐of‐the‐art computing and storage equipment for computationally intensive Maritim
e Domain
Awareness intelligence fusion applications; and implementation of a core fed
erated distributed disk spider cap
able of driving the next plateau of stream
ing data to fill a 100 Gbps wavelength.
In FY 2011, N
RL proposes to invest in graphic processing united‐based clusters which w
ill facilitate the development an
d evaluation of high perform
ance computing hardware; a high‐speed
signal processing system to support base program projects an
d sponsor‐funded efforts; and a high perform
ance content storage an
d delivery system at each of NRLʹs locations to provide the
environment to accomplish research in architecture and distributed scaling in data han
dling; and a high perform
ance computing system that w
ill include Message Passing Interface
technology that is currently in use at DoD operational data processing sites. The proposed end results will im
prove NRLʹs functionality, p
erform
ance, cap
acity, efficiency, security, standards
complian
ce, m
anageability, and m
aintainability as related to ongoing research and development efforts. P
re‐investm
ent economic analyses were perform
ed for all projects.
Telecommunications
One investm
ent in telecommunications is proposed in FY 2010. In FY 2010, N
RL w
ill invest in w
ideban
d code division m
ultiple access (W
CDMA), an emerging w
orldwide cellular stan
dard
that w
ill be increasingly employed by the Navy and throughout DoD. Access to a W
CDMA cellular testbed w
ill enhan
ce the research efforts of Tactical Electronic W
arfare in the following
areas: M
ulti‐Platform Communication Electronic Attack, O
ptimized Communication Electronic Attack, and Communications Specific Emitter Identification. Additionally, this cap
ability w
ill
be utilized in support of six operational DoD comman
ds that look to N
RL for ad
van
ced communications vulnerability research. A pre‐investm
ent economic analyses was perform
ed for this
project.
Exhibit Fund‐9b Capital Purchase Justification

Dep
artm
ent of the Navy / Research and Development
Naval Research Laboratory
February 2010
Quan
tUnit Cost
Total Cost
Quan
tUnit Cost
Total Cost
Quan
tUnit CostTotal Cost
Replacement
12,000
Productivity
New Mission
11,857
22,750
Environmental
Total
11,857
22,750
12,000
00.000
Justification:
Cap
ital Investm
ent Justification
Fiscal Year (FY) 2011 Budget Estim
ates
($ in Thousands)
February 2010
#004 ‐ M
inor Construction Cap
abilities
NRL
Washington, D
C
Minor Construction Cap
abilities
FY 2009
FY 2011
FY 2010
Minor Construction:
REPLACEMENT
The FY 2011 investm
ent of $2.000M is for the ʺEpicenter Addition.ʺ T
his facility w
ill house equipment an
d includes ultra‐high‐vacuum system
s for ep
itaxy film growth and analysis. T
he
present system is in an advan
ced state of deterioration and w
ill negatively impact the use of the facility w
ithin five years. There exists no feasible alternative that w
ill allow uninterrupted
operation of the Epicenter. T
he proposed project is considered the most viable option becau
se it meets the necessary requirem
ents for continued successful operation of the Epicenter. A pre‐
investm
ent economic analysis was perform
ed.
NEW MISSION
Two new m
ission investm
ents are proposed for FY 2010. N
RL proposes a $2.000M investm
ent in FY 2010 for ʺO
ptical Physics Facility M
odifications.ʺ This investm
ent will facilitate the
conversion of existing space into usable laboratories as related to optical devices, optical materials, and optical phenomena. A
n alternative to lease space for the above purpose is not cost
effective an
d w
ill greatly exceed the proposed cost and w
ould pose logistics and security problems.
An FY 2010 purchase will be mad
e for 87 acres of land surrounding the NRL Pomonkey field site that has recently been proposed for commercial development. N
RL operates a 30 meter all‐
sky tracking antenna an
d several smaller an
tennas on the Pomonkey Free Space Antenna Ran
ge in Charles County, M
D. These an
tennas have been and w
ill continue to be utilized for
urgent an
d m
ission critical tasks im
portan
t to N
ational Defense. Minim
izing m
an‐m
ade electronic interference is critical to the operation of the sensitive receivers using the an
tennas;
development would adversely affect the radio‐quiet mission‐essential environment existent at the site. Pre‐investm
ent economic analyses were perform
ed for both projects.
Exhibit Fund‐9b Capital Purchase Justification

PROJECTS ON THE FY 2010 PRESIDENT'S BUDGET
Approved Approved Current Asset/ Explanation/FY Project Reprogs Proj Cost Proj Cost Deficiency Reason for Change
2010 Equipment except ADPE and TELECOM -0.356 9.619 9.263 0.356 1/
2010 Equipment - ADPE and TELECOM -0.621 2.893 2.272 0.621 1/
2010 Software Development 0.000 0.000 0.000 0.000
2010 Minor Construction 0.750 2.000 2.750 -0.750 2/
Total FY 2010 Capital Purchase Program -0.227 14.512 14.285 0.227
1/ Canceled multiple projects to fund higher priority projects2/ FY 2011's "Pomonkey Land Purchase" project accelerated to FY 2010 to prevent acquisition by commercial developers.
($ in Millions)
(Dollars in Millions)
Capital Budget ExecutionDepartment of the Navy
Research and Development/Naval Research LaboratoryFiscal Year (FY) 2011 Budget Estimates
February 2010
FY 2010

Military Sealift Command

DEPARTMENT OF THE NAVY
TRANSPORTATION
MILITARY SEALIFT COMMAND
FISCAL YEAR (FY) 2011 BUDGET ESTIMATES
February 2010
Mission Statement / Overview
The Military Sealift Command (MSC) is the single manager‐operating agency for sealift services. MSC
operates as a Working Capital Fund (WCF) in two separate entities. This submission addresses MSC’s
Navy mission funded by the Navy Working Capital Fund (NWCF), providing support to the Fleet
Commanders (FLTCOMs) and other DOD activities by providing unique vessels and programs. The
second mission, providing sealift support for DOD cargoes in peacetime, is accomplished through the
Transportation Working Capital Fund (TWCF) under the auspices of the US Transportation
Command (TRANSCOM). Ship availability for MSC customers is the metric for evaluating mission
performance in the sealift transportation business area.
Fuel purchases are one of MSC’s largest expenses. As such any change in fuel prices will have an
impact on MSC’s cost of operations, cash balances, and eventually impact MSC customers through
rate changes.
Activity Group Composition:
MSC supports the Fleet Commanders for Pacific and Atlantic Fleets (Commander Pacific Fleet
(COMPACFLT) and United States Fleet Forces Command (USFFC), the Naval Sea Systems Command
(NAVSEA), the Space and Naval Warfare Systems Command (SPAWAR), the Strategic Systems
Programs (DIRSSP), the US Air Force, and the National Defense Sealift Fund (NDSF) with unique
vessels and programs. The Maritime Prepositioning Ships (MPS) Restructuring effort began in
FY 2006. This effort is to balance sealift requirements with Navy‐owned and chartered assets to
effectively meet sealift demand including the purchase of MPS ships. One ship will be purchased in
FY 2010. All ships were procured with National Defense Sealift Fund (NDSF) resources. In addition,
three chartered ships will be terminated in FY 2009 and no terminations are scheduled for FY 2010 or
FY 2011.
The three programs budgeted through the Navy Working Capital Fund (NWCF) are:
1. Naval Fleet Auxiliary Force (NFAF): Provides support utilizing civilian mariner manned non‐
combatant ships for material support and ocean going tugs.
2. Special Mission Ships (SMS): Provides unique seagoing platforms, operation of Navy Command
Ships, and contracted Harbor Tugs.
3. Afloat Propositioning Force ‐ Navy (APF‐N): Deploys advance materiel for strategic lifts for the
Marine Expeditionary Forces.

DEPARTMENT OF THE NAVY
TRANSPORTATION
MILITARY SEALIFT COMMAND
FISCAL YEAR (FY) 2011 BUDGET ESTIMATES
February 2010
Significant Changes FY 2010 to FY 2011:
NFAF – A full year operating status for T‐AKE 10 USNS CHARLES DREW and T‐AKE 11 USNS
WASHINGTON CHAMBERS will be executed which is offset by the deactivation of T‐AE 32 USNS
FLINT, T‐AE 35 USNS KISKA and T‐AE 34 USNS MOUNT BAKER and T‐AFS SAN JOSE.
SMS – One TAGS‐60 Class will be deactivated as well as the TIME CHARTER Ship CAROLYN
CHOUEST.
APF‐N– A full year of operation for all three LMSR Ships as well as the activation of T‐AKE‐12 USNS
WILLIAM MCLEAN.
Financial Profile:
Revenue/Expense/NOR/AOR ($M) FY 2009 FY 2010 FY 2011
Revenue $2,367.9 $2,715.0 $2,654.4
Expense $2,438.2 $2,766.4 $2,740.3
Operating Results ‐$70.3 ‐$51.4 ‐$85.9
Other Changes Affecting AOR
Accumulated Operating Results (AOR) $137.3 $85.9 $0
Revenue and Expense: The changes in revenue and expense from year to year are primarily
associated with the MPS Restructuring.
Operating Results: The FY 2010 President’s Budget reflected an NOR of $7.3M vice the current
estimate of ‐$51.4M for FY 2010. The less favorable result is primarily due to Overhaul Schedule
Changes and Alterations.
The FY 2010 prices for fuel in this submission are calculated using the current fuel composite rate of
$118.02 per barrel versus the FY 2010 Presidentʹs Budget rate of $89.46. This will result in a projected
revenue shortfall of $124.719M; $107.971M of this amount is being requested as a direct Working
Capital Fund (WCF) appropriation in the FY 2010 supplemental and the remainder will be handled
from either WCF cash balances or through an additional customer surcharge.

DEPARTMENT OF THE NAVY
TRANSPORTATION
MILITARY SEALIFT COMMAND
FISCAL YEAR (FY) 2011 BUDGET ESTIMATES
February 2010
Collections/Disbursements/Outlays
($M)
FY 2009 FY 2010 FY 2011
Collections $2,418.0 $2,715.0 $2,654.4
Disbursements $2,474.5 $2,768.4 $2,707.9
Outlays $56.5 $53.4 $53.5
Collections: FY 2009 reflects actual revenue including the rate changes that became effective 1 April
due to the reduction in fuel prices. FY 2010 and FY 2011 reflect expected revenue based on current
estimates.
Disbursements: This represents budgeted expense as modified by MPS principal payments and
Capital Investment Program (CIP) outlays. FY 2010 EOY Cash is estimated to be $43M and FY 2011
‐$45M.
Workload:
FY 2009 FY 2010
FY 2011
NFAF 14,925 14,983 14,712
SMS 18,130 19,073 17,996
APF‐N 5,244 6,753 6,993
Workload for MSC refers to the number of per diem days associated with each of the three MSC
programs.
NFAF increases in FY 2010 are associated with the activation of T‐AKE 9 USNS MATTHEW PERRY
and T‐AKE 10 USNS CHARLES DREW which is offset by the deactivation of T‐AFS 5 USNS
CONCORD, T‐AFS 10 USNS SATURN, and T‐AFS 7 USNS SAN JOSE. The SMS increase in FY 2010
is due to the transition to four new Off shore Service Vessel (OSV) ships to replace the current leased
ships, and the inclusion of one Motor Vessel ship and one sub‐tender. The APF‐N increase in
FY 2010 over FY 2009 is also due to the MPS restructuring which includes three LMSR ships, a tanker
ship and a container ship. In addition to the MPS restructuring (resulting in the termination of three
Maersk ships in FY 2009), an increase to reflect the lease of two HSVs is reflected beginning in FY
2010.
NFAF decreases in FY 2011 are associated with T‐AKE 10 USNS CHARLES DREW and T‐AKE USNS
WASHINGTON CHAMBERS which is offset by the deactivation of T‐AE 32 USNS FLINT, T‐AE 35
USNS KISKA and T‐AE 34 USNS MOUNT BAKER. The SMS decreases in FY 2011 are due to the
deactivation of one TAGS‐60 Class and deactivation of the TIME CHARTER Ship CAROLYN
CHOUEST. The APF‐N increase in FY 2011 reflects a full year of operation for all three LMSR Ships
as well as the activation of T‐AKE‐12.

DEPARTMENT OF THE NAVY
TRANSPORTATION
MILITARY SEALIFT COMMAND
FISCAL YEAR (FY) 2011 BUDGET ESTIMATES
February 2010
Reimbursable Orders ($M) FY 2009 FY 2010 FY 2011
Current Estimate $2,445.2 $2,715.0 $2,654.4
Orders for MSC equate to revenue. Variances are due to changes in per diem days, fuel price
changes, and requirement to attain zero AOR in FY 2011.
Direct Labor Hours (000) FY 2009 FY 2010 FY 2011
Current Estimate 11,832 12,844 12,276
Direct labor hours refer to Civilian Mariners (CIVMARS) only. Variances across fiscal years are due
to the addition of T‐AS 40 USS FRANK CABLE, annualization of ships coming on board e.g. T‐AKEs
and deactivations e.g. T‐AE 32 USNS FLINT and T‐AFS 9 USNS SPICA, and reduction for afloat
distance program.
Performance Indicators:
Program Performance is measured by “ship availability days,” which measures days against plan that
ships are actually available to perform the function for which they were intended. Any change in
ship operation such as FOS to ROS, transitioning ships between coasts, or changing ship status
(e.g., from R0S‐15 days, ROS‐30 days or ROS‐45 days) are coordinated with the respective MSC
customer.
A summary of performance goals is reflected below:
Performance Measure Goal FY 2009 FY 2010 FY 2011
Ship Availability 95% 95% 95% 95%
Unit Cost FY 2009 FY 2010 FY 2011
NFAF 85,769 96,603 105,044
SMS 19,840 24,422 26,595
APF‐N 61,117 66,756 71,858
MSC operates under three distinct unit cost goals ‐ one for each of the programs. All programs have
cost/per day as the unit cost basis (costs include only per diem expenses in the annual operating
budget (AOB) as per OSD guidelines.) Ship mix – e.g. class of ships and operating status, impacts
unit cost levels. Changes in all years are primarily a function of approved escalation, fuel, CIVMAR
salaries, ship mix, Capital Hire, and M&R.
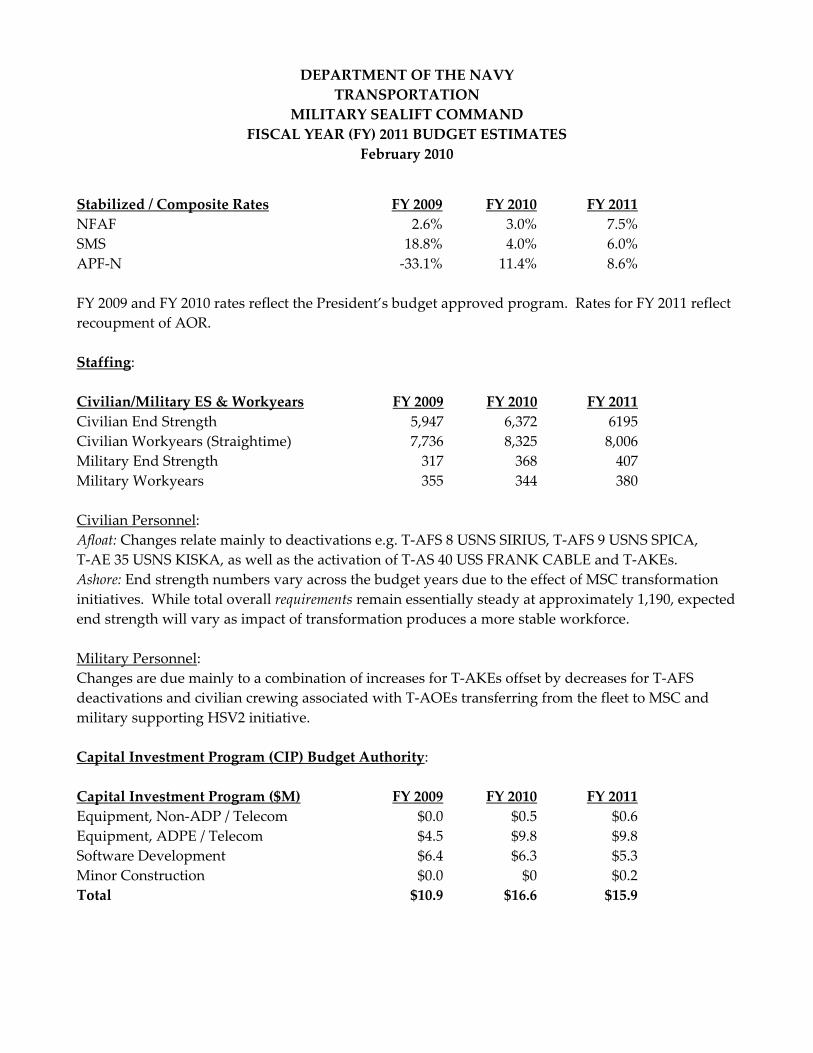
DEPARTMENT OF THE NAVY
TRANSPORTATION
MILITARY SEALIFT COMMAND
FISCAL YEAR (FY) 2011 BUDGET ESTIMATES
February 2010
Stabilized / Composite Rates FY 2009 FY 2010 FY 2011
NFAF 2.6% 3.0% 7.5%
SMS 18.8% 4.0% 6.0%
APF‐N ‐33.1% 11.4% 8.6%
FY 2009 and FY 2010 rates reflect the President’s budget approved program. Rates for FY 2011 reflect
recoupment of AOR.
Staffing:
Civilian/Military ES & Workyears FY 2009 FY 2010 FY 2011
Civilian End Strength 5,947 6,372 6195
Civilian Workyears (Straightime) 7,736 8,325 8,006
Military End Strength 317 368 407
Military Workyears 355 344 380
Civilian Personnel:
Afloat: Changes relate mainly to deactivations e.g. T‐AFS 8 USNS SIRIUS, T‐AFS 9 USNS SPICA,
T‐AE 35 USNS KISKA, as well as the activation of T‐AS 40 USS FRANK CABLE and T‐AKEs.
Ashore: End strength numbers vary across the budget years due to the effect of MSC transformation
initiatives. While total overall requirements remain essentially steady at approximately 1,190, expected
end strength will vary as impact of transformation produces a more stable workforce.
Military Personnel:
Changes are due mainly to a combination of increases for T‐AKEs offset by decreases for T‐AFS
deactivations and civilian crewing associated with T‐AOEs transferring from the fleet to MSC and
military supporting HSV2 initiative.
Capital Investment Program (CIP) Budget Authority:
Capital Investment Program ($M) FY 2009 FY 2010 FY 2011
Equipment, Non‐ADP / Telecom $0.0 $0.5 $0.6
Equipment, ADPE / Telecom $4.5 $9.8 $9.8
Software Development $6.4 $6.3 $5.3
Minor Construction $0.0 $0 $0.2
Total $10.9 $16.6 $15.9

DEPARTMENT OF THE NAVY
TRANSPORTATION
MILITARY SEALIFT COMMAND
FISCAL YEAR (FY) 2011 BUDGET ESTIMATES
February 2010
Information Technology (IT/ADP) efforts represent the predominant share of CIP costs. These efforts
include migration to a paperless environment; secure storage of engineering materials, ADPE for
Shipboard local area networks (LANs), systems development efforts – e.g. mandated travel system,
financial management system, and Next Generation Wideband. Non‐IT equipment reflects
requirement to replace HVAC at MSC Headquarters

FY 2009 FY 2010 FY 2011
Operations 2,357.7 2,702.8 2,642.4
Surcharges 0.0 0.0 0.0
Depreciation excluding Major Construction 10.2 12.2 12.0
Total Income 2,367.9 2,715.0 2,654.4
Military Personnel 24.2 23.7 26.4
Civilian Personnel 632.0 686.5 675.5
Travel and Transportation of Personnel 21.4 22.7 27.2
Material & Supplies (Internal Operations) 391.7 569.1 602.9
Equipment 80.3 73.3 68.3
Other Purchases from NWCF 1.5 1.4 1.3
Transportation of Things 8.4 8.6 8.4
Depreciation ‐ Capital 10.2 12.2 12.0
Printing and Reproduction 0.7 0.4 0.4
Advisory and Assistance Services 0.2 0.3 0.3
Rent, Communication & Utilities 562.3 587.0 543.9
Other Purchased Services 705.3 781.1 773.8
Total Expenses 2,438.2 2,766.4 2,740.3
Work in Process Adjustment 0.0 0.0 0.0
Comp Work for Activity Retention Adjustment 0.0 0.0 0.0
Cost of Goods Sold 2,438.2 2,766.4 2,740.3
Operating Result ‐70.4 ‐51.4 ‐86.0
Less Surcharges 0.0 0.0 0.0
Plus Appropriations Affecting NOR/AOR 0.0 0.0 0.0
Other Changes Affecting NOR/AOR 0.0 0.0 0.0
Extraordinary Expenses Unmatched 0.0 0.0 0.0
Net Operating Result ‐70.4 ‐51.4 ‐86.0
Other Changes Affecting AOR 0.0 0.0 0.0
Accumulated Operating Result 137.3 86.0 0.0
Revenue and Expenses
Department of the Navy
Transportation ‐ Military Sealift Command
Fiscal Year (FY) 2011 Budget Estimates
February 2010
$ in Millions
Revenue:
Gross Sales
Other Income
Expenses
Cost of Materiel Sold from Inventory
Salaries and Wages:
Exhibit Fund‐14 Expense

FY 2009 FY 2010 FY 2011
1. New Orders 2,445.2 2,715.0 2,654.4
a. Orders from DoD Components: 2,384.4 2,651.9 2,579.2
Department of the Navy 2,319.9 2,584.1 2,521.6
O & M, Navy 2,056.6 2,448.8 2,450.2
O & M, Marine Corps ‐0.2 19.4 23.9
O & M, Navy Reserve 0.0 0.0 0.0
O & M, Marine Corp Reserve 0.0 0.0 0.0
Aircraft Procurement, Navy 0.0 0.0 0.0
Weapons Procurement, Navy 0.0 0.0 0.0
Ammunition Procurement, Navy/MC 0.0 0.0 0.0
Shipbuilding & Conversion, Navy 0.0 0.0 0.0
Other Procurement, Navy 5.1 4.5 0.5
Procurement, Marine Corps 0.0 0.0 0.0
Family Housing, Navy/MC 0.0 0.0 0.0
Research, Devevelopment, Test, & Evaluation, Navy 1.2 0.0 0.0
Military Construction, Navy 0.0 0.0 0.0
National Defense Sealift Fund 0.0 111.5 47.2
Other Navy Appropriations 257.1 0.0 0.0
Other Marine Corps Appropriations 0.0 0.0 0.0
Department of the Army 1.0 0.0 0.0
Army Operation & Maintenance 1.0 0.0 0.0
Army Research, Development, Test & Evaluation 0.0 0.0 0.0
Army Procurement 0.0 0.0 0.0
Army Other 0.0 0.0 0.0
Department of the Air Force 45.3 48.8 38.5
Air Force Operation & Maintenance 45.3 48.8 38.5
Air Force Research, Development, Test & Evaluation 0.0 0.0 0.0
Air Force Procurement 0.0 0.0 0.0
Air Force Other 0.0 0.0 0.0
DOD Appropriation Accounts 18.2 19.1 19.0
Base Closure & Realignment 0.0 0.0 0.0
Operation & Maintenance Accounts 17.9 0.0 0.0
Research, Development, Test & Evaluation Accounts 0.3 0.0 0.0
Procurement Accounts 0.0 0.0 0.0
Defense Emergency Relief Fund 0.0 0.0 0.0
DOD Other 0.0 19.1 19.0
b. Orders from other Fund Activity Groups 56.0 63.1 75.2
c. Total DoD 2,440.4 2,715.0 2,654.4
d. Other Orders: 4.8 0.0 0.0
Other Federal Agencies 4.0 0.0 0.0
Foreign Military Sales 0.1 0.0 0.0
Non Federal Agencies 0.8 0.0 0.0
2. Carry‐In Orders 334.9 412.3 412.3
3. Total Gross Orders 2,780.2 3,127.3 3,066.6
a. Funded Carry‐Over before Exclusions 412.3 412.3 412.3
b. Total Gross Sales 2,367.9 2,715.0 2,654.4
4. End of Year Work‐In‐Process (‐) 0.0 0.0 0.0
5. Non‐DoD, BRAC, FMS, Inst. MRTFB (‐) ‐2.0 ‐2.0 ‐2.0
6. Net Funded Carryover 410.3 410.3 410.3
February 2010
$ in Millions
Sources of New Orders & Revenue
Department of the Navy
Transportation ‐ Military Sealift Command
Fiscal Year (FY) 2011 Budget Estimates
Exhibit Fund‐11 Sources of Revenue
Note: Line 4 (End of Year Work‐In‐Process) is adjusted for Non‐DOD BRAC, FMS, and Institutional MRTFB

Changes in the Cost of OperationsDepartment of the Navy
Transportation - Military Sealift CommandFiscal Year (FY) 2011 Budget Estimates
February 2010$ in Millions Total
Expenses1. FY 2009 Actual Execution 2,438.2
2. FY 2010 Estimate in FY2009 President's Budget: 2,608.9
3. Pricing Adjustments: 123.4 a. Change in FY 2009 Fuel Price Asummptions 124.7 b. Change in FY 2009 General Inflation Assumptions -1.3
4. Program Changes: 34.5 a. MPF Restructure -44.0 b. Increased Port and Canal cost 1.6 c. Increased OPTEMPO 0.1 d. Overhauls 36.2 e. Contract Re-compete Changes 17.8 g. Sub-Tender ELSP Changes -6.8 h. Sea-Band Communications for the TAGs 1.0 i. T-AKE Schedule Delivery Schedule Changes -8.0 j. Eliminate 25 days FOS for Hospital Ships -1.0 k. ROS to FOR Status for the SIOUX 2.6 l. Contract Services for HSV4 35.0
5. Other Changes: -0.4 a. Other Miscellaneous Adjustments -0.4
6. FY 2010 Current Estimate: 2,766.4
7. Pricing Adjustments: 81.4 a. FY 2011 Pay Raise 7.9 (1) Civilian Personnel 7.1 (2) Military Personnel 0.8 b. Annualization of Prior Year Pay Raises 9.2 (1) Civilian Personnel 9.2 (2) Military Personnel 0.0 c. Fuel 40.2 d. Working Capital Fund Price Changes 0.0 e. General Purchase Inflation 24.1
8. Program Changes: -107.5 a. T-AKE Pre-Delivery 4.0 b. Overhauls -64.5 c. Helo Shelter 8.2 d. Sub-Tender Operational Costs -1.4 e. Deactivation of 1 METOC Ship -9.8 f. MPS Restructure -44.0
9. FY 2011 Estimate: 2,740.3
Exhibit Fund 2 Changes in the Cost of Operations

Department of the Navy Transportation - Military Sealift Command
Fiscal Year (FY) 2011 Budget Estimates February 2010 9a Exhibit: Activity Group Capital Investment Summary
($ in Millions)
FY 2009 FY 2010 FY 2011
Line Item Total Total TotalNumber Description Qty Cost Qty Cost Qty Cost
Equipment 001 Replacement
Productivity 002 New Mission 0.0 1 0.5 1 0.6
Environmental Compliance
ADPE & Telecomm Computer Hardware (Production)
003 LAN 1 4.5 2 9.3 2 9.3 Computer Software (Operating) 0.0 1 0.5 1 0.5 Telecommunications Other Communications and Telecommunications Support Equipment
Software Development 004 Systems 2 3.9 2 3.3 2 3.3005 HRMS 1 2.5 1 3.0 1 2.0
Minor Construction Replacement Productivity
006 New Mission 1 0.2 Environmental Compliance
Grand Total 4 10.9 7 16.6 8 15.9
Total Capital Outlays 9.9 14.2 14.6
Total Depreciation Expense 10.2 12.2 12.0
Exhibit Fund-9A Capital Investment Summary

AC
TIVI
TY G
RO
UP
CA
PITA
L IN
VEST
MEN
T JU
STIF
ICA
TIO
N
(Dol
lars
in T
hous
ands
)
Fisc
al Y
ear (
FY) 2
011
Bud
get E
sim
ates
Feb
ruar
y 20
10
Mili
tary
Sea
lift C
omm
and/
Tran
spor
tatio
n/ F
ebru
ary
2010
0
02E
quip
men
t
Mili
tary
Sea
lift C
omm
and
FY
200
9
FY
201
0
FY
201
1
Uni
t
Tot
al
U
nit
T
otal
Uni
t
Tot
al
EQ
UIP
MEN
T
Qty
C
ost
C
ost
Q
ty
Cos
t
Cos
t
Qty
C
ost
C
ost
HV
AC
1
50
0
500
1
60
0
600
T
otal
0
0
1
50
0
1
60
0
Nar
rativ
e Ju
stifi
catio
n:
Cur
rent
uni
ts a
re o
ld a
nd re
quire
con
stan
t rep
air.
The
cur
rent
pro
file
prov
ides
for r
epla
cem
ent o
f un
its in
two
build
ings
in th
e W
ashi
ngto
n, D
C a
rea.

A
CTI
VITY
GR
OU
P C
API
TAL
INVE
STM
ENT
JUST
IFIC
ATI
ON
(D
olla
rs in
Tho
usan
ds)
Fi
scal
Yea
r (FY
) 201
1 B
udge
t Esi
mat
es F
ebru
ary
2010
Mili
tary
Sea
lift C
omm
and/
Tran
spor
tatio
n/ F
ebru
ary
2010
0
03A
DP
E a
nd T
elec
omm
unic
atio
ns C
apab
ilit
Mili
tary
Sea
lift C
omm
and
FY
200
9
FY
201
0
FY
201
1
Uni
t
Tota
l
U
nit
To
tal
Uni
t
Tota
l
AD
PE a
nd T
elec
omm
Equ
ipm
ent
Q
ty
Cos
t
Cos
t
Qty
C
ost
C
ost
Q
ty
Cos
t
Cos
t
C
ompu
ter H
ardw
are
(Pro
duct
ion)
1
4,
494
4,
494
1
4,
350
4,
350
1
4,
350
4,
350
C
ompu
ter S
oftw
are
(Ope
ratin
g S
yste
1
450
45
0
1
450
45
0
Tel
ecom
mun
icat
ions
Oth
er C
ompu
ter &
Tel
ecom
m E
qup
Tot
al
1
4,
494
2
4,80
0
2
4,
800
N
arra
tive
Just
ifica
tion:
The
abov
e re
pres
ents
MS
C re
quire
men
ts to
impl
emen
t unc
lass
ified
and
cla
ssifi
ed L
AN
S a
t all
ship
s,of
fices
, are
a co
mm
and,
and
hea
dqua
rters
wor
ld-w
ide.
Equ
ipm
ent i
nclu
des
serv
ers,
rout
ers,
mod
em p
ools
,pr
inte
rs, f
irew
all,
etc.
Add
ition
ally
, fu
ndin
g w
ill p
rovi
de fo
r Cry
pto
Mod
erni
zatio
n N
avy
man
date
Add
ition
ally
, fun
ding
will
pro
vide
the
abili
ty to
inte
grat
e w
ith M
SC
Fin
anci
al M
anag
emen
t Sys
tem
(FM
S,)
repl
icat
e da
ta s
hore
side
, and
faci
litat
e w
eben
able
men
t in
acco
rdan
ce w
ith T
aks
Forc
e W
eb (T
FW) d
irect
ives
. E
cono
mic
Ana
lysi
s (E
A) f
or F
MS
com
plet
ed J
anua
ry 2
005.
MS
C re
quire
s eq
uipm
ent a
nd s
oftw
are
to m
aint
ain
back
up s
ites
- i.e
. Mis
sion
Con
tinui
ty P
lan
(MC
P.)
The
refre
shre
quire
men
ts a
re n
ot c
over
ed b
y N
MC
I or B
ase
Leve
l Inf
rast
ruct
ure
Impl
emen
tatio
n (B
LII)
plan
s.
No
EA
for a
float
AD
PE
as
this
was
a d
irect
ed C
IP c
ost b
y O
SD
.
Exh
ibit
Fund
-9b
Bus
ines
s A
rea
Cap
ital I
nves
tmen
t Jus
tific
atio
n
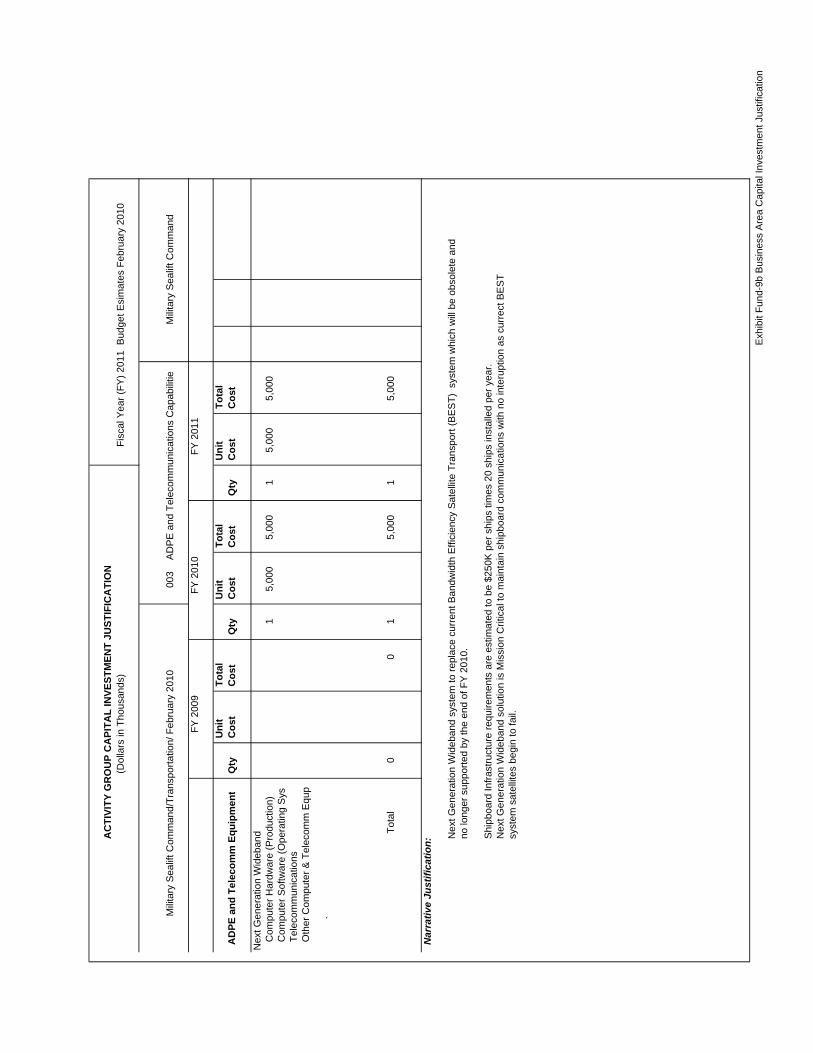
AC
TIVI
TY G
RO
UP
CA
PITA
L IN
VEST
MEN
T JU
STIF
ICA
TIO
N
(Dol
lars
in T
hous
ands
)
Fisc
al Y
ear (
FY) 2
011
Bud
get E
sim
ates
Feb
ruar
y 20
10
Mili
tary
Sea
lift C
omm
and/
Tran
spor
tatio
n/ F
ebru
ary
2010
0
03A
DP
E a
nd T
elec
omm
unic
atio
ns C
apab
ilitie
M
ilita
ry S
ealif
t Com
man
d
FY 2
009
FY 2
010
FY 2
011
U
nit
To
tal
Uni
t
Tota
l
U
nit
T
otal
A
DPE
and
Tel
ecom
m E
quip
men
t
Qty
C
ost
C
ost
Q
ty
Cos
t
Cos
t
Qty
C
ost
C
ost
N
ext G
ener
atio
n W
ideb
and
C
ompu
ter H
ardw
are
(Pro
duct
ion)
1
5,00
0
5,00
0
1
5,00
0
5,00
0
C
ompu
ter S
oftw
are
(Ope
ratin
g S
ys
Tele
com
mun
icat
ions
O
ther
Com
pute
r & T
elec
omm
Equ
p
`
Tot
al
0
0
1
5,00
0
1
5,
000
N
arra
tive
Just
ifica
tion:
Nex
t Gen
erat
ion
Wid
eban
d sy
stem
to re
plac
e cu
rren
t Ban
dwid
th E
ffici
ency
Sat
ellit
e Tr
ansp
ort (
BE
ST)
sys
tem
whi
ch w
ill b
e ob
sole
te a
nd
no lo
nger
sup
porte
d by
the
end
of F
Y 2
010.
Shi
pboa
rd In
frast
ruct
ure
requ
irem
ents
are
est
imat
ed to
be
$250
K p
er s
hips
tim
es 2
0 sh
ips
inst
alle
d pe
r yea
r.N
ext G
ener
atio
n W
ideb
and
solu
tion
is M
issi
on C
ritic
al to
mai
ntai
n sh
ipbo
ard
com
mun
icat
ions
with
no
inte
rupt
ion
as c
urre
ct B
ES
T sy
stem
sat
ellit
es b
egin
to fa
il.
Exh
ibit
Fund
-9b
Bus
ines
s A
rea
Cap
ital I
nves
tmen
t Jus
tific
atio
n

AC
TIVI
TY G
RO
UP
CA
PITA
L IN
VEST
MEN
T JU
STIF
ICA
TIO
N
(Dol
lars
in T
hous
ands
)
Fisc
al Y
ear (
FY) 2
011
Bud
get E
sim
ates
Feb
ruar
y 20
10
Mili
tary
Sea
lift C
omm
and/
Tran
spor
tatio
n/ F
ebru
ary
2010
0
05S
oftw
are
M
ilita
ry S
ealif
t Com
man
d
FY 2
009
FY 2
010
FY 2
011
U
nit
T
otal
Uni
t
Tot
al
U
nit
T
otal
S
OFT
WA
RE
Q
ty
Cos
t
Cos
t
Qty
C
ost
C
ost
Q
ty
Cos
t
Cos
t
M
SC
- H
RM
S
1
2,53
0
2,53
0
1
3,00
0
3,00
0
1
1,95
0
1,95
0
Tot
al
1
2,
530
1
3,00
0
1
1,
950
N
arra
tive
Just
ifica
tion:
MS
C H
RM
S (H
uman
Res
ourc
es M
anag
emen
t Sys
tem
)
MS
C h
as c
onso
lidat
ed it
s ci
vmar
per
sonn
el fu
nctio
ns a
t the
Aflo
at P
erso
nnel
Man
agem
ent C
ente
r (A
PM
C.)
Th
is fu
ndin
g w
ill s
atis
fy th
e re
quire
men
t to
mig
rate
to a
pap
erle
ss e
nviro
nmen
t - i.
e. to
tal a
utom
atio
n of
the
AP
pro
cess
, aut
omat
ed w
orkf
low
and
doc
umen
tatio
n m
anag
emen
t util
izin
g O
racl
e H
uman
Res
ourc
e (H
R) a
ndP
ayro
ll. I
mpl
emen
tatio
n of
HR
als
o w
ill p
rovi
de th
e ab
ility
to in
tegr
ate
with
MS
C's
cor
pora
te d
ata
envi
ronm
ent.
Not
e: C
ivili
an M
arin
er (C
IVM
AR
) per
sonn
el fu
nctio
ns a
re n
ot h
andl
ed b
y th
e D
OD
Mod
ern
Def
ense
Civ
ilian
Pay
roll
Dat
a S
yste
m (D
CP
DS
.)
Bus
ines
s E
nter
pirs
e A
rchi
tect
ure
(BE
A) c
ompl
iant
EA
was
com
plet
ed in
200
7, a
ll ite
ms
have
obt
aine
d O
SD
BTA
cer
tific
atio
n.
Exh
ibit
Fund
-9b
Bus
ines
s A
rea
Cap
ital I
nves
tmen
t Jus
tific
atio
n

A
CTI
VITY
GR
OU
P C
API
TAL
INVE
STM
ENT
JUST
IFIC
ATI
ON
(D
olla
rs in
Tho
usan
ds)
Fi
scal
Yea
r (FY
) 201
1 B
udge
t Esi
mat
es F
ebru
ary
2010
Mili
tary
Sea
lift C
omm
and/
Tran
spor
tatio
n/ F
ebru
ary
2010
0
04S
oftw
are
M
ilita
ry S
ealif
t Com
man
d
FY 2
009
FY 2
010
FY 2
011
U
nit
To
tal
Uni
t
Tota
l
U
nit
T
otal
S
OFT
WA
RE
Q
ty
Cos
t
Cos
t
Qty
C
ost
C
ost
Q
ty
Cos
t
Cos
t
M
SC
-IS P
orta
l
1
3,19
4
3,19
4
1
2,00
0
2,00
0
1
1,50
0
1,50
0
MS
C -
FMS
1
67
1
671
11,
260
1,26
01
1,80
81,
808
Tot
al
2
3,
865
2
3,26
0
2
3,
308
N
arra
tive
Just
ifica
tion:
Dev
elop
men
t
Var
ious
mod
ules
inte
grat
e ex
istin
g w
orld
wid
e pr
ocur
emen
t sys
tem
with
dev
elop
ing/
depl
oyin
g fin
anci
al s
yste
m; t
his
ensu
res
valid
atio
n of
acc
ount
ing
data
at t
ime
of o
rigin
atio
n, a
nd
track
ing
of b
oth
proc
urem
ent a
nd fu
nds
cont
rol f
rom
obl
igat
ion
thro
ugh
paym
ent.
Incl
udes
fund
ing
requ
ired
to im
plem
ent D
OD
man
date
d tra
vel s
yste
m a
nd in
tegr
ate
it w
ith th
eC
omm
and
finan
cial
man
agem
ent s
yste
m a
s w
ell a
s th
e pa
perle
ss e
nviro
nmen
t.
Info
rmat
ion
Sys
tem
s: I
S P
orta
l and
FM
S
IS P
orta
l: T
his
is a
sta
ndar
ds b
ased
web
app
licat
ion
that
will
sea
mle
ssly
inte
grat
e sh
ipbo
ard
and
shor
e-si
de in
form
atio
nte
chno
logy
func
tion
and
proc
esse
s in
to o
ne in
tegr
ated
por
tal.
MS
C IS
Por
tal w
ill b
e in
tegr
ated
with
the
Nav
y E
nter
pris
eP
orta
l (N
EO
.)
FMS
: Th
is is
a D
OD
/DFA
S m
igra
tory
fina
nce
and
acco
untin
g sy
stem
. It
is c
onsi
sten
t with
the
requ
irem
ents
of t
he F
inan
cial
Inte
grity
Act
, Ant
i-Def
icie
ncy
Act
, Joi
nt F
inan
cial
Man
agem
ent I
mpr
ovm
ent P
rogr
am (J
MIP
), an
d th
e C
hief
Fin
anci
alO
ffice
r (C
FO) A
ct.
This
initi
ativ
e w
ill p
rovi
de fo
r cro
ss fu
nctio
nal r
equi
rem
ents
and
con
tinui
ng d
evel
opm
ent o
f enh
ance
men
t and
upg
rade
sto
MS
C b
usin
ess
syst
ems.
Sup
ports
the
intro
duct
ion
of a
dditi
onal
mod
ules
requ
ired
to p
rovi
de a
tota
l aut
omat
ed p
rocu
reto
pay
sol
utio
n fo
r MS
C.
It al
so w
ill s
uppo
rt th
e de
velo
pmen
t of i
nter
face
s re
quire
d w
ith e
xter
nal s
yste
ms
- e.g
. DO
Dw
ide
impl
emen
tatio
n of
the
End
-to-
End
pro
cure
men
t pro
cess
.
Bus
ines
s E
nter
pris
e A
rchi
tect
ure
(BE
A) 4
.1 c
ompl
iant
EA
com
plet
ed in
200
7, h
owev
er, a
ll ite
ms
have
obt
aine
d O
SD
Bus
ines
s Tr
ansf
orm
atio
n A
genc
y (B
TA) c
ertif
icat
ion.
Exh
ibit
Fund
-9b
Bus
ines
s A
rea
Cap
ital I
nves
tmen
t Jus
tific
atio
n

AC
TIVI
TY G
RO
UP
CA
PITA
L IN
VEST
MEN
T JU
STIF
ICA
TIO
N
(Dol
lars
in T
hous
ands
)
Fisc
al Y
ear (
FY) 2
011
Bud
get E
sim
ates
Feb
ruar
y 20
10
M
ilita
ry S
ealif
t Com
man
d/Tr
ansp
orta
tion/
Feb
ruar
y 20
10
006
Min
or C
onst
ruct
ion
M
ilita
ry S
ealif
t Com
man
d
F
Y 20
09
FY
2010
F
Y 20
11
Uni
t
Tota
l
U
nit
To
tal
Uni
t
Tota
l
MIN
OR
CO
NST
RU
CTI
ON
Q
ty
Cos
t
Cos
t
Qty
C
ost
C
ost
Q
ty
Cos
t
Cos
t
R
epla
cem
ent
Pro
duct
ivity
New
Mis
sion
1
20
0
200
E
nviro
nmen
tal
Tot
al
0
0
0
0
0
0
1
20
0
Nar
rativ
e Ju
stifi
catio
n:
The
abov
e co
vers
requ
irem
ents
ass
ocia
ted
with
the
mov
e of
MS
C p
erso
nnel
in th
e N
orfo
lk A
rea.
Ren
ovat
ion
of a
ll re
quire
d bu
ildin
gs w
ill a
llow
MS
CLA
NT
to c
onso
lidat
e in
the
Tide
wat
er a
rea.
If fu
ndin
g is
not
pro
vide
d, c
onso
lidat
ion
coul
d no
t be
com
plet
ed a
nd p
ortio
ns o
f MS
CTr
ansf
orm
atio
n ef
forts
wou
ld b
e cu
rtaile
d.
Exh
ibit
Fund
-9b
Bus
ines
s A
rea
Cap
ital I
nves
tmen
t Jus
tific
atio
n

Department of the NavyTransportation - Military Sealift Command
Fiscal Year (FY) 2011 February 2010Fund-9c: Capital Budget Execution
($ in Millions)
Approved Current Asset/FY Approved Projects PB Amount Reprogs Proj Cost Proj Cost Deficiency Explanation
10 Equipment except ADPE & Telcomm $0.5 $0.5 $0.5 $0.0 No change
ADPE & Telecomm LAN $9.8 $9.8 $9.8 $0.0 No change
Software Development Systems/Lan $6.3 $6.3 $6.3 $0.0 No change
Minor Construction $0.0 $0.0 $0.0 $0.0 No change
TOTAL FY 2010 $16.6 $0.0 $16.6 $16.6 $0.0
Exhibit Fund-9c Capital Budget Execution

Facilities Engineering Command

DEPARTMENT OF THE NAVY BASE SUPPORT
FACILITIES ENGINEERING COMMANDS (FECs) FISCAL YEAR (FY) 2011 BUDGET ESTIMATES
FEBRUARY 2010
MISSION STATEMENT / OVERVIEW:
The mission of the Facilities Engineering Commands (FECs) is to provide Navy, DoD, and other
Federal clients with quality public works support and services. The FECs provide utilities
services, facilities sustainment, transportation support, engineering services, and environmental
services required by afloat and ashore operating forces and other activities.
The FECs enable the Navy to leverage “best of class” technology by having combined functions
that were previously performed by separate former Engineering Field Divisions (EFDs),
Engineering Field Activities (EFAs), Resident Officers in Charge of Construction (ROICC),
independent Public Works Detachments (PWDs) and the former Public Works Centers (PWCs).
ACTIVITY GROUP COMPOSITION:
ACTIVITY LOCATION
FEC Midwest Great Lakes, Illinois
FEC Marianas Agana, Guam, Marianas Islands
FEC Southeast Jacksonville, Florida
FEC Mid‐Atlantic Norfolk, Virginia
FEC Hawaii Pearl Harbor, Hawaii
FEC Southwest San Diego, California
FEC Washington Washington, D.C.
FEC Far East Yokosuka, Japan
FEC Europe – Southwest Asia Naples, Italy
FEC Northwest Silverdale, Washington
Significant Changes Since the FY 2010 President’s Budget:
There are no significant changes in the activity group composition since the FY 2010 President’s
Budget.
Fuel: The FY 2010 prices for fuel in this submission are calculated using the current fuel
composite rate of $118.02 per barrel versus the FY 2010 Presidentʹs Budget rate of $89.46. This
will result in a projected revenue shortfall of $53.522 million; $43.151 million of this amount is
being requested as a direct Working Capital Fund (WCF) appropriation in the FY 2010
supplemental and the remainder will be handled from either WCF cash balances or through an
additional customer surcharge.

BASE SUPPORT FACILITIES ENGINEERING COMMANDS (FECs)
FISCAL YEAR (FY) 2011 BUDGET ESTIMATES
Financial Profile:
Revenue/Expense/Operating Results
($Millions) FY 2009 FY 2010
FY 2011
Revenue $2,676.9 $2,776.1 $2,920.1
Cost of Goods and Services $2,725.4 $2,726.4 $2,832.9
Operating Results ‐$48.5 +$49.7 +$87.3
Other Changes Affecting AOR $0.0 $0.0 $0.0
Accumulated Operating Results (AOR) ‐$137.0 ‐$87.3 $0.0
Revenue and Cost of Goods Sold: The trend in revenue and expense is primarily a result of
pay raise, general inflation, and fuel pricing factors. In FY 2011, revenue includes the amount
needed to achieve $0 AOR.
Operating Results: The net effect of revised FY 2010 general inflation pricing assumptions, the
cost of compliance with new California standards for diesel engine emissions, and updated
workload estimates, are expected to produce an operating gain in FY 2010 when compared to
the FY 2010 President’s Budget.
Foreign Currency Issues: Foreign currency exchange rates can impact the FECs’ operating
results, especially since the incorporation of FEC Europe‐Southwest Asia into the activity group
in FY 2008. The table below shows the estimated value of FEC costs that are subject to payment
in foreign currency:
Costs Subject to Foreign Currency ($Millions) FY 2009 FY 2010 FY 2011
Costs to be Paid in EUROS $63.9 $65.1 $72.1
Costs to be Paid in YEN $114.3 $116.6 $127.9
Total Costs to be Paid in Foreign Currency $178.2 $181.7 $200.0
Collections and Disbursements/Outlays:
Net Outlays ($Millions) FY 2009 FY 2010 FY 2011
Collections $2,818.2 $2,857.6 $2,986.0
Disbursements $2,729.1 $2,775.4 $2,887.3
Net Outlays ‐$89.1 ‐$82.2 ‐$98.7
Workload:
Reimbursable Orders ($Millions) FY 2009 FY 2010 FY 2011
Current Estimate $2,719.7 $2,780.2 $2,922.2

BASE SUPPORT FACILITIES ENGINEERING COMMANDS (FECs)
FISCAL YEAR (FY) 2011 BUDGET ESTIMATES
Acronym List
CHITS In‐House request for work document MBTU Million British Thermal Units
CUYD Cubic Yard MWH Mega Watt Hour
KCF Thousand Cubic Feet SRO Shop Repair Order
KGAL Thousand Gallons LBS Pounds
TONS Tons
Total units are displayed in table below: UNIT OF Units Units Units
Product / Service MEASURE FY 09 FY 10 FY 11
Utility Services
Electricity MWH 7,403,731 7,633,318 7,653,211Potable Water KGAL 25,948,062 27,301,604 28,741,142Salt Water KGAL 8,278,043 8,481,238 8,629,759Steam MBTU 9,324,069 10,059,900 9,980,225Sewage KGAL 18,111,713 19,778,620 20,393,717Natural Gas MBTU 3,039,524 3,211,639 3,131,426
Compressed Air KCF 13,457,913 12,900,245 13,000,245
Sanitation Services
Refuse Collection & Disposal I CUYD 1,076,003 1,355,506 1,354,352Refuse Collection & Disposal II TONS ‐ ‐ 39,055Pest Control HOURS 63,017 62,564 62,514Hazardous Waste I GAL 352,093 327,846 327,871Hazardous Waste II LBS 11,931,346 18,918,965 18,739,965Indutrial Waste KGAL 230,485 327,566 327,453Environmental Enginnering HOUR 113,552 55,705 55,331Environmental Lab TEST 93,947 78,774 78,833
Transporation Services
Equipment Rental HOURS 40,540,430 43,678,954 44,386,989Vehicle Operations HOURS 1,870,772 1,122,106 1,118,978Vehicle Maintenance SRO 167,394 78,484 74,626
Maintenance & Repair
Specifics JOBS 13,435 4,292 4,529Minor M&R ITEMS 165,686 151,230 152,157Emergency CHITS 234,335 197,805 194,654Service CHITS 825,229 760,282 750,410Recurring ITEMS 598,029 238,159 236,306Engineering Support 344,951 289,235 320,650

BASE SUPPORT FACILITIES ENGINEERING COMMANDS (FECs)
FISCAL YEAR (FY) 2011 BUDGET ESTIMATES
Direct Labor Hours (000) FY 2009 FY 2010 FY 2011
Current Estimate 11,109 12,546 13,044
Performance Indicators:
Among the key financial indicators for the FECs are operating results (as noted above), annual
rate changes, and unit costs (as presented below). Other key corporate performance measures
include timeliness, workforce safety, and client satisfaction. Timeliness is an extremely
important client satisfaction indicator in the area of facilities sustainment; it is reported on a
quarterly basis.
The Emergency Work Response Time – Schedule Adherence metric represents the percent of
time that emergency work crews arrive on‐scene within prescribed time‐lines. Another
metric, Service/Minor/Specific Work Completion Date – Schedule Adherence reflects the
percent of time that work is completed on schedule. The minimum goal in either case is 90%.
Performance Measures
FY 2009
FY 2010
FY 2011
Emergency Work Response Time‐
Schedule Adherence
90.0%
90.0%
90.0%
Service/Minor/Specific Work
Completion Date‐Schedule Adherence
90.0%
90.0%
90.0%
Annual rate changes reflect the impact of pricing adjustments as well as the impact of
returning/recouping operating gains or losses.
Rate Changes FY 2009 FY 2010 FY 2011
Composite Rate +5.5% +2.0% +7.3%
Utilities and Sanitation +7.6% +2.9% +10.2%
Other Base Services +1.7% +0.4% +1.6%
Unit Costs
Unit costs for each of the FECs 23 different product areas are displayed on the following page.

BASE SUPPORT FACILITIES ENGINEERING COMMANDS (FECs)
FISCAL YEAR (FY) 2011 BUDGET ESTIMATES
UNIT OF Unit Cost Unit Cost Unit CostProduct / Service MEASURE FY09 FY10 FY11
Utility Services
Electricity MWH 134.73 130.68 138.91Potable Water KGAL 6.09 5.61 5.30Salt Water KGAL 1.06 1.01 1.04Steam MBTU 30.86 32.67 34.17Sewage KGAL 8.04 7.08 7.19Natural Gas MBTU 9.87 12.28 12.76
Compressed Air KCF 1.70 1.88 1.81
Sanitation Services
Refuse Collection & Disposal I CUYD 15.02 13.62 13.29Refuse Collection & Disposal II TONS ‐ ‐ 18.79Pest Control HOURS 47.73 43.71 44.91Hazardous Waste I GAL 6.23 8.08 8.38Hazardous Waste II LBS 1.25 1.10 1.17Indutrial Waste KGAL 39.77 38.58 38.27Environmental Enginnering HOUR 50.27 106.89 111.03Environmental Lab TEST 91.30 94.89 96.94
Transporation Services
Equipment Rental HOURS 4.67 4.95 5.20Vehicle Operations HOURS 35.60 57.29 60.04Vehicle Maintenance SRO 126.56 303.76 329.68
Maintenance & Repair
Specifics JOBS 5,949.57 17,173.90 19,676.57Minor M&R ITEMS 580.88 595.46 609.26Emergency CHITS 106.17 84.18 84.88Service CHITS 108.61 122.45 123.68Recurring ITEMS 274.60 545.40 556.03Engineering Support 141.16 153.93 149.54

BASE SUPPORT FACILITIES ENGINEERING COMMANDS (FECs)
FISCAL YEAR (FY) 2011 BUDGET ESTIMATES
Utilities. Higher purchased electricity costs will continue to impact the FECs’ cost of
operations. Even though the FECs are impacted by higher purchased utilities, we are
implementing energy conservation measures that are reducing the quantities of electricity and
natural gas consumed. These initiatives include managing the kinds of fuel purchased;
implementing efficient ways of using fuel to produce steam; aggressive energy management to
move activities toward Common Output Level (COL) 3; arranging visits by Department of
Energy (DOE) analysts to identify poor energy performers; maximizing the use of energy
projects, increasing the use of alternative sources of energy such as geothermal, ocean thermal,
wind, solar, and wave; and deploying Resource Efficiency Managers who are examining
contracting methods and ordering arrangements with local authorities. Utility rates also
include resources for utility system maintenance across all sites in order to adequately correct
known environmental and safety deficiencies and to meet mission requirements. The amount
budgeted for sustainment, restoration, and modernization is designed to keep facilities in
acceptable operating condition.
Base Support Vehicles and Equipment (BSVE). Initiatives to standardize and lower vehicles
and equipment operating costs include:
•Central management of BSVE NWCF Rates and Recapitalization
•Management of BSVE across Product Lines at all FECs.
•Lease Passenger Carrying Vehicles (PCVs) from GSA
•Establish BSVE management board
•Downsize vehicles and equipment to minimum size, including Neighborhood Electric
Vehicles and other slow moving vehicles
•Standardize vehicle and equipment type, sizes and configurations
•Optimize use of lease and short term rentals for vehicles and heavy equipment
Facility Management and Services. FECs are reducing the cost of facility service contracts
through maximizing the use of regional contracts and seeking fewer and longer term contracts
while still maintaining Small Business commitments. Additionally, a contracting template has
been developed and deployed that standardizes required COL performance. This also serves to
reduce costs by minimizing specification writing.
Facility Management and Sustainment. The Facilities Condition Assessment Process (FCAP)
has been reengineered. This process replaces the labor intensive Annual Inspection Summary
process with complete coverage through modeling (90%) and “eyes‐on” inspections (10%). This
is expected to reduce facility inspection costs by over 50% through fewer “eyes‐on” inspections.
Additionally, call centers are being consolidated, a Work Induction System (WIS)

BASE SUPPORT FACILITIES ENGINEERING COMMANDS (FECs)
FISCAL YEAR (FY) 2011 BUDGET ESTIMATES
is being developed, and a standard method for dispatching work to shops is being
implemented.
Staffing:
Civilian / Military ES & Work Years FY 2009 FY 2010 FY 2011
Civilian End Strength 9,497 9,447 9,548
Civilian Work Years (Straight Time) 9,339 9,412 9,495
Military End Strength 78 78 78
Military Work Years 78 78 78
Civilian Personnel: Personnel resources are one of the most valuable assets to the FEC
organization. The NWCF FEC Management team continues to focus on the optimal mix and
quantity of personnel required to ensure effectiveness in providing quality products and service
to our customers. The growth in civilian workyears in FY 2010 reflects increased and improved
recruiting efforts within the FECs to achieve greater standardization in the FECsʹ business
models to support the commandʹs strategic plan and some impact from Joint Basing initiatives.
In FY 2011, the growth in civilian end strength and workyears is primarily associated with Joint
Basing initiatives.
Military Personnel: Military end strength remains stable.
Capital Investment Program (CIP):
The FECs’ capital investments are a modest, but important element of successful operations.
CIP ($Millions) FY 2009 FY 2010 FY 2011
Equipment, Non‐ADP / Telecom $11.4 $20.1 $12.6
Equipment, ADPE / Telecom $0.0 $0.0 $0.0
Software Development $0.0 $0.0 $0.0
Minor Construction $7.7 $9.3 $7.2
Total $19.1 $29.4 $19.8
SUMMARY
The 10 geographic FECs strive to be efficient and effective organizations that provide high
quality products and services to afloat and ashore‐based activities. Sound business practices are
the core for decisions that promote continuous and innovative improvements of products and
services. It is our objective for mission accomplishment to reduce total cost for services,
increase productivity, improve quality/client satisfaction, and provide a safe and productive
work environment.

FY 2009 FY 2010 FY 2011
Operations 2,670.4 2,759.7 2,903.1
Surcharges 0.0 0.0 0.0
Depreciation excluding Major Construction 6.5 16.4 17.0
Total Income 2,676.9 2,776.1 2,920.1
Military Personnel 8.6 9.0 9.2
Civilian Personnel 681.9 684.9 708.2
Travel and Transportation of Personnel 6.1 14.2 13.0
Material & Supplies (Internal Operations) 303.3 359.8 384.7
Equipment 42.7 44.3 50.2
Other Purchases from NWCF 12.6 14.6 15.2
Transportation of Things 0.1 1.0 0.8
Depreciation ‐ Capital 6.5 16.4 17.0
Printing and Reproduction 0.3 1.1 1.1
Advisory and Assistance Services 0.0 0.4 0.4
Rent, Communication & Utilities 1,037.9 1,002.3 1,018.0
Other Purchased Services 625.3 578.6 615.1
Total Expenses 2,725.4 2,726.4 2,832.9
Work in Process Adjustment 0.0 0.0 0.0
Comp Work for Activity Retention Adjustment 0.0 0.0 0.0
Cost of Goods Sold 2,725.4 2,726.4 2,832.9
Operating Result ‐48.5 49.7 87.3
Less Surcharges 0.0 0.0 0.0
Plus Appropriations Affecting NOR/AOR 0.0 0.0 0.0
Other Changes Affecting NOR/AOR 0.0 0.0 0.0
Extraordinary Expenses Unmatched 0.0 0.0 0.0
Net Operating Result ‐48.5 49.7 87.3
Other Changes Affecting AOR 0.0 0.0 0.0
Accumulated Operating Result ‐137.0 ‐87.3 0.0
Exhibit Fund‐14 Revenue and Expenses
Expenses
Cost of Materiel Sold from Inventory
Salaries and Wages:
Revenue:
Gross Sales
Other Income
February 2010
$ in Millions
Revenue and Expenses
Department of the Navy
Base Support ‐ Facilities Engineering Commands
Fiscal Year (FY) 2011 Budget Estimates

FY 2009 FY 2010 FY 2011
1. New Orders 2,719.7 2,780.2 2,922.2
a. Orders from DoD Components: 2,138.2 2,161.5 2,298.0
Department of the Navy 1,818.3 1,888.6 2,023.5
O & M, Navy 1,645.6 1,699.1 1,829.4
O & M, Marine Corps 68.2 50.2 53.6
O & M, Navy Reserve 32.6 31.3 31.6
O & M, Marine Corp Reserve 2.5 4.8 4.8
Aircraft Procurement, Navy ‐0.1 1.2 1.3
Weapons Procurement, Navy 0.0 0.0 0.0
Ammunition Procurement, Navy/MC 0.0 0.0 0.0
Shipbuilding & Conversion, Navy ‐0.2 2.8 2.9
Other Procurement, Navy ‐0.2 1.6 1.5
Procurement, Marine Corps 0.2 0.0 0.0
Family Housing, Navy/MC 58.9 94.0 93.4
Research, Dev., Test, & Eval., Navy 3.3 1.7 2.8
Military Construction, Navy 1.7 1.5 1.8
National Defense Sealift Fund 0.0 0.0 0.0
Other Navy Appropriations 4.0 0.4 0.4
Other Marine Corps Appropriations 1.6 0.0 0.0
Department of the Army 52.6 53.6 54.1
Army Operation & Maintenance 18.8 25.4 25.1
Army Res, Dev, Test, Eval 1.1 2.4 2.6
Army Procurement 0.0 0.0 0.0
Army Other 32.6 25.8 26.4
Department of the Air Force 43.3 44.2 44.7
Air Force Operation & Maintenance 26.6 31.8 32.2
Air Force Res, Dev, Test, Eval 0.0 0.1 0.0
Air Force Procurement 0.0 0.0 0.0
Air Force Other 16.6 12.4 12.5
DOD Appropriation Accounts 224.0 174.9 175.6
Base Closure & Realignment 1.9 7.9 8.8
Operation & Maintenance Accounts 142.6 116.6 115.3
Res, Dev, Test & Eval Accounts 2.7 1.6 1.7
Procurement Accounts 3.0 1.1 1.1
Defense Emergency Relief Fund 0.0 0.0 0.0
DOD Other 73.8 47.8 48.8
b. Orders from other Fund Activity Groups 337.7 415.6 415.6
c. Total DoD 2,475.9 2,577.1 2,713.6
d. Other Orders: 243.8 203.2 208.6
Other Federal Agencies 30.3 10.3 10.4
Foreign Military Sales 0.5 0.7 0.7
Non Federal Agencies 213.1 192.2 197.5
2. Carry‐In Orders 183.3 226.2 230.3
3. Total Gross Orders 2,903.0 3,006.4 3,152.6
a. Funded Carry‐Over before Exclusions 226.2 230.3 232.4
b. Total Gross Sales 2,676.9 2,776.1 2,920.1
4. End of Year Work‐In‐Process (‐) 0.0 0.0 0.0
5. Non‐DoD, BRAC, FMS, Inst. MRTFB (‐) ‐25.0 ‐12.9 ‐16.1
6. Net Funded Carryover 201.2 217.5 216.4
February 2010
$ in Millions
Sources of New Orders & Revenue
Department of the Navy
Base Support ‐ Facilities Engineering Commands
Fiscal Year (FY) 2011 Budget Estimates
Exhibit Fund‐11 Sources of Revenue
Note: Line 4 (End of Year Work‐In‐Process) is adjusted for Non‐DOD BRAC, FMS, and Institutional MRTFB

Changes in the Cost of Operations
Department of the Navy
Base Support ‐ Facilities Engineering Commands
Fiscal Year (FY) 2011 Budget Estimates
Date: February 2010
$ in Millions
Total Cost
FY 2009 Actual Execution $2,725.4
FY 2010 Estimate in FY 2010 Presidentʹs Budget: $2,661.4
Estimated Impact in FY 2010 of Actual FY 2009 Experience $0.0
Price Changes
Change in FY 2010 Fuel Price Assumptions $53.5
Change in FY 2010 General Inflation Assumptions ‐$1.8
Program Changes
Joint Basing Initiatives
FEC Marianas (Transfer from Air Force) $13.4
FEC Mid‐Atlantic
Ft Story, VA (Transfer from Army) $0.4
Lakehurst, NJ (Transfer to Air Force) ‐$6.3
Other Workload / Program Changes:
California Air Resources Board (CARB) Emissions Requirements
for Diesel Powered Equipment & Modifications $5.6
All Other Changes $0.1
FY 2010 Current Estimate $2,726.4
Price Changes:
Annualization of Prior Year Pay Raises
Military $0.0
Civilian $3.4
FY 2011 Pay Raise
Military Personnel $0.2
Civilian Personnel $7.0
Fuel Price Changes $16.0
Working Capital Fund Price Changes $0.1
General Purchase Inflation $25.0
Euro/Yen Exchange Rate $14.7
Productivity Initiatives and Other Efficiencies
Anticipated A‐76 Studies ‐$15.9
Other Workload / Program Changes:
Joint Base Charleston (Transfer to Air Force) ‐$25.7
Joint Base Pearl Harbor (Transfer from Air Force) $72.6
California Air Resources Board (CARB) Emissions Requirements
for Diesel Powered Equipment & Modifications $0.6
All Other Changes $8.5
FY 2011 Current Estimate 2,832.9
Exhibit Fund‐2 Changes in the Cost of Operations

Department of the Navy
Base Operating Support ‐ Facilities Engineering Commands
Capital Investiment Summary
Fiscal Year (FY) 2011 Budget Estimates
February 2010
$ in Millions
FY 2009
FY 2010
Line #
Description
Quantity
Total Cost
Quantity
Total Cost
Quantity
Total Cost
1Non‐A
DP Equipment Total
$11.348
$20.115
$12.576
‐ Rep
lacement Cap
ability
18$10.140
32$14.930
14$9.636
‐ Productivity Cap
ability
0$0.000
1$0.847
1$0.450
‐ N
ew M
ission Cap
ability
2$1.208
5$4.338
2$2.490
‐ Environmental Cap
ability
0$0.000
0$0.000
0$0.000
2 ADP and Telecom Equipment Total
$0.000
$0.000
$0.000
‐ Computer Hardware (Production)
0$0.000
0$0.000
0$0.000
‐ Computer Software (O
perating)
0$0.000
0$0.000
0$0.000
‐ Telecommunications
0$0.000
0$0.000
0$0.000
‐ Oth Computer & Telecom Spt Equip
0$0.000
0$0.000
0$0.000
3Software Development Total
$0.000
$0.000
$0.000
‐ Projects = or > $1M (List Sep
arately)
0$0.000
0$0.000
0$0.000
‐ Projects < $1M
0$0.000
0$0.000
0$0.000
4Minor Construction Total
$7.705
$9.310
$7.226
‐ Rep
lacement Cap
ability
13$4.873
10$3.233
6$1.970
‐ Productivity Cap
ability
8$2.631
7$2.751
6$1.836
‐ N
ew M
ission Cap
ability
0$0.000
7$3.326
6$3.420
‐ Environmental Cap
ability
1$0.201
0$0.000
$0.000
Grand Total
40$19.053
42$29.425
26$19.802
Total Capital Outlays
$14.654
$17.737
$16.045
Total Depreciation Expense
$6.459
$16.376
$17.037
FY 2011
Exhibit Fund‐9A C
apital Investm
ent Summary

February 2010
Dep
artm
ent of the Navy / Base Support / Facilities
Engineering Comman
ds
Quan
t
Unit
Cost
Total
Cost
Quan
t
Unit
Cost
Total
Cost
Quan
t
Unit
Cost
Total
Cost
Rep
lacement Equipment
18563
10,140
32467
14,930
14688
9,636
0
Productivity Equipment
00
01
847
847
1450
450
00
0
New M
ission Cap
ability
2604
1,208
5868
4,338
21,245
2,490
00
0
Environmental Cap
ability
00
00
00
00
00
0
Total
2011,348
38529
20,115
1712,576
00
0
Justification:
Non‐A
DPE and Telecommunications
FY 2009
FY 2011
FY 2010
CAPITAL INVESTMENT JUSTIFICATIO
NFiscal Year (FY) 2011 Budget Estim
ates
($ in Thousands)
#001
- N
on-A
DPE
and
Tel
ecom
mun
icat
ions
Facilities Engineering
Comman
ds
Civil Engineering Support Equipment (CESE) an
d Industrial Plan Equipment (IPE) ‐ FY 09/10/11 Requirem
ents:
Requested CESE and IPE w
ill replace overaged
, deteriorated, and obsolete inventory covering the full ran
ge of public works support functions, i.e., utilities, m
aintenan
ce, and transportation.
All budgeted CESE rep
lacement item
s have been reviewed and have been determined to m
eet activity allowan
ces an
d rep
lacement economic analysis criteria. IPE includes m
etal lathes,
metal shear bending or an
y heavy shop m
achinery used in the accomplishment of shop fabrications. A
ll requested rep
lacements are in support of public works workload
. The age of existing
equipment contributes to downtime an
d deteriorating output. In particular, inventories of large equipment such as craw
ling cranes and / or truck cranes have critical safety lift an
d
operational requirem
ents to m
eet workload needs. O
perational delays for repair or safety downtimes are offset by leasing w
here an
d w
hen available. Leasing equipment ranges from 30% to
60% higher in cost per hour than in‐house equipem
ent. R
equested rep
lacements are expected to result in annual estim
ated lease and m
aintenan
ce cost avoidan
ce of $540 thousand in FY
2009. Rep
lacements provide for more efficient an
d safe operations as w
ell as providing the latest technology in public works support cap
abilities.
The timing of placement of these new assets in operation varies dep
ending on the size, complexity, vendor availability, and shipping. Generally, equipment cost avoidan
ce begins within 30 ‐
60 days from receipt of the item
.
Each FEC has conducted a comprehensive business review of itsʹ equipment inventories and determined an optimal economic approach to containing costs as w
ell as m
aintaining m
inim
um
interruption to services. The proposed rep
lacements are essential to this strategy. If the proposed equipment replacements are not purchased
, substan
tial opportunity to provide safe and
reliable services at the least cost to the Navy w
ill be lost.
Exhibit Fund‐9B Cap
ital Purchase Justification

February 2010
Dep
artm
ent of the Navy / Base Support / Facilities
Engineering Comman
ds
Quan
t
Unit
Cost
Total
Cost
Quan
t
Unit
Cost
Total Cost
Quan
t
Unit
Cost
Total
Cost
Rep
lacement Equipment
13375
4,873
10323
3,233
6328
1,970
0
Productivity Equipment
8329
2,631
7393
2,751
6306
1,836
00
0
New M
ission Cap
ability
00
07
475
3,326
6570
3,420
00
0
Environmental Cap
ability
1201
201
00
00
00
00
Total
227,705
24388
9,310
187,226
00
0
CAPITAL INVESTMENT JUSTIFICATIO
NFiscal Year (FY) 2011 Budget Estim
ates
($ in Thousands)
#004
- M
inor
Con
stru
ctio
n ($
100K
- $7
50K
)Facilities Engineering
Comman
ds
Justification:
Non‐A
DPE and Telecommunications
FY 2009
FY 2011
FY 2010
Minor Construction ($100 Thousand ‐ $750 Thousand) ‐ FY 09/10/11 Requirem
ents:
FEC m
inor construction projects represent the fuell range of public works facilities requirem
ents for tran
sportation, u
tilities, storage, and m
aintenan
ce. The proposed projects are limited to and
strickly controlled by the Cap
ital Investm
ent Program (CIP) thresholds. N
one of the projects in this budget exceed current MILCON thresholds. B
udgeted projects are for constuction,
expan
sion, or im
provem
ent of a complete and useable building, structure, or other real property.
Each FEC has conducted a comprehensive business review of its facilities needs an
d determined an optimal economic approach to cost containment, w
hile ensuring that health and safety
requirem
ents are m
et and m
inim
izing service interruptions. T
he proposed project priorities are determined by economic analyses which are based on cost effecitve payback solutions which
produce the fastest return on investm
ent. G
enerally, FEC projects have a payback on the initial investm
ent of 5 years or less. Completion of health/safety and environmental complian
ce projects
will provide for cost avoidan
ce resulting from elimination of potential hazmat situations.
The proposed budget is essential to providing planned cost control an
d service reliability of the FEC plant account. If proposed projects are not ap
proved
, substan
tial opportunity to provide
safe, environmentally complian
t, and cost effective services at the least cost to the Navy w
ill be lost.
Exhibit Fund‐9B Cap
ital Purchase Justification

Capital Budget Execution
Department of the Navy
Base Support ‐ Facilities Engineering Commands
Fiscal Year (FY) 2011 Budget Estimates
Date: February 2010
$ in Millions
Projects in the FY 2010 Presidentʹs Budget
APPROVED CURRENT
PRESIDENTʹS
PROJECT
PROJECT
ASSET/
FY
Approved Project
BUDGET
REPROGS
COST
COSTDEFICIENCYJUSTIFICATION
2010
Equipment except ADPE and TELCOM
$19.224
$0.891
$20.115
$20.115
$0.000
Equipment ‐ ADPE and TELCOM
$0.000
$0.000
$0.000
$0.000
$0.000
Software Development
$0.000
$0.000
$0.000
$0.000
$0.000
Minor Construction
$8.827
$0.483
$9.310
$9.310
$0.000
TOTAL FY 2010
$28.051
$1.374
$29.425
$29.425
$0.000
Quantity
Cost
EQUIPMENT
FEC
Change
Change
130 Ton M
obile Crane ‐ Yokosuka
FAR EAST
‐$0.400Price chan
ge
Hazardous. Response Truck (Heavy) ‐ Yokosuka/Sasebo
FAR EAST
1$0.400
Increased quan
tity
Hazardous Material Truck
MID
WEST
1$0.330
Requirem
ent is the result of having identified the need for vehicles with
equipment capable of responding to H
AZMAT emergencies
Hazardous Response Vehicle
SOUTHWEST
$0.014
Defense Supply Center, Philad
elphia price chan
ge
Hazardous Response Vehicle
SOUTHWEST
$0.014
Defense Supply Center, Philad
elphia price chan
ge
Crane Truck M
TD 90 Ton
SOUTHWEST
‐1‐$1.024Item no longer required
Crane Truck M
ounted H
YD DED 51 TON & U
pSOUTHWEST
$0.669
Price increase due to specifications chan
ge
Crane Truck M
ounted H
YD DED 51 TON & U
pSOUTHWEST
‐1‐$1.131Item no longer required
Crane Truck M
TD 90 Ton
SOUTHWEST
‐$0.085Price red
uction due to specifications chan
ge
Truck, tan
k aircraft refueling / defueling
SOUTHWEST
$0.036
Defense Supply Center, Philad
elphia price chan
ge
Truck, tan
k aircraft refueling / defueling
SOUTHWEST
$0.036
Defense Supply Center, Philad
elphia price chan
ge
Truck, tan
k aircraft refueling / defueling
SOUTHWEST
$0.036
Defense Supply Center, Philad
elphia price chan
ge
Truck, tan
k aircraft refueling / defueling
SOUTHWEST
$0.036
Defense Supply Center, Philad
elphia price chan
ge
Truck, tan
k aircraft refueling / defueling
SOUTHWEST
$0.036
Defense Supply Center, Philad
elphia price chan
ge
Truck, tan
k aircraft refueling / defueling
SOUTHWEST
‐1‐$0.290Item no longer required
Truck Container Roll‐off/Forked
SOUTHWEST
‐1‐$0.267Item no longer required
Hazardous Material Truck
EURAFSWA
4$1.320
Emergent high priority requirem
ent ad
ded
Nitrogen Trailer
NORTHWEST
‐1‐$0.386Item no longer required
Truck, Strad
dle
NORTHWEST
1$0.450
Emergent requirem
ent for PWD Kitsap ‐ Bremerton added
Maxigrind W
ood Chipper
NORTHWEST
1$0.250
Emergent requirem
ent PWD ‐ W
hidbey Islan
d added
90T H
ydraulic Truck Crane
WASHIN
GTON
1$0.847
Procurement of cran
e was originally budgeted for prior year, but was
cancelled due to price chan
ge. P
roject shifted to FY 2010.
4$0.891
SUBTOTAL
Exhibit Fund‐9C Cap
ital Budget Execution
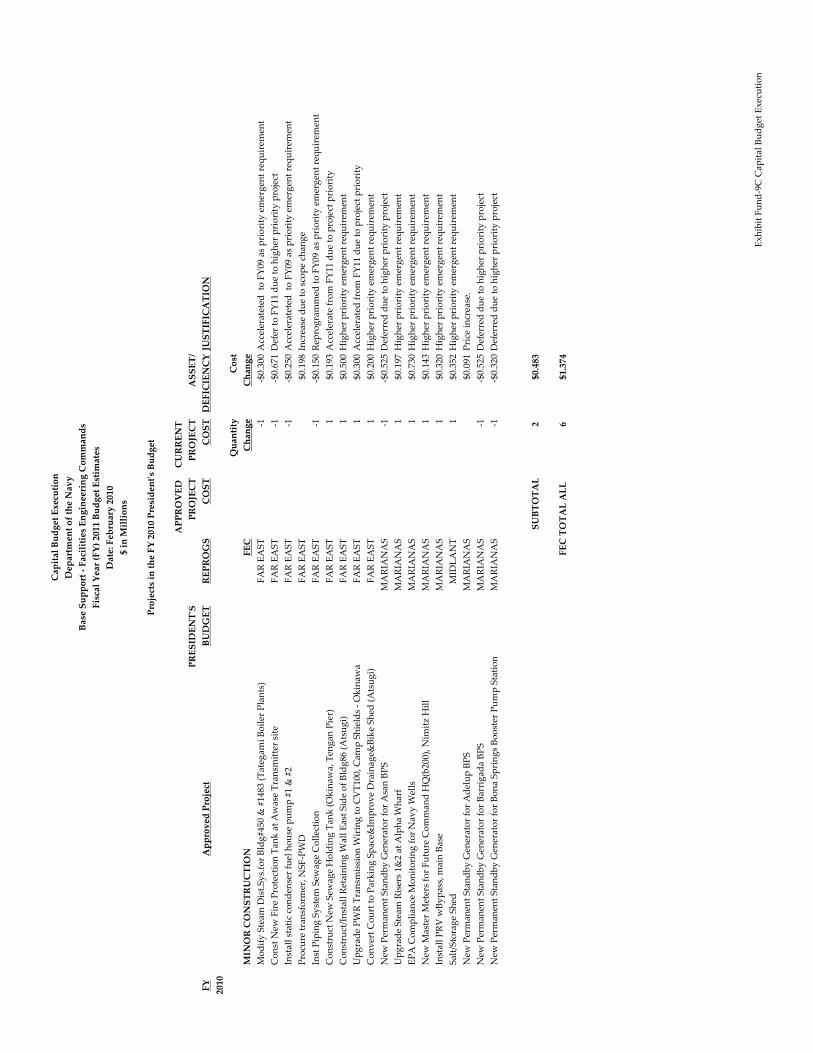
Capital Budget Execution
Department of the Navy
Base Support ‐ Facilities Engineering Commands
Fiscal Year (FY) 2011 Budget Estimates
Date: February 2010
$ in Millions
Projects in the FY 2010 Presidentʹs Budget
APPROVED CURRENT
PRESIDENTʹS
PROJECT
PROJECT
ASSET/
FY
Approved Project
BUDGET
REPROGS
COST
COSTDEFICIENCYJUSTIFICATION
2010
Quantity
Cost
MINOR CONSTRUCTION
FEC
Change
Change
Modify Steam Dist.Sys.for Bldg#450 & #1483 (Tategam
i Boiler Plants)
FAR EAST
‐1‐$0.300Accelerateted to FY09 as priority emergent requirem
ent
Const N
ew Fire Protection Tan
k at Awase Transm
itter site
FAR EAST
‐1‐$0.671Defer to FY11 due to higher priority project
Install static condenser fuel house pump #1 & #2
FAR EAST
‐1‐$0.250Accelerateted to FY09 as priority emergent requirem
ent
Procure transform
er, N
SF‐PWD
FAR EAST
$0.198
Increase due to scope chan
ge
Inst Piping System Sew
age Collection
FAR EAST
‐1‐$0.150Rep
rogrammed to FY09 as priority emergent requirem
ent
Construct N
ew Sew
age Holding Tan
k (Okinaw
a, Tengan Pier)
FAR EAST
1$0.193
Accelerate from FY11 due to project priority
Construct/Install Retaining W
all East Side of Bldg86 (Atsugi)
FAR EAST
1$0.500
Higher priority emergent requirem
ent
Upgrade PWR Transm
ission W
iring to CVT100, Cam
p Shields ‐ Okinaw
aFAR EAST
1$0.300
Accelerated from FY11 due to project priority
Convert Court to Parking Space&
Improve Drainage&
Bike Shed (Atsugi)
FAR EAST
1$0.200
Higher priority emergent requirem
ent
New Perman
ent Standby Generator for Asan BPS
MARIA
NAS
‐1‐$0.525Deferred due to higher priority project
Upgrade Steam Risers 1&
2 at Alpha Wharf
MARIA
NAS
1$0.197
Higher priority emergent requirem
ent
EPA Complian
ce M
onitoring for Navy W
ells
MARIA
NAS
1$0.730
Higher priority emergent requirem
ent
New M
aster Meters for Future Comman
d H
Q(b200), N
imitz Hill
MARIA
NAS
1$0.143
Higher priority emergent requirem
ent
Install PRV w
Bypass, m
ain Base
MARIA
NAS
1$0.320
Higher priority emergent requirem
ent
Salt/Storage Shed
MID
LANT
1$0.352
Higher priority emergent requirem
ent
New Perman
ent Standby Generator for Adelup BPS
MARIA
NAS
$0.091
Price increase.
New Perman
ent Standby Generator for Barrigad
a BPS
MARIA
NAS
‐1‐$0.525Deferred due to higher priority project
New Perman
ent Standby Generator for Bona Springs Booster Pump Station
MARIA
NAS
‐1‐$0.320Deferred due to higher priority project
SUBTOTAL
2
$0.483
6
$1.374
FEC TOTAL ALL
Exhibit Fund‐9C Cap
ital Budget Execution

Naval Facilities Engineering Services Center

Narrative Summary of Operations
Department of the Navy
Base Support – Naval Facilities Engineering Service Center
Fiscal Year (FY) 2011 Budget Estimates February 2010
Mission Statement / Overview
The Naval Facilities Engineering Service Center (NFESC) is a Navy‐wide technical center,
delivering quality products and services in:
o Energy and Utilities
o Amphibious and Expeditionary Systems
o Environment
o Shore, Ocean, and Waterfront Facilities
As a member of the Naval Facilities Engineering Command (NAVFAC) team, NFESC provides
worldwide support services to the Navy, Marine Corps, and other DOD agencies. These support
services provide solutions to problems through engineering, design, construction, consultation,
test and evaluation, technology demonstration and implementation, and program management
support. In accomplishing these services NFESC leverages technology to enhance customer
effectiveness and efficiency. NFESC uses existing technology where possible, identifies and
adapts breakthrough technology when appropriate, and performs technology development when
required.
The NFESC is the principal Navy provider of specialized engineering services and products for
shore and offshore facilities, energy and utilities, environmental support, and amphibious and
expeditionary systems. The work performed by NFESC is accomplished by mobilizing the
proper mix of personnel expertise and other technological resources to address customer
requirements. NFESC provides a synergism of expertise and practical experience to solve field
activity and fleet needs. NFESC supports a very broad range of Navy and Marine Corps
customers with focus on delivering quality products and services. Program execution is funded
by many appropriations, to include Operations and Maintenance, Navy; Research Development
Test & Evaluation, Navy; working capital fund; and other DOD accounts.
The energy and utilities mission focuses on the Navy’s ashore establishment energy program.
Efforts focus on utilities and energy management, conservation systems, data management,
technology transfer, utilities control systems, utility systems engineering, and thermal and power
plant engineering.
The amphibious and expeditionary mission involves developing and providing support and
enhancement to Naval construction battalions and Marine Corp advanced base construction and
operations, amphibious force operations, and Marine Corps combat engineer operations. Efforts
focus on amphibious systems, combat engineer systems, expedient facilities, and logistics
engineering.

Narrative Summary of Operations
Department of the Navy
Base Support – Naval Facilities Engineering Service Center
Fiscal Year (FY) 2011 Budget Estimates February 2010
The environmental mission entails planning, reviewing, and analyzing Navy‐wide functions, and
assembling and deploying customized technology to meet the environmental requirements of the
naval shore establishment. Efforts focus on environmental restoration, compliance, data
management, technology transfer, waste management, pollution prevention, indoor air
management, and oil spill program.
The ocean facilities mission is to develop, implement, and improve the Navy’s capabilities for the
design, construction, maintenance, and repair of fixed ocean facilities. Efforts focus on marine
geotechniques, anchor systems, ocean structures, ocean construction, undersea warfare,
underwater cable facilities, hyperbaric facilities, mooring systems, magnetic silencing facilities,
underwater inspection, ocean construction equipment inventory, coastal facilities, and pipeline
integrity assessment.
The shore facilities mission is to provide innovative engineering solutions, designs, technological
tools and field services to support a viable naval shore establishment. Efforts focus on waterfront
facilities, aviation facilities, physical security, ordnance facilities, materials and coatings,
computer aided design, facilities life cycle management, base survivability electronics thermal
and power plant engineering.
Activity Group Composition:
NFESC Headquarters Port Hueneme, CA.
East Coast Detachment Navy Yard, Washington, DC.
Significant Changes Since the FY 2010 President’s Budget:
NFESC has added a FY10 CIP requirement for replacement of a 20/10 Ton Overhead Bridge
Crane in support of the Deep Ocean Simulation Facility.
Workload:
Reimbursable Orders ($Millions) FY 2009 FY 2010 FY 2011
Current Estimate $125.8 $104.3 $104.1
Reimbursable orders are based on projected customer requirements.
Direct Labor Hours (000) FY 2009 FY 2010 FY 2011
Current Estimate 559 490 490
Direct labor hours reflect the Center’s efforts to maintain the correct level of organic expertise to
meet recurring customer demand.

Narrative Summary of Operations
Department of the Navy
Base Support – Naval Facilities Engineering Service Center
Fiscal Year (FY) 2011 Budget Estimates February 2010
Financial Profile:
Revenue/Expense/NOR/AOR ($Millions) FY 2009 FY 2010 FY 2011
Revenue $104.0 $102.5 $104.9
Expense $105.1 $102.5 $104.6
Operating Results ‐$1.1 $0.0 $0.4
Other Changes Affecting AOR $0.0 ‐$0.0 ‐$0.0
Accumulated Operating Results (AOR) ‐$0.4 ‐$0.4 $0.0
Revenue and Expense:
Revenue and expenses are expected to remain fairly constant through the budget period,
consistent with customer requirements.
Operating Results:
NFESC’s operating results are unchanged from levels approved in the FY 2010 President’s
Budget submission.
Collections/Disbursements/Outlays
Outlays ($Millions) FY 2009 FY 2010
FY 2011
Collections $113.9 $92.3 $113.4
Disbursements $103.1 $109.7 $113.4
Outlays ‐$10.8 $17.4 $0.0
Net Outlays are projected to remain relatively stable over the course of this budget.
Performance Indicators:
The primary performance indicator is unit cost. Unit cost measures total direct labor and
overhead costs per direct labor hour. Changes in unit cost are primarily due to price/escalation
factors and adjustments in customer requirements.
Unit Cost FY 2009 FY 2010 FY 2011
Total Stabilized Cost ($M) $56.7 $47.9 $48.6
Workload (DLHs) (000) 559 490 490
Unit Cost (per DLH) $101.38 $97.93 $99.30

Narrative Summary of Operations
Department of the Navy
Base Support – Naval Facilities Engineering Service Center
Fiscal Year (FY) 2011 Budget Estimates February 2010
Stabilized/Composite Rate FY 2009 FY 2010 FY 2011
Stabilized Rate ($M) $95.35 $97.88 $100.03
Change from Prior Year +1.0% +2.7% +2.2%
Composite Rate Change +1.5% +1.9% +1.8%
Staffing:
Civilian/Military ES & Work Years FY 2009 FY 2010 FY 2011
Civilian End Strength 397 384 384
Civilian Work Years 381 373 373
Military End Strength 3 3 3
Military Work Years 3 3 3
Civilian Personnel:
End strength and work years remain stable and are based upon workload requirements.
Military Personnel:
Military end strength and work years remain level.
Capital Investment Program (CIP) Budget Authority: NFESC has an emergent CIP requirement
for FY10 to replace a 20/10 Ton Overhead Bridge Crane used to load/unload the pressure vessels
at the Deep Ocean Simulation Facility. NFESC has been notified by the Navy Crane Center that
due to the age of the crane (+40 years) and the non availability of repair parts (manufacturer
closed 30 years ago) that the crane could not be certified past March 2010.
Capital Investment Program ($M) FY 2009 FY 2010 FY 2011
Equipment, Non‐ADP / Telecom $ 0.0 $ 0.5 $ 0.0
Equipment ADPE / Telecom $ 0.0 $ 0.0 $ 0.0
Software Development $ 0.0 $ 0.0 $ 0.0
Minor Construction $ 0.0 $ 0.0 $ 0.0
Total $ 0.0 $ 0.5 $ 0.0

FY 2009 FY 2010 FY 2011
Operations 103.9 102.5 104.9 Surcharges 0 0 0 Depreciation excluding Major Construction 0.1 0 0
Total Income 104.0 102.5 104.9
Military Personnel 0.3 0.4 0.4 Civilian Personnel 48.0 48.1 49.1 Travel and Transportation of Personnel 6.1 3.8 3.9 Material & Supplies (Internal Operations) 3.8 3.5 3.6 Equipment 0.7 1.7 1.7 Other Purchases from NWCF 1.9 1.8 1.8 Transportation of Things 0.5 0.5 0.5 Depreciation - Capital 0.1 0 0 Printing and Reproduction 0 0.1 0.1 Advisory and Assistance Services 0 0 0 Rent, Communication & Utilities 0.8 0.7 0.6 Other Purchased Services 43.0 42.0 43.0 Total Expenses 105.1 102.5 104.6
Work in Process Adjustment 0 0 0 Comp Work for Activity Retention Adjustment 0 0 0 Cost of Goods Sold 105.1 102.5 104.6
Operating Result -1.1 0 0.4
Less Surcharges 0 0 0 Plus Appropriations Affecting NOR/AOR 0 0 0 Other Changes Affecting NOR/AOR 0 0 0 Extraordinary Expenses Unmatched 0 0 0
Net Operating Result -1.1 0 0.4
Other Changes Affecting AOR 0 0 0
Accumulated Operating Result -0.4 -0.4 0
Exhibit Fund-14 Revenue and Expenses
Fiscal Year (FY) 2011 Budget Estimates
Expenses Cost of Materiel Sold from Inventory
Revenue: Gross Sales
Other Income
$ in Millions
Salaries and Wages:
Revenue and ExpensesDepartment of the Navy/ Navy Working Capital Fund
Base Support - Naval Facilities Engineering Service CenterFebruary 2010

FY 2009 FY 2010 FY 2011------- ------- -------
1. New Orders 125.8 104.3 104.1
a. Orders from DoD Components: 105.7 88.6 80.2
Department of the Navy 78.3 73.5 67.3 O & M, Navy 34.5 40.7 37.9 O & M, Marine Corps 2.0 1.9 2.0 O & M, Navy Reserve 0.4 0 0 O & M, Marine Corp Reserve 0.5 0 0 Aircraft Procurement, Navy 0.1 0 0 Weapons Procurement, Navy 0 0 0 Ammunition Procurement, Navy/MC 0 0 0 Shipbuilding & Conversion, Navy -0.1 0 0 Other Procurement, Navy 5.8 0.9 0.9 Procurement, Marine Corps 0.1 0 0 Family Housing, Navy/MC 0 0 0 Research, Dev., Test, & Eval., Navy 35.1 29.3 25.9 Military Construction, Navy 0.1 0.3 0.3 National Defense Sealift Fund 0 0 0 Other Navy Appropriations -0.1 0.2 0.2 Other Marine Corps Appropriations 0 0.1 0.1
Department of the Army 5.8 1.4 1.5 Army Operation & Maintenance 3.9 0.2 0.3 Army Res, Dev, Test, Eval 1.5 0.6 0.6 Army Procurement 0.5 0 0 Army Other -0.2 0.6 0.6
Department of the Air Force 0.3 0.2 0.2 Air Force Operation & Maintenance 0.3 0 0 Air Force Res, Dev, Test, Eval 0 0.2 0.2 Air Force Procurement 0 0 0 Air Force Other 0 0 0
DOD Appropriation Accounts 21.3 13.6 11.3 Base Closure & Realignment 2.8 1.8 0.2 Operation & Maintenance Accounts 4.4 0.6 0.6 Res, Dev, Test & Eval Accounts 13.2 7.9 8.0 Procurement Accounts 0.6 0.5 0.5 Defense Emergency Relief Fund 0 0 0 DOD Other 0.4 2.9 2.0
b. Orders from other Fund Activity Groups 16.3 7.5 5.0
c. Total DoD 122 96.1 85.2
d. Other Orders: 3.8 8.2 18.9 Other Federal Agencies 1.1 3.4 12.0 Foreign Military Sales 0.1 0.2 0.2 Non Federal Agencies 2.6 4.7 6.8
2. Carry-In Orders 19.9 41.6 43.4
3. Total Gross Orders 145.6 145.9 147.5
a. Funded Carry-Over before Exclusions 41.6 43.4 42.6
b. Total Gross Sales 104.0 102.5 104.9
4. End of Year Work-In-Process (-) 0 0 0
5. Non-DoD, BRAC, FMS, Inst. MRTFB (-) -4.8 -8.8 -13.8
6. Net Funded Carryover 36.8 34.6 28.8
Exhibit Fund-11 Sources of New Orders and Revenue
Note: Line 4 (End of Year Work-In-Process) is adjusted for Non-DOD BRAC, FMS, and Institutional MRTF
Fiscal Year (FY) Budget Estimates
($ in Millions)
Sources of New Orders & RevenueDepartment of the Navy
Base Support - Naval Facilities Engineering Service CenterFebruary 2010

Total Cost
FY 2009 Actual 105.1
FY 2010 Estimate in FY 2010 Presidentʹs Budget 102.5
Price Changes 0.0
Change in FY 2010 Fuel Price Assumptions 0.1
Change in FY 2010 General Inflation Assumptions 0.0
Program and Other Changes 0.0
FY 2010 Current Estimate 102.5
Price Changes:
Annualization of Prior Year Pay Raises
Military 0.0
Civilian 0.2
FY 2011 Pay Raise
Military Personnel 0.0
Civilian Personnel 0.8
Fuel 0.0
Working Capital Fund Price Changes 0.0
General Purchase Inflation 0.7
Program Changes
Workload, Shore program 0.2
Other Changes:
All Other Changes 0.0
FY 2011 Current Estimate 104.6
Changes in the Cost of Operations
Base Support / Naval Facilities Engineering Service Center
Department of the Navy
Dollars in Millions
Date: February 2010
Fiscal Year (FY) 2011 Budget Estimates
Exhibit Fund‐2 Changes in the Cost of Operations

Department of the Navy
Base Operating Support / Naval Facilities Engineering Service Center
Activity Group Capital Investiment Summary
Fiscal Year (FY) 2011 Budget Estimates
Date: February 2010
$ in Millions
FY 2009
FY 2010
FY 2011
Line #
Description
Quantity
Total Cost
Quantity
Total Cost
Quantity
Total Cost
1Non‐ADP Equipment
0$0.000
1$0.500
0$0.000
‐ Rep
lacement Cap
ability**
0$0.000
1$0.500
0$0.000
‐ Productivity Cap
ability
0$0.000
0$0.000
0$0.000
‐ N
ew M
ission Cap
ability
0$0.000
0$0.000
0$0.000
‐ Environmental Cap
ability
0$0.000
0$0.000
0$0.000
2 ADP and Telecom Equipment
0$0.000
0$0.000
0$0.000
‐ Computer Hardware (Production)
0$0.000
0$0.000
0$0.000
‐ Computer Software (O
perating)
0$0.000
0$0.000
0$0.000
‐ Telecommunications
0$0.000
0$0.000
0$0.000
‐ Oth Computer & Telecom Spt Equip
0$0.000
0$0.000
0$0.000
3Software Development
0$0.000
0$0.000
0$0.000
‐ Projects = or > $1M (List Sep
arately)
0$0.000
0$0.000
0$0.000
‐ Projects < $1M
0$0.000
0$0.000
0$0.000
4Minor Construction
0$0.000
0$0.000
0$0.000
‐ Rep
lacement Cap
ability
0$0.000
0$0.000
0$0.000
‐ Productivity Cap
ability
0$0.000
0$0.000
0$0.000
‐ N
ew M
ission Cap
ability
0$0.000
0$0.000
0$0.000
‐ Environmental Cap
ability
0$0.000
0$0.000
0$0.000
Grand Total
0$0.000
1$0.500
0$0.000
Total Capital Outlays
$0.000
$0.000
$0.000
Total Depreciation Expense
$0.000
$0.000
$0.000
Exh
ibit
Fund
-9A
Act
ivity
Gro
up C
apita
l Inv
estim
ent S
umm
ary

Dep
artm
ent o
f the
Nav
y / B
ase
Supp
ort /
Nav
al F
acili
ties
Engi
neer
ing
Serv
ice
Cen
ter
Qua
ntU
nit C
ost
Tota
l Cos
tQ
uant
Uni
t Cos
tTo
tal C
ost
Qua
ntU
nit C
ost
Tota
l Cos
tR
epla
cem
ent
00
00
00
150
050
0P
rod
uct
ivit
y0
00
00
0N
ew M
issi
on0
00
00
0E
nvi
ron
men
tal
00
0To
tal
00
00
00
150
050
00
00
The
Nav
y's D
eep
Oce
an S
imul
atio
n Fa
cilit
y is
loca
ted
at N
AV
FAC
ESC
, Bui
ldin
g 11
00, i
n Po
rt H
uene
me
CA
. The
faci
lity
is c
ompr
ised
of t
wo
pres
sure
ves
sels
w
hich
are
use
d to
sim
ulat
e th
e de
ep o
cean
env
ironm
ent,
both
pre
ssur
e an
d te
mpe
ratu
re. T
he 7
2" d
iam
eter
ves
sel i
s cap
able
of a
pply
ing
a st
atic
pre
ssur
e of
5,5
00 p
si a
nd th
e 24
" di
amet
er v
esse
l is c
apab
le o
f app
lyin
g a
stat
ic p
ress
ure
of 1
5,00
0 ps
i. Th
ese
two
vess
els a
llow
cus
tom
ers t
o su
bjec
t the
ir eq
uipm
ent t
o a
pres
suriz
ed e
nviro
nmen
t whi
le m
onito
ring
and
or o
pera
ting
the
equi
pmen
t at t
he re
quire
d de
pth.
The
ves
sels
are
crit
ical
to te
stin
g eq
uipm
ent p
rior t
o de
ploy
men
t in
the
ocea
n. S
uppo
rt to
the
Nav
y in
clud
es te
stin
g of
all
Dee
p Se
a R
escu
e V
ehic
le (D
SRV
) and
dee
p su
bmer
genc
e ba
tterie
s, fib
er o
ptic
cab
les a
nd c
onne
ctor
s, el
ectro
nic
bottl
es th
at a
re to
be
used
in th
e de
ep o
cean
env
ironm
ent,
RO
V's,
dee
p se
a lig
hts a
nd c
amer
as a
s wel
l as m
any
othe
r typ
es o
f equ
ipm
ent.
All
is b
eing
con
duct
ed w
ithin
the
Oce
an E
ngin
eerin
g B
usin
ess L
ine;
man
y of
the
test
s res
ult i
n fo
llow
on
wor
k fo
r the
O B
L.In
tegr
al to
the
faci
lity
is a
n ov
erhe
ad b
ridge
cra
ne th
at is
use
d to
load
/unl
oad
the
pres
sure
ves
sels
. In
Mar
ch o
f thi
s yea
r, N
avy
Cra
ne C
ente
r (N
CC
) ins
pect
ors,
whi
le p
erfo
rmin
g th
eir a
nnua
l rec
ertif
icat
ion
of th
e cr
ane,
info
rmed
NA
VFA
C E
SC v
erba
lly th
at d
ue to
the
age
of th
e cr
ane
(+40
yea
rs) a
nd
the
non
avai
labi
lity
of re
pair
parts
(man
ufac
ture
r clo
sed
30 y
ears
ago
) tha
t thi
s wou
ld b
e th
e la
st ti
me
the
cran
e co
uld
be c
ertif
ied.
In
shor
t, th
e cr
ane
that
supp
orts
all
wor
k in
the
faci
lity
will
nee
d to
be
rem
oved
and
dis
pose
d of
in M
arch
of 2
010.
With
out t
he c
rane
, thi
s uni
que
and
vita
l fac
ility
(the
onl
y on
e of
its k
ind
wes
t of t
he M
issi
ssip
pi/o
ne o
f tw
o in
the
coun
try) w
ill h
ave
to sh
ut d
own.
The
NC
C's
reco
mm
enda
tion
is th
at a
new
brid
ge a
nd h
oist
syst
em b
e pr
ocur
ed a
nd in
stal
led.
Thi
s pur
chas
e m
ust b
e m
ade
thro
ugh
NC
C.
They
als
o pr
ovid
ed a
RO
M
quot
e of
$50
0,00
0.00
for p
urch
ase
of th
e ne
w c
rane
, rem
oval
of t
he o
ld u
nit a
nd in
stal
latio
n of
the
new
one
. Sc
alin
g do
wn
the
size
of t
he c
rane
was
di
scus
sed
and
foun
d to
not
be
feas
ible
. R
ebui
ldin
g th
e cr
ane
coul
d ru
n al
mos
t $1M
due
to it
s age
and
the
unav
aila
bilit
y of
par
ts.
AC
TIV
ITY
GR
OU
P C
API
TAL
INV
ESTM
ENT
JUST
IFIC
ATI
ON
Fisc
al Y
ear (
FY) 2
011
Bud
get E
stim
ates
($ in
Tho
usan
ds)
#001
- N
on-A
DPE
and
Tel
ecom
mun
icat
ions
Rep
lace
men
t Cap
abili
ties
Nav
al F
acili
tes E
ngin
eerin
g Se
rvic
e C
ente
r (N
FESC
)
Febr
uary
201
0
Just
ifica
tion:
FY
201
1
Non
-AD
PE a
nd T
elec
omm
unic
atio
ns E
quip
men
t
FY
200
8F
Y 2
010
FY
200
9
Exh
ibit
Fund
-9B
Cap
ital P
urch
ase
Just
ifica
tion

Dep
artm
ent o
f the
Nav
y / B
ase
Supp
ort /
Nav
al F
acili
ties
Engi
neer
ing
Serv
ice
Cen
ter
Qua
ntU
nit C
ost
Tota
l Cos
tQ
uant
Uni
t Cos
tTo
tal C
ost
Qua
ntU
nit C
ost
Tota
l Cos
tC
omp
ute
r H
ard
war
e (P
rod
uct
ion
)0
00
00
00
Com
pu
ter
Sof
twar
e (O
per
atin
g S
yste
m)
00
00
00
00
0T
elec
omm
un
icat
ion
s0
00
00
00
00
Oth
er C
omp
ute
r &
Tel
ecom
mu
nic
atio
ns
Sp
t E
qu
ipm
ent
00
00
00
00
0To
tal
00
00
00
00
0
Not
App
licab
le
FY
201
1
Just
ifica
tion:
AD
PE a
nd T
elec
omm
unic
atio
ns E
quip
men
t
FY
200
8F
Y 2
010
FY
200
9
AC
TIV
ITY
GR
OU
P C
API
TAL
INV
ESTM
ENT
JUST
IFIC
ATI
ON
Fisc
al Y
ear (
FY) 2
011
Bud
get E
stim
ates
($ in
Tho
usan
ds)
#002
- A
DPE
and
Tel
ecom
mun
icat
ions
Cap
abili
ties
Nav
al F
acili
tes E
ngin
eerin
g Se
rvic
e C
ente
r (N
FESC
)
Febr
uary
201
0 Exh
ibit
Fund
-9B
Cap
ital P
urch
ase
Just
ifica
tion
Dep
artm
ent o
f the
Nav
y / B
ase
Supp
ort /
Nav
al F
acili
ties
Engi
neer
ing
Serv
ice
Cen
ter
Qua
ntU
nit C
ost
Tota
l C
ost
Qua
ntU
nit C
ost
Tota
l C
ost
Qua
ntU
nit C
ost
Tota
l C
ost
List
Indi
vidu
al P
roje
ct N
ame,
As R
equi
red
00
0To
tal
00
00
00
Not
App
licab
le
FY
201
1
Just
ifica
tion:
Softw
are
FY
200
8F
Y 2
010
FY
200
9
AC
TIV
ITY
GR
OU
P C
API
TAL
INV
ESTM
ENT
JUST
IFIC
ATI
ON
Fisc
al Y
ear (
FY) 2
011
Bud
get E
stim
ates
($ in
Tho
usan
ds)
#003
- So
ftwar
e (S
how
Indi
vidu
al P
roje
ct N
ame,
As R
equi
red)
Nav
al F
acili
tes E
ngin
eerin
g Se
rvic
e C
ente
r (N
FESC
)
Febr
uary
201
0
Exh
ibit
Fund
-9B
Cap
ital P
urch
ase
Just
ifica
tion

Dep
artm
ent o
f the
Nav
y / B
ase
Supp
ort /
Nav
al F
acili
ties
Engi
neer
ing
Serv
ice
Cen
ter
Qua
ntU
nit C
ost
Tota
l Cos
tQ
uant
Uni
t Cos
tTo
tal C
ost
Qua
ntU
nit C
ost
Tota
l Cos
tR
epla
cem
ent E
quip
men
t0
00
00
00
00
00
0To
tal
00
00
00
00
00
00
Not
App
licab
le.
AC
TIV
ITY
GR
OU
P C
API
TAL
INV
ESTM
ENT
JUST
IFIC
ATI
ON
Fisc
al Y
ear (
FY) 2
011
Bud
get E
stim
ates
($ in
Tho
usan
ds)
#004
- M
inor
Con
stru
ctio
n $1
00K
-$75
0KN
aval
Fac
ilite
s Eng
inee
ring
Serv
ice
Cen
ter
(NFE
SC)
Febr
uary
201
0
Just
ifica
tion:
FY
201
1
Min
or C
onst
ruct
ion
FY
200
8F
Y 2
010
FY
200
9
Exh
ibit
Fund
-9B
Cap
ital P
urch
ase
Just
ifica
tion

Department of the Navy
Base Support / Naval Facilities Engineering Service Center
Fiscal Year (FY) 2011 Budget Estimates
Date: February 2010
2010
(Dollars in Millions)
Presidentʹs
Approved
Current
Asset/
FY
Approved Project
Budget
Reprogs
Proj Cost
Proj Cost
DeficiencyExplanation
2010
Equipment except ADPE and TELCOM
0.000
0.500
0.000
0.500
0.000
20/10 Ton Overhead Bridge Crane
0.000
0.500
0.000
0.500
0.000Rep
lacement
Equipment ‐ ADPE and TELCOM
0.000
0.000
0.000
0.000
0.000
Software Development
0.000
0.000
0.000
0.000
0.000
Minor Construction
0.000
0.000
0.000
0.000
0.000
TOTAL FY 2010
0.000
0.500
0.000
0.500
0.000
Exhi
bit F
und-
9C C
apita
l Bud
get E
xecu
tion

Navy Supply

Department of the Navy
Navy Working Capital Fund
Supply Management ‐ Navy
Fiscal Year (FY) 2011 Budget Estimates
February 2010
Mission Statement/Overview:
The mission of Navy Supply Management is to perform inventory management functions
resulting in the sale of aviation and shipboard components, ship’s store stock and consumables
to a wide variety of customers. Major customers include Fleet and Marine Corps forces,
Department of the Navy shore activities, Army, Air Force, Defense Agencies, other government
agencies and foreign governments. Costs related to supplying this material to customers are
recouped through stabilized rate recovery elements such as prior year gains and losses,
inventory maintenance, repair costs including attrition, and local elements. Navy Supply
Management is divided into six Budget Projects to organize the financial operations of the fund.
Budget Project
Wholesale
Aviation Consumables BP34
Ship Reparables and Consumables BP81
Aviation Reparables BP85
Retail
Ship’s Store BP21
General Consumables BP28
Operations
Operations and Reimbursables BP91
Activity Group Composition:
Navy Working Capital Fund Supply Management (NWCF‐SM) activity group is comprised of:
Naval Inventory Control Point (NAVICP):
NAVICP Mechanicsburg, PA
NAVICP Philadelphia, PA
Commander, Fleet and Industrial Supply Centers (COMFISCS):
Fleet and Industrial Supply Center, San Diego, CA
Fleet and Industrial Supply Center, Jacksonville, FL
Fleet and Industrial Supply Center, Norfolk, VA
Fleet and Industrial Supply Center, Pearl Harbor, HI
Fleet and Industrial Supply Center, Puget Sound, WA
Fleet and Industrial Supply Center, Yokosuka, JP
Fleet and Industrial Supply Center, Sigonella, IT
Navy Supply Information Systems Activity (NAVSISA), Mechanicsburg, PA

Executive Summary
Significant Changes Since the FY 2010 President’s Budget:
The following significant changes have occurred since the FY 2010 President’s Budget:
V‐22 Osprey Material Support Date (MSD)
On October 1, 2008, Navy Supply Management began supporting the V‐22 Osprey aircraft.
Previous budgets included repair and parts demand forecasts based on pre‐Material Support
Date interim support data. Since then, demand has increased significantly due to extended
operations in a desert environment and the necessary Obligation Authority has increased.
Additionally, backorders have increased while material availability has decreased. This budget
reflects increased Obligation Authority in FY 2009, FY 2010, and FY 2011.
Consumable Item Transfer (CIT)
The CIT is a bi‐annual transfer of mature pipelines from Navy Supply Management to Defense
Logistics Agency that occurs in the odd numbered years. Until recently, the number of items
transferred each year was relatively small and did not have a major impact on the budget.
However in FY 2009, two transfers occurred for 6,377 items resulting in lost annual sales of
$74.8M in FY 2009, $127.0M in FY 2010, and $127.2M in FY 2011.
CH‐53D Helicopter
The CH‐53D aircraft is deployed in support of Overseas Contingency Operations (OCO) and is
seeing an increased operation tempo. Additionally, the aircraft is undergoing a Program Life
extension from FY 2007 to FY 2018. This 43 year old aircraft is experiencing pronounced
demand increases for various components due to both extended operations and age.
Enterprise Resource Planning (ERP) System Implementation Strategy
Navy ERP release 1.1 (Single Supply Solution) is scheduled to deploy beginning in February
2010. As a hedge against potential disruptions to Fleet customer support, the FY 2009 Navy
Supply Management budget accelerated requirements, resulting in earlier than normal
procurement actions to ensure a full supply pipeline would be maintained. This approach is
similar to the process used by the Defense Logistics Agency when the Business Systems
Modernization (BSM) was implemented and is deemed to be prudent given the complexity of
deploying a new system of this magnitude. Obligation values below have been adjusted for
items transferring during Phase I, in February 2010, and obligations associated with Phases II
and III, scheduled for August 2010 and February 2011.
Budget Project ($M) FY 2009 FY 2010 FY 2011
Ship Repairables and Consumables (BP81) 17.5 6.0 0
Aviation Repairables (BP85) 19.8 11.8 0
Aviation Consumables (BP34) 11.9 40.0 0

Budget Highlights:
Operating Results
Revenue/Expense/NOR/AOR ($M) FY 2009 FY 2010 FY 2011
Net Revenue 5,926.7 6,021.2 6,347.5
Expenses 6,091.3 6,095.6 6,201.8
Net Operating Results ‐75.7 ‐55.9 164.5
Prior Year AOR ‐32.8 ‐108.5 ‐164.5
Accumulated Operating Result (AOR) ‐108.5 ‐164.5 0.0
Note: Amounts may not add properly due to rounding.
Revenue and Expense: FY 2009 Revenue and Expenses reflect actuals. FY 2010 and FY 2011
Revenue increases are driven by wholesale Aviation special programs, including the increased
V‐22 requirements. The Expense changes are consistent with revenue adjustments.
Cash Management:
As a primary consideration of this budget, Navy Supply Management has carefully balanced
concerns of NWCF solvency, impacts of potential changes to customer rates, and customer
support effectiveness.
Collections/Disbursement/Outlays ($M) FY 2009 FY 2010 FY 2011
Collections 5909.1 6021.2 6259.9
Disbursements 5945.6 6162.8 6370.8
Outlays 36.5 141.5 110.9
Transfers 1.6 48.0 60.0
Sales:
Gross Sales FY 2009 FY 2010 FY 2011
Wholesale 4,611.2 4,672.5 4,900.8
Retail 1,037.9 989.3 1,003.6
Total 5,649.1 5,661.8 5,904.3
Note: Amounts may not add properly due to rounding.
Wholesale & Retail: Sales are tied to customer funding and NAVICP’s ability to fill orders.

Metrics:
FY 2009 FY 2010 FY 2011
Items Managed 356,021 348,942 354,999
Requisitions Received 515,652 509,103 507,604
Receipts 928,078 1,276,442 1,180,192
Issues 1,107,019 1,096,596 1,099,303
Contracts Executed 49,174 43,662 41,380
Purchase Inflation 1.3% 1.1% 1.4%
Undelivered Orders: Undelivered orders represent contracts or orders for goods for which a
liability has not yet accrued. The accrual of the liability creates an outlay requirement.
FY 2009 FY 2010 FY 2011
Undelivered Orders ($M) 4574.5 4603.5 4590.0
Performance Indicators:
Primary performance measurement tool for the Supply Management business area is the
“Dashboard Metrics” tool. Dashboard Metrics provide indicators that link Navy Supply
Management’s strategic plan to the performance budget and to Chief of Naval Operations
priorities, which directly support DoD strategic goals as described in the Quadrennial Defense
Review (QDR).
Supply Management’s primary performance indicators are:
FY 2009 FY 2010 FY 2011
Customer Wait Time (days) 12.7 12.5 12.5
Ship Operating Time w/C3/C4 CASREP
Deployed 31% 25% 25%
Non‐deployed 33% 28% 28%
Aircraft Non Mission Capable Supply
Deployed
Non‐Deployed
8%
8%
10%
10%
10%
10%
Supply Material Availability 83% 85% 85%
Unit Cost
FY 2009 FY 2010 FY 2011
Wholesale 1.032 1.042 .986
Retail .899 1.001 1.001

Composite Rates:
FY 2009 FY 2010 FY 2011
Annual Price Change 1.782% 1.635% 3.231%
Composite Cost Recovery Rate (CRR) 12.660% 13.265% 15.239%
Staffing:
Civilian/Military ES & Workyears FY 2009 FY 2010 FY 2011
Civilian End Strength 7,069 6,323 6,300
Civilian Workyears 7,309 6,318 6,293
Military End Strength 369 369 369
Military Workyears 369 369 369
Civilian Personnel: The majority of the decrease in FY 2010 is the result of functional transfers
to DLA as identified below:
Manpower (End Strength) FY 2010
DLR Procurement BRAC 68
Navy Warehouse Transfer 610
FISC‐Norfolk Ocean Terminal Services 28
DLR Procurement transfers the procurement management and related support functions of
Depot Level Reparable items to DLA. The Navy Warehouse Transfer is an initiative to transfer
a significant percentage of Navy warehousing, storage, and tactical distribution functions to
DLA. The transfer contributes to the CNO’s objective to reduce Navy infrastructure footprint.
Ocean Terminal Services is part of a multi‐facetted effort to combine ocean and air shipment
processing in Norfolk into a single organization. The objective of this transfer is to service all
modes of transportation regionally and globally from a single facility.
Capital Investment Program (CIP) Budget Authority:
Capital Investment Program ($M) FY 2009 FY 2010 FY 2011
Equipment, Non‐ADPE / Telecom 1.3 1.9 1.9
Equipment, ADPE / Telecom 1.5 1.0 0.9
Software Development 10.3 3.7 2.0
Minor Construction 1.6 2.4 2.5
Total 14.7 9.0 7.3
FY 2009 Software Development includes an increase of $6.3M for ERP. The Navy Working
Capital Fund Supply Management’s CIP authority reflects a reduction in the out years due to
reduced requirements. Legacy system costs have been reduced due to implementation of ERP.

Fund
-9A
Act
ivity
Gro
up C
apita
l Inv
estm
ent S
umm
ary
Dep
artm
ent o
f the
Nav
yS
uppl
y M
anag
emen
t - N
avy
Fisc
al Y
ear (
FY) 2
011
Bud
get E
stim
ates
- Fe
brua
ry 2
010
($ in
Mill
ions
)
LIN
EIT
EM
TO
TAL
TOTA
LTO
TAL
NU
MB
ER
DE
SC
RIP
TIO
NQ
UA
NTI
TYC
OS
TQ
UA
NTI
TYC
OS
TQ
UA
NTI
TYC
OS
T
0001
Equ
ipm
ent C
apab
ilitie
s1.
257
1.89
31.
921
-
Rep
lace
men
tV
AR
1.25
7V
AR
1.89
3V
AR
1.92
1
-P
rodu
ctiv
ity
-N
ew M
issi
on
-E
nviro
nmen
tal
0002
AD
PE
& T
elec
omm
unic
atio
ns E
quip
men
t Cap
abili
ties
1.49
91.
019
0.88
0
C
ompu
ter H
ardw
are
(Pro
duct
ion)
VA
R1.
499
VA
R1.
019
VA
R0.
880
Com
pute
r Sof
twar
e (O
pera
ting
Sys
tem
)
Te
leco
ms,
Oth
er C
ompu
ter &
Tel
ecom
Sup
Equ
ip.
0003
Sof
twar
e D
evel
opm
ent
10.2
853.
743
1.95
0
In
tern
ally
Dev
elop
ed3.
618
3.74
31.
950
O
ne T
ouch
v3.
0V
AR
0.70
0V
AR
0.85
0V
AR
0.65
0
UA
DP
S-IC
P/U
AD
PS
-U2/
SP
VA
R2.
021
VA
R1.
393
0.00
0
One
Sup
ply
VA
R0.
897
VA
R1.
500
VA
R1.
300
Ext
erna
lly D
evel
opm
ent
6.66
70.
000
0.00
0
Ent
erpr
ise
Res
ourc
e P
lann
ing
VA
R6.
667
0.00
00.
000
0004
Min
or C
onst
ruct
ion
Cap
abili
ties
1.62
32.
430
2.50
0
-R
epla
cem
ent
-
Pro
duct
ivity
VA
R1.
623
VA
R2.
430
VA
R2.
500
-
New
Mis
sion
-
Env
ironm
enta
l
TOTA
L14
.664
9.08
57.
251
Tota
l Cap
ital O
utla
ys15
.394
13.1
369.
013
Tota
l Dep
reci
atio
n E
xpen
se27
.799
27.4
9326
.068
FY 2
010
FY 2
011
FY 2
009

Act
ivity
Gro
up C
apita
l Inv
estm
ent J
ustif
icat
ion
Dep
artm
ent o
f the
Nav
yS
uppl
y M
anag
emen
t-Nav
yFi
scal
Yea
r (FY
) 201
1 B
udge
t Est
imat
es -
Febr
uary
201
0($
in T
hous
ands
)
Fund
-9B
FY 2
009
Ele
men
t of
U
nit
Tota
l U
nit
Tota
l U
nit
Tota
l C
ost
Qua
ntity
Cos
tC
ost
Qua
ntity
Cos
tC
ost
Qua
ntity
Cos
tC
ost
Equ
ipm
ent C
apab
ility
R
epla
cem
ent
40V
AR
880.
000
29V
AR
1,00
0.00
031
VA
R1,
000.
000
P
rodu
ctiv
ity
New
Mis
sion
E
nviro
nmen
tal
A.
Bud
get S
ubm
issi
onFi
scal
Yea
r (FY
) 201
1 B
udge
t Est
imat
es -
Febr
uary
201
0A
CTI
VIT
Y G
RO
UP
CA
PIT
AL
INV
ES
TME
NT
JUS
TIFI
CA
TIO
N($
in T
hous
ands
)
Dep
artm
ent o
f the
Nav
y/S
uppl
y M
anag
emen
t - N
avy/
Febr
uary
201
0FY
201
0
D.
Act
ivity
Iden
tific
atio
n00
01 M
ater
ial H
andl
ing
Equ
ipm
ent (
Fork
lifts
)N
WC
FFY
201
1
B.
Com
pone
nt/B
usin
ess
Are
a/D
ate
C.
Line
No.
& It
em D
escr
iptio
n
Nar
rativ
e Ju
stifi
catio
n:
This
pro
gram
fund
s th
e pr
ocur
emen
t of n
ew/in
itial
out
fittin
g an
d re
plac
emen
t of M
ater
ial H
andl
ing
Equ
ipm
ent (
MH
E) a
nd A
utom
ated
Mat
eria
l Han
dlin
g S
yste
ms
(AM
HS
) to
satis
fy o
pera
tiona
l req
uire
men
ts
with
in th
e N
avy
Sup
ply
Sys
tem
. R
epla
cem
ent M
HE
is fo
r ove
r age
d no
n-re
paira
ble
equi
pmen
t use
d in
mat
eria
l han
dlin
g op
erat
ions
at v
ario
us a
ctiv
ities
. W
ith a
larg
e in
vent
ory
of e
quip
men
t at t
he v
ario
us
Flee
t and
Indu
stria
l Sup
ply
Cen
ters
(FIS
Cs)
ther
e w
ill a
lway
s be
uni
ts e
ligib
le fo
r rep
lace
men
t thr
ough
pro
cure
men
t. If
fully
sup
porte
d, th
is fu
ndin
g w
ill a
llow
the
Nav
y to
dev
elop
the
right
mix
of n
ew
proc
urem
ents
, res
ultin
g in
ove
rall
requ
irem
ent r
educ
tions
, and
reso
lvin
g th
e pr
oble
m o
f try
ing
to m
aint
ain
old
equi
pmen
t at h
igh
mai
nten
ance
cos
t and
redu
ced
stat
e of
read
ines
s. M
HE
fund
ing
limita
tions
in
past
yea
rs h
as p
recl
uded
the
purc
hase
of r
equi
red
MH
E p
lann
ed fo
r iss
ue.
We
can
not e
mph
asiz
e en
ough
that
this
is a
con
tinui
ng p
rogr
am a
nd o
ne y
ear b
uild
s on
the
next
. Del
ayin
g an
y fu
ndin
g on
ly
post
pone
s th
e in
evita
ble
requ
irem
ent t
o pr
ocur
e a
new
uni
t at a
hig
her c
ost.
Sup
ply
read
ines
s an
d lo
gist
ical
sup
port
are
depe
nden
t upo
n th
e av
aila
bilit
y of
relia
ble
MH
E.
Non
-rep
aira
ble
equi
pmen
t is
not
cost
effe
ctiv
e to
mai
ntai
n fo
r con
tinue
d op
erat
ion,
and
repa
ir pa
rts a
re d
iffic
ult t
o ob
tain
. R
epla
cem
ent o
f non
-rep
aira
ble
equi
pmen
t with
new
and
mor
e ef
ficie
nt m
odel
s w
ill re
duce
exc
essi
ve c
osts
attr
ibut
ed
to re
pair/
over
haul
, dow
ntim
e an
d m
aint
enan
ce.
New
equ
ipm
ent w
ill e
nhan
ce p
rodu
ctiv
ity a
nd e
nabl
e us
ers
to m
eet h
andl
ing
and
logi
stic
s re
quire
men
ts in
an
effic
ient
and
effe
ctiv
e m
anne
r. F
or th
ese
reas
ons
it is
ess
entia
l to
mai
ntai
n fu
ndin
g to
cov
er p
rocu
rem
ent o
f new
equ
ipm
ent a
s re
quire
d.
Due
to F
ISC
real
ignm
ent w
ith D
LA, t
he n
umbe
r of f
orkl
ifts
requ
iring
repl
acem
ent h
as d
ecre
ased
in th
e ou
t ye
ars
thus
low
erin
g ou
r FY
-10
and
11 fu
ndin
g re
quire
men
t.

Act
ivity
Gro
up C
apita
l Inv
estm
ent J
ustif
icat
ion
Dep
artm
ent o
f the
Nav
yS
uppl
y M
anag
emen
t-Nav
yFi
scal
Yea
r (FY
) 201
1 B
udge
t Est
imat
es -
Febr
uary
201
0($
in T
hous
ands
)
Fund
-9B
FY 2
009
Ele
men
t of
U
nit
Tota
l U
nit
Tota
l U
nit
Tota
l C
ost
Qua
ntity
Cos
tC
ost
Qua
ntity
Cos
tC
ost
Qua
ntity
Cos
tC
ost
Equ
ipm
ent C
apab
ility
R
epla
cem
ent
VA
RV
AR
377.
000
VA
RV
AR
893.
000
VA
RV
AR
921.
000
P
rodu
ctiv
ity
New
Mis
sion
E
nviro
nmen
tal
A.
Bud
get S
ubm
issi
onFi
scal
Yea
r (FY
) 201
1 B
udge
t Est
imat
es -
Febr
uary
201
0
FY 2
010
FY 2
011
NW
CF
AC
TIV
ITY
GR
OU
P C
AP
ITA
L IN
VE
STM
EN
T JU
STI
FIC
ATI
ON
($ in
Tho
usan
ds)
Dep
artm
ent o
f the
Nav
y/S
uppl
y M
anag
emen
t - N
avy/
Febr
uary
201
0B
. C
ompo
nent
/Bus
ines
s A
rea/
Dat
eC
. Li
ne N
o. &
Item
Des
crip
tion
D.
Act
ivity
Iden
tific
atio
n00
01 C
ivil
Eng
inee
ring
Sup
port
Equ
ipm
ent
Nar
rativ
e Ju
stifi
catio
n:
Nav
al S
uppl
y S
yste
ms
Com
man
d (N
AV
SU
P) i
s re
spon
sibl
e fo
r rep
laci
ng a
nd m
aint
aini
ng a
ging
Civ
il E
ngin
eerin
g S
uppo
rt E
quip
men
t (C
ES
E) n
eces
sary
for f
uel d
epot
ope
ratio
ns th
roug
hout
the
Nav
y. T
his
equi
pmen
t is
nece
ssar
y to
mai
ntai
n an
d im
prov
e th
e w
orki
ng c
ondi
tions
and
ass
ist N
AV
SU
P o
pera
tions
em
ploy
ees.
Saf
ety,
relia
bilit
y, m
aint
enan
ce c
ost a
nd c
usto
mer
sup
port
are
dire
ctly
impa
cted
by
age
and
cond
ition
of t
his
equi
pmen
t. E
cono
mic
ana
lysi
s is
not
pro
vide
d si
nce
equi
pmen
t is
only
repl
aced
as
usef
ul li
fe h
as b
een
exce
eded
due
to a
ge a
nd o
r usa
ge.
Dol
lar v
alue
s ar
e es
tabl
ishe
d by
NA
VFA
C p
rocu
ring
activ
ity in
Por
t Hue
nem
e, C
A.
Exa
mpl
es:
Tank
er tr
uck,
, 20
ton
sem
i tra
iler s
take
2 a
xle,
20
ton
sem
i tra
iler v
an 2
axl
e.

Act
ivity
Gro
up C
apita
l Inv
estm
ent J
ustif
icat
ion
Dep
artm
ent o
f the
Nav
yS
uppl
y M
anag
emen
t-Nav
yFi
scal
Yea
r (FY
) 201
1 B
udge
t Est
imat
es -
Febr
uary
201
0($
in T
hous
ands
)
Fund
-9B
0002
Info
rmat
ion
Tech
nolo
gyFY
200
9E
lem
ent o
f
Uni
tTo
tal
Uni
tTo
tal
Uni
tTo
tal
Cos
tQ
uant
ityC
ost
Cos
tQ
uant
ityC
ost
Cos
tQ
uant
ityC
ost
Cos
t
AD
PE
& T
elec
omm
unic
atio
ns E
quip
men
t Cap
abili
ties
C
ompu
ter H
ardw
are
(Pro
duct
ion)
VA
RV
AR
1,49
9.00
0V
AR
VA
R1,
019.
000
VA
RV
AR
880.
000
C
ompu
ter S
oftw
are
(Ope
ratin
g S
yste
m)
T
elec
oms,
Oth
er C
ompu
ter &
Tel
ecom
Sup
Equ
ip.
D.
Act
ivity
Iden
tific
atio
nN
WC
FFY
201
0
A.
Bud
get S
ubm
issi
onFi
scal
Yea
r (FY
) 201
1 B
udge
t Est
imat
es -
Febr
uary
201
0
FY 2
011
AC
TIV
ITY
GR
OU
P C
AP
ITA
L IN
VE
STM
EN
T JU
STI
FIC
ATI
ON
($ in
Tho
usan
ds)
Dep
artm
ent o
f the
Nav
y/S
uppl
y M
anag
emen
t - N
avy/
Febr
uary
201
0B
. C
ompo
nent
/Bus
ines
s A
rea/
Dat
eC
. Li
ne N
o. &
Item
Des
crip
tion
Nar
rativ
e Ju
stifi
catio
n:
Nav
y S
uppl
y In
form
atio
n S
yste
ms
Act
ivity
(NA
VS
ISA
) - F
unds
pro
vide
sup
port
to th
e N
AV
SIS
A L
egac
y/N
on-N
avy/
Mar
ine
Cor
ps In
trane
t (N
MC
I) N
etw
ork
Pla
n. A
s pa
rt of
the
plan
, NA
VS
ISA
is u
pgra
ding
its
NE
TWA
RC
OM
app
rove
d le
gacy
net
wor
k, w
hich
will
repl
ace
obso
lete
non
-NM
CI A
DP
equ
ipm
ent t
o pr
ovid
e an
env
ironm
ent f
or c
lient
/ser
ver d
evel
opm
ent.
A v
arie
ty o
f PC
har
dwar
e pl
atfo
rms
curr
ently
exi
sts
in N
AV
SIS
A th
at p
reve
nts
depl
oym
ent o
f the
de
velo
pmen
t too
ls n
eede
d to
mai
ntai
n its
com
petit
iven
ess.
Upg
radi
ng a
nd s
tand
ardi
zing
har
dwar
e in
frast
ruct
ure
will
allo
w N
AV
SIS
A to
use
the
netw
ork
to d
eplo
y th
e la
test
lega
cy/n
on-N
MC
I sof
twar
e pr
oduc
ts.

Act
ivity
Gro
up C
apita
l Inv
estm
ent J
ustif
icat
ion
Dep
artm
ent o
f the
Nav
yS
uppl
y M
anag
emen
t-Nav
yFi
scal
Yea
r (FY
) 201
1 B
udge
t Est
imat
es -
Febr
uary
201
0($
in T
hous
ands
)
Fund
-9B
0003
One
Tou
ch S
uppo
rtFY
200
9E
lem
ent o
f
Uni
tTo
tal
Uni
tTo
tal
Uni
tTo
tal
Cos
tQ
uant
ityC
ost
Cos
tQ
uant
ityC
ost
Cos
tQ
uant
ityC
ost
Cos
tS
oftw
are
Dev
elop
men
t
One
Tou
ch S
uppo
rtV
AR
VA
R70
0.00
0V
AR
VA
R85
0.00
0V
AR
VA
R65
0.00
0
D.
Act
ivity
Iden
tific
atio
nN
WC
FFY
201
0
Fisc
al Y
ear (
FY) 2
011
Bud
get E
stim
ates
- Fe
brua
ry 2
010
A.
Bud
get S
ubm
issi
on
FY 2
011
AC
TIV
ITY
GR
OU
P C
AP
ITA
L IN
VE
STM
EN
T JU
STI
FIC
ATI
ON
($ in
Tho
usan
ds)
Dep
artm
ent o
f the
Nav
y/S
uppl
y M
anag
emen
t - N
avy/
Febr
uary
201
0B
. C
ompo
nent
/Bus
ines
s A
rea/
Dat
eC
. Li
ne N
o. &
Item
Des
crip
tion
Nar
rativ
e Ju
stifi
catio
n:W
eb-b
ased
real
-tim
e da
ta a
cces
s an
d st
atus
info
rmat
ion
to le
gacy
Nav
y an
d D
LA le
gacy
/DLA
ER
P s
uppl
y sy
stem
pro
vidi
ng s
uppl
y te
chni
cal s
cree
ning
, sto
ck c
heck
info
rmat
ion
for N
SN
s, re
quis
ition
sta
tus,
M
ILS
TRIP
ent
ry, s
hipm
ent s
tatu
s, a
nd s
eria
l num
ber t
rack
ing
for D
epot
Lev
el R
epai
rabl
es. O
TS p
rovi
des
a co
mm
on v
iew
acr
oss
DLA
and
Nav
y in
vent
ory
appl
icat
ions
and
dis
tribu
ted
data
base
s an
d pr
ovid
es a
si
ngle
-poi
nt, c
entra
lly m
anag
ed g
loba
l acc
ess
avai
labl
e to
all
auth
oriz
ed u
sers
thro
ugh
a st
anda
rd w
eb-b
row
ser.
Com
plet
e en
d-to
-end
real
-tim
e su
pply
cha
in c
apab
ility
and
vis
ibili
ty is
pro
vide
d th
roug
h O
TS.
Nav
y E
RP
pla
ns to
use
OTS
to s
atis
fy d
ata
acce
ss re
quire
men
ts fo
r ext
erna
l (re
ad-o
nly)
use
rs o
f sub
sum
ed s
yste
ms.
OTS
is a
n id
entif
ied
inte
rface
for N
avy
ER
P 1
.1 a
nd 1
.X. C
ost a
void
ance
ass
ocia
ted
with
this
ER
P
inte
rface
is th
e pr
ojec
ted
user
bas
e m
ultip
lied
by a
ssoc
iate
d S
AP
lice
nses
, as
wel
l as
the
cost
avo
idan
ce a
ssoc
iate
d w
ith S
AP
inte
grat
ion
to th
e m
ultip
le D
OD
and
Nav
y le
gacy
sys
tem
inte
rface
s th
at O
ne T
ouch
cu
rren
tly p
rovi
des.
One
Tou
ch tr
ansa
ctio
n w
orkl
oad
reve
rting
to a
cal
l cen
ter,
i.e. t
he G
loba
l Dis
tanc
e S
uppo
rt C
ente
r (G
DS
C) a
nd p
erso
nal a
ssis
tanc
e, i.
e. L
ogis
tics
Sup
port
Cen
ters
(LS
C) a
nd o
ther
sub
mis
sion
pr
oces
ses
into
the
supp
ly s
yste
m e
xpon
entia
lly in
crea
ses
trans
actio
n pr
oces
sing
tim
e an
d su
ppor
t cos
ts. A
pplic
atio
n of
a s
impl
e w
orkl
oad
form
ula
prod
uces
a ro
ugh
orde
r of m
agni
tude
whi
ch in
dica
tes
a si
gnifi
cant
co
st im
pact
with
out a
cces
s to
OTS
cap
abili
ty w
ithin
thes
e lo
gist
ics
supp
ort f
unct
ions
. If 5
0% o
f OTS
wor
kloa
d pu
shed
into
the
GD
SC
, cos
t for
pro
cess
ing
wor
kloa
d is
pro
ject
ed a
t $23
,045
,650
. Add
ition
al c
ost f
or
proc
essi
ng a
ctio
ns a
cces
sing
mul
tiple
sys
tem
s ra
ther
than
one
sys
tem
(OTS
) will
driv
e in
divi
dual
tran
sact
ion
cost
s ev
en h
ighe
r. If
10%
of O
TS w
orkl
oad
push
ed in
to th
e LS
C, c
osts
wou
ld in
crea
se w
ithin
the
LSC
by
$16
,344
,143
. Add
ition
al ti
me
requ
ired
for p
roce
ssin
g ac
tions
acc
essi
ng m
ultip
le s
yste
ms
rath
er th
an o
ne s
yste
m (O
TS) w
ill d
rive
trans
actio
n co
sts
high
er.
An
econ
omic
ana
lysi
s w
as p
erfo
rmed
and
sub
mitt
ed
as p
art o
f the
FY
06 B
MM
P s
ubm
issi
on fo
r One
Tou
ch S
uppo
rt, a
nd u
pdat
ed in
FY
2009
. It w
as a
ppro
ved
Janu
ary
25, 2
006.
Cos
t avo
idan
ce re
late
d to
ope
ratio
nal e
ffici
enci
es in
use
of O
TS is
est
imat
ed a
t $1.
5 m
illio
n an
nual
ly F
Y06
-FY
12 d
urin
g th
e sy
stem
's re
mai
ning
life
cycl
e. In
vest
men
t & R
etur
n (F
YD
P $
’s b
ased
on
FY07
BE
S) (
Pro
ject
ed) R
OI:
1.0
5 B
reak
even
: 20
12 N
PV
: $0
.327
M.
Den
ial o
f thi
s fu
ndin
g w
ould
gr
eatly
affe
ct D
oN o
pera
tions
. Cus
tom
er S
uppo
rt is
not
par
t of t
he c
urre
nt N
avy
ER
P p
roce
ss fo
otpr
int.
The
cust
omer
sel
f-ser
vice
cap
abili
ty a
nd w
orkl
oad
capa
city
ass
ocia
ted
with
OTS
as
an in
terim
sol
utio
n pr
oces
sing
into
bot
h E
RP
sys
tem
s an
d le
gacy
sys
tem
s si
gnifi
cant
ly s
tream
lines
and
sta
ndar
dize
s m
anag
emen
t of l
ogis
tics
func
tions
and
requ
isiti
onin
g pr
oces
ses.
OTS
pro
vide
s w
orld
wid
e, re
al ti
me
visi
bilit
y of
N
aval
and
DLA
ass
ets.
The
OTS
pro
gram
insu
res
that
tim
ely
and
accu
rate
info
rmat
ion
is p
rovi
ded
to m
eet t
he n
eeds
of t
he w
ar fi
ghte
r, an
d fu
rther
ena
bles
Nav
y H
uman
Cap
ital S
trate
gy g
oals
by
prov
idin
g a
capa
bilit
y th
at p
erm
its s
igni
fican
tly m
ore
wor
k to
be
done
by
few
er p
erso
nnel
. Cus
tom
er S
uppo
rt P
roce
ss im
pact
due
to fu
ndin
g el
imin
atio
n: a
. Fra
ctur
es c
usto
mer
sup
port
met
hods
and
requ
ires
wor
kloa
d pr
oces
sing
thro
ugh
disp
arat
e sy
stem
s ra
ther
than
sin
gle
poin
t of e
ntry
. b.
If a
t lea
st 4
0% o
f the
OTS
wor
kloa
d ba
ck to
Fle
et fo
r pro
cess
ing
thro
ugh
mul
tiple
sys
tem
s, s
igni
fican
t add
ition
al tr
aini
ng c
osts
ass
ocia
ted
with
use
of m
ultip
le s
yste
ms
and
affe
cts
Hum
an C
apita
l Stra
tegy
obj
ectiv
es a
ssoc
iate
d w
ith m
ovin
g w
orkl
oad
asho
re. H
ighe
r tra
nsac
tion
cost
than
if O
TS a
vaila
ble
to c
usto
mer
. Cus
tom
ers'
gre
ater
relia
nce
on
Glo
bal D
ista
nce
Sup
port
Cen
ter a
nd L
ogis
tics
Sup
port
Cen
ter w
ould
ove
rload
the
capa
bilit
ies
of b
oth
thos
e al
tern
ativ
es. c
. Im
pairs
Fle
et re
adin
ess
by fo
rcin
g us
e of
mul
tiple
tool
s ra
ther
than
sin
gle
poin
t of e
ntry
. d.
Ass
et v
isib
ility
is re
duce
d as
alte
rnat
e sy
stem
s do
not
pre
sent
ly p
rovi
de a
cces
s to
all
syst
ems
OTS
pro
vide
s e.
Ful
l sup
ply
chai
n st
atus
vis
ibili
ty is
deg
rade
d - e
limin
atio
n of
OTS
elim
inat
es e
nd-to
-end
vie
w o
f re
quis
ition
sta
tus
(req
uisi
tion
inpu
t thr
ough
del
iver
y) in
clud
ing
proc
urem
ent s
tatu
s in
form
atio
n as
wel
l as
asse
t vis
ibili
ty. E
nd-to
-end
ava
ilabi
lity
was
sig
nific
antly
enh
ance
d in
FY
08 a
s O
TS re
plac
ed th
e S
eria
l N
umbe
r Tra
ckin
g S
yste
m (S
NTS
) with
ext
ends
the
visi
ble
supp
ly c
hain
to in
clud
e re
paira
ble
item
inst
alla
tion/
rem
oval
and
car
cass
trac
king
thro
ugh
com
mer
cial
and
org
anic
dep
ot le
vel r
epai
r. Th
is fu
ll pi
ctur
e is
not
pr
ovid
ed th
roug
h an
y ot
her t
ool p
rese
ntly
ava
ilabl
e to
ove
r 10,
000
regi
ster
ed u
sers
. Web
-ena
bled
sys
tem
faci
litat
es e
ase
of in
tegr
atio
n w
ith o
ther
DO
D/D
ON
logi
stic
s/su
pply
sys
tem
s, D
LA a
nd N
avy
ER
P s
yste
ms,
an
d af
ford
s 24
/7 a
cces
s by
the
user
. Th
e sy
stem
is in
sus
tain
men
t with
lim
ited
inte
grat
ion
and
inte
rface
requ
irem
ents
thro
ugh
ER
P b
row
nout
in F
Y10
. O
ngoi
ng s
yste
m d
evel
opm
ent p
rimar
ily is
focu
sed
on to
ols
enab
ling
logi
stic
s su
ppor
t for
the
Litto
ral C
omba
t Shi
p (L
CS
), an
d in
tegr
atio
n w
ith th
e N
avy
Info
rmat
ion
App
licat
ion
Pro
duct
Sui
te (N
IAP
S) f
or a
float
use
rs.
OTS
sof
twar
e is
mai
ntai
ned
and
deve
lope
d in
tern
ally
at
NA
VS
ISA
, Mec
hani
csbu
rg, P
A.
Lice
nse
fees
are
incl
uded
as
part
of th
e N
AV
SU
P e
nter
pris
e O
racl
e lic
ense
s an
d ar
e no
t sep
arat
ely
char
ged
to th
e pr
ogra
m.

Act
ivity
Gro
up C
apita
l Inv
estm
ent J
ustif
icat
ion
Dep
artm
ent o
f the
Nav
yS
uppl
y M
anag
emen
t-Nav
yFi
scal
Yea
r (FY
) 201
1 B
udge
t Est
imat
es -
Febr
uary
201
0($
in T
hous
ands
)
Fund
-9B
FY 2
009
Ele
men
t of
U
nit
Tota
l U
nit
Tota
l U
nit
Tota
l C
ost
Qua
ntity
Cos
tC
ost
Qua
ntity
Cos
tC
ost
Qua
ntity
Cos
tC
ost
Sof
twar
e D
evel
opm
ent
UA
DP
S-IC
P/U
AD
PS
-U2/
SP
VA
RV
AR
2,02
1.00
0V
AR
VA
R1,
393.
000
0.00
0
B.
Com
pone
nt/B
usin
ess
Are
a/D
ate
C.
Line
No.
& It
em D
escr
iptio
nD
epar
tmen
t of t
he N
avy/
Sup
ply
Man
agem
ent -
Nav
y/Fe
brua
ry 2
010
A.
Bud
get S
ubm
issi
onFi
scal
Yea
r (FY
) 201
1 B
udge
t Est
imat
es -
Febr
uary
201
0A
CTI
VIT
Y G
RO
UP
CA
PIT
AL
INV
ES
TME
NT
JUS
TIFI
CA
TIO
N($
in T
hous
ands
)
FY 2
011
FY 2
010
0003
UA
DP
S-IC
P/U
AD
PS
-U2/
SP
D.
Act
ivity
Iden
tific
atio
nN
WC
F
Nar
rativ
e Ju
stifi
catio
n:
Ree
ngin
eer a
nd m
oder
nize
cor
e bu
sine
ss s
yste
ms
that
will
not
be
repl
aced
by
NE
RP
Sin
gle
Sup
ply
Sol
utio
n. M
any
NA
VS
UP
sys
tem
s ha
ve b
een
in a
“bro
wn-
out”
stat
us w
aitin
g fo
r ER
P im
plem
enta
tion.
The
pu
rpos
e of
this
fund
ing
is to
mod
erni
ze th
ose
syst
ems
and
add
func
tiona
lity
whe
re a
ppro
pria
te to
brin
g th
ese
syst
em o
ut o
f a s
tate
of o
bsol
esce
nce.
Fun
ding
will
be
used
to:
-
sin
gle
up fu
nctio
nalit
y in
mul
tiple
sys
tem
s, to
elim
inat
e re
dund
ant f
unct
iona
lity,
and
reen
gine
erin
g/ m
oder
niza
tion
as re
quire
d to
inte
grat
e w
ith, o
r be
"bol
t-ons
" to
ER
P in
clud
e, b
ut a
re n
ot li
mite
d to
the
follo
win
g ap
plic
atio
ns/s
yste
ms:
Inte
grat
ed T
echn
ical
Item
Man
agem
ent a
nd P
rocu
rem
ent (
ITIM
P),
Reg
iona
l One
Tou
ch (R
1T),
Nav
y S
uppl
y D
iscr
epan
cy R
epor
ting
Sys
tem
(NS
DR
S),
Info
rM-2
1/D
ata
War
ehou
sing
, Log
istic
s S
uppo
rt C
ente
r /Lo
gist
ic S
uppo
rt C
ente
r/Log
istic
Cus
tom
er A
sset
Vis
ibili
ty (L
SC
/LC
AV
), S
tand
ard
Aut
omat
ed L
ogis
tics
Tool
Set
(SA
LTS
), S
eria
l Num
ber T
rack
ing
(SN
T), e
lect
roni
c R
etro
grad
e m
anag
emen
t S
yste
m (e
RM
S),
Re-
Eng
inee
red
Mar
itim
e A
llow
ance
Dev
elop
men
t (R
eMA
D),
Aut
omat
ed C
OS
AL
Trac
king
Sys
tem
-Inte
rnat
iona
l Log
istic
s (A
CTS
-IL),
Tier
II O
racl
e, e
tc.
-
reen
gine
er a
nd m
oder
nize
the
Rea
dine
ss S
uite
(Rea
dine
ss B
ased
Spa
ring
(RB
S) W
orks
tatio
n/C
omm
on R
ates
Com
puta
tion
Sys
tem
-Com
man
d A
llow
ance
Dev
elop
men
t (C
RC
S-C
AD
)) a
pplic
atio
n. I
ncre
ased
fu
nctio
nalit
y w
ill b
e pr
ovid
ed th
roug
h in
corp
orat
ing
chan
ges
that
com
e ou
t of t
he A
viat
ion
Con
sum
able
Ass
essm
ent S
tudy
; enh
anci
ng ra
te c
ompu
tatio
ns, c
andi
date
file
pre
para
tion
and
allo
wan
ce c
ompu
tatio
n fo
r Fl
eet R
eadi
ness
Cen
ters
; ena
ble
auto
mat
ed p
repa
ratio
n of
tailo
red
Airc
raft
and
Equ
ipm
ent C
onfig
urat
ion
List
with
tran
smis
sion
to th
e fle
et fo
r rev
iew
; mod
ify th
e ap
plic
atio
n to
con
side
r wei
ght,
cube
, and
oth
er
fact
ors
requ
ired
to s
uppo
rt pr
epar
atio
n of
CV
N21
can
dida
te fi
les;
mod
ify th
e M
ariti
me
appl
icat
ion
to in
clud
e pr
ovis
ions
for d
ual r
ates
revi
ew c
apab
ility
.
- a
dopt
ion
of a
ser
vice
orie
nted
arc
hite
ctur
e to
sup
port
inte
rope
rabi
lity
and
seam
less
inte
grat
ion
with
N-E
RP
del
iver
y. T
he a
dopt
ion
of a
sta
ndar
d de
velo
pmen
t env
ironm
ent f
or th
e re
mai
ning
app
licat
ions
to
low
er fu
ture
tota
l ow
ners
hip
cost
s. C
onso
lidat
e re
dund
ant d
ata
war
ehou
ses
at IC
P (e
.g. F
ocus
into
Info
rM-2
1). C
ogno
s U
pgra
de (S
W U
pgra
de a
nd C
SS
to a
ccom
plis
h th
e ta
sk) f
or In
forM
-21
for c
urre
nt u
sers
plu
s an
add
ition
al 1
,500
use
rs o
f the
UIC
P T
rans
actio
n H
isto
ry F
ile (d
oes
not i
nclu
de p
oten
tial D
ista
nce
Sup
port
or o
ther
FIS
C/IC
P u
sers
.
- im
prov
e ou
r PB
L Tr
acki
ng a
pplic
atio
n, w
hich
is c
alle
d fo
r in
an IG
find
ing.
- c
ompl
ete
the
Tand
em R
etire
men
t and
IDM
S u
pgra
de.
-
pro
duce
a N
AV
ICP
in-T
rans
it A
ccou
nt (N
ITA
) mod
ule
of e
RM
S w
hich
will
retir
e N
AV
ICP
's le
gacy
Car
cass
Tra
ckin
g (P
R04
A) a
nd S
tock
-in-T
rans
it (P
M76
) pro
gram
s an
d pr
ovid
e th
at fu
nctio
nalit
y to
the
Nav
y-E
RP
pro
gram
upo
n th
at s
yste
m's
impl
emen
tatio
n.

Act
ivity
Gro
up C
apita
l Inv
estm
ent J
ustif
icat
ion
Dep
artm
ent o
f the
Nav
yS
uppl
y M
anag
emen
t-Nav
yFi
scal
Yea
r (FY
) 201
1 B
udge
t Est
imat
es -
Febr
uary
201
0($
in T
hous
ands
)
Fund
-9B
0003
One
Sup
ply
FY 2
009
Ele
men
t of
U
nit
Tota
l U
nit
Tota
l U
nit
Tota
l C
ost
Qua
ntity
Cos
tC
ost
Qua
ntity
Cos
tC
ost
Qua
ntity
Cos
tC
ost
Sof
twar
e D
evel
opm
ent
One
Sup
ply
VA
RV
AR
897.
000
VA
RV
AR
1,50
0.00
0V
AR
VA
R1,
300.
000
FY 2
010
AC
TIV
ITY
GR
OU
P C
AP
ITA
L IN
VE
STM
EN
T JU
STI
FIC
ATI
ON
($ in
Tho
usan
ds)
Dep
artm
ent o
f the
Nav
y/S
uppl
y M
anag
emen
t - N
avy/
Febr
uary
201
0B
. C
ompo
nent
/Bus
ines
s A
rea/
Dat
eC
. Li
ne N
o. &
Item
Des
crip
tion
NW
CF
A.
Bud
get S
ubm
issi
onFi
scal
Yea
r (FY
) 201
1 B
udge
t Est
imat
es -
Febr
uary
201
0
FY 2
011
D.
Act
ivity
Iden
tific
atio
n
Nar
rativ
e Ju
stifi
catio
n:
One
Sup
ply
will
be
the
mul
ti-co
mm
odity
, ash
ore
supp
ly s
uppo
rt so
lutio
n th
at e
ncom
pass
es b
oth
trans
actio
n pr
oces
sing
and
tren
d an
alys
is to
ols
to fa
cilit
ate
deci
sion
-mak
ing
acro
ss th
e su
pply
man
agem
ent s
pect
rum
. O
ne S
uppl
y w
ill p
rovi
de e
nhan
ced
supp
ort f
or w
ar fi
ghte
r log
istic
s re
sulti
ng in
impr
oved
flee
t rea
dine
ss a
nd fa
cilit
atin
g m
ovin
g w
orkl
oad
asho
re.
The
FY09
-11
info
rmat
ion
tech
nolo
gy p
lan
for O
ne S
uppl
y in
clud
es, W
eb a
pplic
atio
n so
ftwar
e en
gine
erin
g an
d de
velo
pmen
t, da
taba
se d
esig
n an
d in
terfa
ce, d
ata
war
ehou
sing
dev
elop
men
t/int
egra
tion,
as
wel
l as
inte
rface
deve
lopm
ent/l
inka
ge w
ith e
xist
ing
syst
ems.
Usi
ng th
e da
ta fr
om In
form
21
and
the
Ent
erpr
ise
Dat
a W
areh
ouse
, One
Sup
ply
will
pro
vide
the
info
rmat
ion
tool
to im
prov
e fle
et re
adin
ess.
The
cap
abili
ties
of O
ne S
uppl
y w
ill
prov
ide
the
foun
datio
n da
ta fo
r Ope
ratin
g Fo
rces
dec
isio
ns.
This
will
incl
ude
but n
ot b
e lim
ited
to M
anag
emen
t of O
pera
ting
Flee
t For
ces
from
Ash
ore,
Man
agin
g R
equi
sitio
ns fo
r Ope
ratio
nal F
orce
s, a
nd M
anag
emen
t fo
r Air
Forc
es w
ith th
e ov
eral
l obj
ectiv
e of
bet
ter m
ater
ial m
anag
emen
t for
the
fleet
. O
ne S
uppl
y w
ill p
rovi
de th
e to
ols
to e
nabl
e S
trate
gic
Sou
rcin
g de
cisi
ons
and
Dis
tanc
e S
uppo
rt to
rem
ove
wor
kloa
d fro
m th
e sh
ips
to
Ash
ore.
The
cap
abili
ties
to ti
e pa
rts a
nd c
osts
to s
peci
fic m
issi
on c
apab
ilitie
s st
arte
d in
FY
08 w
ill p
rovi
de th
e bu
ildin
g bl
ocks
for F
Y09
-11
in b
oth
appl
icat
ion
deve
lopm
ent a
nd in
frast
ruct
ure
redu
ctio
n in
the
out y
ears
w
hen
mai
nten
ance
to p
arts
inte
grat
ion
will
occ
ur. T
hese
tool
s w
ill p
rovi
de th
e fle
et a
hig
her d
egre
e of
read
ines
s. In
clus
ion
and
inte
grat
ion
of th
e m
yria
d ex
istin
g le
gacy
sys
tem
s is
als
o pl
anne
d fo
r FY
09
-11,
bas
ed o
nfu
nctio
nalit
y an
d ar
chite
ctur
al a
naly
ses
that
sta
rted
in F
Y 0
8.
One
Sup
ply
will
be
a W
eb-a
cces
sibl
e sy
stem
that
will
pro
vide
mul
ti-co
mm
odity
sto
ck c
ontro
l, re
quis
ition
pro
cess
ing,
exp
editi
ng, a
nd tr
ansa
ctio
n pr
oces
sing
as
wel
l as
anal
ytic
al p
roce
ssin
g (e
.g.,
AC
WT,
LR
T, s
tock
pos
ition
ing
and
trend
ana
lysi
s) u
sing
nex
t gen
erat
ion
info
rmat
ion
tech
nolo
gy s
tand
ards
. W
hile
One
Sup
ply
supp
orts
cap
abili
ties
not i
n sc
ope
for N
avy
ER
P, O
ne
Sup
ply
will
be
desi
gned
with
Nav
y E
RP
as
the
end-
stat
e fo
r res
pect
ive
com
mod
ity m
anag
emen
t and
sta
tistic
al a
naly
sis.

Act
ivity
Gro
up C
apita
l Inv
estm
ent J
ustif
icat
ion
Dep
artm
ent o
f the
Nav
yS
uppl
y M
anag
emen
t-Nav
yFi
scal
Yea
r (FY
) 201
1 B
udge
t Est
imat
es -
Febr
uary
201
0($
in T
hous
ands
)
Fund
-9B
0003
Ent
erpr
ise
Res
ourc
e P
lann
ing
(ER
P)
FY 2
009
Ele
men
t of
U
nit
Tota
l U
nit
Tota
l U
nit
Tota
l C
ost
Qua
ntity
Cos
tC
ost
Qua
ntity
Cos
tC
ost
Qua
ntity
Cos
tC
ost
Sof
twar
e D
evel
opm
ent
Ent
erpr
ise
Res
ourc
e P
lann
ing
(ER
P)
VA
RV
AR
6,66
7.00
00.
000
0.00
0
FY 2
010
FY 2
011
AC
TIV
ITY
GR
OU
P C
AP
ITA
L IN
VE
STM
EN
T JU
STI
FIC
ATI
ON
($ in
Tho
usan
ds)
Dep
artm
ent o
f the
Nav
y/S
uppl
y M
anag
emen
t - N
avy/
Febr
uary
201
0B
. C
ompo
nent
/Bus
ines
s A
rea/
Dat
eC
. Li
ne N
o. &
Item
Des
crip
tion
D.
Act
ivity
Iden
tific
atio
nN
WC
F
A.
Bud
get S
ubm
issi
onFi
scal
Yea
r (FY
) 201
1 B
udge
t Est
imat
es -
Febr
uary
201
0
Nar
rativ
e Ju
stifi
catio
n:
Nav
y E
RP
is a
n in
tegr
ated
bus
ines
s m
anag
emen
t sys
tem
that
mod
erni
zes
and
stan
dard
izes
Nav
y bu
sine
ss o
pera
tions
, pro
vide
s un
prec
eden
ted
man
agem
ent v
isib
ility
acr
oss
the
ente
rpris
e, a
nd in
crea
ses
effe
ctiv
enes
s an
d ef
ficie
ncy.
The
Nav
y E
RP
sol
utio
n al
low
s th
e N
avy
to s
tream
line
busi
ness
act
iviti
es in
to o
ne s
yste
m a
chie
ving
the
high
est s
tand
ard
of s
ecur
e, re
liabl
e, a
cces
sibl
e, a
nd c
urre
nt in
form
atio
n.
Pro
cess
es a
re s
impl
ified
, red
unda
ncie
s el
imin
ated
, effi
cien
cies
ach
ieve
d. N
avy
ER
P is
com
plia
nt w
ith C
FO A
ct.
Nav
y E
RP
use
s c
omm
erci
al s
oftw
are
that
requ
ires
user
s to
be
licen
sed.
The
bud
get e
stim
ate
supp
orts
the
purc
hase
of u
ser l
icen
ses
thre
e m
onth
s pr
ior t
o G
o-Li
ve.

Act
ivity
Gro
up C
apita
l Inv
estm
ent J
ustif
icat
ion
Dep
artm
ent o
f the
Nav
yS
uppl
y M
anag
emen
t-Nav
yFi
scal
Yea
r (FY
) 201
1 B
udge
t Est
imat
es -
Febr
uary
201
0($
in T
hous
ands
)
Fund
-9B
0004
Min
or C
onst
ruct
ion
FY 2
009
Ele
men
t of
U
nit
Tota
l U
nit
Tota
l U
nit
Tota
l C
ost
Qua
ntity
Cos
tC
ost
Qua
ntity
Cos
tC
ost
Qua
ntity
Cos
tC
ost
Min
or C
onst
ruct
ion
Cap
abili
ties
-
Rep
lace
men
t
-P
rodu
ctiv
ityV
AR
VA
R1,
623.
000
VA
RV
AR
2,43
0.00
0V
AR
VA
R2,
500.
000
-
New
Mis
sion
-
Env
ironm
enta
l
FY 2
010
FY 2
011
AC
TIV
ITY
GR
OU
P C
AP
ITA
L IN
VE
STM
EN
T JU
STI
FIC
ATI
ON
($ in
Tho
usan
ds)
Dep
artm
ent o
f the
Nav
y/S
uppl
y M
anag
emen
t - N
avy/
Febr
uary
201
0B
. C
ompo
nent
/Bus
ines
s A
rea/
Dat
eC
. Li
ne N
o. &
Item
Des
crip
tion
D.
Act
ivity
Iden
tific
atio
nN
WC
F
A.
Bud
get S
ubm
issi
onFi
scal
Yea
r (FY
) 201
1 B
udge
t Est
imat
es -
Febr
uary
201
0
Nar
rativ
e Ju
stifi
catio
n:
Min
or C
onst
ruct
ion:
NA
VS
UP
, as
the
mai
nten
ance
UIC
for a
ll fa
cilit
ies
occu
pied
and
ope
rate
d by
NA
VS
UP
em
ploy
ees,
is re
spon
sibl
e fo
r Rea
l Pro
perty
Mai
nten
ance
(Min
or C
onst
ruct
ion
porti
on) o
f fac
ilitie
s oc
cupi
ed a
nd o
pera
ted.
The
se N
WC
F S
uppl
y M
anag
emen
t pro
ject
s ar
e ne
cess
ary
to m
aint
ain
and
impr
ove
the
wor
king
con
ditio
ns fo
r NA
VS
UP
cla
iman
cy e
mpl
oyee
s. P
roje
cts
incl
ude
Min
or C
onst
ruct
ion
requ
irem
ents
of f
acili
ties
as w
ell a
s Q
ualit
y of
Life
and
cor
rect
ion
of S
afet
y de
ficie
ncie
s. M
inor
Con
stru
ctio
n fu
ndin
g re
ques
ted
supp
orts
the
over
all R
PM
obj
ectiv
es o
f the
NA
VFA
C re
com
men
ded
spen
ding
lim
its o
fbe
twee
n 2%
to 4
% a
nnua
lly b
ased
on
the
asso
ciat
ed p
rope
rty v
alue
s. E
cono
mic
ana
lysi
s is
not
per
form
ed s
ince
Min
or C
onst
ruct
ion
fund
ing
limits
kee
p in
vest
men
t per
cent
age
to s
uch
a sm
all p
erce
ntag
e of
the
tota
l fac
ility
val
ue.
Cos
t sav
ings
if id
entif
ied
are
prov
ided
as
part
of th
e pr
ojec
t doc
umen
tatio
n de
velo
ped.
Eac
h m
inor
con
stru
ctio
n pr
ojec
t mus
t be
less
than
$75
0,00
0. N
o m
inor
con
stru
ctio
n pr
ojec
t exc
eeds
the
curr
ent M
ILC
ON
thre
shol
d.

Fund
-9C
Cap
ital B
udge
t Exe
cutio
nD
epar
tmen
t of t
he N
avy
Sup
ply
Man
agem
ent -
Nav
yFi
scal
Yea
r (FY
) 201
1 B
udge
t Est
imat
es -
Febr
uary
201
0($
in M
illio
ns)
FY 2
009
App
rove
dC
urre
ntA
sset
/FY
App
rove
d P
roje
ctR
epro
gsP
roj C
ost
Pro
j Cos
tD
efic
ienc
yE
xpla
natio
n/R
easo
n fo
r Cha
nge
09N
on-A
DP
Equ
ipm
ent
-.812
2.06
91.
257
.000
Rep
rogr
amm
ed to
Sof
twar
e D
evel
opm
ent i
n su
ppor
t of N
avy
ER
P R
equi
rem
ent.
09A
DP
Equ
ipm
ent
-.028
1.52
71.
499
.000
Adj
uste
d re
quire
men
ts
09S
oftw
are
Dev
elop
men
t6.
032
4.25
310
.285
.000
Nav
y E
RP
Req
uire
men
t.
09M
inor
Con
stru
ctio
n-.7
422.
365
1.62
3.0
00A
djus
ted
requ
irem
ents
Tota
l Cap
ital I
nves
tmen
t4.
450
10.2
1414
.664
.000

Fund-11
FY 2009 FY 2010 FY 20111. New Orders
a. Orders from DoD Components:
Own Component1105 Military Personnel, M.C. 0.000 0.000 0.0001106 O&M Marine Corps 16.720 16.139 16.9071108 Reserve Personnel, M.C. 0.000 0.000 0.0001109 Procurement, M.C. 3.514 3.392 3.5541205 Military Construction, Navy 0.000 0.000 0.0001319 RDT & E, Navy 0.532 0.514 0.5381405 Reserve Personnel, Navy 0.000 0.000 0.0001453 Military Personnel, Navy 0.000 0.000 0.0001506 Aircraft Procurement, Navy 631.540 545.962 595.7911507 Weapons Procurement, Navy 8.412 7.500 7.5001611-1811 Shipbuilding & Conv. Navy 30.064 28.300 31.6001804 O&M, Navy 3758.299 3680.010 3828.5601806 O&M, Navy Reserve 96.166 92.826 97.2411810 Other Procurement, Navy 30.723 27.700 36.7004930 Navy Working Capital Fund 946.323 928.157 965.623
5522.295 5330.501 5584.014Orders from other DoD Components2100 Army 11.608 11.205 11.7385700 Air Force 129.716 125.211 131.1669700 Other DoD 0.000 0.000 0.000
141.324 136.416 142.904b. Orders from other Fund Business Areas:Distribution Depots, Navy 0.000 0.000 0.000Logistics Support, Navy 0.000 0.000 0.000
0.000 0.000 0.000
c. Total DoD 5663.619 5466.917 5726.917
d. Other Orders:Other Federal Agencies 16.720 16.140 16.907Trust Fund 0.000 0.000 0.000Non-Federal Agencies * 176.400 134.200 135.644Foreign Military Sales (FMS) 98.831 95.399 99.936
291.951 245.738 252.487
Total New Orders 5955.570 5712.655 5979.404
2. Carry-In Orders 601.814 908.297 959.166
3. Total Gross Orders 6557.384 6620.952 6938.570
4. Carry-Out Orders (-) 908.297 959.166 1034.249
5. Gross Sales 5649.087 5661.786 5904.321
Reimbursable Orders (BP 91) 351.864 442.509 526.203
6. Credit (-) 74.218 83.048 83.070
7. Net Sales 5926.733 6021.247 6347.454
($ in Millions)
Sources Of RevenueDepartment of the Navy
Supply Management - NavyFiscal Year (FY) 2011 Budget Estimates - February 2010

Fund-14Revenue and Expense Summary
Department of the NavySupply Management - Navy
Fiscal Year (FY) 2011 Budget Estimates - February 2010($ in Millions)
FY 2009 FY 2010 FY 2011Revenue: Gross Sales Operations 5,634.424 5,652.701 5,897.070 Capital Surcharge (13.136) (18.408) (18.817) Depreciation except Maj Const 27.799 27.493 26.068 Total Gross Sales 5,649.087 5,661.786 5,904.321 Major Construction Dep 0.000 0.000 0.000 Other Income 351.864 442.509 526.203 Refunds/Discounts (- Credit Sales) (74.218) (83.048) (83.070) Total Income: 5,926.733 6,021.247 6,347.454
Expenses: Cost of Materiel Sold from Inventory 4,807.757 4,744.898 4,817.600
Salaries and Wages: Military Personnel 29.377 30.554 30.749 Civilian Personnel 557.952 504.026 513.350 Travel & Transportation of Personnel 14.658 14.920 15.129 Materials & Supplies 35.097 33.498 33.967 Equipment 11.661 12.569 12.745 Other Purchases from Revolving Funds 244.845 261.221 267.016 Transportation of Things 133.542 161.979 165.218 Depreciation - Capital 27.799 27.493 26.068 Printing and Reproduction 8.036 8.355 8.472 Advisory and Assistance Services 11.212 11.722 11.886 Rent, Communication, Utilities & Misc 29.937 28.458 28.856 Other Purchased Services 179.475 255.907 270.736
TOTAL EXPENSES 6,091.348 6,095.600 6,201.792
Operating Result (164.615) (74.353) 145.662 Less Capital Surcharge reservation (13.136) (18.408) (18.817) Plus Appro Affecting NOR/AOR 0.000 0.000 0.000 Plus Other Changes Affecting NOR 75.773 0.000 0.000
Net Operating Result (75.706) (55.945) 164.479 Prior Year AOR (32.828) (108.534) (164.479) Other Changes Affecting AOR
Accumulated Operating Result (108.534) (164.479) 0.000

SM-1
NET CAPITAL PEACETIME CUSTOMER NET TOTAL VARIABILITY TARGET IMPROVEMENT CREDIT
DIVISION INVENTORY ORDERS SALES OPERATING MOBILIZATION OBLIGATIONS TARGET TOTAL PROGRAM SALES
BP 21Approved 37.219 66.760 66.760 67.300 0.000 67.300 0.000 67.300 0.000 0.000Request 32.568 74.540 74.540 70.253 0.000 70.253 0.000 70.253 0.000 0.000
Delta (4.651) 7.780 7.780 2.953 0.000 2.953 0.000 2.953 0.000 0.000
BP 28Approved 1,439.672 872.203 872.203 872.203 0.000 872.203 0.000 872.203 0.000 4.888Request 1,530.096 960.856 960.856 860.573 0.000 860.573 0.000 860.573 0.000 2.460
Delta 90.424 88.653 88.653 (11.630) 0.000 (11.630) 0.000 (11.630) 0.000 (2.428)
BP 34Approved 911.975 384.637 385.181 332.736 0.000 332.736 40.000 372.736 0.000 0.000Request 863.139 414.589 397.322 363.234 0.000 363.234 0.000 363.234 0.000 0.283
Delta (48.836) 29.952 12.141 30.498 0.000 30.498 (40.000) (9.502) 0.000 0.283
BP 81Approved 8,319.755 794.139 794.139 704.757 0.000 704.757 90.500 795.257 0.000 29.000Request 8,681.819 835.932 835.932 720.095 0.000 720.095 0.000 720.095 0.000 22.289
Delta 362.064 41.793 41.793 15.338 0.000 15.338 (90.500) (75.162) 0.000 (6.711)** REPAIR-> 437.950
BP85 Approved 35,817.944 3,498.866 3,429.508 2,763.668 0.000 2,763.668 425.500 3,189.168 0.000 52.800
Request 36,207.156 3,530.996 3,306.219 2,886.593 0.000 2,886.593 0.000 2,886.593 0.000 49.186Delta 389.212 32.130 (123.289) 122.925 0.000 122.925 (425.500) (302.575) 0.000 (3.614)
** REPAIR-> 1,984.267
BP 91 Approved 0.000 0.000 494.482 1,339.737 0.000 1,339.737 0.000 1,339.737 10.214 0.000Request 0.000 0.000 351.864 1,255.792 0.000 1,255.792 0.000 1,255.792 14.664 0.000
Delta 0.000 0.000 (142.618) (83.945) 0.000 (83.945) 0.000 (83.945) 4.450 0.000
TOTALApproved 46,526.565 5,616.605 6,042.273 6,080.401 0.000 6,080.401 556.000 6,636.401 10.214 86.688Request 47,314.778 5,816.913 5,926.733 6,156.540 0.000 6,156.540 0.000 6,156.540 14.664 74.218
Delta 788.213 200.308 (115.540) 76.139 0.000 76.139 (556.000) (479.861) 4.450 (12.470)
Supply Management Summary Department of the Navy
Supply Management - NavyFiscal Year (FY) 2011 Budget Estimates - February 2010
FY 2009($ in Millions)

SM-1
NET CAPITAL PEACETIME CUSTOMER NET TOTAL VARIABILITY TARGET IMPROVEMENT CREDIT
DIVISION INVENTORY ORDERS SALES OPERATING MOBILIZATION OBLIGATIONS TARGET TOTAL PROGRAM SALES
BP 21Approved 39.190 67.200 67.200 67.950 0.000 67.950 0.000 67.950 0.000 0.000Request 34.539 67.200 67.200 67.950 0.000 67.950 0.000 67.950 0.000 0.000
Delta (4.651) 0.000 0.000 0.000 0.000 0.000 0.000 0.000 0.000 0.000
BP 28Approved 1,451.380 889.647 889.647 890.816 0.000 890.816 0.000 890.816 0.000 4.888Request 1,519.237 917.181 917.181 917.181 0.000 917.181 0.000 917.181 0.000 4.888
Delta 67.857 27.534 27.534 26.365 0.000 26.365 0.000 26.365 0.000 0.000
BP 34Approved 870.191 397.605 399.013 273.151 0.000 273.151 40.000 313.151 0.000 0.000Request 761.145 389.133 389.556 338.208 0.000 338.208 19.156 357.364 0.000 0.360
Delta (109.046) (8.472) (9.457) 65.057 0.000 65.057 (20.844) 44.213 0.000 0.360
BP 81Approved 8,125.689 791.768 791.863 702.487 0.000 702.487 90.500 792.987 0.000 29.000Request 8,393.794 785.813 785.813 684.743 0.000 684.743 43.341 728.084 0.000 25.000
Delta 268.105 (5.955) (6.050) (17.744) 0.000 (17.744) (47.159) (64.903) 0.000 (4.000)** REPAIR-> 281.506
BP85Approved 35,992.447 3,507.274 3,424.193 2,843.390 0.000 2,843.390 429.603 3,272.993 0.000 52.800Request 34,954.468 3,470.280 3,418.988 2,886.519 0.000 2,886.519 205.742 3,092.261 0.000 52.800
Delta (1,037.979) (36.994) (5.205) 43.129 0.000 43.129 (223.861) (180.732) 0.000 0.000** REPAIR-> 2,008.061
BP 91 Approved 0.000 0.000 380.007 1,256.440 0.000 1,256.440 0.000 1,256.440 9.085 0.000Request 0.000 0.000 442.509 1,323.209 0.000 1,323.209 0.000 1,323.209 9.085 0.000
Delta 0.000 0.000 62.502 66.769 0.000 66.769 0.000 66.769 0.000 0.000
TOTALApproved 46,478.897 5,653.494 5,951.923 6,034.234 0.000 6,034.234 560.103 6,594.337 9.085 86.688Request 45,663.183 5,629.607 6,021.247 6,217.810 0.000 6,217.810 268.239 6,486.049 9.085 83.048
Delta (815.714) (23.887) 69.324 183.576 0.000 183.576 (291.864) (108.288) 0.000 (3.640)
($ in Millions)FY 2010
Department of the Navy
Fiscal Year (FY) 2011 Budget Estimates - February 2010Supply Management - Navy
Supply Management Summary
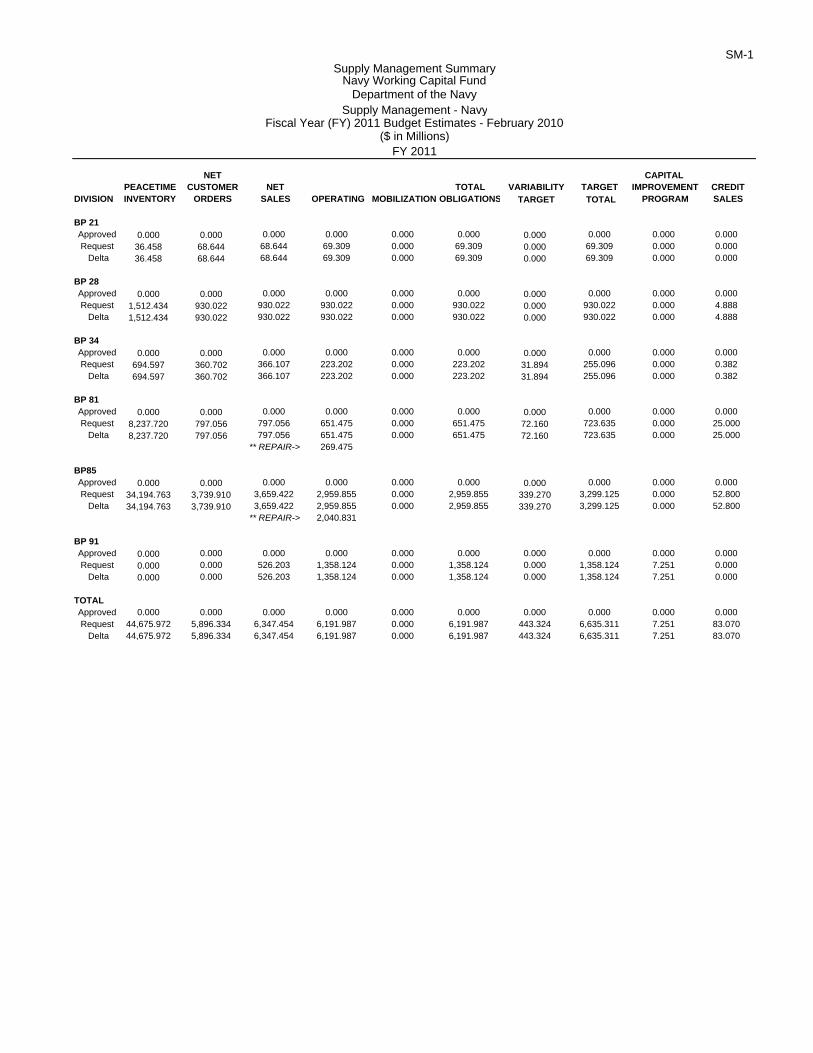
SM-1
NET CAPITAL PEACETIME CUSTOMER NET TOTAL VARIABILITY TARGET IMPROVEMENT CREDIT
DIVISION INVENTORY ORDERS SALES OPERATING MOBILIZATION OBLIGATIONS TARGET TOTAL PROGRAM SALES
BP 21Approved 0.000 0.000 0.000 0.000 0.000 0.000 0.000 0.000 0.000 0.000Request 36.458 68.644 68.644 69.309 0.000 69.309 0.000 69.309 0.000 0.000
Delta 36.458 68.644 68.644 69.309 0.000 69.309 0.000 69.309 0.000 0.000
BP 28Approved 0.000 0.000 0.000 0.000 0.000 0.000 0.000 0.000 0.000 0.000Request 1,512.434 930.022 930.022 930.022 0.000 930.022 0.000 930.022 0.000 4.888
Delta 1,512.434 930.022 930.022 930.022 0.000 930.022 0.000 930.022 0.000 4.888
BP 34Approved 0.000 0.000 0.000 0.000 0.000 0.000 0.000 0.000 0.000 0.000Request 694.597 360.702 366.107 223.202 0.000 223.202 31.894 255.096 0.000 0.382
Delta 694.597 360.702 366.107 223.202 0.000 223.202 31.894 255.096 0.000 0.382
BP 81Approved 0.000 0.000 0.000 0.000 0.000 0.000 0.000 0.000 0.000 0.000Request 8,237.720 797.056 797.056 651.475 0.000 651.475 72.160 723.635 0.000 25.000
Delta 8,237.720 797.056 797.056 651.475 0.000 651.475 72.160 723.635 0.000 25.000** REPAIR-> 269.475
BP85 Approved 0.000 0.000 0.000 0.000 0.000 0.000 0.000 0.000 0.000 0.000Request 34,194.763 3,739.910 3,659.422 2,959.855 0.000 2,959.855 339.270 3,299.125 0.000 52.800
Delta 34,194.763 3,739.910 3,659.422 2,959.855 0.000 2,959.855 339.270 3,299.125 0.000 52.800** REPAIR-> 2,040.831
BP 91 Approved 0.000 0.000 0.000 0.000 0.000 0.000 0.000 0.000 0.000 0.000Request 0.000 0.000 526.203 1,358.124 0.000 1,358.124 0.000 1,358.124 7.251 0.000
Delta 0.000 0.000 526.203 1,358.124 0.000 1,358.124 0.000 1,358.124 7.251 0.000
TOTALApproved 0.000 0.000 0.000 0.000 0.000 0.000 0.000 0.000 0.000 0.000Request 44,675.972 5,896.334 6,347.454 6,191.987 0.000 6,191.987 443.324 6,635.311 7.251 83.070
Delta 44,675.972 5,896.334 6,347.454 6,191.987 0.000 6,191.987 443.324 6,635.311 7.251 83.070
Navy Working Capital Fund
FY 2011
Supply Management Summary
Department of the NavySupply Management - Navy
Fiscal Year (FY) 2011 Budget Estimates - February 2010($ in Millions)

NMCS Buy-In Special BasicWeapon System Rates1 Outfitting Programs Replen Repair Total
F/A-18 8.6 127.347 88.309 72.383 224.809 512.848AV-8B/T-45 10.9/5.9 0.000 8.889 0.187 5.534 14.610EA-6B 9.3 6.627 0.000 9.719 37.969 54.315VTUAV n/a 0.000 0.000 0.000 0.000 0.000V-22 15.4 104.256 0.000 55.562 67.927 227.745S-3 5.9 0.000 0.000 0.000 1.000 1.000C-130 10.8 0.000 0.000 1.603 3.718 5.321P-3 6.9 4.539 2.617 5.870 41.871 54.897E-2/C-2 9.8/8.0 3.442 18.057 5.166 36.114 62.779Common Systems n/a 14.300 0.000 7.135 52.640 74.075Aircraft Engines n/a 19.986 0.000 22.854 92.754 135.594Aviation Support Systems n/a 0.000 0.518 2.976 24.123 27.617H-1 12.5 47.673 2.660 5.638 52.911 108.882H-46 10.7 0.000 0.000 1.962 37.719 39.681H-53 11.5 0.000 12.800 16.479 91.713 120.992H-60 8.3 59.859 0.000 26.417 19.266 105.542Multi-application n/a 0.000 0.000 65.067 335.689 400.756Efficiencies/Self Financing (87.791) 0.465 (16.208) 0.000 (103.534)Anticipated Special Programs 0.000 0.000 0.000 0.000 0.000Carcass Losses 0.000 0.000 18.000 0.000 18.000Full PBL 0.000 0.000 155.932 892.806 1048.738LECP Investment/Savings 0.000 0.000 (4.190) (38.875) (43.065)ERP Buy-Ahead 0.000 0.000 19.800 0.000 19.800
Total 300.238 134.315 472.352 1979.688 2886.593
1Not Mission Capable Supply (NMCS) - Percentage of time aircraft are Not Mission Capable due to a supply shortage. Used in conjunction with Not Mission Capable Maintenance (NMCM) to determine total Not Mission Capable rate (inverse of MC). NMCS is computed only for weapon systems. NMCS is not computed for weapon system parts, such as engines. Source: Corporate Information System (CIS)
Operating Requirement by Weapon SystemDepartment of the Navy
Supply Management - NavyBudget Project 85
Fiscal Year (FY) 2011 Budget Estimates - February 2010($ in Millions)
SM-3b
FY 2009

NMCS Buy-In Special BasicWeapon System Rates1 Outfitting Programs Replen Repair Total
F/A-18 8.6 110.761 108.543 44.539 206.785 470.628AV-8B/T-45 10.9/5.9 0.000 0.000 0.261 5.357 5.618EA-6B 9.3 6.276 0.000 9.873 30.442 46.591VTUAV n/a 0.000 0.000 0.000 0.000 0.000V-22 15.4 52.495 0.000 18.954 79.732 151.181S-3 5.9 0.000 0.000 0.000 2.494 2.494C-130 10.8 0.000 0.000 1.791 4.427 6.218P-3 6.9 4.790 0.000 6.926 36.299 48.015E-2/C-2 9.8/8.0 0.000 16.800 7.174 30.697 54.671Common Systems n/a 19.305 0.000 4.094 50.067 73.466Aircraft Engines n/a 27.480 0.000 25.939 122.877 176.296Aviation Support Systems n/a 0.000 0.000 2.763 15.114 17.877H-1 12.5 33.529 0.000 8.524 42.084 84.137H-46 10.7 0.000 0.000 2.152 29.165 31.317H-53 11.5 0.000 3.441 10.911 102.217 116.569H-60 8.3 182.982 13.881 44.911 18.747 260.521Multi-application n/a 0.000 0.000 72.955 330.922 403.877Efficiencies/Self Financing (169.832) 0.490 (3.220) 0.000 (172.562)Anticipated Special Programs 0.000 50.000 0.000 20.000 70.000Carcass Losses 0.000 0.000 18.000 0.000 18.000Full PBL 0.000 0.000 106.018 912.049 1018.067LECP Investment/Savings 0.000 0.000 23.153 (31.413) (8.260)ERP Buy-Ahead 0.000 0.000 11.800 0.000 11.800
Total 267.786 193.155 417.516 2008.062 2886.519
FY 2010
Department of the NavySupply Management - Navy
Budget Project 85Fiscal Year (FY) 2011 Budget Estimates - February 2010
($ in Millions)
Operating Requirement by Weapon SystemSM-3b
1Not Mission Capable Supply (NMCS) - Percentage of time aircraft are Not Mission Capable due to a supply shortage. Used in conjunction with Not Mission Capable Maintenance (NMCM) to determine total Not Mission Capable rate (inverse of MC). NMCS is computed only for weapon systems. NMCS is not computed for weapon system parts, such as engines. Source: Corporate Information System (CIS)

NMCS Buy-In Special BasicWeapon System Rates1 Outfitting Programs Replen Repair Total
F/A-18 8.6 67.225 73.056 17.920 198.488 356.689AV-8B/T-45 10.9/5.9 0.000 0.000 0.339 5.018 5.357EA-6B 9.3 6.454 0.000 11.348 29.713 47.515VTUAV n/a 15.417 0.000 0.000 0.000 15.417V-22 15.4 71.354 0.000 12.887 99.006 183.247S-3 5.9 0.000 0.000 0.000 1.247 1.247C-130 10.8 0.000 0.000 2.345 4.520 6.865P-3 6.9 4.209 0.000 9.061 36.379 49.649E-2/C-2 9.8/8.0 0.000 22.400 11.566 29.267 63.233Common Systems n/a 7.302 0.000 6.936 51.460 65.698Aircraft Engines n/a 23.163 0.000 28.136 117.348 168.647Aviation Support Systems n/a 0.000 0.000 3.135 14.833 17.968H-1 12.5 51.084 0.000 12.864 41.427 105.375H-46 10.7 0.000 0.000 2.006 28.365 30.371H-53 11.5 0.000 0.000 23.728 92.129 115.857H-60 8.3 154.948 0.000 19.454 52.349 226.751Multi-application n/a 0.000 0.000 95.615 314.878 410.493Efficiencies/Self Financing (113.326) 0.490 (4.071) 0.000 (116.907)Anticipated Special Programs 50.000 20.000 70.000Carcass Losses 18.000 18.000Full PBL 192.033 932.194 1124.227LECP Investment/Savings 21.944 (27.788) (5.844)
Total 287.830 145.946 485.247 2040.833 2959.855
Operating Requirement by Weapon SystemDepartment of the Navy
Supply Management - Navy
FY 2011
1Not Mission Capable Supply (NMCS) - Percentage of time aircraft are Not Mission Capable due to a supply shortage. Used in conjunction with Not Mission Capable Maintenance (NMCM) to determine total Not Mission Capable rate (inverse of MC). NMCS is computed only for weapon systems. NMCS is not computed for weapon system parts, such as engines. Source: Corporate Information System (CIS)
SM-3b
Budget Project 85Fiscal Year (FY) 2011 Budget Estimates - February 2010
($ in Millions)

SM-4
Total Mobilization Operating Other
1. INVENTORY BOP 46,877.300 5.009 23,549.104 23,323.187
2. BOP INVENTORY ADJUSTMENTS (333.288) 0.056 3,421.814 (3,755.158) A. RECLASSIFICATION CHANGE (memo) 0.000 0.000 3,657.964 (3,657.964) B. PRICE CHANGE AMOUNT (memo) (333.288) 0.056 (236.150) (97.194) C. INVENTORY RECLASSIFIED AND 46,544.012 5.065 26,970.918 19,568.029 REPRICED
3. RECEIPTS AT STANDARD 3,060.214 0.000 2,895.509 164.705
4. SALES AT STANDARD 5,649.087 0.000 5,649.087 0.000
5. INVENTORY ADJUSTMENTS A. CAPITALIZATIONS + or (-) 589.439 0.029 634.939 (45.529) B. RETURNS FROM CUSTOMERS FOR CREDIT 74.218 0.003 52.654 21.561 C. RETURNS FROM CUSTOMERS, NO CREDIT 18,323.892 0.083 6,119.592 12,204.217 D. RETURNS TO SUPPLIERS (-) 0.000 0.000 0.000 0.000 E. TRANSFERS TO PROP. DISPOSAL (-) (4,216.133) 0.000 0.000 (4,216.133) F. ISSUES/RECEIPTS WITHOUT REIMBURSEMENT + or (-) (1,494.042) (0.005) (124.906) (1,369.131) G. OTHER (listed in Section 9) (9,598.908) (2.528) (6,346.982) (3,249.398) H. TOTAL ADJUSTMENTS 3,362.286 (2.418) 335.297 3,029.407
6. INVENTORY EOP 47,317.425 2.647 24,552.637 22,762.141
7. INVENTORY EOP (REVALUED) 26,579.337 2.647 15,090.738 11,485.952 A. APPROVED ACQUISITION OBJECTIVE (memo) 9,958.424 B. ECONOMIC RETENTION (memo) 1,090.791 C. CONTINGENCY RETENTION (memo) 394.318 D. POTENTIAL DOD REUTILIZATION (memo) 42.419
8. INVENTORY ON ORDER EOP (memo) 2,299.088 0.000 2,170.373 137.897
9. NARRATIVE:
Other adjustments (Total posted to line 5g):
Other Gains/Losses (963.167) 0.000 (955.088) (8.079) Strata Transfers 0.000 (2.528) 3,243.847 (3,241.319) Net/Standard Difference (8,635.741) 0.000 (8,635.741) 0.000 Discounted Unserviceable Returns 0.000 0.000 0.000 0.000
Total (9,598.908) (2.528) (6,346.982) (3,249.398)
Inventory StatusDepartment of the Navy
Supply Management - Navy
Fiscal Year (FY) 2011 Budget Estimates - February 2010Budget Project Summary
($ in Millions)FY 2009
---Peacetime---

SM-4
Total Mobilization Operating Other
1. INVENTORY BOP 47,317.425 2.647 24,552.637 22,762.141
2. BOP INVENTORY ADJUSTMENTS 434.511 0.049 5,552.870 (5,118.408) A. RECLASSIFICATION CHANGE (memo) 0.000 0.000 5,313.955 (5,313.955) B. PRICE CHANGE AMOUNT (memo) 434.511 0.049 238.915 195.547 C. INVENTORY RECLASSIFIED AND 47,751.936 2.696 30,105.507 17,643.733 REPRICED
3. RECEIPTS AT STANDARD 3,244.625 0.000 3,259.767 (15.142)
4. SALES AT STANDARD 5,661.786 0.000 5,661.786 0.000
5. INVENTORY ADJUSTMENTS A. CAPITALIZATIONS + or (-) 176.734 0.000 25.665 151.069 B. RETURNS FROM CUSTOMERS FOR CREDIT 83.048 0.000 10.855 72.193 C. RETURNS FROM CUSTOMERS, NO CREDIT 17,928.846 0.000 9,207.017 8,721.829 D. RETURNS TO SUPPLIERS (-) 0.000 0.000 0.000 0.000 E. TRANSFERS TO PROP. DISPOSAL (-) (5,540.746) 0.000 0.000 (5,540.746) F. ISSUES/RECEIPTS WITHOUT REIMBURSEMENT + or (-) (258.801) 0.000 (169.745) (89.056) G. OTHER (listed in Section 9) (12,057.977) 0.000 (11,977.220) (80.757) H. TOTAL ADJUSTMENTS 331.104 0.000 (2,903.428) 3,234.532
6. INVENTORY EOP 45,665.879 2.696 24,800.061 20,863.122
7. INVENTORY EOP (REVALUED) 26,030.168 2.647 15,325.836 10,701.685 A. APPROVED ACQUISITION OBJECTIVE (memo) 9,243.718 B. ECONOMIC RETENTION (memo) 1,036.959 C. CONTINGENCY RETENTION (memo) 381.579 D. POTENTIAL DOD REUTILIZATION (memo) 39.429
8. INVENTORY ON ORDER EOP (memo) 2,237.485 0.000 2,236.616 0.869
9. NARRATIVE:
Other adjustments (Total posted to line 5g):
Other Gains/Losses (93.203) 0.000 (48.812) (44.391) Strata Transfers 0.000 0.000 36.366 (36.366) Net/Standard Difference (11,964.774) 0.000 (11,964.774) 0.000 Discounted Unserviceable Returns 0.000 0.000 0.000 0.000
Total (12,057.977) 0.000 (11,977.220) (80.757)
Inventory StatusDepartment of the Navy
Supply Management - Navy
Fiscal Year (FY) 2011 Budget Estimates - February 2010($ in Millions)
Budget Project Summary
FY 2010
---Peacetime---

SM-4
Total Mobilization Operating Other
1. INVENTORY BOP 45,665.879 2.696 24,800.061 20,863.122
2. BOP INVENTORY ADJUSTMENTS 882.490 0.050 6,653.788 (5,771.348) A. RECLASSIFICATION CHANGE (memo) 0.000 0.000 5,372.901 (5,372.901) B. PRICE CHANGE AMOUNT (memo) 882.490 0.050 1,280.887 (398.447) C. INVENTORY RECLASSIFIED AND 46,548.369 2.746 31,453.849 15,091.774 REPRICED
3. RECEIPTS AT STANDARD 3,270.754 0.000 3,295.856 (25.102)
4. SALES AT STANDARD 5,904.321 0.000 5,904.321 0.000
5. INVENTORY ADJUSTMENTS A. CAPITALIZATIONS + or (-) 197.171 0.000 25.762 171.409 B. RETURNS FROM CUSTOMERS FOR CREDIT 83.070 0.000 11.102 71.968 C. RETURNS FROM CUSTOMERS, NO CREDIT 19,197.354 0.000 9,835.871 9,361.483 D. RETURNS TO SUPPLIERS (-) 0.000 0.000 0.000 0.000 E. TRANSFERS TO PROP. DISPOSAL (-) (5,460.555) 0.000 0.000 (5,460.555) F. ISSUES/RECEIPTS WITHOUT REIMBURSEMENT + or (-) (247.583) 0.000 (158.527) (89.056) G. OTHER (listed in Section 9) (13,005.541) 0.000 (12,671.679) (333.862) H. TOTAL ADJUSTMENTS 763.916 0.000 (2,957.471) 3,721.387
6. INVENTORY EOP 44,678.718 2.746 25,887.913 18,788.059
7. INVENTORY EOP (REVALUED) 31,511.055 2.746 19,584.496 11,923.813 A. APPROVED ACQUISITION OBJECTIVE (memo) 10,366.422 B. ECONOMIC RETENTION (memo) 1,108.358 C. CONTINGENCY RETENTION (memo) 404.652 D. POTENTIAL DOD REUTILIZATION (memo) 44.381
8. INVENTORY ON ORDER EOP (memo) 2,228.960 0.000 2,228.091 0.869
9. NARRATIVE:
Other adjustments (Total posted to line 5g):
Other Gains/Losses (86.688) 0.000 (49.476) (37.212) Strata Transfers 0.000 0.000 296.650 (296.650) Net/Standard Difference (12,918.853) 0.000 (12,918.853) 0.000 Discounted Unserviceable Returns 0.000 0.000 0.000 0.000
Total (13,005.541) 0.000 (12,671.679) (333.862)
Inventory StatusDepartment of the Navy
---Peacetime---
Supply Management - Navy
Fiscal Year (FY) 2011 Budget Estimates - February 2010($ in Millions)
FY 2011
Budget Project Summary

l
SM
-5B
Cus
tom
er P
rice
Cha
nge
Dep
artm
ent o
f the
Nav
yS
uppl
y M
anag
emen
t - N
avy
Fisc
al Y
ear (
FY) 2
011
Bud
get E
stim
ates
- Fe
brua
ry 2
010
($ In
Mill
ions
)
SH
IPS
/AV
IATI
ON
FY 2
009
FY 2
010
FY 2
011
1.
Net
sal
es a
t Cos
t40
50.9
7841
50.9
4842
52.9
14
2.
Less
: Mat
eria
l Inf
latio
n A
dj13
2.76
046
.285
61.5
00
3.
Rev
ised
Net
Sal
es a
t Cos
t39
18.2
1841
04.6
6341
91.4
14
4.
Sur
char
ge ($
)51
2.86
755
0.62
564
8.08
8
5.
Cha
nge
to C
usto
mer
s
a. P
revi
ous
Yea
r's S
urch
arge
(%)
0.14
50.
127
0.13
3
b. T
his
year
's S
urch
arge
and
mat
eria
0.16
50.
145
0.16
9
infla
tion
divi
ded
by li
ne 3
abo
ve ($
)
c. P
erce
nt c
hang
e to
cus
tom
er1.
8%1.
6%3.
2%

SM
-5B
Cus
tom
er P
rice
Cha
nge
Dep
artm
ent o
f the
Nav
yS
uppl
y M
anag
emen
t - N
avy
Fisc
al Y
ear (
FY) 2
011
Bud
get E
stim
ates
- Fe
brua
ry 2
010
($ In
Mill
ions
)
BP
34-A
VIA
TIO
N C
ON
SU
MA
BLE
SFY
200
9FY
201
0FY
201
1
1.
Net
sal
es a
t Cos
t29
8.81
635
9.51
032
0.54
3
2.
Less
: Mat
eria
l Inf
latio
n A
dj(2
.301
)5.
528
(18.
209)
3.
Rev
ised
Net
Sal
es a
t Cos
t30
1.11
735
3.98
233
8.75
2
4.
Sur
char
ge ($
)49
.275
39.9
5145
.965
5.
Cha
nge
to C
usto
mer
s
a. P
revi
ous
Yea
r's S
urch
arge
(%)
0.13
60.
165
0.11
1
b. T
his
year
's S
urch
arge
and
mat
eria
l0.
156
0.12
80.
082
in
flatio
n di
vide
d by
line
3 a
bove
($)
c. P
erce
nt c
hang
e to
cus
tom
er1.
7%(3
.1%
)(2
.6%
)
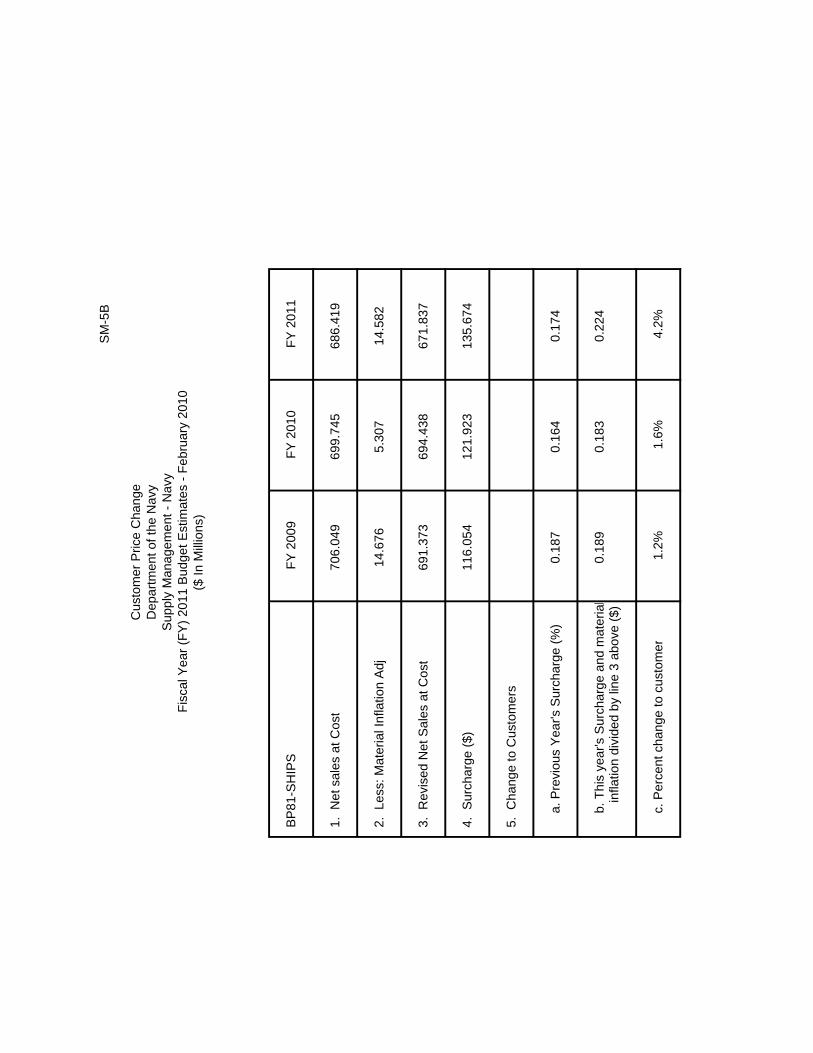
SM
-5B
Cus
tom
er P
rice
Cha
nge
Dep
artm
ent o
f the
Nav
yS
uppl
y M
anag
emen
t - N
avy
Fisc
al Y
ear (
FY) 2
011
Bud
get E
stim
ates
- Fe
brua
ry 2
010
($ In
Mill
ions
)
BP
81-S
HIP
SFY
200
9FY
201
0FY
201
1
1.
Net
sal
es a
t Cos
t70
6.04
969
9.74
568
6.41
9
2.
Less
: Mat
eria
l Inf
latio
n A
dj14
.676
5.30
714
.582
3.
Rev
ised
Net
Sal
es a
t Cos
t69
1.37
369
4.43
867
1.83
7
4.
Sur
char
ge ($
)11
6.05
412
1.92
313
5.67
4
5.
Cha
nge
to C
usto
mer
s
a. P
revi
ous
Yea
r's S
urch
arge
(%)
0.18
70.
164
0.17
4
b. T
his
year
's S
urch
arge
and
mat
eria
l0.
189
0.18
30.
224
in
flatio
n di
vide
d by
line
3 a
bove
($)
c. P
erce
nt c
hang
e to
cus
tom
er1.
2%1.
6%4.
2%

SM
-5B
Cus
tom
er P
rice
Cha
nge
Dep
artm
ent o
f the
Nav
yS
uppl
y M
anag
emen
t - N
avy
Fisc
al Y
ear (
FY) 2
011
Bud
get E
stim
ates
- Fe
brua
ry 2
010
($ In
Mill
ions
)
BP
85-A
VIA
TIO
N R
EP
AIR
AB
LES
FY 2
009
FY 2
010
FY 2
011
1.
Net
sal
es a
t Cos
t30
46.1
1430
91.6
9332
45.9
52
2.
Less
: Mat
eria
l Inf
latio
n A
dj12
0.38
635
.450
64.5
85
3.
Rev
ised
Net
Sal
es a
t Cos
t29
25.7
2830
56.2
4331
81.3
67
4.
Sur
char
ge ($
)34
7.53
938
8.75
246
6.44
9
5.
Cha
nge
to C
usto
mer
s
a. P
revi
ous
Yea
r's S
urch
arge
(%)
0.13
60.
114
0.12
6
b. T
his
year
's S
urch
arge
and
mat
eria
l0.
160
0.13
90.
167
in
flatio
n di
vide
d by
line
3 a
bove
($)
c. P
erce
nt c
hang
e to
cus
tom
er1.
9%2.
2%3.
7%

SM-6
STOCKPILE STATUS WRM WRMTotal Protected Other
1. Inventory BOP @ std 5.009 5.009
2. Price Change 0.056 0.056
3. Reclassification 0.000 0.000
4. Inventory Changes (2.418) (2.418) 0.000 a. Receipts @ std 0.086 0.086 0.000 (1). Purchases 0.000 0.000 (2). Returns from customers 0.086 0.086
b. Issues @ std (0.005) (0.005) 0.000 (1). Sales 0.000 0.000 (2). Returns to suppliers 0.000 0.000 (3). Disposals 0.000 0.000 (4). Issues/receipts w/o ADJs (0.005) (0.005)
c. Adjustments @ std (2.499) (2.499) 0.000 (1). Capitalizations 0.029 0.029 (2). Gains and losses 0.000 0.000 (3). Other (2.528) (2.528)
5. Inventory EOP 2.647 2.647 0.000
1. Storage 0.0022. Management 0.0003. Maintenance/Other 0.000Total Cost 0.002
1. Obligations @ cost a. Additional WRM 0.000 b. Replen. WRM 0.000 c. Repair WRM 0.000 d. Assemble/Disassemble 0.000 e. Other 0.000Total Request 0.000
War Reserve Material (WRM)
WRM BUDGET REQUEST
($ in Millions)FY 2009
Department of the NavySupply Management - Navy
STOCKPILE COSTS
Fiscal Year (FY) 2011 Budget Estimates - February 2010

SM-6
STOCKPILE STATUS WRM WRMTotal Protected Other
1. Inventory BOP @ std 2.647 2.647
2. Price Change 0.049 0.049
3. Reclassification 0.000 0.000
4. Inventory Changes 0.000 0.000 0.000 a. Receipts @ std 0.000 0.000 0.000 (1). Purchases 0.000 0.000 (2). Returns from customers 0.000 0.000
b. Issues @ std 0.000 0.000 0.000 (1). Sales 0.000 0.000 (2). Returns to suppliers 0.000 0.000 (3). Disposals 0.000 0.000 (4). Issues/receipts w/o ADJs 0.000 0.000
c. Adjustments @ std 0.000 0.000 0.000 (1). Capitalizations 0.000 0.000 (2). Gains and losses 0.000 0.000 (3). Other 0.000 0.000
5. Inventory EOP 2.696 2.696 0.000
1. Storage 0.0022. Management 0.0003. Maintenance/Other 0.000Total Cost 0.002
1. Obligations @ cost a. Additional WRM 0.000 b. Replen. WRM 0.000 c. Repair WRM 0.000 d. Assemble/Disassemble 0.000 e. Other 0.000Total Request 0.000
War Reserve Material (WRM)
WRM BUDGET REQUEST
FY 2010
Department of the NavySupply Management - Navy
Fiscal Year (FY) 2011 Budget Estimates - February 2010
STOCKPILE COSTS
($ in Millions)

SM-6
STOCKPILE STATUS WRM WRMTotal Protected Other
1. Inventory BOP @ std 2.696 2.696
2. Price Change 0.050 0.050
3. Reclassification 0.000 0.000
4. Inventory Changes 0.000 0.000 0.000 a. Receipts @ std 0.000 0.000 0.000 (1). Purchases 0.000 0.000 (2). Returns from customers 0.000 0.000
b. Issues @ std 0.000 0.000 0.000 (1). Sales 0.000 0.000 (2). Returns to suppliers 0.000 0.000 (3). Disposals 0.000 0.000 (4). Issues/receipts w/o ADJs 0.000 0.000
c. Adjustments @ std 0.000 0.000 0.000 (1). Capitalizations 0.000 0.000 (2). Gains and losses 0.000 0.000 (3). Other 0.000 0.000
5. Inventory EOP 2.746 2.746 0.000
1. Storage 0.0012. Management 0.0003. Maintenance/Other 0.000Total Cost 0.001
1. Obligations @ cost a. Additional WRM 0.000 b. Replen. WRM 0.000 c. Repair WRM 0.000 d. Assemble/Disassemble 0.000 e. Other 0.000Total Request 0.000
War Reserve Material (WRM)
WRM BUDGET REQUEST
FY 2011
Department of the NavySupply Management - Navy
Fiscal Year (FY) 2011 Budget Estimates - February 2010
STOCKPILE COSTS
($ in Millions)

Marine Corps Supply

DEPARTMENT OF THE NAVY
NAVY WORKING CAPITAL FUND
SUPPLY MANAGEMENT‐ MARINE CORPS
FISCAL YEAR (FY) 2011 BUDGET ESTIMATES
February 2010
Mission Statement/Overview:
The Marine Corps Supply Management Activity Group (SMAG) performs inventory
management functions that result in the sale of consumable and reparable items to support
Department of Defense (DoD), other government, and non‐governmental customers’ supply
needs. Costs related to providing material support to customers are recouped through the
application of stabilized rates that include recovery for cost elements such as inventory
management and the receipt and issue of assets.
Activity Group Composition:
Portions of the following Marine Corps organizations are funded in this activity group:
Supply Chain Management Center, Albany, GA
Direct Support Stock Control, Albany, GA
Direct Support Stock Control, Barstow, CA
Business Logistics Support Department, Camp Lejeune, NC
Direct Support Stock Control, Quantico, VA
Consolidated Material and Service Center, Camp Pendleton, CA
Executive Summary
Significant Changes Since the FY 2010 President’s Budget:
The Marine Corps Supply Management Activity Group shows no significant changes from the
FY 2010 President’s Budget.
Budget Highlights:
Operating Results
Note: Amounts may not add due to rounding
Revenue/Expense/NOR/AOR ($M) FY 2009 FY 2010 FY 2011
Net Revenue 119.8 121.6 130.0
Expenses 122.3 121.6 122.3
Net Operating Results ‐2.5 0.0 7.6
Prior Year AOR ‐5.1 ‐7.6 ‐7.6
Accumulated Operating Result (AOR) ‐7.6 ‐7.6 0.0

Revenue and Expenses: Annual Revenue and Expenses fluctuate slightly across the budget
years in relation to sales and obligations. The net result is a balanced budget that achieves a
zero AOR in FY 2011.
Cash Management:
Collections/Disbursement/Outlays ($M) FY 2009 FY 2010 FY 2011
Collections 120.5 114.3 114.0
Disbursements 133.7 118.5 118.2
Outlays 13.1 4.3 4.2
Note: Amounts may not add due to rounding
Collections: FY 2009 Collections are higher due to Direct Support Stock Control (DSSC)
continuing to experience an increase in sales as a result of demand for hazardous material to
support the operating tempo at Maintenance Centers, Albany and Barstow. FY 2010 and FY
2011 fluctuate slightly across budget years commensurate with sales.
Disbursements: FY 2009 Disbursements are higher solely due to receipt of on order items and
completion/receipt of assets from sources of repair earlier than anticipated.
Outlays: Outlays fluctuate across the budget years based on the effects of Collections and
Disbursements.
Sales:
Note: Amounts may not add due to rounding
Gross Sales FY 2009 FY 2010 FY 2011
Wholesale 67.3 72.2 82.3
Retail 56.9 55.0 55.4
Provisioning 0.0 2.3 0.3
Total 124.2 129.5 137.9
Wholesale: FY 2009 Gross Sales decreased due to 1) The Fleet Marine Force (FMF) satisfying
some requirements by redistribution of assets among the Reparable Issue Points under the
Centralized Secondary Reparable Management concept with total visibility of the assets; 2) The
FMF is no longer supporting the Amphibious Assault Vehicle (AAV) in Iraq. Assets were
fielded with sufficient spares, which minimized demand to the wholesale system. In FY 2010
and FY 2011 sales increased to support the customer’s demand for Light Armored Vehicle
General II Suspension, Mine Resistant Ambush Protected Armored Vehicle (MRAP) and the
AN/TPS‐59 Tactical Missile Defense Radar.

Retail: FY 2009 Gross Sales increased due to customer demands to the DSSCs. The work tempo
at Maintenance Centers, Albany and Barstow, has resulted in increased demands to the DSSCs
for hazardous materials. Sales remain stable for FY 2010 and FY 2011.
Metrics:
FY 2009 FY 2010 FY 2011
Items Managed 4,240 4,250 4,250
Requisitions Received 4,475 4,609 4,565
Receipts 1,305 1,344 1,331
Issues 4,619 4,758 4,711
Contracts Executed 41 35 35
Purchase Inflation 1.3% 1.0% 1.3%
Supply Material Availability 85% 85% 85%
Undelivered Orders: Undelivered orders represent contracts or orders for goods for which a
liability has not yet accrued. The accrual of the liability creates an outlay requirement.
FY 2009 FY 2010 FY 2011
Undelivered Orders ($M) 23.1 23.5 23.8
War Reserve Material (WRM): WRM funding supports the procurement, replenishment,
reconstitution, stock and contracted asset availability guarantee of consumable and reparable
items deemed necessary for war reserve. No obligational authority is anticipated during this
budget cycle.
FY 2009 FY 2010 FY 2011
War Reserve Material ($M) 0.0 0.0 0.0
Performance Indicators: In addition to core metrics such as net and accumulated operating
results, Supply Chain Channel Performance measures the capacity of the supply chain to
respond to customer demand.
FY 2009 FY 2010 FY 2011
Supply Chain Channel Performance 85% 85% 85%
Report of Discrepancy 0% 0% 0%
Report of Discrepancy Processing Time 24 24 24

Unit Cost:
FY 2009 FY 2010 FY 2011
Wholesale 0.899 0.867 0.840
Retail 0.910 0.981 0.980
Composite Rates:
FY 2009 FY 2010 FY 2011
Annual Price Change 8.039% 6.353% 5.630%
Composite Cost Recovery Rate (CRR) 24.70% 29.63% 34.69%
The cost recovery rates increase due to higher labor and supplier costs. The Annual Price
Change declined as a result of previous AOR gains. A 1% Annual Price Change is equal to
approximately $600K.
Staffing:
Civilian/Military ES & Work years FY 2009 FY 2010 FY 2011
Civilian End Strength 24 24 24
Civilian Work years 24 24 24
Military End Strength 0 0 0
Military Work years 0 0 0
The Civilian and Military staffing remains constant through the budget period.
Capital Investment Program (CIP) Budget Authority:
The Marine Corps Supply Management Activity Group does not have a Capital Investment
Program budget.

Fund-11
FY 2009 FY 2010 FY 2011
1. New Orders
1a. Orders from DoD Components: Own Component Military Personnel, M.C. 0.000 0.000 0.000 O & M, M.C. 105.275 95.525 107.247 O & M, M.C. Reserve 0.000 0.000 0.000 Reserve Personnel, M.C. 0.000 0.000 0.000 Procurement, M.C. 0.036 2.250 0.250
Other Services (O&M) Army 5.437 3.600 3.620 Air Force 0.948 0.905 0.906 Navy 0.085 1.505 1.506 All Other DOD 0.385 0.094 0.095
Subtotal 112.166 103.879 113.624
1b. Orders from other Fund Business Areas: Navy Supply Management 0.000 0.000 0.000 M.C. Depot Maintenance 14.970 17.739 17.719
Subtotal 14.970 17.739 17.719
1c. Total DoD 127.136 121.618 131.343
1d. Other Orders: Other Federal Agencies 0.240 0.263 0.263 Foreign Military Sales 2.584 4.890 4.890 Non Federal Agencies 0.000 0.000 0.000
Subtotal 2.824 5.153 5.153
1. Total New Orders 129.960 126.771 136.496
2. Carry-In Orders 10.443 16.192 13.486
3. Total Gross Orders: 140.403 142.963 149.982
4. Funded Carry-over: 16.192 13.486 12.077
5. Total Gross Sales: 124.211 129.477 137.905
Source of New Orders and RevenueDepartment of the Navy
($ in Millions)
Supply Management - Marine CorpsFiscal Year (FY) 2011 Budget Estimates - February 2010

Fund-14
FY 2009 FY 2010 FY 2011
Revenue Operations (Gross Sales) 124.175 127.227 137.655
Capital Surcharge 0.000 0.000 0.000Depreciation except Maj Const 0.000 0.000 0.000Major Construction Depreciation 0.000 0.000 0.000
Other Income 0.036 2.250 0.250Refunds/Discounts (4.416) (7.902) (8.021)
Total Income: 119.795 121.575 129.884
Expenses Cost of Materiel Sold from Inventory 110.078 108.060 108.689Salaries and Wages:
Military Personnel Compensation & Benefits 0.000 0.000 0.000Civilian Personnel & Compensation & Benefits 2.120 2.287 2.379
Travel & Transportation of Personnel 0.029 0.100 0.100Materials & Supplies (For internal Operations) 0.000 0.000 0.000Mobilization 0.000 0.000 0.000Other Purchases from Revolving Funds 7.904 8.581 8.581Transportation of Things 0.011 0.100 0.100Depreciation - Capital 0.000 0.000 0.000Printing and Reproduction 0.000 0.000 0.000Advisory and Assistance Services 0.000 0.000 0.000Rent, Communication, Utilities, & Misc. Charges 0.000 0.000 0.000Other Purchased Services 2.152 2.447 2.425
Total Expenses: 122.294 121.575 122.274
Operating Result: (2.499) 0.000 7.610
Less Capital Surcharge Reservation 0.000 0.000 0.000Plus Appropriations Affecting NOR/AOR - WRM 0.000 0.000 0.000Other Changes Affecting NOR/AOR 0.000 0.000 0.000
Net Operating Result: (2.499) 0.000 7.610
Other Changes Affecting AOR
Prior Year AOR (5.111) (7.610) (7.610)
AOR Redistribution (0.000) 0.000 0.000
Cash Factor 0.000 0.000 0.000
Accumulated Operating Result: (7.610) (7.610) (0.000)
($ in Millions)
Revenue and ExpensesDepartment of the Navy
Supply Management - Marine CorpsFiscal Year (FY) 2011 Budget Estimates - February 2010

Fund
-15
Dep
ots
BB
LSU
nit C
ost
$000
,000
BB
LSU
nit C
ost
$000
,000
BB
LSU
nit C
ost
$000
,000
Airc
raft
Ops
AV
GA
S (C
ON
US
)0.
000
0.00
00.
000
0.00
00.
000
0.00
00.
000
0.00
00.
000
MO
GA
S:
Unl
eade
d-M
id0.
000
0.00
00.
000
0.00
00.
000
0.00
00.
000
0.00
00.
000
JP-4
Mils
pec
0.00
00.
000
0.00
00.
000
0.00
00.
000
0.00
00.
000
0.00
0JP
-50.
000
0.00
00.
000
0.00
00.
000
0.00
00.
000
0.00
00.
000
JP-8
0.00
00.
000
0.00
00.
000
0.00
00.
000
0.00
00.
000
0.00
0D
istil
late
s0.
000
0.00
00.
000
0.00
00.
000
0.00
00.
000
0.00
00.
000
Res
idua
ls
0.00
00.
000
0.00
00.
000
0.00
00.
000
0.00
00.
000
0.00
0D
iese
l0.
000
0.00
00.
000
0.00
00.
000
0.00
00.
000
0.00
00.
000
Tota
l Air
Ops
0.00
00.
000
0.00
00.
000
0.00
00.
000
Oth
erA
VG
AS
(CO
NU
S)
0.00
00.
000
0.00
00.
000
0.00
00.
000
0.00
00.
000
0.00
0M
OG
AS
: Le
aded
0.00
00.
000
0.00
00.
000
0.00
00.
000
0.00
00.
000
0.00
0M
OG
AS
: U
nlea
ded-
Mid
0.00
00.
000
0.00
00.
000
0.00
00.
000
0.00
00.
000
0.00
0JP
-50.
000
0.00
00.
000
0.00
00.
000
0.00
00.
000
0.00
00.
000
JP-8
0.00
00.
000
0.00
00.
000
0.00
00.
000
0.00
00.
000
0.00
0D
istil
late
s0.
000
0.00
00.
000
0.00
00.
000
0.00
00.
000
0.00
00.
000
Res
idua
ls0.
000
0.00
00.
000
0.00
00.
000
0.00
00.
000
0.00
00.
000
Gas
ohol
0.00
00.
000
0.00
00.
000
0.00
00.
000
0.00
00.
000
0.00
0R
ecla
imed
0.00
00.
000
0.00
00.
000
0.00
00.
000
0.00
00.
000
0.00
0D
iese
l0.
000
0.00
00.
000
0.00
00.
000
0.00
00.
000
0.00
00.
000
Tota
l Oth
er0.
000
0.00
00.
000
0.00
00.
000
0.00
0
Shi
p O
psM
OG
AS
: U
nlea
ded
- Mid
0.00
00.
000
0.00
00.
000
0.00
00.
000
0.00
00.
000
0.00
0JP
-50.
000
0.00
00.
000
0.00
00.
000
0.00
00.
000
0.00
00.
000
Dis
tilla
tes
0.00
00.
000
0.00
00.
000
0.00
00.
000
0.00
00.
000
0.00
0R
esid
uals
0.00
00.
000
0.00
00.
000
0.00
00.
000
0.00
00.
000
0.00
0R
ecla
imed
0.00
00.
000
0.00
00.
000
0.00
00.
000
0.00
00.
000
0.00
0D
iese
l0.
000
0.00
00.
000
0.00
00.
000
0.00
00.
000
0.00
00.
000
Tota
l Shi
p O
ps0.
000
0.00
00.
000
0.00
00.
000
0.00
0
Veh
icle
Ops A
VG
AS
: (C
ON
US
)0.
000
0.00
00.
000
0.00
00.
000
0.00
00.
000
0.00
00.
000
Unl
eade
d - R
egul
ar2.
006
88.1
7017
6.86
92.
655
115.
080
305.
537
2.25
012
4.32
027
9.72
0M
OG
AS
: U
nlea
ded-
Mid
0.00
00.
000
0.00
00.
000
0.00
00.
000
0.00
00.
000
0.00
0JP
-50.
000
0.00
00.
000
0.00
00.
000
0.00
00.
000
0.00
00.
000
JP-8
1.25
090
.200
112.
750
2.12
511
8.02
025
0.79
31.
810
127.
260
230.
341
Dis
tilla
tes
0.00
00.
000
0.00
00.
000
0.00
00.
000
0.00
00.
000
0.00
0G
asoh
ol0.
000
0.00
00.
000
0.00
00.
000
0.00
00.
000
0.00
00.
000
( Eth
anol
) Rec
laim
ed0.
000
0.00
00.
000
0.00
00.
000
0.00
00.
000
0.00
00.
000
*Bio
-Die
sel
0.00
00.
000
0.00
00.
000
0.00
00.
000
0.00
00.
000
0.00
0P
ropa
ne2.
099
89.7
8018
8.44
82.
714
117.
600
319.
166
2.40
612
6.84
030
5.17
7D
iese
l3.
314
88.1
7029
2.19
54.
470
115.
330
515.
525
4.12
812
4.32
051
3.19
3U
ltra
LS (D
SS
)0.
000
0.00
00.
000
0.00
00.
000
0.00
00.
000
0.00
00.
000
Ultr
a LS
(DV
D)
0.00
00.
000
0.00
00.
000
0.00
00.
000
0.00
00.
000
0.00
0K
eros
ene
0.00
00.
000
0.00
00.
000
0.00
00.
000
0.00
00.
000
0.00
0O
ther
(CN
G)
0.08
690
.200
7.75
70.
102
118.
020
12.0
380.
099
127.
260
12.5
99
Tota
l Veh
icle
Ops
8.75
577
8.01
912
.066
1,40
3.05
910
.693
1,34
1.03
0
FY 2
011
Est
imat
eFY
200
9 E
stim
ate
FY 2
010
Est
imat
e
Fuel
Dat
a
Fisc
al Y
ear (
FY) 2
011
Bud
get E
stim
ates
- Fe
brua
ry 2
010
($ in
Mill
ions
)
Dep
artm
ent o
f the
Nav
yS
uppl
y M
anag
emen
t - M
arin
e C
orps
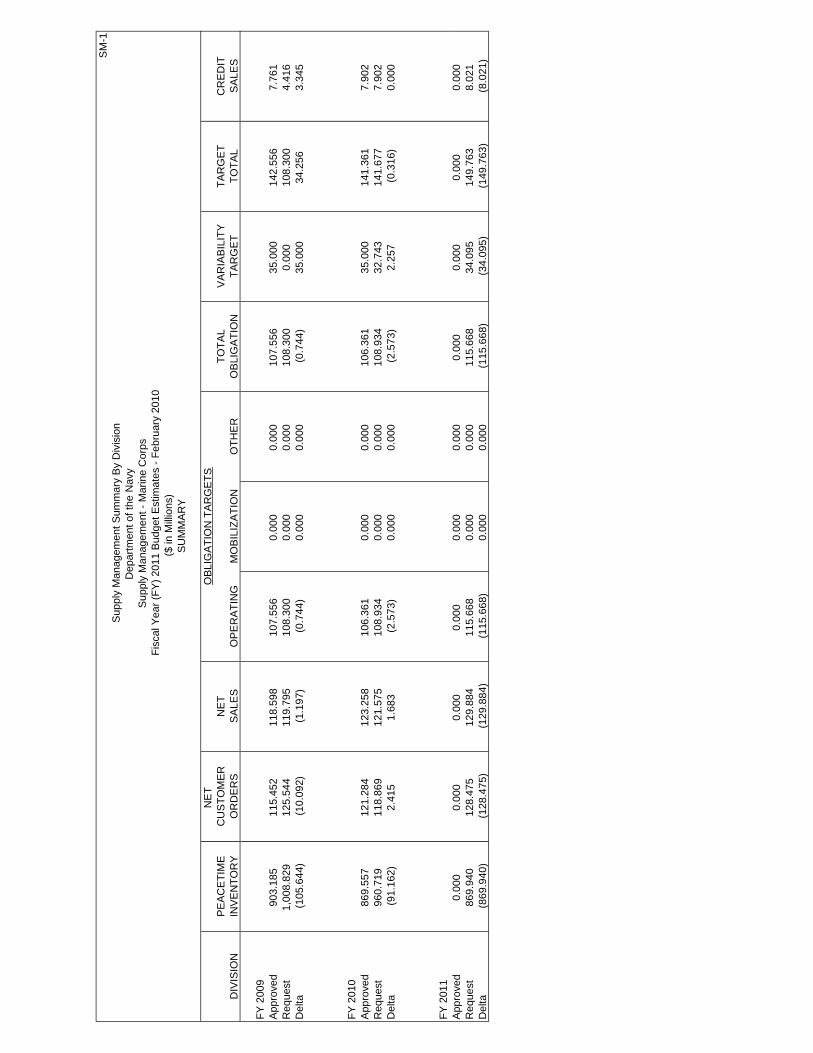
SM
-1
NE
T O
BLI
GA
TIO
N T
AR
GE
TSP
EA
CE
TIM
EC
US
TOM
ER
NE
TTO
TAL
VA
RIA
BIL
ITY
TAR
GE
TC
RE
DIT
DIV
ISIO
NIN
VE
NTO
RY
OR
DE
RS
SA
LES
OP
ER
ATI
NG
MO
BIL
IZA
TIO
NO
THE
RO
BLI
GA
TIO
NTA
RG
ET
TOTA
LS
ALE
S
FY 2
009
App
rove
d90
3.18
511
5.45
211
8.59
810
7.55
60.
000
0.00
010
7.55
635
.000
142.
556
7.76
1R
eque
st1,
008.
829
125.
544
119.
795
108.
300
0.00
00.
000
108.
300
0.00
010
8.30
04.
416
Del
ta(1
05.6
44)
(10.
092)
(1.1
97)
(0.7
44)
0.00
00.
000
(0.7
44)
35.0
0034
.256
3.34
5
FY
201
0
App
rove
d86
9.55
712
1.28
412
3.25
810
6.36
10.
000
0.00
010
6.36
135
.000
141.
361
7.90
2R
eque
st96
0.71
911
8.86
912
1.57
510
8.93
40.
000
0.00
010
8.93
432
.743
141.
677
7.90
2D
elta
(91.
162)
2.41
51.
683
(2.5
73)
0.00
00.
000
(2.5
73)
2.25
7(0
.316
)0.
000
FY 2
011
A
ppro
ved
0.00
00.
000
0.00
00.
000
0.00
00.
000
0.00
00.
000
0.00
00.
000
Req
uest
869.
940
128.
475
129.
884
115.
668
0.00
00.
000
115.
668
34.0
9514
9.76
38.
021
Del
ta(8
69.9
40)
(128
.475
)(1
29.8
84)
(115
.668
)0.
000
0.00
0(1
15.6
68)
(34.
095)
(149
.763
)(8
.021
)
Sup
ply
Man
agem
ent S
umm
ary
By
Div
isio
nD
epar
tmen
t of t
he N
avy
Fisc
al Y
ear (
FY) 2
011
Bud
get E
stim
ates
- Fe
brua
ry 2
010
($ in
Mill
ions
)
Sup
ply
Man
agem
ent -
Mar
ine
Cor
ps
SU
MM
AR
Y

SM
-1
NE
T O
BLI
GA
TIO
N T
AR
GE
TSP
EA
CE
TIM
EC
US
TOM
ER
NE
TTO
TAL
VA
RIA
BIL
ITY
TAR
GE
TC
RE
DIT
DIV
ISIO
NIN
VE
NTO
RY
OR
DE
RS
SA
LES
OP
ER
ATI
NG
MO
BIL
IZA
TIO
NO
THE
RO
BLI
GA
TIO
NTA
RG
ET
TOTA
LS
ALE
S
BP
21
App
rove
d0.
000
0.00
00.
000
0.00
00.
000
0.00
00.
000
0.00
00.
000
0.00
0R
eque
st0.
000
0.00
00.
000
0.00
00.
000
0.00
00.
000
0.00
00.
000
0.00
0D
elta
0.00
00.
000
0.00
00.
000
0.00
00.
000
0.00
00.
000
0.00
00.
000
BP
28
App
rove
d22
6.31
948
.650
49.2
4045
.172
0.00
00.
000
45.1
7220
.000
65.1
720.
100
Req
uest
226.
912
53.4
3853
.641
50.8
740.
000
0.00
050
.874
0.00
050
.874
0.12
1D
elta
(0.5
93)
(4.7
88)
(4.4
01)
(5.7
02)
0.00
00.
000
(5.7
02)
20.0
0014
.298
(0.0
21)
BP
38
App
rove
d0.
645
4.89
44.
894
4.89
10.
000
0.00
04.
891
0.00
04.
891
0.00
0R
eque
st0.
021
3.10
13.
101
0.77
80.
000
0.00
00.
778
0.00
00.
778
0.00
0D
elta
0.62
41.
793
1.79
34.
113
0.00
00.
000
4.11
30.
000
4.11
30.
000
BP
84
App
rove
d67
6.22
161
.908
64.4
6444
.176
0.00
00.
000
44.1
7615
.000
59.1
767.
661
Req
uest
781.
896
69.0
0563
.053
44.4
320.
000
0.00
044
.432
0.00
044
.432
4.29
5D
elta
(105
.675
)(7
.097
)1.
411
(0.2
56)
0.00
00.
000
(0.2
56)
15.0
0014
.744
3.36
6
BP
91
App
rove
d0.
000
0.00
00.
000
13.3
170.
000
0.00
013
.317
0.00
013
.317
0.00
0R
eque
st0.
000
0.00
00.
000
12.2
160.
000
0.00
012
.216
0.00
012
.216
0.00
0D
elta
0.00
00.
000
0.00
01.
101
0.00
00.
000
1.10
10.
000
1.10
10.
000
TOTA
LA
ppro
ved
903.
185
115.
452
118.
598
107.
556
0.00
00.
000
107.
556
35.0
0014
2.55
67.
761
Req
uest
1,00
8.82
912
5.54
411
9.79
510
8.30
00.
000
0.00
010
8.30
00.
000
108.
300
4.41
6D
elta
(105
.644
)(1
0.09
2)(1
.197
)(0
.744
)0.
000
0.00
0(0
.744
)35
.000
34.2
563.
345
Dep
artm
ent o
f the
Nav
yS
uppl
y M
anag
emen
t - M
arin
e C
orps
FY 2
009
Fisc
al Y
ear (
FY) 2
011
Bud
get E
stim
ates
- Fe
brua
ry 2
010
($ in
Mill
ions
)
Sup
ply
Man
agem
ent S
umm
ary
By
Div
isio
n

S
M-1
NE
T O
BLI
GA
TIO
N T
AR
GE
TSP
EA
CE
TIM
EC
US
TOM
ER
NE
TTO
TAL
VA
RIA
BIL
ITY
TAR
GE
TC
RE
DIT
DIV
ISIO
NIN
VE
NTO
RY
OR
DE
RS
SA
LES
OP
ER
ATI
NG
MO
BIL
IZA
TIO
NO
THE
RO
BLI
GA
TIO
NTA
RG
ET
TOTA
LS
ALE
S
BP
21
App
rove
d0.
000
0.00
00.
000
0.00
00.
000
0.00
00.
000
0.00
00.
000
0.00
0R
eque
st0.
000
0.00
00.
000
0.00
00.
000
0.00
00.
000
0.00
00.
000
0.00
0D
elta
0.00
00.
000
0.00
00.
000
0.00
00.
000
0.00
00.
000
0.00
00.
000
BP
28
App
rove
d22
6.35
147
.458
47.5
5946
.683
0.00
00.
000
46.6
8320
.000
66.6
830.
100
Req
uest
221.
939
53.4
4753
.497
52.4
420.
000
0.00
052
.442
20.0
0072
.442
0.10
0D
elta
4.41
2(5
.989
)(5
.938
)(5
.759
)0.
000
0.00
0(5
.759
)0.
000
(5.7
59)
0.00
0
BP
38
App
rove
d0.
644
5.17
65.
175
5.11
90.
000
0.00
05.
119
0.00
05.
119
0.00
0R
eque
st0.
018
1.40
31.
403
1.40
30.
000
0.00
01.
403
0.00
01.
403
0.00
0D
elta
0.62
63.
773
3.77
23.
716
0.00
00.
000
3.71
60.
000
3.71
60.
000
BP
84
App
rove
d64
2.56
268
.650
70.5
2440
.916
0.00
00.
000
40.9
1615
.000
55.9
167.
802
Req
uest
738.
762
64.0
1966
.675
41.5
740.
000
0.00
041
.574
12.7
4354
.317
7.80
2D
elta
(96.
200)
4.63
13.
849
(0.6
58)
0.00
00.
000
(0.6
58)
2.25
71.
599
0.00
0
BP
91
App
rove
d0.
000
0.00
00.
000
13.6
430.
000
0.00
013
.643
0.00
013
.643
0.00
0R
eque
st0.
000
0.00
00.
000
13.5
150.
000
0.00
013
.515
0.00
013
.515
0.00
0D
elta
0.00
00.
000
0.00
00.
128
0.00
00.
000
0.12
80.
000
0.12
80.
000
TOTA
LA
ppro
ved
869.
557
121.
284
123.
258
106.
361
0.00
00.
000
106.
361
35.0
0014
1.36
17.
902
Req
uest
960.
719
118.
869
121.
575
108.
934
0.00
00.
000
108.
934
32.7
4314
1.67
77.
902
Del
ta(9
1.16
2)2.
415
1.68
3(2
.573
)0.
000
0.00
0(2
.573
)2.
257
(0.3
16)
0.00
0
Dep
artm
ent o
f the
Nav
y
Fisc
al Y
ear (
FY) 2
011
Bud
get E
stim
ates
- Fe
brua
ry 2
010
($ in
Mill
ions
)FY
201
0
Sup
ply
Man
agem
ent -
Mar
ine
Cor
ps
Sup
ply
Man
agem
ent S
umm
ary
By
Div
isio
n
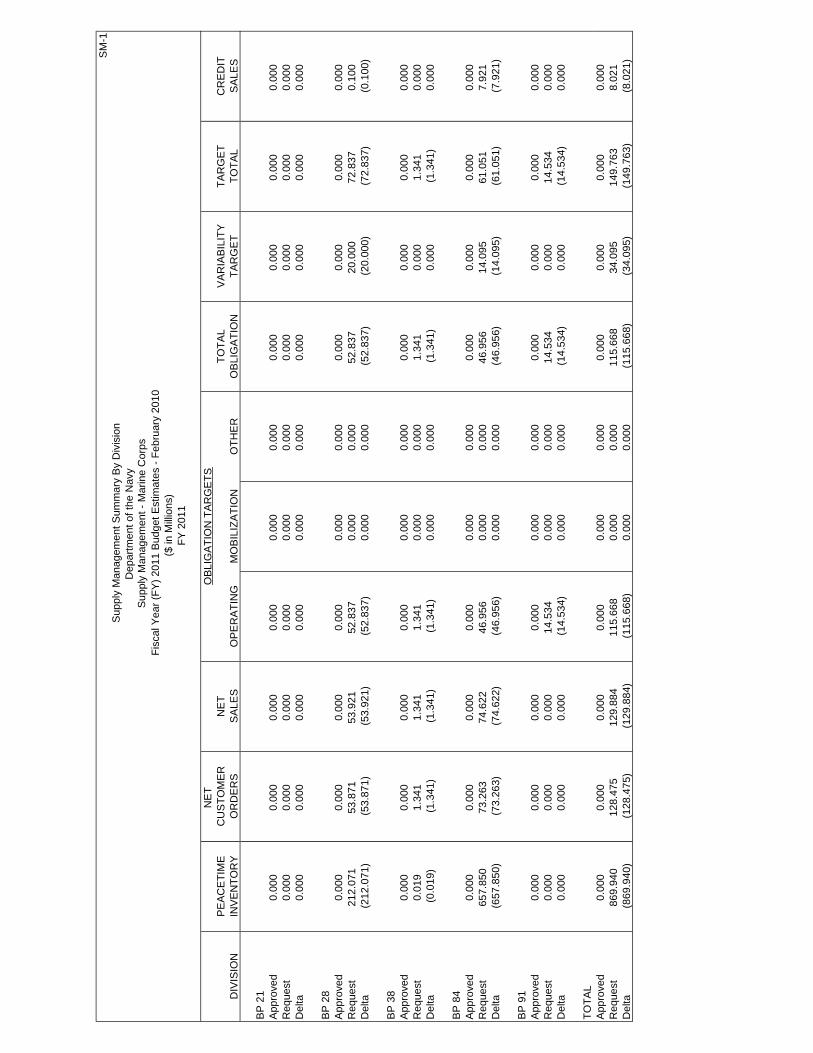
SM
-1
NE
T O
BLI
GA
TIO
N T
AR
GE
TSP
EA
CE
TIM
EC
US
TOM
ER
NE
TTO
TAL
VA
RIA
BIL
ITY
TAR
GE
TC
RE
DIT
DIV
ISIO
NIN
VE
NTO
RY
OR
DE
RS
SA
LES
OP
ER
ATI
NG
MO
BIL
IZA
TIO
NO
THE
RO
BLI
GA
TIO
NTA
RG
ET
TOTA
LS
ALE
S
BP
21
App
rove
d0.
000
0.00
00.
000
0.00
00.
000
0.00
00.
000
0.00
00.
000
0.00
0R
eque
st0.
000
0.00
00.
000
0.00
00.
000
0.00
00.
000
0.00
00.
000
0.00
0D
elta
0.00
00.
000
0.00
00.
000
0.00
00.
000
0.00
00.
000
0.00
00.
000
BP
28
App
rove
d0.
000
0.00
00.
000
0.00
00.
000
0.00
00.
000
0.00
00.
000
0.00
0R
eque
st21
2.07
153
.871
53.9
2152
.837
0.00
00.
000
52.8
3720
.000
72.8
370.
100
Del
ta(2
12.0
71)
(53.
871)
(53.
921)
(52.
837)
0.00
00.
000
(52.
837)
(20.
000)
(72.
837)
(0.1
00)
BP
38
App
rove
d0.
000
0.00
00.
000
0.00
00.
000
0.00
00.
000
0.00
00.
000
0.00
0R
eque
st0.
019
1.34
11.
341
1.34
10.
000
0.00
01.
341
0.00
01.
341
0.00
0D
elta
(0.0
19)
(1.3
41)
(1.3
41)
(1.3
41)
0.00
00.
000
(1.3
41)
0.00
0(1
.341
)0.
000
BP
84
App
rove
d0.
000
0.00
00.
000
0.00
00.
000
0.00
00.
000
0.00
00.
000
0.00
0R
eque
st65
7.85
073
.263
74.6
2246
.956
0.00
00.
000
46.9
5614
.095
61.0
517.
921
Del
ta(6
57.8
50)
(73.
263)
(74.
622)
(46.
956)
0.00
00.
000
(46.
956)
(14.
095)
(61.
051)
(7.9
21)
BP
91
App
rove
d0.
000
0.00
00.
000
0.00
00.
000
0.00
00.
000
0.00
00.
000
0.00
0R
eque
st0.
000
0.00
00.
000
14.5
340.
000
0.00
014
.534
0.00
014
.534
0.00
0D
elta
0.00
00.
000
0.00
0(1
4.53
4)0.
000
0.00
0(1
4.53
4)0.
000
(14.
534)
0.00
0
TOTA
LA
ppro
ved
0.00
00.
000
0.00
00.
000
0.00
00.
000
0.00
00.
000
0.00
00.
000
Req
uest
869.
940
128.
475
129.
884
115.
668
0.00
00.
000
115.
668
34.0
9514
9.76
38.
021
Del
ta(8
69.9
40)
(128
.475
)(1
29.8
84)
(115
.668
)0.
000
0.00
0(1
15.6
68)
(34.
095)
(149
.763
)(8
.021
)
Dep
artm
ent o
f the
Nav
yS
uppl
y M
anag
emen
t Sum
mar
y B
y D
ivis
ion
($ in
Mill
ions
)FY
201
1
Sup
ply
Man
agem
ent -
Mar
ine
Cor
psFi
scal
Yea
r (FY
) 201
1 B
udge
t Est
imat
es -
Febr
uary
201
0

SM
-3b
BA
SIC
SP
EC
IAL
BA
SIC
WE
AP
ON
SY
STE
M
B
P-8
4R
EP
LEN
OU
TFIT
SP
RO
GR
AM
SR
EW
OR
KTO
TAL
HIG
H M
OB
ILIT
Y A
RTI
LLE
RY
RO
CK
ET
SY
STE
M (H
IMA
RS
)0.
232
0.23
20.
000
0.00
0B
AS
IC R
EP
LEN
/BA
SIC
RE
WO
RK
8.90
010
.333
19.2
33TO
TAL
OR
DN
AN
CE
TA
NK
AU
TOM
OTI
VE
8.90
00.
232
0.00
010
.333
19.4
650.
000
0.00
00.
000
BA
SIC
RE
PLE
N/B
AS
IC R
EW
OR
K0.
000
0.00
00.
000
TOTA
L G
UID
ED
MIS
SIL
ES
AN
D E
QU
IPM
EN
T0.
000
0.00
00.
000
0.00
00.
000
RE
PA
IR &
TE
ST
EQ
UIP
ME
NT
0.19
80.
198
0.00
00.
000
BA
SIC
RE
PLE
N/B
AS
IC R
EW
OR
K10
.480
9.37
419
.854
TOTA
L C
OM
MU
NIC
ATI
ON
AN
D E
LEC
TRO
NIC
S10
.480
0.19
80.
000
9.37
420
.052
0.00
00.
000
0.00
0B
AS
IC R
EP
LEN
/BA
SIC
RE
WO
RK
3.89
50.
900
4.79
5TO
TAL
EN
GIN
EE
R S
UP
PO
RT
AN
D C
ON
STR
UC
TIO
N3.
895
0.00
00.
000
0.90
04.
795
0.00
00.
000
0.00
0B
AS
IC R
EP
LEN
/BA
SIC
RE
WO
RK
0.12
00.
120
TOTA
L G
EN
ER
AL
PR
OP
ER
T Y0.
000
0.00
00.
000
0.12
00.
120
TOTA
L P
RO
CU
RE
ME
NT
23.2
750.
430
0.00
020
.727
44.4
32W
AR
RE
SE
RV
E
0.00
00.
000
TOTA
L C
OS
T23
.275
0.43
00.
000
20.7
2744
.432
Ope
ratin
g R
equi
rem
ent b
y W
eapo
n S
yste
m D
ivis
ion
Dep
artm
ent o
f the
Nav
yS
uppl
y M
anag
emen
t - M
arin
e C
orps
($ in
Mill
ions
)
Fi
scal
Yea
r (FY
) 201
1 B
udge
t Est
imat
es -
Febr
uary
201
0
FY 2
009

SM
-3b
BA
SIC
SP
EC
IAL
BA
SIC
WE
AP
ON
SY
STE
M B
P-8
4R
EP
LEN
OU
TFIT
SP
RO
GR
AM
SR
EW
OR
KTO
TAL 0.
000
0.00
00.
000
BA
SIC
RE
PLE
N/B
AS
IC R
EW
OR
K8.
739
10.6
5219
.391
TOTA
L O
RD
NA
NC
E T
AN
K A
UTO
MO
TIV
E8.
739
0.00
00.
000
10.6
5219
.391
0.00
00.
000
0.00
0B
AS
IC R
EP
LEN
/BA
SIC
RE
WO
RK
0.00
00.
000
0.00
0TO
TAL
GU
IDE
D M
ISS
ILE
S A
ND
EQ
UIP
ME
NT
0.00
00.
000
0.00
00.
000
0.00
0R
EP
AIR
& T
ES
T E
QU
IPM
EN
T0.
250
0.25
00.
000
0.00
0B
AS
IC R
EP
LEN
/BA
SIC
RE
WO
RK
8.27
90.
000
9.37
417
.653
TOTA
L C
OM
MU
NIC
ATI
ON
AN
D E
LEC
TRO
NIC
S8.
279
0.25
00.
000
9.37
417
.903
0.00
00.
000
0.00
0B
AS
IC R
EP
LEN
/BA
SIC
RE
WO
RK
3.26
00.
900
4.16
0TO
TAL
EN
GIN
EE
R S
UP
PO
RT
AN
D C
ON
STR
UC
TIO
N3.
260
0.00
00.
000
0.90
04.
160
0.
000
0.00
00.
000
BA
SIC
RE
PLE
N/B
AS
IC R
EW
OR
K0.
120
0.12
0TO
TAL
GE
NE
RA
L P
RO
PE
RT Y
0.00
00.
000
0.00
00.
120
0.12
0
TOTA
L P
RO
CU
RE
ME
NT
20.2
780.
250
0.00
021
.046
41.5
74W
AR
RE
SE
RV
E
0.00
00.
000
TOTA
L C
OS
T20
.278
0.25
00.
000
21.0
4641
.574
Fisc
al Y
ear (
FY) 2
011
Bud
get E
stim
ates
- Fe
brua
ry 2
010
Ope
ratin
g R
equi
rem
ent b
y W
eapo
n S
yste
m D
ivis
ion
Dep
artm
ent o
f the
Nav
yS
uppl
y M
anag
emen
t - M
arin
e C
orps
($ in
Mill
ions
)FY
201
0

SM
-3b
BA
SIC
SP
EC
IAL
BA
SIC
WE
AP
ON
SY
STE
M B
P-8
4R
EP
LEN
OU
TFIT
SP
RO
GR
AM
SR
EW
OR
KTO
TAL 0.
000
0.00
00.
000
BA
SIC
RE
PLE
N/B
AS
IC R
EW
OR
K13
.896
10.4
1124
.307
TOTA
L O
RD
NA
NC
E T
AN
K A
UTO
MO
TIV
E13
.896
0.00
00.
000
10.4
1124
.307
0.00
00.
000
0.00
0B
AS
IC R
EP
LEN
/BA
SIC
RE
WO
RK
0.00
00.
000
0.00
0TO
TAL
GU
IDE
D M
ISS
ILE
S A
ND
EQ
UIP
ME
NT
0.00
00.
000
0.00
00.
000
0.00
0R
EP
AIR
& T
ES
T E
QU
IPM
EN
T0.
250
0.25
00.
000
0.00
0B
AS
IC R
EP
LEN
/BA
SIC
RE
WO
RK
8.71
50.
000
9.77
618
.491
TOTA
L C
OM
MU
NIC
ATI
ON
AN
D E
LEC
TRO
NIC
S8.
715
0.25
00.
000
9.77
618
.741
0.00
00.
000
0.00
0B
AS
IC R
EP
LEN
/BA
SIC
RE
WO
RK
3.69
90.
125
3.82
4TO
TAL
EN
GIN
EE
R S
UP
PO
RT
AN
D C
ON
STR
UC
TIO
N3.
699
0.00
00.
000
0.12
53.
824
0.
000
0.00
00.
000
BA
SIC
RE
PLE
N/B
AS
IC R
EW
OR
K0.
084
0.08
4TO
TAL
GE
NE
RA
L P
RO
PE
RT Y
0.00
00.
000
0.00
00.
084
0.08
4
TOTA
L P
RO
CU
RE
ME
NT
26.3
100.
250
0.00
020
.396
46.9
56W
AR
RE
SE
RV
E
0.00
00.
000
TOTA
L C
OS
T26
.310
0.25
00.
000
20.3
9646
.956
Fisc
al Y
ear (
FY) 2
011
Bud
get E
stim
ates
- Fe
brua
ry 2
010
FY 2
011
Sup
ply
Man
agem
ent -
Mar
ine
Cor
ps
Ope
ratin
g R
equi
rem
ent b
y W
eapo
n S
yste
m D
ivis
ion
Dep
artm
ent o
f the
Nav
y
($ in
Mill
ions
)

SM-4
Total Mobilization Operating Other
1. INVENTORY BOP 1,009.021 84.288 330.698 594.035
2. BOP INVENTORY ADJUSTMENTS 58.556 3.093 19.133 36.330 A. RECLASSIFICATION CHANGE (memo) 0.000 0.000 0.000 0.000 B. PRICE CHANGE AMOUNT (memo) 58.556 3.093 19.133 36.330 C. INVENTORY RECLASSIFIED AND 1,067.577 87.381 349.831 630.365 REPRICED
3. RECEIPTS AT STANDARD 126.058 17.332 108.726 0.000
4. SALES AT STANDARD 141.332 0.000 141.332 0.000
5. INVENTORY ADJUSTMENTS A. CAPITALIZATIONS + or (-) (1.660) (0.012) 4.539 (6.187) B. RETURNS FROM CUSTOMERS FOR CREDIT + 4.416 0.000 4.416 0.000 C. RETURNS FROM CUSTOMERS W/O CREDIT 378.693 0.905 44.697 333.091 D. RETURNS TO SUPPLIERS (-) (25.223) 0.000 0.000 (25.223) E. TRANSFERS TO PROP. DISPOSAL (-) (160.833) 0.000 0.000 (160.833) F. ISSUES/RECEIPTS WITHOUT REIMBURSEMENT + or (-) (30.097) (17.713) 0.000 (12.384) G. OTHER (list/explain) (125.926) (5.051) (81.125) (39.750) H. TOTAL ADJUSTMENTS 39.370 (21.871) (27.473) 88.714
6. INVENTORY EOP 1,091.673 82.842 289.752 719.079
7. INVENTORY EOP, REVALUED 693.888 70.405 274.136 349.347 A. ECONOMIC RETENTION (memo) 34.869 B. CONTINGENCY RETENTION (memo) 110.994 C. POTENTIAL DOD EXCESS (memo) 148.733
8. INVENTORY ON ORDER EOP (memo) 54.789 2.000 48.904 3.885
9. NARRATIVE:
Other adjustments (line 5g):
Total Mobilization Operating Other
Other Gains/Losses (125.926) (5.051) (81.125) (39.750) K3 Adjust 0.000 0.000 0.000 0.000 SIT Change 0.000 0.000 0.000 0.000 Strata Transfers 0.000 0.000 0.000 0.000
----- ----- ----- ----- Total (125.926) (5.051) (81.125) (39.750)
Inventory StatusDepartment of the Navy
Supply Management - Marine Corps
($ in Millions)Fiscal Year (FY) 2011 Budget Estimates - February 2010
FY 2009---- Peacetime ----
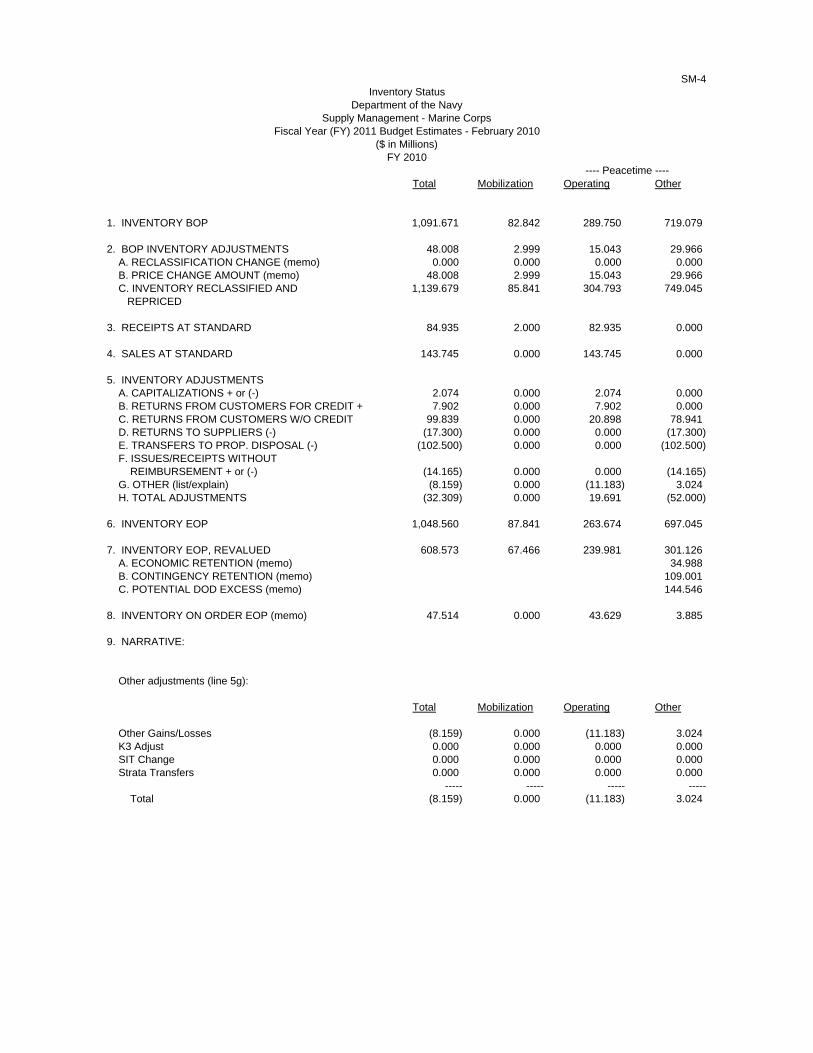
SM-4
Total Mobilization Operating Other
1. INVENTORY BOP 1,091.671 82.842 289.750 719.079
2. BOP INVENTORY ADJUSTMENTS 48.008 2.999 15.043 29.966 A. RECLASSIFICATION CHANGE (memo) 0.000 0.000 0.000 0.000 B. PRICE CHANGE AMOUNT (memo) 48.008 2.999 15.043 29.966 C. INVENTORY RECLASSIFIED AND 1,139.679 85.841 304.793 749.045 REPRICED
3. RECEIPTS AT STANDARD 84.935 2.000 82.935 0.000
4. SALES AT STANDARD 143.745 0.000 143.745 0.000
5. INVENTORY ADJUSTMENTS A. CAPITALIZATIONS + or (-) 2.074 0.000 2.074 0.000 B. RETURNS FROM CUSTOMERS FOR CREDIT + 7.902 0.000 7.902 0.000 C. RETURNS FROM CUSTOMERS W/O CREDIT 99.839 0.000 20.898 78.941 D. RETURNS TO SUPPLIERS (-) (17.300) 0.000 0.000 (17.300) E. TRANSFERS TO PROP. DISPOSAL (-) (102.500) 0.000 0.000 (102.500) F. ISSUES/RECEIPTS WITHOUT REIMBURSEMENT + or (-) (14.165) 0.000 0.000 (14.165) G. OTHER (list/explain) (8.159) 0.000 (11.183) 3.024 H. TOTAL ADJUSTMENTS (32.309) 0.000 19.691 (52.000)
6. INVENTORY EOP 1,048.560 87.841 263.674 697.045
7. INVENTORY EOP, REVALUED 608.573 67.466 239.981 301.126 A. ECONOMIC RETENTION (memo) 34.988 B. CONTINGENCY RETENTION (memo) 109.001 C. POTENTIAL DOD EXCESS (memo) 144.546
8. INVENTORY ON ORDER EOP (memo) 47.514 0.000 43.629 3.885
9. NARRATIVE:
Other adjustments (line 5g):
Total Mobilization Operating Other
Other Gains/Losses (8.159) 0.000 (11.183) 3.024 K3 Adjust 0.000 0.000 0.000 0.000 SIT Change 0.000 0.000 0.000 0.000 Strata Transfers 0.000 0.000 0.000 0.000
----- ----- ----- ----- Total (8.159) 0.000 (11.183) 3.024
Inventory StatusDepartment of the Navy
Supply Management - Marine CorpsFiscal Year (FY) 2011 Budget Estimates - February 2010
($ in Millions)FY 2010
---- Peacetime ----

SM-4
Total Mobilization Operating Other
1. INVENTORY BOP 1,048.560 87.841 263.674 697.045
2. BOP INVENTORY ADJUSTMENTS (20.886) 0.519 (6.276) (15.129) A. RECLASSIFICATION CHANGE (memo) 0.000 0.000 0.000 0.000 B. PRICE CHANGE AMOUNT (memo) (20.886) 0.519 (6.276) (15.129) C. INVENTORY RECLASSIFIED AND 1,027.674 88.360 257.398 681.916 REPRICED
3. RECEIPTS AT STANDARD 99.457 0.000 99.457 0.000
4. SALES AT STANDARD 152.268 0.000 152.268 0.000
5. INVENTORY ADJUSTMENTS A. CAPITALIZATIONS + or (-) 2.074 0.000 2.074 0.000 B. RETURNS FROM CUSTOMERS FOR CREDIT + 8.021 0.000 8.021 0.000 C. RETURNS FROM CUSTOMERS W/O CREDIT 97.455 0.000 37.151 60.304 D. RETURNS TO SUPPLIERS (-) (16.000) 0.000 0.000 (16.000) E. TRANSFERS TO PROP. DISPOSAL (-) (98.000) 0.000 0.000 (98.000) F. ISSUES/RECEIPTS WITHOUT REIMBURSEMENT + or (-) (4.855) 0.000 0.000 (4.855) G. OTHER (list/explain) (5.258) 0.000 (10.922) 5.664 H. TOTAL ADJUSTMENTS (16.563) 0.000 36.324 (52.887)
6. INVENTORY EOP 958.300 88.360 240.911 629.029
7. INVENTORY EOP, REVALUED 605.176 69.153 222.388 313.635 A. ECONOMIC RETENTION (memo) 36.686 B. CONTINGENCY RETENTION (memo) 113.790 C. POTENTIAL DOD EXCESS (memo) 150.569
8. INVENTORY ON ORDER EOP (memo) 52.121 0.000 48.236 3.885
9. NARRATIVE:
Other adjustments (line 5f):
Total Mobilization Operating Other
Other Gains/Losses (5.258) 0.000 (10.922) 5.664 K3 Adjust 0.000 0.000 0.000 0.000 SIT Change 0.000 0.000 0.000 0.000 Strata Transfers 0.000 0.000 0.000 0.000
----- ----- ----- ----- Total (5.258) 0.000 (10.922) 5.664
Inventory StatusDepartment of the Navy
---- Peacetime ----
Supply Management - Marine CorpsFiscal Year (FY) 2011 Budget Estimates - February 2010
($ in Millions)FY 2011

SM
-5b
FY 2
009
FY 2
010
FY20
11
1. N
ET
SA
LES
AT
CO
ST
58.8
1360
.517
61.0
98
2. L
ES
S: M
AT'
L IN
FLA
TIO
N A
DJ.
1.17
41.
361
1.00
0
3. R
EV
ISE
D N
ET
SA
LES
57.6
3959
.156
60.0
98
4. S
UR
CH
AR
GE
($)
14.5
2417
.934
21.1
95
5. C
HA
NG
E T
O C
US
TOM
ER
S
a.
PR
EV
IOU
S Y
EA
R'S
SU
RC
HA
RG
E (%
)0.
178
0.24
70.
296
b. T
HIS
YE
AR
'S S
UR
CH
AR
GE
AN
D M
ATE
RIA
L
IN
FLA
TIO
N D
IVID
ED
BY
LIN
E 3
AB
OV
E ($
)0.
272
0.32
60.
369
c.
PE
RC
EN
T C
HA
NG
E T
O C
US
TOM
ER
8.04
%6.
35%
5.63
%
($ in
Mill
ions
)
Cus
tom
er P
rice
Cha
nge
Dep
artm
ent o
f the
Nav
yS
uppl
y M
anag
emen
t - M
arin
e C
orps
Fisc
al Y
ear (
FY) 2
011
Bud
get E
stim
ates
- Fe
brua
ry 2
010

SM-6
WRM WRMTOTAL PROTECTED OTHER
1. INVENTORY BOP @ STD 84.288 84.288 0.000
2. PRICE CHANGE 3.093 3.093 0.000
3. RECLASSIFICATION 87.381 87.381 0.000
INVENTORY CHANGES a. RECEIPTS @ STD 17.332 17.332 0.000 (1) PURCHASES 17.332 17.332 0.000 (2) RETURNS FROM CUSTOMERS 0.000 0.000 0.000
b. ISSUES @ STD 0.000 0.000 0.000 (1) SALES 0.000 0.000 0.000 (2) RETURNS TO SUPPLIERS 0.000 0.000 0.000 (3) DISPOSALS 0.000 0.000 0.000
c. ADJUSTMENTS @ STD (21.871) (21.871) 0.000 (1) CAPITALIZATIONS 0.000 0.000 0.000 (2) GAINS AND LOSSES 0.000 0.000 0.000 (3) OTHER (21.871) (21.871) 0.000
INVENTORY EOP 82.842 82.842 0.000
1. STORAGE 0.000 0.000 0.0002. MANAGEMENT 0.000 0.000 0.0003. MAINTENANCE/OTHER 0.000 0.000 0.000
TOTAL COST 0.000 0.000 0.000
WRM BUDGET REQUEST1. OBLIGATIONS @ COST a. ADDITIONAL WRM INVESTMENT 0.000 0.000 0.000 b. REPLEN/REPAIR WRM REINVEST 0.000 0.000 0.000 c. STOCK ROTATION/OBSOLESCENCE 0.000 0.000 0.000 d. ASSEMBLE/DISASSEMBLE 0.000 0.000 0.000 e. OTHER 0.000 0.000 0.000
TOTAL REQUEST 0.000 0.000 0.000
STOCKPILE COSTS
FY 2009
War Reserve MaterialDepartment of the Navy
Supply Management - Marine Corps
STOCKPILE STATUS
($ in Millions)Fiscal Year (FY) 2011 Budget Estimates - February 2010

SM-6
WRM WRM TOTAL PROTECTED OTHER1. INVENTORY BOP @ STD 82.842 82.842 0.000
2. PRICE CHANGE 2.999 2.999 0.000
3. RECLASSIFICATION 85.841 85.841 0.000
INVENTORY CHANGES a. RECEIPTS @ STD 2.000 2.000 0.000 (1) PURCHASES 2.000 2.000 0.000 (2) RETURNS FROM CUSTOMERS 0.000 0.000 0.000
b. ISSUES @ STD 0.000 0.000 0.000 (1) SALES 0.000 0.000 0.000 (2) RETURNS TO SUPPLIERS 0.000 0.000 0.000 (3) DISPOSALS 0.000 0.000 0.000
c. ADJUSTMENTS @ STD 0.000 0.000 0.000 (1) CAPITALIZATIONS 0.000 0.000 0.000 (2) GAINS AND LOSSES 0.000 0.000 0.000 (3) OTHER 0.000 0.000 0.000
INVENTORY EOP 87.841 87.841 0.000
1. STORAGE 0.000 0.000 0.0002. MANAGEMENT 0.000 0.000 0.0003. MAINTENANCE/OTHER 0.000 0.000 0.000
TOTAL COST 0.000 0.000 0.000
1. OBLIGATIONS @ COST a. ADDITIONAL WRM INVESTMENT 0.000 0.000 0.000 b. REPLEN/REPAIR WRM REINVEST 0.000 0.000 0.000 c. STOCK ROTATION/OBSOLESCENCE 0.000 0.000 0.000 d. ASSEMBLE/DISASSEMBLE 0.000 0.000 0.000 e. OTHER 0.000 0.000 0.000
TOTAL REQUEST 0.000 0.000 0.000
WRM BUDGET REQUEST
War Reserve Material
STOCKPILE STATUS
STOCKPILE COSTS
FY 2010
Department of the Navy
($ in Millions)
Supply Management - Marine CorpsFiscal Year (FY) 2011 Budget Estimates - February 2010
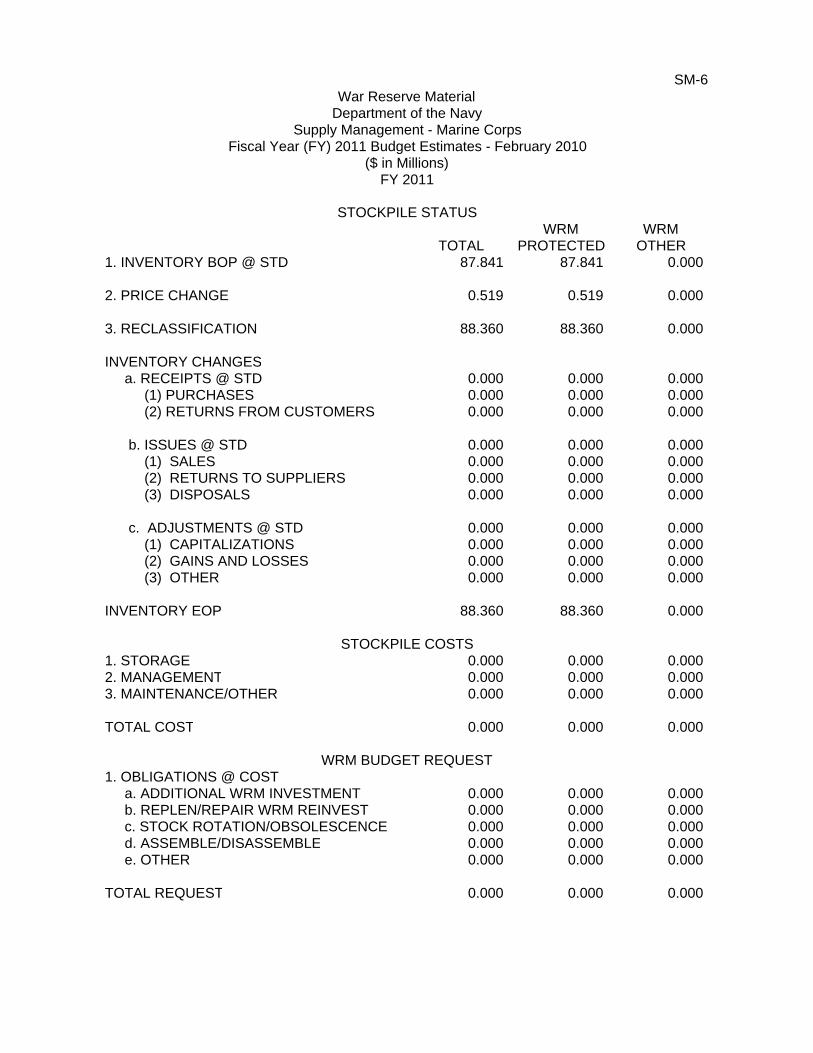
SM-6
WRM WRMTOTAL PROTECTED OTHER
1. INVENTORY BOP @ STD 87.841 87.841 0.000
2. PRICE CHANGE 0.519 0.519 0.000
3. RECLASSIFICATION 88.360 88.360 0.000
INVENTORY CHANGES a. RECEIPTS @ STD 0.000 0.000 0.000 (1) PURCHASES 0.000 0.000 0.000 (2) RETURNS FROM CUSTOMERS 0.000 0.000 0.000
b. ISSUES @ STD 0.000 0.000 0.000 (1) SALES 0.000 0.000 0.000 (2) RETURNS TO SUPPLIERS 0.000 0.000 0.000 (3) DISPOSALS 0.000 0.000 0.000
c. ADJUSTMENTS @ STD 0.000 0.000 0.000 (1) CAPITALIZATIONS 0.000 0.000 0.000 (2) GAINS AND LOSSES 0.000 0.000 0.000 (3) OTHER 0.000 0.000 0.000
INVENTORY EOP 88.360 88.360 0.000
1. STORAGE 0.000 0.000 0.0002. MANAGEMENT 0.000 0.000 0.0003. MAINTENANCE/OTHER 0.000 0.000 0.000
TOTAL COST 0.000 0.000 0.000
WRM BUDGET REQUEST1. OBLIGATIONS @ COST a. ADDITIONAL WRM INVESTMENT 0.000 0.000 0.000 b. REPLEN/REPAIR WRM REINVEST 0.000 0.000 0.000 c. STOCK ROTATION/OBSOLESCENCE 0.000 0.000 0.000 d. ASSEMBLE/DISASSEMBLE 0.000 0.000 0.000 e. OTHER 0.000 0.000 0.000
TOTAL REQUEST 0.000 0.000 0.000
Fiscal Year (FY) 2011 Budget Estimates - February 2010
War Reserve Material
STOCKPILE STATUS
STOCKPILE COSTS
FY 2011
Department of the NavySupply Management - Marine Corps
($ in Millions)