Embed Size (px)
Citation preview
Lean 6-Sigma Program
Shawn Cox(Project Greenbelt)
Department of Toxic Substances Control (DTSC)
Adam Palmer(Project Champion)
Keith Kihara(Executive Sponsor)
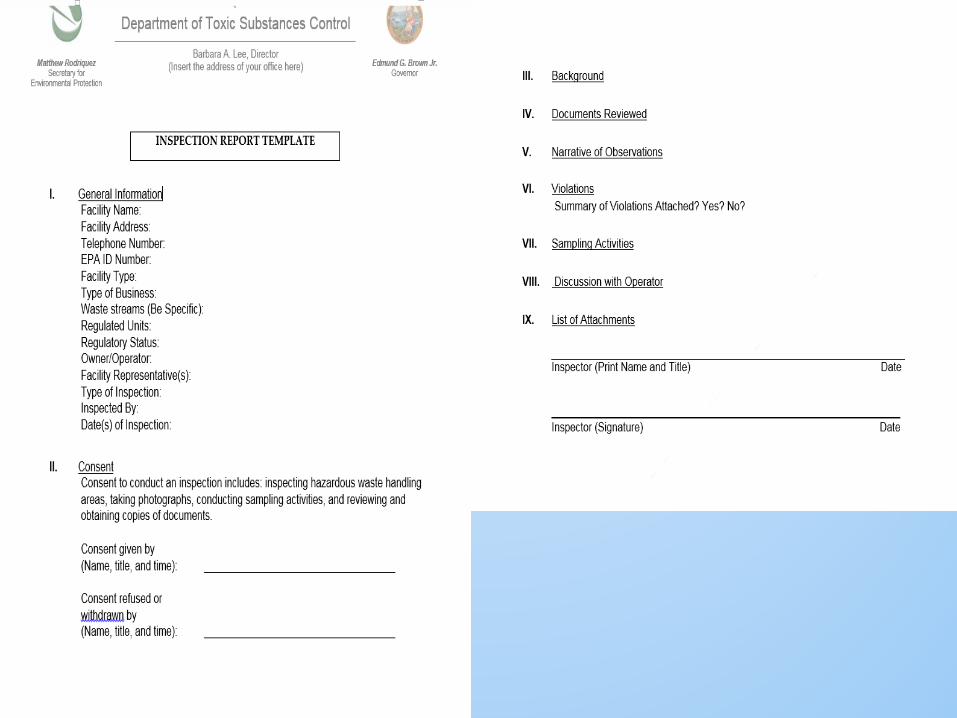
Inspection Report Project
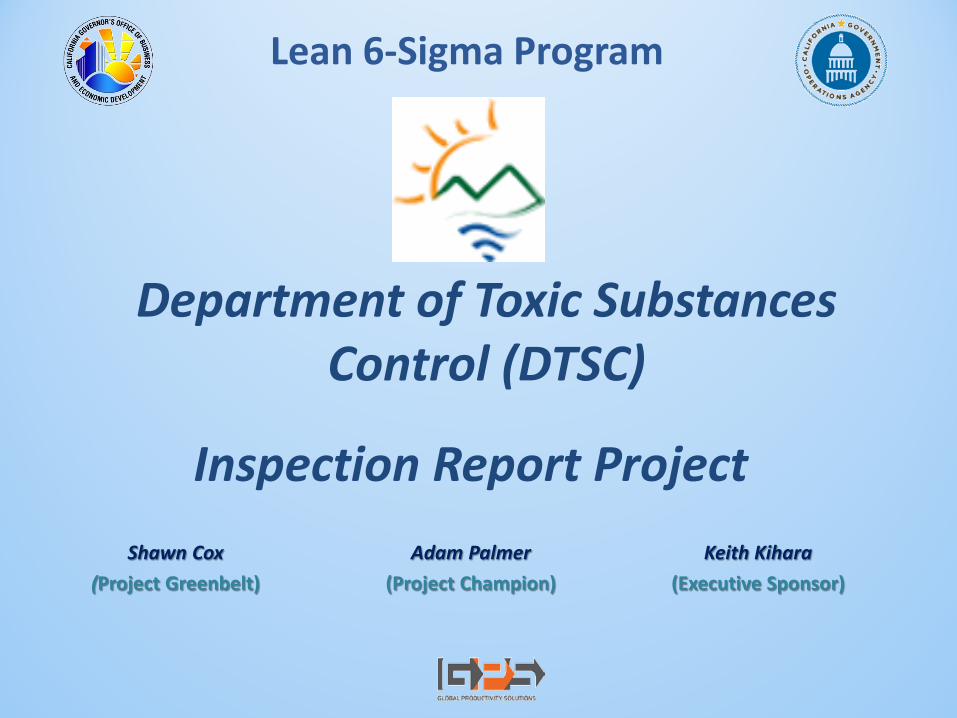
Enforcement and Emergency Response Division (EERD)
We perform inspections and enforcement on the following:
Universal Waste Facilities (E-Waste) Hazardous Waste Transporters Generators Treatment, Storage, and Disposal Facilities
Lean 6-Sigma Program
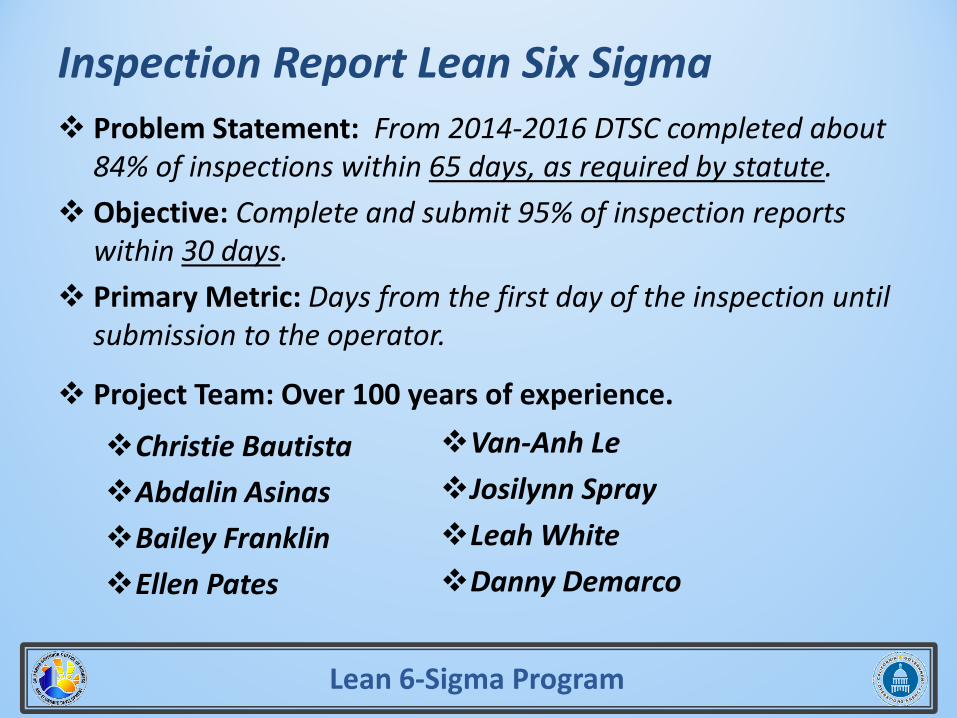
Problem Statement: From 2014-2016 DTSC completed about 84% of inspections within 65 days, as required by statute.
Objective: Complete and submit 95% of inspection reports within 30 days.
Primary Metric: Days from the first day of the inspection until submission to the operator.
Project Team: Over 100 years of experience.
Christie BautistaAbdalin AsinasBailey FranklinEllen Pates
Lean 6-Sigma Program
Inspection Report Lean Six Sigma
Van-Anh LeJosilynn SprayLeah WhiteDanny Demarco
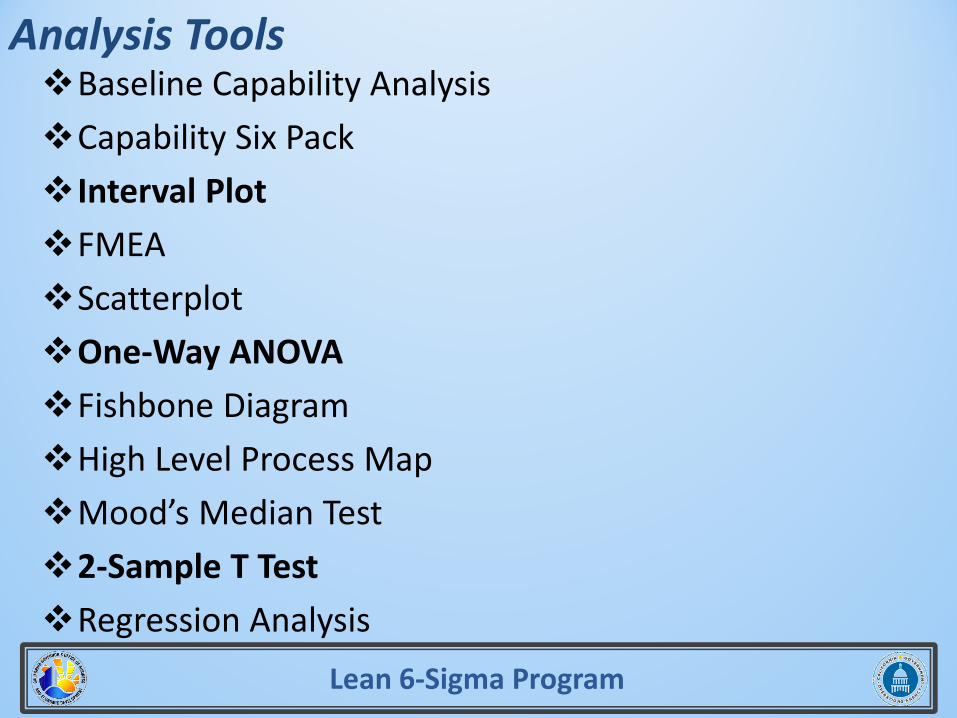
Baseline Capability AnalysisCapability Six PackInterval PlotFMEAScatterplotOne-Way ANOVAFishbone DiagramHigh Level Process MapMood’s Median Test2-Sample T TestRegression Analysis
Lean 6-Sigma Program
Analysis Tools
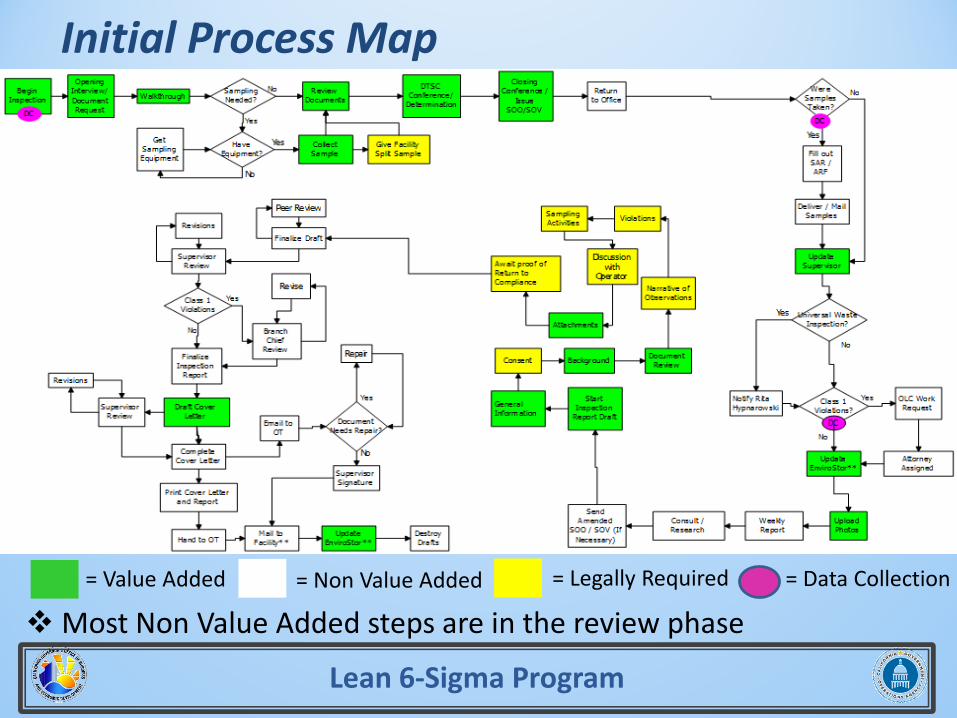
Most Non Value Added steps are in the review phase
Lean 6-Sigma Program
Initial Process Map
insert process map
= Value Added = Non Value Added = Legally Required = Data Collection
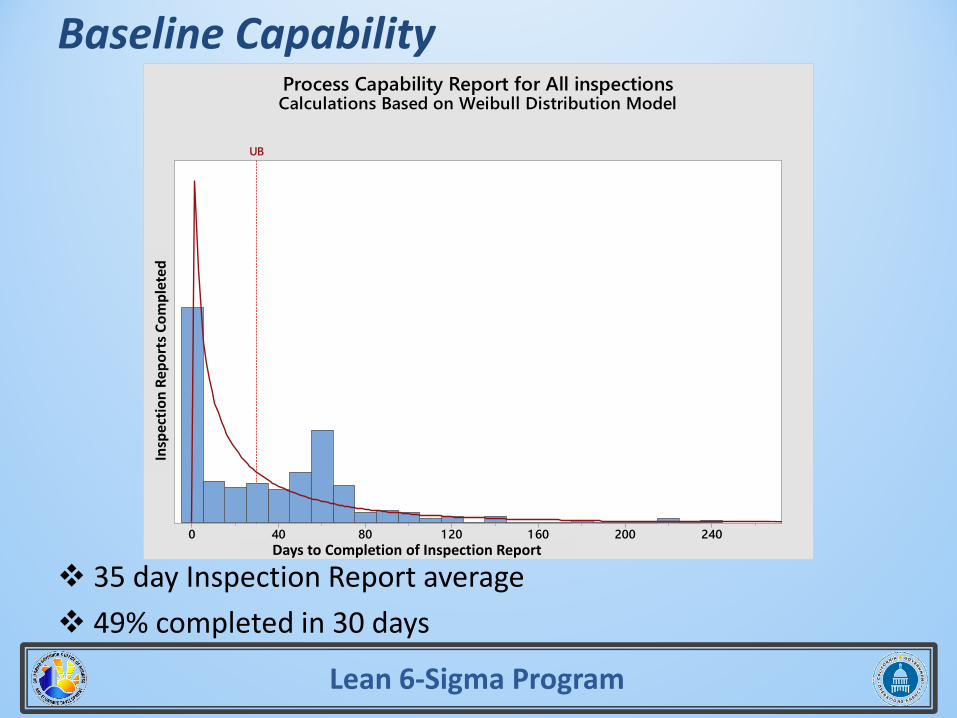
35 day Inspection Report average 49% completed in 30 days
Lean 6-Sigma Program
Baseline Capability
insert capability analysis graph
2402001 601 2080400
UB
Process Capability Report for All inspectionsCalculations Based on Weibull Distribution Model
Insp
ectio
n Re
port
s Com
plet
ed
Days to Completion of Inspection Report
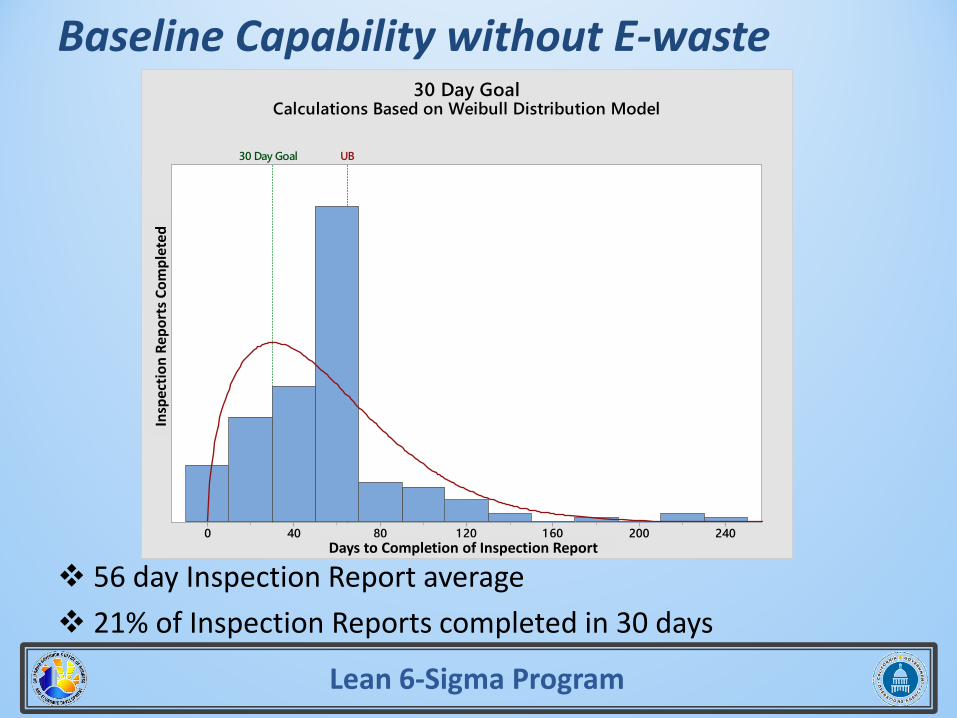
56 day Inspection Report average 21% of Inspection Reports completed in 30 days
Lean 6-Sigma Program
Baseline Capability without E-waste
insert capability analysis graph
2402001 601 2080400
30 Day Goal UB
30 Day GoalCalculations Based on Weibull Distribution Model
Insp
ectio
n Re
port
s Com
plet
ed
Days to Completion of Inspection Report
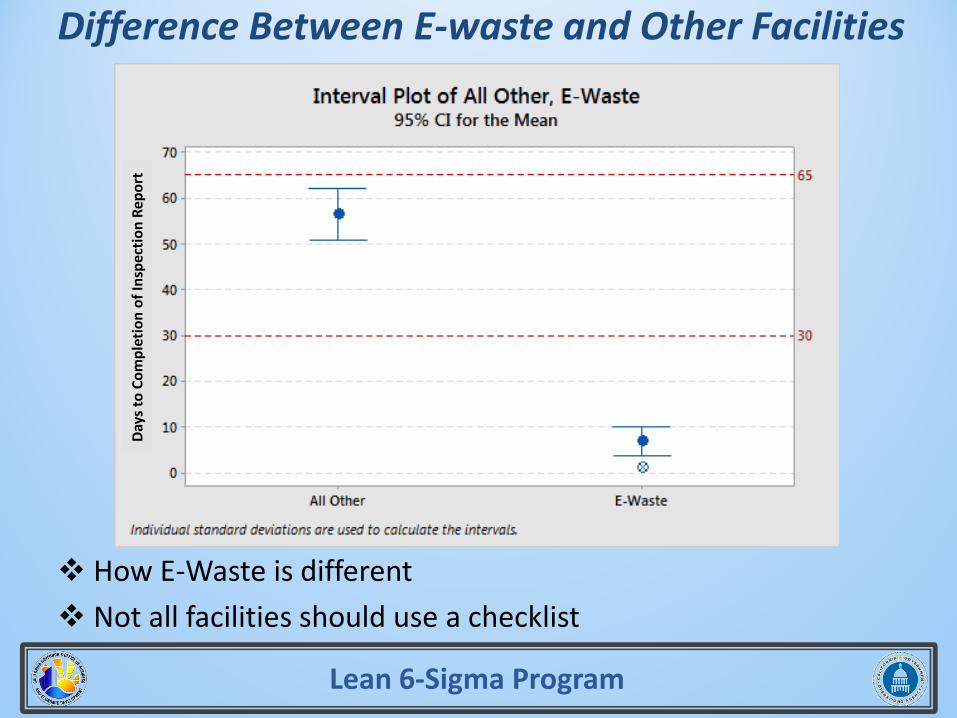
How E-Waste is different Not all facilities should use a checklist
Lean 6-Sigma Program
Difference Between E-waste and Other Facilities
insert graphical or analysis result
Days
to C
ompl
etio
n of
Insp
ectio
n Re
port
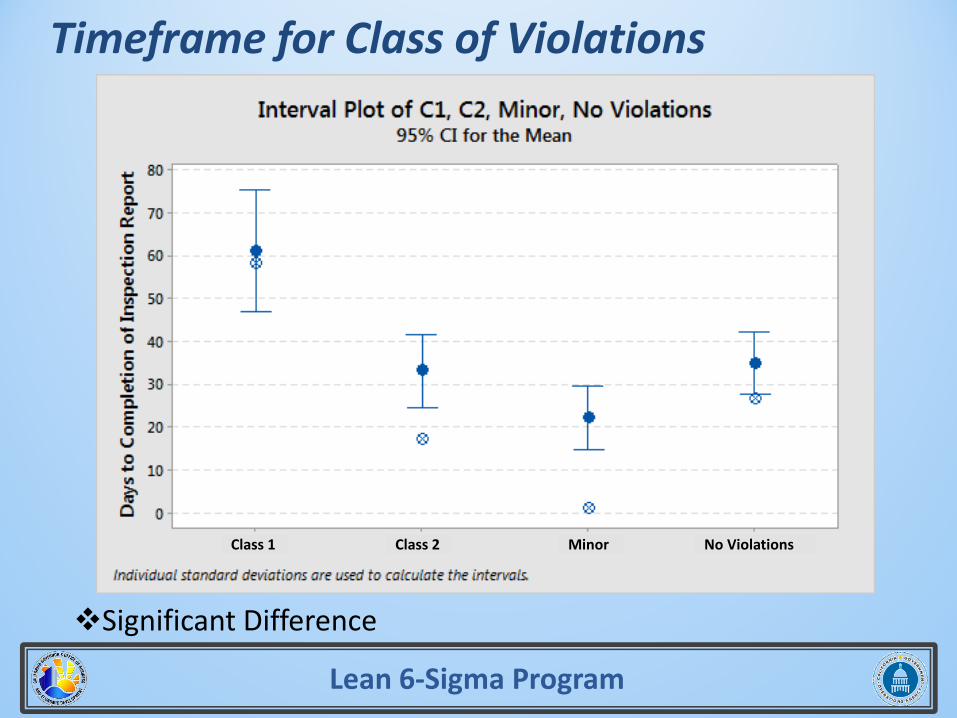
Timeframe for Class of Violations
Significant Difference
Class 1 Class 2 Minor No Violations
Lean 6-Sigma Program
Lean 6-Sigma Program
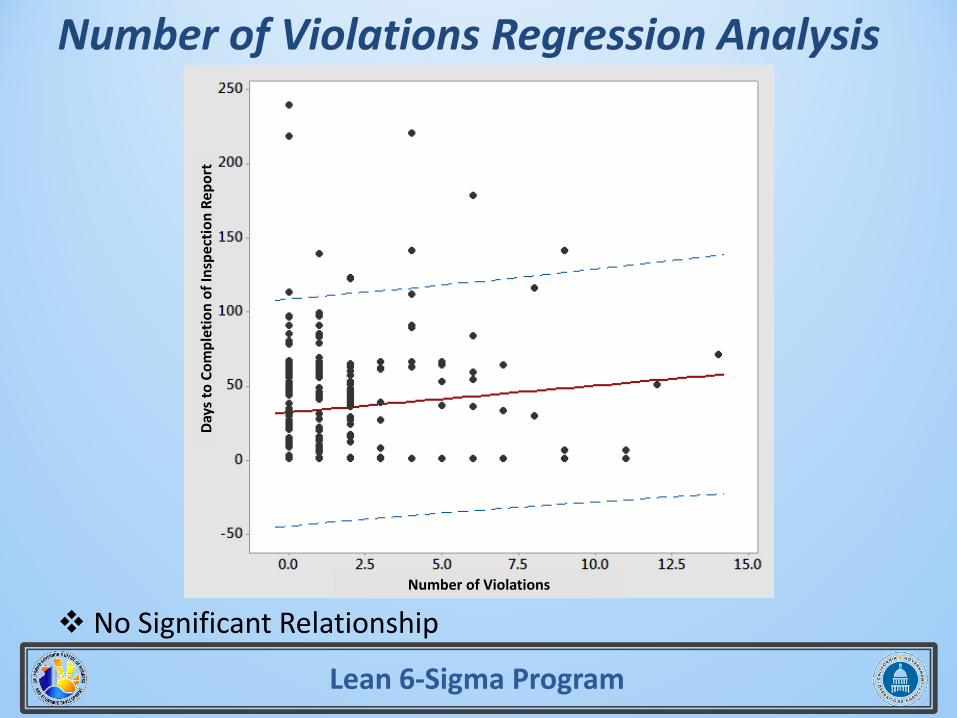
Number of Violations Regression Analysis
No Significant Relationship
Days
to C
ompl
etio
n of
Insp
ectio
n Re
port
Number of Violations
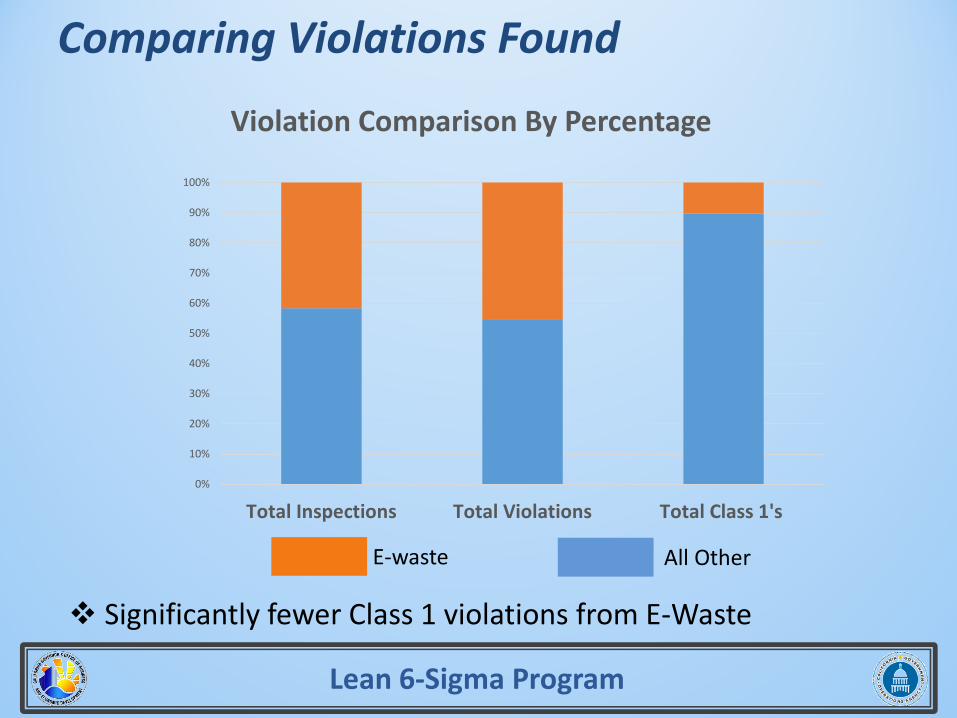
Significantly fewer Class 1 violations from E-Waste
Lean 6-Sigma Program
Comparing Violations Found
0%
10%
20%
30%
40%
50%
60%
70%
80%
90%
100%
Total Inspections Total Violations Total Class 1's
Violation Comparison By Percentage
E-waste All Other
Inspection Report Template – No real templateConsultation and Research – It is impossible to know all
of the California Code of Regulations/Health and Safety Code
Sampling – Not prepared to sample during the inspection
Cyclical review phases
Lean 6-Sigma Program
Critical X’s (root causes of problems)
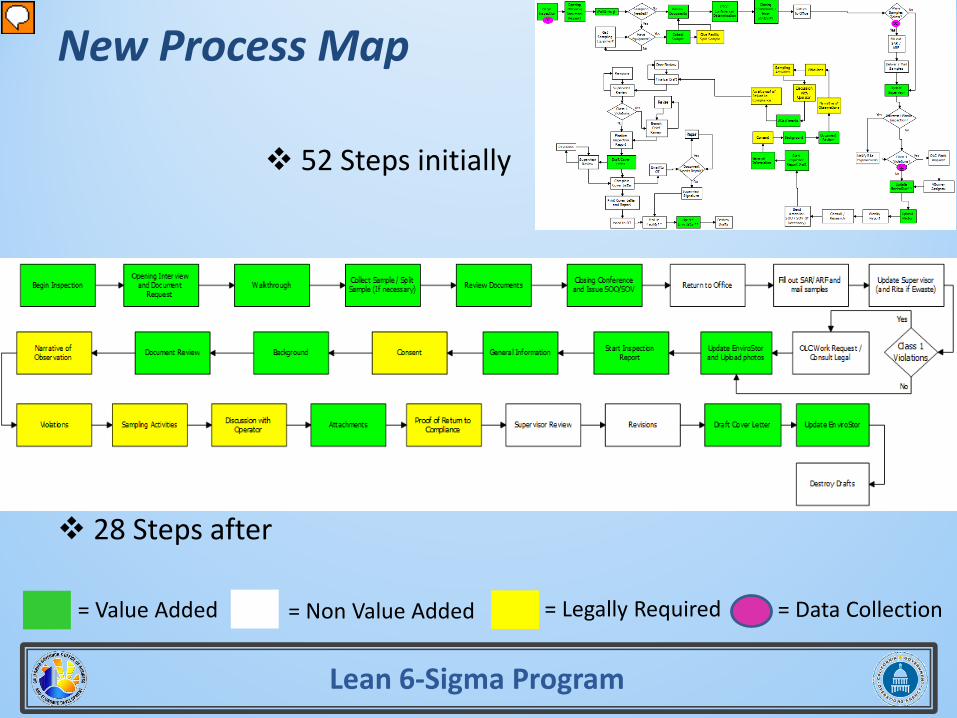
52 Steps initially
Lean 6-Sigma Program
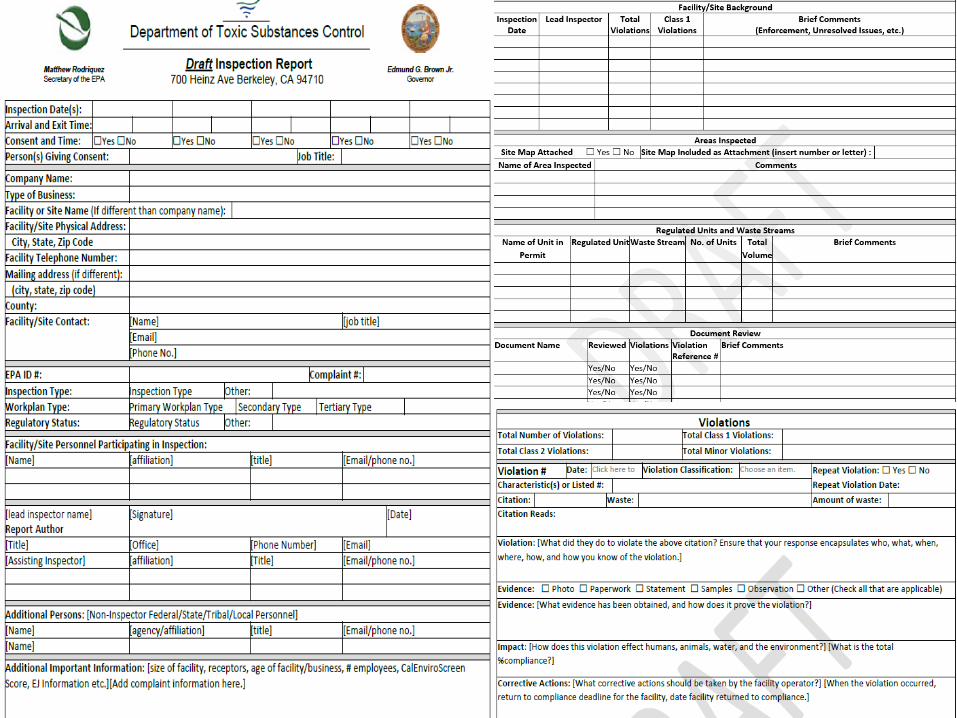
New Process Map
28 Steps after
= Value Added = Non Value Added = Legally Required = Data Collection
Checklist for transporter inspections Class 2 Violation threshold for checklist based inspections
(currently a Class 1 threshold) New inspection report template Sampling kit Health and Safety Code / California Code of Regulations
database Penalty Determination Team in the instance of Class 1 Violations Standardized Cover Letter Eliminate Branch Chief review of Inspection Reports
Lean 6-Sigma Program
Improvement Techniques
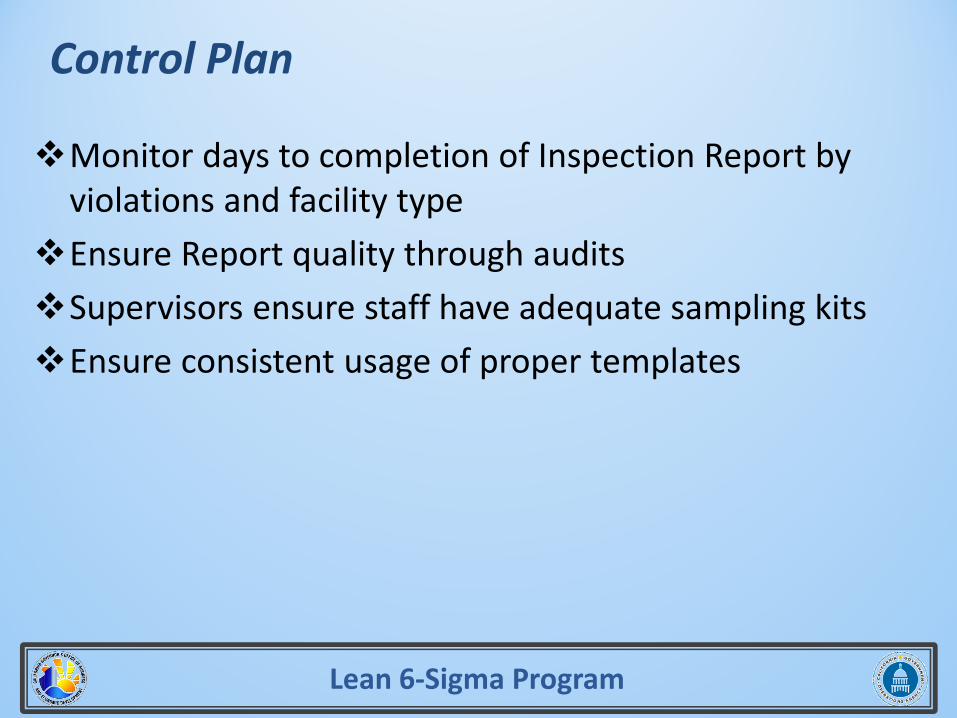
Monitor days to completion of Inspection Report by violations and facility type
Ensure Report quality through auditsSupervisors ensure staff have adequate sampling kitsEnsure consistent usage of proper templates
Lean 6-Sigma Program
Control Plan
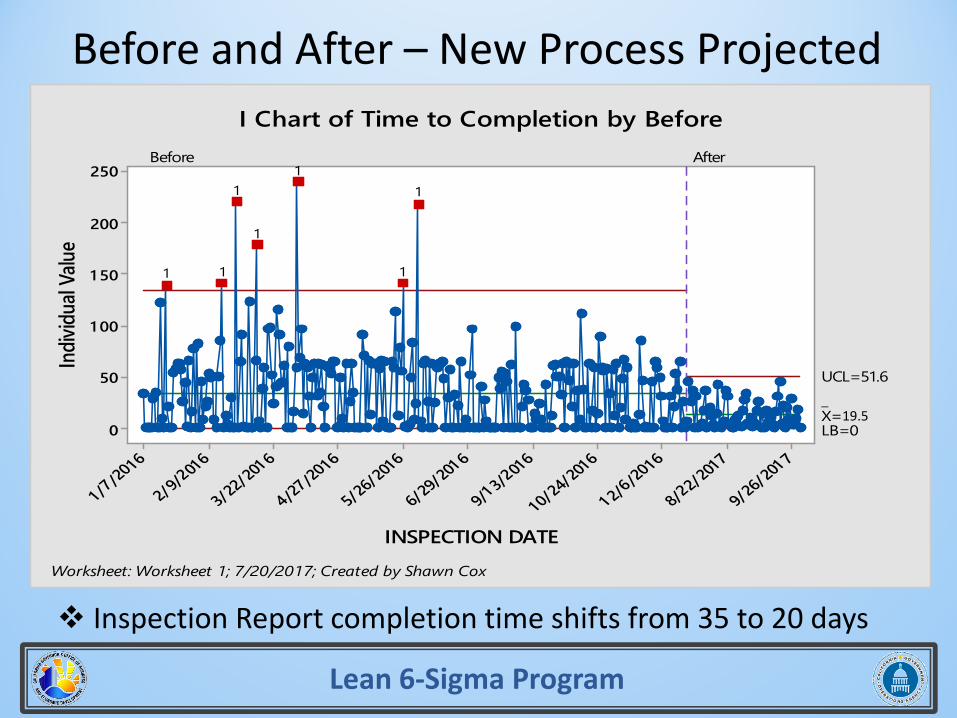
Before and After – New Process Projected
9/26/2
01 7
8/22/2
017
1 2/6/20
16
10/24/
2016
9/13/2
016
6/29/2
01 6
5/26/2
016
4/27/20
16
3/22/2
01 6
2/9/2016
1/7/20
16
250
200
1 50
1 00
50
0
INSPECTION DATE
Indiv
idual
Value
_X=13.8
UCL=51.6
LB=0
Before After
1
1
1
1
1
11
I Chart of Time to Completion by Before
Worksheet: Worksheet 1; 7/20/2017; Created by Shawn Cox
Inspection Report completion time shifts from 35 to 20 days
Lean 6-Sigma Program
19.5
Staff MoraleDepartment ImageStaff EfficiencyConcise presentation of informationCustomer SatisfactionCompatible with future technology upgrades
Lean 6-Sigma Program
Additional Benefits
A3 Performance Tracker
A3 Performance Tracker 20
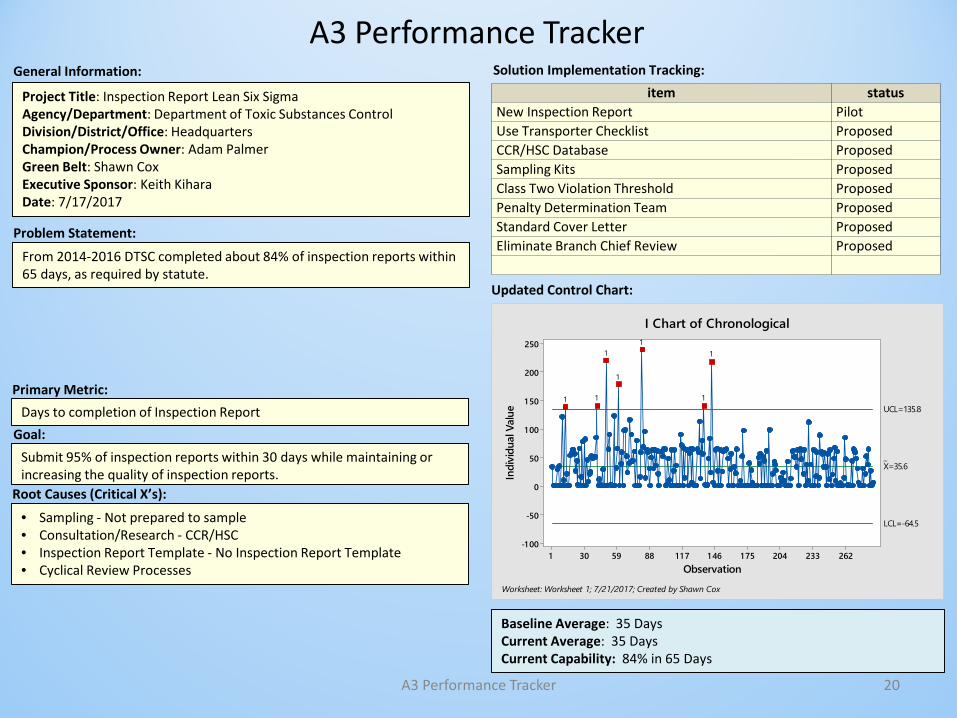
Problem Statement:
From 2014-2016 DTSC completed about 84% of inspection reports within 65 days, as required by statute.
Primary Metric:Days to completion of Inspection Report
Goal:Submit 95% of inspection reports within 30 days while maintaining or increasing the quality of inspection reports.
Root Causes (Critical X’s):
• Sampling - Not prepared to sample• Consultation/Research - CCR/HSC• Inspection Report Template - No Inspection Report Template• Cyclical Review Processes
Updated Control Chart:
Project Title: Inspection Report Lean Six Sigma Agency/Department: Department of Toxic Substances Control Division/District/Office: Headquarters Champion/Process Owner: Adam PalmerGreen Belt: Shawn CoxExecutive Sponsor: Keith Kihara Date: 7/17/2017
Baseline Average: 35 DaysCurrent Average: 35 DaysCurrent Capability: 84% in 65 Days
General Information: Solution Implementation Tracking:item status
New Inspection Report PilotUse Transporter Checklist ProposedCCR/HSC Database ProposedSampling Kits ProposedClass Two Violation Threshold ProposedPenalty Determination Team ProposedStandard Cover Letter ProposedEliminate Branch Chief Review Proposed
2622332041 751 461 1 78859301
250
200
1 50
1 00
50
0
-50
-1 00
Observation
Indi
vidu
al V
alue
_X=35.6
UCL=135.8
LCL=-64.5
1
1
1
1
1
11
I Chart of Chronological
Worksheet: Worksheet 1; 7/21/2017; Created by Shawn Cox
Name: Shawn Cox
Phone: (916) 322-7527
Email: [email protected]
Lean 6-Sigma Program
Green Belt Contact Information