Embed Size (px)
Citation preview
1Philippine Inclusive Innovation Industrial Strategy PROPELLING JOBS, INVESTMENTS, AND SHARED PROSPERITY FOR ALL
Highlights
• Inclusive Innovation Industrial Strategy (i3S) aims at growing innovative and globally competitive manufacturing, agriculture, and services while strengthening their linkages into domestic and global value chains with innovation at the core of the country’s strategic policies and programs.
• Underpinning the i3S strategy is the competition-innovation-productivity relationship where a highly liberalized market environment leads to more competition which spurs innovation and productivity growth.
• Innovation is crucial in addressing the challenges not only from globalization and rising regional economic integration but also from automation, robotics, artificial intelligence and other new technologies.
• While the private sector is seen as the major driver of growth for i3S strategy, the government plays an important role in terms of coordinating policies and necessary support measures that will address the obstacles to the entry and growth of domestic firms.
• The i3S prioritizes the growth and development of 12 major industries covering automotive, electronics and electrical, aerospace parts, chemicals, iron and steel and tool and die, garments, textiles, and furniture, shipbuilding, tourism, IT-business process management particularly knowledge process outsourcing and E-commerce, agribusiness, construction, and infrastructure and logistics.
• To complement innovation and entrepreneurship, the other major pillars of the i3S consist of building new industries, clusters, and agglomeration; capacity building and human resource development; MSME growth and development; and ease of doing business and investment environment.
• With the creation of the proper environment and implementation of innovation-centered programs through the Philippine i3S, domestic firms and industries can unleash their full potentials to take advantage of market opportunities, overcome challenges, and act as an engine for sustained, inclusive growth, job creation, and poverty reduction.
Series No. 2017-05
DEPARTMENT OF TRADE AND INDUSTRY
PolicyBriefs
Philippine Inclusive Innovation Industrial Strategy (i3S)PROPELLING JOBS, INVESTMENTS, AND SHARED PROSPERITY FOR ALL
2Philippine Inclusive Innovation Industrial Strategy PROPELLING JOBS, INVESTMENTS, AND SHARED PROSPERITY FOR ALL
Amidst increasing global and economic uncertainty, the Philippines has posted an impressive growth in recent years and is now seen as a new growth area. This remarkable development has been sustained up to the current year, as the country’s year-on-year growth rate for the first three quarters of 2017 stood at 6.7 percent – one of the highest in Asia, only eclipsed by China’s growth rate of 6.9 percent. This impressive growth is highlighted by the resurgence of the manufacturing sector, which exhibited an 8.3-percent year-on-year growth rate. Given its 105 million consumer market, rising middle class, and young and English speaking workers; there are opportunities for the Philippines to transform and upgrade its industries, generate more jobs, and attract more investments. The creation of the ASEAN Economic Community in 2015 and the emergence of regional and international production networks as well as global value chains offer increased trade and investment opportunities. Industry 4.0, which is driven by technologies like artificial intelligence, robotics, big data, and additive manufacturing represents opportunities to improve productivity and move up the global value chain but could also indicate substantial threats to industries that would be displaced by machines and automation. Though the macroeconomic performance of the Philippines has been remarkable, regional economic imbalances have continued to persist along with poverty, unemployment and underemployment. It is from this complex domestic and global perspectives that the government, in consultation with the private sector, has fine-tuned the country’s industrial strategy to adapt to changing market trends and attain sustainable and inclusive growth.
The policy brief outlines the new Philippine industrial policy which aims to create more and better jobs in order to make growth more inclusive and achieve shared prosperity for all Filipinos. It starts by providing a discussion of the macroeconomic performance of the Philippines along with an analysis of the emerging industrial structure. Section II highlights the imbalance in regional economic performance accompanied by poverty in the rural areas and high unemployment in regions such as NCR, CALABARZON, and Central Luzon, where economic opportunities are relatively higher: Section III reviews the most binding constraints preventing our industries from maximizing their potential opportunities. Section IV presents the country’s new industrial policy known as inclusive innovation industrial strategy (i3S) that aims to grow globally competitive and innovative industries with innovation at the core of industrial policies and programs.
This impressive growth is highlighted by the resurgence of the manufacturing sector...Given its 105 million consumer market, rising middle class, and young and English speaking workers; there are opportunities for the Philippines to transform and upgrade its industries, generate more jobs, and attract more investments.
3Philippine Inclusive Innovation Industrial Strategy PROPELLING JOBS, INVESTMENTS, AND SHARED PROSPERITY FOR ALL
I. Macroeconomic Performance and Industrial Structure
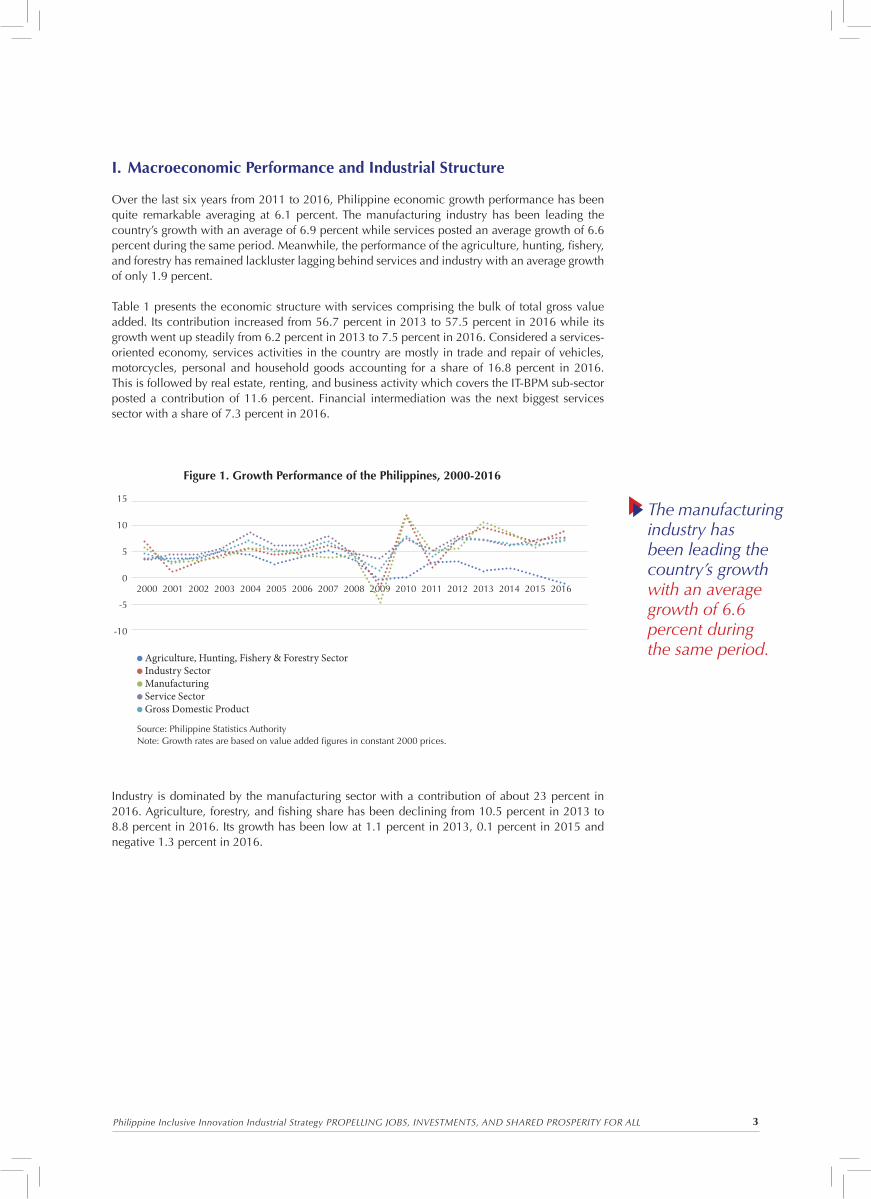
Over the last six years from 2011 to 2016, Philippine economic growth performance has been quite remarkable averaging at 6.1 percent. The manufacturing industry has been leading the country’s growth with an average of 6.9 percent while services posted an average growth of 6.6 percent during the same period. Meanwhile, the performance of the agriculture, hunting, fishery, and forestry has remained lackluster lagging behind services and industry with an average growth of only 1.9 percent.
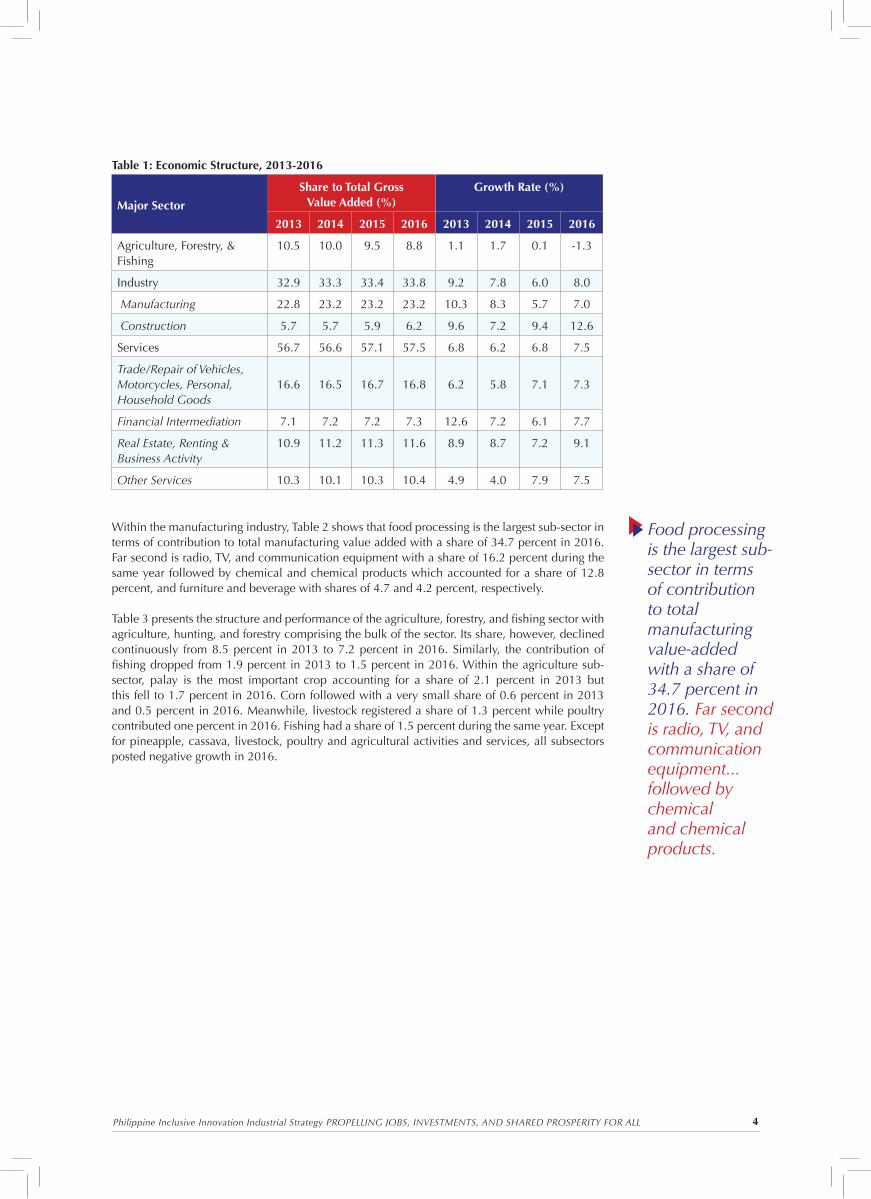
Table 1 presents the economic structure with services comprising the bulk of total gross value added. Its contribution increased from 56.7 percent in 2013 to 57.5 percent in 2016 while its growth went up steadily from 6.2 percent in 2013 to 7.5 percent in 2016. Considered a services-oriented economy, services activities in the country are mostly in trade and repair of vehicles, motorcycles, personal and household goods accounting for a share of 16.8 percent in 2016. This is followed by real estate, renting, and business activity which covers the IT-BPM sub-sector posted a contribution of 11.6 percent. Financial intermediation was the next biggest services sector with a share of 7.3 percent in 2016.
Industry is dominated by the manufacturing sector with a contribution of about 23 percent in 2016. Agriculture, forestry, and fishing share has been declining from 10.5 percent in 2013 to 8.8 percent in 2016. Its growth has been low at 1.1 percent in 2013, 0.1 percent in 2015 and negative 1.3 percent in 2016.
The manufacturing industry has been leading the country’s growth with an average growth of 6.6 percent during the same period.
2000 2001 2002 2003 2004 2005 2006 2007 2008 2009 2010 2011 2012 2013 2014 2015 2016
15
10
5
0
-5
-10
Agriculture, Hunting, Fishery & Forestry Sector Industry Sector Manufacturing Service Sector Gross Domestic Product
Source: Philippine Statistics AuthorityNote: Growth rates are based on value added figures in constant 2000 prices.
Figure 1. Growth Performance of the Philippines, 2000-2016
4Philippine Inclusive Innovation Industrial Strategy PROPELLING JOBS, INVESTMENTS, AND SHARED PROSPERITY FOR ALL
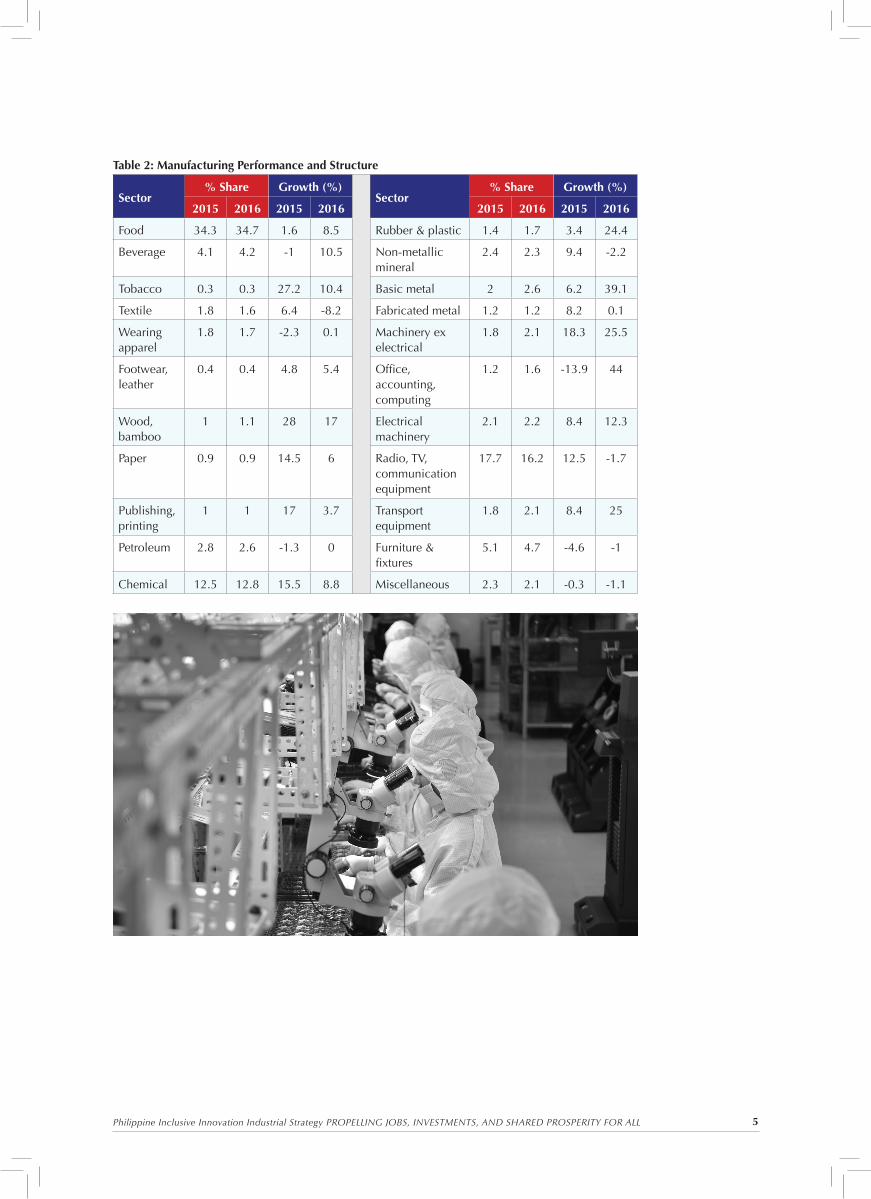
Food processing is the largest sub-sector in terms of contribution to total manufacturing value-added with a share of 34.7 percent in 2016. Far second is radio, TV, and communication equipment... followed by chemical and chemical products.
Table 1: Economic Structure, 2013-2016
Major Sector
Share to Total Gross Value Added (%)
Growth Rate (%)
2013 2014 2015 2016 2013 2014 2015 2016
Agriculture, Forestry, & Fishing
10.5 10.0 9.5 8.8 1.1 1.7 0.1 -1.3
Industry 32.9 33.3 33.4 33.8 9.2 7.8 6.0 8.0
Manufacturing 22.8 23.2 23.2 23.2 10.3 8.3 5.7 7.0
Construction 5.7 5.7 5.9 6.2 9.6 7.2 9.4 12.6
Services 56.7 56.6 57.1 57.5 6.8 6.2 6.8 7.5
Trade/Repair of Vehicles, Motorcycles, Personal,Household Goods
16.6 16.5 16.7 16.8 6.2 5.8 7.1 7.3
Financial Intermediation 7.1 7.2 7.2 7.3 12.6 7.2 6.1 7.7
Real Estate, Renting & Business Activity
10.9 11.2 11.3 11.6 8.9 8.7 7.2 9.1
Other Services 10.3 10.1 10.3 10.4 4.9 4.0 7.9 7.5
Within the manufacturing industry, Table 2 shows that food processing is the largest sub-sector in terms of contribution to total manufacturing value added with a share of 34.7 percent in 2016. Far second is radio, TV, and communication equipment with a share of 16.2 percent during the same year followed by chemical and chemical products which accounted for a share of 12.8 percent, and furniture and beverage with shares of 4.7 and 4.2 percent, respectively.
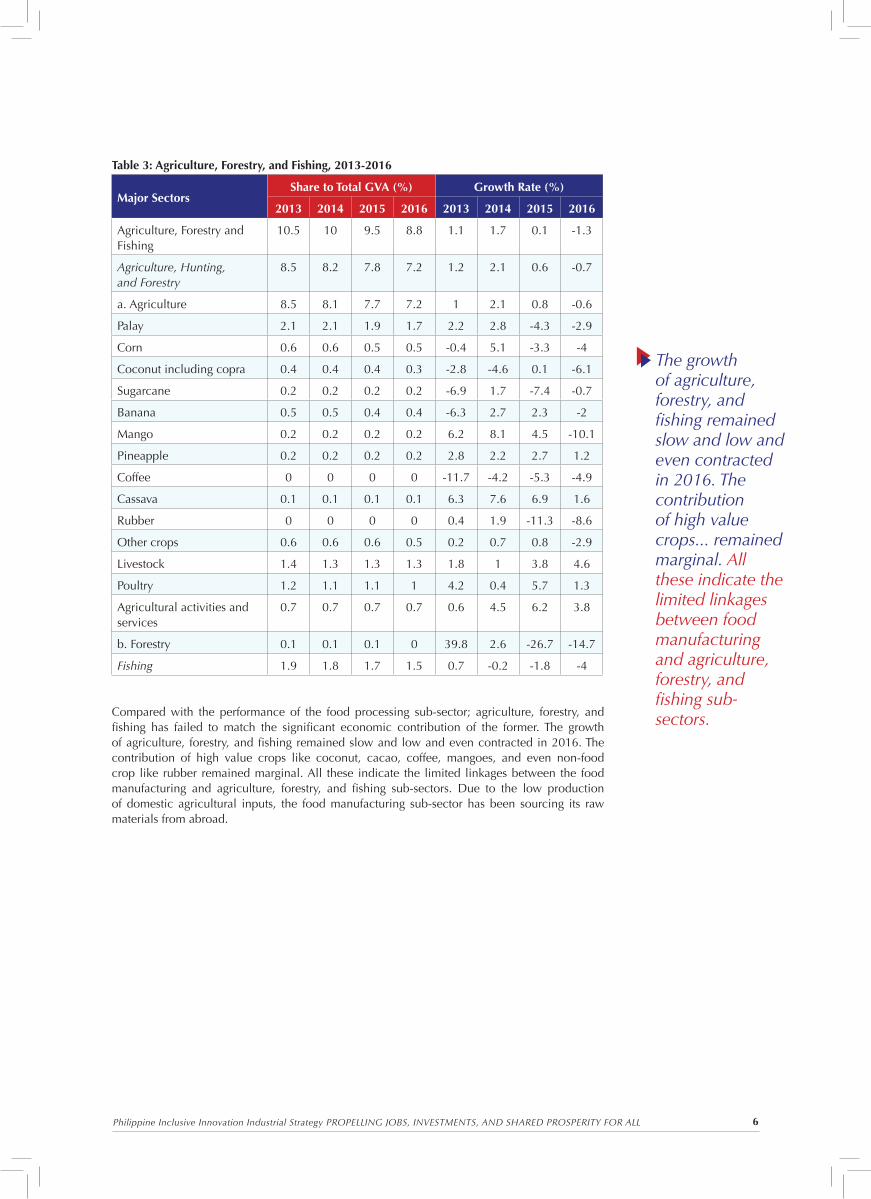
Table 3 presents the structure and performance of the agriculture, forestry, and fishing sector with agriculture, hunting, and forestry comprising the bulk of the sector. Its share, however, declined continuously from 8.5 percent in 2013 to 7.2 percent in 2016. Similarly, the contribution of fishing dropped from 1.9 percent in 2013 to 1.5 percent in 2016. Within the agriculture sub-sector, palay is the most important crop accounting for a share of 2.1 percent in 2013 but this fell to 1.7 percent in 2016. Corn followed with a very small share of 0.6 percent in 2013 and 0.5 percent in 2016. Meanwhile, livestock registered a share of 1.3 percent while poultry contributed one percent in 2016. Fishing had a share of 1.5 percent during the same year. Except for pineapple, cassava, livestock, poultry and agricultural activities and services, all subsectors posted negative growth in 2016.
5Philippine Inclusive Innovation Industrial Strategy PROPELLING JOBS, INVESTMENTS, AND SHARED PROSPERITY FOR ALL
Table 2: Manufacturing Performance and Structure
Sector% Share Growth (%)
Sector% Share Growth (%)
2015 2016 2015 2016 2015 2016 2015 2016
Food 34.3 34.7 1.6 8.5 Rubber & plastic 1.4 1.7 3.4 24.4
Beverage 4.1 4.2 -1 10.5 Non-metallic mineral
2.4 2.3 9.4 -2.2
Tobacco 0.3 0.3 27.2 10.4 Basic metal 2 2.6 6.2 39.1
Textile 1.8 1.6 6.4 -8.2 Fabricated metal 1.2 1.2 8.2 0.1
Wearing apparel
1.8 1.7 -2.3 0.1 Machinery ex electrical
1.8 2.1 18.3 25.5
Footwear, leather
0.4 0.4 4.8 5.4 Office, accounting, computing
1.2 1.6 -13.9 44
Wood, bamboo
1 1.1 28 17 Electrical machinery
2.1 2.2 8.4 12.3
Paper 0.9 0.9 14.5 6 Radio, TV, communication equipment
17.7 16.2 12.5 -1.7
Publishing, printing
1 1 17 3.7 Transport equipment
1.8 2.1 8.4 25
Petroleum 2.8 2.6 -1.3 0 Furniture & fixtures
5.1 4.7 -4.6 -1
Chemical 12.5 12.8 15.5 8.8 Miscellaneous 2.3 2.1 -0.3 -1.1
6Philippine Inclusive Innovation Industrial Strategy PROPELLING JOBS, INVESTMENTS, AND SHARED PROSPERITY FOR ALL
Table 3: Agriculture, Forestry, and Fishing, 2013-2016
Major SectorsShare to Total GVA (%) Growth Rate (%)
2013 2014 2015 2016 2013 2014 2015 2016
Agriculture, Forestry and Fishing
10.5 10 9.5 8.8 1.1 1.7 0.1 -1.3
Agriculture, Hunting, and Forestry
8.5 8.2 7.8 7.2 1.2 2.1 0.6 -0.7
a. Agriculture 8.5 8.1 7.7 7.2 1 2.1 0.8 -0.6
Palay 2.1 2.1 1.9 1.7 2.2 2.8 -4.3 -2.9
Corn 0.6 0.6 0.5 0.5 -0.4 5.1 -3.3 -4
Coconut including copra 0.4 0.4 0.4 0.3 -2.8 -4.6 0.1 -6.1
Sugarcane 0.2 0.2 0.2 0.2 -6.9 1.7 -7.4 -0.7
Banana 0.5 0.5 0.4 0.4 -6.3 2.7 2.3 -2
Mango 0.2 0.2 0.2 0.2 6.2 8.1 4.5 -10.1
Pineapple 0.2 0.2 0.2 0.2 2.8 2.2 2.7 1.2
Coffee 0 0 0 0 -11.7 -4.2 -5.3 -4.9
Cassava 0.1 0.1 0.1 0.1 6.3 7.6 6.9 1.6
Rubber 0 0 0 0 0.4 1.9 -11.3 -8.6
Other crops 0.6 0.6 0.6 0.5 0.2 0.7 0.8 -2.9
Livestock 1.4 1.3 1.3 1.3 1.8 1 3.8 4.6
Poultry 1.2 1.1 1.1 1 4.2 0.4 5.7 1.3
Agricultural activities and services
0.7 0.7 0.7 0.7 0.6 4.5 6.2 3.8
b. Forestry 0.1 0.1 0.1 0 39.8 2.6 -26.7 -14.7
Fishing 1.9 1.8 1.7 1.5 0.7 -0.2 -1.8 -4
Compared with the performance of the food processing sub-sector; agriculture, forestry, and fishing has failed to match the significant economic contribution of the former. The growth of agriculture, forestry, and fishing remained slow and low and even contracted in 2016. The contribution of high value crops like coconut, cacao, coffee, mangoes, and even non-food crop like rubber remained marginal. All these indicate the limited linkages between the food manufacturing and agriculture, forestry, and fishing sub-sectors. Due to the low production of domestic agricultural inputs, the food manufacturing sub-sector has been sourcing its raw materials from abroad.
The growth of agriculture, forestry, and fishing remained slow and low and even contracted in 2016. The contribution of high value crops... remained marginal. All these indicate the limited linkages between food manufacturing and agriculture, forestry, and fishing sub-sectors.
7Philippine Inclusive Innovation Industrial Strategy PROPELLING JOBS, INVESTMENTS, AND SHARED PROSPERITY FOR ALL
-50.00% -30.00% -10.00% 10.00% 30.00% 50.00% 70.00%
Mining growth rate (2014-2015, at constant prices)
Min
ing
as %
of G
RD
P (2
015,
at
cons
tant
pri
ces)
30.00%
25.00%
20.00%
15.00%
10.00%
5.00%
0.00%
-5.00%
Figure 4: Mining Activities Across Regions: Size, Growth, Contribution to GRDP
MIMAROPACARAGA
CALABARZONCENTRAL LUZON
II. Regional Economic Analysis: Uneven Development, Poverty, and Unemployment
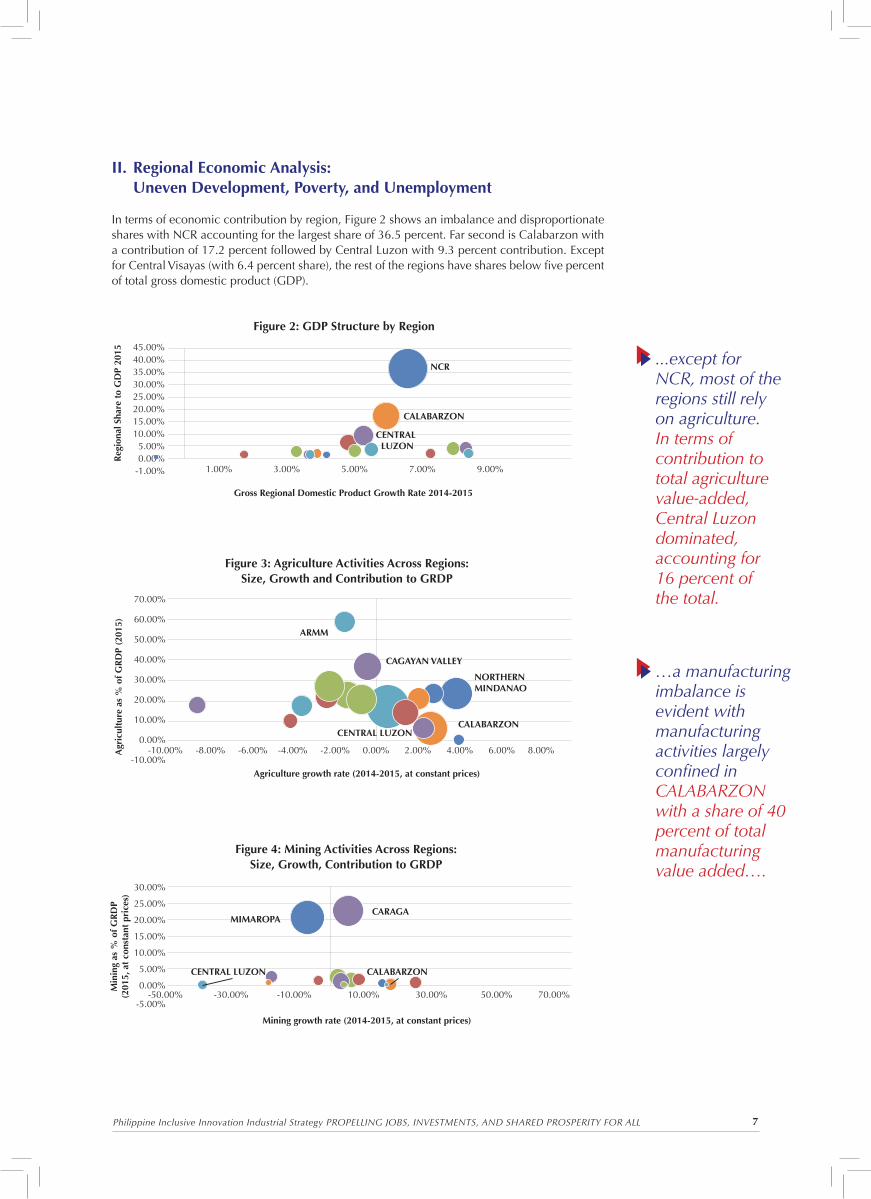
In terms of economic contribution by region, Figure 2 shows an imbalance and disproportionate shares with NCR accounting for the largest share of 36.5 percent. Far second is Calabarzon with a contribution of 17.2 percent followed by Central Luzon with 9.3 percent contribution. Except for Central Visayas (with 6.4 percent share), the rest of the regions have shares below five percent of total gross domestic product (GDP).
...except for NCR, most of the regions still rely on agriculture. In terms of contribution to total agriculture value-added, Central Luzon dominated, accounting for 16 percent of the total.
…a manufacturing imbalance is evident with manufacturing activities largely confined in CALABARZON with a share of 40 percent of total manufacturing value added….
45.00%40.00%35.00%30.00%25.00%20.00%15.00%10.00%5.00%0.00%
-1.00% 1.00% 3.00% 5.00% 7.00% 9.00%
Reg
iona
l Sha
re t
o G
DP
2015
Gross Regional Domestic Product Growth Rate 2014-2015
NCR
CALABARZON
CENTRAL LUZON
Figure 2: GDP Structure by Region
-10.00% -8.00% -6.00% -4.00% -2.00% 0.00% 2.00% 4.00% 6.00% 8.00%
CAGAYAN VALLEY
CENTRAL LUZON
ARMM
NORTHERNMINDANAO
CALABARZON
Agriculture growth rate (2014-2015, at constant prices)
Agr
icul
ture
as
% o
f GR
DP
(201
5)
70.00%
60.00%
50.00%
40.00%
30.00%
20.00%
10.00%
0.00%
-10.00%
Figure 3: Agriculture Activities Across Regions: Size, Growth and Contribution to GRDP
8Philippine Inclusive Innovation Industrial Strategy PROPELLING JOBS, INVESTMENTS, AND SHARED PROSPERITY FOR ALL
Figure 3 shows that except for NCR, most of the regions still rely on agriculture. In terms of contribution to total agriculture value added, Central Luzon dominated accounting for 16 percent of the total. Northern Mindanao follows with a share of 9.6 percent, CALABARZON 9.3 percent, Western Visayas 8.2 percent, and Cagayan Valley 7.9 percent.
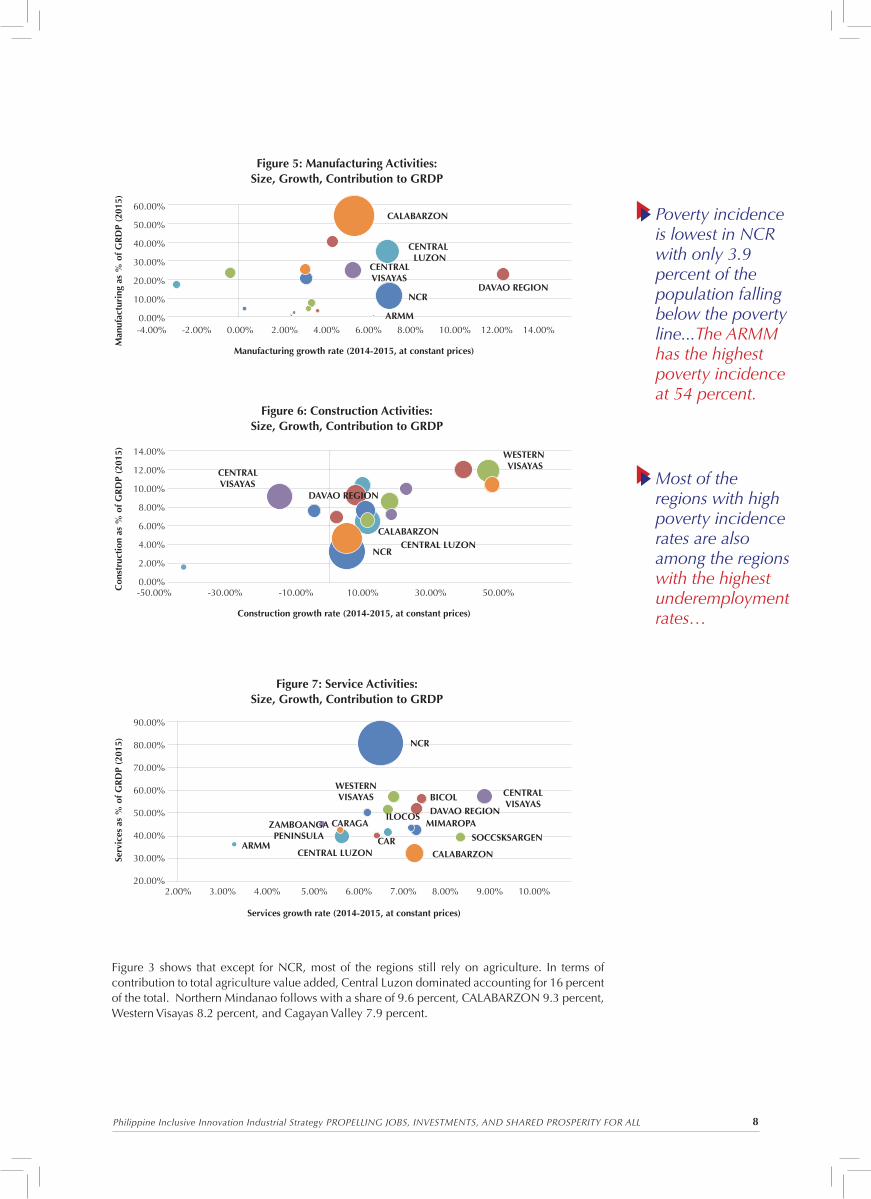
Poverty incidence is lowest in NCR with only 3.9 percent of the population falling below the poverty line...The ARMM has the highest poverty incidence at 54 percent.
Most of the regions with high poverty incidence rates are also among the regions with the highest underemployment rates…
-4.00% -2.00% 0.00% 2.00% 4.00% 6.00% 8.00% 10.00% 12.00% 14.00%
CALABARZON
CENTRAL LUZON
NCR
ARMM
DAVAO REGION
CENTRAL VISAYAS
Manufacturing growth rate (2014-2015, at constant prices)
Man
ufac
turi
ng a
s %
of G
RD
P (2
015)
60.00%
50.00%
40.00%
30.00%
20.00%
10.00%
0.00%
Figure 5: Manufacturing Activities: Size, Growth, Contribution to GRDP
-50.00% -30.00% -10.00% 10.00% 30.00% 50.00%
WESTERN VISAYAS
CALABARZONCENTRAL LUZON
NCR
Construction growth rate (2014-2015, at constant prices)
Con
stru
ctio
n as
% o
f GR
DP
(201
5) 14.00%
12.00%
10.00%
8.00%
6.00%
4.00%
2.00%
0.00%
Figure 6: Construction Activities: Size, Growth, Contribution to GRDP
DAVAO REGION
CENTRAL VISAYAS
2.00% 3.00% 4.00% 5.00% 6.00% 7.00% 8.00% 9.00% 10.00%
Services growth rate (2014-2015, at constant prices)
Serv
ices
as
% o
f GR
DP
(201
5)
90.00%
80.00%
70.00%
60.00%
50.00%
40.00%
30.00%
20.00%
Figure 7: Service Activities: Size, Growth, Contribution to GRDP
CALABARZONCENTRAL LUZONARMM
NCR
BICOLDAVAO REGION
SOCCSKSARGEN
MIMAROPAILOCOS
CARAGA
CAR
WESTERNVISAYAS CENTRAL
VISAYAS
ZAMBOANGAPENINSULA
9Philippine Inclusive Innovation Industrial Strategy PROPELLING JOBS, INVESTMENTS, AND SHARED PROSPERITY FOR ALL
In terms of mining activities, Figure 4 shows that mining is concentrated in two regions MIMAROPA and CARAGA which together accounted for 58 percent of total mining value added. In Figure 5, a manufacturing imbalance is evident with manufacturing activities largely confined in CALABARZON with a share of 40 percent of total manufacturing value added, NCR 20 percent, and Central Luzon 14 percent. Central Visayas follows with a share of 7 percent and Davao region with a share of 4 percent. In most regions, construction has been growing and contributing to economic activities (see Figure 6). NCR dominated and accounted for the biggest share of 20 percent. This is followed by CALABARZON 14 percent, Central Luzon and Central Visayas both posted 10 percent each, and Western Visayas 8 percent. A huge imbalance is also witnessed in services with activities concentrated in highly urbanized NCR which accounted for 52 percent of total services value added (see Figure 7). CALABARZON follows with a share of 9.8 percent, Central Luzon 6.5 percent, and Central Visayas 6.4 percent.
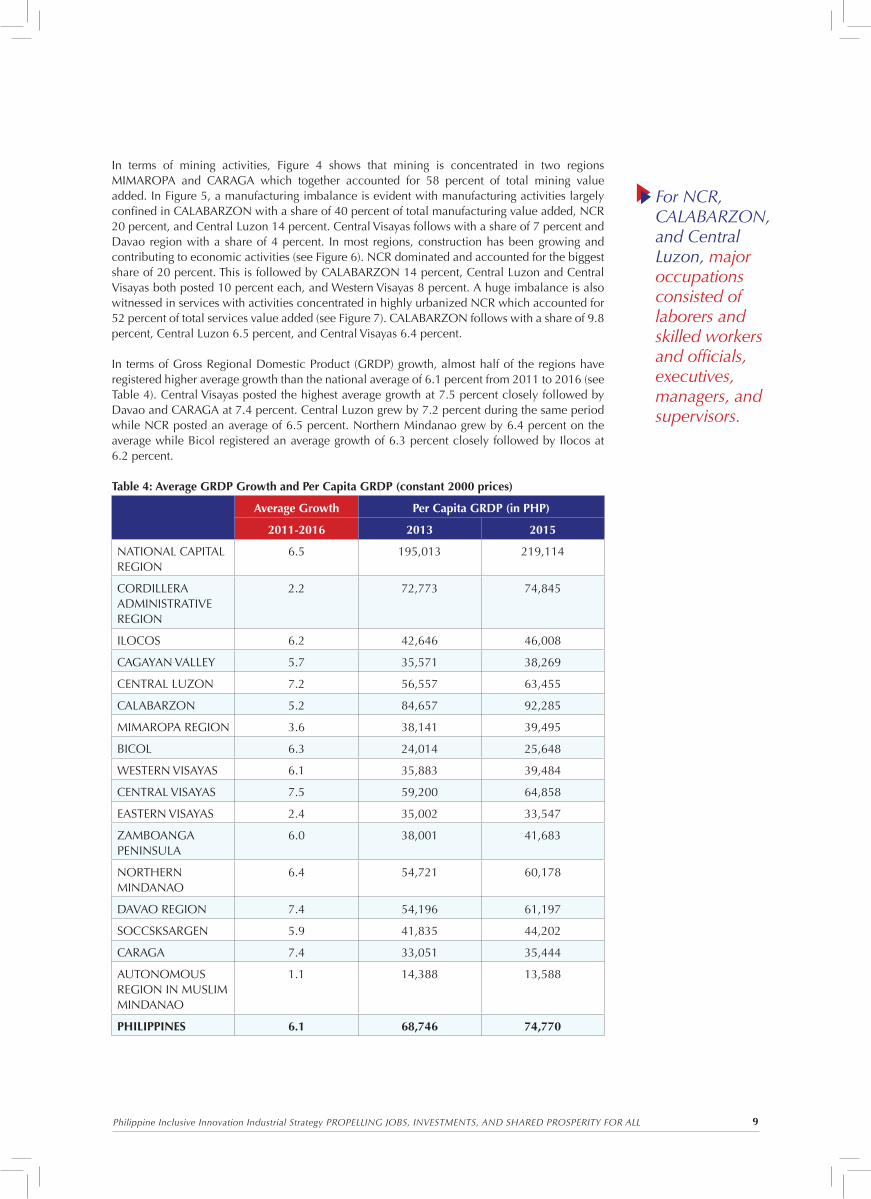
In terms of Gross Regional Domestic Product (GRDP) growth, almost half of the regions have registered higher average growth than the national average of 6.1 percent from 2011 to 2016 (see Table 4). Central Visayas posted the highest average growth at 7.5 percent closely followed by Davao and CARAGA at 7.4 percent. Central Luzon grew by 7.2 percent during the same period while NCR posted an average of 6.5 percent. Northern Mindanao grew by 6.4 percent on the average while Bicol registered an average growth of 6.3 percent closely followed by Ilocos at 6.2 percent.
Table 4: Average GRDP Growth and Per Capita GRDP (constant 2000 prices)
Average Growth Per Capita GRDP (in PHP)
2011-2016 2013 2015
NATIONAL CAPITAL REGION
6.5 195,013 219,114
CORDILLERA ADMINISTRATIVE REGION
2.2 72,773 74,845
ILOCOS 6.2 42,646 46,008
CAGAYAN VALLEY 5.7 35,571 38,269
CENTRAL LUZON 7.2 56,557 63,455
CALABARZON 5.2 84,657 92,285
MIMAROPA REGION 3.6 38,141 39,495
BICOL 6.3 24,014 25,648
WESTERN VISAYAS 6.1 35,883 39,484
CENTRAL VISAYAS 7.5 59,200 64,858
EASTERN VISAYAS 2.4 35,002 33,547
ZAMBOANGA PENINSULA
6.0 38,001 41,683
NORTHERN MINDANAO
6.4 54,721 60,178
DAVAO REGION 7.4 54,196 61,197
SOCCSKSARGEN 5.9 41,835 44,202
CARAGA 7.4 33,051 35,444
AUTONOMOUS REGION IN MUSLIM MINDANAO
1.1 14,388 13,588
PHILIPPINES 6.1 68,746 74,770
For NCR, CALABARZON, and Central Luzon, major occupations consisted of laborers and skilled workers and officials, executives, managers, and supervisors.
10Philippine Inclusive Innovation Industrial Strategy PROPELLING JOBS, INVESTMENTS, AND SHARED PROSPERITY FOR ALL
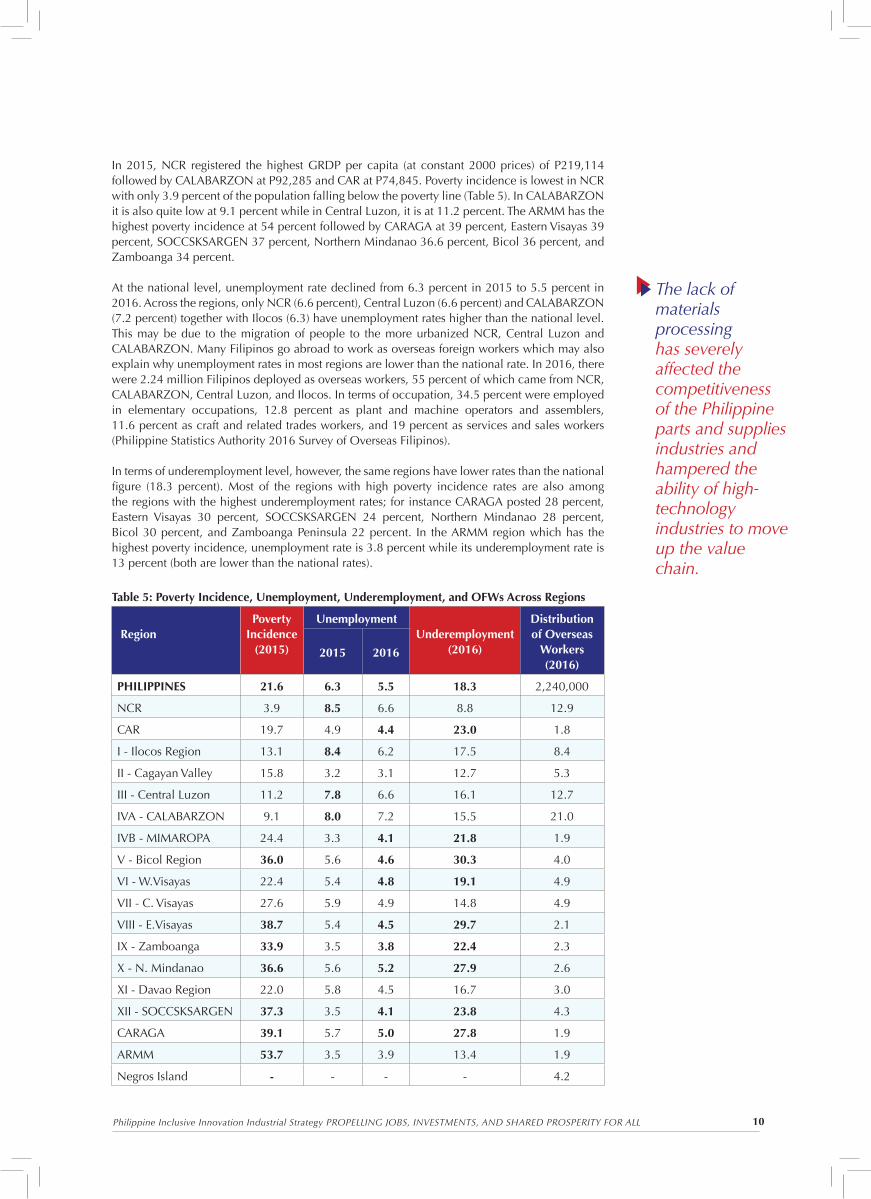
In 2015, NCR registered the highest GRDP per capita (at constant 2000 prices) of P219,114 followed by CALABARZON at P92,285 and CAR at P74,845. Poverty incidence is lowest in NCR with only 3.9 percent of the population falling below the poverty line (Table 5). In CALABARZON it is also quite low at 9.1 percent while in Central Luzon, it is at 11.2 percent. The ARMM has the highest poverty incidence at 54 percent followed by CARAGA at 39 percent, Eastern Visayas 39 percent, SOCCSKSARGEN 37 percent, Northern Mindanao 36.6 percent, Bicol 36 percent, and Zamboanga 34 percent.
At the national level, unemployment rate declined from 6.3 percent in 2015 to 5.5 percent in 2016. Across the regions, only NCR (6.6 percent), Central Luzon (6.6 percent) and CALABARZON (7.2 percent) together with Ilocos (6.3) have unemployment rates higher than the national level. This may be due to the migration of people to the more urbanized NCR, Central Luzon and CALABARZON. Many Filipinos go abroad to work as overseas foreign workers which may also explain why unemployment rates in most regions are lower than the national rate. In 2016, there were 2.24 million Filipinos deployed as overseas workers, 55 percent of which came from NCR, CALABARZON, Central Luzon, and Ilocos. In terms of occupation, 34.5 percent were employed in elementary occupations, 12.8 percent as plant and machine operators and assemblers, 11.6 percent as craft and related trades workers, and 19 percent as services and sales workers (Philippine Statistics Authority 2016 Survey of Overseas Filipinos).
In terms of underemployment level, however, the same regions have lower rates than the national figure (18.3 percent). Most of the regions with high poverty incidence rates are also among the regions with the highest underemployment rates; for instance CARAGA posted 28 percent, Eastern Visayas 30 percent, SOCCSKSARGEN 24 percent, Northern Mindanao 28 percent, Bicol 30 percent, and Zamboanga Peninsula 22 percent. In the ARMM region which has the highest poverty incidence, unemployment rate is 3.8 percent while its underemployment rate is 13 percent (both are lower than the national rates).
Table 5: Poverty Incidence, Unemployment, Underemployment, and OFWs Across Regions
RegionPoverty
Incidence (2015)
UnemploymentUnderemployment
(2016)
Distribution of Overseas
Workers(2016)
2015 2016
PHILIPPINES 21.6 6.3 5.5 18.3 2,240,000
NCR 3.9 8.5 6.6 8.8 12.9
CAR 19.7 4.9 4.4 23.0 1.8
I - Ilocos Region 13.1 8.4 6.2 17.5 8.4
II - Cagayan Valley 15.8 3.2 3.1 12.7 5.3
III - Central Luzon 11.2 7.8 6.6 16.1 12.7
IVA - CALABARZON 9.1 8.0 7.2 15.5 21.0
IVB - MIMAROPA 24.4 3.3 4.1 21.8 1.9
V - Bicol Region 36.0 5.6 4.6 30.3 4.0
VI - W.Visayas 22.4 5.4 4.8 19.1 4.9
VII - C. Visayas 27.6 5.9 4.9 14.8 4.9
VIII - E.Visayas 38.7 5.4 4.5 29.7 2.1
IX - Zamboanga 33.9 3.5 3.8 22.4 2.3
X - N. Mindanao 36.6 5.6 5.2 27.9 2.6
XI - Davao Region 22.0 5.8 4.5 16.7 3.0
XII - SOCCSKSARGEN 37.3 3.5 4.1 23.8 4.3
CARAGA 39.1 5.7 5.0 27.8 1.9
ARMM 53.7 3.5 3.9 13.4 1.9
Negros Island - - - - 4.2
The lack of materials processing has severely affected the competitiveness of the Philippine parts and supplies industries and hampered the ability of high-technology industries to move up the value chain.
11Philippine Inclusive Innovation Industrial Strategy PROPELLING JOBS, INVESTMENTS, AND SHARED PROSPERITY FOR ALL
Table 6: Major Occupations by Region
Occupation Group A B C D E F G H I JTotal in
‘000
Total occupationsIn ‘000
6,276 1,976 1,046 2,479 4,920 4,998 2,596 2,092 12,242 116 38,741
Philippines 16.2 5.1 2.7 6.4 12.7 12.9 6.7 5.4 31.6 0.3 38,741
NCR 18.9 8.0 4.7 13.5 15.3 0.3 8.9 8.3 21.9 0.3 4,752
CAR 12.7 5.7 2.9 4.5 8.6 21.6 5.0 2.9 35.6 0.5 759
I - Ilocos Region 13.9 4.4 1.9 4.4 14.2 15.0 5.9 4.0 36.1 0.1 2,014
II - Cagayan Valley 10.2 4.1 1.4 3.4 8.4 18.7 4.5 2.6 46.5 0.3 1,512
III - Central Luzon 21.7 5.3 3.0 7.6 15.3 3.5 8.6 6.0 28.8 0.2 4,126
IVA - CALABARZON
18.7 6.2 3.5 7.9 14.1 6.1 8.2 11.0 24.1 0.3 5,085
IVB - MIMAROPA 13.5 4.1 2.1 3.8 10.7 22.5 5.3 2.3 35.4 0.3 1,296
V - Bicol Region 14.1 4.0 1.9 3.8 12.9 18.3 5.8 3.1 35.7 0.2 2,373
VI – W.Visayas 15.0 4.6 2.2 5.5 11.6 14.6 5.2 3.6 37.3 0.2 3,195
VII – C. Visayas 13.7 4.6 2.6 7.1 13.6 15.4 9.9 5.1 27.8 0.1 3,215
VIII – E.Visayas 13.4 4.3 1.8 3.2 10.3 22.7 4.7 2.0 37.5 0.1 1,011
IX – Zamboanga 14.2 5.2 1.7 3.3 10.4 20.5 5.1 2.8 36.0 0.6 1,384
X – N. Mindanao 15.4 4.2 2.1 4.5 13.1 15.5 5.1 3.4 36.5 0.3 1,989
XI - Davao Region 15.3 4.4 2.1 6.2 12.9 13.5 5.7 4.5 35.1 0.4 1,925
XII - SOCCSKSARGEN
15.9 4.0 1.9 3.8 10.3 18.5 4.2 3.3 37.4 0.7 1,756
CARAGA 20.8 4.9 2.1 4.3 12.0 12.6 5.4 4.1 33.3 0.5 1,092
ARMM 11.7 2.6 0.9 1.3 4.0 43.8 1.6 3.7 30.2 0.3 1,259
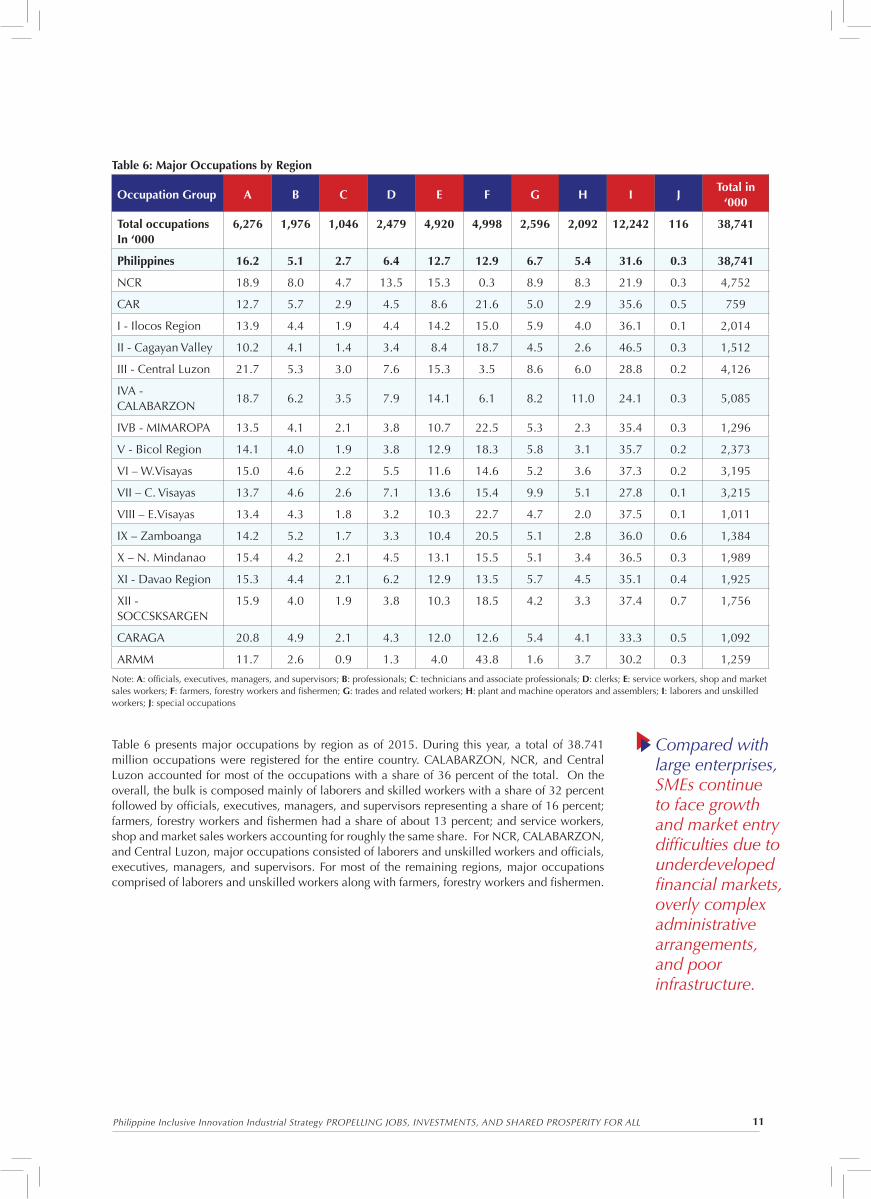
Note: A: officials, executives, managers, and supervisors; B: professionals; C: technicians and associate professionals; D: clerks; E: service workers, shop and market sales workers; F: farmers, forestry workers and fishermen; G: trades and related workers; H: plant and machine operators and assemblers; I: laborers and unskilled workers; J: special occupations
Table 6 presents major occupations by region as of 2015. During this year, a total of 38.741 million occupations were registered for the entire country. CALABARZON, NCR, and Central Luzon accounted for most of the occupations with a share of 36 percent of the total. On the overall, the bulk is composed mainly of laborers and skilled workers with a share of 32 percent followed by officials, executives, managers, and supervisors representing a share of 16 percent; farmers, forestry workers and fishermen had a share of about 13 percent; and service workers, shop and market sales workers accounting for roughly the same share. For NCR, CALABARZON, and Central Luzon, major occupations consisted of laborers and unskilled workers and officials, executives, managers, and supervisors. For most of the remaining regions, major occupations comprised of laborers and unskilled workers along with farmers, forestry workers and fishermen.
Compared with large enterprises, SMEs continue to face growth and market entry difficulties due to underdeveloped financial markets, overly complex administrative arrangements, and poor infrastructure.
12Philippine Inclusive Innovation Industrial Strategy PROPELLING JOBS, INVESTMENTS, AND SHARED PROSPERITY FOR ALL
III. Most Binding Constraints to Growth: What is preventing us from taking advantage of the potential opportunities
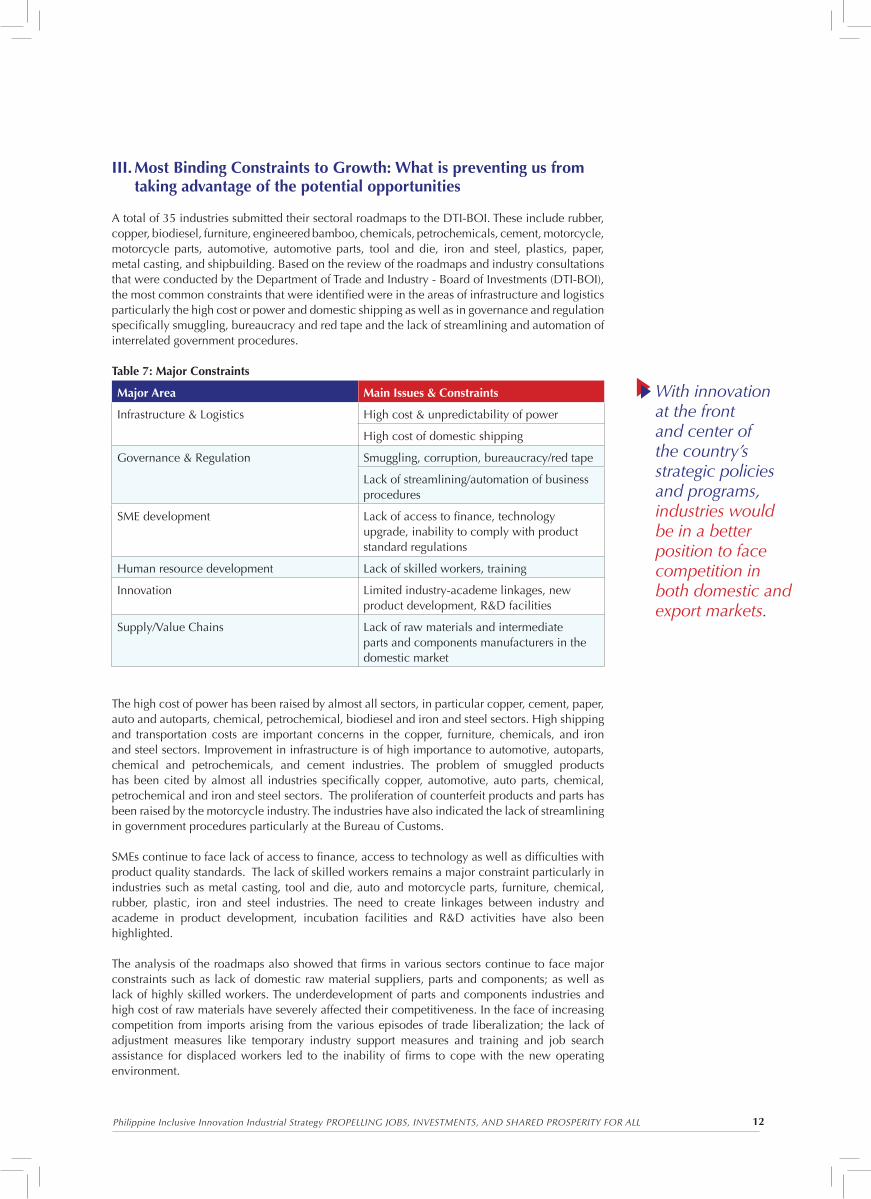
A total of 35 industries submitted their sectoral roadmaps to the DTI-BOI. These include rubber, copper, biodiesel, furniture, engineered bamboo, chemicals, petrochemicals, cement, motorcycle, motorcycle parts, automotive, automotive parts, tool and die, iron and steel, plastics, paper, metal casting, and shipbuilding. Based on the review of the roadmaps and industry consultations that were conducted by the Department of Trade and Industry - Board of Investments (DTI-BOI), the most common constraints that were identified were in the areas of infrastructure and logistics particularly the high cost or power and domestic shipping as well as in governance and regulation specifically smuggling, bureaucracy and red tape and the lack of streamlining and automation of interrelated government procedures.
Table 7: Major Constraints
Major Area Main Issues & Constraints
Infrastructure & Logistics High cost & unpredictability of power
High cost of domestic shipping
Governance & Regulation Smuggling, corruption, bureaucracy/red tape
Lack of streamlining/automation of business procedures
SME development Lack of access to finance, technology upgrade, inability to comply with product standard regulations
Human resource development Lack of skilled workers, training
Innovation Limited industry-academe linkages, new product development, R&D facilities
Supply/Value Chains Lack of raw materials and intermediate parts and components manufacturers in the domestic market
The high cost of power has been raised by almost all sectors, in particular copper, cement, paper, auto and autoparts, chemical, petrochemical, biodiesel and iron and steel sectors. High shipping and transportation costs are important concerns in the copper, furniture, chemicals, and iron and steel sectors. Improvement in infrastructure is of high importance to automotive, autoparts, chemical and petrochemicals, and cement industries. The problem of smuggled products has been cited by almost all industries specifically copper, automotive, auto parts, chemical, petrochemical and iron and steel sectors. The proliferation of counterfeit products and parts has been raised by the motorcycle industry. The industries have also indicated the lack of streamlining in government procedures particularly at the Bureau of Customs.
SMEs continue to face lack of access to finance, access to technology as well as difficulties with product quality standards. The lack of skilled workers remains a major constraint particularly in industries such as metal casting, tool and die, auto and motorcycle parts, furniture, chemical, rubber, plastic, iron and steel industries. The need to create linkages between industry and academe in product development, incubation facilities and R&D activities have also been highlighted.
The analysis of the roadmaps also showed that firms in various sectors continue to face major constraints such as lack of domestic raw material suppliers, parts and components; as well as lack of highly skilled workers. The underdevelopment of parts and components industries and high cost of raw materials have severely affected their competitiveness. In the face of increasing competition from imports arising from the various episodes of trade liberalization; the lack of adjustment measures like temporary industry support measures and training and job search assistance for displaced workers led to the inability of firms to cope with the new operating environment.
With innovation at the front and center of the country’s strategic policies and programs, industries would be in a better position to face competition in both domestic and export markets.
13Philippine Inclusive Innovation Industrial Strategy PROPELLING JOBS, INVESTMENTS, AND SHARED PROSPERITY FOR ALL
Broken linkages in the supply/value chain characterize many of our industries. The lack of materials processing has severely affected the competitiveness of the Philippine parts and supplies industries and hampered the ability of high-technology industries to move up the value chain. Due to weak backward linkages within the manufacturing industry, automotive and electronics have continued to rely on imported parts and remained at the assembly stage of the supply chain.
It is also important to note that the linkages of small and medium enterprises with large domestic and multinational corporations have remained weak; hence growth experienced by large enterprises has failed to spillover to the SME sector. Compared with large enterprises, SMEs continue to face growth and market entry difficulties due to underdeveloped financial markets, overly complex administrative arrangements, and poor infrastructure. With their subdued performance, SMEs have not generated sufficient manufacturing value added and employment to increase market contestability and improve the country’s industrial structure.
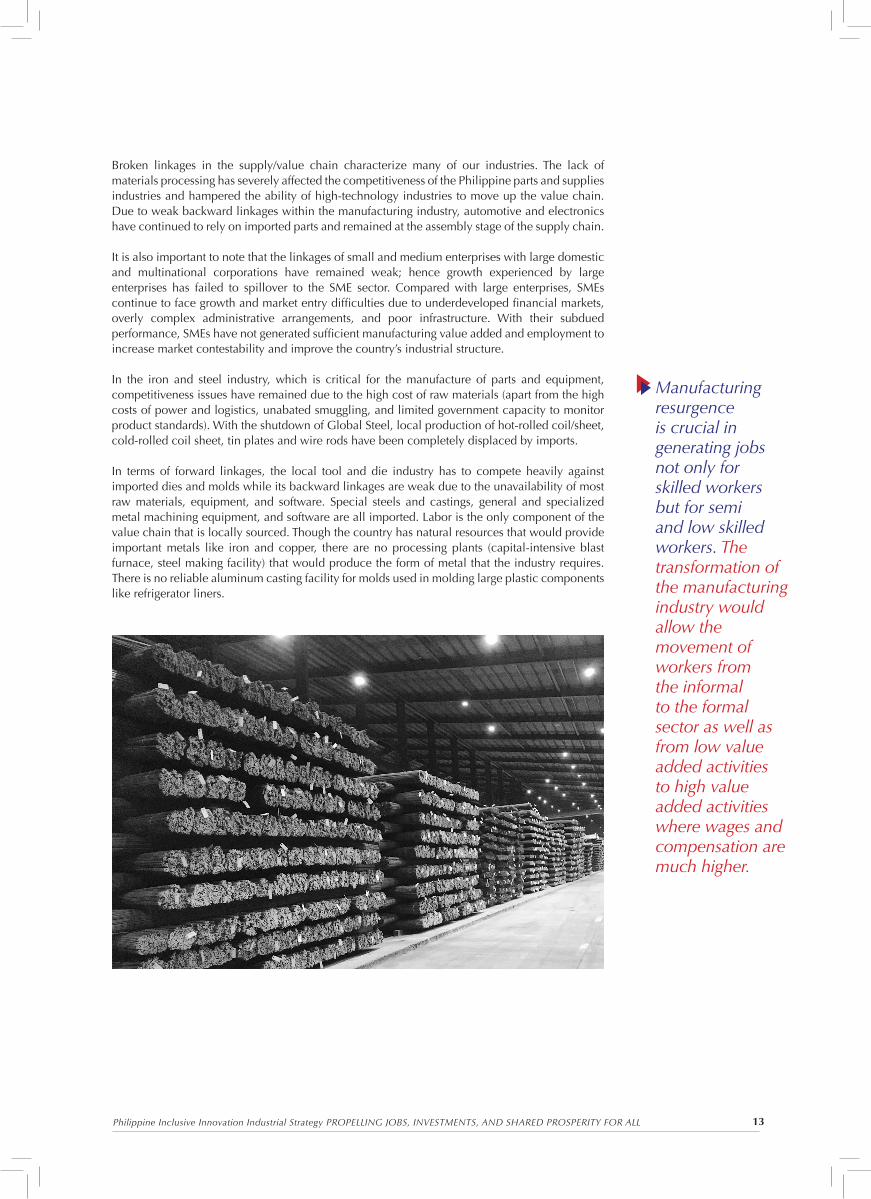
In the iron and steel industry, which is critical for the manufacture of parts and equipment, competitiveness issues have remained due to the high cost of raw materials (apart from the high costs of power and logistics, unabated smuggling, and limited government capacity to monitor product standards). With the shutdown of Global Steel, local production of hot-rolled coil/sheet, cold-rolled coil sheet, tin plates and wire rods have been completely displaced by imports.
In terms of forward linkages, the local tool and die industry has to compete heavily against imported dies and molds while its backward linkages are weak due to the unavailability of most raw materials, equipment, and software. Special steels and castings, general and specialized metal machining equipment, and software are all imported. Labor is the only component of the value chain that is locally sourced. Though the country has natural resources that would provide important metals like iron and copper, there are no processing plants (capital-intensive blast furnace, steel making facility) that would produce the form of metal that the industry requires. There is no reliable aluminum casting facility for molds used in molding large plastic components like refrigerator liners.
Manufacturing resurgence is crucial in generating jobs not only for skilled workers but for semi and low skilled workers. The transformation of the manufacturing industry would allow the movement of workers from the informal to the formal sector as well as from low value added activities to high value added activities where wages and compensation are much higher.
14Philippine Inclusive Innovation Industrial Strategy PROPELLING JOBS, INVESTMENTS, AND SHARED PROSPERITY FOR ALL
In the export-oriented copper industry, firms have hardly any linkage with the domestic economy. Copper ores are all exported and although the country has a copper smelting facility, it imports 100 percent of its copper ore requirements and exports 100 percent of its output due to the absence of a copper rod facility. Manufacturers of wiring harness, a major export product and user of copper rods, import all of their copper rod requirements.
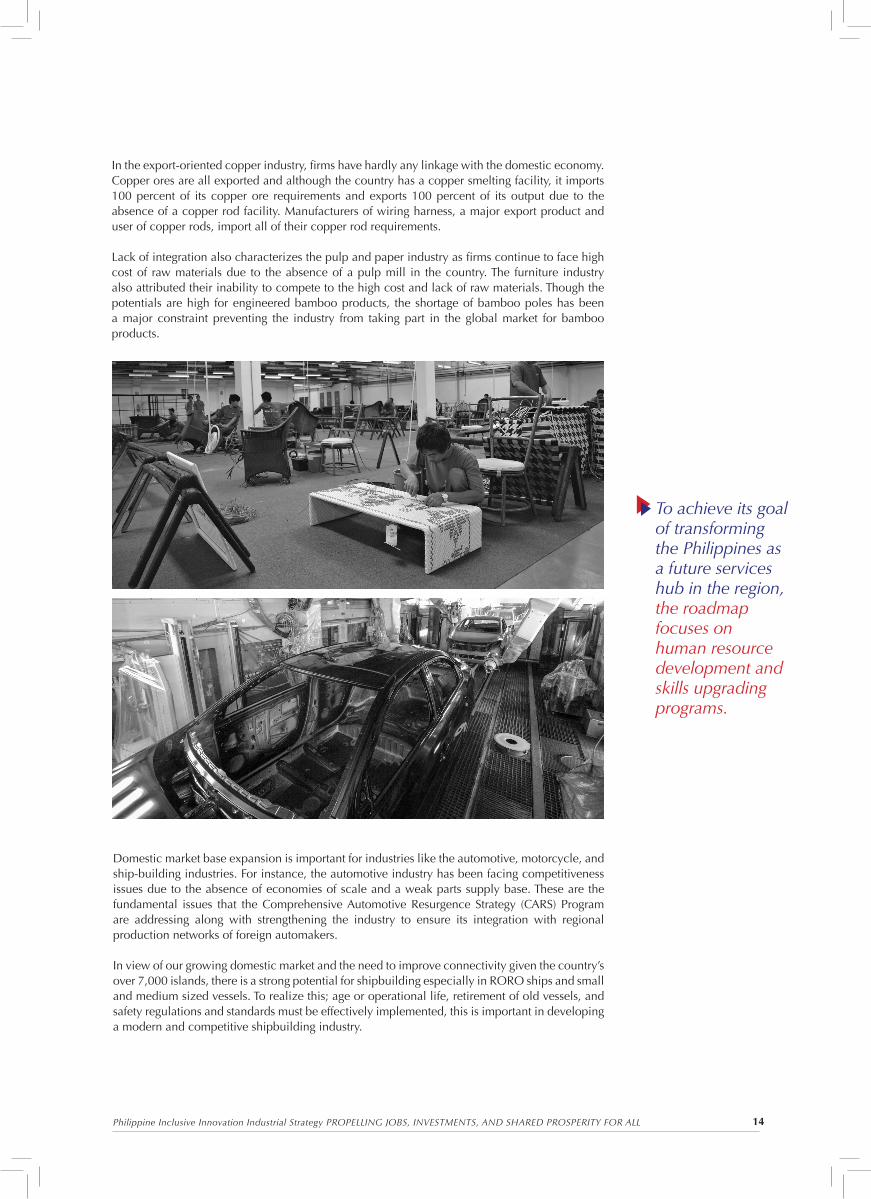
Lack of integration also characterizes the pulp and paper industry as firms continue to face high cost of raw materials due to the absence of a pulp mill in the country. The furniture industry also attributed their inability to compete to the high cost and lack of raw materials. Though the potentials are high for engineered bamboo products, the shortage of bamboo poles has been a major constraint preventing the industry from taking part in the global market for bamboo products.
Domestic market base expansion is important for industries like the automotive, motorcycle, and ship-building industries. For instance, the automotive industry has been facing competitiveness issues due to the absence of economies of scale and a weak parts supply base. These are the fundamental issues that the Comprehensive Automotive Resurgence Strategy (CARS) Program are addressing along with strengthening the industry to ensure its integration with regional production networks of foreign automakers.
In view of our growing domestic market and the need to improve connectivity given the country’s over 7,000 islands, there is a strong potential for shipbuilding especially in RORO ships and small and medium sized vessels. To realize this; age or operational life, retirement of old vessels, and safety regulations and standards must be effectively implemented, this is important in developing a modern and competitive shipbuilding industry.
To achieve its goal of transforming the Philippines as a future services hub in the region, the roadmap focuses on human resource development and skills upgrading programs.
15Philippine Inclusive Innovation Industrial Strategy PROPELLING JOBS, INVESTMENTS, AND SHARED PROSPERITY FOR ALL
IV. Inclusive Innovation Industrial Strategy (i3S)
It is in the context of reviving manufacturing and linking it with agriculture and services in order to create more and better jobs and attain inclusive and sustainable growth that the DTI - BOI has formulated a new industrial policy known as Inclusive Innovation Industrial Strategy (or i3S). i3S aims at growing innovative and globally competitive manufacturing, agriculture, and services while strengthening their linkages into domestic and global value chains.
Underpinning this strategy is the competition-innovation-productivity relationship where a highly liberalized market environment (due to trade liberalization) leads to more competition. With the removal of trade and investment barriers, opportunities such as bigger export markets and increased foreign direct investment flows can arise but at the same time, the entry of competing imports or more competitive global players in the domestic market would increase competition which might pose risks to the survival of relatively smaller, less competitive and what used to be highly protected firms in the domestic economy. In a highly competitive market environment, inefficient firms are likely to exit while firms that engage in innovative activities at a faster pace have a higher probability to survive and increase their productivity. Through innovation, firms can face competition leading to productivity increases and higher economic growth.
With innovation at the front and center of the country’s strategic policies and programs, industries would be in a better position to face competition in both domestic and export markets. With accompanying measures to improve capacity to penetrate export markets, industries could take advantage of increasing returns to scale and market access opportunities especially those arising from free trade agreements and increasing regional integration in the ASEAN Economic Community. Innovation is crucial in addressing the challenges from automation, robotics, artificial intelligence and other new technologies.
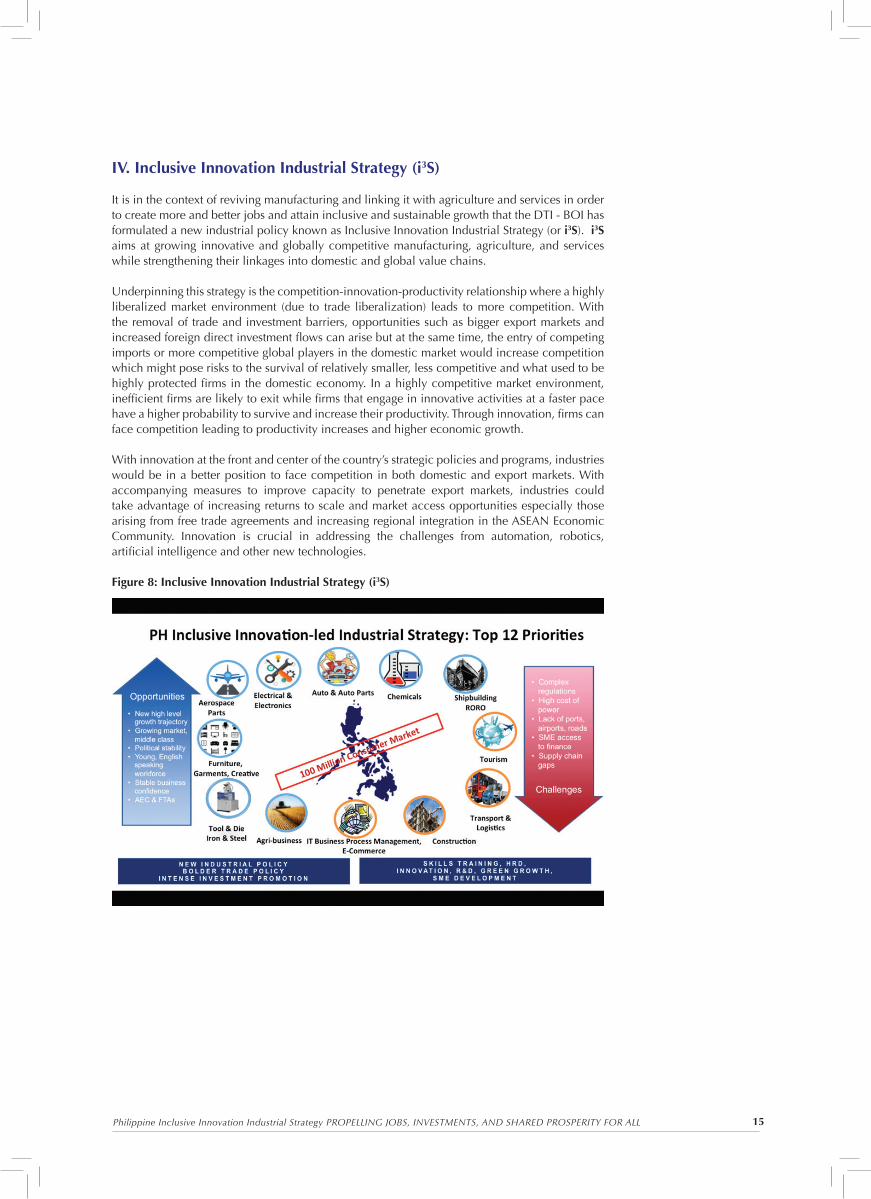
Figure 8: Inclusive Innovation Industrial Strategy (i3S)
16Philippine Inclusive Innovation Industrial Strategy PROPELLING JOBS, INVESTMENTS, AND SHARED PROSPERITY FOR ALL
The i3S sees DTI and BOI as facilitator and coordinator to address the most binding constraints that prevent the entry of new firms or hinder the latter’s integration into the global value chains of multinationals. It coordinates closely with other government agencies to address the biggest obstacles to the entry and growth of domestic firms. It is important for the government to create the right policy framework to encourage the development of the private sector along the lines of the country’s comparative advantage. These will entail programs and policies to address the high cost of power, high cost of domestic shipping and logistics, inadequate infrastructure, and complex government rules and regulations affecting business operations. Equally important are strategies including human resource development and skills training programs, micro, small, and medium enterprise (MSME) development, innovation, green growth, as well as investment promotion especially foreign direct investment that would bring in new technologies.
Manufacturing resurgence is crucial in generating jobs not only for skilled workers but for semi and low skilled workers. The transformation of the manufacturing industry would allow the movement of workers from the informal to the formal sector as well as from low value added activities to high value added activities where wages and compensation are much higher.
The following sub-sectors are the top priorities for industry development with focus not only on manufacturing but on linking together activities particularly through the servicification of manufacturing, which connects services activities like design, R&D, engineering, and after-sales with manufacturing:
• Auto and auto parts: auto electronics, CARS Program, Public Utility Vehicle Modernization
• Electronic manufacturing services: auto electronics, medical devices, telecommunications equipment, power storage, civil aviation/aerospace); Semiconductor manufacturing service: integrated circuit (IC) design
• Aerospace parts and Aircraft Maintenance, Repair, & Overhaul
• Chemicals: petrochemicals, acyclic alcohols & derivatives, metallic salts & peroxy salts of inorganic acids, cyclic hydrocarbons, oleo chemicals
• Shipbuilding & Ship-repair: roll-on roll-off (RORO) as well as small- and medium-sized vessels
• Furniture, garments, creative industries manufacturing and design
• Iron and Steel, tool and die
• Agribusiness: rubber, coconut, mangoes, coffee, banana, and other high value crops
• Construction: roads, railways, bridges, ports, airports, & low-cost housing
• IT-BPM and E-Commerce: higher earning more complex non-voice services BPO, Knowledge Process Outsourcing in medical, financial, and legal services; game development; engineering services outsourcing (ESO), software development, shared services
• Transport and Logistics: land, air, & water transport, warehousing, support facilities for transport
• Tourism
The CARS Program aims to jumpstart auto manufacturing, stimulate investments in parts manufacturing, generate quality jobs, create a competitive industry and become a regional hub in the very near future. The program focuses on developing parts manufacturing particularly large body shell and plastic assemblies, common parts, strategic parts that are not yet manufactured in the country, and shared facilities. Through a temporary fiscal support, the program attempts to close the competitiveness gap and kick start car development in the country. The implementation of the CARS Program signals government’s vigorous support and focus on industry development.
Priorities in agribusiness include rubber, coconut, mangoes, coffee, banana, and other high value crops. The agribusiness roadmap focuses on strengthening production and agro-processing sectors and addressing binding constraints such as supply and value chain gaps, access to technologies and finance, weak regulatory and certification system, lack of infrastructure, and R&D.
Close coordination among government agencies and effective policy implementation are the most crucial factors for industry development.
17Philippine Inclusive Innovation Industrial Strategy PROPELLING JOBS, INVESTMENTS, AND SHARED PROSPERITY FOR ALL
Apart from the IT-BPM sector which has remained a major strength of the country, i3S focuses on the development of labor intensive sectors like tourism, construction, ship repair, maintenance, repair, overhaul of aircraft and logistics and infrastructure investments, along with services activities embedded in manufacturing like design, R&D, engineering. To achieve its goal of transforming the Philippines as a future services hub in the region, the roadmap focuses on human resource development and skills upgrading programs.
Tourism and agribusiness are important job generators in the regions. Improving agriculture productivity is crucial in order to transform regional economies from traditional agriculture to more modern agribusiness. Huge investments in infrastructure and logistics would boost the competitiveness of industries and improve connectivity within the country.
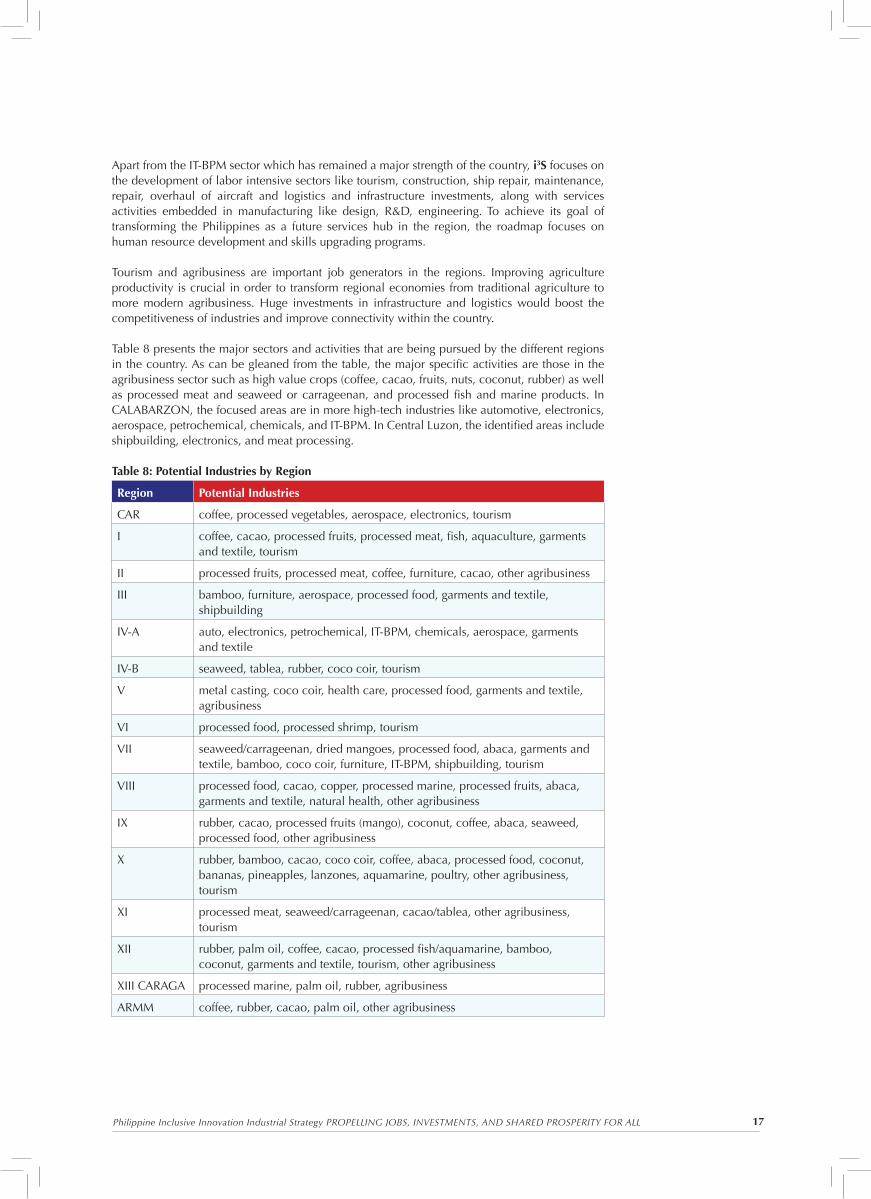
Table 8 presents the major sectors and activities that are being pursued by the different regions in the country. As can be gleaned from the table, the major specific activities are those in the agribusiness sector such as high value crops (coffee, cacao, fruits, nuts, coconut, rubber) as well as processed meat and seaweed or carrageenan, and processed fish and marine products. In CALABARZON, the focused areas are in more high-tech industries like automotive, electronics, aerospace, petrochemical, chemicals, and IT-BPM. In Central Luzon, the identified areas include shipbuilding, electronics, and meat processing.
Table 8: Potential Industries by Region
Region Potential Industries
CAR coffee, processed vegetables, aerospace, electronics, tourism
I coffee, cacao, processed fruits, processed meat, fish, aquaculture, garments and textile, tourism
II processed fruits, processed meat, coffee, furniture, cacao, other agribusiness
III bamboo, furniture, aerospace, processed food, garments and textile, shipbuilding
IV-A auto, electronics, petrochemical, IT-BPM, chemicals, aerospace, garments and textile
IV-B seaweed, tablea, rubber, coco coir, tourism
V metal casting, coco coir, health care, processed food, garments and textile, agribusiness
VI processed food, processed shrimp, tourism
VII seaweed/carrageenan, dried mangoes, processed food, abaca, garments and textile, bamboo, coco coir, furniture, IT-BPM, shipbuilding, tourism
VIII processed food, cacao, copper, processed marine, processed fruits, abaca, garments and textile, natural health, other agribusiness
IX rubber, cacao, processed fruits (mango), coconut, coffee, abaca, seaweed, processed food, other agribusiness
X rubber, bamboo, cacao, coco coir, coffee, abaca, processed food, coconut, bananas, pineapples, lanzones, aquamarine, poultry, other agribusiness, tourism
XI processed meat, seaweed/carrageenan, cacao/tablea, other agribusiness, tourism
XII rubber, palm oil, coffee, cacao, processed fish/aquamarine, bamboo, coconut, garments and textile, tourism, other agribusiness
XIII CARAGA processed marine, palm oil, rubber, agribusiness
ARMM coffee, rubber, cacao, palm oil, other agribusiness
18Philippine Inclusive Innovation Industrial Strategy PROPELLING JOBS, INVESTMENTS, AND SHARED PROSPERITY FOR ALL
While the private sector is seen as the major driver of growth, the government likewise plays an important role in terms of coordinating policies and necessary support measures that will address the obstacles to the entry and growth of domestic firms. Close coordination among government agencies and effective policy implementation are the most crucial factors for industry development. The i3S is based on five major pillars aimed at pursuing the following strategic actions in coordination with other government agencies, industry, and academe:
Building new industries, clusters, and agglomeration • Address gaps and linkages in industry supply and value chains
• Expand the domestic market base to allow industries to attain economies of scale and realize their export potential
• Pursue green policies in industries to make them more competitive, innovative, environment friendly, and climate smart
• Implement aggressive promotion and marketing programs to attract more foreign direct investments especially those that would bring in new technologies
• Address market failures by providing fiscal incentives that are well-targeted, performance-based, and time bound
• Create industry clusters to address agglomeration, economies of scale, and coordination issues
• Promote the establishment of domestic ecozones that would allow activities catering to both domestic and export markets
Capacity-building and human resource development• Design human resource development and training programs to improve skills and establish
tie ups with universities and training institutions
MSME growth and development• Support SME development by boosting their growth and profitability through the 7Ms:
mindset, mastery, mentoring, money, machine, market, and models and programs focusing on establishment of common service facilities, improving access to finance, technology, and skilled workers; linking MSMEs with large domestic enterprises and multinationals; promote inter-firm and academe collaboration; efficient storage and logistics (handling, cold storage)
Innovation and entrepreneurship• Establish an inclusive innovation and entrepreneurship ecosystem that would link together
academe, industry, and government, strengthen industry-academe collaboration focusing on market-oriented research, revise engineering curricula particularly manufacturing engineering and work related to industries, equip universities to carry out research relevant to industries, intellectual property protection, R&D incentives (tax credit, accelerated depreciation), shared facilities for rapid prototyping and demonstration
Ease of doing business and investment environment• Continue to strengthen our institutional and regulatory framework by addressing corruption
and smuggling and eliminate bureaucratic red tape by streamlining and automation of government procedures and regulations
• Establish a single mechanism for coordinating business registration, application for permits and licenses, and investment promotion with local government units and other national government agencies
• Continue the big bang infrastructure investment to cover not only the building of physical infrastructure like roads but also power and logistics as well as modern and efficient air and sea infrastructure
19Philippine Inclusive Innovation Industrial Strategy PROPELLING JOBS, INVESTMENTS, AND SHARED PROSPERITY FOR ALL
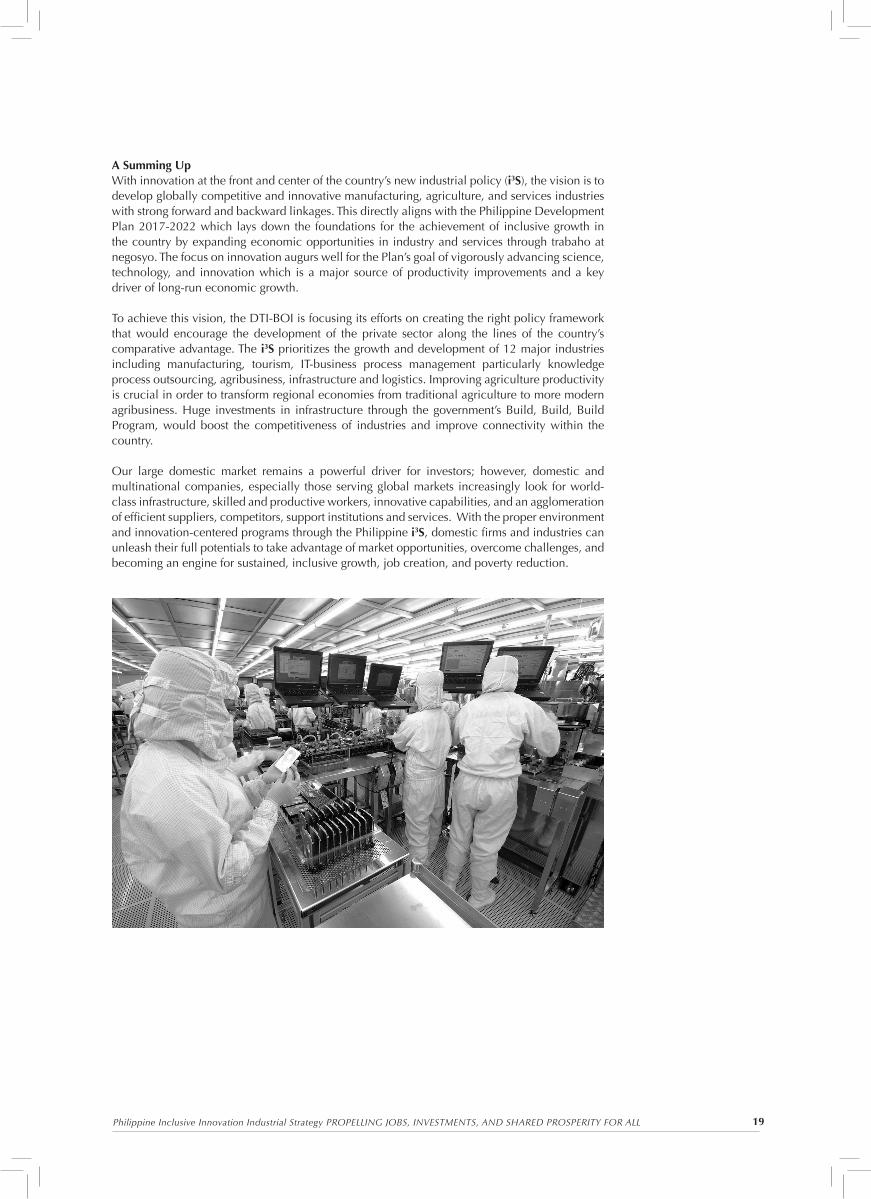
A Summing UpWith innovation at the front and center of the country’s new industrial policy (i3S), the vision is to develop globally competitive and innovative manufacturing, agriculture, and services industries with strong forward and backward linkages. This directly aligns with the Philippine Development Plan 2017-2022 which lays down the foundations for the achievement of inclusive growth in the country by expanding economic opportunities in industry and services through trabaho at negosyo. The focus on innovation augurs well for the Plan’s goal of vigorously advancing science, technology, and innovation which is a major source of productivity improvements and a key driver of long-run economic growth.
To achieve this vision, the DTI-BOI is focusing its efforts on creating the right policy framework that would encourage the development of the private sector along the lines of the country’s comparative advantage. The i3S prioritizes the growth and development of 12 major industries including manufacturing, tourism, IT-business process management particularly knowledge process outsourcing, agribusiness, infrastructure and logistics. Improving agriculture productivity is crucial in order to transform regional economies from traditional agriculture to more modern agribusiness. Huge investments in infrastructure through the government’s Build, Build, Build Program, would boost the competitiveness of industries and improve connectivity within the country.
Our large domestic market remains a powerful driver for investors; however, domestic and multinational companies, especially those serving global markets increasingly look for world-class infrastructure, skilled and productive workers, innovative capabilities, and an agglomeration of efficient suppliers, competitors, support institutions and services. With the proper environment and innovation-centered programs through the Philippine i3S, domestic firms and industries can unleash their full potentials to take advantage of market opportunities, overcome challenges, and becoming an engine for sustained, inclusive growth, job creation, and poverty reduction.
Series No. 2017-05
DEPARTMENT OF TRADE AND INDUSTRY
PolicyBriefs
This policy brief was prepared by Assistant Secretary Rafaelita M. Aldaba of the Department of Trade and Industry. This can be downloaded at www.industry.gov.ph.
The views and opinions expressed in this policy brief are of the author/s and do not necessarily reflect Philippine government policy.
The DTI Policy Briefs is published by the Department of Trade and Industry – Bureau of Trade and Industrial Policy Research (BTIPR), with email address at [email protected].