Embed Size (px)
Citation preview
Dependability and Performance Assessment of
Dynamic CONNECTed Systems
Antonia Bertolino, Felicita Di GiandomenicoISTI-CNRJoint work with
A. Calabro’, F. Lonetti, M. Martinucci, P. Masci, N. Nostro, A. Sabetta
22
Outline
V&V in CONNECT
Introduction to Dependability and Performance
Introduction to Monitoring
Dependability and Performance Approaches in CONNECT
Logical Architecture of DePer
The GLIMPSE Monitoring Infrastructure
GLIMPSE + DePer
Case Study
Demo
3
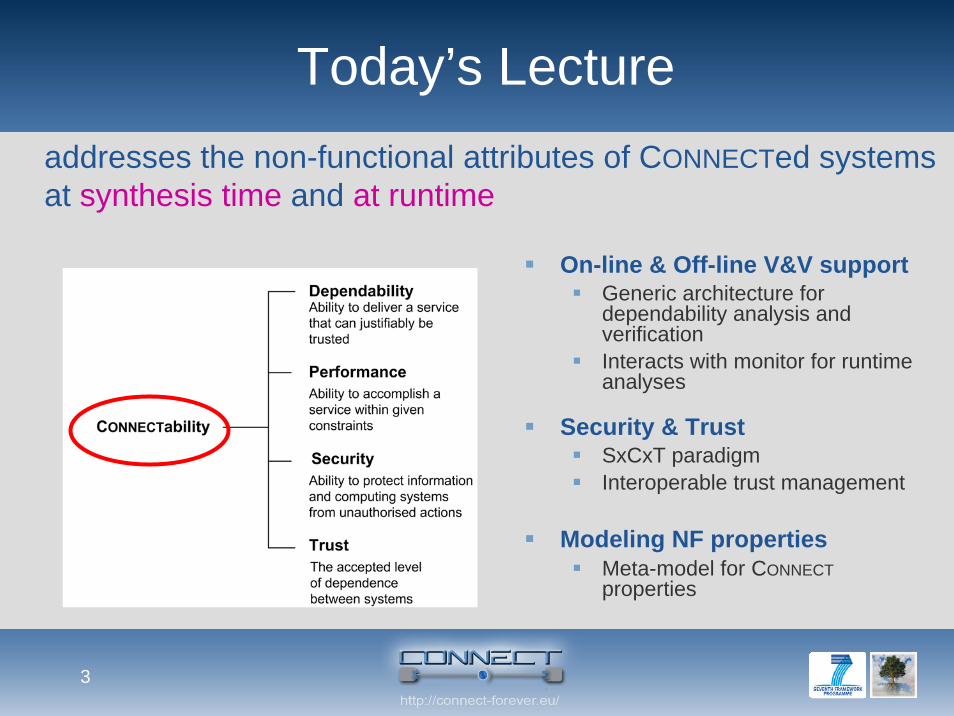
Today’s Lectureaddresses the non-functional attributes of CONNECTed systemsat synthesis time and at runtime
On-line & Off-line V&V supportGeneric architecture for dependability analysis and verificationInteracts with monitor for runtimeanalyses
Security & TrustSxCxT paradigmInteroperable trust management
Modeling NF propertiesMeta-model for CONNECTproperties

4
CONNECT Vision and V&V
The very goal of CONNECT, ensuringinteroperability in spite of changes, requiresspecial attention on validation techniques• to ensure that the functionality of systems is as
expected• to ensure that the desired non-functional properties
are maintainedAn ambitious goal: achieving CONNECTabilityeven in a highly dynamic setting
5
Challenges
System assembled dynamicallyReference specification of expected/correctoperation not a-priori availableSpecifications are learnt/inferred, thus they can be incomplete, unstable, uncertainAssessment activities must accommodatechange (and must be adaptable themselves)Special emphasis on run-time assessment(possibly coupled with off-line analysistechniques, whenever possible)
66
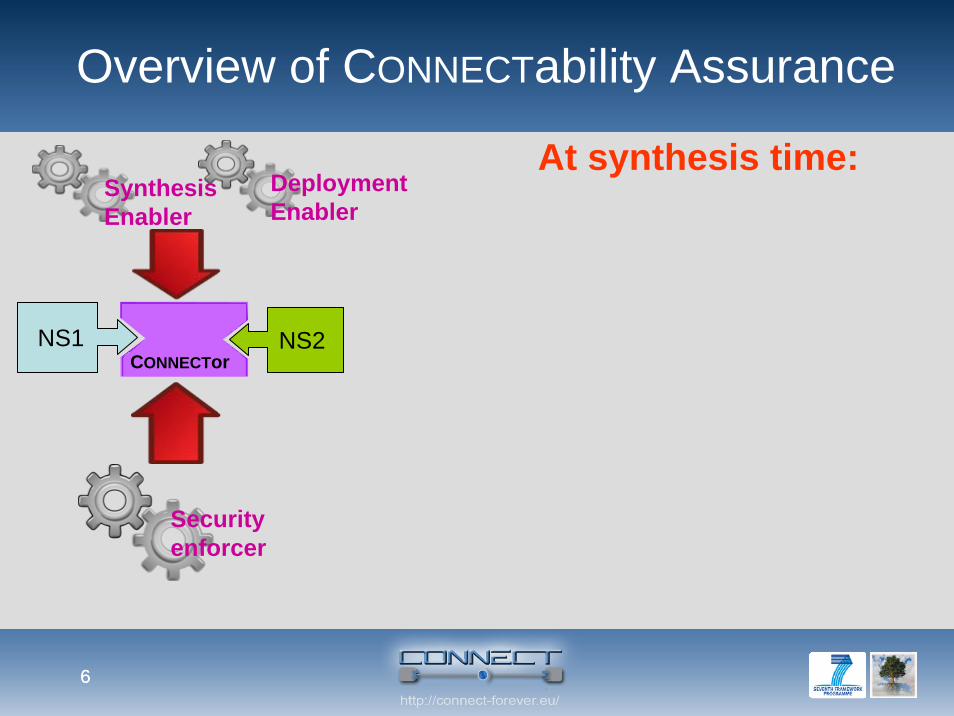
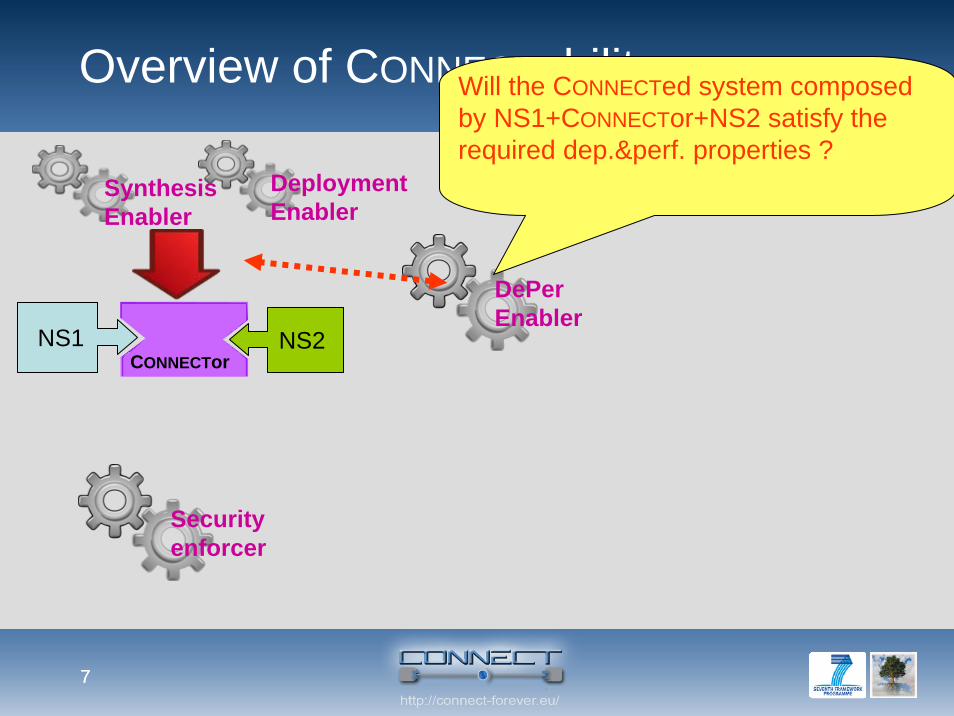
Overview of CONNECTability Assurance
CONNECTor
SynthesisEnabler
NS2
DeploymentEnabler
NS1
At synthesis time:
Securityenforcer
77
At synthesis time:
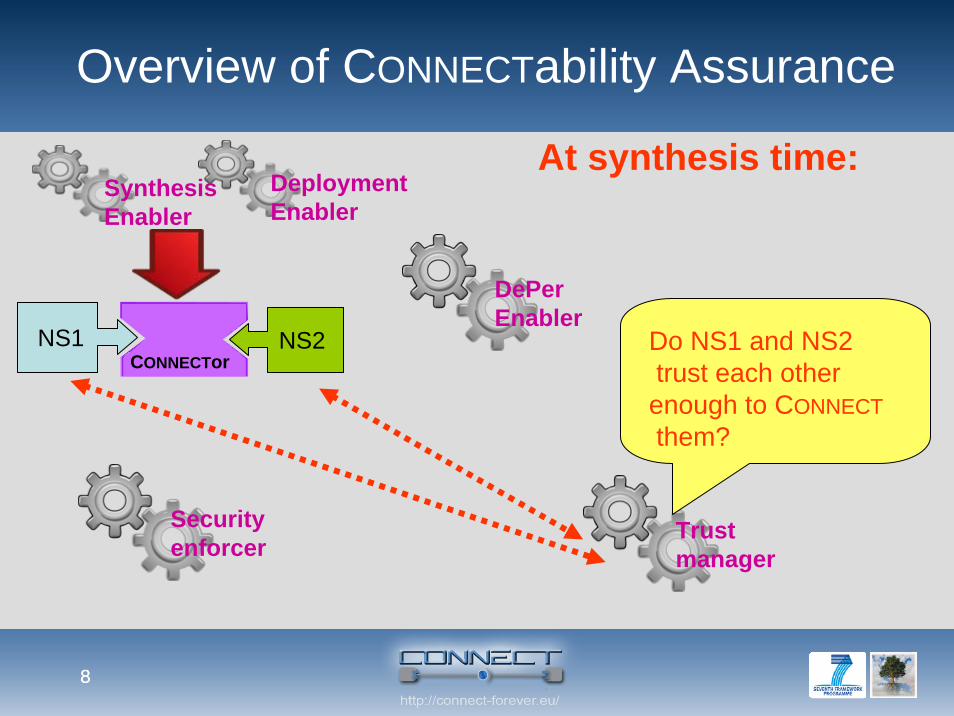
Overview of CONNECTability assurance
CONNECTor
SynthesisEnabler
NS2
DeploymentEnabler
NS1
DePerEnabler
Securityenforcer
Will the CONNECTed system composedby NS1+CONNECTor+NS2 satisfy the required dep.&perf. properties ?
88
Overview of CONNECTability Assurance
CONNECTor
SynthesisEnabler
NS2
DeploymentEnabler
NS1
Trustmanager
At synthesis time:
DePerEnabler
Securityenforcer
Do NS1 and NS2trust each otherenough to CONNECTthem?
99
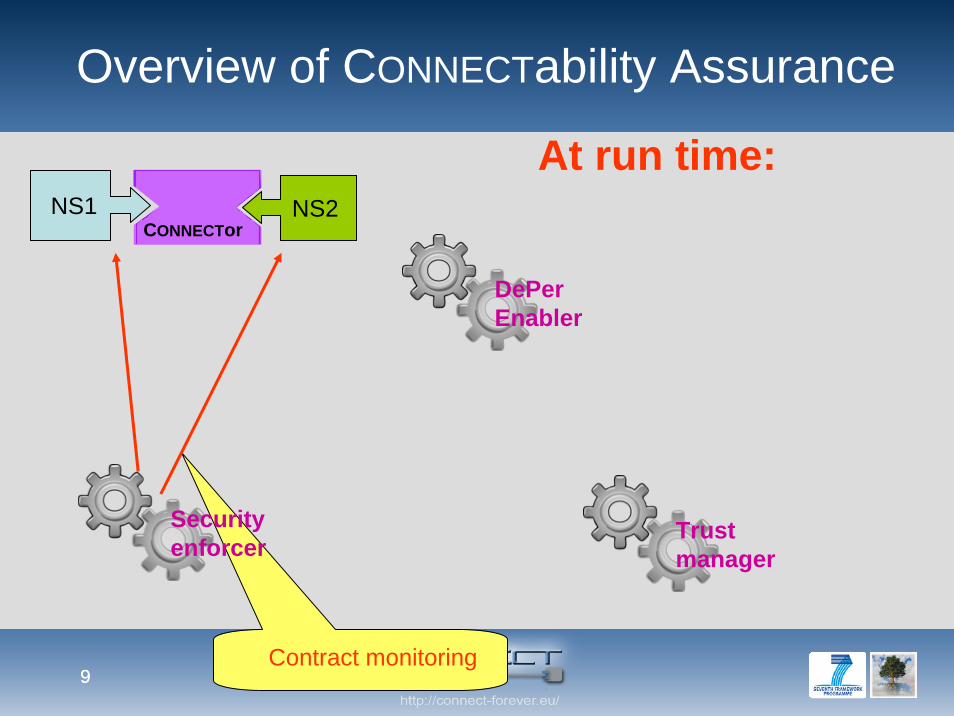
Overview of CONNECTability Assurance
Trustmanager
At run time:
DePerEnabler
Securityenforcer
CONNECTorNS2NS1
Contract monitoring
1010
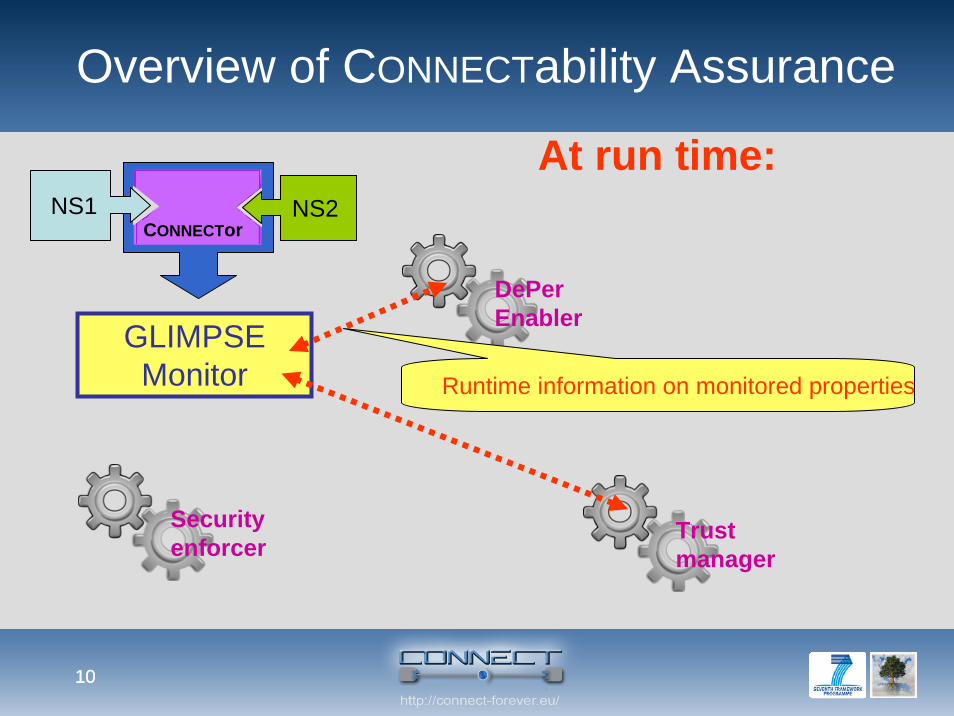
Overview of CONNECTability Assurance
Trustmanager
At run time:
DePerEnabler
Securityenforcer
GLIMPSEMonitor Runtime information on monitored properties
CONNECTorNS2NS1
11
Introduction toDependability and Performance
attributes
12
Dependability
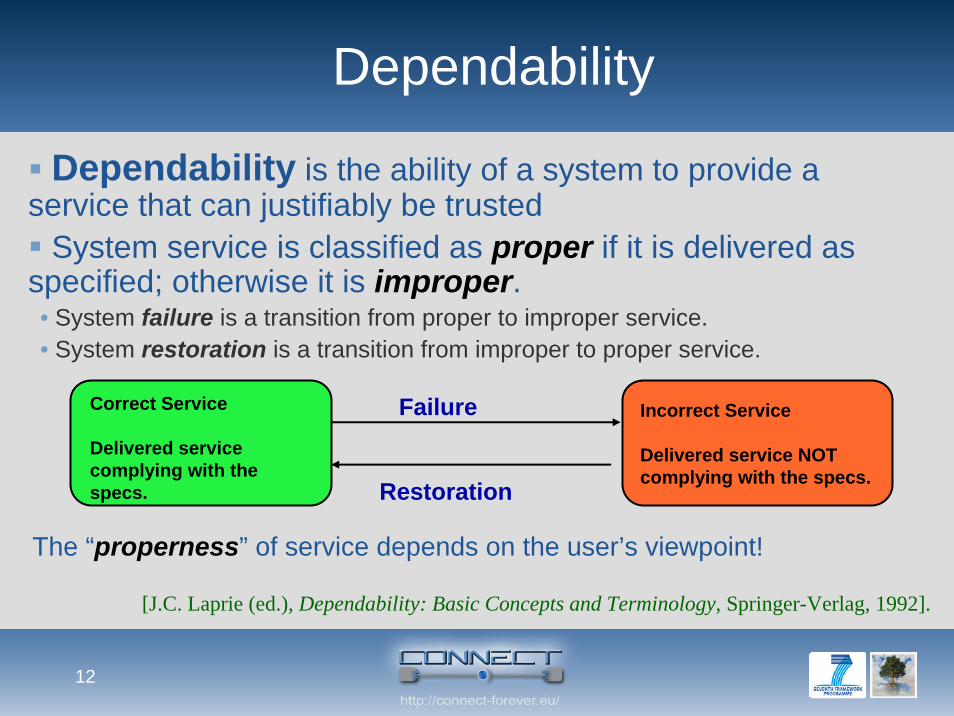
Dependability is the ability of a system to provide a service that can justifiably be trusted
System service is classified as proper if it is delivered as specified; otherwise it is improper.• System failure is a transition from proper to improper service.• System restoration is a transition from improper to proper service.
Correct Service
Delivered service complying with the specs.
Incorrect Service
Delivered service NOT complying with the specs.
Failure
Restoration
The “properness” of service depends on the user’s viewpoint!
[J.C. Laprie (ed.), Dependability: Basic Concepts and Terminology, Springer-Verlag, 1992].
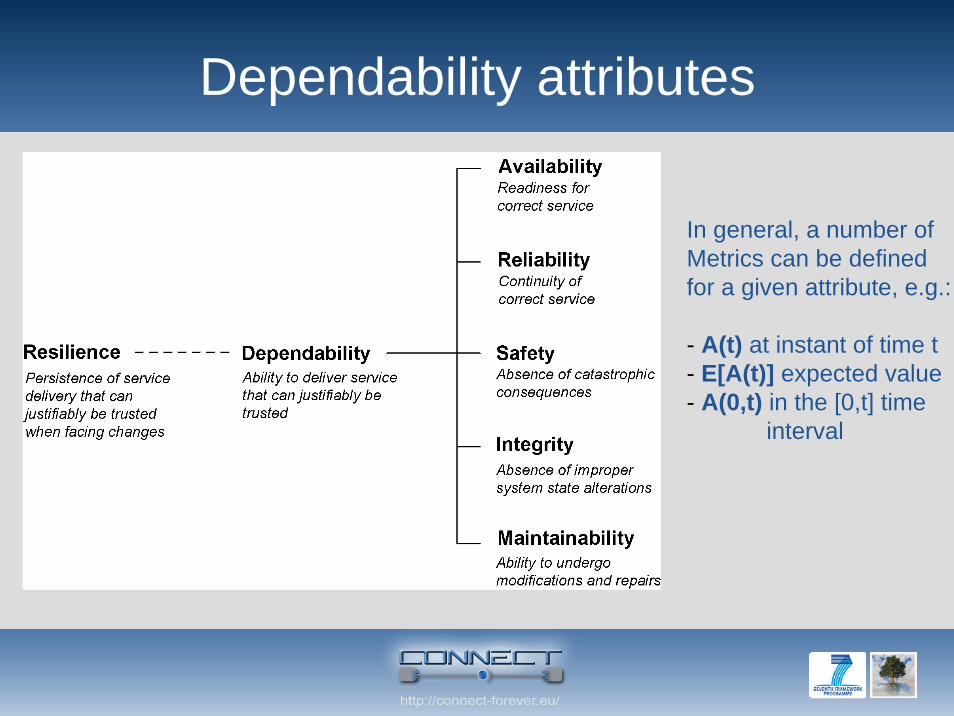
Dependability attributes
In general, a number of Metrics can be defined for a given attribute, e.g.:
- A(t) at instant of time t- E[A(t)] expected value- A(0,t) in the [0,t] time
interval
14
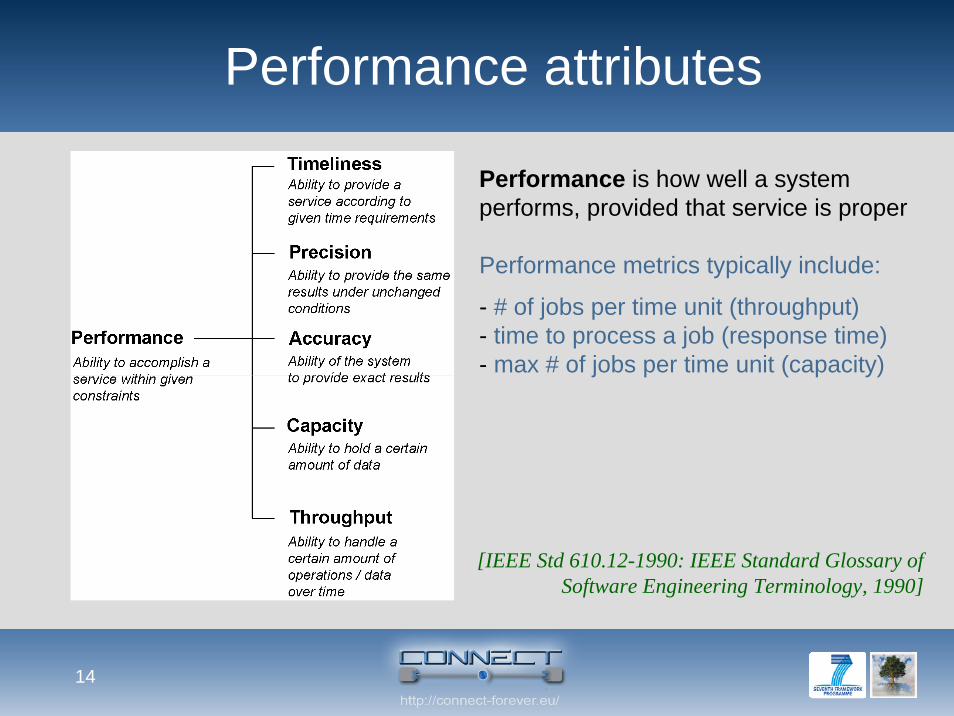
Performance attributes
Performance is how well a system performs, provided that service is proper
Performance metrics typically include:
- # of jobs per time unit (throughput)- time to process a job (response time)- max # of jobs per time unit (capacity)
[IEEE Std 610.12-1990: IEEE Standard Glossary of Software Engineering Terminology, 1990]
15
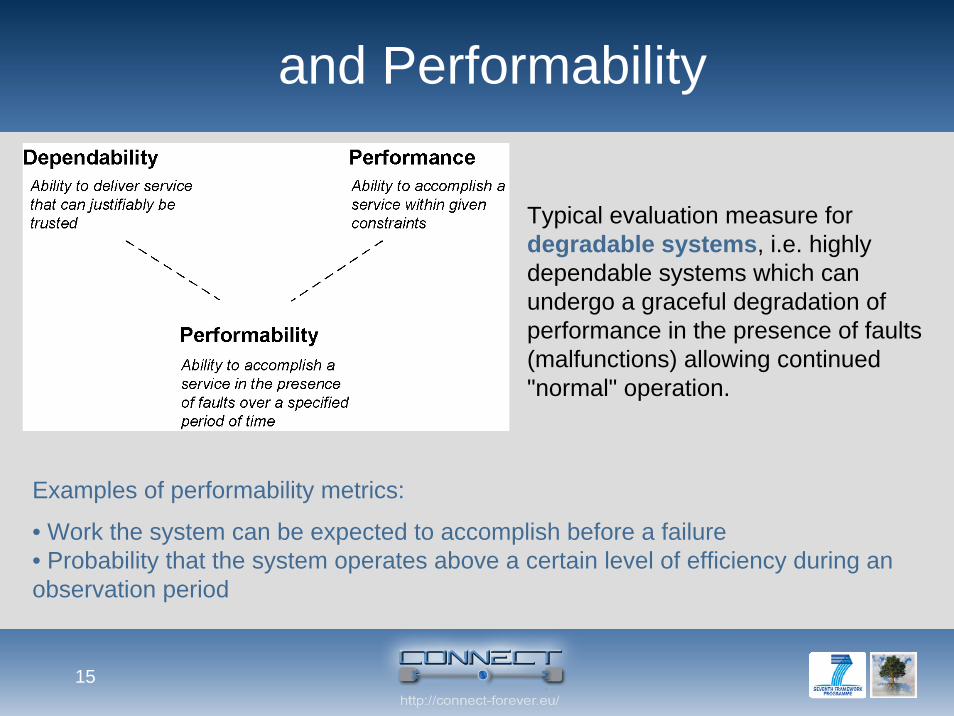
and Performability
Examples of performability metrics:
• Work the system can be expected to accomplish before a failure• Probability that the system operates above a certain level of efficiency during an observation period
Typical evaluation measure for degradable systems, i.e. highly dependable systems which can undergo a graceful degradation of performance in the presence of faults (malfunctions) allowing continued "normal" operation.
16
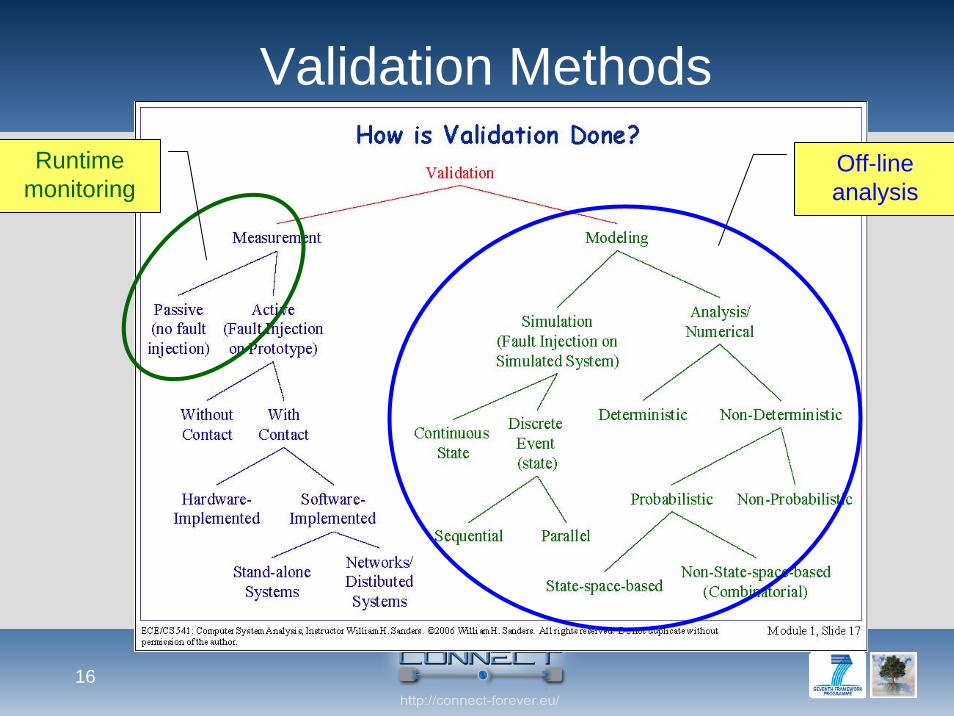
Validation MethodsOff-lineanalysis
Runtimemonitoring
Stochastic Model-Based Approaches
Consist of 2 phases:
The construction of a model of the system from theelementary stochastic processes that model thebehavior of the components of the system and theirinteractions; these elementary stochastic processesmainly relate to failure, to service restoration and repair;
Processing the model to obtain the expressions and thevalues of the dependability measures of the system.
Solution Methods
Dependability Model Solution Methods -- Method by which one determines measures from a model. Models can be solved by a variety of techniques:
Combinatorial Methods -- Structure of the model is used to obtain a simple arithmetic solution.Analytical/Numerical Methods -- A system of linear differential equations or linear equations is constructed, which is solved toobtain the desired measuresSimulation -- The description of what the system is and does is executed, and estimates of the measures are calculated based on the resulting executions (known also as sample paths or trajectories.)
19
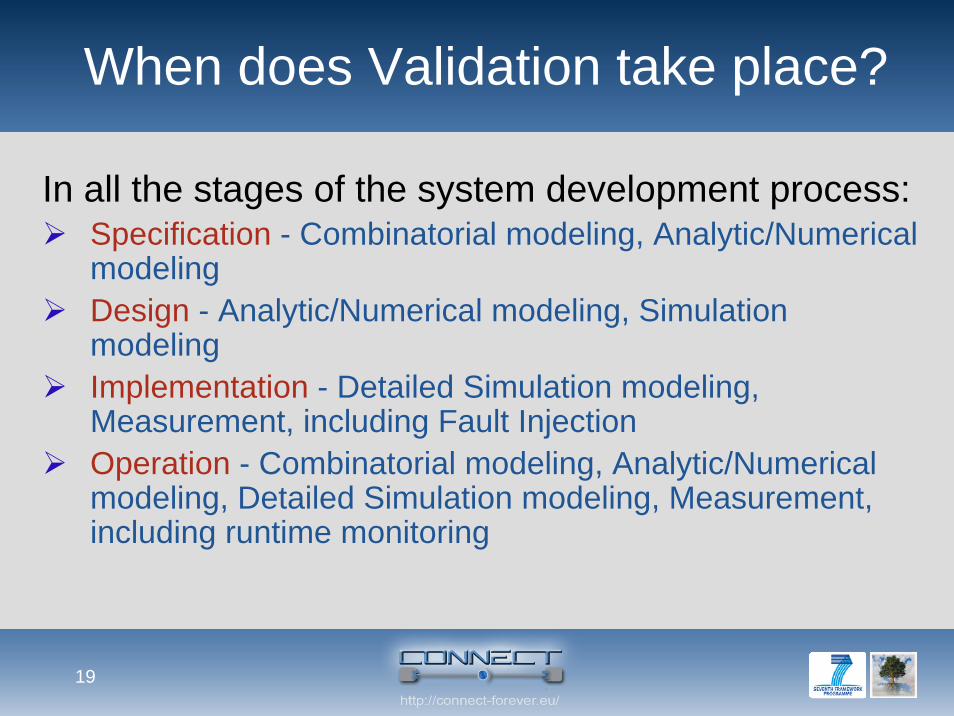
When does Validation take place?
In all the stages of the system development process:Specification - Combinatorial modeling, Analytic/Numerical modelingDesign - Analytic/Numerical modeling, Simulation modelingImplementation - Detailed Simulation modeling, Measurement, including Fault InjectionOperation - Combinatorial modeling, Analytic/Numerical modeling, Detailed Simulation modeling, Measurement, including runtime monitoring
20
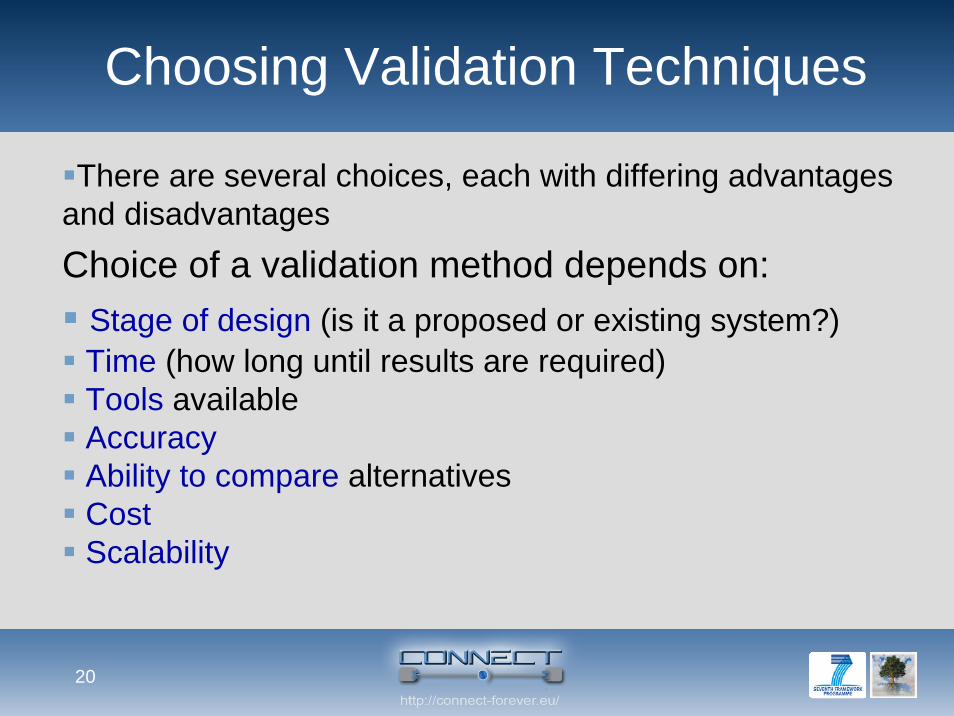
Choosing Validation Techniques
There are several choices, each with differing advantages and disadvantagesChoice of a validation method depends on:
Stage of design (is it a proposed or existing system?) Time (how long until results are required)Tools available AccuracyAbility to compare alternativesCostScalability
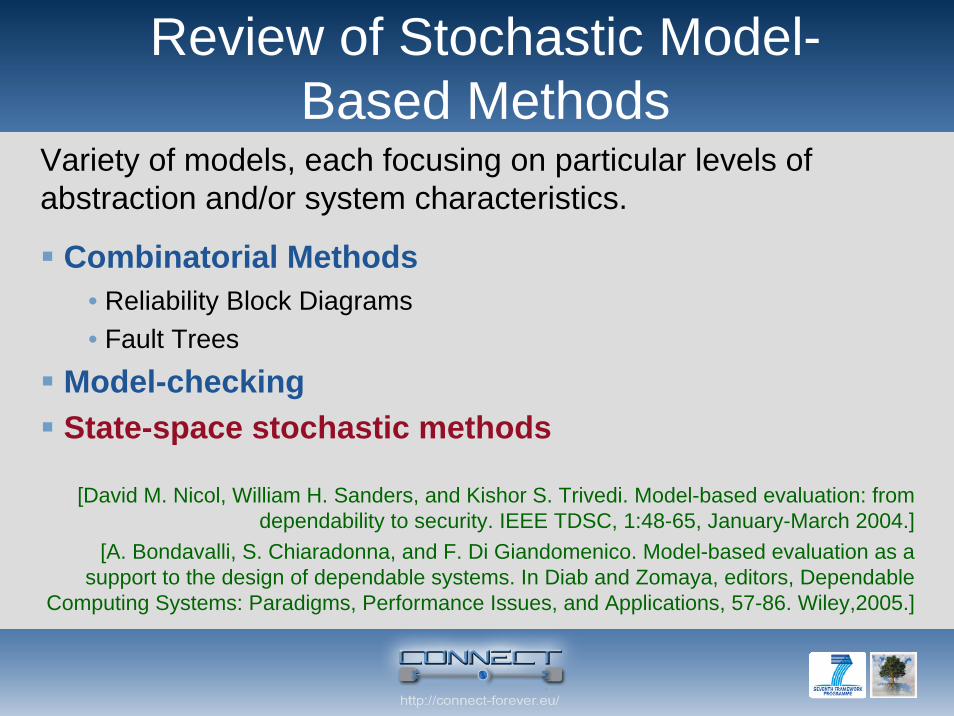
Review of Stochastic Model-Based Methods
Variety of models, each focusing on particular levels of abstraction and/or system characteristics.
Combinatorial Methods• Reliability Block Diagrams• Fault Trees
Model-checkingState-space stochastic methods
[David M. Nicol, William H. Sanders, and Kishor S. Trivedi. Model-based evaluation: from dependability to security. IEEE TDSC, 1:48-65, January-March 2004.]
[A. Bondavalli, S. Chiaradonna, and F. Di Giandomenico. Model-based evaluation as a support to the design of dependable systems. In Diab and Zomaya, editors, Dependable
Computing Systems: Paradigms, Performance Issues, and Applications, 57-86. Wiley,2005.]
22
Introduction toRun-time Analysis via Monitoring
23
Validation @ runtime
Relies on sensing what is happening and on timely collecting relevant information
We need to monitor systems behaviour
24
An over-loaded term
Large (but fractioned) body of research, carried out over decades.Different authors use the term “monitoring" to indicate different things.A monitoring system is in fact an assemblyof different pieces dealing with differentconcerns.
25
Monitoring: Definition
the process of dynamic collection, interpretation, and presentation ofinformation concerning objects or software processes under scrutiny
[J. Joyce, G. Lomow, K. Slind, and B. Unger. Monitoring distributedsystems. ACM Trans. Comput. Syst., 5(2):121–150, 1987]
26
Monitoring: purpose
A monitor gathers information about a process as it executes
This is always carried out with a purpose in mind
The specialization of monitoring to the different purposes determines the type and the way in which information is collected
27
Monitoring: purpose
Some uses:
Dependability
Performance evaluation
Security
Correctness checking
Debugging and testing
Control
Accounting
Resource utilisation analysis
28
Monitoring: purpose
Some uses:
Dependability
Performance evaluation
Security
Correctness checking
Debugging and testing
ControlControl
Accounting
Resource utilisation analysis
29
Example: Fault-monitoring
A monitor takes a specification of desired software properties and observes an executing software system to check that the execution meets the properties, i.e., that the properties hold for the given execution.See e.g. Delgado et al.’s for a taxonomy
[N. Delgado, A. Quiroz Gates, and S. Roach. A Taxonomy and Catalog of Runtime Software-Fault Monitoring Tools. IEEE TSE. 30(12) 2004, 859-872.]
30
“On-line” monitoring
By default.Schroeder qualifies on-line as:• External observation• Monitored application is fully functioning• Intended to be permanent
[B. A. Schroeder. On-Line Monitoring: A Tutorial. Computer, 28(6):72-78, 1995]
31
Monitor types
Assertion based Property specification basedAspect-oriented programmingInterception of exchanged messagesFunctional/Non-functional monitoringData-driven vs. Event-driven
32
System observation
The operation of a subject system is abstracted in terms of actions: we distinguish between actionswhich happen internally to components and thoseat the interfaces between components
Communication actions are regulated by inter-component communication protocols that are independent of the components internals.
33
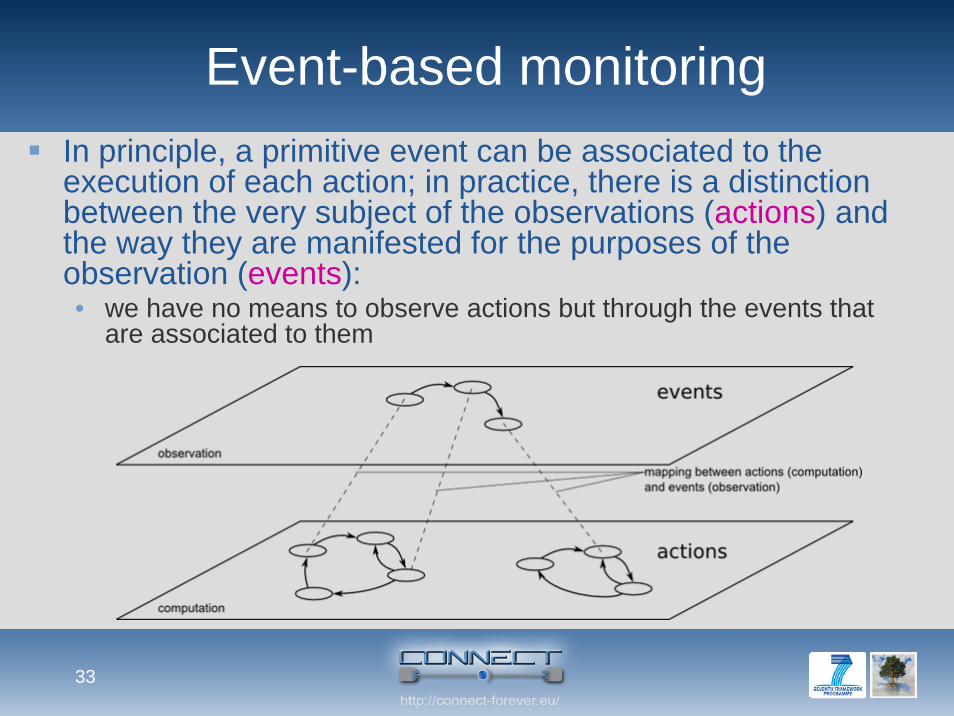
Event-based monitoringIn principle, a primitive event can be associated to the execution of each action; in practice, there is a distinctionbetween the very subject of the observations (actions) and the way they are manifested for the purposes of the observation (events):• we have no means to observe actions but through the events that
are associated to them
34
Event-based monitoring
While actions just happen, firing of eventsdepends on the decisions taken as part of the configuration of the monitoring system. Event specification is central to the overall setupof a monitoring system• Simple (“basic” or “primitive”) events : events that
correspond to the completion of an action• Complex (“structured” or “composite”) events: happen
when a certain combination of basic events and/or other composite events happen
35
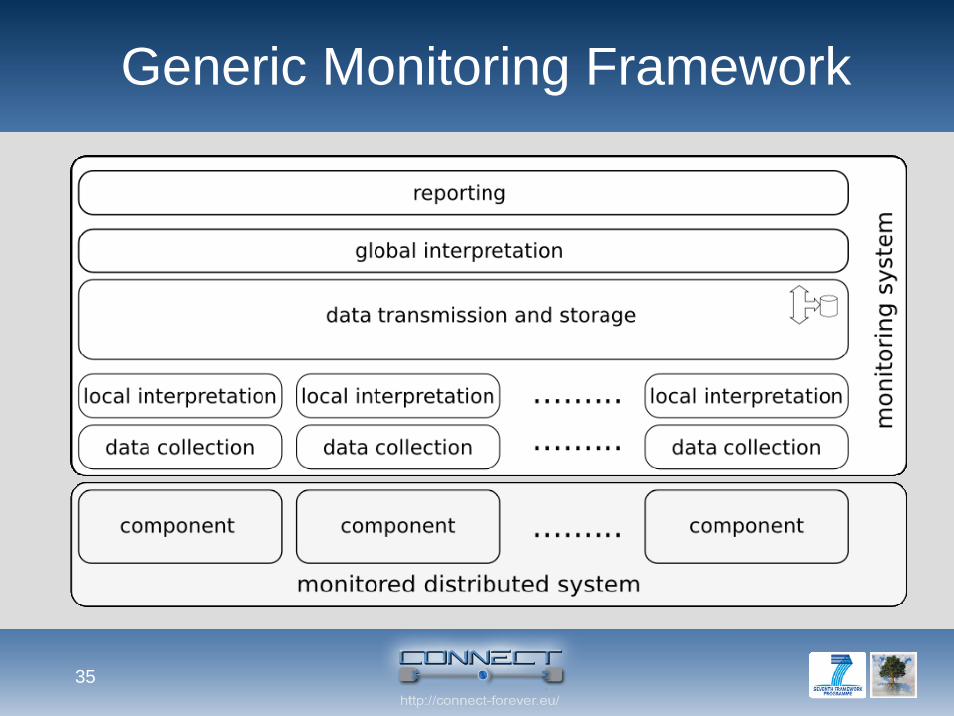
Generic Monitoring Framework
36
Data collection
Styles• Code instrumentation (off-line)• Runtime instrumentation (e.g. bytecode instrumentation, aspect-
orientation)• Proxy-based (agent snoops communications to intercept• relevant events)
Level of detail, target of the observation (hw-level, OS-level, middleware-level, application-level)Continuous Vs. sample-based (sample in time/space)
37
Local interpretation
making sense of collected data (filter out uninteresting information)
38
Transmission
Compression (may exploit semantics)Immediate Vs. delayedBuffering, resource consumption trade-offsWidth of observation window (affectsoverhead as well as detection effectiveness), prioritisation.Lossy Vs. non-lossy
39
Global interpretation
aka “correlation”Put together information coming fromdifferent (distributed) processes to makesense of it globallyMay involve correlating concurrent eventsat multiple nodesMulti-layer architectures to increasescalability
40
Reporting
Observed events might not be amenablefor immediate use by the observer
Either machine readable, or textualreports, graphics, animations and so on.
41
Distribution issues
Physical separation:• No single point of observation, system partial failure, delays or
communication failures, ConcurrencyHeterogeneityFederation• Crossing federation boundaries, different authorities, agreed
policiesScalingEvolution
[Y. Hoffner, “Monitoring in distributed systems”, ANSA project 1994]
42
Natural Constraints
Observability Problem• L. Lamport, Time, Clocks and the Ordering of Events
in a Distributed System, CACM 21, 7 (July 1978), 558-565.
• C. Fidge. Fundamentals of Distributed System Observation. In IEEE Software, Volume 13, pp. 77-83, 1996.
Probe Effect• J. Gait. A Probe Effect in Concurrent Programs.
Softw., Pract. Exper., 16(3):225–233, 1986.
43
Relevant issues
How data are collected/filtered from the sourceHow info is aggregated/synchronizedHow to instruct the monitor
44
Events aggregation
open-source event processing engines• Drools Fusion1
• Esper2
• can be fully embedded in existing Java architectures
1Drools Fusion: Complex Event Processor. http://www.jboss.org/drools/drools-fusion.html
2Esper: Event Stream and Complex Event Processing for Java. http://www.espertech.com/products/esper.php.
45
Some event based monitoring framework proposals
HiFi1
• event filtering approach • specifically targeted at improving scalability and performance for
large-scale distributed systems• minimizing the monitoring intrusiveness
event-based middleware2
• with complex event processing capabilities on distributed systems• publish/subscribe infrastructure
1E. A. Hussein Et al. “HiFi: A New Monitoring Architecture for Distributed Systems Management”, ICDCS, 171-178, 1999.
2E. P.R. Pietzuch, B. Shand, and J. Bacon. “Composite event detection as a generic middleware extension”, Network, IEEE, 18(1):44-55, 2004.
46
Complex event monitoring specification languages
GEM1
• rule-based languageTESLA2
• simple syntax and a semantics based on a first order temporal logicSnoop3
• event-condition-action approach supporting temporal and composite events specification
• it is especially developed for active databases
1Samani and Sloman. “GEM: a generalized event monitoring language for distributed systems”, Distributed Systems Engineering, 4(2):96-108, 1997.
2 G. Cugola and A. Margara. "TESLA: a formally defined event specificationlanguage", DEBS, 50-61, 2010.
3 S. Chakravarthy and D. Mishra. “Snoop: An expressive event specification languagefor active databases", Data & Knowledge Engineering, 14(1) 1-26, 1994.
47
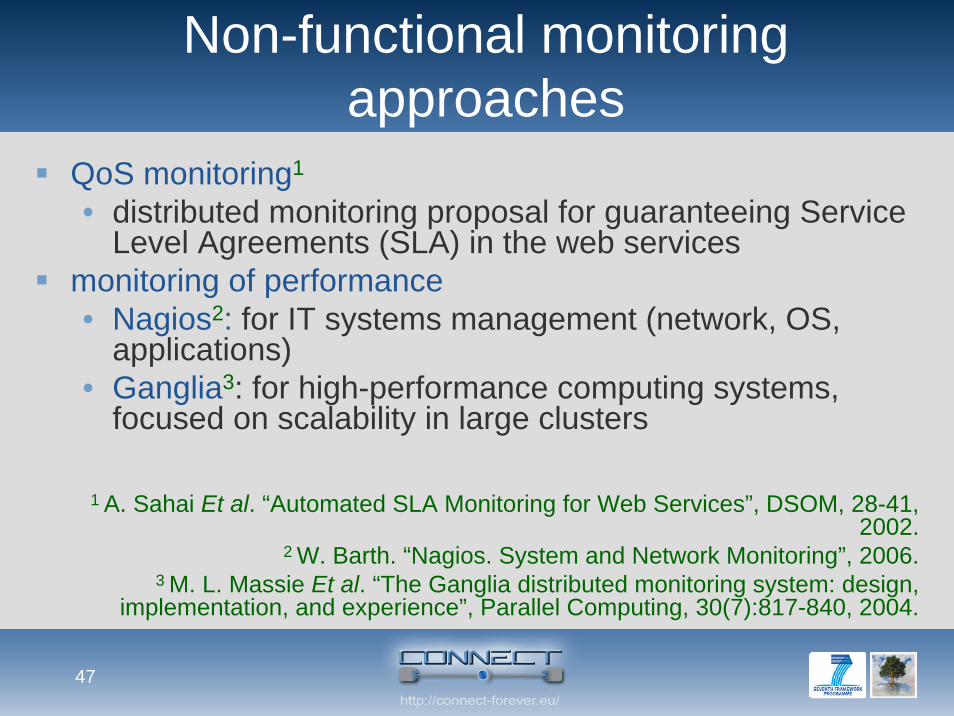
Non-functional monitoring approaches
QoS monitoring1
• distributed monitoring proposal for guaranteeing Service Level Agreements (SLA) in the web services
monitoring of performance• Nagios2: for IT systems management (network, OS,
applications)• Ganglia3: for high-performance computing systems,
focused on scalability in large clusters
1 A. Sahai Et al. “Automated SLA Monitoring for Web Services”, DSOM, 28-41, 2002.
2 W. Barth. “Nagios. System and Network Monitoring”, 2006.3 M. L. Massie Et al. “The Ganglia distributed monitoring system: design,
implementation, and experience”, Parallel Computing, 30(7):817-840, 2004.
48
Dependability and PerformanceApproach in CONNECT
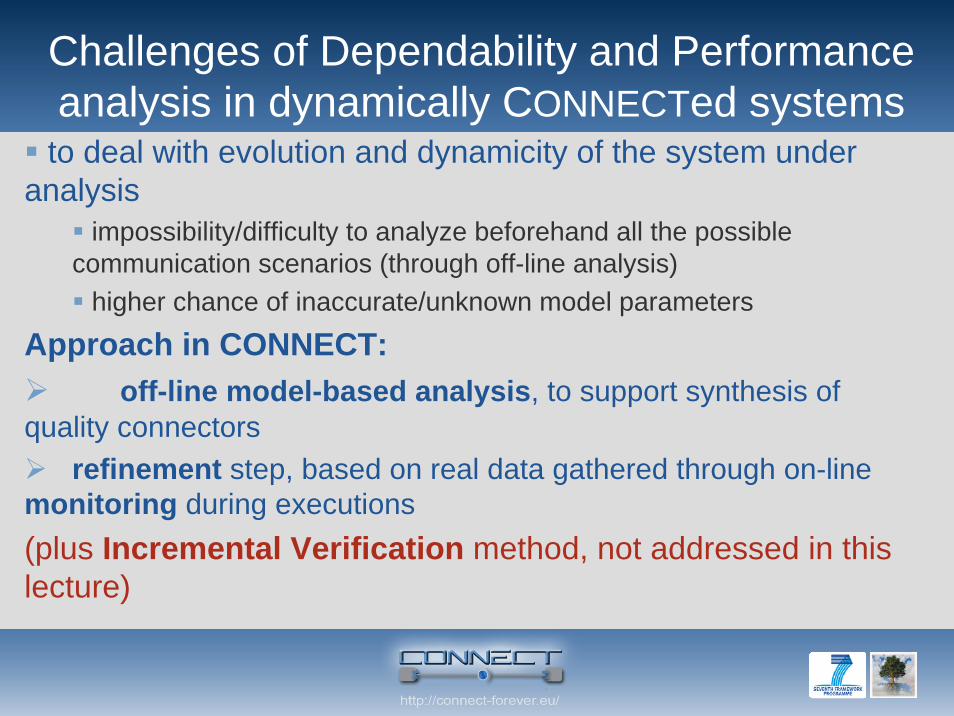
Challenges of Dependability and Performance analysis in dynamically CONNECTed systems
to deal with evolution and dynamicity of the system under analysis
impossibility/difficulty to analyze beforehand all the possiblecommunication scenarios (through off-line analysis)
higher chance of inaccurate/unknown model parameters
Approach in CONNECT:off-line model-based analysis, to support synthesis of
quality connectorsrefinement step, based on real data gathered through on-line
monitoring during executions(plus Incremental Verification method, not addressed in this lecture)
50
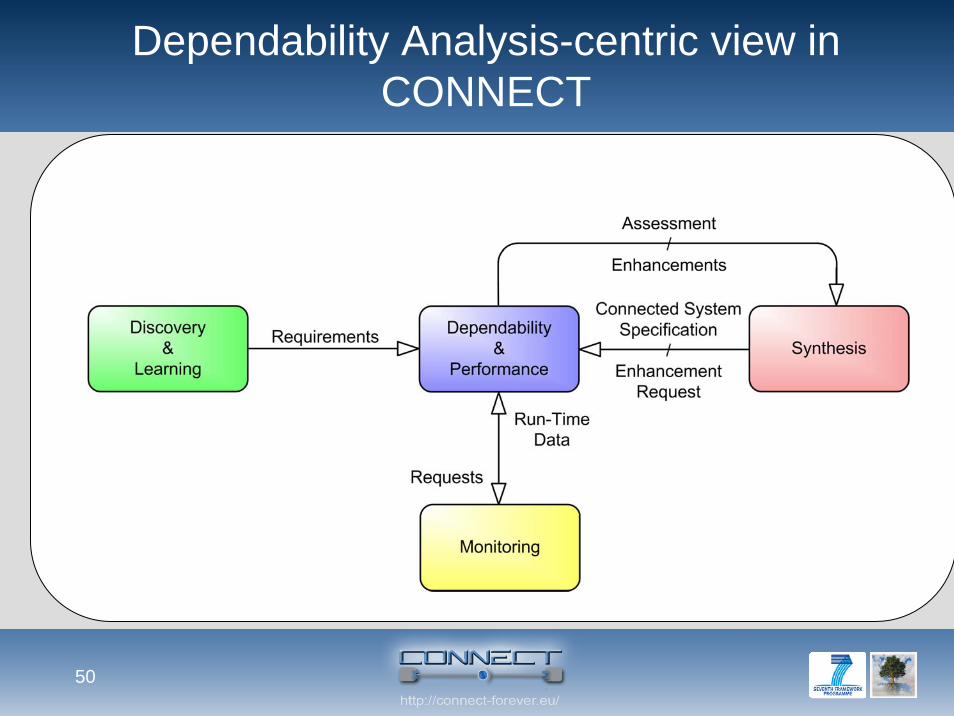
Dependability Analysis-centric view in CONNECT
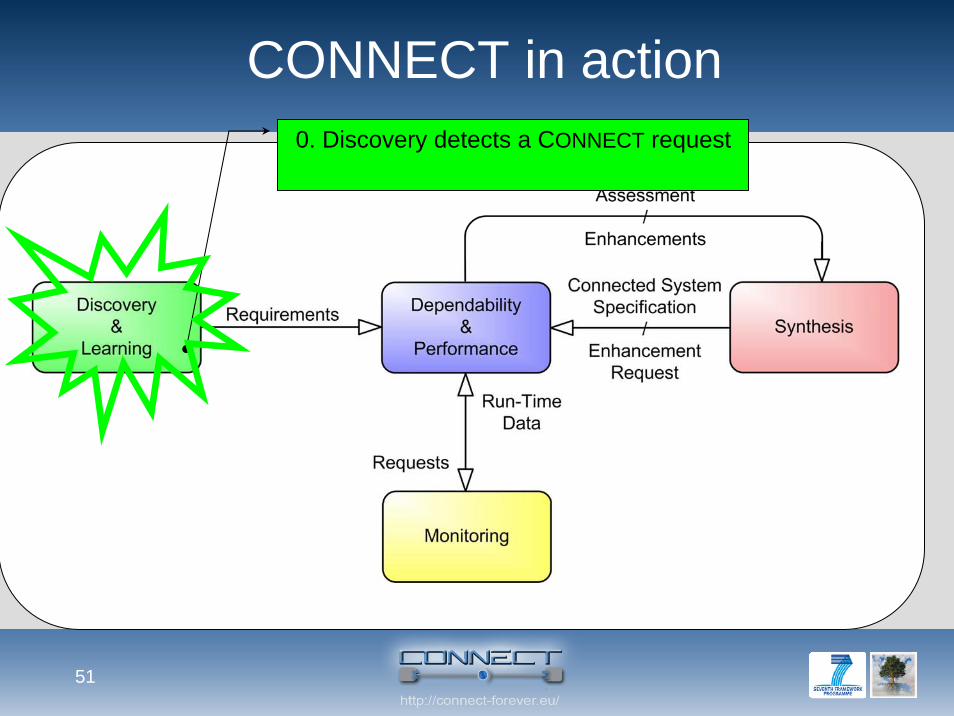
51
CONNECT in action0. Discovery detects a CONNECT request
52
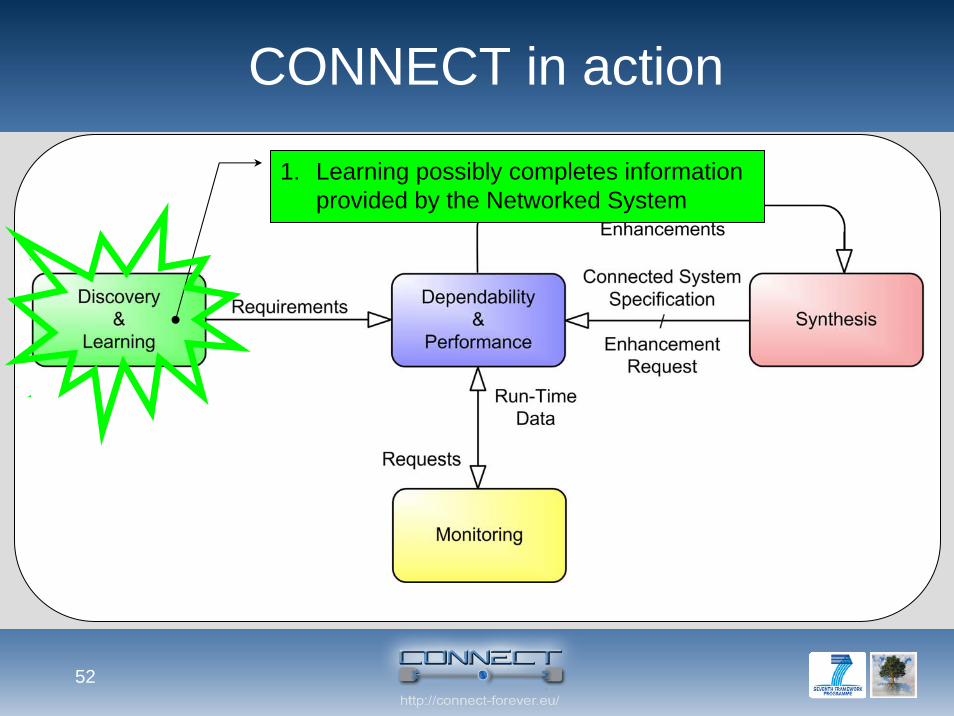
CONNECT in action
1. Learning possibly completes information provided by the Networked System
53
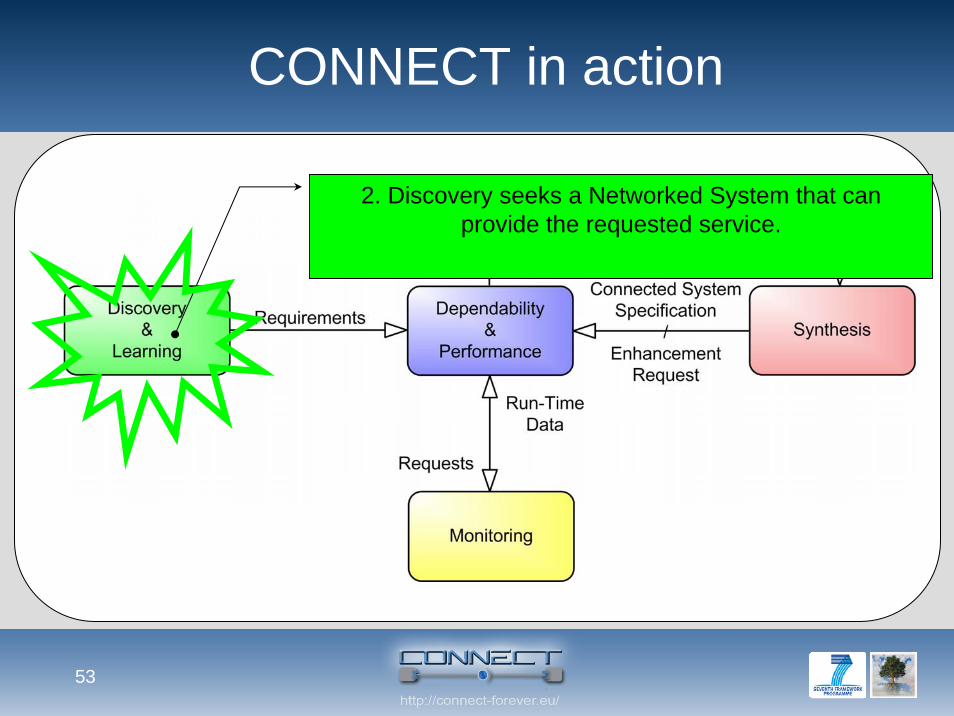
CONNECT in action
2. Discovery seeks a Networked System that can provide the requested service.
54
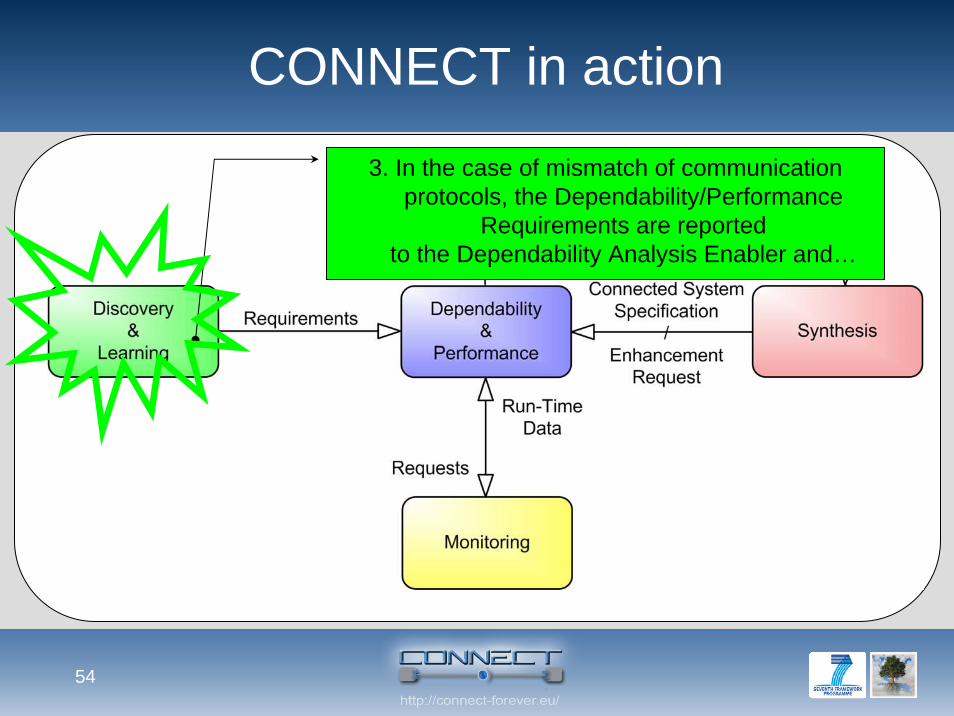
CONNECT in action
3. In the case of mismatch of communication protocols, the Dependability/Performance
Requirements are reported to the Dependability Analysis Enabler and…
55
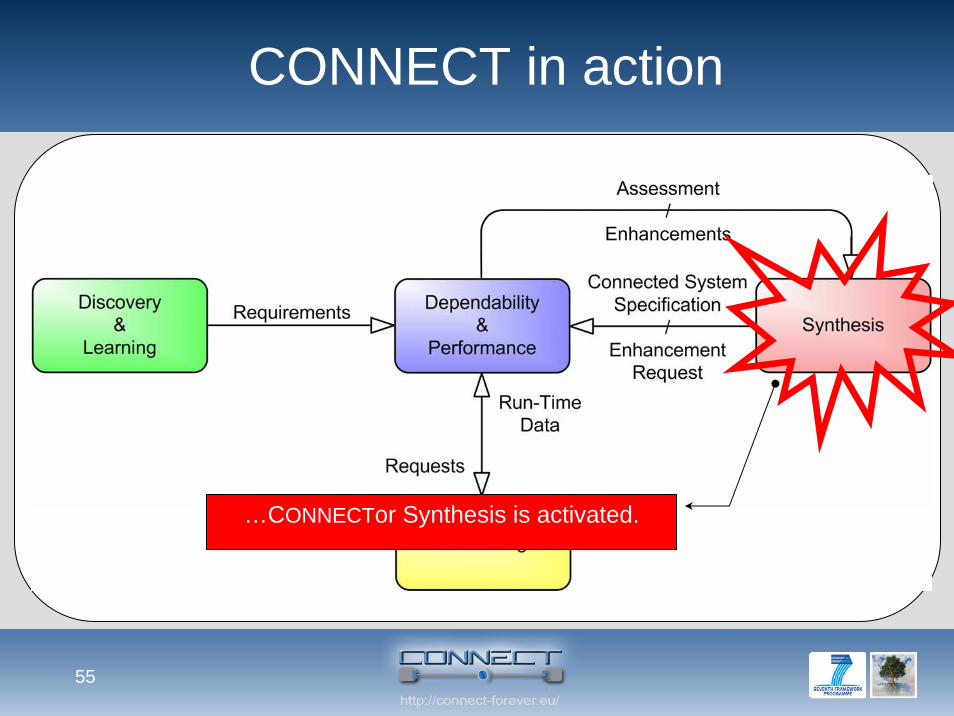
CONNECT in action
…CONNECTor Synthesis is activated.
56
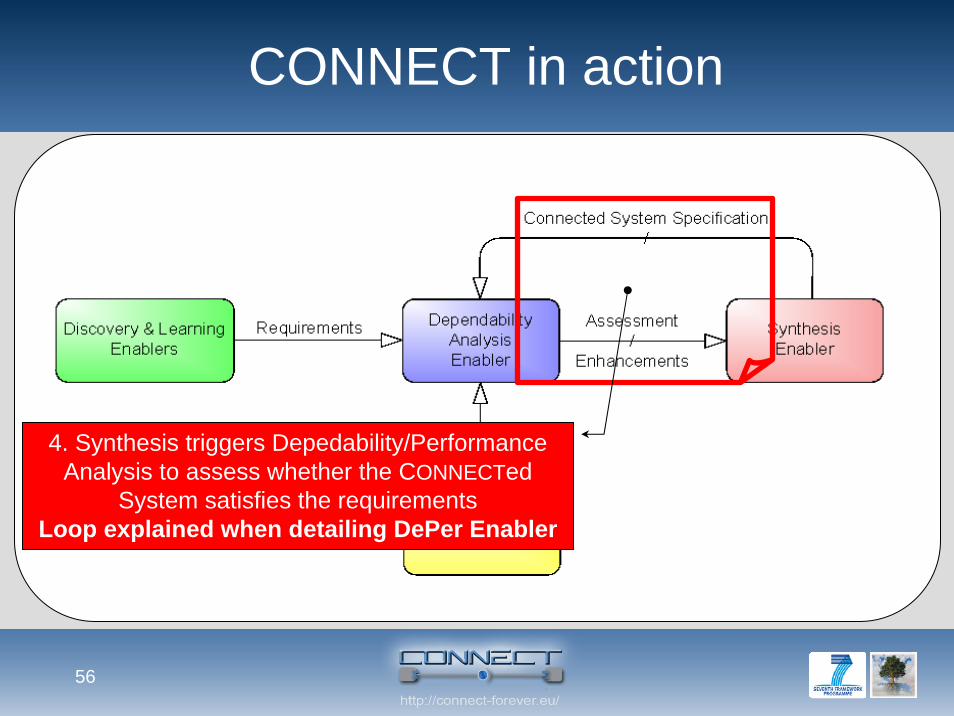
CONNECT in action
4. Synthesis triggers Depedability/Performance Analysis to assess whether the CONNECTed
System satisfies the requirementsLoop explained when detailing DePer Enabler
57
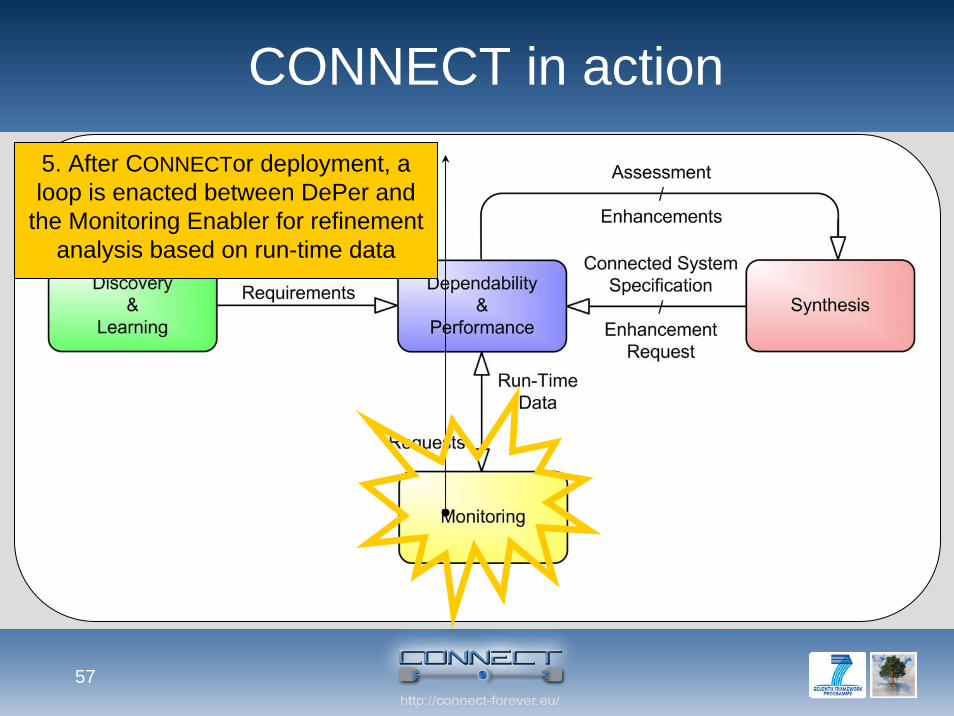
CONNECT in action5. After CONNECTor deployment, a loop is enacted between DePer and
the Monitoring Enabler for refinement analysis based on run-time data
58
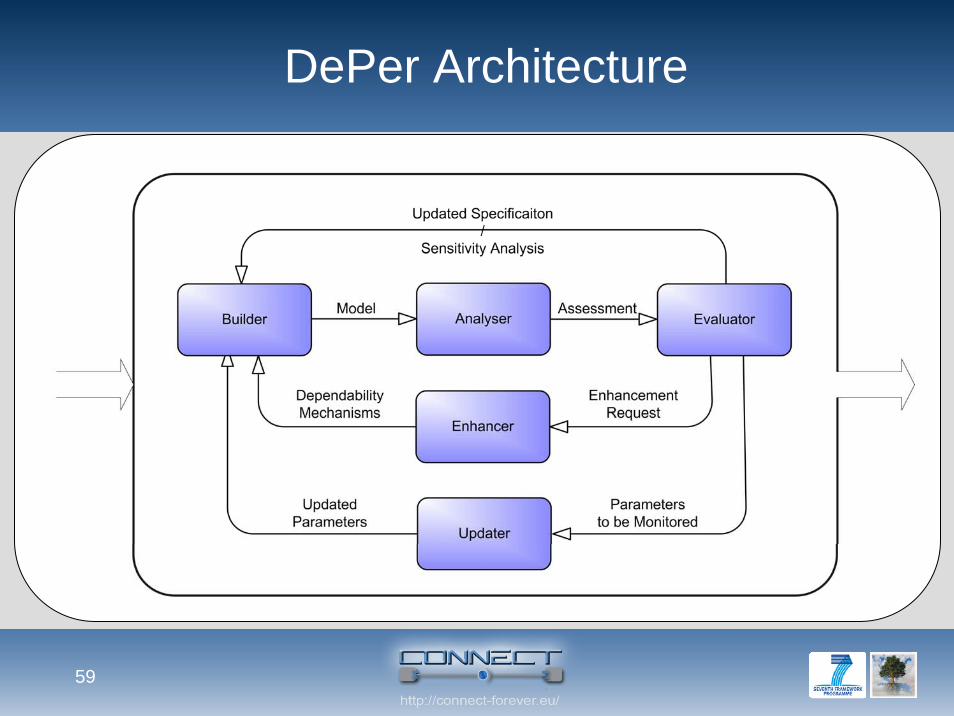
Logical Architectureof the
Dependability and Performance Analysis Enabler (DePer)
59
DePer Architecture
60
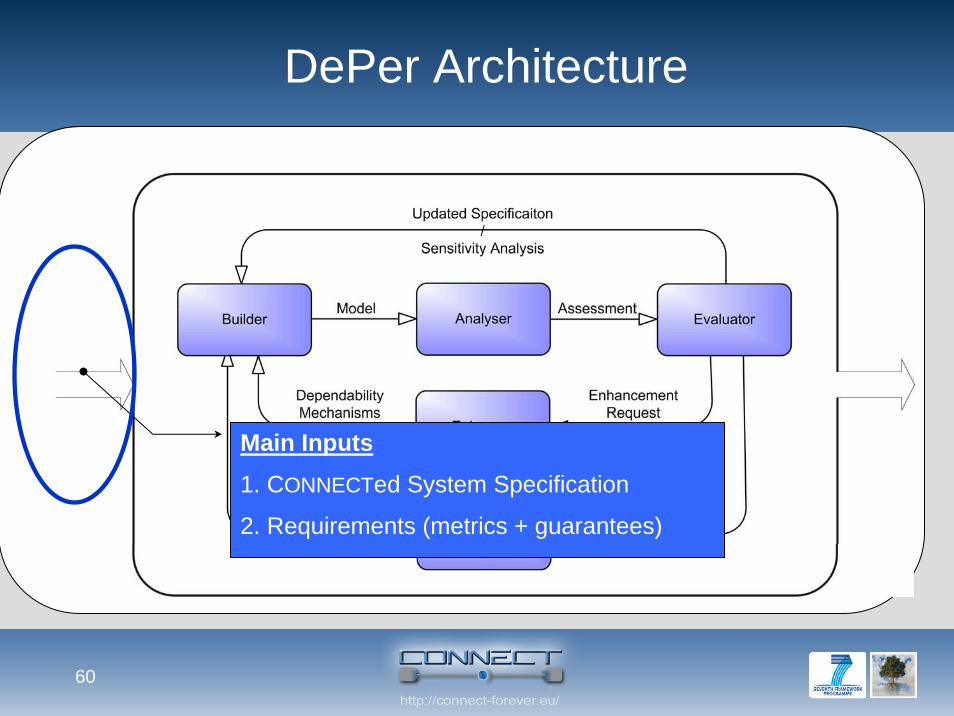
DePer Architecture
Main Inputs
1. CONNECTed System Specification
2. Requirements (metrics + guarantees)
61
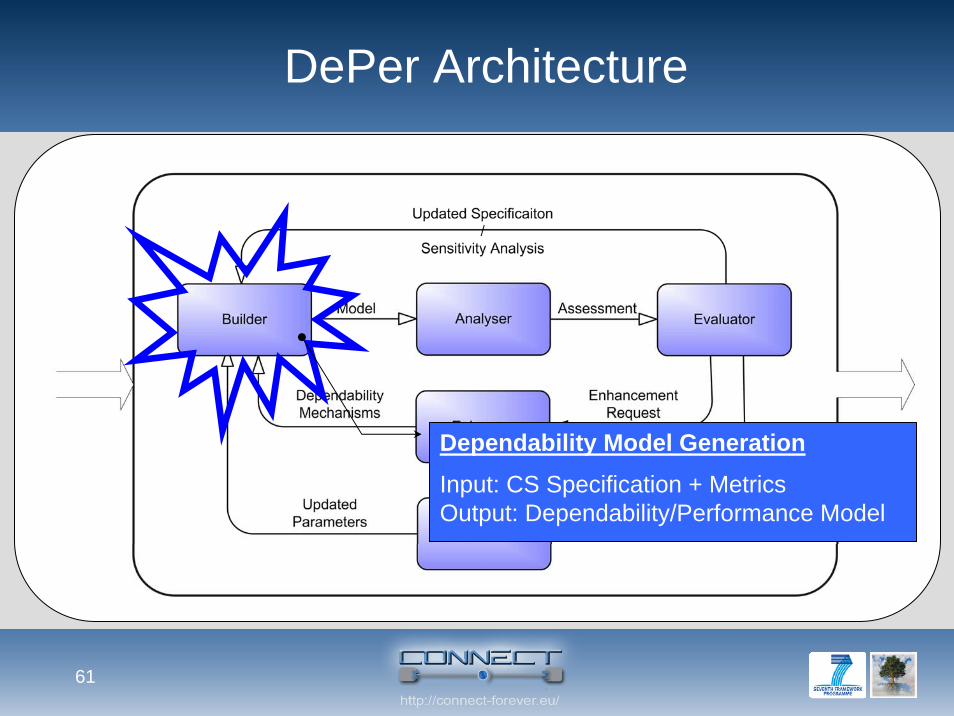
DePer Architecture
Dependability Model Generation
Input: CS Specification + MetricsOutput: Dependability/Performance Model
62
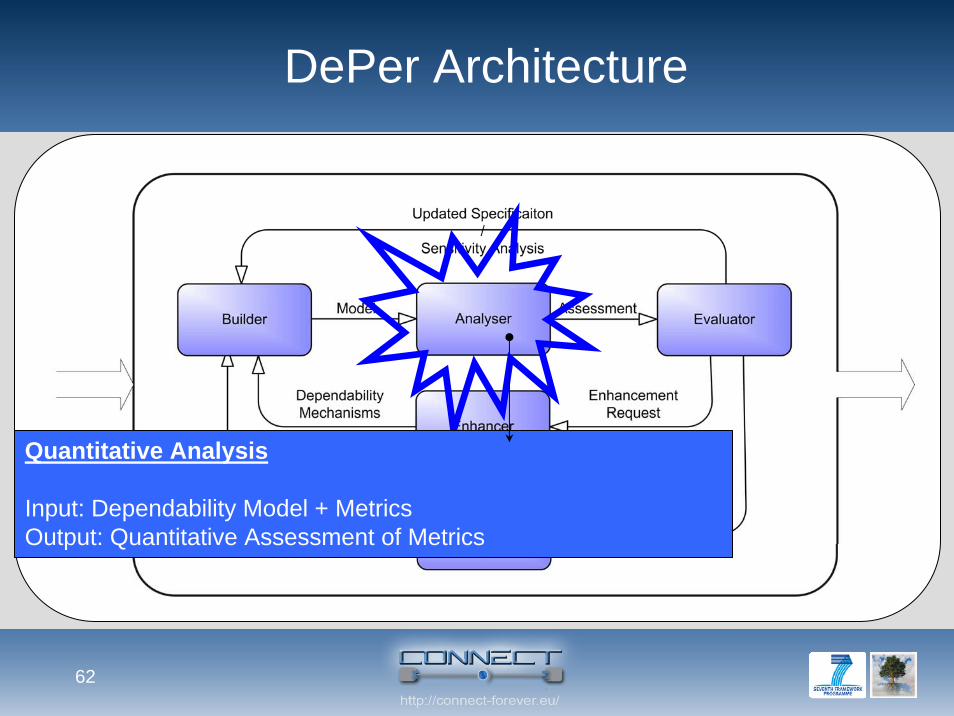
DePer Architecture
Quantitative Analysis
Input: Dependability Model + MetricsOutput: Quantitative Assessment of Metrics
63
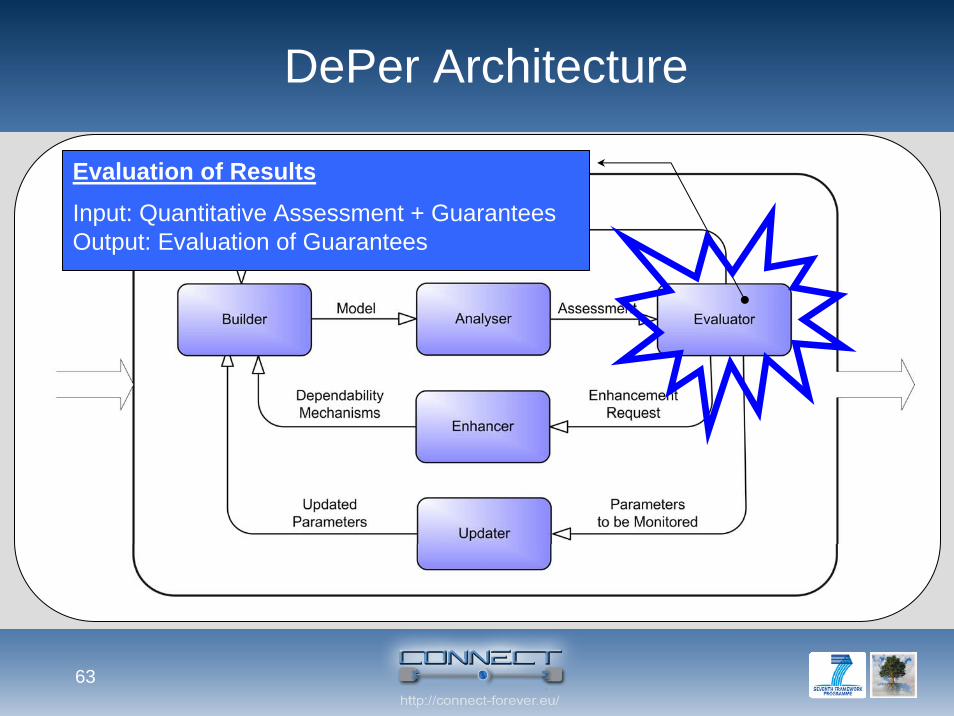
DePer Architecture
Evaluation of Results
Input: Quantitative Assessment + GuaranteesOutput: Evaluation of Guarantees
64
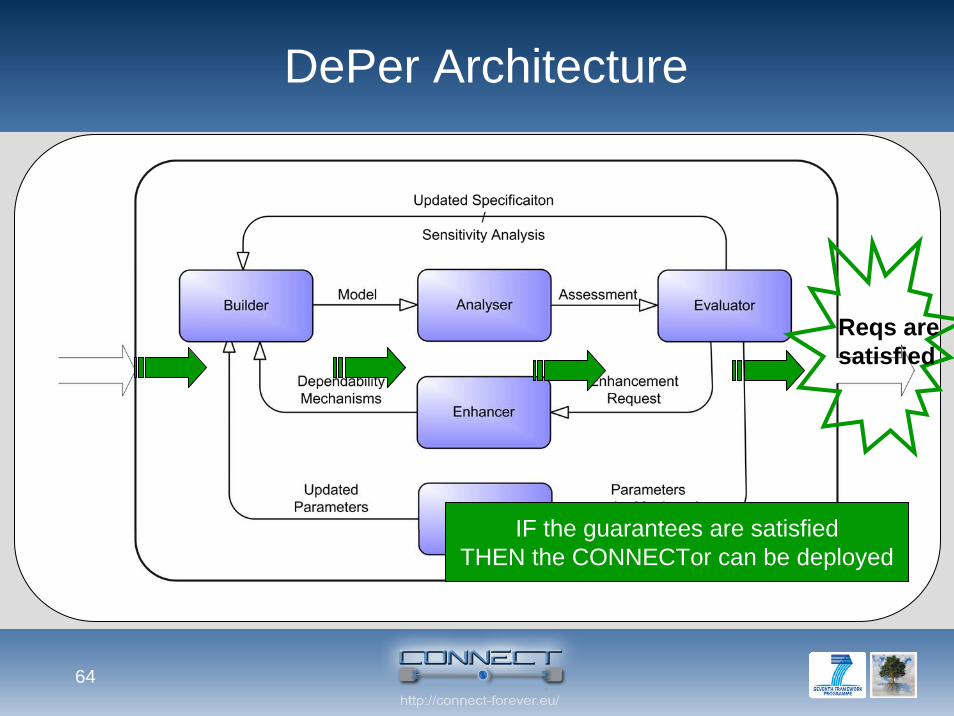
DePer Architecture
Reqs are satisfied
IF the guarantees are satisfiedTHEN the CONNECTor can be deployed
65
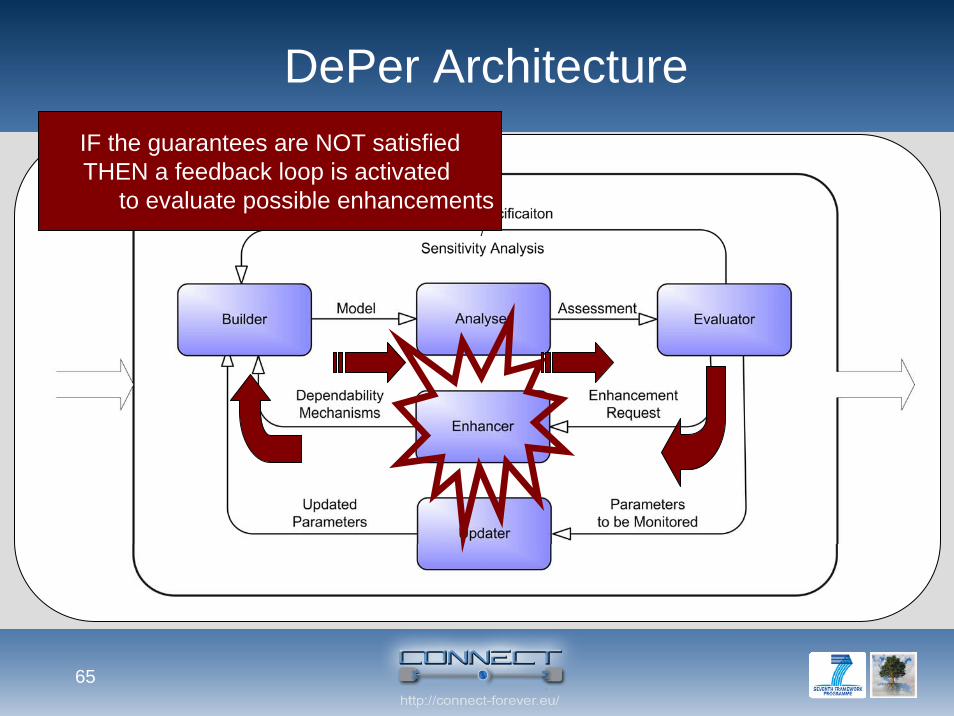
DePer ArchitectureIF the guarantees are NOT satisfiedTHEN a feedback loop is activated
to evaluate possible enhancements
66
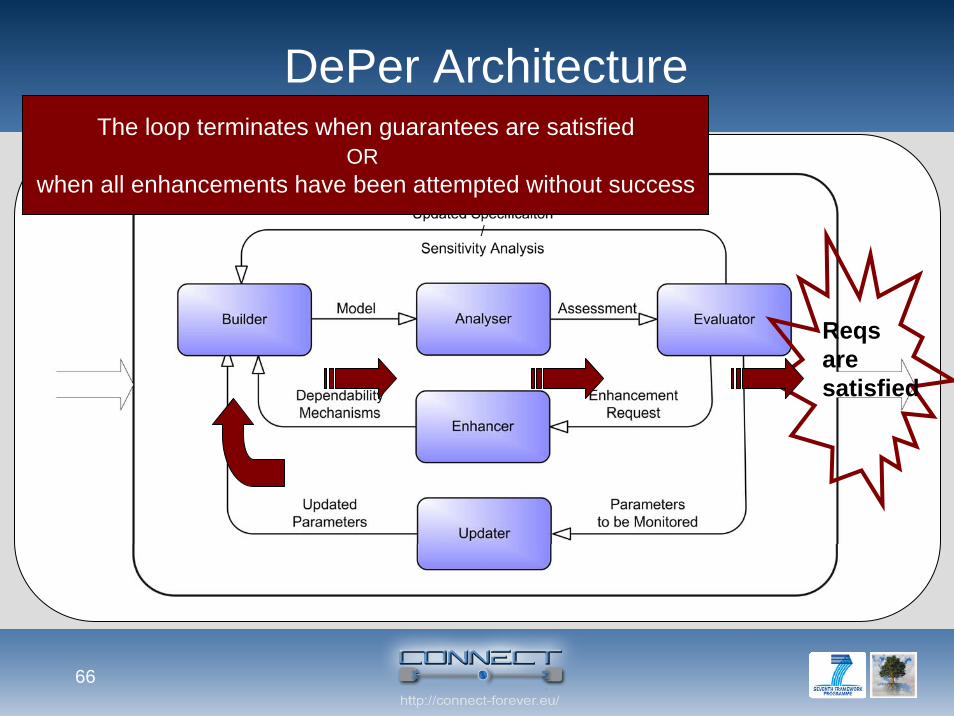
DePer Architecture
Reqsare satisfied!
The loop terminates when guarantees are satisfiedOR
when all enhancements have been attempted without success
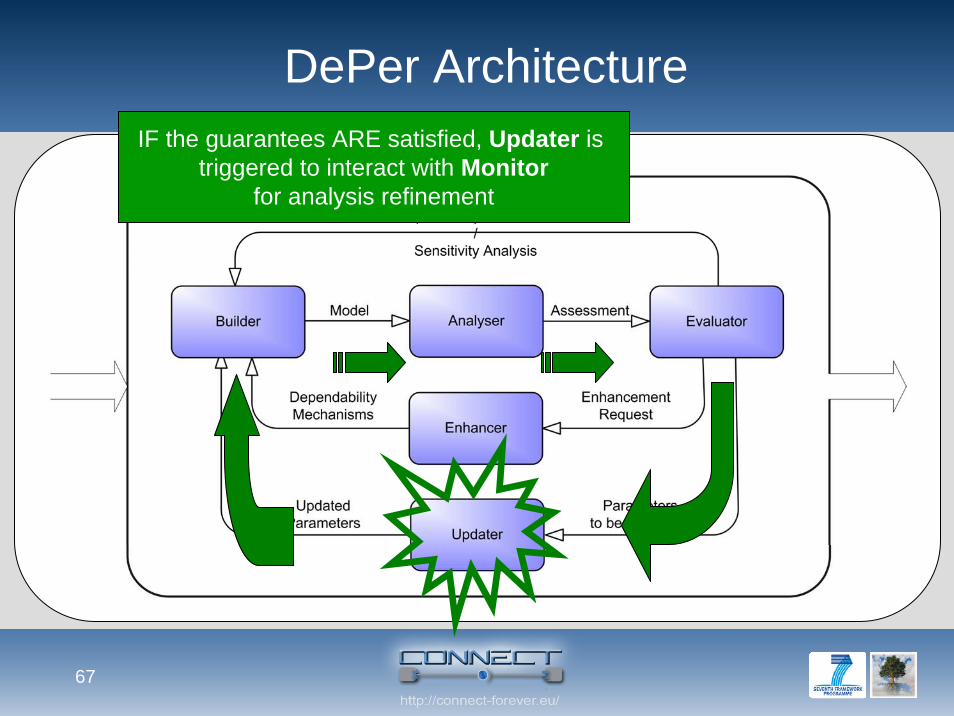
67
DePer ArchitectureIF the guarantees ARE satisfied, Updater is
triggered to interact with Monitorfor analysis refinement
68
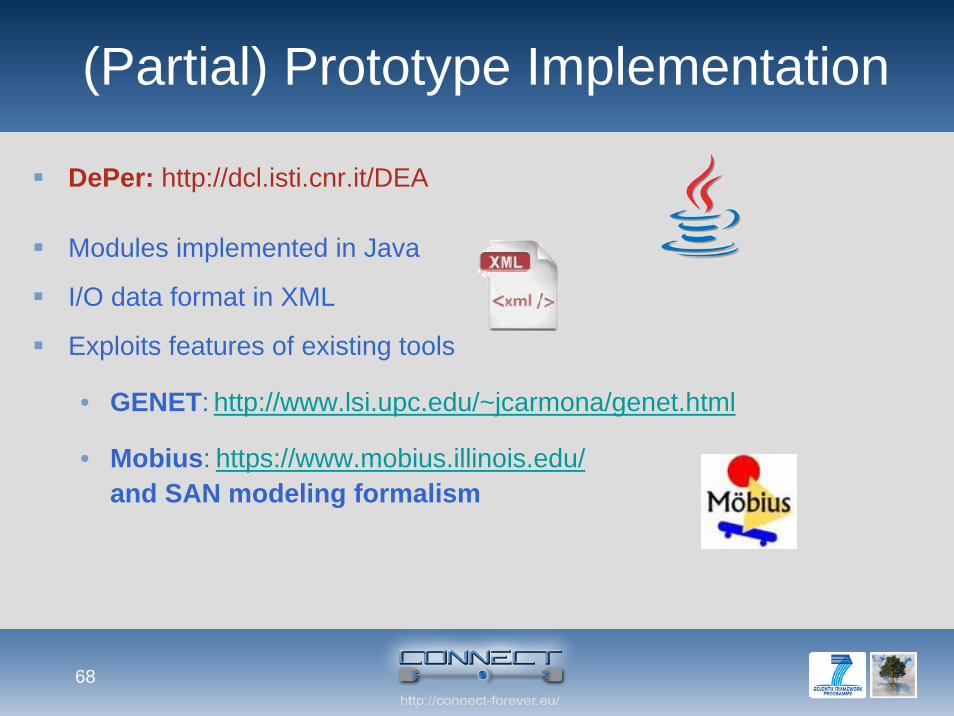
(Partial) Prototype Implementation
DePer: http://dcl.isti.cnr.it/DEA
Modules implemented in Java
I/O data format in XML
Exploits features of existing tools
• GENET: http://www.lsi.upc.edu/~jcarmona/genet.html
• Mobius: https://www.mobius.illinois.edu/and SAN modeling formalism
69
The CONNECTMonitoring Infrastructure
GLIMPSE
70
Monitoring into CONNECT
A CONNECT-transversal functionality supporting on-line assessment for different purposes:
• “assumption monitoring” for CONNECTors• QoS assessment and dependability analysis • learning• security and trust management
71
GLIMPSE solution
GLIMPSE (Generic fLexIble Monitoring based on a
Publish Subscribe infrastructurE)
• flexible, generic, distributed
• based on a publish-subscribe infrastructure
• decouples the high-level event specification from
observation and analysis
72
Model-driven approach
Functional and non functional properties of interest can be specified as
instances of an eCore metamodel
• Advantages
• an editor that users can use for specifying properties and metrics
to be monitorated
• automated procedures (Model2Code transformations) for
instrumenting GLIMPSE
73
CONNECT Property Meta-Model(CPMM)
Ongoing work: CONNECT Property Meta-Model (CPMM) expresses
relevant properties for the project
• prescriptive (required) properties
• The system S in average must respond in 3 ms in executing the e1
operation with a workload of 10 e2 operations
• descriptive (owned) properties
• The system S in average responds in 3 ms in executing the e1
operation with a workload of 10 e2 operations
74
Qualitative properties
• events that are observed and cannot be measured
• e.g., deadlock freeness or liveness
Quantitative properties
• quantiable/measurable observations of the system that have an
associated metric
• e.g., performance measures
The models conforming to CPMM can be used to drive the
instrumentation of the monitoring Enabler
74
CONNECT Property Meta-Model(CPMM)
75
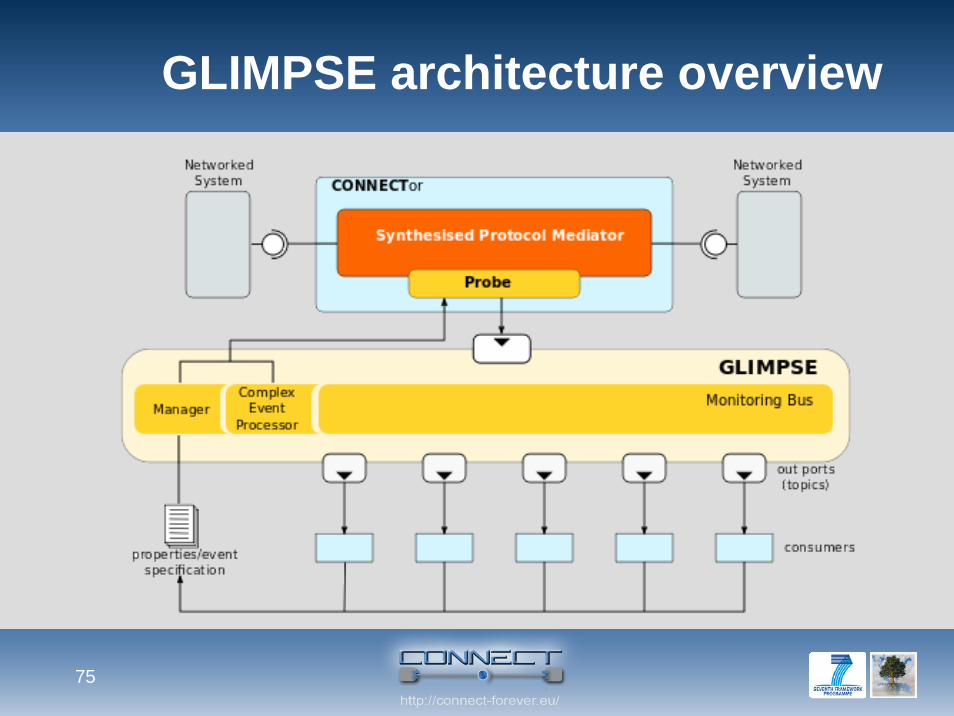
GLIMPSE architecture overview
7676
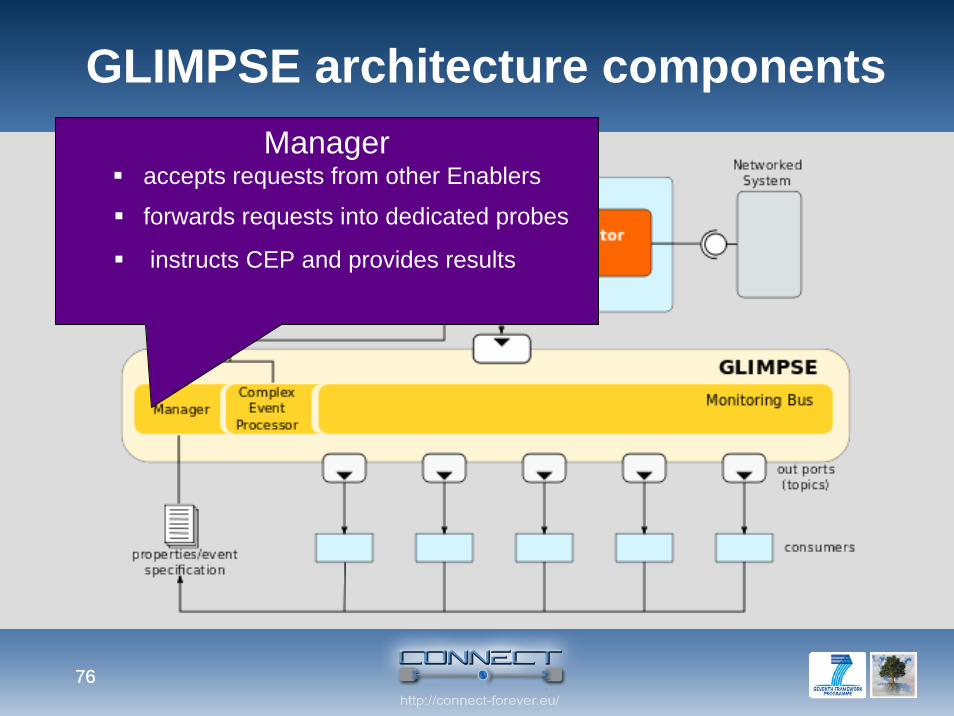
GLIMPSE architecture componentsManager
accepts requests from other Enablers
forwards requests into dedicated probes
instructs CEP and provides results
7777
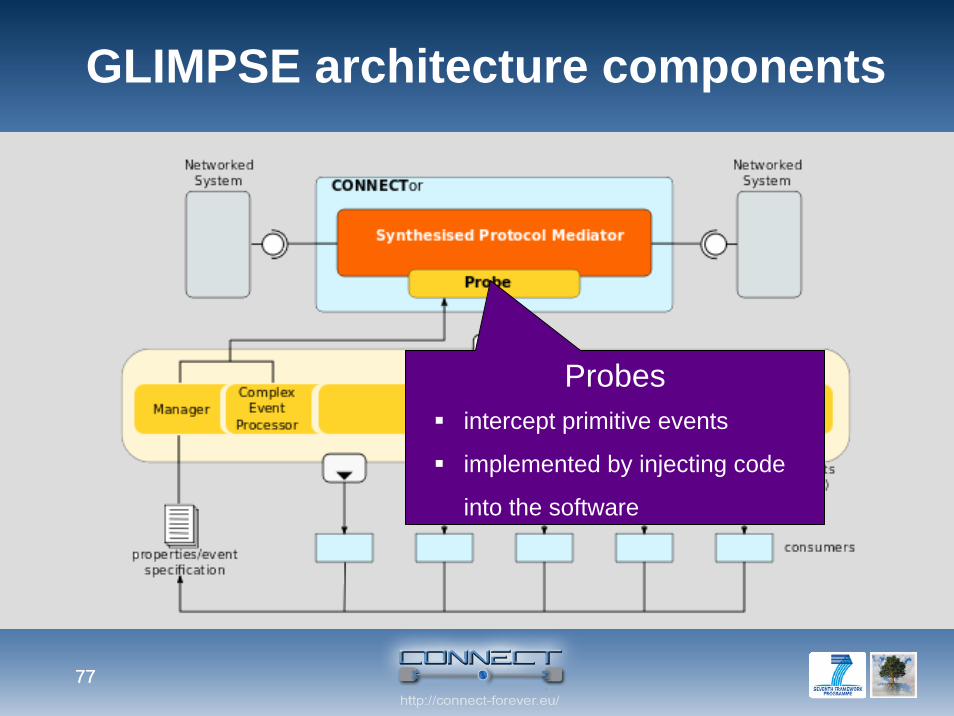
GLIMPSE architecture components
Probesintercept primitive events
implemented by injecting code
into the software
7878
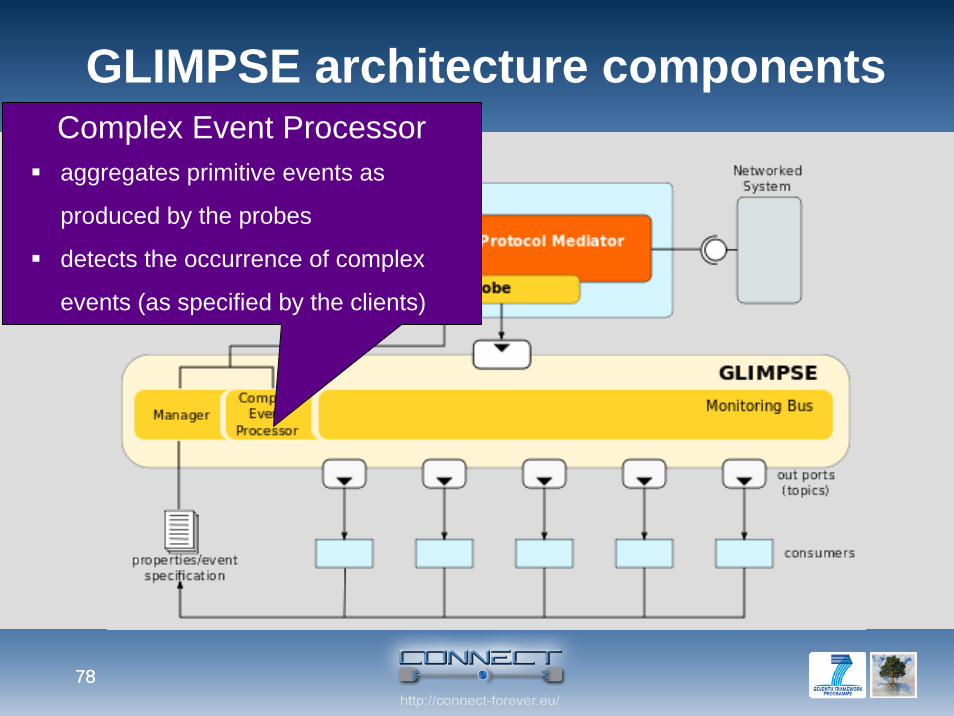
GLIMPSE architecture componentsComplex Event Processoraggregates primitive events as
produced by the probes
detects the occurrence of complex
events (as specified by the clients)
7979
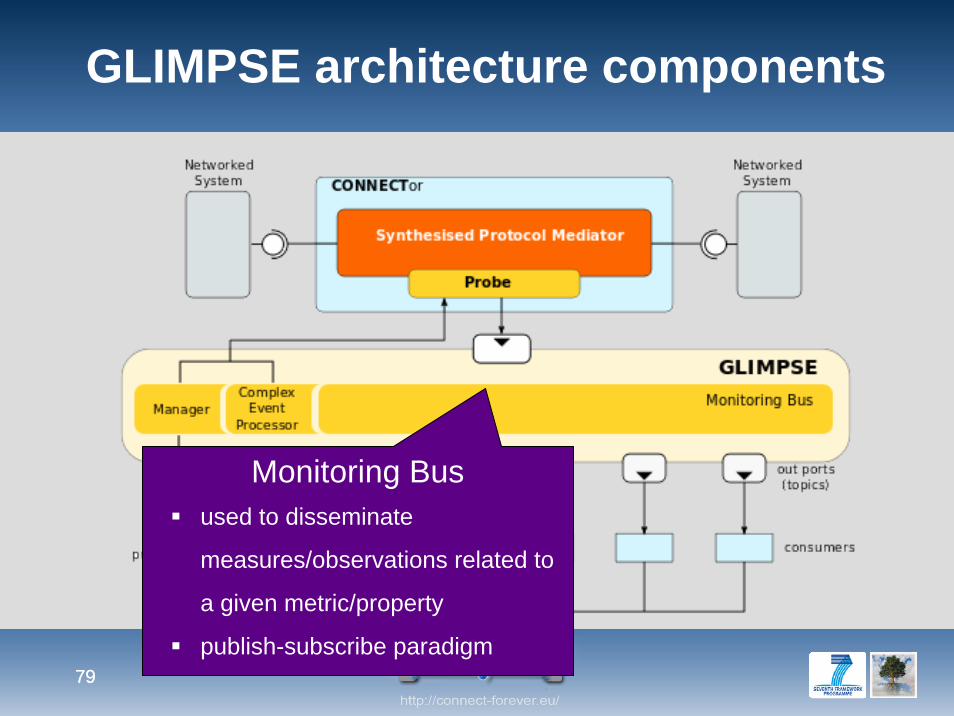
GLIMPSE architecture components
Monitoring Busused to disseminate
measures/observations related to
a given metric/property
publish-subscribe paradigm
8080
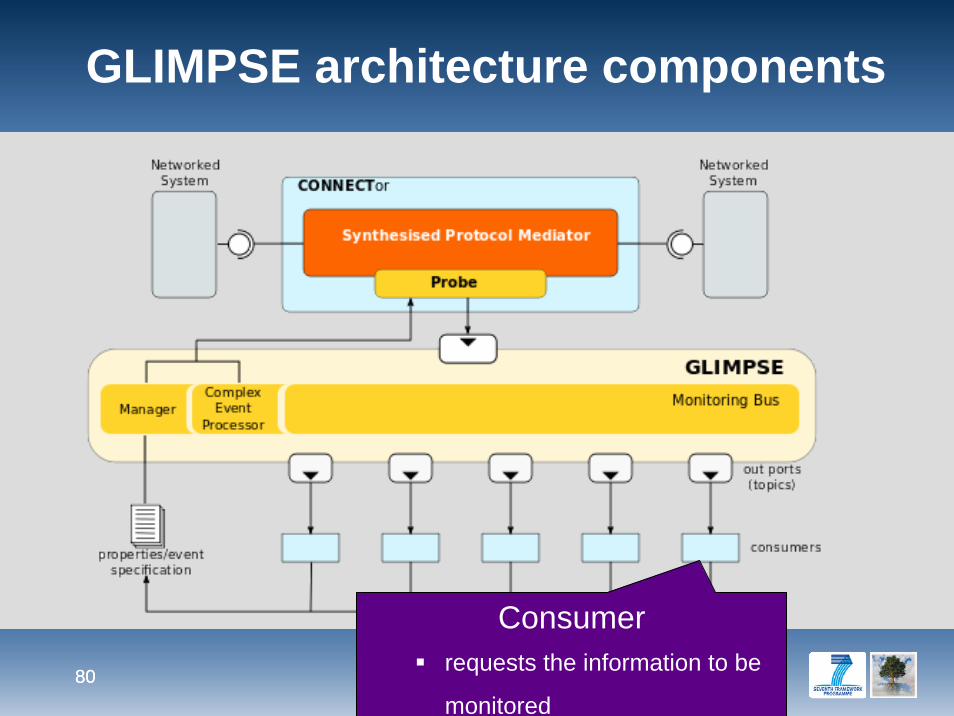
GLIMPSE architecture components
Consumerrequests the information to be
monitored
81
Used Technology
Monitoring Bus
• ServiceMix4
• open source Enterprise Service Bus
• supports an open source message broker like ActiveMQ
Complex Event Processing
• Jboss Drools Fusion
Model-driven tools (Eclipse-based)
• Model transformation languages (ATL, Acceleo)
8282
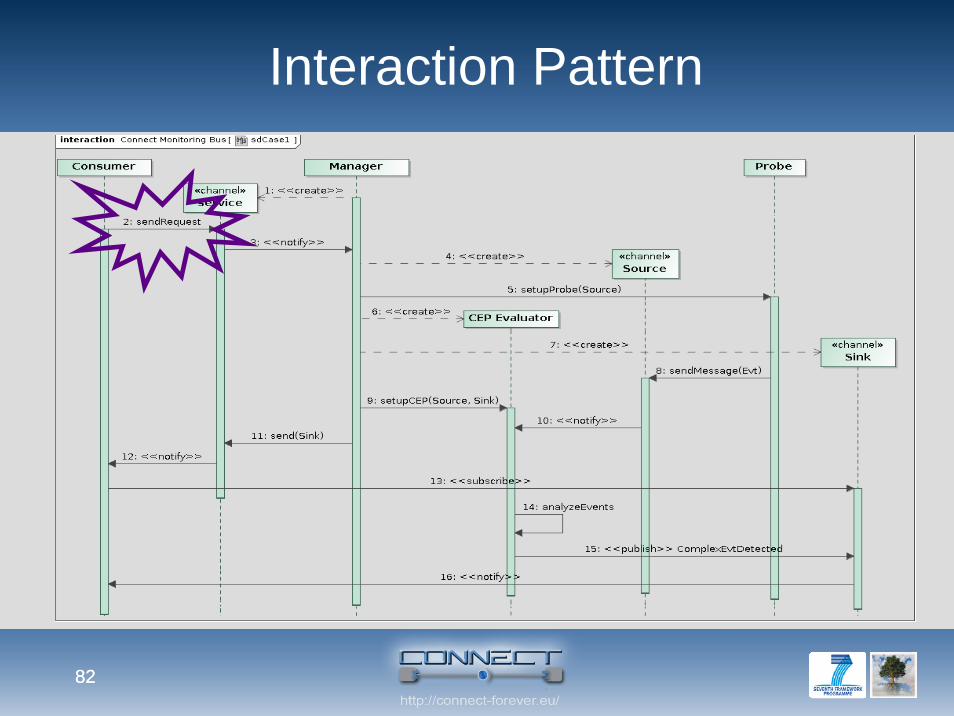
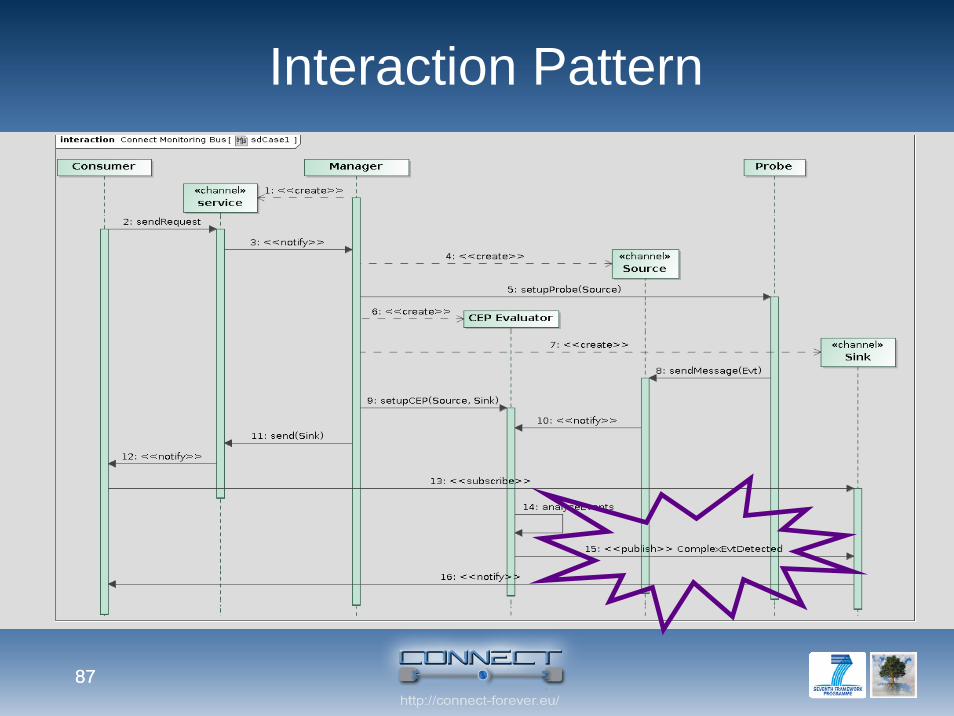
Interaction Pattern
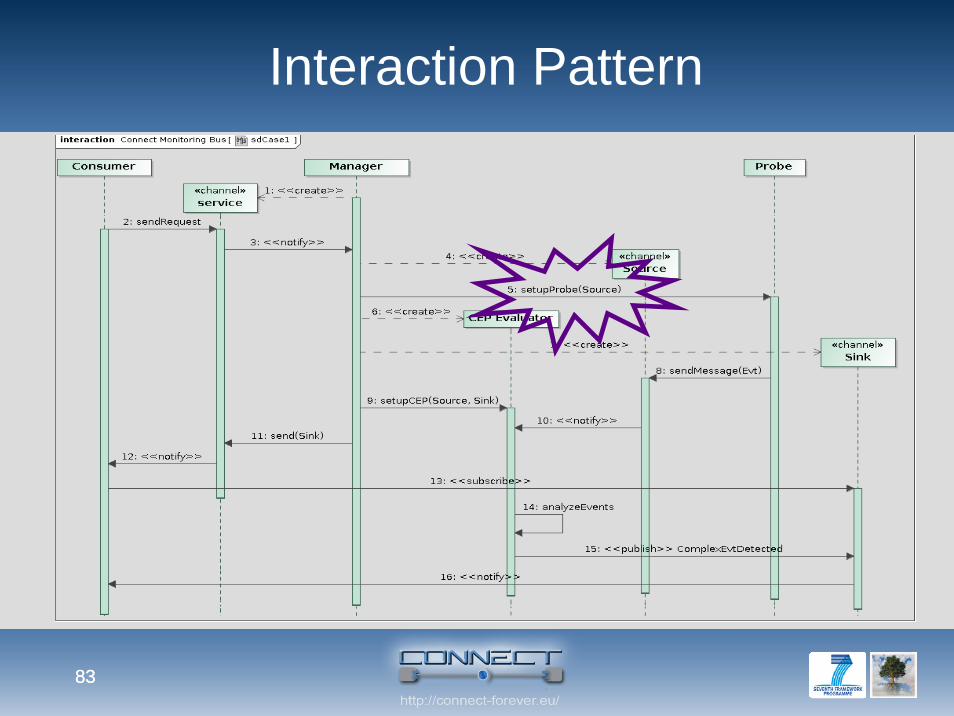
8383
Interaction Pattern
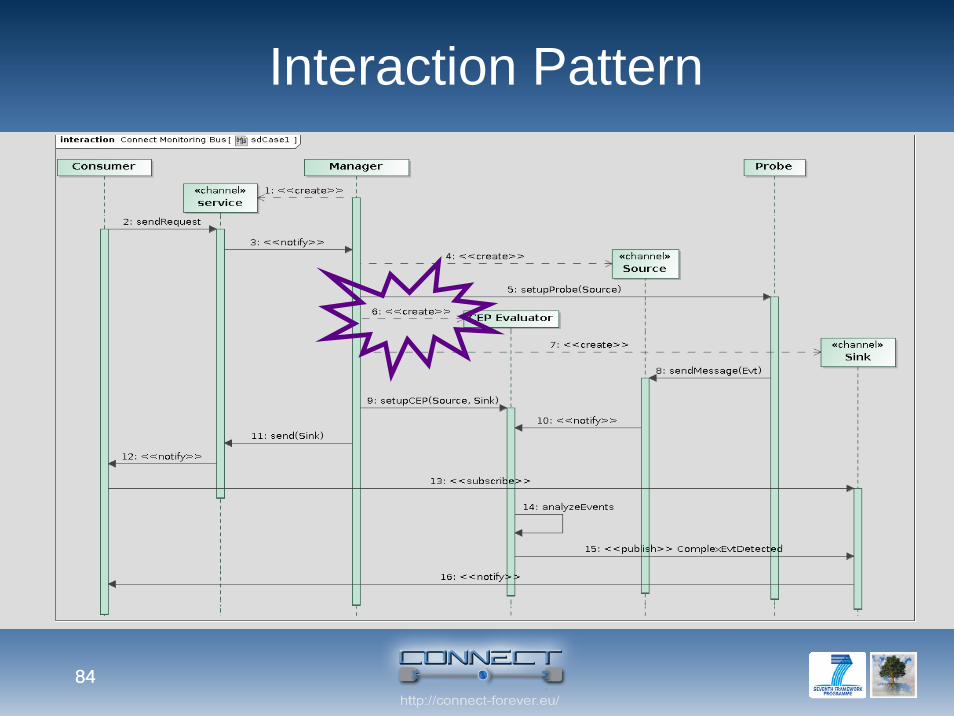
8484
Interaction Pattern
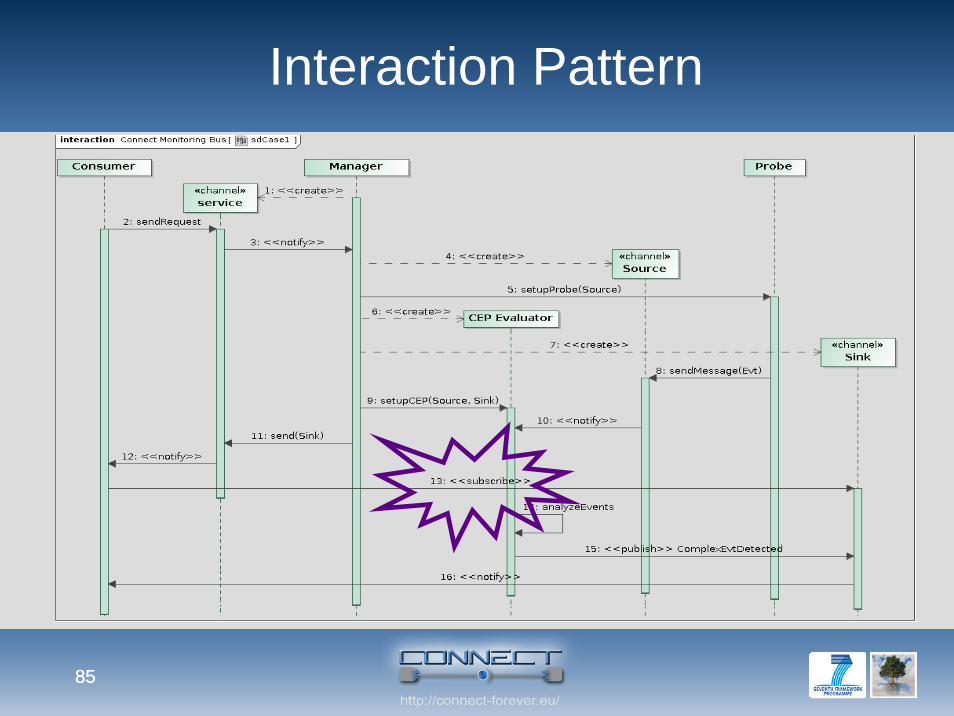
8585
Interaction Pattern
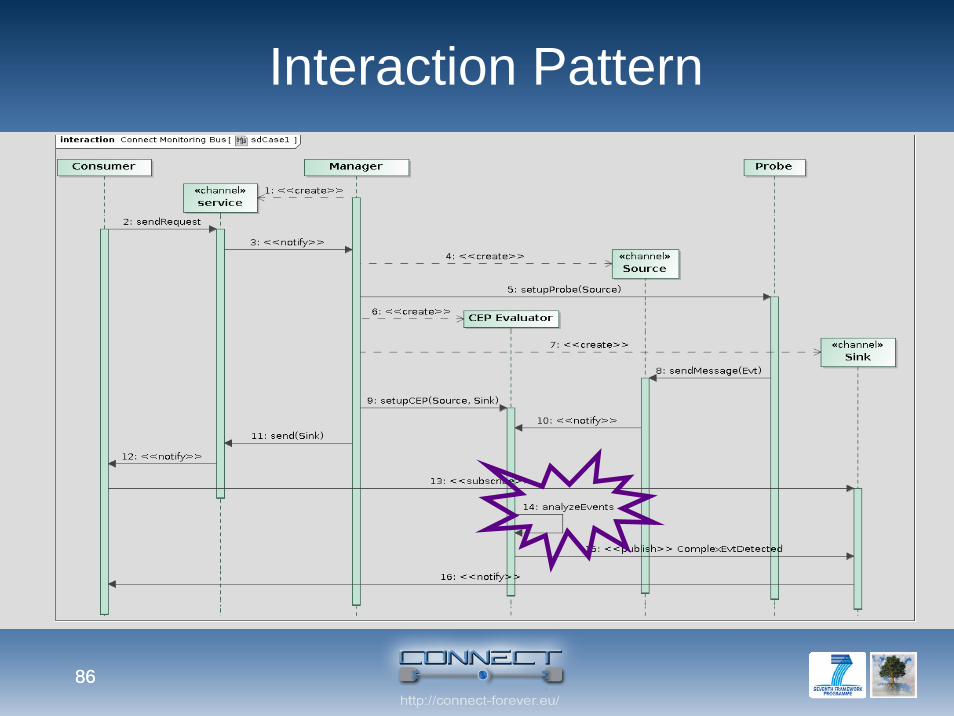
8686
Interaction Pattern
8787
Interaction Pattern
88
Integrated DePer + GLIMPSE
analysis
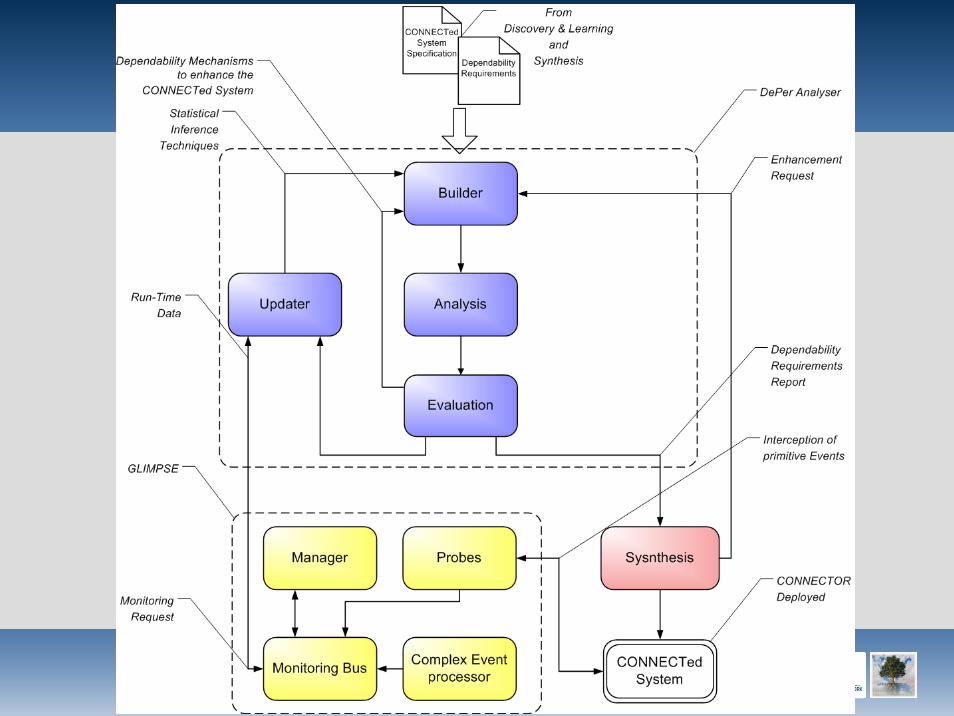
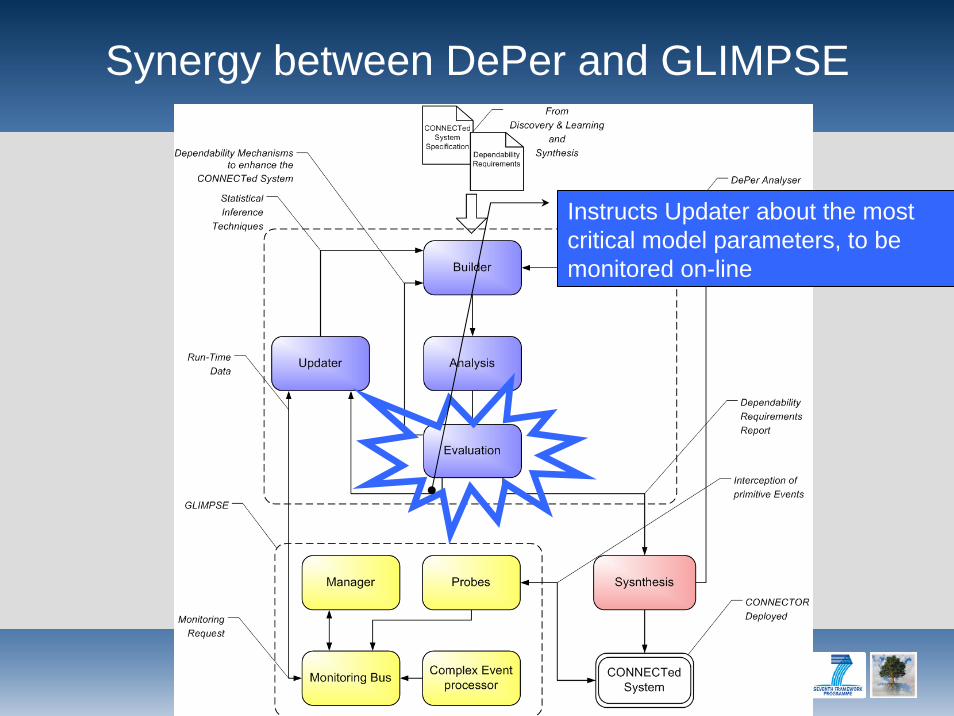
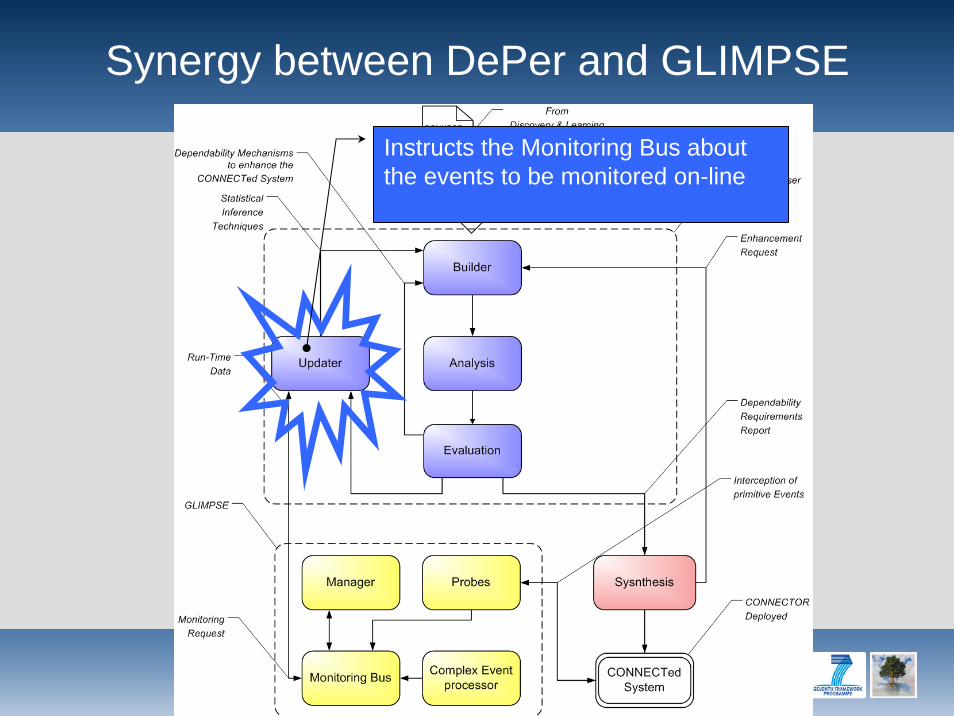
Synergy between DePer and GLIMPSE
Instructs Updater about the most critical model parameters, to be monitored on-line
Synergy between DePer and GLIMPSE
Instructs the Monitoring Bus about the events to be monitored on-line
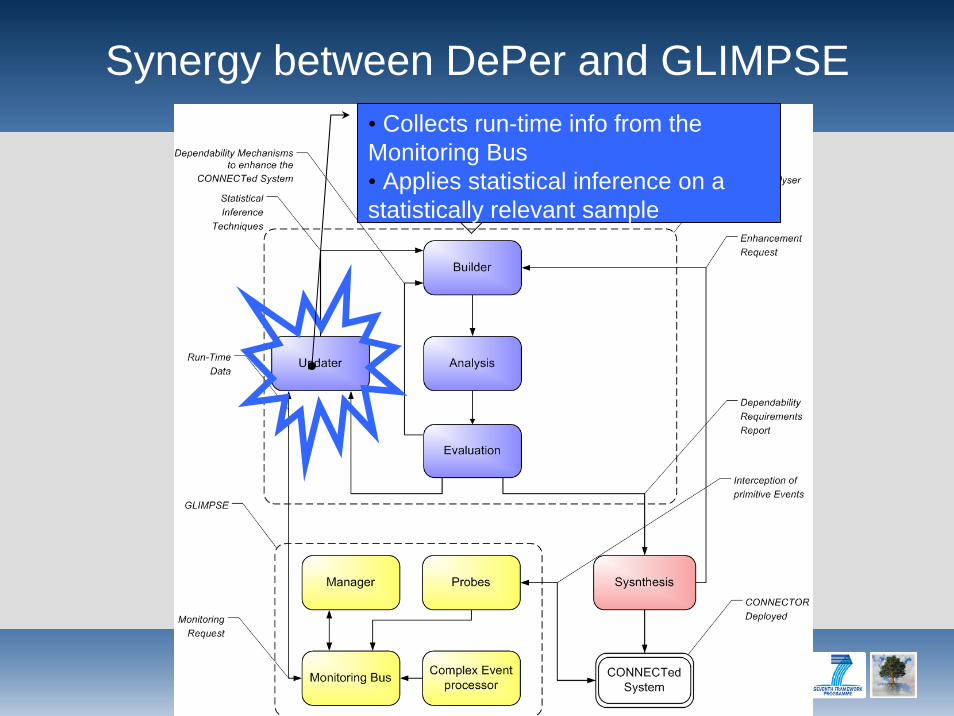
Synergy between DePer and GLIMPSE• Collects run-time info from the Monitoring Bus• Applies statistical inference on a statistically relevant sample
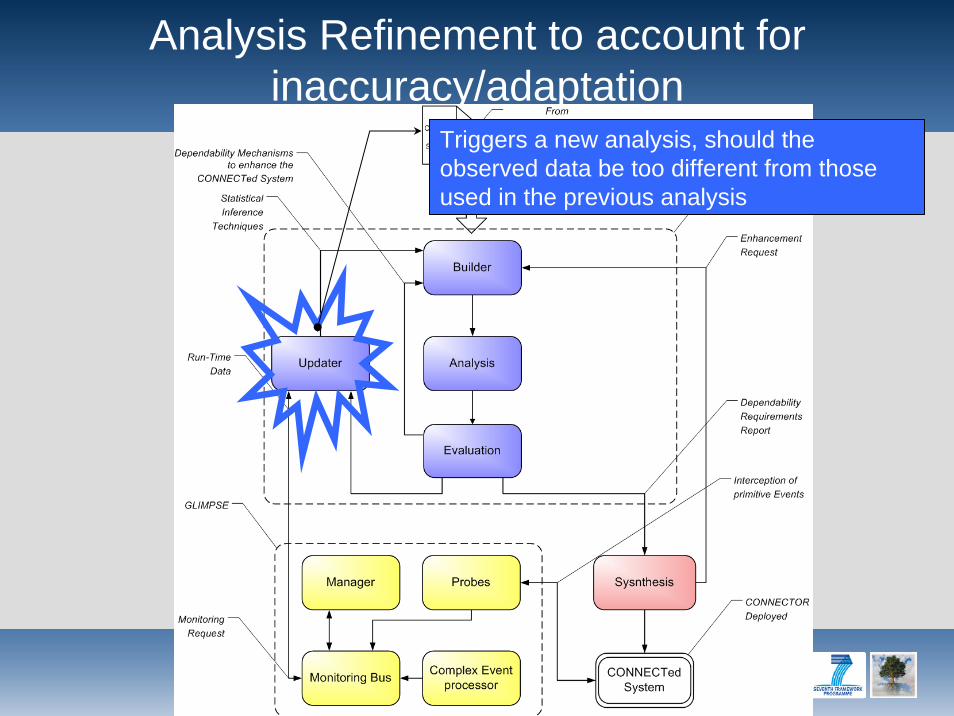
Analysis Refinement to account for inaccuracy/adaptation
Triggers a new analysis, should the observed data be too different from those used in the previous analysis
94
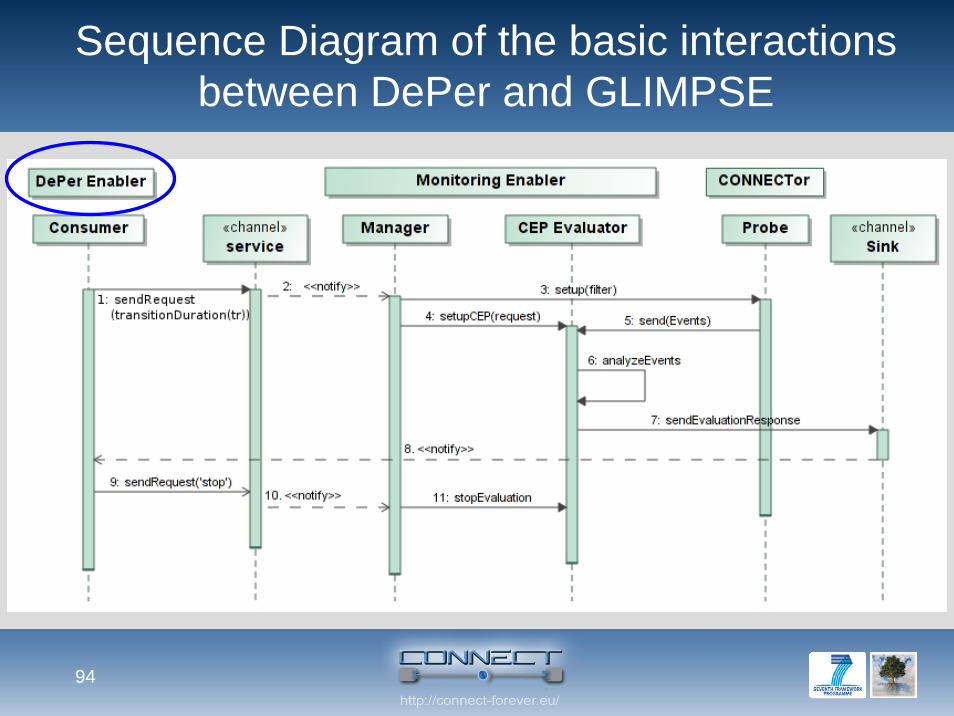
Sequence Diagram of the basic interactions between DePer and GLIMPSE
95
Case Study
9696
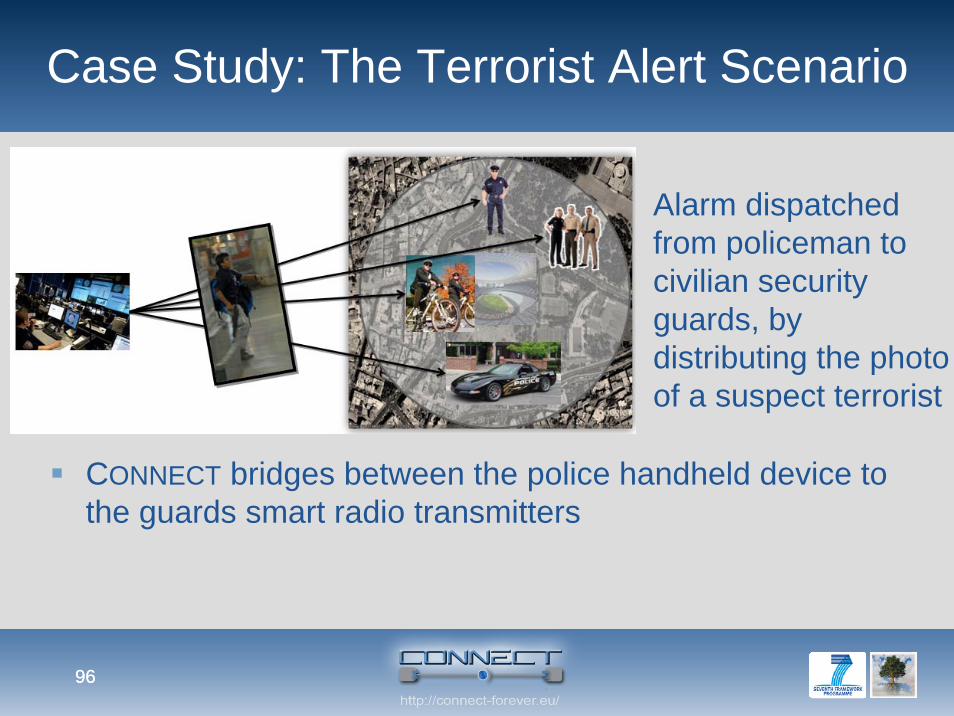
Case Study: The Terrorist Alert Scenario
CONNECT bridges between the police handheld device tothe guards smart radio transmitters
Alarm dispatchedfrom policeman tocivilian security guards, bydistributing the photoof a suspect terrorist
9797
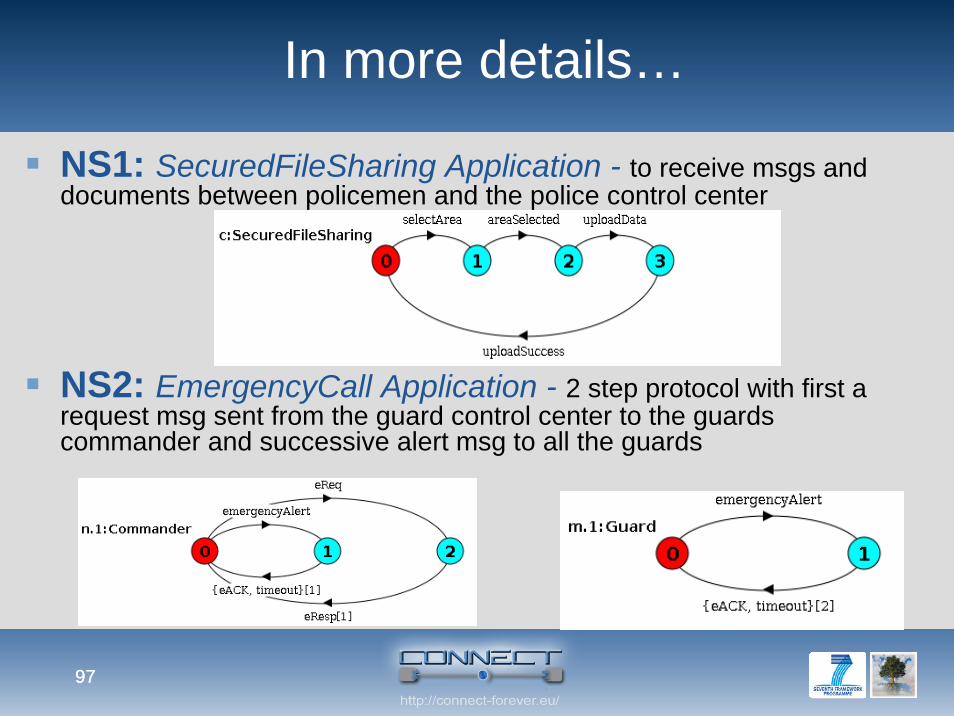
In more details…
NS1: SecuredFileSharing Application - to receive msgs and documents between policemen and the police control center
NS2: EmergencyCall Application - 2 step protocol with first a request msg sent from the guard control center to the guardscommander and successive alert msg to all the guards
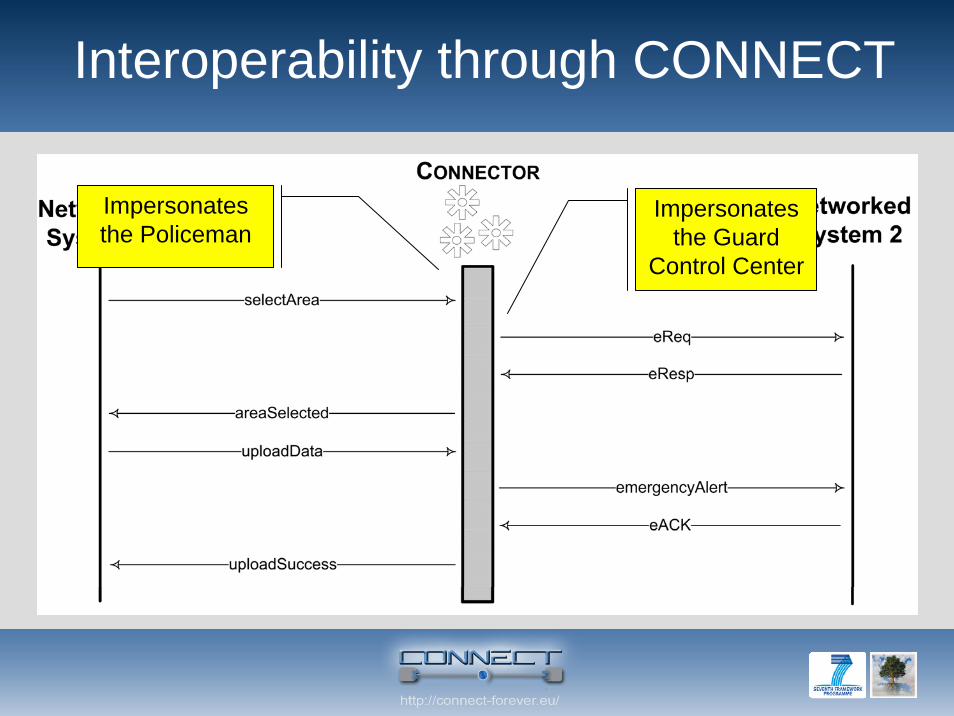
Interoperability through CONNECT
Impersonatesthe Guard
Control Center
Impersonatesthe Policeman
9999
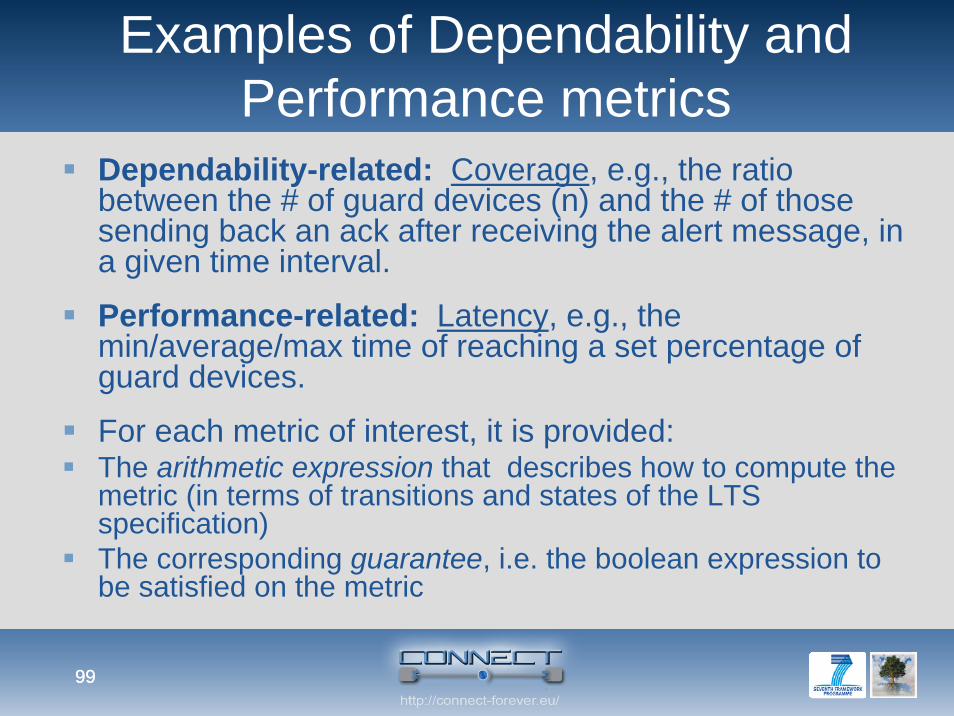
Examples of Dependability and Performance metrics
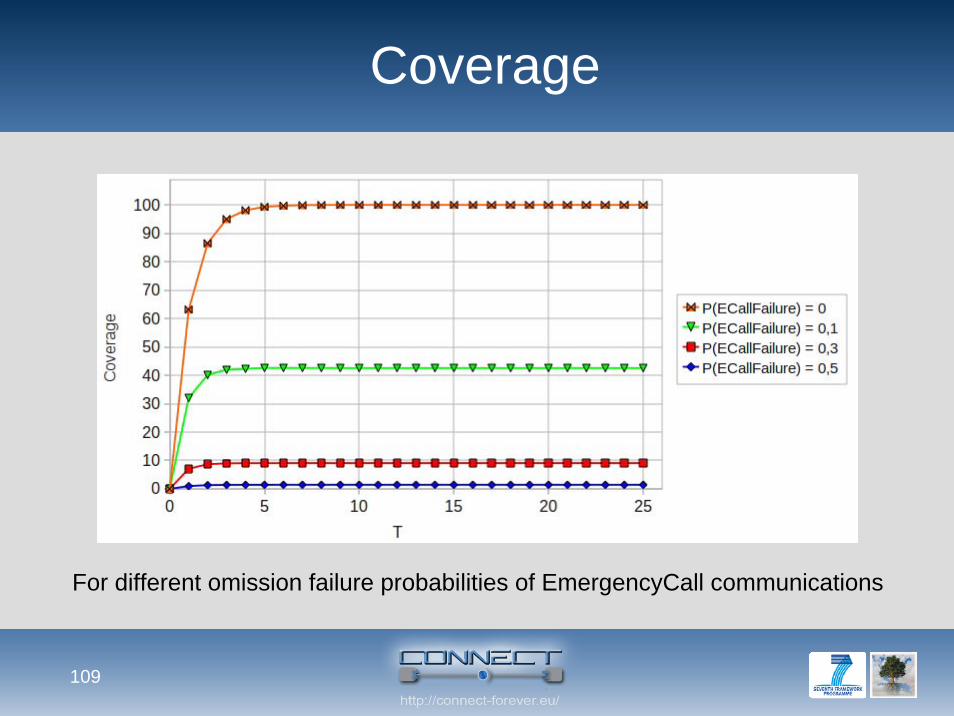
Dependability-related: Coverage, e.g., the ratiobetween the # of guard devices (n) and the # of thosesending back an ack after receiving the alert message, in a given time interval.
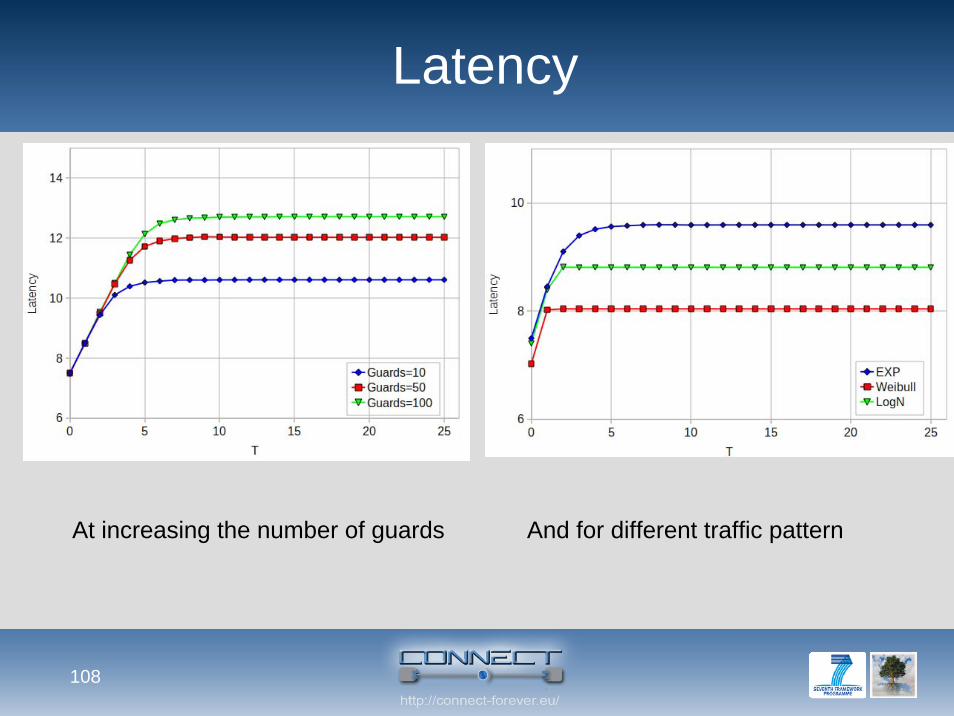
Performance-related: Latency, e.g., the min/average/max time of reaching a set percentage ofguard devices.
For each metric of interest, it is provided:The arithmetic expression that describes how to compute the metric (in terms of transitions and states of the LTS specification)The corresponding guarantee, i.e. the boolean expression tobe satisfied on the metric
100100
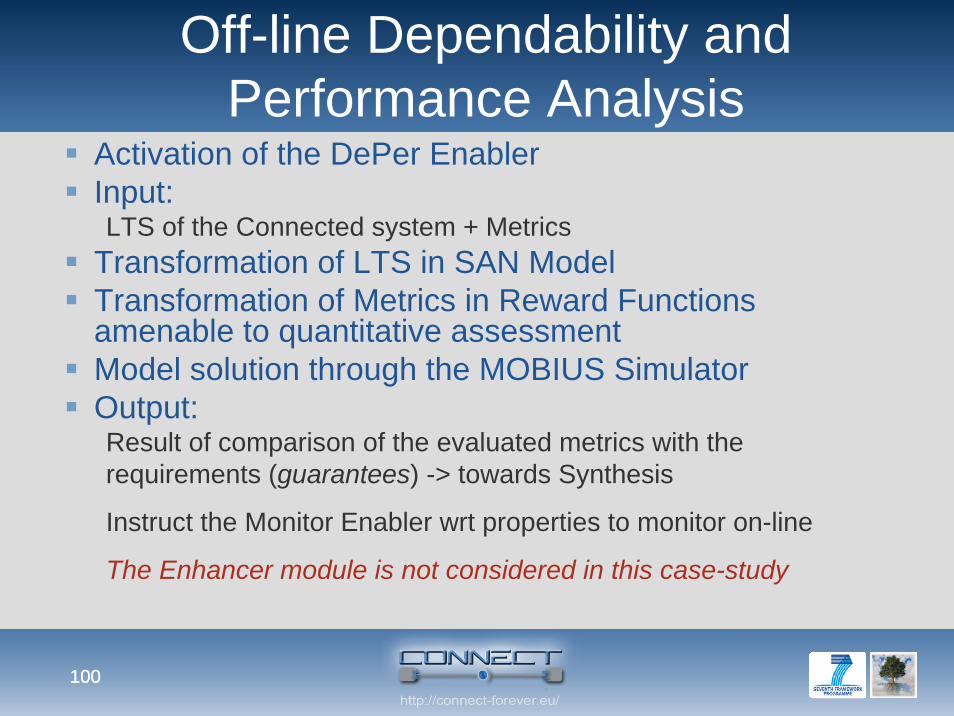
Activation of the DePer EnablerInput:LTS of the Connected system + Metrics
Transformation of LTS in SAN ModelTransformation of Metrics in Reward Functionsamenable to quantitative assessmentModel solution through the MOBIUS SimulatorOutput:Result of comparison of the evaluated metrics with the requirements (guarantees) -> towards Synthesis
Instruct the Monitor Enabler wrt properties to monitor on-line
The Enhancer module is not considered in this case-study
Off-line Dependability and Performance Analysis
101
Stochastic Activity Networks
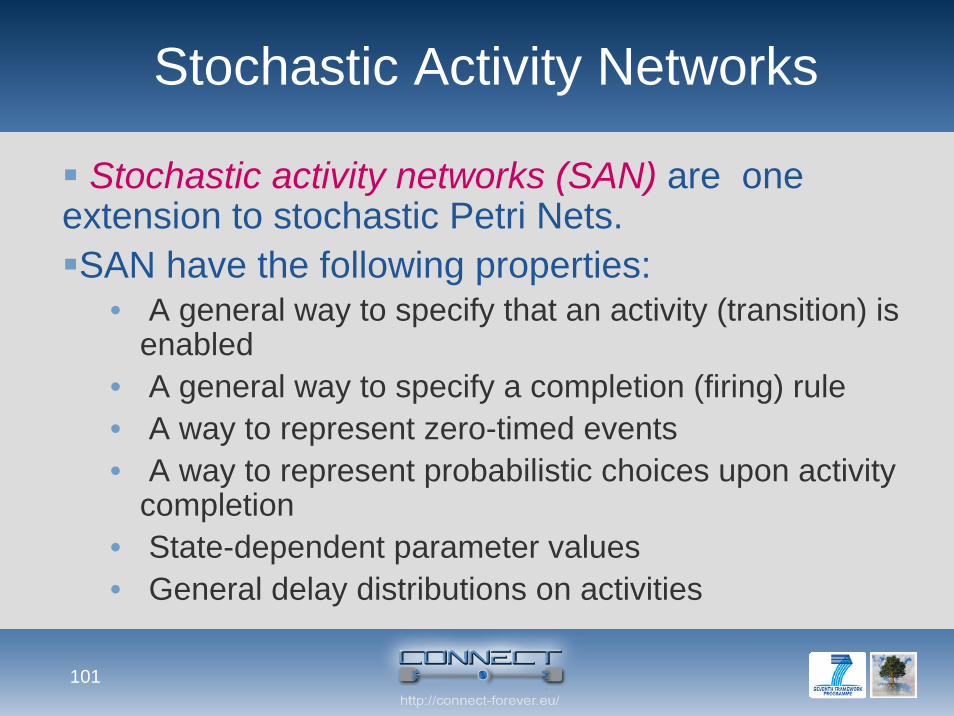
Stochastic activity networks (SAN) are one extension to stochastic Petri Nets.SAN have the following properties:
• A general way to specify that an activity (transition) is enabled
• A general way to specify a completion (firing) rule• A way to represent zero-timed events• A way to represent probabilistic choices upon activity
completion• State-dependent parameter values• General delay distributions on activities
102
SAN Symbols
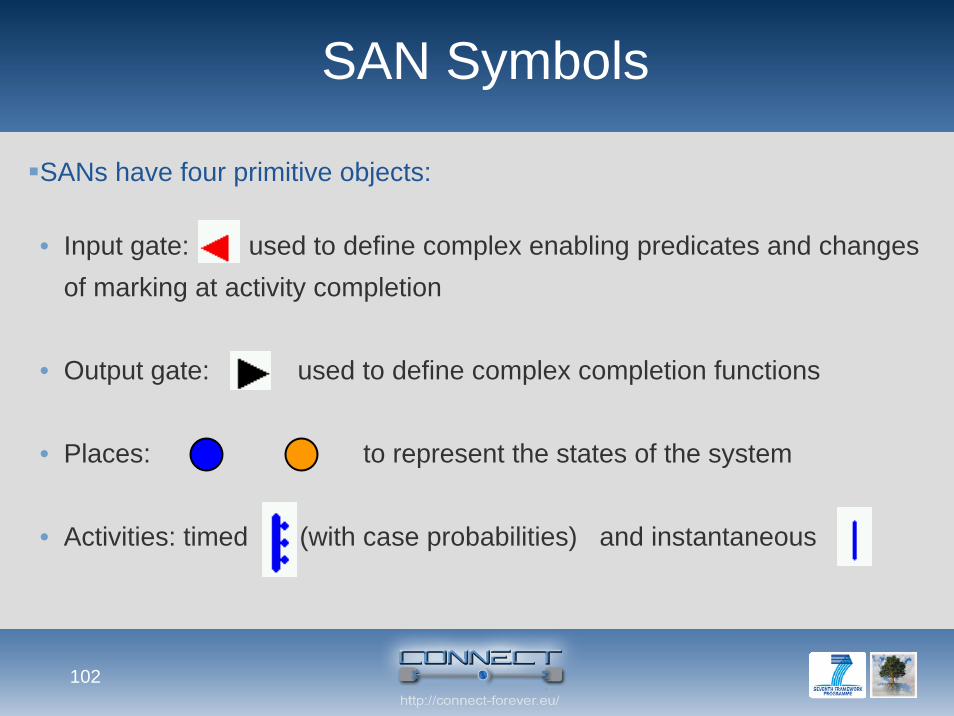
SANs have four primitive objects:
• Input gate: used to define complex enabling predicates and changes of marking at activity completion
• Output gate: used to define complex completion functions
• Places: to represent the states of the system
• Activities: timed (with case probabilities) and instantaneous
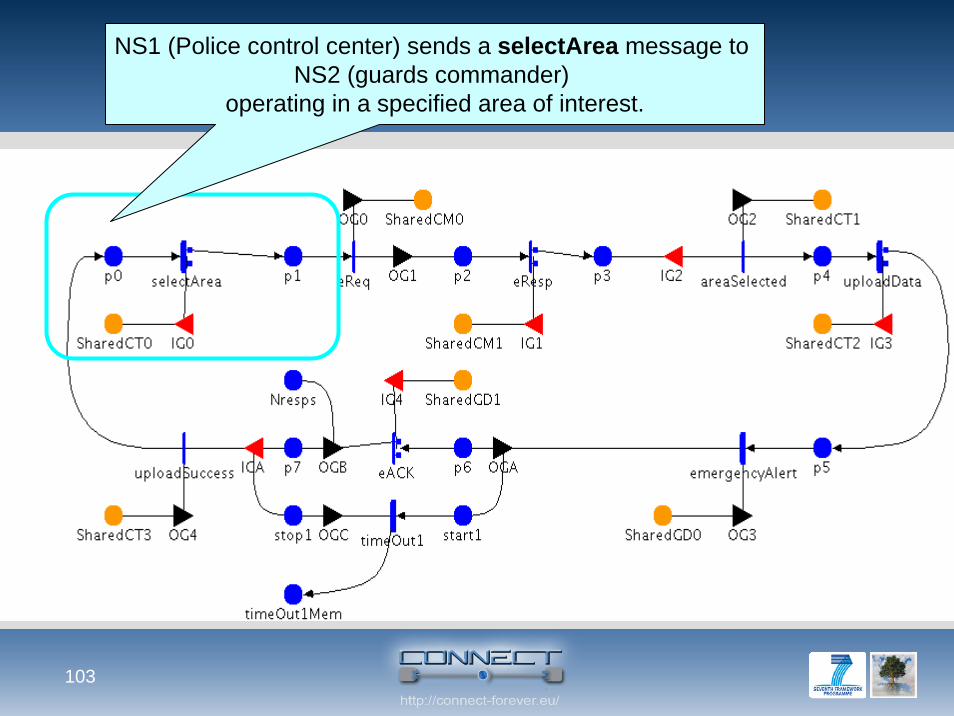
103
SAN of the CONNECTorNS1 (Police control center) sends a selectArea message toNS2 (guards commander)
operating in a specified area of interest.
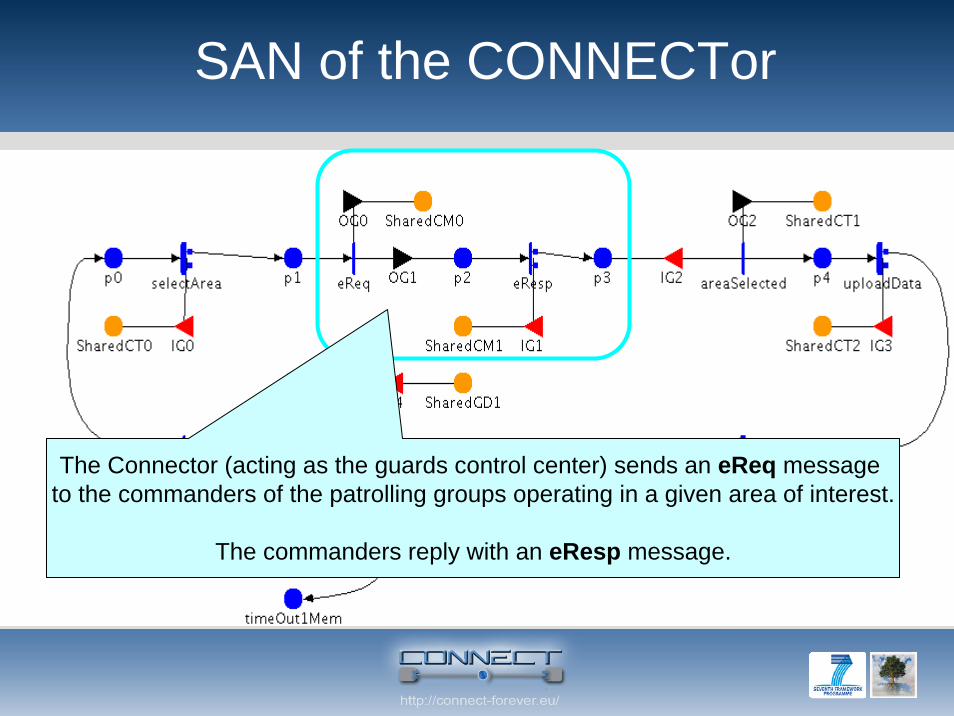
SAN of the CONNECTor
The Connector (acting as the guards control center) sends an eReq messageto the commanders of the patrolling groups operating in a given area of interest.
The commanders reply with an eResp message.
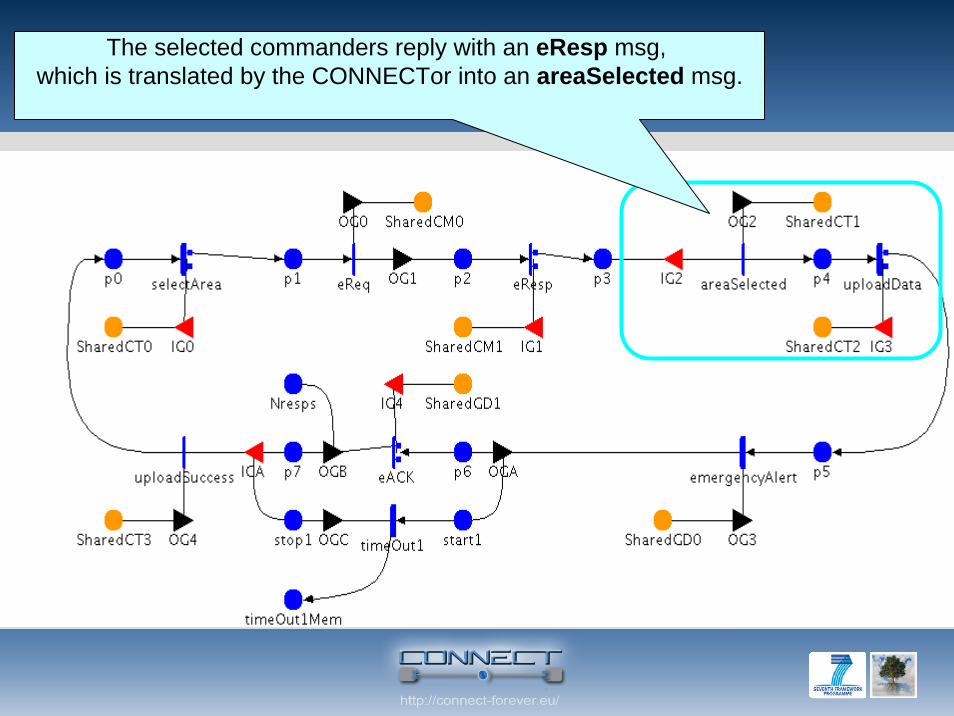
The selected commanders reply with an eResp msg, which is translated by the CONNECTor into an areaSelected msg.
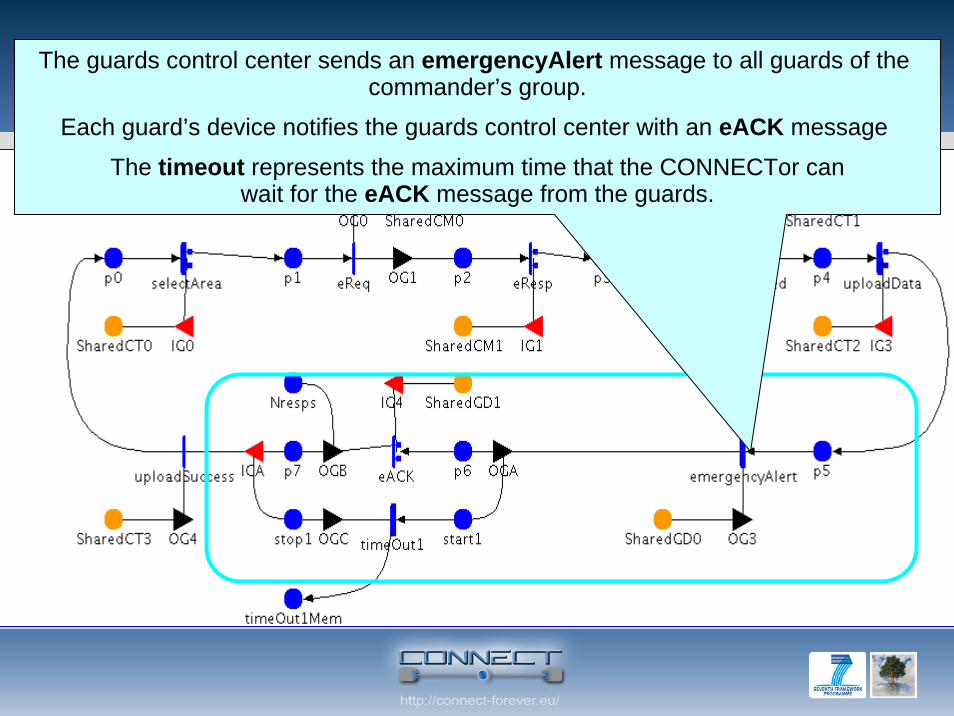
The guards control center sends an emergencyAlert message to all guards of the commander’s group.
Each guard’s device notifies the guards control center with an eACK message
The timeout represents the maximum time that the CONNECTor canwait for the eACK message from the guards.
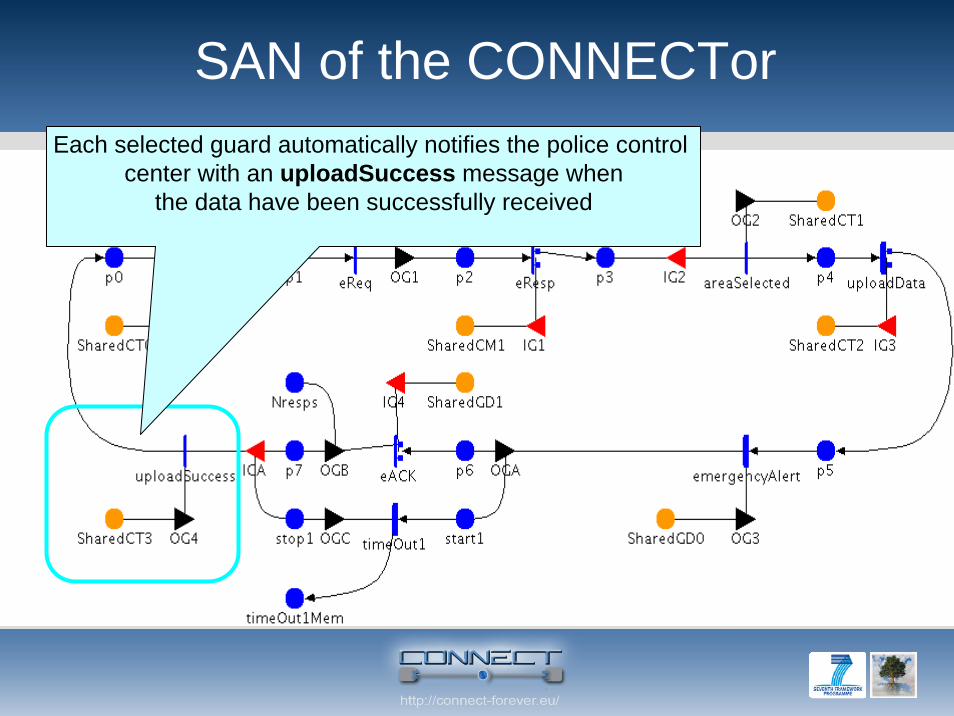
Each selected guard automatically notifies the police control center with an uploadSuccess message when
the data have been successfully received
SAN of the CONNECTor
108
Latency
At increasing the number of guards And for different traffic pattern
109
Coverage
For different omission failure probabilities of EmergencyCall communications