Embed Size (px)
Citation preview

DOT HS 811 732 April 2013
Depiction of Priority Light-Vehicle Pre-Crash Scenarios for Safety Applications Based on Vehicle-to-Vehicle Communications

DISCLAIMER
This publication is distributed by the U.S. Department of Transportation, National Highway Traffic Safety Administration, in the interest of information exchange. The opinions, findings, and conclusions expressed in this publication are those of the authors and not necessarily those of the Department of Transportation or the National Highway Traffic Safety Administration. The United States Government assumes no liability for its contents or use thereof. If trade names, manufacturers’ names, or specific products are mentioned, it is because they are considered essential to the object of the publication and should not be construed as an endorsement. The United States Government does not endorse products or manufacturers.

i
REPORT DOCUMENTATION PAGE Form Approved
OMB No. 0704-0188
Public reporting burden for this collection of information is estimated to average 1 hour per response, including the time for reviewing instructions, searching existing data sources, gathering and maintaining the data needed, and completing and reviewing the collection of information. Send comments regarding this burden estimate or any other aspect of this collection of information, including suggestions for reducing this burden, to Washington Headquarters Services, Directorate for Information Operations and Reports, 1215 Jefferson Davis Highway, Suite 1204, Arlington, VA 22202-4302, and to the Office of Management and Budget, Paperwork Reduction Project (0704-0188), Washington, DC 20503.
1. AGENCY USE ONLY (Leave blank)
2. REPORT DATE
April 2013
3. REPORT TYPE AND DATES COVERED
August 2009 – February 2011
4. TITLE AND SUBTITLE
Depiction of Priority Light-Vehicle Pre-Crash Vehicle-to-Vehicle Communications
Scenarios for Safety Applications Based on
5. FUNDING NUMBERS
Inter-Agency Agreement
HS-60A1
DTNH22-09-V-00030 6. AUTHOR(S)
Wassim G. Najm, Samuel Toma, and John Brewer
7. PERFORMING ORGANIZATION NAME(S) AND ADDRESS(ES)
U.S. Department of Transportation Research and Innovative Technology Administration John A. Volpe National Transportation Systems Center Cambridge, MA 02142
8. PERFORMING ORGANIZATION REPORT NUMBER
9. SPONSORING/MONITORING AGENCY NAME(S) AND ADDRESS(ES)
John Harding U.S. Department of Transportation National Highway Traffic Safety Administration 1200 New Jersey Avenue SE. Washington, DC 20590
10. SPONSORING/MONITORING AGENCY REPORT NUMBER
DOT HS 811 732
DOT-VNTSC-NHTSA-11-12
11. SUPPLEMENTARY NOTES
12a. DISTRIBUTION/AVAILABILITY STATEMENT
Document is available to the public from the National Technical Information Service www.ntis.gov
12b. DISTRIBUTION CODE
13. ABSTRACT
A template of pre-crash scenarios is presented to depict national crash statistics and kinematic information of time-to-collision for the design of appropriate crash countermeasures based on vehicle-to-vehicle (V2V) communications. This template serves the development of functional requirements, performance specifications, test procedures, and benefits estimation for potential light-vehicle V2V safety applications. A set of ten pre-crash scenarios is suggested as a priority list to be addressed by V2V technology for light vehicles (i.e., passenger cars, vans and minivans, sport utility vehicles, and light pickup trucks with gross vehicle weight ratings of 10,000 pounds or less). This report presents the time-to-collision equations as well as the crash statistics for each of the ten priority scenarios based on data available in the General Estimates System, National Motor Vehicle Crash Causation Survey, and Event Data Recorder databases. 14. SUBJECT TERMS
Safety Applications, Intelligent Transportation Systems, light vehicles, vehicle-to-vehicle communications, crash avoidance, General Estimates System, National Motor Vehicle Crash Causation Survey, Event Data Recorder, pre-crash scenarios, crash causes, crash contributing factors, and kinematic data.
15. NUMBER OF PAGES
79
16. PRICE CODE
17. SECURITY CLASSIFICATION OF REPORT
Unclassified
18. SECURITY CLASSIFICATION OF THIS PAGE
Unclassified
19. SECURITY CLASSIFICATION OF ABSTRACT
Unclassified
20. LIMITATION OF ABSTRACT
NSN
7540-01-280-5500 Standard Form 298 (Rev. 2-89) Prescribed by ANSI Std. 239-18
298-102

ii
QUICK INCH - CENTIMETER LENGTH CONVERSION10 2 3 4 5
InchesCentimeters 0 1 3 4 52 6 1110987 1312
METRIC/ENGLISH CONVERSION FACTORS ENGLISH TO METRIC METRIC TO ENGLISH
LENGTH (APPROXIMATE)
1 inch (in) = 2.5 centimeters (cm) 1 foot (ft) = 30 centimeters (cm)
1 yard (yd) = 0.9 meter (m) 1 mile (mi) = 1.6 kilometers (km)
LENGTH (APPROXIMATE)
1 millimeter (mm) = 0.04 inch (in) 1 centimeter (cm) = 0.4 inch (in)
1 meter (m) = 3.3 feet (ft) 1 meter (m) = 1.1 yards (yd)
1 kilometer (km) = 0.6 mile (mi)
AREA (APPROXIMATE)
1 square inch (sq in, in2) = 6.5 square centimeters (cm2)
1 square foot (sq ft, ft2) = 0.09 square meter (m2)
1 square yard (sq yd, yd2) = 0.8 square meter (m2) 1 square mile (sq mi, mi2) = 2.6 square kilometers
(km2) 1 acre = 0.4 hectare (he) = 4,000 square meters (m2)
AREA (APPROXIMATE)
1 square centimeter (cm2) = 0.16 square inch (sq in, in2)
1 square meter (m2) = 1.2 square yards (sq yd, yd2)
1 square kilometer (km2) = 0.4 square mile (sq mi, mi2) 10,000 square meters (m2) = 1 hectare (ha) = 2.5 acres
MASS - WEIGHT (APPROXIMATE)
1 ounce (oz) = 28 grams (gm) 1 pound (lb) = 0.45 kilogram (kg)
1 short ton = 2,000 = 0.9 tonne (t) pounds (lb)
MASS - WEIGHT (APPROXIMATE)
1 gram (gm) = 0.036 ounce (oz) 1 kilogram (kg) = 2.2 pounds (lb)
1 tonne (t) = 1,000 kilograms (kg) = 1.1 short tons
VOLUME (APPROXIMATE)
1 teaspoon (tsp) = 5 milliliters (ml) 1 tablespoon (tbsp) = 15 milliliters (ml) 1 fluid ounce (fl oz) = 30 milliliters (ml)
1 cup (c) = 0.24 liter (l) 1 pint (pt) = 0.47 liter (l)
1 quart (qt) = 0.96 liter (l) 1 gallon (gal) = 3.8 liters (l)
1 cubic foot (cu ft, ft3) = 0.03 cubic meter (m3) 1 cubic yard (cu yd, yd3) = 0.76 cubic meter (m3)
VOLUME (APPROXIMATE)
1 milliliter (ml) = 0.03 fluid ounce (fl oz) 1 liter (l) = 2.1 pints (pt) 1 liter (l) = 1.06 quarts (qt) 1 liter (l) = 0.26 gallon (gal)
1 cubic meter (m3) = 36 cubic feet (cu ft, ft3) 1 cubic meter (m3) = 1.3 cubic yards (cu yd, yd3)
TEMPERATURE (EXACT)
[(x-32)(5/9)] °F = y °C
TEMPERATURE (EXACT)
[(9/5) y + 32] °C = x °F
iii
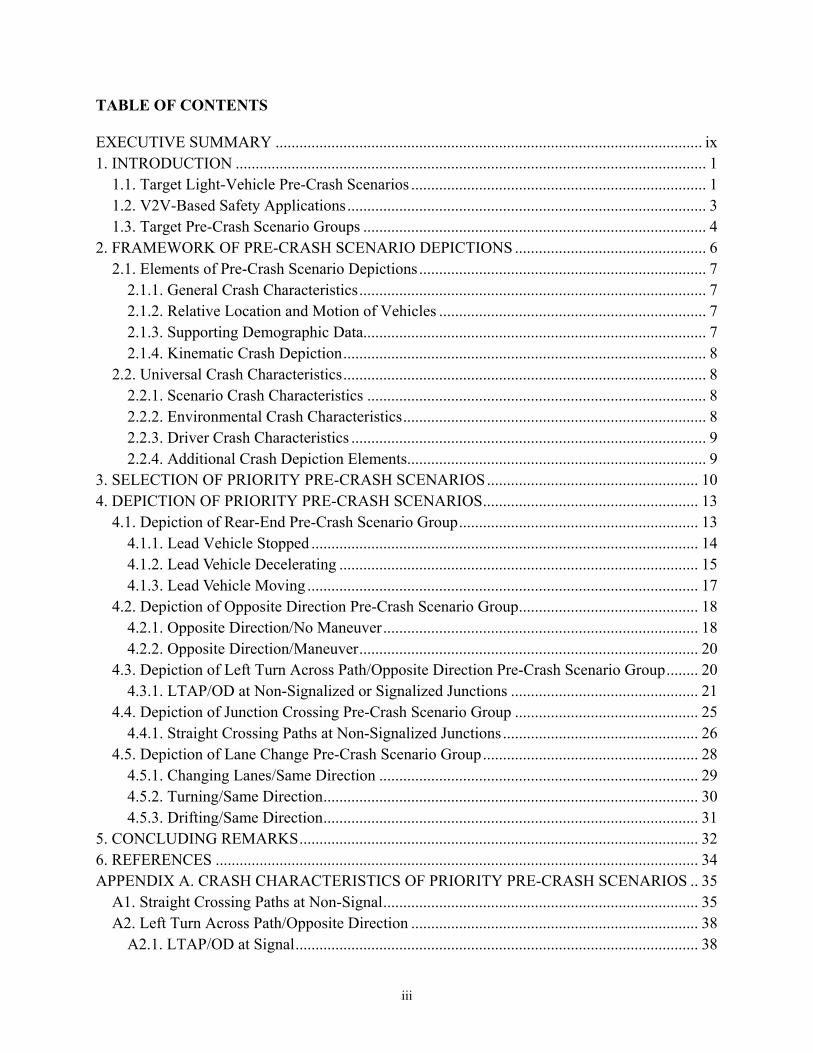
TABLE OF CONTENTS
EXECUTIVE SUMMARY ........................................................................................................... ix 1. INTRODUCTION ...................................................................................................................... 1
1.1. Target Light-Vehicle Pre-Crash Scenarios .......................................................................... 1 1.2. V2V-Based Safety Applications .......................................................................................... 3 1.3. Target Pre-Crash Scenario Groups ...................................................................................... 4
2. FRAMEWORK OF PRE-CRASH SCENARIO DEPICTIONS ................................................ 6 2.1. Elements of Pre-Crash Scenario Depictions ........................................................................ 7
2.1.1. General Crash Characteristics ....................................................................................... 7 2.1.2. Relative Location and Motion of Vehicles ................................................................... 7 2.1.3. Supporting Demographic Data...................................................................................... 7 2.1.4. Kinematic Crash Depiction ........................................................................................... 8
2.2. Universal Crash Characteristics ........................................................................................... 8 2.2.1. Scenario Crash Characteristics ..................................................................................... 8 2.2.2. Environmental Crash Characteristics ............................................................................ 8 2.2.3. Driver Crash Characteristics ......................................................................................... 9 2.2.4. Additional Crash Depiction Elements........................................................................... 9
3. SELECTION OF PRIORITY PRE-CRASH SCENARIOS ..................................................... 10 4. DEPICTION OF PRIORITY PRE-CRASH SCENARIOS ...................................................... 13
4.1. Depiction of Rear-End Pre-Crash Scenario Group ............................................................ 13 4.1.1. Lead Vehicle Stopped ................................................................................................. 14 4.1.2. Lead Vehicle Decelerating .......................................................................................... 15 4.1.3. Lead Vehicle Moving .................................................................................................. 17
4.2. Depiction of Opposite Direction Pre-Crash Scenario Group ............................................. 18 4.2.1. Opposite Direction/No Maneuver ............................................................................... 18 4.2.2. Opposite Direction/Maneuver ..................................................................................... 20
4.3. Depiction of Left Turn Across Path/Opposite Direction Pre-Crash Scenario Group ........ 20 4.3.1. LTAP/OD at Non-Signalized or Signalized Junctions ............................................... 21
4.4. Depiction of Junction Crossing Pre-Crash Scenario Group .............................................. 25 4.4.1. Straight Crossing Paths at Non-Signalized Junctions ................................................. 26
4.5. Depiction of Lane Change Pre-Crash Scenario Group ...................................................... 28 4.5.1. Changing Lanes/Same Direction ................................................................................ 29 4.5.2. Turning/Same Direction .............................................................................................. 30 4.5.3. Drifting/Same Direction .............................................................................................. 31
5. CONCLUDING REMARKS .................................................................................................... 32 6. REFERENCES ......................................................................................................................... 34 APPENDIX A. CRASH CHARACTERISTICS OF PRIORITY PRE-CRASH SCENARIOS .. 35
A1. Straight Crossing Paths at Non-Signal ............................................................................... 35 A2. Left Turn Across Path/Opposite Direction ........................................................................ 38
A2.1. LTAP/OD at Signal ..................................................................................................... 38

iv
A2.2. LTAP/OD at Non-Signal ............................................................................................ 42 A3. Rear-End/Lead Vehicle Stopped ........................................................................................ 46 A4. Rear-End/Lead Vehicle Decelerating ................................................................................ 49 A5. Rear-End/Lead Vehicle Moving at Slower Constant Speed .............................................. 52 A6. Opposite Direction/No Maneuver ...................................................................................... 55 A7. Opposite Direction/Maneuver ............................................................................................ 58 A8. Changing Lanes/Same Direction ....................................................................................... 60 A9. Turning/Same Direction ..................................................................................................... 63 A10. Drifting/Same Direction ................................................................................................... 65

v
LIST OF TABLES
Table 1. Societal Harm of Target Light-Vehicle V2V Pre-Crash Scenarios ...................................2 Table 2. Mapping of Target Light Vehicle Pre-Crash Scenarios to VSC-A Applications ..............4 Table 3. Societal Harm of Target Pre-Crash Scenario Groups ........................................................5 Table 4. Societal Harm of Target Pre-Crash Scenarios .................................................................10 Table 5. Priority V2V Pre-Crash Scenarios ...................................................................................11 Table 6. Mapping of Priority Pre-Crash Scenarios to VSC-A Applications .................................32
vi
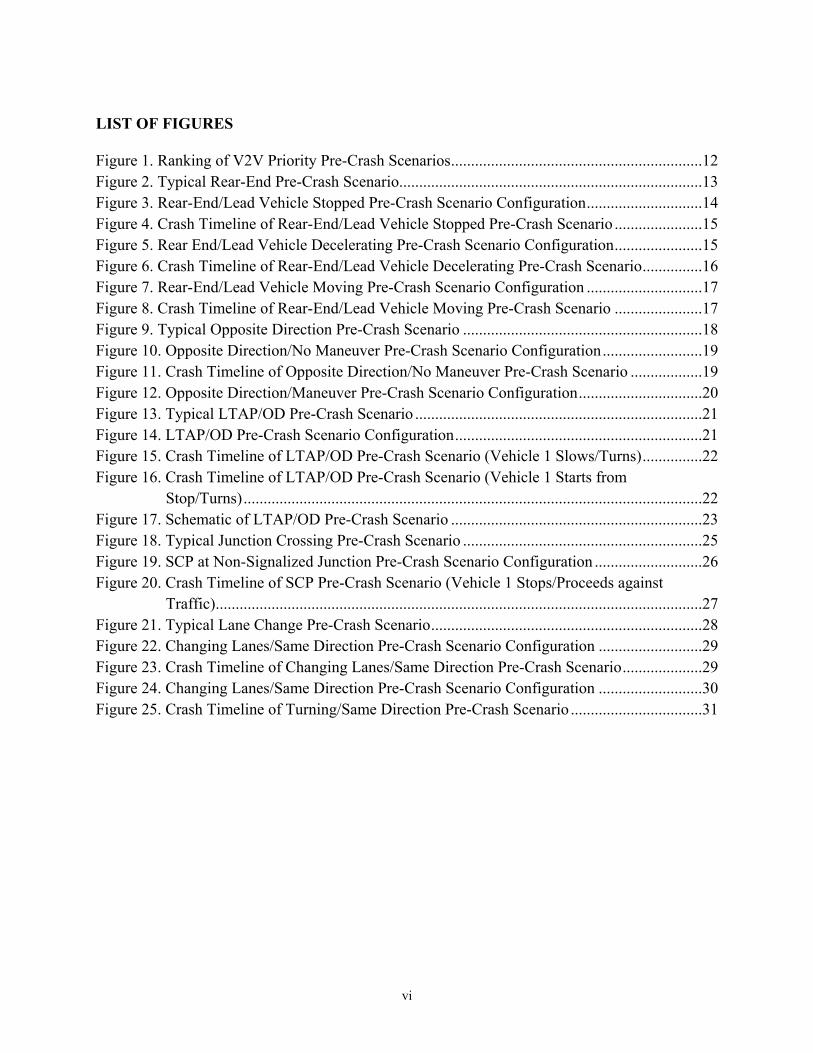
LIST OF FIGURES
Figure 1. Ranking of V2V Priority Pre-Crash Scenarios ...............................................................12 Figure 2. Typical Rear-End Pre-Crash Scenario ............................................................................13 Figure 3. Rear-End/Lead Vehicle Stopped Pre-Crash Scenario Configuration .............................14 Figure 4. Crash Timeline of Rear-End/Lead Vehicle Stopped Pre-Crash Scenario ......................15 Figure 5. Rear End/Lead Vehicle Decelerating Pre-Crash Scenario Configuration ......................15 Figure 6. Crash Timeline of Rear-End/Lead Vehicle Decelerating Pre-Crash Scenario ...............16 Figure 7. Rear-End/Lead Vehicle Moving Pre-Crash Scenario Configuration .............................17 Figure 8. Crash Timeline of Rear-End/Lead Vehicle Moving Pre-Crash Scenario ......................17 Figure 9. Typical Opposite Direction Pre-Crash Scenario ............................................................18 Figure 10. Opposite Direction/No Maneuver Pre-Crash Scenario Configuration .........................19 Figure 11. Crash Timeline of Opposite Direction/No Maneuver Pre-Crash Scenario ..................19 Figure 12. Opposite Direction/Maneuver Pre-Crash Scenario Configuration ...............................20 Figure 13. Typical LTAP/OD Pre-Crash Scenario ........................................................................21 Figure 14. LTAP/OD Pre-Crash Scenario Configuration ..............................................................21 Figure 15. Crash Timeline of LTAP/OD Pre-Crash Scenario (Vehicle 1 Slows/Turns) ...............22 Figure 16. Crash Timeline of LTAP/OD Pre-Crash Scenario (Vehicle 1 Starts from
Stop/Turns) ...................................................................................................................22 Figure 17. Schematic of LTAP/OD Pre-Crash Scenario ...............................................................23 Figure 18. Typical Junction Crossing Pre-Crash Scenario ............................................................25 Figure 19. SCP at Non-Signalized Junction Pre-Crash Scenario Configuration ...........................26 Figure 20. Crash Timeline of SCP Pre-Crash Scenario (Vehicle 1 Stops/Proceeds against
Traffic) ..........................................................................................................................27 Figure 21. Typical Lane Change Pre-Crash Scenario ....................................................................28 Figure 22. Changing Lanes/Same Direction Pre-Crash Scenario Configuration ..........................29 Figure 23. Crash Timeline of Changing Lanes/Same Direction Pre-Crash Scenario ....................29 Figure 24. Changing Lanes/Same Direction Pre-Crash Scenario Configuration ..........................30 Figure 25. Crash Timeline of Turning/Same Direction Pre-Crash Scenario .................................31
vii
LIST OF ACRONYMS
AV Autonomous vehicle BSW Blind Spot Warning CICAS-V Cooperative Intersection Collision Avoidance System for Violations CLW Control Loss Warning DNPW Do Not Pass Warning EDR Event Data Recorder EEBL Emergency Electronic Brake Light FCW Forward Collision Warning FYL Functional Years Lost GES General Estimates System IMA Intersection Movement Assist LCW Lane Change Warning LTAP/OD Left Turn Across Path/Opposite Directions LVA Lead Vehicle Accelerating LVD Lead Vehicle Decelerating LVM Lead Vehicle Moving LVS Lead Vehicle Stopped NASS National Automotive Sampling System NMVCCS National Motor Vehicle Crash Causation Survey SCP Straight Crossing Paths TCD Traffic Control Device TTC Time-to-Collision V2I Vehicle-to-Infrastructure V2V Vehicle-to-Vehicle VSC-A Vehicle Safety Communications – Applications

viii
LIST OF KINEMATIC EQUATION SYMBOLS
Ai Acceleration of vehicle i D0 Longitudinal gap between subject and other vehicles Di Initial distance from front of vehicle i to stop line ILCD Intended lane change distance Li Length of vehicle i S(t) Lateral gap between subject and other vehicles at time t S0 Lateral gap between subject and other vehicles t time Ti(c) Time for vehicle i to clear the path of the other vehicle Ti(r) Time for vehicle i to reach the path of the other vehicle TLC Time to complete lane change ttc Time-to-collision Vi Velocity of vehicle i (1 = subject, 2 = other) Vi(s) Velocity of vehicle i at stop line Wi Width of vehicle i Y Lane width θ Vehicle yaw/drift angle λi Distance from road centerline to edge of vehicle i

ix
EXECUTIVE SUMMARY
This report presents a template that describes pre-crash scenarios involving at least one light vehicle for potential safety applications based on vehicle-to-vehicle (V2V) communications. The light-vehicle platform encompasses passenger cars, vans and minivans, sport utility vehicles, and light pickup trucks with gross vehicle weight ratings of 10,000 pounds or less. The goal of the template is to support the development of functional requirements, performance specifications, objective test procedures, and safety benefits for crash avoidance systems using V2V technology. The template consists of representative crash statistics from national crash databases as well as kinematic description of the time-to-collision equations. National crash databases such as the General Estimates System, National Motor Vehicle Crash Causation Survey, and Event Data Recorder provide the necessary variables to depict the characteristics of pre-crash scenarios. Crash elements include:
• Driving environment • Driver characteristics • Driver contributing factors • Driver causal factors • Vehicle contributing factors • Kinematic information
From a list of 17 target pre-crash scenarios involving multi-vehicle crashes, a subset of ten pre-crash scenarios is suggested as priority scenarios for V2V-based safety applications. The 10 priority pre-crash scenarios are grouped into 5 distinct categories for consideration as V2V-based safety application packages:
• Junction crossing: Straight crossing paths (SCP) at non-signalized junctions • Left turn across path/opposite directions (LTAP/OD) at controlled and non-controlled
junctions • Rear-end:
o Lead vehicle stopped o Lead vehicle decelerating o Lead vehicle moving at constant speed
• Opposite direction: o One vehicle attempting a maneuver such as passing o No maneuvering involved such as drifting
• Lane change/same direction: o Changing lanes o Turning at a junction o Drifting

x
The ten priority pre-crash scenarios account for about 87 percent of the comprehensive economic cost and functional years lost of all V2V pre-crash scenarios involving multiple vehicles with at least one light vehicle. The 10 priority pre-crash scenarios listed above were mapped to potential V2V-based safety applications under development by the Crash Avoidance Metrics Partnership through the Vehicle Safety Communications – Applications (VSC-A) project. The LTAP/OD and opposite direction/no maneuver pre-crash scenarios were not addressed by V2V-based crash countermeasures. It should be noted that further development of the VSC-A applications would be required to deal with the different crash characteristics and kinematics of the pre-crash scenarios already addressed by these applications.
1
1. INTRODUCTION
The Intelligent Transportation System program’s 2010-2014 Strategic Research Plan describes an initiative aimed at developing safety applications to increase situational awareness and reduce or eliminate crashes through vehicle-to-vehicle (V2V) and vehicle-to-infrastructure (V2I) data transmission that supports driver advisories, driver warnings, and vehicle and/or infrastructure controls [1]. A multi-track research plan was conceived to promote V2V active safety applications that address the most critical crash scenarios [2]. Track 1 of this V2V research plan establishes a key scenario framework by which the crash problem can be further defined and new crash avoidance capabilities identified and described. The framework connects pre-crash scenarios to crash avoidance safety applications and provides information that will enable the identification of safety application function, performance, and initial effectiveness benchmarks. This framework will contribute to determining requirements for safety applications and will aid in the research and development of new crash avoidance technology and applications that will address the most pressing aspects of the crash problem. This report presents results from ongoing analyses in support of the V2V research plan’s Track 1 activities for the light-vehicle platform that includes passenger cars, vans and minivans, sport utility vehicles, and light pickup trucks with gross vehicle weight rating of 10,000 pounds or less. Detailed depiction of priority pre-crash scenarios is delineated to help understand their individual characteristics and dynamics, which provides a basis to assess the capabilities required to develop suitable crash avoidance systems to address these scenarios. Moreover, scenario depictions serve the development of crash countermeasure profiles, functional requirements, minimum performance specifications, objective test procedures, and safety benefits estimation.
1.1. Target Light Vehicle Pre-Crash Scenarios The population of motor vehicle crashes involving at least one light vehicle was linked to a set of 37 pre-crash scenarios that describe vehicle movements and critical events immediately prior to a crash [3]. The statistics of the 37 pre-crash scenarios were recently updated based on crash data from the 2004-2008 General Estimates System (GES), National Motor Vehicle Crash Causation Survey (NMVCCS), and event data recorder (EDR) databases [4]. Further analysis was conducted to identify target pre-crash scenarios for V2V-based safety applications. When considered as the primary countermeasure, V2V-based crash avoidance systems have the potential to deal with 76 percent of all light vehicle crashes based on 2004-2008 GES statistics [5]. The following 17 pre-crash scenarios were deemed as target crashes for V2V-based safety applications:

2
1. Rear-end crash/lead vehicle stopped (LVS) 2. Rear-end crash/lead vehicle moving at slower constant speed (LVM) 3. Rear-end crash/lead vehicle decelerating (LVD) 4. Rear-end crash/lead vehicle accelerating (LVA) 5. Rear-end crash/following vehicle making a maneuver 6. Opposite direction/no vehicle maneuver 7. Opposite direction/vehicle making a maneuver 8. Left turn across path from opposite directions (LTAP/OD) at signalized junctions 9. LTAP/OD at non-signalized junctions 10. Straight crossing paths (SCP) at non-signalized junctions 11. Turning at non-signalized junctions 12. Turning right at signalized junctions 13. Running red light 14. Running stop sign 15. Changing lanes/both vehicles traveling in same direction 16. Drifting/both vehicles traveling in same direction 17. Turning/both vehicles traveling in same direction
Table 1 lists and ranks the 17 target pre-crash scenarios in terms of average annual crash frequency, comprehensive economic costs, and functional years lost based on 2004-2008 GES light-vehicle crash statistics.
Table 1. Societal Harm of Target Light Vehicle V2V Pre-Crash Scenarios
Pre-Crash ScenarioCrash Frequency Comprehensive Costs Functional Years Lost
Value Rank Value Rank Value RankSCP @ non signal 647,000 2 41,095,000,000 1 292,000 1Rear-end/LVS 942,000 1 29,716,000,000 2 198,000 3Opposite direction/no maneuver 118,000 10 29,558,000,000 3 213,000 2Running red light 237,000 5 18,274,000,000 4 129,000 4LTAP/OD @ non signal 184,000 9 15,481,000,000 5 111,000 5LTAP/OD @ signal 204,000 6 14,777,000,000 6 105,000 6Rear-end/LVD 398,000 3 12,215,000,000 7 82,000 7Rear-end/LVM 202,000 7 10,342,000,000 8 72,000 8 Changing lanes/same direction 336,000 4 8,414,000,000 9 60,000 9Turning/same direction 202,000 7 6,176,000,000 10 43,000 10Opposite direction/maneuver 11,000 17 3,500,000,000 11 25,000 11Drifting/same direction 105,000 11 3,483,000,000 12 25,000 11Running stop sign 41,000 14 3,075,000,000 13 22,000 13Rear-end/striking maneuver 83,000 12 2,381,000,000 14 16,000 14Turn @ non signal 45,000 13 930,000,000 15 6,000 15Turn right @ signal 31,000 15 908,000,000 16 6,000 15Rear-end/LVA 21,000 16 667,000,000 17 5,000 17

3
1.2. V2V-Based Safety Applications The Vehicle Safety Communications – Applications (VSC-A) project developed and tested communications-based vehicle safety systems to determine if dedicated short-range communications at 5.9 GHz, in combination with vehicle positioning, can improve upon autonomous vehicle (AV) based safety systems and enable new communications-based safety applications [6]. The VSC-A project was an extension of a prior research effort that originally proposed numerous safety applications based on V2V and vehicle-to-infrastructure communications [7]. Six safety applications were selected for the VSC-A system test bed:
1. Emergency Electronic Brake Light (EEBL): Enables a host (subject) vehicle to broadcast a self-generated emergency brake event to surrounding remote (other) vehicles. Upon receiving such event information, the remote vehicle determines the relevance of the event and provides a warning to the driver if appropriate.
2. Forward Collision Warning (FCW): Warns the driver of the host vehicle in case of an impending rear-end collision with a remote vehicle ahead in traffic in the same lane and direction of travel.
3. Intersection Movement Assist (IMA): Warns the driver of a host vehicle when it is not safe to enter an intersection due to high collision probability with other remote vehicles at stop sign controlled and uncontrolled intersections.
4. Blind Spot Warning + Lane Change Warning (BSW+LCW): Warns the driver of the host vehicle during a lane change attempt if the blind spot zone into which the host vehicle intends to switch is, or will soon be, occupied by another vehicle traveling in the same direction. The application also provides the driver of the host vehicle with advisory information that a vehicle in an adjacent lane is positioned in the blind spot zone when a lane change is not being attempted.
5. Do Not Pass Warning (DNPW): Warns the driver of the host vehicle during a passing maneuver attempt when a slower moving vehicle, ahead and in the same lane, cannot be safely passed using a passing zone that is occupied by vehicles in the opposite direction of travel. The application also provides the driver of the host vehicle with advisory information that the passing zone is occupied when a passing maneuver is not being attempted.
6. Control Loss Warning (CLW): Enables a host vehicle to broadcast a self-generated control loss event to surrounding remote vehicles. Upon receiving such event information, the remote vehicle determines the relevance of the event and provides a warning to the driver, if appropriate.
Table 2 maps target V2V pre-crash scenarios to VSC-A safety applications. It should be noted that the control loss pre-crash scenarios are excluded from the target V2V scenarios because they mostly involve a single-vehicle crash. Moreover, the CLW application provides situational awareness information about upcoming surface condition hazard and not necessarily about a crash imminent condition between two vehicles. Thus, the focus of target V2V pre-crash scenarios is on driving scenarios that involve at least two vehicles on an imminent collision path. The three pre-crash scenarios that do not map directly to any of the safety applications defined within the scope of the VSC-A project are LTAP/OD at signalized junctions, turning right at signalized junctions, and running red light. Although these three scenarios are addressed
4
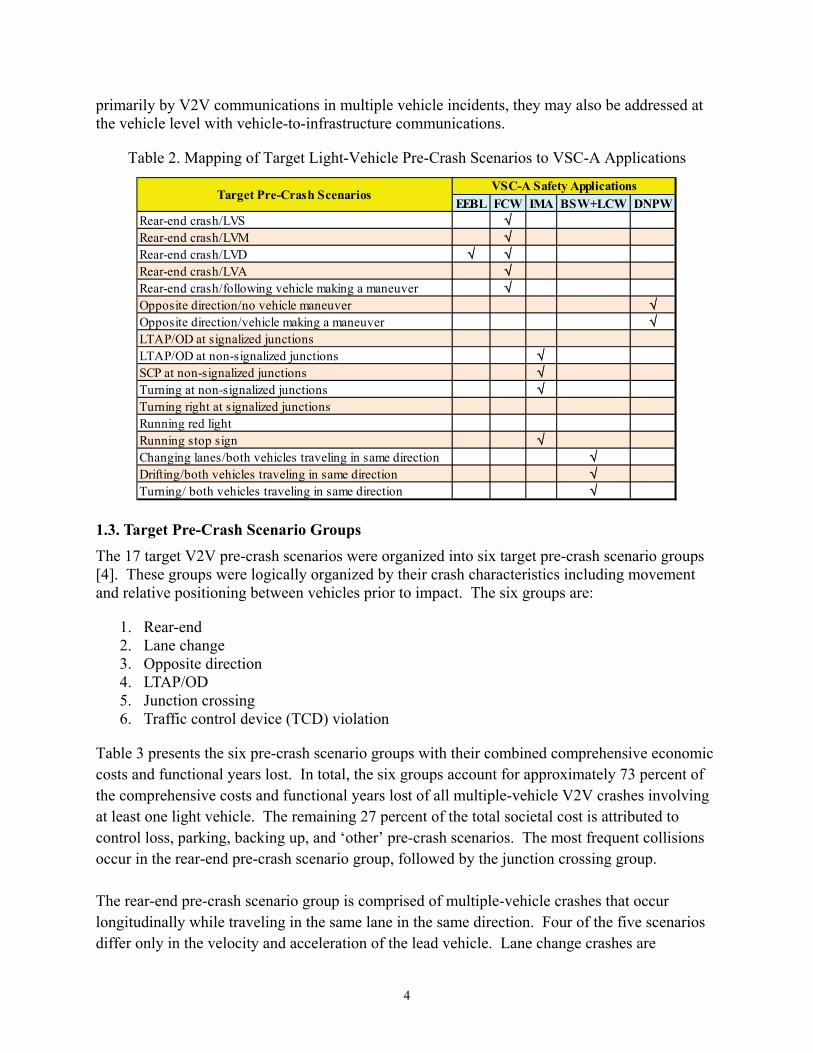
primarily by V2V communications in multiple vehicle incidents, they may also be addressed at the vehicle level with vehicle-to-infrastructure communications.
Table 2. Mapping of Target Light-Vehicle Pre-Crash Scenarios to VSC-A Applications
Target Pre-Crash ScenariosVSC-A Safety Applications
EEBL FCW IMA BSW+LCW DNPWRear-end crash/LVS √Rear-end crash/LVM √Rear-end crash/LVD √ √Rear-end crash/LVA √Rear-end crash/following vehicle making a maneuver √Opposite direction/no vehicle maneuver √Opposite direction/vehicle making a maneuver √LTAP/OD at signalized junctions LTAP/OD at non-signalized junctions √SCP at non-signalized junctions √Turning at non-signalized junctions √Turning right at signalized junctionsRunning red lightRunning stop sign √Changing lanes/both vehicles traveling in same direction √Drifting/both vehicles traveling in same direction √Turning/ both vehicles traveling in same direction √
1.3. Target Pre-Crash Scenario Groups The 17 target V2V pre-crash scenarios were organized into six target pre-crash scenario groups [4]. These groups were logically organized by their crash characteristics including movement and relative positioning between vehicles prior to impact. The six groups are:
1. Rear-end 2. Lane change 3. Opposite direction 4. LTAP/OD 5. Junction crossing 6. Traffic control device (TCD) violation
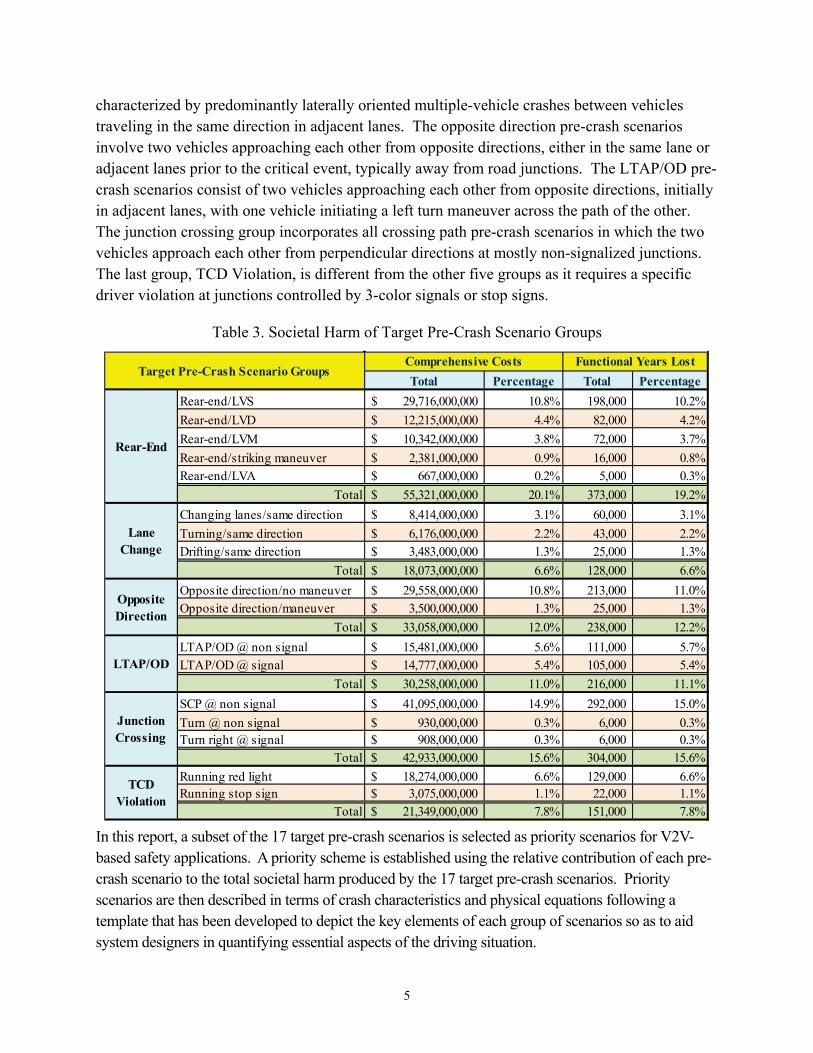
Table 3 presents the six pre-crash scenario groups with their combined comprehensive economic costs and functional years lost. In total, the six groups account for approximately 73 percent of the comprehensive costs and functional years lost of all multiple-vehicle V2V crashes involving at least one light vehicle. The remaining 27 percent of the total societal cost is attributed to control loss, parking, backing up, and ‘other’ pre-crash scenarios. The most frequent collisions occur in the rear-end pre-crash scenario group, followed by the junction crossing group. The rear-end pre-crash scenario group is comprised of multiple-vehicle crashes that occur longitudinally while traveling in the same lane in the same direction. Four of the five scenarios differ only in the velocity and acceleration of the lead vehicle. Lane change crashes are
5
characterized by predominantly laterally oriented multiple-vehicle crashes between vehicles traveling in the same direction in adjacent lanes. The opposite direction pre-crash scenarios involve two vehicles approaching each other from opposite directions, either in the same lane or adjacent lanes prior to the critical event, typically away from road junctions. The LTAP/OD pre-crash scenarios consist of two vehicles approaching each other from opposite directions, initially in adjacent lanes, with one vehicle initiating a left turn maneuver across the path of the other. The junction crossing group incorporates all crossing path pre-crash scenarios in which the two vehicles approach each other from perpendicular directions at mostly non-signalized junctions. The last group, TCD Violation, is different from the other five groups as it requires a specific driver violation at junctions controlled by 3-color signals or stop signs.
Table 3. Societal Harm of Target Pre-Crash Scenario Groups
Target Pre-Crash Scenario GroupsComprehensive Costs Functional Years LostTotal Percentage Total Percentage
Rear-End
Rear-end/LVS $ 29,716,000,000 10.8% 198,000 10.2%Rear-end/LVD $ 12,215,000,000 4.4% 82,000 4.2%Rear-end/LVM $ 10,342,000,000 3.8% 72,000 3.7%Rear-end/striking maneuver $ 2,381,000,000 0.9% 16,000 0.8%Rear-end/LVA $ 667,000,000 0.2% 5,000 0.3%
Total $ 55,321,000,000 20.1% 373,000 19.2%
Lane Change
Changing lanes/same direction $ 8,414,000,000 3.1% 60,000 3.1%Turning/same direction $ 6,176,000,000 2.2% 43,000 2.2%Drifting/same direction $ 3,483,000,000 1.3% 25,000 1.3%
Total $ 18,073,000,000 6.6% 128,000 6.6%
Opposite Direction
Opposite direction/no maneuver $ 29,558,000,000 10.8% 213,000 11.0% Opposite direction/maneuver $ 3,500,000,000 1.3% 25,000 1.3%
Total $ 33,058,000,000 12.0% 238,000 12.2%
LTAP/ODLTAP/OD @ non signal $ 15,481,000,000 5.6% 111,000 5.7%LTAP/OD @ signal $ 14,777,000,000 5.4% 105,000 5.4%
Total $ 30,258,000,000 11.0% 216,000 11.1%
Junction Crossing
SCP @ non signal $ 41,095,000,000 14.9% 292,000 15.0%Turn @ non signal $ 930,000,000 0.3% 6,000 0.3%Turn right @ signal $ 908,000,000 0.3% 6,000 0.3%
Total $ 42,933,000,000 15.6% 304,000 15.6%
TCD Violation
Running red light $ 18,274,000,000 6.6% 129,000 6.6%Running stop sign $ 3,075,000,000 1.1% 22,000 1.1%
Total $ 21,349,000,000 7.8% 151,000 7.8%
In this report, a subset of the 17 target pre-crash scenarios is selected as priority scenarios for V2V-based safety applications. A priority scheme is established using the relative contribution of each pre-crash scenario to the total societal harm produced by the 17 target pre-crash scenarios. Priority scenarios are then described in terms of crash characteristics and physical equations following a template that has been developed to depict the key elements of each group of scenarios so as to aid system designers in quantifying essential aspects of the driving situation.

6
2. FRAMEWORK OF PRE-CRASH SCENARIO DEPICTIONS
Pre-crash scenarios are depicted to convey information that will be helpful in the development of functional requirements, performance specifications, objective test procedures, and estimation of safety benefits for V2V-based safety applications. A depiction framework is presented below to characterize each group of priority V2V pre-crash scenarios using a template that meets these objectives. This depiction supplements the pre-crash scenario template based on national crash statistics found in the GES, NMVCCS, and EDR databases as presented in [4]. The template consists of the following elements:
• Driving environment (GES): o Roadway alignment × roadway surface condition × atmospheric condition o Relation to junction × traffic control device o Lighting condition o Posted speed limit
• Driver characteristics (GES): o Age o Gender
• Driver contributing factors (GES): o Alcohol o Drugs o Physical impairment o Violation o Speeding o Vision obscured o Distraction
• Driver causal factors (NMVCCS): o Fatigued o Inattention o Conversing o Misjudgment of distance/speed o False assumption o Inadequate evasive action o Inadequate surveillance o Following too closely
• Vehicle contributing factors (GES) • Corrective action attempted (GES) • Kinematic information (EDR):
o Travel speed o Brake activation o Deceleration level
7
2.1. Elements of Pre-Crash Scenario Depictions The depiction of pre-crash scenarios consists of the following four key elements as described below in Sections 2.1.1 through 2.1.4. These are general crash characteristics, relative location and motion of vehicles, supporting demographic data, and kinematic crash depiction.
2.1.1. General Crash Characteristics
• Typical Scenario: Each pre-crash scenario group is depicted in a typical configuration to illustrate the common kinematic and time-dependent elements. A generic illustration is provided, which shows the simplest roadway geometry and defines the critical quantitative physical parameters.
• Critical Event: Each pre-crash scenario group is linked to a primary critical event that made the crash imminent [8]. There are three primary critical events:
1. Lane departure leading to encroachment onto the travel lane of another vehicle. The
two vehicles may be traveling in the same or opposite directions. 2. Approaching a vehicle in the same lane. The two vehicles may be traveling in the
same or opposite directions. 3. Encroaching onto the travel lane of another vehicle at junctions including turning
across the path or straight crossing paths. In turning across the path, the two vehicles may be initially traveling from the same or opposite directions.
2.1.2. Relative Location and Motion of Vehicles The location and trajectory of the subject vehicle and other relevant vehicles are the essence of the mathematical description for the time-to-collision (ttc) variable. The initial state of the vehicles must be understood and the potential influence of other driving factors must be estimated in order to predict possible intersection of their paths. In addition to the subject vehicle, other vehicles of interest include target vehicles located ahead, behind, and to either side of the subject vehicle. Moreover, the front or rear offset of target vehicles must be considered. V2V-based safety applications must be able to ascertain each vehicle’s: relative position (including elevation), velocity, heading, range rate, position in lane, acceleration (longitudinal and lateral), and yaw rate. Elevation can be especially crucial at overpasses and underpasses where two-dimensional representations of the trajectories would generate numerous false alerts.
2.1.3. Supporting Demographic Data Where available, the template will include supporting demographic data from the GES and NMVCCS databases [4]. Such information provides insight into the most common crash contributing factors.
8
2.1.4. Kinematic Crash Depiction The three key elements described above are provided for each pre-crash scenario group. In contrast, the kinematic crash depiction element is delineated for each individual pre-crash scenario in the various groups. This fourth element consists of the following:
• Scenario Configuration: A figure is provided, which illustrates an essential description of the specific scenario.
• Crash Timeline: An illustrative timeline depicts the velocities and the gap between vehicles as a function of time, to the point of impact.
• Mathematical Description: A series of mathematical equations are derived to determine whether a collision will occur and the concomitant ttc variable.
2.2. Universal Crash Characteristics While the generic scenario descriptions capture the essence of the events, there can be numerous complicating and confounding factors that need to be considered for a more complete pre-crash scenario depiction. Many of these factors are common to all crash modes. A multitude of crash characteristics may influence the ttc value other than simple range and range rate between vehicles. Where possible, all relevant crash characteristics should be considered in the calculation of the ttc variable. The alert logic of V2V-based safety applications depends on accurate detection and measurements of these crash characteristics. The following are some crash characteristics that can form part of the alert logic of any V2V system.
2.2.1. Scenario Crash Characteristics The depictions of the pre-crash scenarios become more complex as real world considerations are taken into account. In particular, detection of vehicles beyond topographical features such as hills or sloped terrain can be augmented by V2V-based safety systems, and may be recognized by measuring vehicle inclination, throttle position, engine RPM, brake use, and GPS data. Vehicle path determination can be enhanced by measuring steering input, yaw rate, and GPS data. Consideration should be given to obstructions to the driver’s line of sight such as hills, buildings, and vegetation.
2.2.2. Environmental Crash Characteristics There are several environmental factors that may contribute to crashes. These include reduced visibility either by darkness at night or sun glare during the day. Precipitation and vehicle window condensation can negatively impact the driver’s ability to recognize and react to crash circumstances. Further, precipitation and icing can contribute to reduce traction between the vehicle and the road surface. Environmental factors can often be inferred through the use of equipment such as headlights and fog lights, windshield wiper, window defrosters, turn signals, and hazard lights. Their use can

9
indicate reduced visibility, for example. Similarly, the activation of traction control systems or anti-lock brake systems may indicate poor braking performance and thus may serve as measures of the road surface condition.
2.2.3. Driver Crash Characteristics Driver conditions and errors are a contributing factor in almost every crash to some degree. These factors include misjudging other vehicle behavior and false assumptions of other drivers’ behavior, distraction, fatigue, aggressiveness, and impairment (e.g., alcohol or drug use). Potential measurements of driver factors may include blood alcohol content sensors and eye-tracking cameras. Vehicle positioning within lane may indicate fatigue or distraction. Driver aggressiveness, misjudgment, and false assumptions of other driver’s intent present the greatest challenge to measure and quantify due to the subjective nature and effect of the behavior. It may be possible to utilize an extended GPS system track of the vehicle’s behavior to highlight aggressiveness over an extended period of time. Repeated occurrences of high accelerations followed quickly by heavy braking, frequent lane changes (augmented by turn signal use during lane change), relative position to other vehicles, frequent passing and horn use may serve as measures of such aggressive behavior. Indicators of aggressive driving behavior may be gleaned from traffic violation citations handed out by State and local police.
2.2.4. Additional Crash Depiction Elements
• Non-Vehicle Obstructions: The presence of non-vehicle obstructions such as pedestrians, pedalcyclists, animals, and road debris may trigger unexpected maneuvers by some or all of the vehicles. Non-vehicle obstructions appear as a critical event in some multi-vehicle crashes. These road obstacles must be considered even though they may not be picked up by V2V communications.
• Traffic Control Devices: Specific TCDs, including road signs, generally serve to minimize the risk of vehicle crashes. Nonetheless, assumptions and ambiguities about their position, status, and intended audience can result in crashes.
• Miscellaneous Ambiguities: Beyond poorly orientated or placed TCDs, there may be other situational ambiguities (e.g., optical illusions regarding relative approach velocity) that can contribute to the critical event of pre-crash scenarios.

10
3. SELECTION OF PRIORITY PRE-CRASH SCENARIOS
Table 4 presents statistics about the annual societal harm of the 17 target light vehicle pre-crash scenarios in terms of the comprehensive economic costs and functional years lost (FYL). The pre-crash scenarios are arranged by the six target pre-crash scenario groups. The absolute values in Table 4 are similar to those provided in Table 3 in Section 1. The percentage values, however, are computed from the proportions relative to the total societal harm attributed to the 17 target pre-crash scenarios as opposed to the total harm from all light-vehicle, multi-vehicle, police reported crashes. It should be noted that the societal harm is derived from persons who were injured in police reported crashes involving at least one light vehicle, excluding crashes not reported to the police.
Table 4. Societal Harm of Target Pre-Crash Scenarios
Target Pre-Crash Scenario Groups Comprehensive Costs Functional Years LostTotal Percentage Total Percentage
Rear-End
Rear-end/LVS $ 29,716,000,000 14.8% 198,000 14.0%Rear-end/LVD $ 12,215,000,000 6.1% 82,000 5.8%Rear-end/LVM $ 10,342,000,000 5.1% 72,000 5.1%Rear-end/striking maneuver $ 2,381,000,000 1.2% 16,000 1.1%Rear-end/LVA $ 667,000,000 0.3% 5,000 0.4%
Total $ 55,321,000,000 27.5% 373,000 26.5%
Lane Change
Changing lanes/same direction $ 8,414,000,000 4.2% 60,000 4.3%Turning/same direction $ 6,176,000,000 3.1% 43,000 3.0%Drifting/same direction $ 3,483,000,000 1.7% 25,000 1.8%
Total $ 18,073,000,000 9.0% 128,000 9.1%
Opposite Direction
Opposite direction/no maneuver $ 29,558,000,000 14.7% 213,000 15.1%Opposite direction/maneuver $ 3,500,000,000 1.7% 25,000 1.8%
Total $ 33,058,000,000 16.4% 238,000 16.9%
LTAP/ODLTAP/OD @ non signal $ 15,481,000,000 7.7% 111,000 7.9%LTAP/OD @ signal $ 14,777,000,000 7.4% 105,000 7.4%
Total $ 30,258,000,000 15.1% 216,000 15.3%
Junction Crossing
SCP @ non signal $ 41,095,000,000 20.4% 292,000 20.7%Turn @ non signal $ 930,000,000 0.5% 6,000 0.4%Turn right @ signal $ 908,000,000 0.5% 6,000 0.4%
Total $ 42,933,000,000 21.4% 304,000 21.6%
TCD Violation
Running red light $ 18,274,000,000 9.1% 129,000 9.1%Running stop sign $ 3,075,000,000 1.5% 22,000 1.6%
Total $ 21,349,000,000 10.6% 151,000 10.7%Total $ 200,992,000,000 100.0% 1,410,000 100.0%
Pre-crash scenario groups deemed as priority for V2V-based safety applications are limited to the following five: rear-end, lane change, opposite direction, LTAP/OD, and junction crossing. The TCD violation group is excluded since its pre-crash scenarios are best addressed with V2I-based safety applications. A cooperative intersection collision avoidance system for violations

11
(CICAS-V), involving communications between the infrastructure and in-vehicle elements, was developed by the Crash Avoidance Metrics Partnership to reduce the number of violation crashes at controlled intersections [9]. In its basic concept, a CICAS-V equipped vehicle approaching a CICAS-V equipped intersection receives messages about the intersection geometry and type and status of the traffic control device (i.e., stop sign or 3-color signal). A warning is issued if equipment in the vehicle determines that a violation of the stop sign or red light will occur given the current vehicle operating conditions. The 15 pre-crash scenarios in the five priority pre-crash scenario groups are selected down to a total of ten priority pre-crash scenarios for V2V-based safety applications as listed in Table 5. This reduced selection excludes target pre-crash scenarios that contributed to less than 1.5 percent of the annual societal harm. In addition, the two LTAP/OD pre-crash scenarios are combined as one since they have similar kinematics. Figure 1 illustrates the ranking of the priority pre-crash scenarios based on their relative contribution to the annual societal harm.
Table 5. Priority V2V Pre-Crash Scenarios
No Pre-Crash Scenario Group Cost FYL1 SCP @ non signal Junction Crossing 20.4% 20.7%2 LTAP/OD LTAP/OD 15.1% 15.3%3 Rear-end/LVS Rear-End 14.8% 14.0%4 Opposite direction/no maneuver Opposite Direction 14.7% 15.1%5 Rear-end/LVD Rear-End 6.1% 5.8%6 Rear-end/LVM Rear-End 5.1% 5.1%7 Changing lanes/same direction Lane Change 4.2% 4.3%8 Turning/same direction Lane Change 3.1% 3.0%9 Opposite direction/maneuver Opposite Direction 1.7% 1.8%
10 Drifting/same direction Lane Change 1.7% 1.8%Total 86.9% 87.0%

12
0%
5%
10%
15%
20%
25%
Comprehensive Costs Functional Years Lost
Figure 1. Ranking of V2V Priority Pre-Crash Scenarios

13
4. DEPICTION OF PRIORITY PRE-CRASH SCENARIOS
Depictions of the five priority pre-crash scenario groups are presented following the framework as described in Section 2. The kinematic depictions include general descriptions of the pre-crash circumstances for all vehicles involved, as well as the critical event that must be addressed by a primary V2V-based crash countermeasure. Universal crash characteristics discussed in Section 2 regarding the subject vehicle’s driver and local environment characteristics are applicable to all crash scenarios. A selection of these universal elements that are of special interest to each pre-crash scenario is also presented. These secondary crash elements do not directly indicate or lead to a critical event but may influence the probability of a critical event or the severity of the crash. For each priority pre-crash scenario, the pre-crash kinematics leading to the moment of impact are illustrated graphically and plotted to illustrate the relationship between the vehicles’ velocities and the closing gap between them. The plots show the crash timeline that occurs in the absence of a V2V-based crash countermeasure. Each depiction includes the ttc equation for the vehicle of interest if no crash countermeasure is applied. Appendix A provides relevant crash statistics as reported in [4] including the driving environment, driver characteristics, driver contributing and causal factors, vehicle contributing factors, corrective action attempted, and kinematic information.
4.1. Depiction of Rear-End Pre-Crash Scenario Group Typical Scenario: A rear-end crash scenario is characterized by front-to-rear impacts between vehicles traveling in the same lane in the same direction as shown in Figure 2. They are typically differentiated by type based upon the velocity and acceleration of the lead vehicle.
Figure 2. Typical Rear-End Pre-Crash Scenario
Critical Event: The critical event for all rear-end pre-crash scenarios is a following vehicle approaching a lead vehicle in the same lane and in the same path. The lead vehicle may be characterized as stopped, decelerating, accelerating, or simply moving at slower constant speed. Primary Crash Elements: The relative position of vehicles ahead and offset ahead of the following vehicle is the primary positioning element for all rear-end pre-crash scenarios. Crash countermeasures must record the following metrics for vehicle(s) ahead and offset ahead to determine if a rear-end crash critical event has occurred:

14
• Relative position, including elevation • Range rate • Velocity • Heading • Position in lane • Longitudinal acceleration
Supporting Demographic Data: Driver inattention, following too closely, speeding, and moving violations are main contributing factors to rear-end crashes. Driver distraction, following too closely, and false assumption are cited as primary causal factors in rear-end crashes.
4.1.1. Lead Vehicle Stopped Scenario Configuration: The following vehicle is typically going straight at constant speed, and then closes in on a stopped lead vehicle as depicted in Figure 3.
Figure 3. Rear-End/Lead Vehicle Stopped Pre-Crash Scenario Configuration
Crash Timeline: The following vehicle is moving at constant speed and the gap between the two vehicles decreases linearly with time until the vehicles collide as seen in Figure 4. The following vehicle may also be accelerating or decelerating on a straight road or curve.

15
Figure 4. Crash Timeline of Rear-End/Lead Vehicle Stopped Pre-Crash Scenario
Mathematical Description
ttc = Time-to-collision D0 = Gap between front of following vehicle and rear of lead vehicle Vi = Vehicle i speed
(1)
4.1.2. Lead Vehicle Decelerating Scenario Configuration: The following vehicle is typically going straight at constant speed and following another lead vehicle that slows down in traffic lane as shown in Figure 5.
Figure 5. Rear End/Lead Vehicle Decelerating Pre-Crash Scenario Configuration
16
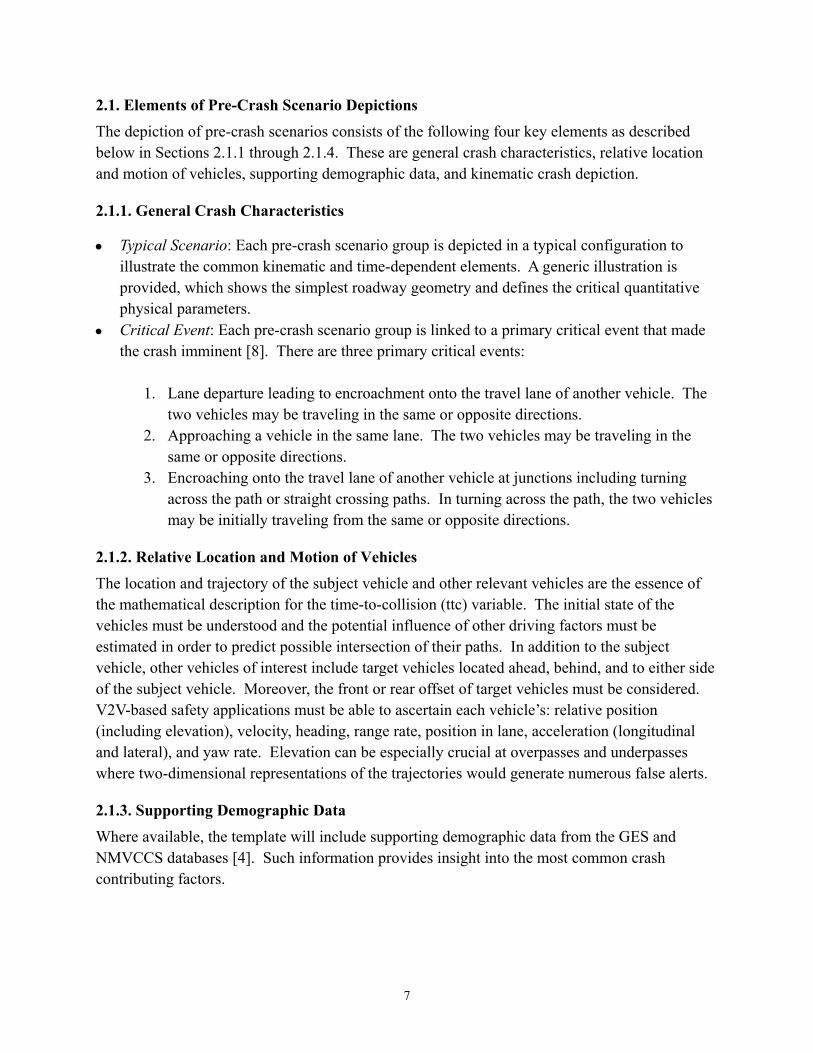
Crash Timeline: In an LVD scenario in which the following vehicle is traveling at constant speed, the gap between the two vehicles decreases at an ever increasing rate with time until the two vehicles collide as illustrated in Figure 6.
Figure 6. Crash Timeline of Rear-End/Lead Vehicle Decelerating Pre-Crash Scenario
Mathematical Description
ttc = Time-to-collision D0 = Initial gap between front of following vehicle and rear of lead vehicle Vi = Vehicle i speed Ai = Vehicle i deceleration
The lead vehicle may be struck by the following vehicle after stopping or during braking. The lead vehicle begins braking when t=0. If then the lead vehicle is struck
after stopping. The ttc when the two vehicles collide at the moment the lead vehicle is stopped is calculated from Equation (2) below:
(2)
17
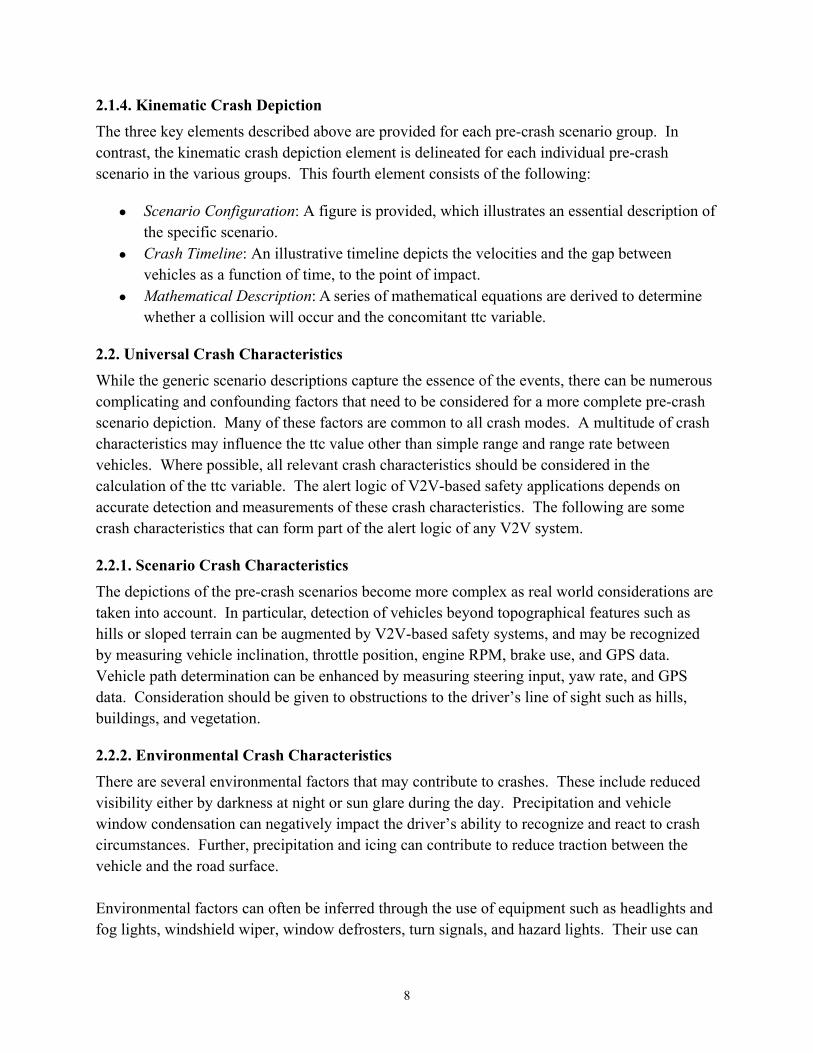
Otherwise, the lead vehicle is struck during the deceleration state and the ttc may be calculated from:
(3)
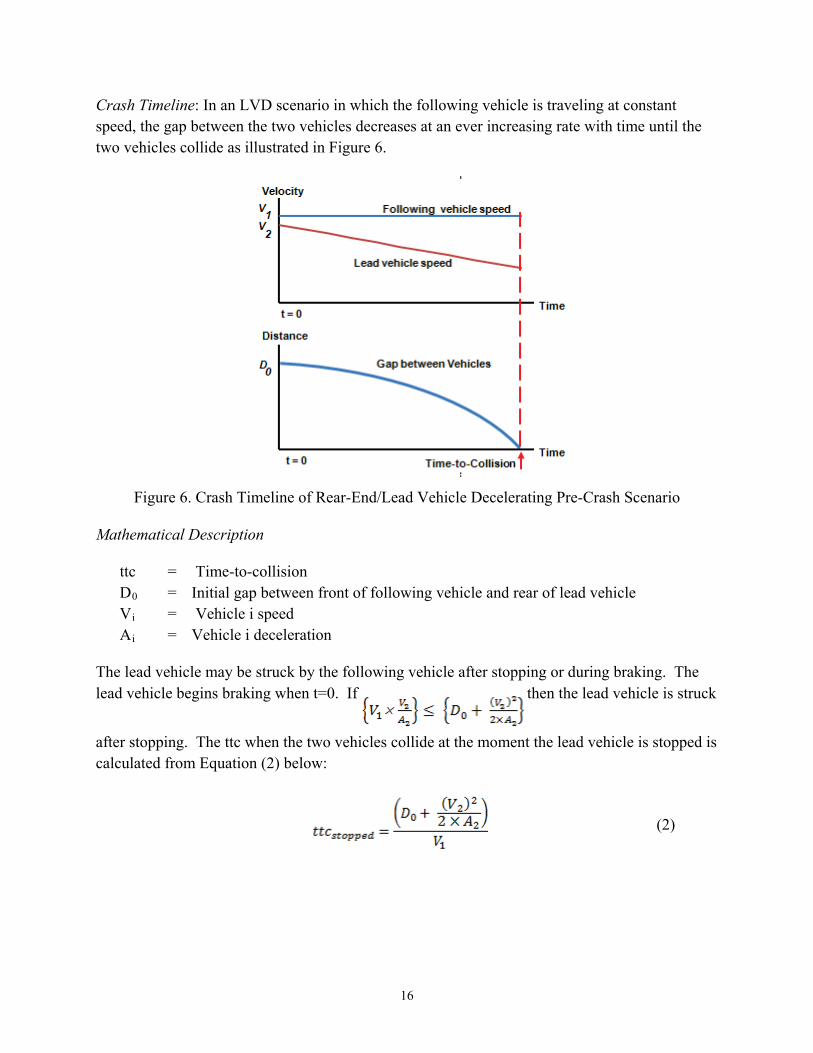
4.1.3. Lead Vehicle Moving Scenario Configuration: Vehicle is typically going straight at constant speed and then closes in on a lead vehicle moving at lower constant speed as shown in Figure 7.
Figure 7. Rear-End/Lead Vehicle Moving Pre-Crash Scenario Configuration
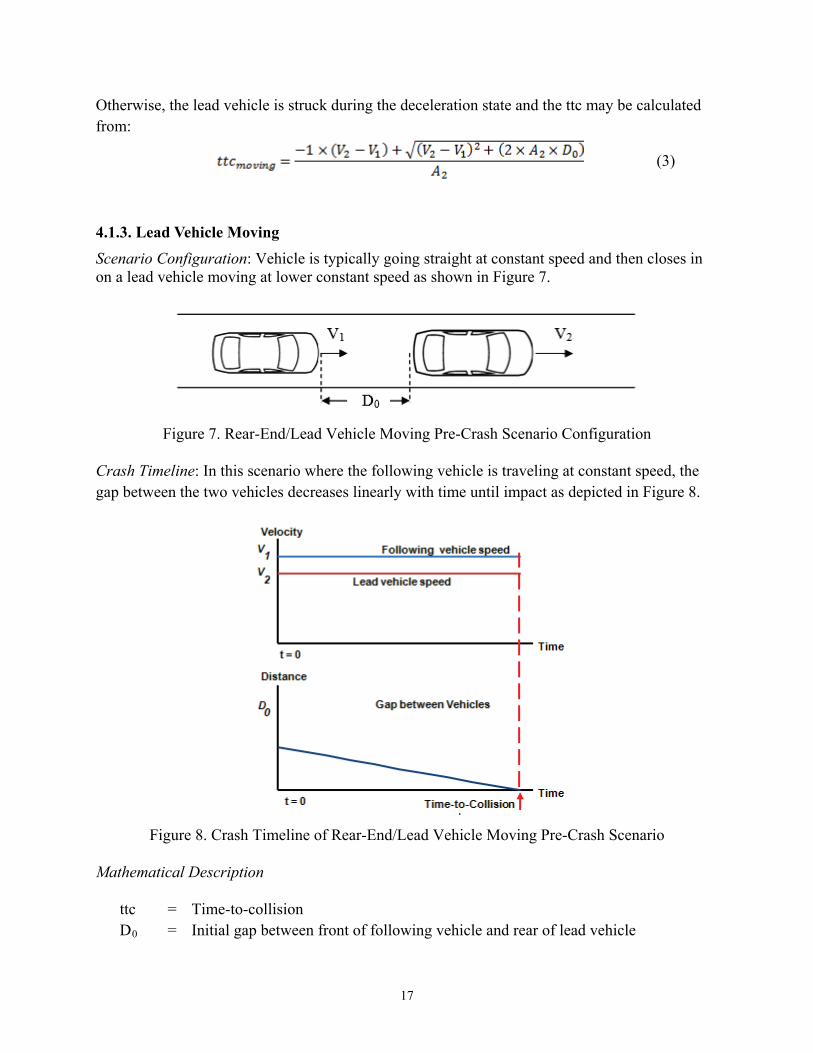
Crash Timeline: In this scenario where the following vehicle is traveling at constant speed, the gap between the two vehicles decreases linearly with time until impact as depicted in Figure 8.
Figure 8. Crash Timeline of Rear-End/Lead Vehicle Moving Pre-Crash Scenario
Mathematical Description
ttc = Time-to-collision D0 = Initial gap between front of following vehicle and rear of lead vehicle

18
Vi = Vehicle i speed
(4)
4.2. Depiction of Opposite Direction Pre-Crash Scenario Group Typical Scenario: An opposite direction pre-crash scenario is characterized by at least one vehicle encroaching onto an oncoming traffic lane resulting in a front-to-front impact. Figure 9 illustrates the pre-crash location and movement of each vehicle. This encroachment scenario may involve a vehicle drifting out of its travel lane or passing another vehicle in front prior to impact.
Figure 9. Typical Opposite Direction Pre-Crash Scenario
Critical Event: The critical event for the opposite direction pre-crash scenario group is one vehicle approaching another in the same lane when the two vehicles are initially traveling in the opposite directions. Primary Crash Elements: The relative position of vehicles to either side and in front of the host vehicle is the primary positioning element for opposite direction pre-crash scenarios. Crash countermeasures must record the following variables to determine if an opposite direction crash critical event has occurred:
• Relative position, including elevation • Range rate • Velocity • Heading • Position in lane • Lateral acceleration
Supporting Demographic Data: Driver distraction, fatigue, inadequate evasive action, and inadequate surveillance are cited as causal factors in opposite direction crashes.
4.2.1. Opposite Direction/No Maneuver Scenario Configuration: Vehicle is going straight, and then drifts and encroaches into another vehicle traveling in the opposite direction. Figure 10 illustrates the scenario.
19
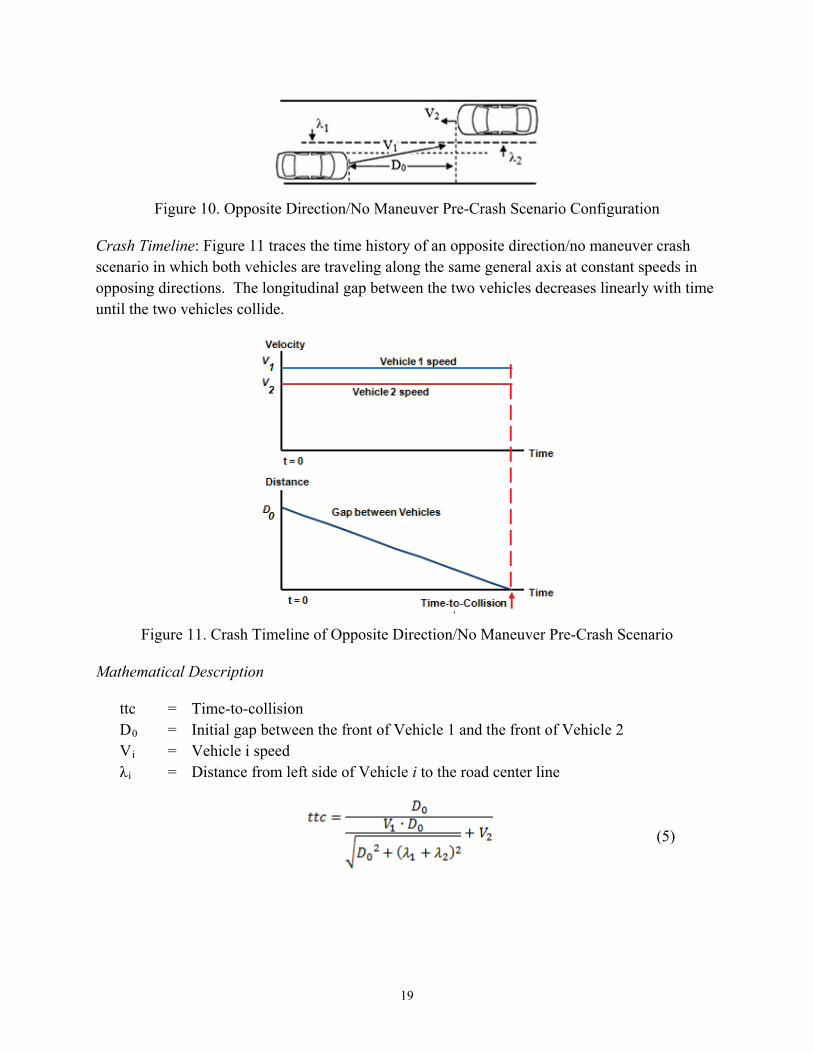
Figure 10. Opposite Direction/No Maneuver Pre-Crash Scenario Configuration
Crash Timeline: Figure 11 traces the time history of an opposite direction/no maneuver crash scenario in which both vehicles are traveling along the same general axis at constant speeds in opposing directions. The longitudinal gap between the two vehicles decreases linearly with time until the two vehicles collide.
Figure 11. Crash Timeline of Opposite Direction/No Maneuver Pre-Crash Scenario
Mathematical Description
ttc = Time-to-collision D0 = Initial gap between the front of Vehicle 1 and the front of Vehicle 2 Vi = Vehicle i speed λi = Distance from left side of Vehicle i to the road center line
(5)

20
4.2.2. Opposite Direction/Maneuver Scenario Configuration: Subject vehicle (V1) is initially following or closing in on a lead vehicle in the same lane. The subject vehicle then makes a passing maneuver around the lead vehicle and encroaches into another vehicle (V2) traveling in the opposite direction as illustrated in Figure 12.
Figure 12. Opposite Direction/Maneuver Pre-Crash Scenario Configuration
Crash Timeline: In an opposite direction/maneuver pre-crash scenario, the colliding vehicles are initially traveling in opposite directions in separate lanes. The critical event occurs when the subject vehicle crosses onto the oncoming lane to maneuver around a lead vehicle. Assuming the subject vehicle (V1) and the opposing vehicle (V2) remain in the same lane traveling along the same path in opposite directions, the crash timeline is represented by Figure 11. Mathematical Description
Assuming that the critical event has occurred and Vehicle 1 is already in the opposing lane, the time-to-collision is expressed as follows:
ttc = Time-to-collision D0 = Initial gap between the front of Vehicle 1 and the front of Vehicle 2 Vi = Speed of Vehicle i
(6)
4.3. Depiction of Left Turn Across Path/Opposite Direction Pre-Crash Scenario Group Typical Scenario: An LTAP/OD pre-crash scenario is characterized by a vehicle turning left across the path of an oncoming vehicle at a junction, both initially traveling in opposite directions, resulting in a front-to-front or front-to-side impact. The two pre-crash scenarios in this group are only differentiated by the presence of a traffic signal at the scene of the crash. Figure 13 illustrates a general configuration of this pre-crash scenario group. It should be noted that the left turning vehicle may initially travel at constant speed, decelerate, or start from a stop before making the left turn. Moreover, there are crash cases that involve both vehicles making a left turn in this pre-crash scenario group. Driver intent to turn left is typically indicated by the use of the turn signal or the presence of the subject vehicle in a left-turn-only lane.

21
Figure 13. Typical LTAP/OD Pre-Crash Scenario
Critical Event: The critical event for the LTAP/OD pre-crash scenario is the encroachment of the subject vehicle onto the travel lane and path of another vehicle at junctions when executing the left turn maneuver. Primary Crash Elements: The primary positioning element for all LTAP/OD pre-crash scenarios is the relative position of vehicles’ lateral offset, with both vehicles initially traveling in the opposite directions. Crash countermeasures must record the following parameters to determine if the critical event of an LTAP/OD crash has occurred:
• Relative position, including elevation • Range Rate • Heading • Velocity • Yaw Rate
Supporting Demographic Data: Driver distraction and inadequate surveillance measures are primary causal factors in LTAP/OD crashes.
4.3.1. LTAP/OD at Non-Signalized or Signalized Junctions Scenario Configuration: In Figure 14, one vehicle is turning left at an intersection without traffic controls or controlled by a 3-color signal (shown) and then cuts across the path of another vehicle traveling from the opposite direction.
Figure 14. LTAP/OD Pre-Crash Scenario Configuration

22
Crash Timeline: In an LTAP/OD pre-crash scenario, the subject vehicle approaches a perpendicular junction at a constant speed intending to turn left. The subject vehicle then slows, but does not stop, to execute the left turn at a constant speed and is struck by a vehicle traveling at constant speed from the opposite direction in the opposing lane as depicted in Figure 15. The subject vehicle may also come to a full stop first before proceeding with the left turn maneuver as illustrated in Figure 16.
Figure 15. Crash Timeline of LTAP/OD Pre-Crash Scenario (Vehicle 1 Slows/Turns)
Figure 16. Crash Timeline of LTAP/OD Pre-Crash Scenario (Vehicle 1 Starts from Stop/Turns)

23
Mathematical Description
Vehicle 1 Slows Down and Turns Left at Constant Speed Figure 17 is presented below to explain the different variables used in the mathematical description of this particular LTAP/OD pre-crash scenario.
Figure 17. Schematic of LTAP/OD Pre-Crash Scenario
Li = Length of Vehicle i Wi = Width of Vehicle i λi = Lateral distance from side of Vehicle i to center line Di = Initial distance from front of Vehicle i to stop line Vi = Initial velocity of Vehicle i at Di Vi(s) = Velocity of Vehicle i at stop line Ai = Acceleration of Vehicle i Y = Width of lane
Time for front of Vehicle 1 to reach path of Vehicle 2 is:
(7)
Time for rear of Vehicle 1 to clear path of Vehicle 2 is:
(8)

24
Time for front of Vehicle 2 to reach path of Vehicle 1 is:
(9)
Time for rear of Vehicle 2 to clear path of Vehicle 1 is:
(10)
A crash would occur if T2(r) ≤ T1(c) ≤ T2(c) or T1(r) ≤ T2(c) ≤ T1(c). Vehicle 1 Accelerates from a Stop and Turns Left
Li = Length of Vehicle i Wi = Width of Vehicle i λi = Lateral distance from side of Vehicle i to center line Di = Initial distance from front of Vehicle i to stop line Vi = Initial velocity of Vehicle i at Di Ai = Acceleration of Vehicle i Y = Width of lane
Time for front of Vehicle 1 to reach path of Vehicle 2 is:
(11)
Time for rear of Vehicle 1 to clear path of Vehicle 2 is:
(12)
Time for front of Vehicle 2 to reach path of Vehicle 1 is:
(13)

25
Time for rear of Vehicle 2 to clear path of Vehicle 1 is:
(14)
A crash would occur if T2(r) ≤ T1(c) ≤ T2(c) or T1(r) ≤ T2(c) ≤ T1(c).
4.4. Depiction of Junction Crossing Pre-Crash Scenario Group Typical Scenario: A junction crossing pre-crash scenario is characterized by the subject vehicle stopping and then proceeding straight across the path of another vehicle at a stop sign or turning right into the same direction of the other vehicle at a stop sign or traffic signal, resulting mostly in front-to-side impacts. Figure 18 illustrates straight crossing paths at a stop-sign-controlled intersection, which does not involve any violation of the stop sign. The vehicle in the horizontal direction first stops at the stop line and then proceeds against the path of the vehicle in the vertical direction. In most cases, the driver of the vehicle in the horizontal direction misjudges the gap and speed of the other vehicle.
Figure 18. Typical Junction Crossing Pre-Crash Scenario
Critical Event: The critical event for the junction crossing pre-crash scenario group is the encroachment of the subject vehicle onto the travel lane of an oncoming vehicle traveling from a perpendicular direction. The subject vehicle intends to cut across or turn into the other vehicle’s travel lane. Primary Crash Elements: The primary positioning element for all junction crossing pre-crash scenarios is the relative position of vehicles to either side of the subject vehicle. Crash countermeasures must record the following parameters to determine if the critical event of the junction crossing scenario has occurred:
• Relative position, including elevation • Range rate

26
• Velocity • Heading
Supporting Demographic Data: Driver distraction, misjudgment, false assumptions, and inadequate surveillance are associated with junction crossing crashes.
4.4.1. Straight Crossing Paths at Non-Signalized Junctions Scenario Configuration: Figure 19 presents a schematic of an SCP pre-crash scenario at a stop sign controlled intersection where the subject vehicle first stops at the stop line, and then proceeds by accelerating and traveling straight across the path of another vehicle approaching at a constant speed from a perpendicular direction.
Figure 19. SCP at Non-Signalized Junction Pre-Crash Scenario Configuration
Crash Timeline: Figure 20 illustrates the time history of distance and speed of both vehicles. Vehicle 1 comes to a halt at the stop line and later accelerates to cross the intersection into the path of an oncoming lateral Vehicle 2 whose path is not controlled by a stop sign.

27
Figure 20. Crash Timeline of SCP Pre-Crash Scenario (Vehicle 1 Stops/Proceeds against Traffic)
Mathematical Description
Li = Length of Vehicle i Wi = Width of Vehicle i λi = Lateral distance from side of Vehicle i to center line Di = Initial distance from front of Vehicle i to stop line Vi = Initial velocity of Vehicle i Ai = Acceleration of Vehicle i Y = Width of intersection
Time for front of Vehicle 1 to reach path of Vehicle 2 is:
(15)
Time for rear of Vehicle 1 to clear path of Vehicle 2 is:
(16)

28
Time for front of Vehicle 2 to reach path of Vehicle 1 is:
(17)
Time for rear of Vehicle 2 to clear path of Vehicle 1 is:
(18)
A crash would occur if T2r ≤ T1c ≤ T2c or T1r ≤ T2c ≤ T1c.
4.5. Depiction of Lane Change Pre-Crash Scenario Group Typical Scenario: A lane change crash scenario is characterized by lateral impacts when a vehicle encroaches onto an adjacent lane and impacts a second vehicle with a primarily side-to-side contact as illustrated in Figure 21. They are typically differentiated by type based upon the actions and velocity of the vehicle changing lanes immediately before impact.
Figure 21. Typical Lane Change Pre-Crash Scenario
Critical Event: The critical event for lane change pre-crash scenarios is the intended or unintended lane departure by one vehicle leading to encroachment onto the travel lane of another vehicle, both traveling in the same direction in adjacent lanes. Primary Crash Elements: The relative position of vehicles to either side and behind the subject vehicle is the primary positioning element for all lane change pre-crash scenarios. Crash countermeasures must record the following metrics for vehicle(s) to each side and offset behind to determine if a lane change critical event has occurred:

29
• Relative position, including elevation • Velocity • Heading • Range rate • Yaw rate • Position in lane • Lateral acceleration
Supporting Demographic Data: Driver distraction and inadequate surveillance factors are cited as contributing factors in lane change crashes.
4.5.1. Changing Lanes/Same Direction Scenario Configuration: One vehicle is going straight and then changes lanes into an adjacent vehicle, both traveling at a constant speed as shown below in Figure 22.
Figure 22. Changing Lanes/Same Direction Pre-Crash Scenario Configuration
Crash Timeline: In this changing lane scenario, the subject vehicle exhibits lateral acceleration as it moves laterally to the adjacent lane, gradually closing the lateral gap with the adjacent vehicle over time until collision as seen in Figure 23.
Figure 23. Crash Timeline of Changing Lanes/Same Direction Pre-Crash Scenario
30
Mathematical Description
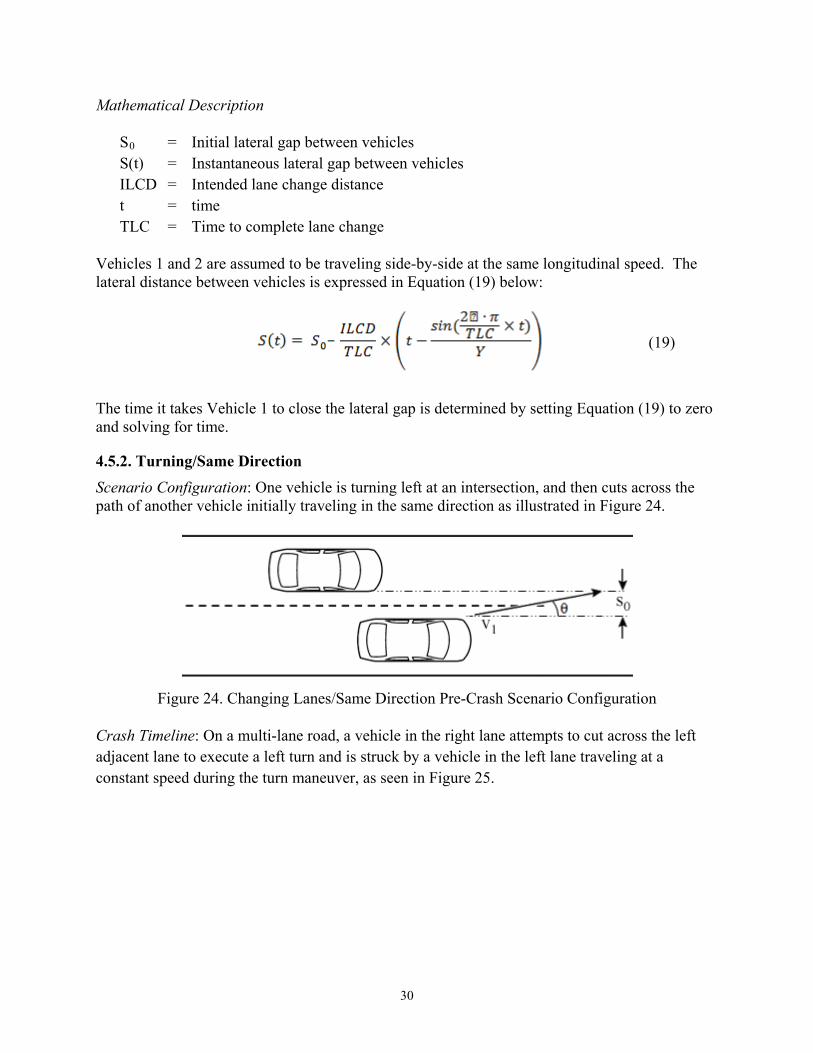
S0 = Initial lateral gap between vehicles S(t) = Instantaneous lateral gap between vehicles ILCD = Intended lane change distance t = time TLC = Time to complete lane change
Vehicles 1 and 2 are assumed to be traveling side-by-side at the same longitudinal speed. The lateral distance between vehicles is expressed in Equation (19) below:
(19)
The time it takes Vehicle 1 to close the lateral gap is determined by setting Equation (19) to zero and solving for time.
4.5.2. Turning/Same Direction Scenario Configuration: One vehicle is turning left at an intersection, and then cuts across the path of another vehicle initially traveling in the same direction as illustrated in Figure 24.
Figure 24. Changing Lanes/Same Direction Pre-Crash Scenario Configuration
Crash Timeline: On a multi-lane road, a vehicle in the right lane attempts to cut across the left adjacent lane to execute a left turn and is struck by a vehicle in the left lane traveling at a constant speed during the turn maneuver, as seen in Figure 25.

31
Figure 25. Crash Timeline of Turning/Same Direction Pre-Crash Scenario
Mathematical Description
S0 = Initial lateral gap between vehicles Vi = Velocity of Vehicle i θ = Turn (drift) angle of Vehicle 1
Vehicles 1 and 2 are assumed to be traveling side-by-side at the same longitudinal speed. The time for Vehicle 1 to close lateral gap and strike Vehicle 2, ttc, is expressed in Equation (20):
(20)
4.5.3. Drifting/Same Direction Scenario Configuration: One vehicle is going straight and then drifts onto an adjacent lane and strikes another vehicle traveling in the same direction, similar to the representation in Figure 24. Crash Timeline: On a multi-lane road where two vehicles are traveling in the same direction, the subject vehicle drifts across the lane marker and collides with the vehicle in the adjacent lane as seen in Figure 25 (turning vehicle becomes drifting vehicle). Mathematical Description
The mathematical description of the drifting/same direction pre-crash scenario is also represented by Equation 20 derived for the turning/same direction pre-crash scenario.

32
5. CONCLUDING REMARKS
A template was presented to completely depict pre-crash scenarios deemed as priority for V2V-based safety applications. The template consists of representative crash statistics from national crash databases as well as kinematic descriptions of the time-to-collision equations. From a list of 17 target pre-crash scenarios, a subset of ten pre-crash scenarios were suggested as priority scenarios for V2V-based safety applications. The ten priority pre-crash scenarios were also grouped into five distinct categories for consideration as V2V-based safety application packages. The pre-crash scenario template provides a basis for the development of functional requirements, performance specifications, objective test procedures, and safety benefits for V2V-based safety applications. The ten priority pre-crash scenarios were mapped to potential VSC-A applications as shown in Table 6. The LTAP/OD and opposite direction/no maneuver pre-crash scenarios remain to be addressed by V2V-based crash countermeasures. It should be noted that the VSC-A applications would require further development to deal with the different crash characteristics and kinematics of the pre-crash scenarios already addressed by these applications.
Table 6. Mapping of Priority Pre-Crash Scenarios to VSC-A Applications
VSC-A Safety ApplicationsNo Group Pre-Crash Scenario EEBL FCW IMA BSW+LCW DNPW1 Junction Crossing SCP @ non signal √
2 LTAP/OD LTAP/OD3 Rear-end/LVS √
4 Rear-End Rear-end/LVD √ √ 5 Rear-end/LVM √
6 Opposite direction/maneuver √Opposite Direction7 Opposite direction/no maneuver8 Changing lanes/same direction √
9 Lane Change Turning/same direction √
10 Drifting/same direction √
If V2V-based crash countermeasures are to prove effective in reducing the frequency and severity of light-vehicle crashes, systems must rapidly, accurately, and continually assess the likelihood of a crash in each of the ten priority pre-crash scenarios. Systems must determine whether a crash is imminent with sufficient lead time to allow the countermeasure to either prevent the crash or to reduce the harm to all persons involved. A critical element of a pre-crash depiction is the determination of the range and range rate between the vehicle of interest and all other similarly equipped vehicles in the vicinity. At all times, communications between two vehicles’ systems must determine the potential time-to-collision that will in turn determine

33
whether to deploy the countermeasures, and to what degree. To determine ttc, systems must be able to determine subject vehicle position, velocity, longitudinal and lateral acceleration, as well as its in-lane position and yaw rate, and its relation in each of these measures to other vehicles in close proximity. As vehicles approach one another, the ttc may approach zero. A series of thresholds may be crossed that can be used to trigger varying countermeasure interventions. Finally, systems must be able to discriminate between crash imminent driving situations and benign driving conditions so as to minimize the occurrence of false positive interventions.

34
6. REFERENCES
[1] ITS Strategic Research Plan, 2010-2014: Transforming Transportation Through Connectivity. (2010). (Report No. FHWA-JPO-10-028). Washington, DC: U.S. Department of Transportation, Research and Innovative Technology Administration, ITS Joint Program Office.
[2] USDOT IntelliDriveSM Program: Vehicle to Vehicle Safety Application Research Plan. (2009). Washington, DC: National Highway Traffic Safety Administration; and Research and Innovative Technology Administration.
[3] Najm, W. G., Smith, J. D. & Yanagisawa, M. (2007). Pre-Crash Scenario Typology for Crash Avoidance Research. (Report No. DOT HS 810 767). Washington, DC: U.S. Department of Transportation, National Highway Traffic Safety Administration.
[4] Najm, W. G., Ranganathan, R., Srinivasan, G., Smith, J. D., Toma, S., Swanson, E., & Burgett, A. (In review). Description of Pre-Crash Scenarios for Safety Applications Based on Vehicle-to-Vehicle Communications. Washington, DC: U.S. Department of Transportation, National Highway Traffic Safety Administration.
[5] Najm, W. G., Koopmann, J., Smith, J. D., & Brewer, J. (2010). Frequency of Target Crashes for IntelliDriveSM Safety Systems. (Report No. DOT HS 811 381). Washington, DC: U.S. Department of Transportation, National Highway Traffic Safety Administration.
[6] Farid, A. Z. & Carter, A. (2009). Vehicle Safety Communications – Applications First Annual Report. (Report No. DOT HS 811 073). Washington, DC: U.S. Department of Transportation, National Highway Traffic Safety Administration.
[7] Crash Avoidance Metrics Partnership. (2006). Vehicle Safety Communications Project – Final Report. (Report No. DOT HS 810 591). Washington, DC: U.S. Department of Transportation, National Highway Traffic Safety Administration.
[8] National Center for Statistics and Analysis. (2009). National Automotive Sampling System (NASS) General Estimates System (GES) Analytical User’s Manual 1988-2008. Washington, DC: U.S. Department of Transportation, National Highway Traffic Safety Administration.
[9] Crash Avoidance Metrics Partnership. (2007). Cooperative Intersection Collision Avoidance System Limited to Stop Sign and Traffic Signal Violations (CICAS-V) – Concept of Operations. (Report No. DTFH61-01-X-00014). Washington, DC: U.S. Department of Transportation, Federal Highway Administration.

35
APPENDIX A. CRASH CHARACTERISTICS OF PRIORITY PRE-CRASH SCENARIOS
A1. Straight Crossing Paths at Non-Signal
Driving Environment1 Roadway Alignment × Roadway Surface Condition × Atmospheric Condition
77% - Straight, dry road surface with no adverse weather 11% - Straight, slippery road surface with adverse weather
Relation to Junction × Traffic Control Device
52% - Intersection or intersection related at stop sign 25% - Driveway, alley, etc. without traffic controls
Lighting Condition 80% - Daylight 12% - Dark but lighted
Posted Speed Limit
0%10%20%30%40%50%60%70%80%90%
100%
0 5 10 15 20 25 30 35 40 45 50 55 60 65 70 75
Speed Limit (mph) Driver Characteristics Age 28% - 0 to 24 years
61% - 25 to 64 years 10% - 65 years or above
Gender 53% - Male 47% - Female
Driver Contributing Factors Alcohol 2% - Alcohol use Drugs < 1% - Drug use Physical Impairment < 1% - Physical impairment Violation Cited 27% - Violation cited Speeding 2% - Speeding Vision Obscured 8% - Obstruction Distraction 13% - Distracted Vehicle Contributing Factors Contributing Factors < 1% - Contributing Factors
1 The data in Appendix A presents the most significant values only, the data not shown is divided across multiple entries that are not individually significant though they appear significant when summed.
36
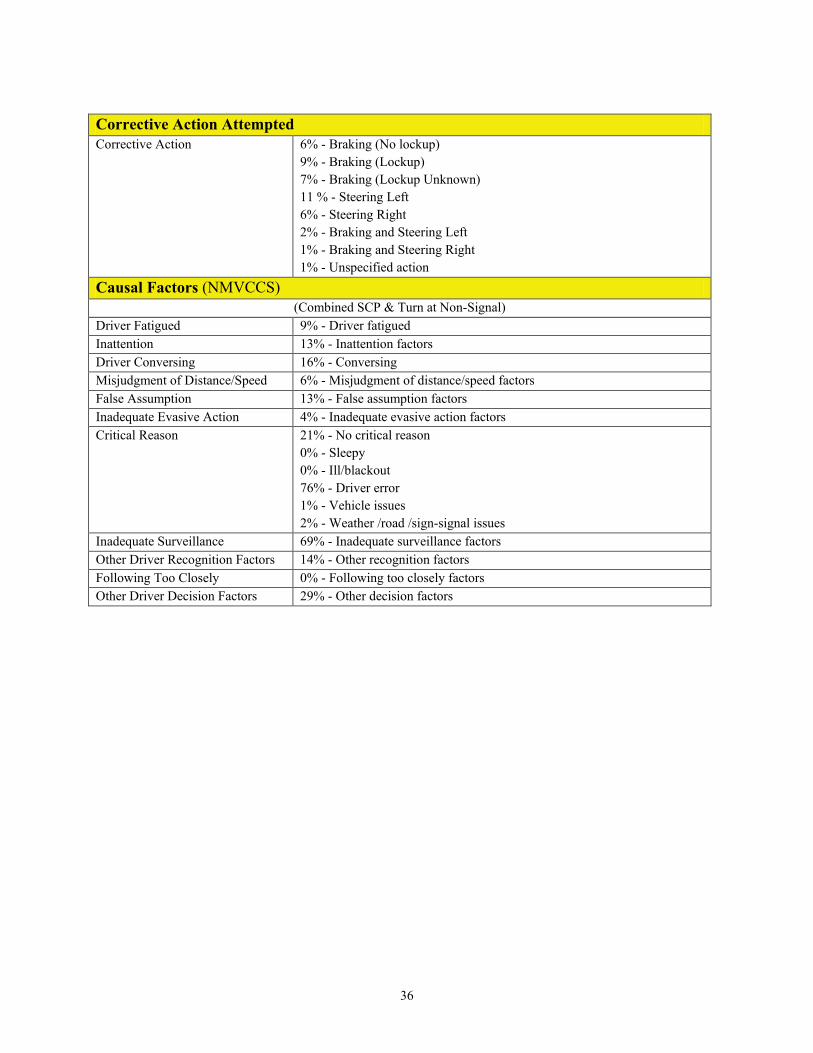
Corrective Action Attempted Corrective Action 6% - Braking (No lockup)
9% - Braking (Lockup) 7% - Braking (Lockup Unknown) 11 % - Steering Left 6% - Steering Right 2% - Braking and Steering Left 1% - Braking and Steering Right 1% - Unspecified action
Causal Factors (NMVCCS) (Combined SCP & Turn at Non-Signal)
Driver Fatigued 9% - Driver fatigued Inattention 13% - Inattention factors Driver Conversing 16% - Conversing Misjudgment of Distance/Speed 6% - Misjudgment of distance/speed factors False Assumption 13% - False assumption factors Inadequate Evasive Action 4% - Inadequate evasive action factors Critical Reason 21% - No critical reason
0% - Sleepy 0% - Ill/blackout 76% - Driver error 1% - Vehicle issues 2% - Weather /road /sign-signal issues
Inadequate Surveillance 69% - Inadequate surveillance factors Other Driver Recognition Factors 14% - Other recognition factors Following Too Closely 0% - Following too closely factors Other Driver Decision Factors 29% - Other decision factors

37
Kinematic Data (126 EDR Cases) SCP at Non-Signal
0%
20%
40%
60%
80%
100%
0 10 20 30 40 50 60 70 80 90 100
Cum
ulat
ive
% v
ehic
les
5s 4s 3s 2s 1s
Vehicle Travel Speed (mph)
0%
20%
40%
60%
80%
100%
0 5 10 15 20 25 30 35 40 45 50 55 60 65 70 75
Vehicle Speed Limit (mph) , 04-08 GES
66%
36%28%
18%14%
0%
20%
40%
60%
80%
100%
-5 -4 -3 -2 -1 0
Cum
ulat
ive %
Veh
icle
s
Brake Frequency at Time to Collision (s)
34%30%
8%2%
8%2% 2%1% 1%
5%1%6%
0%
25%
50%
75%
100%
0000
000
001
0001
000
011
0010
101
110
0011
101
001
0110
001
110
0111
110
000
1001
111
000
1101
111
100
1111
011
111
1011
111
101
% V
ehic
les
Detailed Brake Application Frequency
0%
20%
40%
60%
80%
100%
0.0 0.1 0.2 0.3 0.4 0.5 0.6 0.7 0.8 0.9 1.0
Cum
ulat
ive %
Veh
icle
s
4s 3s 2s 1s
Braking Deceleration (g)
0.00
0.20
0.38
0.260.21
0.07
0.0
0.2
0.4
0.6
0.8
1.0
16,2770
13,4701.5 s
3,6742.5 s
4,2853.5 s
1,7434.5 s
6,2485.5 s
Ave
rage
eff
ectiv
e de
cele
ratio
n (g
)
Effective Deceleration at TTC (s) with Frequency

38
A2. Left Turn Across Path/Opposite Direction
A2.1. LTAP/OD at Signal Driving Environment Roadway Alignment × Roadway Surface Condition × Atmospheric Condition
81% - Straight, dry road surface with no adverse weather 11% - Straight, slippery road surface with adverse weather
Relation to Junction × Traffic Control Device
97% - Intersection or intersection related at RGY traffic signal
Lighting Condition 66% - Daylight ark but lighted
0%10%20%30%40%50%60%70%80%90%
100%
0 5 10 15 20 25 30 35 40 45 50 55 60 65 70 75
Speed Limit (mph)
26% - DPosted Speed Limit
Driver Characteristics Left Turning Vehicle Non-Left Turning Vehicle Age 34% - 0 to 24 years
52% - 25 to 64 years 14% - 65 years or above
28% - 0 to 24 Years 64% - 25 to 64 Years 7% - 65 Years or above
Gender 52% - Male 48% - Female
56% - Male 44% - Female
Driver Contributing Factors Left Turning Driver Non-Left Turning Driver Alcohol 3% - Alcohol use 1% - Alcohol use Drugs < 1% - Drug use < 1% - Drug use Physical Impairment < 1% - Physical impairment < 1% - Physical impairment Violation Cited 51% - Violation cited 13% - Violation cited Speeding 1% - Speeding 2% - Speeding Vision Obscured 6% - Obstruction 3% - Obstruction Distraction 21% - Distracted 4% - Distracted Vehicle Contributing Factors Left Turning Vehicle Non-Left Turning Vehicle Contributing Factors < 1% - Contributing Factors < 1% - Contributing Factors

39
Corrective Action Attempted LTAP/OD at Signal Left Turning Vehicle Non-Left Turning Vehicle Corrective Action 3% - Braking (No lockup)
2% - Braking (Lockup) 1% - Braking (Lockup Unknown) 1% - Steering Left 3% - Accelerating
12% - Braking (No lockup) 13% - Braking (Lockup) 10% - Braking (Lockup Unknown) 5% - Steering Left 10% - Steering Right 1% - Braking and Steering Left 3% - Braking and Steering Right 2% - Unspecified action
Causal Factors (NMVCCS) Left Turning Vehicle Non-Left Turning Vehicle Driver Fatigued 6% - Driver fatigued 5% - Driver fatigued Inattention 8% - Inattention factors 5% - Inattention factors Driver Conversing 13% - Conversing 10% - Conversing Misjudgment of Distance/Speed 13% - Misjudgment of distance/speed
factors 11% - Misjudgment of distance/speed factors
False Assumption 23% - False assumption factors 44% - False assumption factors Inadequate Evasive Action 1% - Inadequate evasive action factors 1% - Inadequate evasive action factors Critical Reason 0% - No critical reason
0% - Sleepy 0% - Ill/blackout 99% - Driver error 0% - Vehicle issues 1% - Weather /road /sign-signal issues
1% - No critical reason 0% - Sleepy 2% - Ill/blackout 98% - Driver error 0% - Vehicle issues 0% - Weather /road /sign-signal issues
Inadequate Surveillance 69% - Inadequate surveillance factors 49% - Inadequate surveillance factors Other Driver Recognition Factors
10% - Other recognition factors 4% - Other recognition factors
Following Too Closely 0% - Following too closely factors 0% - Following too closely factors Other Driver Decision Factors 25% - Other decision factors 24% - Other decision factors

40
Kinematic Data of Turning Vehicle (89 EDR Cases) LTAP/OD at Signal
0%
20%
40%
60%
80%
100%
0 10 20 30 40 50 60 70 80 90 100
Cum
ulat
ive
% v
ehic
les
5s 4s 3s 2s 1s
Vehicle Travel Speed (mph)
0%
20%
40%
60%
80%
100%
0 5 10 15 20 25 30 35 40 45 50 55 60 65 70 75
Vehicle Speed Limit (mph) , 04-08 GES
72%
50%
39%39%37%
0%
20%
40%
60%
80%
100%
-5 -4 -3 -2 -1 0
Cum
ulat
ive %
Veh
icle
s
Brake Frequency at Time to Collision (s)
28%22%
11%
1%1% 3%1%
15%
2%
15%
1%0%
25%
50%
75%
100%
0000
000
001
0001
000
011
0010
101
110
0100
101
001
0110
001
110
0111
110
000
1001
111
000
1101
111
100
1111
011
111
1011
111
101
% V
ehic
les
Detailed Brake Application Frequency
0%
20%
40%
60%
80%
100%
0.0 0.1 0.2 0.3 0.4 0.5 0.6 0.7 0.8 0.9 1.0
Cum
ulat
ive %
Veh
icle
s
4s 3s 2s 1s
Braking Deceleration (g)
0.00
0.120.16
0.060.01 0.00
0.0
0.2
0.4
0.6
0.8
1.0
10,8010
8,5251.5 s
4,1222.5 s
163.5 s
7494.5 s
14,0785.5 s
Ave
rage
eff
ectiv
e de
cele
ratio
n (g
)
Effective Deceleration at TTC (s) with Frequency

41
Kinematic Data of Non-Turning Vehicle (78 EDR) LTAP/OD at Signal
0%
20%
40%
60%
80%
100%
0 10 20 30 40 50 60 70 80 90 100
Cum
ulat
ive
% v
ehic
les
5s 4s 3s 2s 1s
Vehicle Travel Speed (mph)
0%
20%
40%
60%
80%
100%
0 5 10 15 20 25 30 35 40 45 50 55 60 65 70 75
Vehicle Speed Limit (mph) , 04-08 GES
82%
28%
11%9%6%
0%
20%
40%
60%
80%
100%
-5 -4 -3 -2 -1 0
Cum
ulat
ive %
Veh
icle
s
Brake Frequency at Time to Collision (s)
18%
54%
1%
17%
2%3% 1% 2% 2%0%
25%
50%
75%
100%
0000
000
001
0001
000
011
0010
101
110
0011
101
001
0110
001
110
0111
110
000
1001
111
000
1101
111
100
1111
011
111
1011
111
101
% V
ehic
les
Detailed Brake Application Frequency
0%
20%
40%
60%
80%
100%
0.0 0.1 0.2 0.3 0.4 0.5 0.6 0.7 0.8 0.9 1.0
Cum
ulat
ive %
Veh
icle
s
4s 3s 2s 1s
Braking Deceleration (g)
0.00
0.470.52
0.270.23 0.19
0.0
0.2
0.4
0.6
0.8
1.0
6,0090
12,7071.5 s
4,1002.5 s
4363.5 s
6884.5 s
1,4165.5 s
Ave
rage
eff
ectiv
e de
cele
ratio
n (g
)
Effective Deceleration at TTC (s) with Frequency

42
A2.2. LTAP/OD at Non-Signal Driving Environment Roadway Alignment × Roadway Surface Condition × Atmospheric Condition
80% - Straight, dry road surface with no adverse weather
Relation to Junction × Traffic Control Device
41% - Intersection or intersection related without traffic controls 35% - Driveway, alley, etc. without traffic controls
Lighting Condition 79% - daylight 13% - dark but lighted
Posted Speed Limit
0%10%20%30%40%50%60%70%80%90%
100%
0 5 10 15 20 25 30 35 40 45 50 55 60 65 70 75
Speed Limit (mph) Driver Characteristics Left Turning Vehicle Non-Left Turning Vehicle Age 30% - 0 to 24 years
55% - 25 to 64 years 15% - 65 years or above
26% - 0 to 24 years 67% - 25 to 64 years 7% - 65 years or above
Gender 54% - Male 46% - Female
55% - Male 45% - Female
Driver Contributing Factors LTAP/OD at Non-Signal Left Turning Vehicle Non-Left Turning Vehicle Alcohol: 3% - Alcohol use 1% - Alcohol use Drugs < 1% - Drug use < 1% - Drug use Physical Impairment < 1% - Physical impairment < 1% - Physical impairment Violation Cited 56% - Violation cited 10% - Violation cited Speeding 1% - Speeding 2% - Speeding Vision Obscured 18% - Obstruction 9% - Obstruction Distraction 29% - Distracted 4% - Distracted Vehicle Contributing Factors Left Turning Vehicle Non-Left Turning Vehicle Contributing Factors < 1% - Contributing Factors < 1% - Contributing Factors

43
Corrective Action Attempted LTAP/OD at Non-Signal Left Turning Vehicle Non-Left Turning Vehicle Corrective Action 3% - Braking (No lockup)
2% - Accelerating
13% - Braking (No lockup) 12% - Braking (Lockup) 11% - Braking (Lockup Unknown) 6% - Steering Left 9% - Steering Right 1% - Braking and Steering Left 4% - Braking and Steering Right 1% - Unspecified action
Causal Factors (NMVCCS) Driver Fatigued 6% - Driver fatigued Inattention 8% - Inattention factors Driver Conversing 9% - Conversing Misjudgment of Distance/Speed 16% - Misjudgment of distance/speed factors False Assumption 5% - False assumption factors Inadequate Evasive Action 0% - Inadequate evasive action factors Critical Reason 1% - No critical reason
0% - Sleepy 0% - Ill/blackout 98% - Driver error 0% - Vehicle issues 1% - Weather /road /sign-signal issues
Inadequate Surveillance 77% - Inadequate surveillance factors Other Driver Recognition Factors 14% - Other recognition factors Following Too Closely 0% - Following too closely factors Other Driver Decision Factors 40% - Other decision factors
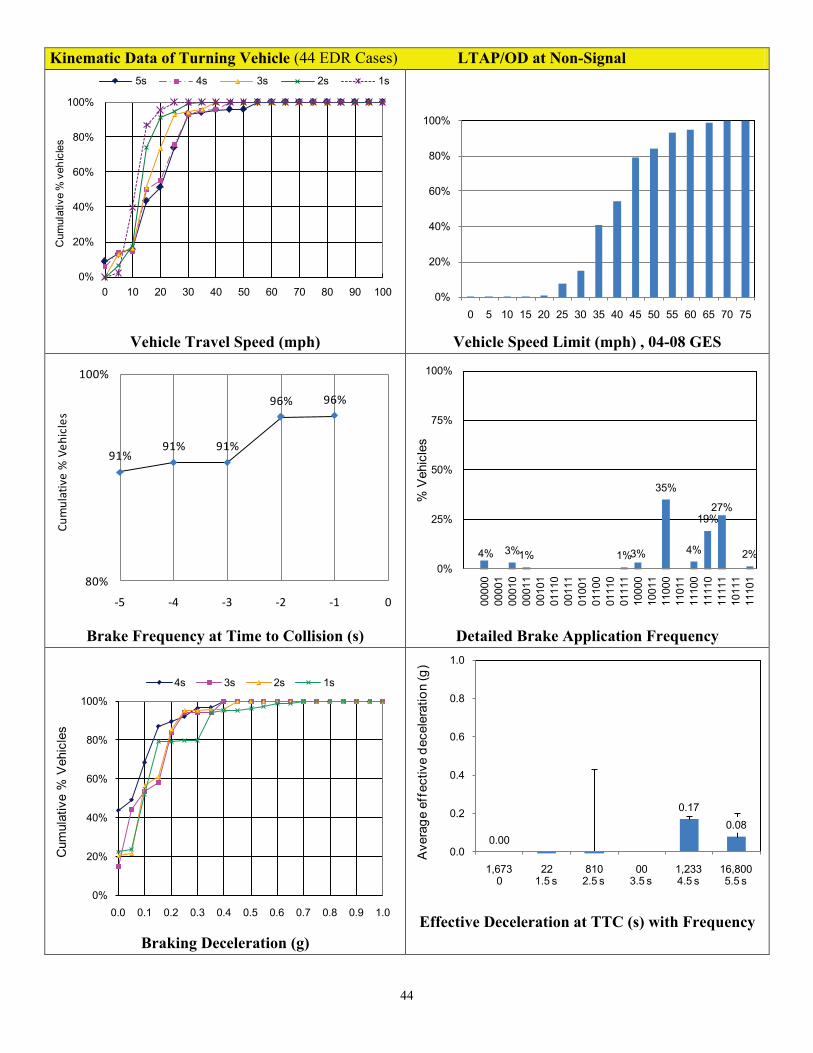
44
Kinematic Data of Turning Vehicle (44 EDR Cases) LTAP/OD at Non-Signal
0%
20%
40%
60%
80%
100%
0 10 20 30 40 50 60 70 80 90 100
Cum
ulat
ive
% v
ehic
les
5s 4s 3s 2s 1s
Vehicle Travel Speed (mph)
0%
20%
40%
60%
80%
100%
0 5 10 15 20 25 30 35 40 45 50 55 60 65 70 75
Vehicle Speed Limit (mph) , 04-08 GES
96%96%
91%91%91%
80%
100%
-5 -4 -3 -2 -1 0
Cum
ulat
ive
% V
ehic
les
Brake Frequency at Time to Collision (s)
4% 3%1% 1%3%
35%
4%
19%27%
2%0%
25%
50%
75%
100%
0000
000
001
0001
000
011
0010
101
110
0011
101
001
0110
001
110
0111
110
000
1001
111
000
1101
111
100
1111
011
111
1011
111
101
% V
ehic
les
Detailed Brake Application Frequency
0%
20%
40%
60%
80%
100%
0.0 0.1 0.2 0.3 0.4 0.5 0.6 0.7 0.8 0.9 1.0
Cum
ulat
ive
% V
ehic
les
4s 3s 2s 1s
Braking Deceleration (g)
0.00
0.170.08
0.0
0.2
0.4
0.6
0.8
1.0
1,6730
221.5 s
8102.5 s
003.5 s
1,2334.5 s
16,8005.5 s
Ave
rage
eff
ectiv
e de
cele
ratio
n (g
)
Effective Deceleration at TTC (s) with Frequency

45
Kinematic Data of Non-Turning Vehicle (44 EDR Cases) LTAP/OD at Non-Signal
0%
20%
40%
60%
80%
100%
0 10 20 30 40 50 60 70 80 90 100
Cum
ulat
ive
% v
ehic
les
5s 4s 3s 2s 1s
Vehicle Travel Speed (mph)
0%
20%
40%
60%
80%
100%
0 5 10 15 20 25 30 35 40 45 50 55 60 65 70 75
Vehicle Speed Limit (mph) , 04-08 GES
85%
64%
7%6%5%
0%
20%
40%
60%
80%
100%
-5 -4 -3 -2 -1 0
Cum
ulat
ive
% V
ehic
les
Brake Frequency at Time to Collision (s)
15%
22%
56%
1% 1% 5%0%
25%
50%
75%
100%
0000
000
001
0001
000
011
0010
101
110
0100
101
001
0110
001
110
0111
110
000
1001
111
000
1101
111
100
1111
011
111
1011
111
101
% V
ehic
les
Detailed Brake Application Frequency
0%
20%
40%
60%
80%
100%
0.0 0.1 0.2 0.3 0.4 0.5 0.6 0.7 0.8 0.9 1.0
Cum
ulat
ive
% V
ehic
les
4s 3s 2s 1s
Braking Deceleration (g)
0.00
0.31
0.53
0.33
0.43
0.15
0.0
0.2
0.4
0.6
0.8
1.0
1,9530
2,8751.5 s
7,4292.5 s
1903.5 s
1154.5 s
6365.5 s
Ave
rage
eff
ectiv
e de
cele
ratio
n (g
)
Effective Deceleration at TTC (s) with Frequency

46
A3. Rear-End/Lead Vehicle Stopped Driving Environment Roadway Alignment × Roadway Surface Condition × Atmospheric Condition
74% - Straight, dry road surface with no adverse weather 13% - Straight, slippery road surface with adverse weather
Relation to Junction × Traffic Control Device
37% - Intersection or intersection related at RGY traffic signal 29% - Non-Junction without traffic controls
Lighting Condition 81% - Daylight 12% - Dark but lighted
Posted Speed Limit
0%10%20%30%40%50%60%70%80%90%
100%
0 5 10 15 20 25 30 35 40 45 50 55 60 65 70 75
Speed Limit (mph) Driver Characteristics Age 35% - 0 to 24 years
59% - 25 to 64 years 7% - 65 years or above
Gender 56% - Male 44% - Female
Driver Contributing Factors Alcohol 4% - Alcohol use Drugs < 1% - Drug use Physical Impairment < 1% - Physical impairment Violation Cited 55% - Violation cited Speeding 31% - Speeding Vision Obscured 2% - Obstruction Distraction 47% - Distracted
1% - Sleepy Vehicle Contributing Factors Contributing Factors 1% - Contributing Factors
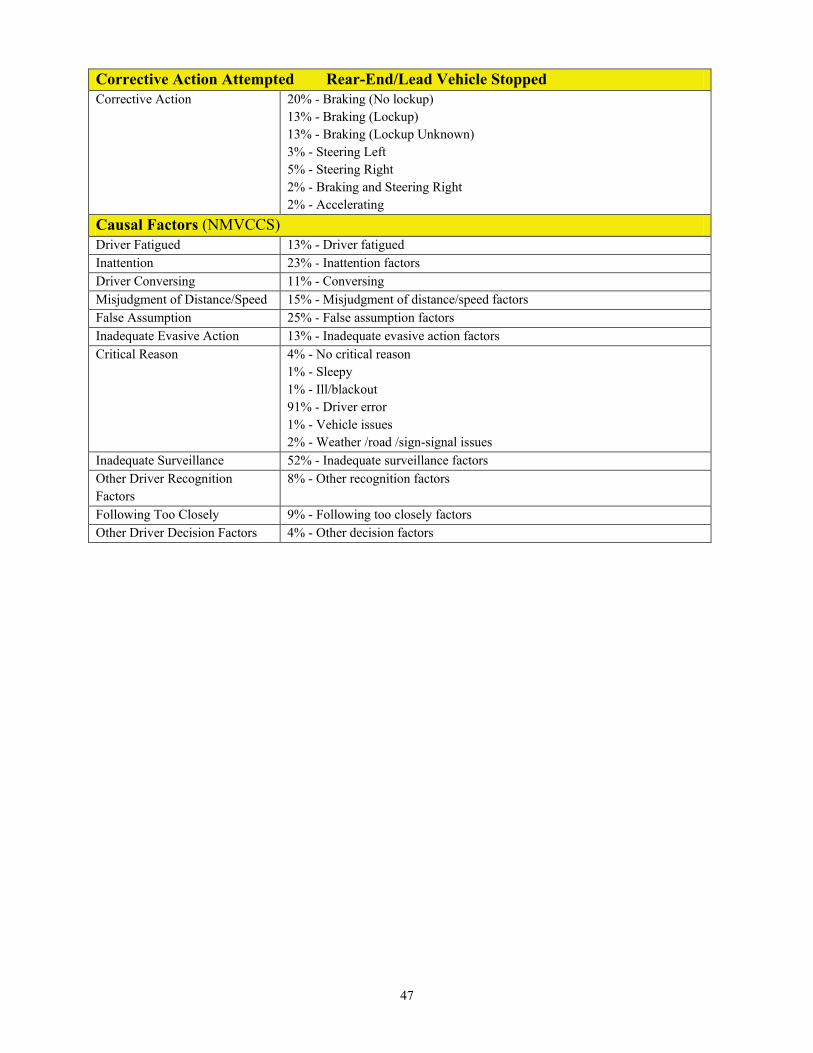
47
Corrective Action Attempted Rear-End/Lead Vehicle Stopped Corrective Action 20% - Braking (No lockup)
13% - Braking (Lockup) 13% - Braking (Lockup Unknown) 3% - Steering Left 5% - Steering Right 2% - Braking and Steering Right 2% - Accelerating
Causal Factors (NMVCCS) Driver Fatigued 13% - Driver fatigued Inattention 23% - Inattention factors Driver Conversing 11% - Conversing Misjudgment of Distance/Speed 15% - Misjudgment of distance/speed factors False Assumption 25% - False assumption factors Inadequate Evasive Action 13% - Inadequate evasive action factors Critical Reason 4% - No critical reason
1% - Sleepy 1% - Ill/blackout 91% - Driver error 1% - Vehicle issues 2% - Weather /road /sign-signal issues
Inadequate Surveillance 52% - Inadequate surveillance factors Other Driver Recognition Factors
8% - Other recognition factors
Following Too Closely 9% - Following too closely factors Other Driver Decision Factors 4% - Other decision factors

48
Kinematic Data (99 EDR Cases) Rear-End/Lead Vehicle Stopped
0%
20%
40%
60%
80%
100%
0 10 20 30 40 50 60 70 80 90 100
Cum
ulat
ive
% v
ehic
les
5s 4s 3s 2s 1s
Vehicle Travel Speed (mph)
0%
20%
40%
60%
80%
100%
0 5 10 15 20 25 30 35 40 45 50 55 60 65 70 75
Vehicle Speed Limit (mph) , 04-08 GES
81%
38%
23%14%11%
0%
20%
40%
60%
80%
100%
-5 -4 -3 -2 -1 0
Cum
ulat
ive %
Veh
icle
s
Brake Frequency at Time to Collision (s)
19%
44%
15%9%
3%4% 1% 4%2%
0%
25%
50%
75%
100%
0000
000
001
0001
000
011
0010
101
110
0011
101
001
0110
001
110
0111
110
000
1001
111
000
1101
111
100
1111
011
111
1011
111
101
% V
ehic
les
Detailed Brake Application Frequency
0%
20%
40%
60%
80%
100%
0.0 0.1 0.2 0.3 0.4 0.5 0.6 0.7 0.8 0.9 1.0
Cum
ulat
ive %
Veh
icle
s
4s 3s 2s 1s
Braking Deceleration (g)
0.34
0.490.42
0.25
0.11
0.0
0.2
0.4
0.6
0.8
1.0
13,3060
31,2981.5 s
10,4612.5 s
6,3783.5 s
2,3684.5 s
7,9085.5 s
Ave
rage
eff
ectiv
e de
cele
ratio
n (g
)
Effective Deceleration at TTC (s) with Frequency

49
A4. Rear-End/Lead Vehicle Decelerating Driving Environment Roadway Alignment × Roadway Surface Condition × Atmospheric Condition
74% - Straight, dry road surface with no adverse weather 13% - Straight, slippery road surface with adverse weather
Relation to Junction × Traffic Control Device
47% - Non-Junction without traffic controls 19% - Intersection or intersection related at RGY traffic signal 11% - Intersection or intersection related without traffic controls
Lighting Condition 82% - Daylight 10% - Dark but lighted
Posted Speed Limit
0%10%20%30%40%50%60%70%80%90%
100%
0 5 10 15 20 25 30 35 40 45 50 55 60 65 70 75
Speed Limit (mph) Driver Characteristics Age 38% - 0 to 24 years
58% - 25 to 64 years 4% - 65 years or above
Gender 58% - Male 42% - Female
Driver Contributing Factors Alcohol 2% - Alcohol use Drugs < 1% - Drug use Physical Impairment < 1% - Physical impairment Violation Cited 51% - Violation cited Speeding 34% - Speeding Vision Obscured 2% - Obstruction Distraction 38% - Distracted Vehicle Contributing Factors Contributing Factors < 1% - Contributing Factors

50
Corrective Action Attempted Rear-End/Lead Vehicle Decelerating Corrective Action 23 % - Braking (No lockup)
14 % - Braking (Lockup) 12 % - Braking (Lockup Unknown) 4 % - Steering Left 6 % - Steering Right 2 % - Braking and Steering Left 3 % - Braking and Steering Right
Causal Factors (NMVCCS) Driver Fatigued 13% - Driver fatigued Inattention 18% - Inattention factors Driver Conversing 8% - Conversing Misjudgment of Distance/Speed 8% - Misjudgment of distance/speed factors False Assumption 12% - False assumption factors Inadequate Evasive Action 3% - Inadequate evasive action factors Critical Reason 51% - No critical reason
0% - Sleepy 1% - Ill/blackout 47% - Driver error 0% - Vehicle issues 1% - Weather /road /sign-signal issues
Inadequate Surveillance 29% - Inadequate surveillance factors Other Driver Recognition Factors 3% - Other recognition factors Following Too Closely 20% - Following too closely factors Other Driver Decision Factors 3% - Other decision factors
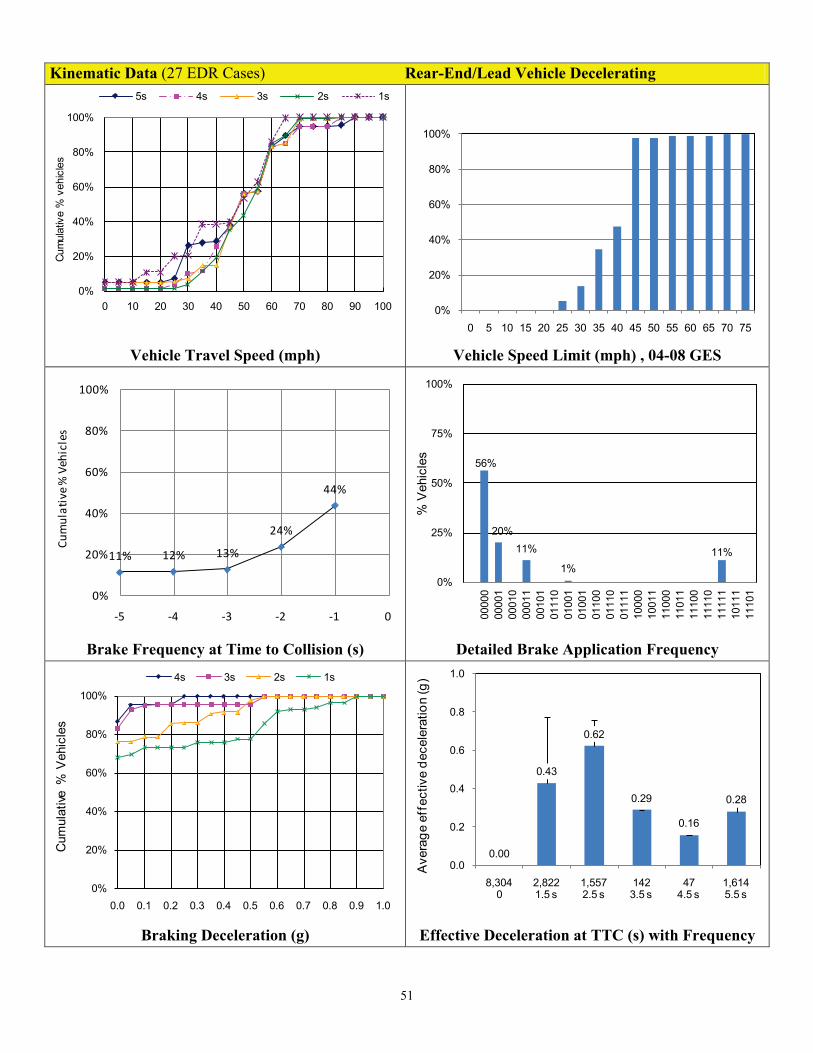
51
Kinematic Data (27 EDR Cases) Rear-End/Lead Vehicle Decelerating
0%
20%
40%
60%
80%
100%
0 10 20 30 40 50 60 70 80 90 100
Cum
ulat
ive
% v
ehic
les
5s 4s 3s 2s 1s
Vehicle Travel Speed (mph)
0%
20%
40%
60%
80%
100%
0 5 10 15 20 25 30 35 40 45 50 55 60 65 70 75
Vehicle Speed Limit (mph) , 04-08 GES
44%
24%
13%12%11%
0%
20%
40%
60%
80%
100%
-5 -4 -3 -2 -1
Cum
ulat
ive %
Veh
icle
s
0
56%
20%11%
1%11%
0%
25%
50%
75%
100%
0000
000
001
0001
000
011
0010
101
110
0100
101
001
0110
001
110
0111
110
000
1001
111
000
1101
111
100
1111
011
111
1011
111
101
% V
ehic
les
Detailed Brake Application Frequency Brake Frequency at Time to Collision (s)
0%
20%
40%
60%
80%
100%
0.0 0.1 0.2 0.3 0.4 0.5 0.6 0.7 0.8 0.9 1.0
Cum
ulat
ive %
Veh
icle
s
4s 3s 2s 1s
Braking Deceleration (g)
0.00
0.43
0.62
0.29
0.16
0.28
0.0
0.2
0.4
0.6
0.8
1.0
8,3040
2,8221.5 s
1,5572.5 s
1423.5 s
474.5 s
1,6145.5 s
Ave
rage
eff
ectiv
e de
cele
ratio
n (g
)
Effective Deceleration at TTC (s) with Frequency

52
A5. Rear-End/Lead Vehicle Moving at Slower Constant Speed Driving Environment Roadway Alignment × Roadway Surface Condition × Atmospheric Condition
76% - Straight, dry road surface with no adverse weather 12% - Straight, slippery road surface with adverse weather
Relation to Junction × Traffic Control Device
58% - Non-Junction without traffic controls 18% - Intersection or intersection related at RGY traffic signal
Lighting Condition 75% - Daylight 14% - Dark but lighted
0%10%20%30%40%50%60%70%80%90%
100%
0 5 10 15 20 25 30 35 40 45 50 55 60 65 70 75
Speed Limit (mph)
Posted Speed Limit
Driver Characteristics Age 36% - 0 to 24 years
59% - 25 to 64 years 5% - 65 years or above
Gender 61% - Male 39% - Female
Driver Contributing Factors Alcohol 7% - Alcohol use Drugs < 1% - Drug use Physical Impairment 2% - Sleepy Violation Cited 51% - Violation cited Speeding 32% - Speeding Vision Obscured 2% - Obstruction Distraction 36% - Distracted Vehicle Contributing Factors Contributing Factors < 1% - Contributing Factors
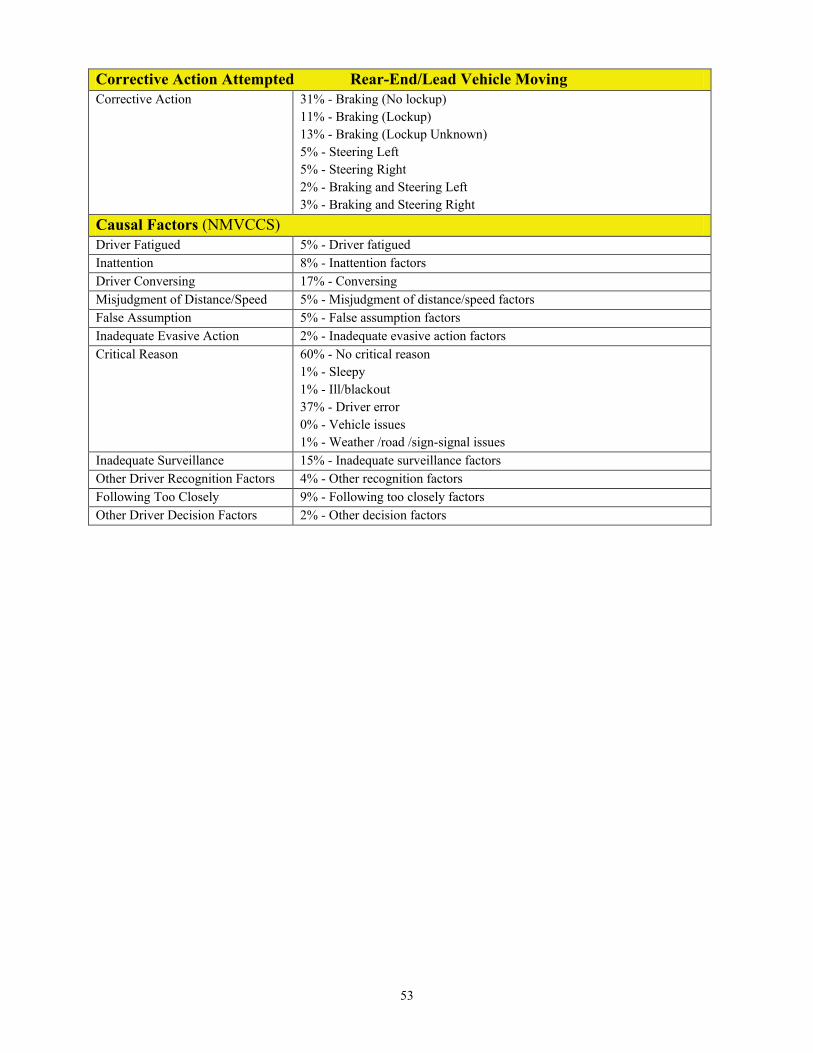
53
Corrective Action Attempted Rear-End/Lead Vehicle Moving Corrective Action 31% - Braking (No lockup)
11% - Braking (Lockup) 13% - Braking (Lockup Unknown) 5% - Steering Left 5% - Steering Right 2% - Braking and Steering Left 3% - Braking and Steering Right
Causal Factors (NMVCCS) Driver Fatigued 5% - Driver fatigued Inattention 8% - Inattention factors Driver Conversing 17% - Conversing Misjudgment of Distance/Speed 5% - Misjudgment of distance/speed factors False Assumption 5% - False assumption factors Inadequate Evasive Action 2% - Inadequate evasive action factors Critical Reason 60% - No critical reason
1% - Sleepy 1% - Ill/blackout 37% - Driver error 0% - Vehicle issues 1% - Weather /road /sign-signal issues
Inadequate Surveillance 15% - Inadequate surveillance factors Other Driver Recognition Factors 4% - Other recognition factors Following Too Closely 9% - Following too closely factors Other Driver Decision Factors 2% - Other decision factors
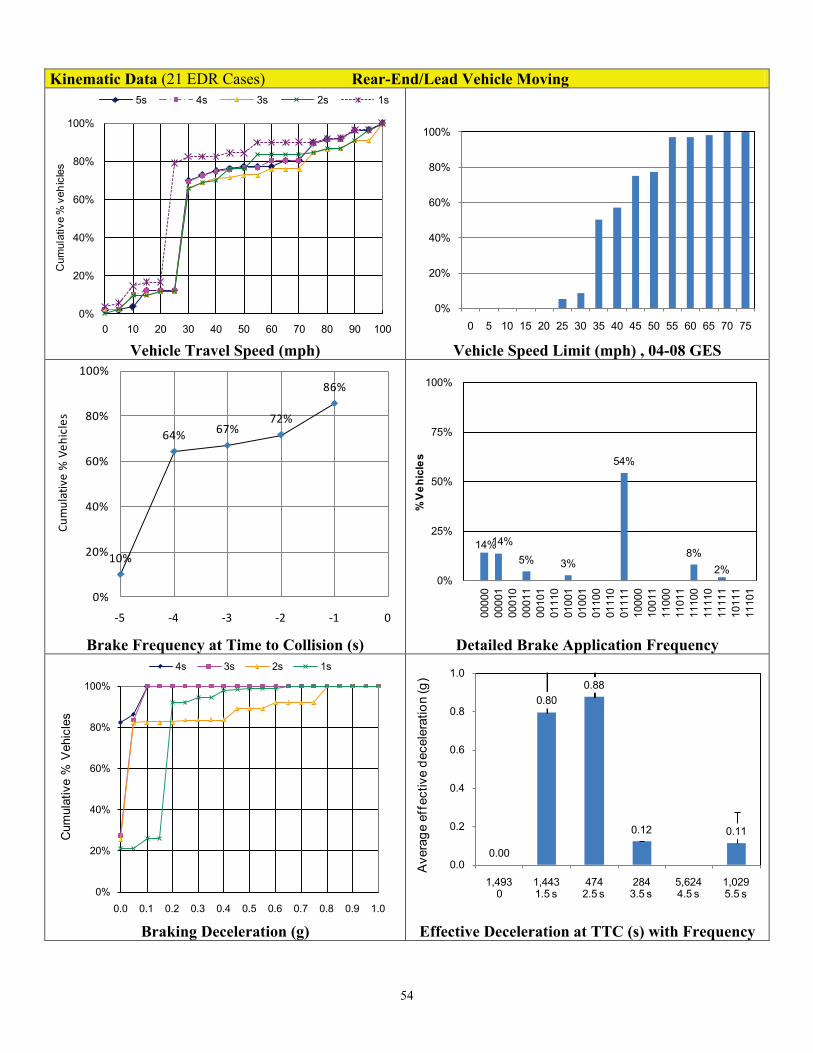
54
Kinematic Data (21 EDR Cases) Rear-End/Lead Vehicle Moving
0%
20%
40%
60%
80%
100%
0 10 20 30 40 50 60 70 80 90 100
Cum
ulat
ive
% v
ehic
les
5s 4s 3s 2s 1s
Vehicle Travel Speed (mph)
0%
20%
40%
60%
80%
100%
0 5 10 15 20 25 30 35 40 45 50 55 60 65 70 75
Vehicle Speed Limit (mph) , 04-08 GES
86%
72%67%64%
10%
0%
20%
40%
60%
80%
100%
-5 -4 -3 -2 -1 0
Cum
ulat
ive
% V
ehic
les
14%14%
5% 3%
54%
8%2%
0%
25%
50%
75%
100%
0000
000
001
0001
000
011
0010
101
110
0100
101
001
0110
001
110
0111
110
000
1001
111
000
1101
111
100
1111
011
111
1011
111
101
% V
ehic
les
Brake Frequency at Time to Collision (s) Detailed Brake Application Frequency
0%
20%
40%
60%
80%
100%
0.0 0.1 0.2 0.3 0.4 0.5 0.6 0.7 0.8 0.9 1.0
Cum
ulat
ive
% V
ehic
les
4s 3s 2s 1s
Braking Deceleration (g)
0.00
0.800.88
0.12 0.11
0.0
0.2
0.4
0.6
0.8
1.0
1,4930
1,4431.5 s
4742.5 s
2843.5 s
5,6244.5 s
1,0295.5 s
Ave
rage
eff
ectiv
e de
cele
ratio
n (g
)
Effective Deceleration at TTC (s) with Frequency

55
A6. Opposite Direction/No Maneuver Driving Environment Roadway Alignment × Roadway Surface Condition × Atmospheric Condition
47% - Straight, dry road surface with no adverse weather 26% - Curve, dry road surface with no adverse weather 10% - Straight, slippery road surface with adverse weather
Relation to Junction × Traffic Control Device
78% - Non-Junction without traffic controls
Lighting Condition 67% - Daylight 16% - Dark 13% - Dark but lighted
0%10%20%30%40%50%60%70%80%90%
100%
0 5 10 15 20 25 30 35 40 45 50 55 60 65 70 75
Speed Limit (mph)
33% - 0 to 24 years
Posted Speed Limit
Driver Characteristics Age
60% - 25 to 64 years 7% - 65 years or above
Gender 65% - Male 35% - Female
Driver Contributing Factors Alcohol: 12% - Alcohol use Drugs 2% - Drug use Physical Impairment 4% - Sleepy
1% - Ill, blackout Violation Cited 39% - Violation cited Speeding 10% - Speeding Vision Obscured 5% - Obstruction Distraction 24% - Distracted Vehicle Contributing Factors Contributing Factors 1% - Contributing Factors

56
Corrective Action Attempted Opposite Direction / No Maneuver Corrective Action 2% - Braking (No lockup)
5% - Braking (Lockup) 3% - Braking (Lockup Unknown) 17% - Steering Left 49% - Steering Right 2% - Braking and Steering Left 3% - Braking and Steering Right 1% - Unspecified action
Causal Factors (NMVCCS) (Combined values for Opposite Direction/Maneuver and No Maneuver)
Driver Fatigued 26% - Driver fatigued Inattention 10% - Inattention factors Driver Conversing 14% - Conversing Misjudgment of Distance/Speed 0% - Misjudgment of distance/speed factors False Assumption 2% - False assumption factors Inadequate Evasive Action 24% - Inadequate evasive action factors Critical Reason 1% - No critical reason
6% - Sleepy 7% - Ill/blackout 84% - Driver error 1% - Vehicle issues 2% - Weather /road /sign-signal issues
Inadequate Surveillance 20% - Inadequate surveillance factors Other Driver Recognition Factors 6% - Other recognition factors Following Too Closely 0% - Following too closely factors Other Driver Decision Factors 3% - Other decision factors

57
Kinematic Data (40 EDR Cases) Opposite Direction/No Maneuver
0%
20%
40%
60%
80%
100%
0 10 20 30 40 50 60 70 80 90 100
Cum
ulat
ive
% v
ehic
les
5s 4s 3s 2s 1s
Vehicle Travel Speed (mph)
0%
20%
40%
60%
80%
100%
0 5 10 15 20 25 30 35 40 45 50 55 60 65 70 75
Vehicle Speed Limit (mph) , 04-08 GES
66%
41%
18%18%18%
0%
20%
40%
60%
80%
100%
-5 -4 -3 -2 -1 0
Cum
ulat
ive %
Veh
icle
s
Brake Frequency at Time to Collision (s)
34%25% 23%
18%
0%
25%
50%
75%
100%
0000
000
001
0001
000
011
0010
101
110
0011
101
001
0110
001
110
0111
110
000
1001
111
000
1101
111
100
1111
011
111
1011
111
101
% V
ehic
les
Detailed Brake Application Frequency
0%
20%
40%
60%
80%
100%
0.0 0.1 0.2 0.3 0.4 0.5 0.6 0.7 0.8 0.9 1.0
Cum
ulat
ive %
Veh
icle
s
4s 3s 2s 1s
Braking Deceleration (g)
0.00
0.36
0.51 0.50
0.14
0.0
0.2
0.4
0.6
0.8
1.0
2,5560
1,9051.5 s
1,7732.5 s
003.5 s
294.5 s
1,3425.5 s
Ave
rage
eff
ectiv
e de
cele
ratio
n (g
)
Effective Deceleration at TTC (s) with Frequency
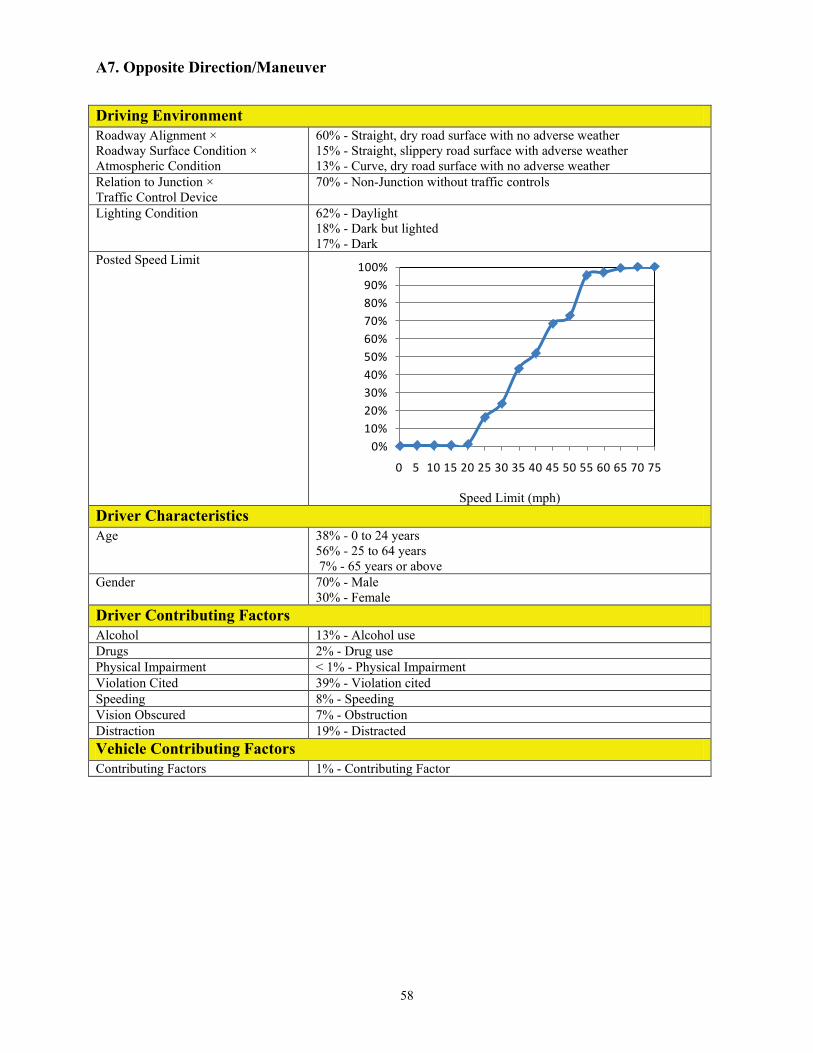
58
A7. Opposite Direction/Maneuver Driving Environment Roadway Alignment × Roadway Surface Condition × Atmospheric Condition
60% - Straight, dry road surface with no adverse weather 15% - Straight, slippery road surface with adverse weather 13% - Curve, dry road surface with no adverse weather
Relation to Junction × Traffic Control Device
70% - Non-Junction without traffic controls
Lighting Condition 62% - Daylight 18% - Dark but lighted 17% - Dark
0%10%20%30%40%50%60%70%80%90%
100%
0 5 10 15 20 25 30 35 40 45 50 55 60 65 70 75
Posted Speed Limit
Speed Limit (mph) Driver Characteristics Age 38% - 0 to 24 years
56% - 25 to 64 years 7% - 65 years or above
Gender 70% - Male 30% - Female
Driver Contributing Factors Alcohol 13% - Alcohol use Drugs 2% - Drug use Physical Impairment < 1% - Physical Impairment Violation Cited 39% - Violation cited Speeding 8% - Speeding Vision Obscured 7% - Obstruction Distraction 19% - Distracted Vehicle Contributing Factors Contributing Factors 1% - Contributing Factor

59
Corrective Action Attempted Opposite Direction/Maneuver Corrective Action 3% - Braking (Lockup)
36% - Steering Left 38% - Steering Right 3% - Braking and Steering Left 1% - Braking and Steering Right 1% - Accelerating
Causal Factors (NMVCCS) (Combined values for Opposite Direction/Maneuver and No Maneuver)
Driver Fatigued 26% - Driver fatigued Inattention 10% - Inattention factors Driver Conversing 14% - Conversing Misjudgment of Distance/Speed 0% - Misjudgment of distance/speed factors False Assumption 2% - False assumption factors Inadequate Evasive Action 24% - Inadequate evasive action factors Critical Reason 1% - No critical reason
6% - Sleepy 7% - Ill/blackout 84% - Driver error 1% - Vehicle issues 2% - Weather /road /sign-signal issues
Inadequate Surveillance 20% - Inadequate surveillance factors Other Driver Recognition Factors 6% - Other recognition factors Following Too Closely 0% - Following too closely factors Other Driver Decision Factors 3% - Other decision factors

60
A8. Changing Lanes/Same Direction Driving Environment Roadway Alignment × Roadway Surface Condition × Atmospheric Condition
78% - Straight, dry road surface with no adverse weather 9% - Straight, slippery road surface with adverse weather
Relation to Junction × Traffic Control Device
65% - Non-Junction without traffic controls 11% - Intersection or intersection related at RGY traffic signal
Lighting Condition 75% - Daylight 15% - Dark but lighted
Posted Speed Limit
0%10%20%30%40%50%60%70%80%90%
100%
0 5 10 15 20 25 30 35 40 45 50 55 60 65 70 75
Speed Limit (mph) Driver Characteristics Age 32% - 0 to 24 years
59% - 25 to 64 years 10% - 65 years or above
Gender 59% - Male 41% - Female
Driver Contributing Factors Alcohol 4% - Alcohol use Drugs < 1% - Drug use Physical Impairment < 1% - Physical Impairment Violation Cited 42% - Violation cited Speeding 4% - Speeding Vision Obscured 2% - Obstruction Distraction 28% - Distracted Vehicle Contributing Factors Contributing Factors < 1% - Contributing Factors

61
Corrective Action Attempted Changing Lanes/Same Direction Corrective Action 2% - Braking (Lockup)
20% - Steering Left 20% - Steering Right 2% - Braking and Steering Left 2% - Braking and Steering Right
Causal Factors (NMVCCS) (Combined values for Changing Lanes, Turning and Drifting Same Direction)
Driver Fatigued 15% - Driver fatigued Inattention 14% - Inattention factors Driver Conversing 17% - Conversing Misjudgment of Distance/Speed 8% - Misjudgment of distance/speed factors False Assumption 17% - False assumption factors Inadequate Evasive Action 5% - Inadequate evasive action factors Critical Reason 6% - No critical reason
2% - Sleepy 2% - Ill/blackout 88% - Driver error 2% - Vehicle issues 0% - Weather /road /sign-signal issues
Inadequate Surveillance 59% - Inadequate surveillance factors Other Driver Recognition Factors 5% - Other recognition factors Following Too Closely 3% - Following too closely factors Other Driver Decision Factors 14% - Other decision factors

62
Kinematic Data (16 EDR Cases) Changing Lanes/Same Direction
0%
20%
40%
60%
80%
100%
0 10 20 30 40 50 60 70 80 90 100
Cum
ulat
ive
% v
ehic
les
5s 4s 3s 2s 1s
Vehicle Travel Speed (mph)
0%
20%
40%
60%
80%
100%
0 5 10 15 20 25 30 35 40 45 50 55 60 65 70 75
Vehicle Speed Limit (mph) , 04-08 GES
47%43%40%40%40%
0%
20%
40%
60%
80%
100%
-5 -4 -3 -2 -1 0
Cum
ulat
ive
% V
ehic
les
Brake Frequency at Time to Collision (s)
53%
5%2%1% 5% 1%
11%
23%
0%
25%
50%
75%
100%
0000
000
001
0001
000
011
0010
101
110
0100
101
001
0110
001
110
0111
110
000
1001
111
000
1101
111
100
1111
011
111
1011
111
101
% V
ehic
les
Detailed Brake Application Frequency
0%
20%
40%
60%
80%
100%
0.0 0.1 0.2 0.3 0.4 0.5 0.6 0.7 0.8 0.9 1.0
Cum
ulat
ive
% V
ehic
les
4s 3s 2s 1s
Braking Deceleration (g)
0.00
0.50
0.25
0.0
0.2
0.4
0.6
0.8
1.0
2,2800
2071.5 s
1132.5 s
003.5 s
004.5 s
1,7365.5 s
Ave
rage
eff
ectiv
e de
cele
ratio
n (g
)
Effective Deceleration at TTC (s) with Frequency

63
A9. Turning/Same Direction Driving Environment Roadway Alignment × Roadway Surface Condition × Atmospheric Condition
78% - Straight, dry road surface with no adverse weather 9% - Straight, slippery road surface with adverse weather
Relation to Junction × Traffic Control Device
26% - Intersection or intersection related at RGY traffic signal 25% - Intersection or intersection related without traffic controls 25% - Driveway, alley, etc. without traffic controls
Lighting Condition 80% - Daylight 13% - Dark but lighted
Posted Speed Limit
0%10%20%30%40%50%60%70%80%90%
100%
0 5 10 15 20 25 30 35 40 45 50 55 60 65 70 75
Speed Limit (mph) Driver Characteristics Age 26% - 0 to 24 years
65% - 25 to 64 years 10% - 65 years or above
Gender 55% - Male 45% - Female
Driver Contributing Factors Alcohol 2% - Alcohol use Drugs < 1% - Drug use Physical Impairment < 1% - Physical Impairment Violation Cited 28% - Violation cited Speeding 1% - Speeding Vision Obscured 1% - Obstruction Distraction 17% - Distracted Vehicle Contributing Factors Contributing Factors < 1% - Contributing Factors

64
Corrective Action Attempted Turning/Same Direction Corrective Action 2% - Braking (No lockup)
2% - Steering Right Causal Factors (NMVCCS)
(Combined values for Changing Lanes, Turning and Drifting Same Direction) Fatigue 15% - Driver fatigued Inattention 14% - Inattention factors Conversing 17% - Conversing Misjudgment of Distance/Speed 8% - Misjudgment of distance/speed factors False Assumption of Others’ Action
17% - False assumption factors
Inadequate Evasive Action 5% - Inadequate evasive action factors Critical Reason 6% - No critical reason
2% - Sleepy 2% - Ill/blackout 88% - Driver error 2% - Vehicle issues 0% - Weather /road /sign-signal issues
Inadequate Surveillance 59% - Inadequate surveillance factors Other Recognition Factors 5% - Other recognition factors Following Too Close 3% - Following too closely factors Other Decision Errors 14% - Other decision factors

65
A10. Drifting/Same Direction Driving Environment Roadway Alignment × Roadway Surface Condition × Atmospheric Condition
71% - Straight, dry road surface with no adverse weather 12% - Straight, slippery road surface with adverse weather
Relation to Junction × Traffic Control Device
60% - Non-Junction without traffic controls 15% - Intersection or intersection related at RGY traffic signal
Lighting Condition 71% - Daylight 18% - Dark but lighted
Posted Speed Limit
0%10%20%30%40%50%60%70%80%90%
100%
0 5 10 15 20 25 30 35 40 45 50 55 60 65 70 75
Speed Limit (mph) Driver Characteristics Age 27% - 0 to 24 years
63% - 25 to 64 years 9% - 65 years or above
Gender 66% - Male 34% - Female
Driver Contributing Factors Alcohol 9% - Alcohol use Drugs 1% - Drug use Physical Impairment 2% - Sleepy Violation Cited 33% - Violation cited Speeding 7% - Speeding Vision Obscured 2% - Obstruction Distraction 28% - Distracted Vehicle Contributing Factors Contributing Factors < 1% - Contributing Factors

66
Corrective Action Attempted Drifting/Same Direction Corrective Action 2% - Braking (No lockup)
3% - Braking (Lockup) 1% - Braking (Lockup Unknown) 9% - Steering Left 16% - Steering Right 2% - Braking and Steering Left 1% - Unspecified action
Causal Factors (NMVCCS) (Combined values for Changing Lanes, Turning and Drifting Same Direction)
Driver Fatigued 15% - Driver fatigued Inattention 14% - Inattention factors Driver Conversing 17% - Conversing Misjudgment of Distance/Speed 8% - Misjudgment of distance/speed factors False Assumption 17% - False assumption factors Inadequate Evasive Action 5% - Inadequate evasive action factors Critical Reason 6% - No critical reason
2% - Sleepy 2% - Ill/blackout 88% - Driver error 2% - Vehicle issues 0% - Weather /road /sign-signal issues
Inadequate Surveillance 59% - Inadequate surveillance factors Other Driver Recognition Factors
5% - Other recognition factors
Following Too Closely 3% - Following too closely factors Other Driver Decision Factors 14% - Other decision factors

DOT HS 811 732April 2013
9356-040813-v1c
![Crash Consistency: FSCK and Journalingnyx.skku.ac.kr/wp-content/uploads/2018/03/OS17-Crash... · 2018-05-17 · Dongkun Shin, SKKU 5 Crash Scenarios - Two writes succeed • I[v2]](https://img.pdfslide.net/doc/110x75/5e9efd5ea97ce91d3b62b97a/crash-consistency-fsck-and-2018-05-17-dongkun-shin-skku-5-crash-scenarios-.jpg)