Embed Size (px)
Citation preview

International Research Journal of Biological Sciences ___________________________________ ISSN 2278-3202
Vol. 3(6), 6-17, June (2014) Int. Res. J. Biological Sci.
International Science Congress Association 6
Describing the Body Shapes of three populations of Sardinella lemuru
(Bleeker, 1853) from Mindanao Island, Philippines Using Relative Warp
Analysis
Aprille Joy M. Luceño, Mark Anthony J. Torres, Sharon Rose M. Tabugo and Cesar G. Demayo Department of Biological Sciences, MSU-Iligan Institute of Technology, 9200 Iligan City, PHILIPPINES
Available online at: www.isca.in, www.isca.me Received 4th September 2013, revised 20th December 2013, accepted 15th January 2014
Abstract
This study utilized landmark-based geometric morphometrics to determine and describe the body shape variation of
Sardinella lemuru populations collected from the bays of Butuan City, Dipolog City, and Pagadian City in Mindanao,
Philippines. A total of 30 males and 30 females from each sampling site were digitized and landmarked using 18 landmark
points in the fish’s body. Relative warps (RW) for within and between populations were obtained. Significant results for
variation between sexes were emphasized by multivariate analysis of variance (MANOVA), canonical variate analysis (CVA),
and discriminant function analysis (DFA). RWs show that females exhibit body shapes that are geared to support large
number of eggs (i.e. distended belly area) ensuring successful reproductive rate while males exhibit a more slender body and
are generally smaller than females. Significant differences were also observed between populations of S. lemuru which can
be attributed to geographic isolation permitting little to no interaction between populations. Environmental factors,
overfishing/overexploitation could also be considered as factors influencing these morphological variations. Hence, this
study showed that landmark-based geometric morphometric methods is an effective tool in describing body shape variations
that exist within and between populations of S. lemuru. This initial method in distinguishing between populations is important
in proper management of these species.
Keywords: Sardinella lemuru, Geometric morphometrics, relative warps, sexual dimorphism, overfishing/ overexploitation,
geographic isolation.
Introduction
Sardines belong to Family Clupeidae, Subfamily Clupeinae.
They have a compressed, silvery, streamlined body, protruding
scales, and a single soft-rayed dorsal fin. They have a two-lobed
non-functional lung and are known for their oily flesh1. Having
an average small size, they inhabit shallow depths of coastal
water or at times in estuaries. They are widely distributed across
the globe both on temperate and tropical marine areas where
they feed mainly on planktons and thrive through large schools2.
In the Philippines, they are locally known as tamban. Sardines
in the Philippines form shoals in coastal waters over the
continental shelf where depth is less than 200 meters3.
Sardinella lemuru is one of the top ten most important species
in terms of commercial fishing in the Philippines4. Since the
1950’s, sardines comprised the largest proportion of landed
catch in the Philippines5 and consequently are the most
accessible source of protein for millions of Filipinos3. Important
economic uses of S. lemuru aside from being consumed as fresh
fish, they are also processed for fishmeal, canning, and also
dried for consumption. The ones used for canning are those high
quality lager-sized fish, while smaller, along with spoiled bigger
fishes, are processed for fishmeal. Ecologically, sardines are
basally positioned in a food web that supports pelagic tuna and
mackerel, as well as numerous sea birds and marine mammals3.
Despite its economic and ecological importance, only a few
studies on Philippine sardines, with emphasis on its diversity,
were done and only a little of these are published. Stock
information is scarce and the data are outdated, with the
exception of the fish’s catch statistics. However, several
assessments on stocks determined that the fishery was
overfished6. A review of the sardine stocks in the Philippines at
the national level appear to be healthy, however certain areas
started to show signs of depletion particularly sardines in the
western and central Visayas based on the data from National
Stock Assessment Program (NSAP)3. These sardines have been
reported to be under heavy fishing pressure in particular, with
stocks of S. gibbosa, S. fimbriata, and S. lemuru being
overexploited7. This evidence of overexploitation is justified by
standard length data of captured fish which is currently less than
the standard length at first maturity for the above mentioned
species.
Since all fish species have already established their genetic
adaptations to the present environmental conditions before
serious exploitation, such current, drastic effects of exploitation
can totally affect their life-history patterns8. In other words,
fishing not only decreases the abundance of fish, but also
changes their genetic composition8. Hence, change in genetic

International Research Journal of Biological Sciences ________________________________________________ ISSN 2278-3202
Vol. 3(6), 6-17, June (2014) Int. Res. J. Biological Sci.
International Science Congress Association 7
composition influences change and/or variation in the
phenotype, and thus morphology of the individual. In light of
this, it is the aim of this study to investigate on the different
body shape variations that could be occurring within and
between the three different populations (i.e. geographically
isolated) of S. lemuru through the use of landmark based
geometric morphometric analysis. This is important since body
shape gives an idea to the different adaptations developed by the
fish in a particular environment and for stock assessment as
well. A study conducted found significant morphological
variation in body shapes between sexes of the white goby
(Glossogobius giuris) using geometric morphometric analysis9.
Another study regarding morphological variation as well as
sexual dimorphism was observed in Hypseleotris agilis also by
the use of the same method10
. Geometric morphometric analysis
also proved to be successful in describing morphological
variations within and among populations in a species of golden
apple snail (Pomacea canaliculata)11
.
Butuan Bay, Dipolog Bay, and Pagadian Bay are areas in
Mindanao, Philippines where S. lemuru is widely fished, and
probably overexploited. Additionally, it is important to study
body shape since it gives an idea on the examination of S.
lemuru’s evolution in these three areas. Body shape affects
efficiency in locomotion in different environments, especially
when fishes are searching for food and in escaping predators.
Since fishes live in water which is a dense medium, their body
shape chiefly influences behavioural performance
characteristics, which can also be observed in other aquatic or
marine organisms. Thus, body shape variation can tell about
behavioural and ecological differences12
. Moreover, studying
body shape is vital for the evolutionary analysis of variation
with respect to the environment, among fish populations and
allows for theories by emphasizing adaptation to local
environmental conditions13-14
. Therefore, morphometric studies
can provide useful information on the evolution of fishes13,15-20
.
Material and Methods
Collection of Samples: Sardinella lemuru (figure 2) samples
were collected from the bays of Butuan City, Dipolog City, and
Pagadian City. There were 30 males and 30 females obtained
from each site respectively. Figure 1 below shows the location
of the three sampling sites. The specimens were processed right
after they were gathered since this species of fish can be easily
damaged. Sex was determined through a thorough examination
of the fish’s gonads. The samples were kept in ice buckets for
preservation and then image acquisition followed. These images
were then used for morphometric analysis.
Figure-1
Sampling sites (Butuan City, Dipolog City, Pagadian City) with reference to the whole archipelago of the Philippines.
(Source: www.maps.google.com)

International Research Journal of Biological Sciences ________________________________________________ ISSN 2278-3202
Vol. 3(6), 6-17, June (2014) Int. Res. J. Biological Sci.
International Science Congress Association 8
Image acquisition: A DSLR (Nikon D5100) camera was used
to capture the image of the specimens. It was mounted on a
tripod so as to make the camera stable and to allow uniform
focus all throughout the image acquisition process. The samples
were placed in a standard position with fins teased so as to show
their natural position when swimming, as shown in figure 2.
Only undamaged fish samples were included.
Morphometrics and Statistical Analysis: Geometric
morphometric analysis is done through a phenotypic standpoint
to determine the morphological variations or differences related
to the history of individuals from different locations with
distinguishable environmental conditions. It allows the precise
and detailed analysis of shape change and shape variation in
organisms on the basis of positions of homologous anatomical
landmarks or shapes of outlines21
. Geometric morphometric
methods also allow for the graphic presentation of results for
visual display and comparison of shape changes based on
measured distances, angles, and ratios.
In this study, body shape among Sardinella lemuru species from
the bays of Butuan City, Dipolog City, and Pagadian City were
examined to assess their variations. This was possible through
the aid of Geometric morphometric analysis.
The images were processed through landmark-based
morphometrics to analyse body shape variations using Tps Dig
freeware 2.12. This image analysis and processing freeware
facilitates the statistical analysis of landmark data in
morphometrics by making it easier to collect and maintain
landmark data from digitized images22
. There were 18
homologous anatomical landmarks that were used to analyse the
body shape of the samples. Figure 2 shows the landmarks that
were plotted on the images: 1) anterior tip of snout at upper jaw,
2) most posterior aspect of neurocranium (beginning of scales
nape), 3) origin of dorsal fin, 4) insertion of dorsal fin, 5)
anterior attachment of dorsal membrane from caudal fin, 6)
posterior end of vertebrae column, 7) anterior attachment of
ventral membrane from caudal fin, 8) insertion of anal fin, 9)
origin of anal fin, 10) insertion of pelvic fin, 11) origin of
pectoral fin, 12) – 16) contour of the gill cover, 17)
posteriormost portion of maxillary, 18) center of the eye.
The geometric configurations composed of x and y coordinates
from the digitized landmarks were transformed first into shape
variables prior to executing the statistical analyses of shape
variation. Since the images contain shape and non-shape
variables resulting from the differences in the orientation and
position of the fishes during the image acquisition, Generalized
Procrustes Analysis (GPA) was used through TpsRelw software.
Relative warps were generated to determine the different body
shape variations exhibited by this species of fish. Relative warp
scores were subjected to Multivariate Analysis of Variance
(MANOVA) which is further supported by Canonical Variate
Analyis (CVA) and Discriminant Function Analysis (DFA)
using PAST (Paleontological Statistics) software to further
analyse the variations existing between males and females, and
between the geographical locations from which this species of
fish were collected.
Figure-2
Locations of the 18 landmarks for analysing fish body shape, illustrated as red dots

International Research Journal of Biological Sciences ________________________________________________ ISSN 2278-3202
Vol. 3(6), 6-17, June (2014) Int. Res. J. Biological Sci.
International Science Congress Association 9
Results and Discussion
The thirty (30) males and thirty females that were collected
from each sampling area were subjected to geometric
morphometric analysis in order to determine the body shape
variation that exists within and between the three populations of
Sardinella lemuru. It is important to know this aspect of the
organism since morphological variations could be attributed to
sexual dimorphism and since it is prevalent in the animal
kingdom, females and males do not only vary in their
reproductive organs but as well as in other external body
structures that are not directly linked or associated to
reproduction23, 24
. Knowledge about sexual dimorphism gives an
idea on the behavior, ecology, and life history of a particular
species which is essential in making comparisons between
populations. Another factor that may influence or contribute to
these variations existing between sexes and between populations
are the effects of overfishing or overexploitaion of this species
of fish.
Body shape variation and its pattern is shown and is
summarized by the boxplots of the relative warp (RW) scores
along with the extremely positive and the extremely negative
warps. Figure 3 shows the summary of the variation within the
population of female and male S. lemuru collected from the
bays of Butuan City (a), Dipolog City (b), and Pagadian City
(c). The uppermost portion for each figure shows the consensus
of the mean body shape from each population. The subsequent
table (table 1) contains the descriptions of the shape change of
each of the significant warps for each sexes with their variances.
For the Butuan City population (figure 3a), the females exhibit
much less variation in the curvature of the body compared to the
males .The distension of the mid section in the females is more
pronounced than that of the males, while the difference in the
length of the ventral and the dorsal side is more or less the same
for the two sexes. The female population also exhibits variation
in the section between the insertion of the pectoral fin to the
insertion of the pelvic fin and also on the part in the
posteriormost part of the neurocranium to the origin of the
dorsal fin. Variation can also be noticed in the snout region of
the female population. The dorsal fin is lengthier in the male
population as compared to the females. Table 1 summarizes
these variations found in both of the male and female
populations from Butuan Bay along with the variances for each
relative warp.
Figure-3
Summary of landmark based geometric morphometric analysis showing the boxplot and variation of the body shapes
between sexes of Sardinella lemuru females and males from the bays of (a) Butuan City (b) Dipolog City (c) Pagadian City as
explained by each of the significant relative warps
International Research Journal of Biological Sciences ________________________________________________ ISSN 2278-3202
Vol. 3(6), 6-17, June (2014) Int. Res. J. Biological Sci.
International Science Congress Association 10
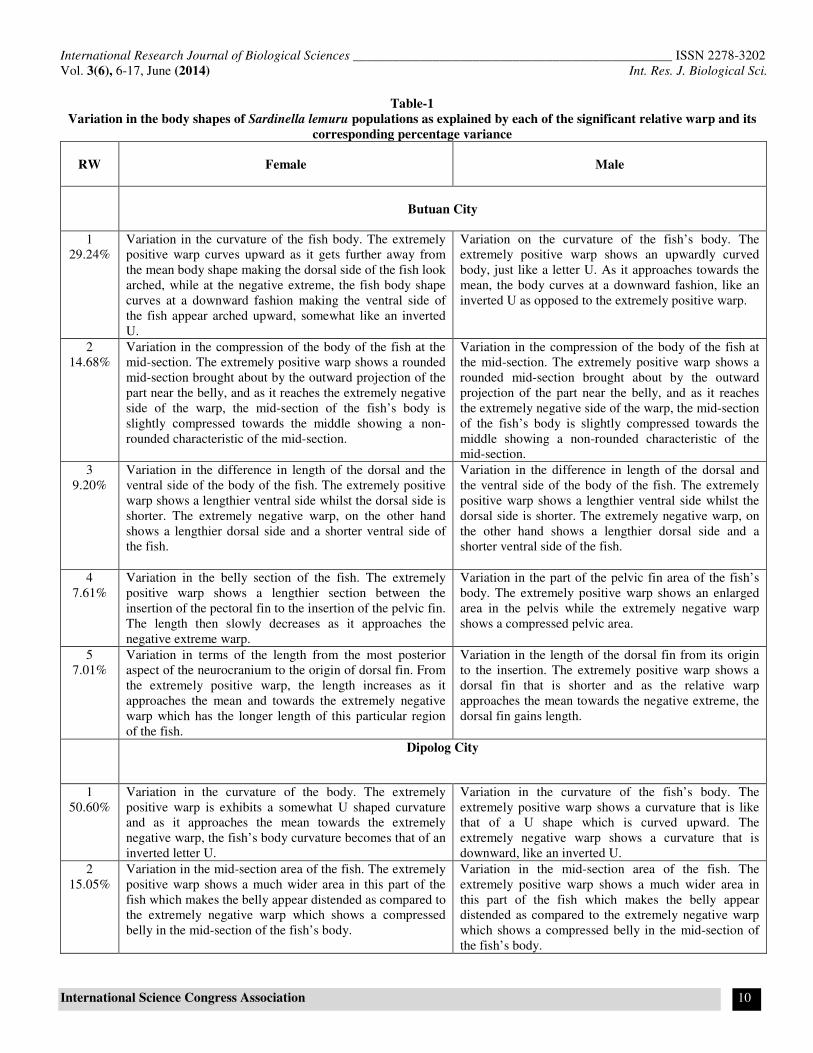
Table-1
Variation in the body shapes of Sardinella lemuru populations as explained by each of the significant relative warp and its
corresponding percentage variance
RW Female Male
Butuan City
1
29.24%
Variation in the curvature of the fish body. The extremely
positive warp curves upward as it gets further away from
the mean body shape making the dorsal side of the fish look
arched, while at the negative extreme, the fish body shape
curves at a downward fashion making the ventral side of
the fish appear arched upward, somewhat like an inverted
U.
Variation on the curvature of the fish’s body. The
extremely positive warp shows an upwardly curved
body, just like a letter U. As it approaches towards the
mean, the body curves at a downward fashion, like an
inverted U as opposed to the extremely positive warp.
2
14.68%
Variation in the compression of the body of the fish at the
mid-section. The extremely positive warp shows a rounded
mid-section brought about by the outward projection of the
part near the belly, and as it reaches the extremely negative
side of the warp, the mid-section of the fish’s body is
slightly compressed towards the middle showing a non-
rounded characteristic of the mid-section.
Variation in the compression of the body of the fish at
the mid-section. The extremely positive warp shows a
rounded mid-section brought about by the outward
projection of the part near the belly, and as it reaches
the extremely negative side of the warp, the mid-section
of the fish’s body is slightly compressed towards the
middle showing a non-rounded characteristic of the
mid-section.
3
9.20%
Variation in the difference in length of the dorsal and the
ventral side of the body of the fish. The extremely positive
warp shows a lengthier ventral side whilst the dorsal side is
shorter. The extremely negative warp, on the other hand
shows a lengthier dorsal side and a shorter ventral side of
the fish.
Variation in the difference in length of the dorsal and
the ventral side of the body of the fish. The extremely
positive warp shows a lengthier ventral side whilst the
dorsal side is shorter. The extremely negative warp, on
the other hand shows a lengthier dorsal side and a
shorter ventral side of the fish.
4
7.61%
Variation in the belly section of the fish. The extremely
positive warp shows a lengthier section between the
insertion of the pectoral fin to the insertion of the pelvic fin.
The length then slowly decreases as it approaches the
negative extreme warp.
Variation in the part of the pelvic fin area of the fish’s
body. The extremely positive warp shows an enlarged
area in the pelvis while the extremely negative warp
shows a compressed pelvic area.
5
7.01%
Variation in terms of the length from the most posterior
aspect of the neurocranium to the origin of dorsal fin. From
the extremely positive warp, the length increases as it
approaches the mean and towards the extremely negative
warp which has the longer length of this particular region
of the fish.
Variation in the length of the dorsal fin from its origin
to the insertion. The extremely positive warp shows a
dorsal fin that is shorter and as the relative warp
approaches the mean towards the negative extreme, the
dorsal fin gains length.
Dipolog City
1
50.60%
Variation in the curvature of the body. The extremely
positive warp is exhibits a somewhat U shaped curvature
and as it approaches the mean towards the extremely
negative warp, the fish’s body curvature becomes that of an
inverted letter U.
Variation in the curvature of the fish’s body. The
extremely positive warp shows a curvature that is like
that of a U shape which is curved upward. The
extremely negative warp shows a curvature that is
downward, like an inverted U.
2
15.05%
Variation in the mid-section area of the fish. The extremely
positive warp shows a much wider area in this part of the
fish which makes the belly appear distended as compared to
the extremely negative warp which shows a compressed
belly in the mid-section of the fish’s body.
Variation in the mid-section area of the fish. The
extremely positive warp shows a much wider area in
this part of the fish which makes the belly appear
distended as compared to the extremely negative warp
which shows a compressed belly in the mid-section of
the fish’s body.
International Research Journal of Biological Sciences ________________________________________________ ISSN 2278-3202
Vol. 3(6), 6-17, June (2014) Int. Res. J. Biological Sci.
International Science Congress Association 11
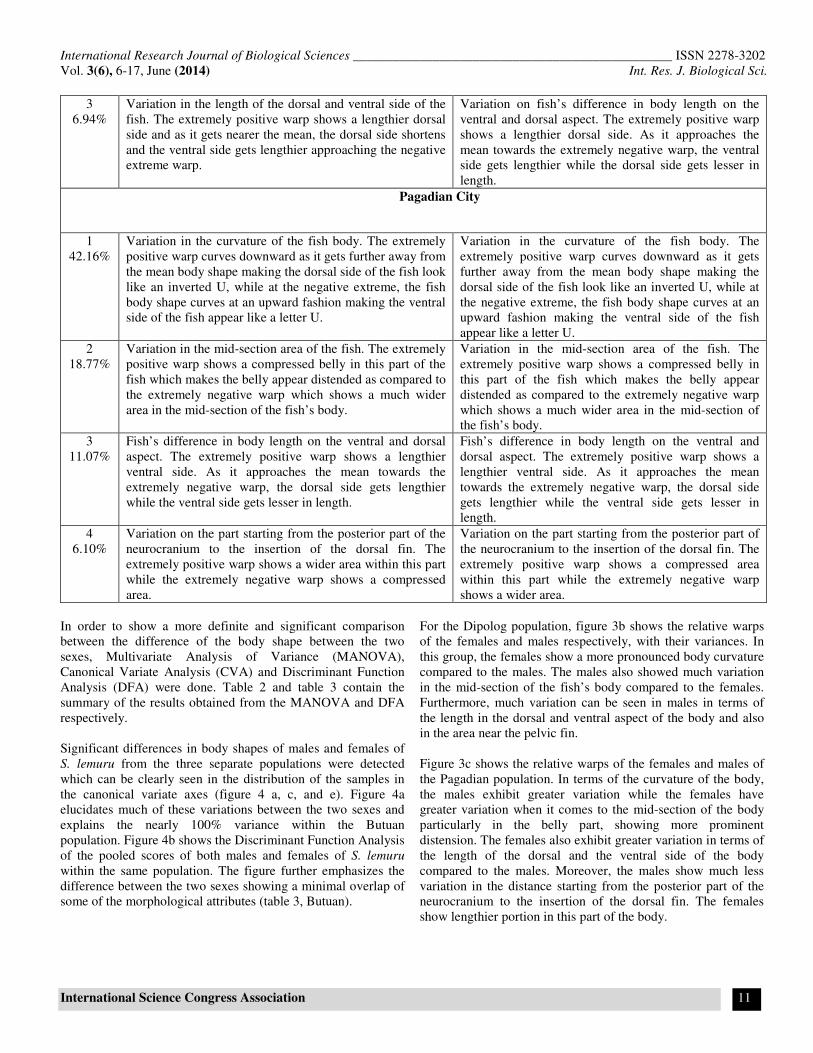
3
6.94%
Variation in the length of the dorsal and ventral side of the
fish. The extremely positive warp shows a lengthier dorsal
side and as it gets nearer the mean, the dorsal side shortens
and the ventral side gets lengthier approaching the negative
extreme warp.
Variation on fish’s difference in body length on the
ventral and dorsal aspect. The extremely positive warp
shows a lengthier dorsal side. As it approaches the
mean towards the extremely negative warp, the ventral
side gets lengthier while the dorsal side gets lesser in
length.
Pagadian City
1
42.16%
Variation in the curvature of the fish body. The extremely
positive warp curves downward as it gets further away from
the mean body shape making the dorsal side of the fish look
like an inverted U, while at the negative extreme, the fish
body shape curves at an upward fashion making the ventral
side of the fish appear like a letter U.
Variation in the curvature of the fish body. The
extremely positive warp curves downward as it gets
further away from the mean body shape making the
dorsal side of the fish look like an inverted U, while at
the negative extreme, the fish body shape curves at an
upward fashion making the ventral side of the fish
appear like a letter U.
2
18.77%
Variation in the mid-section area of the fish. The extremely
positive warp shows a compressed belly in this part of the
fish which makes the belly appear distended as compared to
the extremely negative warp which shows a much wider
area in the mid-section of the fish’s body.
Variation in the mid-section area of the fish. The
extremely positive warp shows a compressed belly in
this part of the fish which makes the belly appear
distended as compared to the extremely negative warp
which shows a much wider area in the mid-section of
the fish’s body.
3
11.07%
Fish’s difference in body length on the ventral and dorsal
aspect. The extremely positive warp shows a lengthier
ventral side. As it approaches the mean towards the
extremely negative warp, the dorsal side gets lengthier
while the ventral side gets lesser in length.
Fish’s difference in body length on the ventral and
dorsal aspect. The extremely positive warp shows a
lengthier ventral side. As it approaches the mean
towards the extremely negative warp, the dorsal side
gets lengthier while the ventral side gets lesser in
length.
4
6.10%
Variation on the part starting from the posterior part of the
neurocranium to the insertion of the dorsal fin. The
extremely positive warp shows a wider area within this part
while the extremely negative warp shows a compressed
area.
Variation on the part starting from the posterior part of
the neurocranium to the insertion of the dorsal fin. The
extremely positive warp shows a compressed area
within this part while the extremely negative warp
shows a wider area.
In order to show a more definite and significant comparison
between the difference of the body shape between the two
sexes, Multivariate Analysis of Variance (MANOVA),
Canonical Variate Analysis (CVA) and Discriminant Function
Analysis (DFA) were done. Table 2 and table 3 contain the
summary of the results obtained from the MANOVA and DFA
respectively.
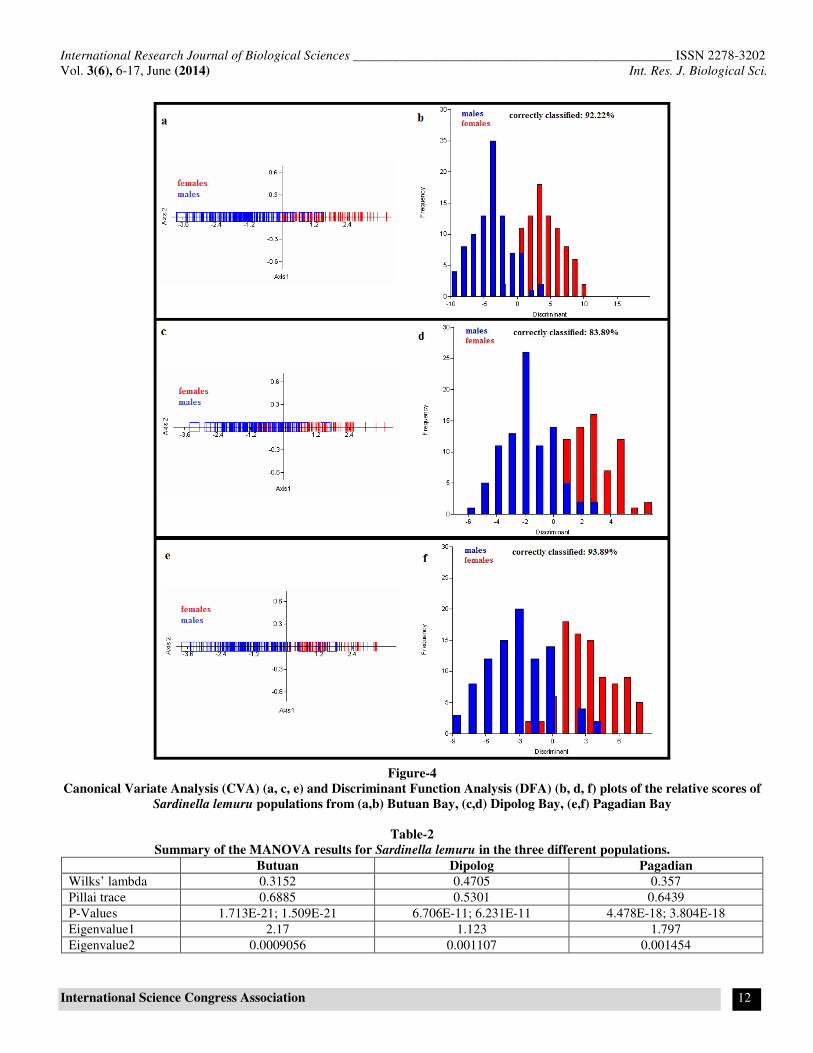
Significant differences in body shapes of males and females of
S. lemuru from the three separate populations were detected
which can be clearly seen in the distribution of the samples in
the canonical variate axes (figure 4 a, c, and e). Figure 4a
elucidates much of these variations between the two sexes and
explains the nearly 100% variance within the Butuan
population. Figure 4b shows the Discriminant Function Analysis
of the pooled scores of both males and females of S. lemuru
within the same population. The figure further emphasizes the
difference between the two sexes showing a minimal overlap of
some of the morphological attributes (table 3, Butuan).
For the Dipolog population, figure 3b shows the relative warps
of the females and males respectively, with their variances. In
this group, the females show a more pronounced body curvature
compared to the males. The males also showed much variation
in the mid-section of the fish’s body compared to the females.
Furthermore, much variation can be seen in males in terms of
the length in the dorsal and ventral aspect of the body and also
in the area near the pelvic fin.
Figure 3c shows the relative warps of the females and males of
the Pagadian population. In terms of the curvature of the body,
the males exhibit greater variation while the females have
greater variation when it comes to the mid-section of the body
particularly in the belly part, showing more prominent
distension. The females also exhibit greater variation in terms of
the length of the dorsal and the ventral side of the body
compared to the males. Moreover, the males show much less
variation in the distance starting from the posterior part of the
neurocranium to the insertion of the dorsal fin. The females
show lengthier portion in this part of the body.
International Research Journal of Biological Sciences ________________________________________________ ISSN 2278-3202
Vol. 3(6), 6-17, June (2014) Int. Res. J. Biological Sci.
International Science Congress Association 12
Figure-4
Canonical Variate Analysis (CVA) (a, c, e) and Discriminant Function Analysis (DFA) (b, d, f) plots of the relative scores of
Sardinella lemuru populations from (a,b) Butuan Bay, (c,d) Dipolog Bay, (e,f) Pagadian Bay
Table-2
Summary of the MANOVA results for Sardinella lemuru in the three different populations.
Butuan Dipolog Pagadian
Wilks’ lambda 0.3152 0.4705 0.357
Pillai trace 0.6885 0.5301 0.6439
P-Values 1.713E-21; 1.509E-21 6.706E-11; 6.231E-11 4.478E-18; 3.804E-18
Eigenvalue1 2.17 1.123 1.797
Eigenvalue2 0.0009056 0.001107 0.001454

International Research Journal of Biological Sciences ________________________________________________ ISSN 2278-3202
Vol. 3(6), 6-17, June (2014) Int. Res. J. Biological Sci.
International Science Congress Association 13
Table-3
Summary of the DFA results for Sardinella lemuru in the three different populations.
Butuan Dipolog Pagadian
P-Value 5.538E-21 1.328E-09 7.171E-18
Correctly classified (%) 92.22% 83.89% 93.89%
Figure-5
Summary of landmark based geometric morphometric analysis showing the boxplot and variation of the body shapes
between populations of Sardinella lemuru (a) females (b) males as explained by each of the significant relative warps
Figure-6
Canonical Variate Analysis (CVA) (a, c) and Discriminant Function Analysis (DFA) (b, d) plots of the relative scores of
Sardinella lemuru females (a, b) and males (c, d)

International Research Journal of Biological Sciences ________________________________________________ ISSN 2278-3202
Vol. 3(6), 6-17, June (2014) Int. Res. J. Biological Sci.
International Science Congress Association 14
Table-4
Summary of the MANOVA results for Sardinella lemuru females and males between the three populations
Females Males
Wilks’ lambda 0.02714 0.03493
Pillai trace 1.651 1.62
P-Values 3.04E-141; 3.407E-136 6.052E-129; 6.685E-128
Eigenvalue1 7.594 5.528
Eigenvalue2 3.286 3.381
Table-5
Summary of the DFA results for Sardinella lemuru females and males between the three populations
Females Males
P-Value Correctly Classified (%) P-Value Correctly Classified (%)
Butuan Vs Dipolog 5.903E-48 98.89% 1.477E-42 99.44%
Butuan Vs Pagadian 1.703E-78 98.89% 1.906E-64 97.04%
Dipolog Vs Pagadian 7.866E-45 98.89% 8.779E-50 100%
Pooled relative warps and boxplots between populations and
within sexes of the S. lemuru were also obtained. Figure 5
shows the summary of the positive and negative extreme warps
and the corresponding percentage variance for each sex [females
(a), and males (b)]. It shows that females exhibit lesser variation
than males in terms of the curvature of the body but the females
however, show greater variation in the distension of the belly
region. Both sexes show almost the same variation in terms of
length of the ventral side of the fish relative to the dorsal side.
Females exhibit greater variation in the area from the insertion
of the pectoral fin to the insertion of the pelvic fin.
Figure 6 shows the Canonical Variate Analysis (figure 6a and
6c) and Discriminant Function Analysis (figure 6b and 6d)
between populations of S. lemuru within sexes [females (a, b),
and males (c, d)]. Significant differences are shown by the
separation of each of the populations in the CVA plot. The CVA
plots for both sexes explain the variation existing between the
two sexes and could explain for almost 100% of the variance.
The Discriminant Function Analysis further emphasizes the
difference between populations and within sexes as shown by
the minimal overlap of some of the morphological attributes.
Table 4 and table 5 contain the summary of the results for
MANOVA and DFA between the three populations
respectively.
Sexual dimorphism has been tested and shown through the use
of Multivariate Analysis of Variance (MANOVA) which
suggests that significant sexual dimorphism exists in the overall
body shape of the S. lemuru species. Wilks’ lambda and Pillai
trace calculated from this method justifies this result. Moreover,
a clearer visualization of the results from MANOVA is shown
through Canonical Variate Analysis (CVA). It is one useful tool
when it comes to multivariate statistics. This method is utilized
to investigate the interrelationship between a number of
populations simultaneously with a goal of objectively
representing the interrelationships graphically in a few
dimensions9. It can be seen in the CVA plots presented that the
females and males for each population converge or meet around
zero along the horizontal axis allowing separation of the two
sexes. Therefore, significant differences in body shapes between
the sexes of S. lemuru for each population were shown by the
results of MANOVA and CVA scatter plots.
Looking at the relative warps of each of the sexes in each
population and their variances, it can be generalized that the
variations occurring in this group of species are mainly on the
curvature of the body, compression and decompression at the
mid-section of the body particularly in the belly area, the
lengthening of the dorsal side relative to the ventral side and
vice versa, the length between the insertion of the pectoral fin to
the insertion of the pelvic fin and also in the part between the
posteriormost aspect of the neurocranium to the origin of the
dorsal fin. A slight variation can also be observed at the
snout/gape region of the fish. It can be observed that the females
exhibit variations that are geared towards body shape that are
capable of supporting huge number of eggs (as justified by the
more distended belly region compared to the males) while the
males exhibit a less distended belly and a more slender body
outline. In addition, males are generally shorter than females. A
study of female populations of white goby from Lake Buluan
showed deeper bodies resulting to stout body outline with
greater body curvature compared to the males having a more
slender body outline, longer gape length, and caudal peduncle
and larger pectoral and anal fin bases9. These variations in body
shape don’t necessarily tell about the phylogenetic history of
populations but rather it shows their different adaptations to
their present environment25
.
Several factors such as natural selection and sexual selection
could result to sexual dimorphism. Significant sexual dimorphic
traits were described between sexes of Hypseleotris agilis from
Lake Lanao, Philippines10
. They found out that males exhibit
bigger head as well as elongated dorsal and anal fin bases which
could have resulted from sexual selection or by ecological/niche
selection. Sexual dimorphism was observed in body shape of the
International Research Journal of Biological Sciences ________________________________________________ ISSN 2278-3202
Vol. 3(6), 6-17, June (2014) Int. Res. J. Biological Sci.
International Science Congress Association 15
spotted barb fish (Puntius binotatus) with males having slender
bodies and wider anal fin bases while females have bigger head
region, deeper body depth and shorter tail region, which could
be attributed to some selective pressures26
. Different
reproductive roles, niche divergence between the sexes,
preference of one sex for particular traits of the other sex, and
intra-sexual competition can influence differences in external
structures24, 27-29
. Although sexual dimorphism is apparent in
many living organisms, males and females don’t only differ in
terms of their reproductive organs but as well as in external
body structures that are not directly linked or associated to
reproduction23, 24
. In a study on body shapes of threespine
sticklebacks (Gasterosteus aculeatus), larger females tend to
have higher chances of successful reproduction since they
produce large number of eggs and are mostly chosen by
courting males30
. Moreover, smaller males tend to have higher
advantage over the larger ones, since they can mature and start
breeding earlier24
, reside into superior breeding grounds or
territories, and finally have higher chances of reproductive
success in contrast to the larger males which breed at a later
time31, 32
. Additionally, males tend to have higher reproductive
success when they allocate more energy into territoriality,
nesting, and parental care, than spending energy to their own
growth30
. Sexual dimorphism could also result from
evolutionary and ecological forces wherein the two sexes have
different habits conforming their functional adaptations33
. These
ecological forces may provide additional selective pressures for
shape differences between sexes34
. The diversity of an
environment can either accentuate or attenuate sexual shape
dimorphism10
. In addition to environmental factors, the genetic
make-up of the organism also plays a huge part in the resulting
phenotype of the individual.
The results also indicated that there is a clear separation of the
three populations based on their morphological differences as
what can be seen in the CVA plots in figure 6. This may suggest
that geographic isolation or separation could be directly related
to the level or degree of phenotypic difference or variation
which may indicate that geographic isolation or separation is a
limiting factor for the migration between populations or
stocks35
. That is, there is just limited intermingling between the
populations. Studies demonstrated that there were clear
distinctions in the morphology of Liza abu (Heckel, 1842) in the
populations from the rivers Orontes, Euphrates, and Tigris35
and
the same observations in the three populations of Anchovy
(Engraulis encrasicolus L.) in the Black, Aegean, and
Northeastern Mediterranean Seas36
. Fishes are able to respond
or adapt to environmental change through their phenotypic
plasticity by modifying their physiology and behaviour which
eventually lead to variations or changes in their morphology,
reproduction or survival that extenuate such forces caused by
environmental change37
. Hence, it could be that S. lemuru
developed these morphological variations in response to the
changes in their environment, or to some selective pressures
(e.g. overfishing/ overexploitation, type of fishing gear used,
etc.). Fisheries have been described as large-scale uncontrolled
experiments in evolution38, 39
so most likely overfishing and/or
the type of fishing gears used are a large contributing factor to
these morphological changes. Generally, fishes have greater
susceptibility to environmentally-induced morphological
variation and in addition, they manifest much variation in
morphological attributes both between and within populations
compared to other vertebrates40,41
.
Conclusion
In this study, Geometric Morphometric methods was applied to
the three different populations of Sardinella lemuru collected
from the bays of Butuan City, Dipolog City, and Pagadian City.
Through the utilization of modern statistical tools such as
Multivariate Analysis of Variance (MANOVA), Canonical
Variate Analysis (CVA), and Discriminant Function Analysis
(DFA), significant differences in morphology within and
between populations was identified in the S. lemuru species.
Results from the relative warps show that females exhibit body
shapes that are geared to support large number of eggs ensuring
successful reproductive rate. Males on the other hand exhibit a
more slender body and are generally smaller than females.
Additionally, variation between populations was also observed
which strongly suggests that geographic isolation plays a role as
a limiting factor in the migration of the stocks possibly leading
to such morphological differences brought about by the
differences in the species’ environment and selection pressures
such as overfishing/overexploitation, and the type of fishing
gears used. Thus, this study suggests that landmark-based
geometric morphometric method is successful in describing
variations that exist within and between populations of the S.
lemuru species. However, it would be very interesting to study
these variations in light of the genes that govern these
morphological variations. Knowledge of both phenotypic and
genetic aspects of this species of fish would contribute greatly
as to the management of the different stocks.
Acknowledgement
The authors would like to thank DOST-ASTHRD for financing
this study. To Helen Betonio, Denmark Recamara, Clarence
Ruelos, Ednalyn Terez, Rhea Mae Gairanan and Rene
Pudelanan for the help in the acquisition of the fish samples.
References
1. Pileggi J. and Thomson B., Fisheries of the United States,
1978, US-NMFS, 7800:120 (1979)
2. Samonte I.E., Pagulayan R.C., Mayer W.E., Molecular
Phylogeny of Philippine Freshwater Sardines Based on
Mitochondrial DNA Analysis, The American Genetic
Association, 91, 247-253 (2000)
3. Willette D.A., Bognot E.D.C., Mutia T.M., Santos M.D.,
Biology and Ecology of Sardines in the Philippines: A
Review. Final Draft (2011)

International Research Journal of Biological Sciences ________________________________________________ ISSN 2278-3202
Vol. 3(6), 6-17, June (2014) Int. Res. J. Biological Sci.
International Science Congress Association 16
4. BFAR (Bureau of Fisheries and Aquatic Resources),
Philippine fisheries profile Department of Agriculture-
BFAR, Manila, Philippines. 54 p. (2000)
5. Thomas R., Willette D., Santos M., Phylogeography of the
goldstripe Sardinella, Sardinella gibbosa, and the Bali
Sardinella, Sardinella lemuru, in the Philippine archipelago.
Open Conference Systems, 11th
National Symposium in
Marine Science (2011)
6. Sustainable Fisheries Partnership, FishSource Profile for
Bali sardinella - stock units undefined [FIP: Bali sardinella,
SFP]. World Wide Web Electronic Publication Available at
http://www.fishsource.com/site/goto_profile_by_uuid/059e
7bc0-bfb2-11de-b141-daf105bfb8c2 accessed 2013-08-07
last updated May 4, (2013)
7. Guanco M.R., Mesa S.V., Belga P.B, Nunal D.R.M.,
Assessment of the commercial fisheries of Western and
Central Visayan Sea, BFAR NFRDI Technical Paper Series
12(1), 1-44 (2009)
8. Fisheries-induced Evolution. World Wide Web Electronic
Article Available at http://webarchive.iiasa.ac.at/Research
/EEP/FinE/Objectives.html (2013)
9. Dorado E., Torres M.A., Demayo C.G., Describing Body
Shapes of the White Goby, Glossogobius giuris of Lake
Buluan in Mindanao, Philippines using landmark-based
geometric morphometric analysis, International Research
Journal of Biological Sciences, 1(7), 33-37 (2012)
10. Nacua S.S., Torres M.A., Demayo, C.G., Sexual
Dimorphism in Body Shape of Hypseleotris agilis (Herre,
1927) from Lake Lanao, Philippines, International
Research Journal of Biological Sciences, 1(2), 25-31
(2012)
11. Torres M.A.J., Joshi R.C., Sebastian L.S., Demayo C.G.,
Geographic phenetic variation in the golden apple snail,
Pomacea canaliculata (Ampullariidae) based on geometric
approaches to morphometrics, AES Bioflux, 3(3), 243-258
(2011)
12. Webb P.W., Body form, locomotion and foraging in aquatic
vertebrates, Amer. Zool., 24, 107–120 (1984)
13. Walker J.A., Ecological morphology of lacustrine
threespine stickleback Gasterosteus aculeatus L.
(Gasterosteidae) body shape, Biological Journal of the
Linnean Society, 61, 3-50 (1997)
14. Pakkasmaa S. and Piironen J., Morphological
differentiation among local trout (Salmo trutta) populations,
Biological Journal of the Linnean Society, 72, 231–239
(2001)
15. Schluter D., Adaptive radiation in sticklebacks: size, shape,
and habitat use efficiency, Ecology, 74, 699–709 (1993)
16. Klingenberg C.P. and Ekau W.A., combined morphometric
and phylogenetic analysis of an ecomorphological trend:
pelagization in Antarctic fishes (Perciformes:
Nototheniidae), Biological Journal of the Linnean Society,
59, 143–177 (1996)
17. Caldecutt W.J. and Adams D.C., Morphometrics of trophic
osteology in the threespine stickleback, Gasterosteus
aculeatus, Copeia, 1998: 827–838 (1998)
18. Douglas M.E., Douglas M.R., Lynch J.M., McElroy D.M.,
Use of geometric morphometrics to differentiate Gila
(Cyprinidae) within the upper Colorado River Basin,
Copeia, 2001: 389-400 (2001)
19. R¨uber L., and Adams D.C., Evolutionary convergence of
body shape and trophic morphology in cichlids from Lake
Tanganyika, J. Evol. Biol., 14, 325–332 (2001)
20. Hulsey C.D. and Wainwright P.C., Projecting mechanics
into morphospace: disparity in the feeding system of labrid
fishes, Proceedings of the Royal Society of London B,
Biological Sciences, 269, 317–326 (2002)
21. Rohlf F.J., and Marcus L.F., A revolution in
morphometrics, Trends in Ecology & Evolution, 8(4), 129–
132 (1993)
22. Rohlf F.J., NTSYSpc: Numerical Taxonomy System, ver.
2.20, Exeter Publishing, Setauket, NY. (2008)
23. Darwin C., The Descent of Man and Selection in Relation
to Sex. Humbolt, New York (1874)
24. Anderson, M., Sexual Selection. Princeton University
Press, Princeton, New Jersey (1994)
25. Corti M., Loy A., Cataudella S., Form changes in the sea
bass, Dicentrarchus labrax (Moronidae: Teleostei), after
acclimation to freshwater: an analysis using shape
coordinates, Environ. Biol. Fish., 47, 165–175 (1996)
26. Dorado E., Torres M.A., Demayo C.G., Sexual
Dimorphism in body shapes of the spotted barb fish,
Puntius binotatus of Lake Buluan in Mindanao, Philippines,
AACL Bioflux, 5(5), 321-329 (2012)
27. Slatkin M., Ecological causes of sexual dimorphism,
Evolution, 38, 622–630 (1984)
28. Shine R., Ecological causes for the evolution of sexual
dimorphism: a review of the evidence, The Quarterly
Review of Biology, 64, 419–461 (1989)
29. Parker G.A., The evolution of sexual size dimorphism in
fish, Journal of Fish Biology 41, 1–20 (1992)
30. Kitano J., Mori S., Peichel C.L. Sexual Dimorphism in the
External Morphology of the Threespine Stickleback
(Gasterosteus aculeatus), Copeia, 2, 336-349 (2007)
31. Mori S., The breeding system of the threespined
stickleback, Gasterosteus aculeatus (forma leiura) with
reference to spatial and temporal patterns of nesting
activity, Behaviour. 126, 97–124 (1993)

International Research Journal of Biological Sciences ________________________________________________ ISSN 2278-3202
Vol. 3(6), 6-17, June (2014) Int. Res. J. Biological Sci.
International Science Congress Association 17
32. Candolin U., and Voigt H.R., Size-dependent selection on
arrival times in sticklebacks: why small males arrive first,
Evolution, 57, 862–871 (2003)
33. Wiley T., Simpfendorfer C., Faria V., Mcdavitt M., Range,
sexual dimorphism and bilateral asymmetry of rostral tooth
counts in the small tooth sawfish Pristis pectinata Latham
(Chondrichthyes: Pristidae) of the southeastern United
States, Zootaxa, 1810, 51- 59 (2008)
34. Spoljaric M.A. and Reimchen T.E., Habitat-dependent
reduction of sexual dimorphism in geometric body shape of
Haida gwaii threespine stickleback, Biological Journal of
the Linnean Society, 95, 505–516 (2008)
35. Turan C., Erguden D., Turan F., Gurlek M., Genetic and
Morphologic Structure of Liza abu (Heckel, 1843)
Populations from the Rivers Orontes, Euphrates and Tigris,
Turk J Vet. Anim. Sci., 28, 729-734 (2004)
36. Turan C., Erguden D., Gurlek M., Basusta N., Turan F.,
Morphometric Structuring of the Anchovy (Engraulis
encrasicolus L.) in the Black, Aegean and Northeastern
Mediterranean Seas, Turk J Vet. Anim. Sci, 28, 865-871
(2004)
37. Stearns S.C., A Natural Experiment in Life-history
Evolution: Field data on the introduction of Mosquitofish
(Gambusia affinis) to Hawaii, Evolution, 37, 601-617
(1983)
38. Rijnsdorp A. D., Fisheries as a large-scale experiment on
life-history evolution: disentangling phenotypic and genetic
effects in changes in maturation and reproduction of North
Sea plaice, Pleuronectes platessa L., Oecologia, 96, 391–
401 (1993)
39. Stokes K. and Law R., Fishing as an evolutionary force,
Mar. Ecol. Prog. Ser., 208, 307–309 (2000)
40. Allendorf F.W., Ryman N., Utter F., Genetics and fishery
management: Past, present and future in populations
genetics and fisheries management (N. Ryman and F. Utter,
Eds.) University of Washington Press, Seattle and London.
pp1-20 (1987)
41. Wimberger P.H., Plasticity of fish body shape - the effects
of diet, development, family and age in two species of
Geophagus (Pisces: Chichlidae), Biol. J. Linn. Soc., 45,
197-218 (1992)