Embed Size (px)
Citation preview

Descriptive Statistics: Numerical Methods, Part 1
Measures of LocationThe MeanThe MedianThe ModePercentilesQuartiles
Mean The mean (or average) is the basic measure of location or “central
tendency” of the data.
•The sample mean is a sample statistic.
•The population mean is a population statistic.
x

Sample Mean
n
xx i
Where the numerator is the sum of values of n observations, or:
ni xxxx ...21
The Greek letter Σ is the summation sign
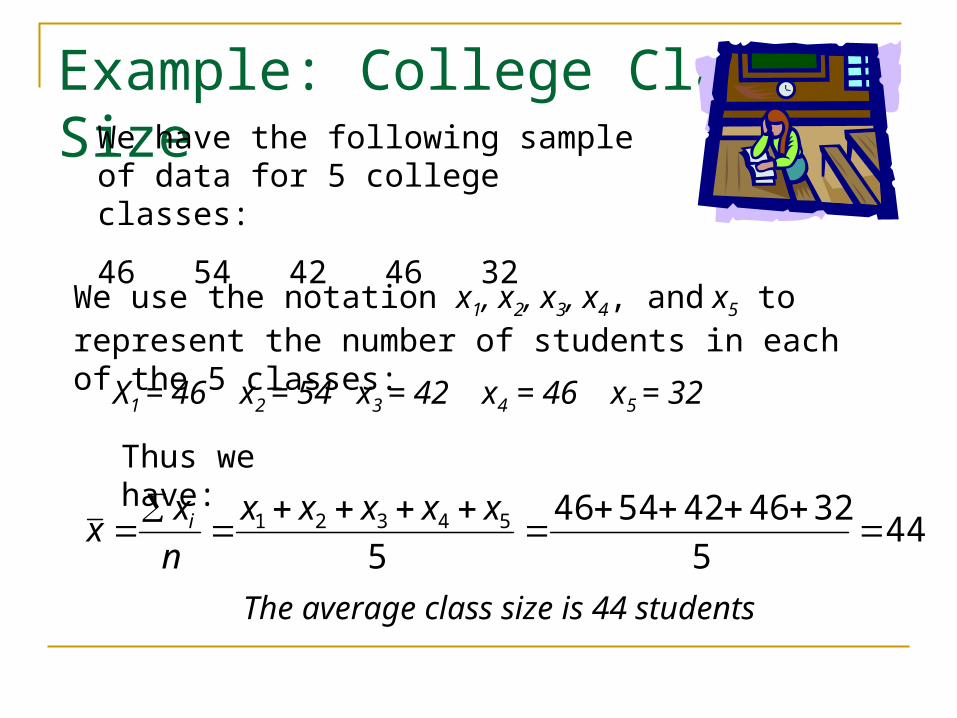
Example: College Class SizeWe have the following sample of data for 5 college classes:
46 54 42 46 32
We use the notation x1, x2, x3, x4, and x5 to represent the number of students in each of the 5 classes:
X1 = 46 x2 = 54 x3 = 42 x4 = 46 x5 = 32
Thus we have:
445
3246425446
554321
xxxxx
n
xx i
The average class size is 44 students
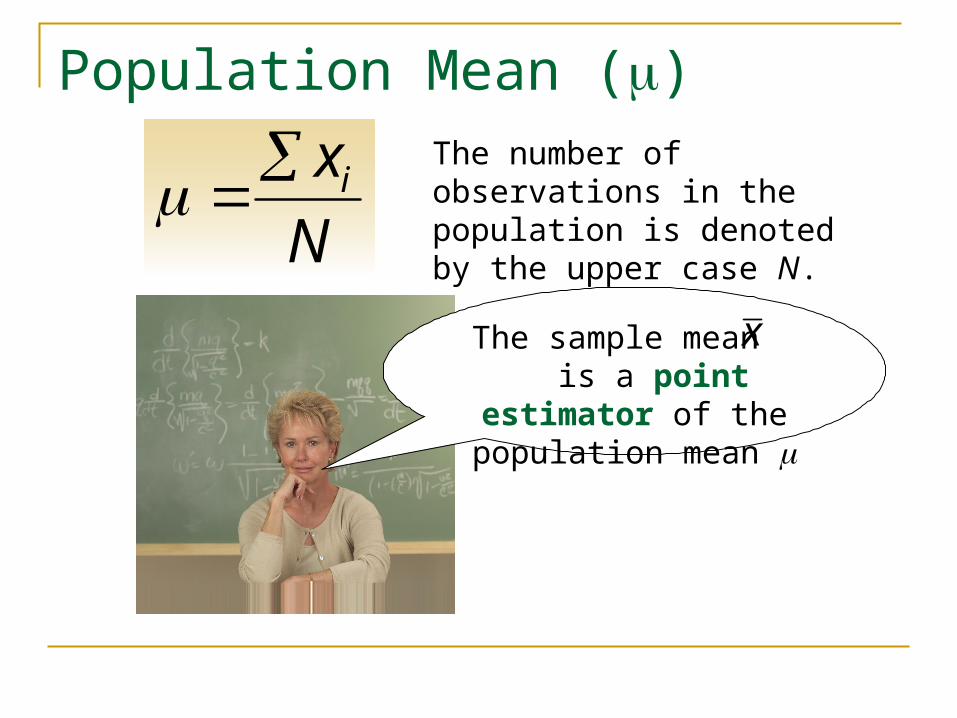
Population Mean ()
N
xi
The number of observations in the population is denoted by the upper case N.
The sample mean is a point estimator of
the population mean
x

Median The median is the value in the middle when the data are arranged in ascending order (from smallest value to largest value).
a. For an odd number of observations the median is the middle value.
b. For an even number of observations the median is the average of the two middle values.
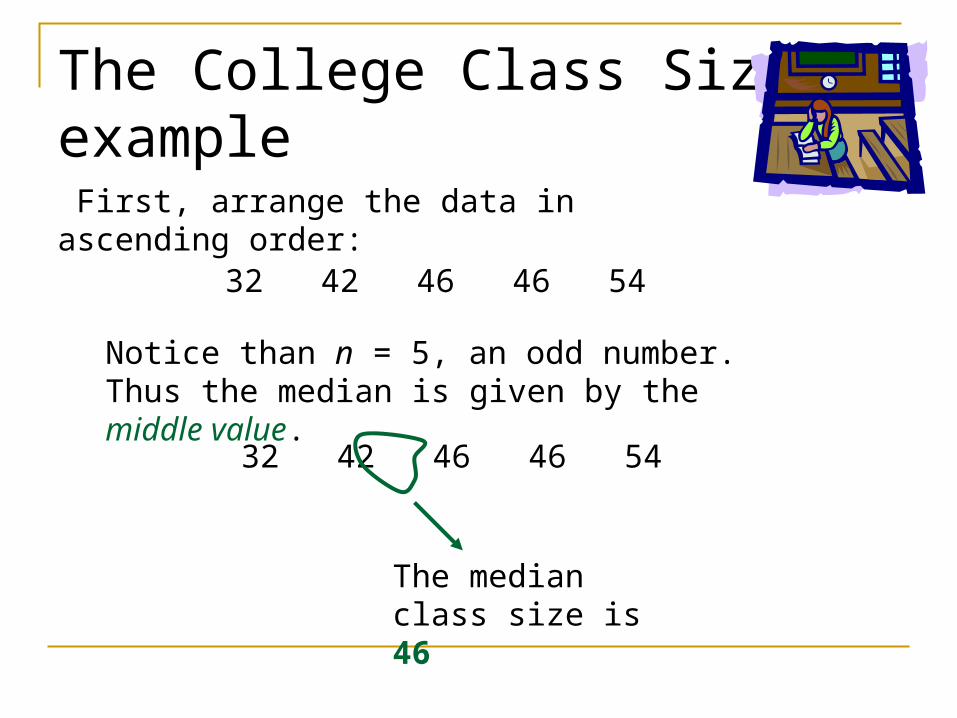
The College Class Size example First, arrange the data in ascending order:
32 42 46 46 54
Notice than n = 5, an odd number. Thus the median is given by the middle value.
32 42 46 46 54
The median class size is 46
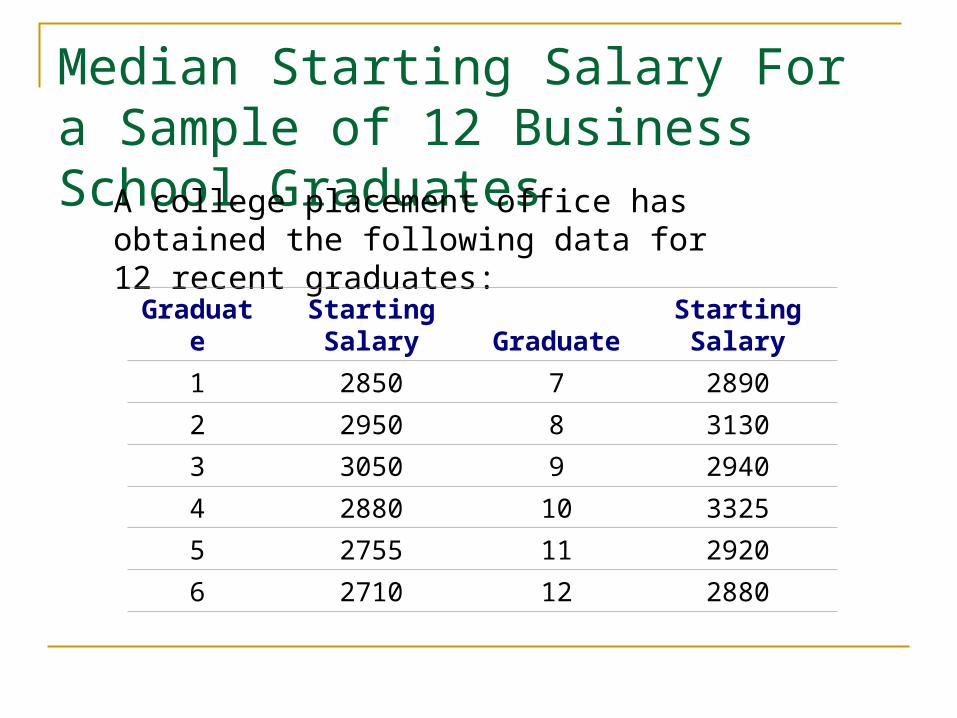
Median Starting Salary For a Sample of 12 Business School GraduatesA college placement office has obtained the
following data for 12 recent graduates:
Graduate Starting Salary Graduate Starting Salary
1 2850 7 2890
2 2950 8 3130
3 3050 9 2940
4 2880 10 3325
5 2755 11 2920
6 2710 12 2880
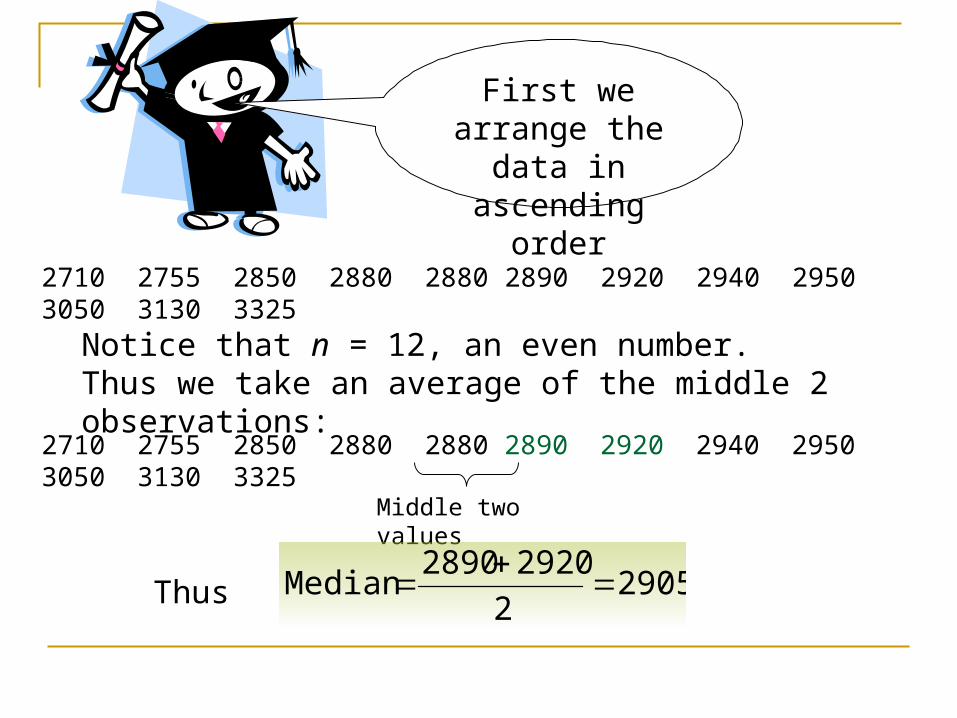
2710 2755 2850 2880 2880 2890 2920 2940 2950 3050 3130 3325
Notice that n = 12, an even number. Thus we take an average of the middle 2 observations:
2710 2755 2850 2880 2880 2890 2920 2940 2950 3050 3130 3325
Middle two values
First we arrange the data in
ascending order
29052
29202890Median
Thus
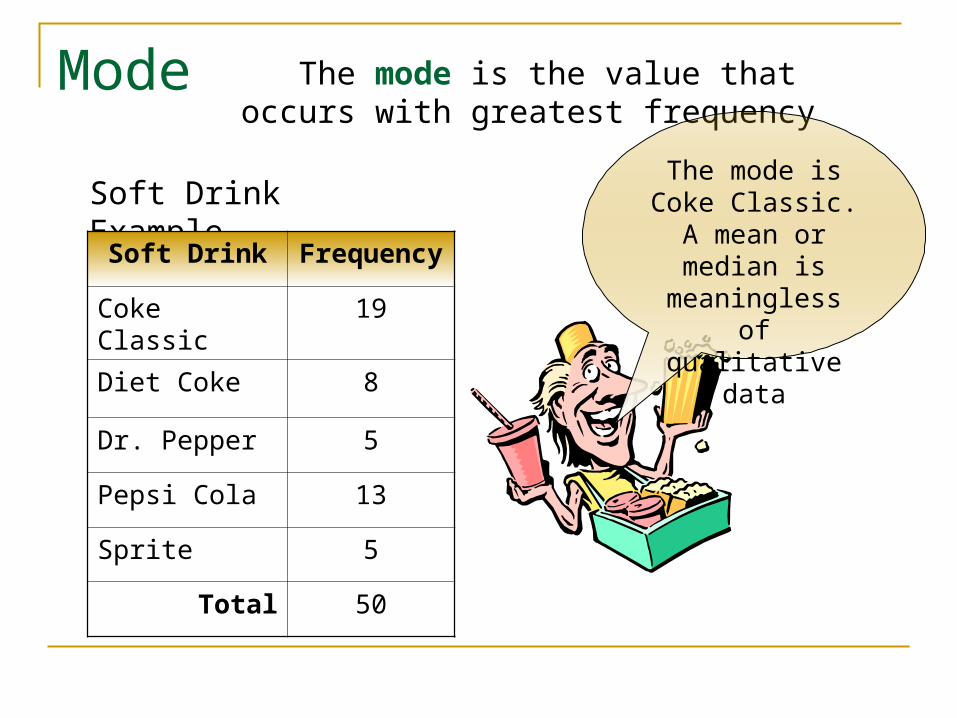
Mode The mode is the value that occurs with greatest frequency
Soft Drink Example
Soft Drink Frequency
Coke Classic 19
Diet Coke 8
Dr. Pepper 5
Pepsi Cola 13
Sprite 5
Total 50
The mode is Coke Classic. A mean
or median is meaningless of qualitative data
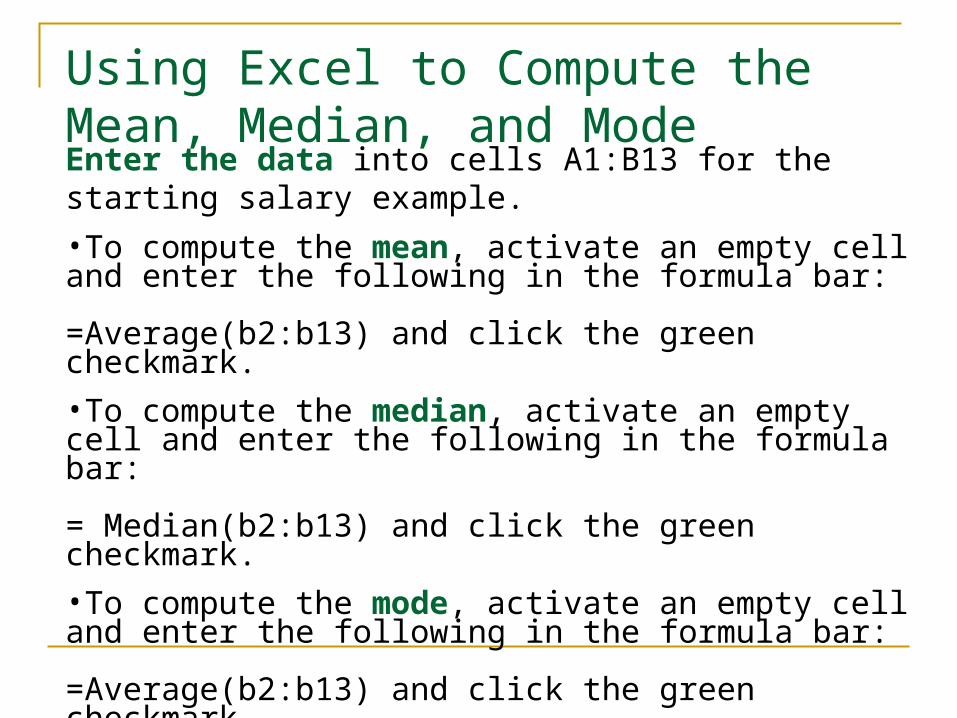
Using Excel to Compute the Mean, Median, and ModeEnter the data into cells A1:B13 for the starting salary example.
•To compute the mean, activate an empty cell and enter the following in the formula bar:
=Average(b2:b13) and click the green checkmark.
•To compute the median, activate an empty cell and enter the following in the formula bar:
= Median(b2:b13) and click the green checkmark.
•To compute the mode, activate an empty cell and enter the following in the formula bar:
=Average(b2:b13) and click the green checkmark.

The Starting Salary Example
Mean 2940
Median 2905
Mode 2880
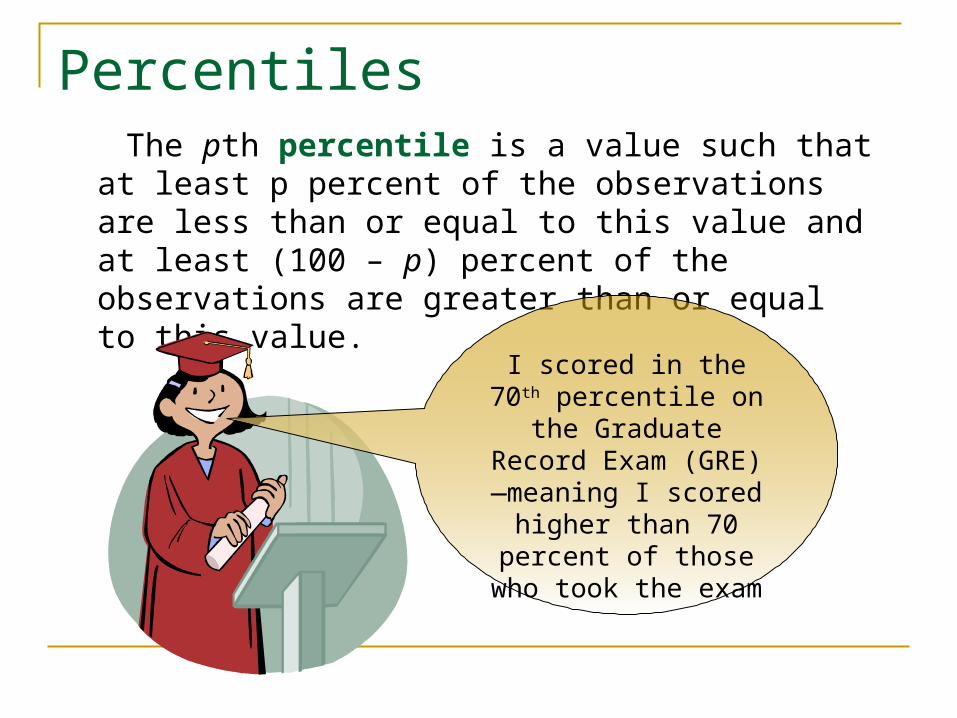
Percentiles The pth percentile is a value such that at least p percent of the observations are less than or equal to this value and at least (100 – p) percent of the observations are greater than or equal to this value.
I scored in the 70th percentile on the Graduate Record Exam (GRE)—
meaning I scored higher than 70 percent of those who took the
exam
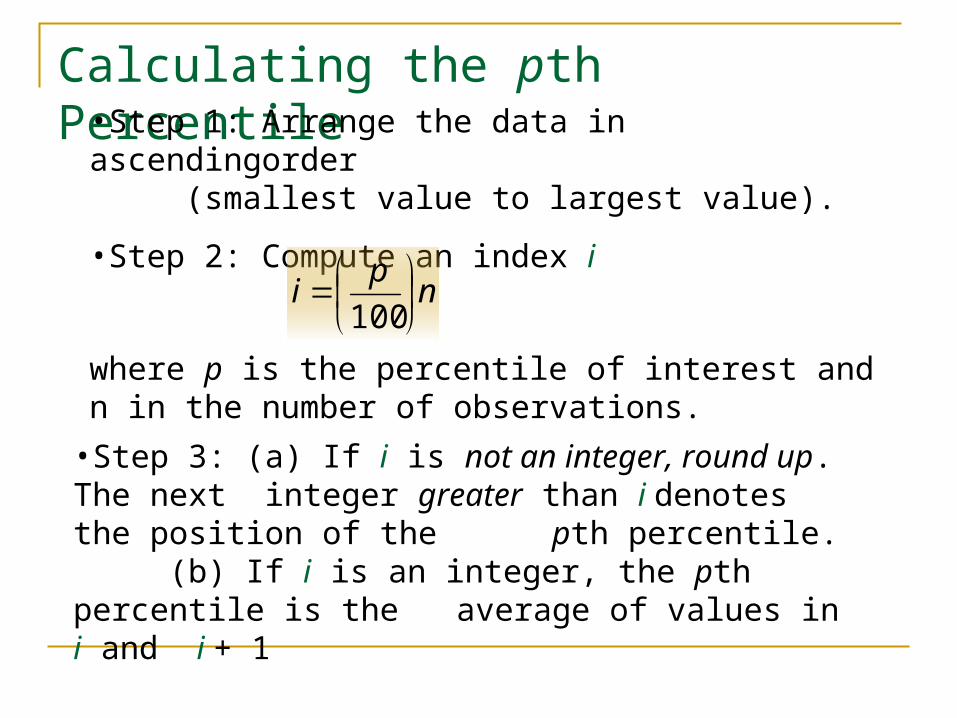
Calculating the pth Percentile•Step 1: Arrange the data in ascendingorder
(smallest value to largest value).
•Step 2: Compute an index i
np
i
100
where p is the percentile of interest and n in the number of observations.
•Step 3: (a) If i is not an integer, round up. The next integer greater than i denotes the position of the pth percentile.
(b) If i is an integer, the pth percentile is the average of values in i and i + 1
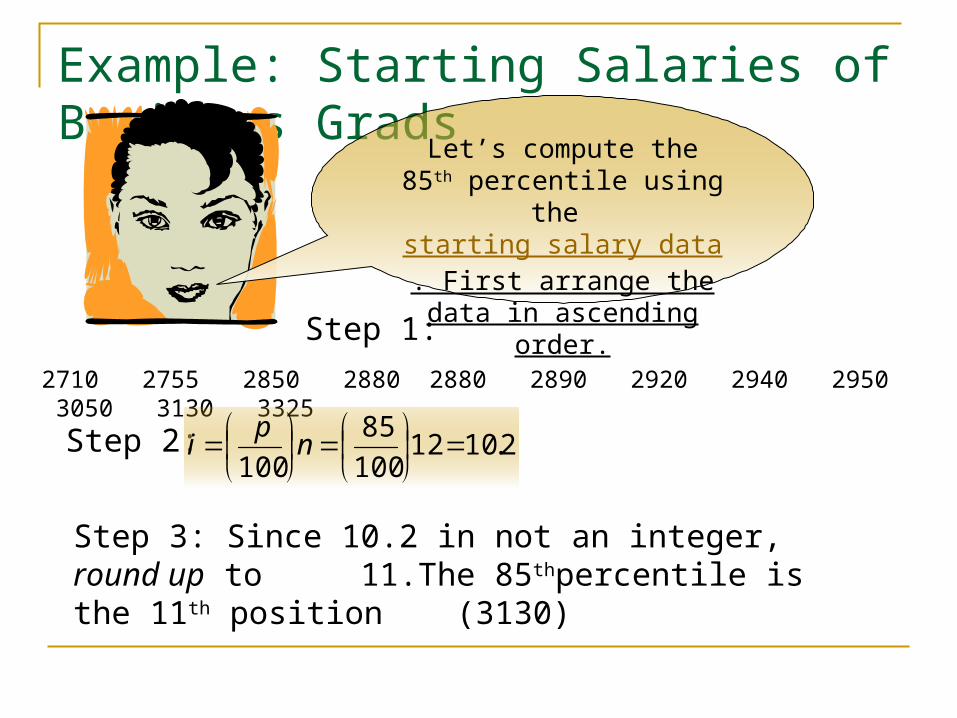
Example: Starting Salaries of Business Grads
Let’s compute the 85th percentile using the
starting salary data. First arrange the data in ascending order.
Step 1:
2710 2755 2850 2880 2880 2890 2920 2940 2950 3050 3130 3325
Step 2: 2.1012100
85
100
np
i
Step 3: Since 10.2 in not an integer, round up to 11.The 85thpercentile is the 11th position (3130)
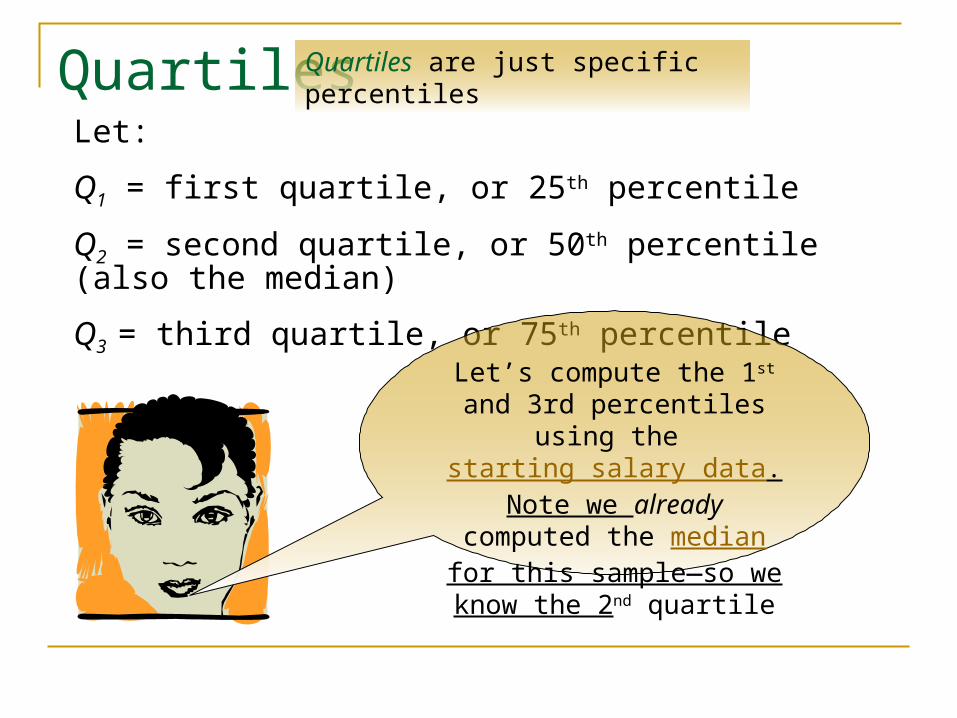
QuartilesQuartiles are just specific percentiles
Let:
Q1 = first quartile, or 25th percentile
Q2 = second quartile, or 50th percentile (also the median)
Q3 = third quartile, or 75th percentile
Let’s compute the 1st and 3rd percentiles using the
starting salary data. Note we already computed the
median for this sample—so we know the 2nd quartile
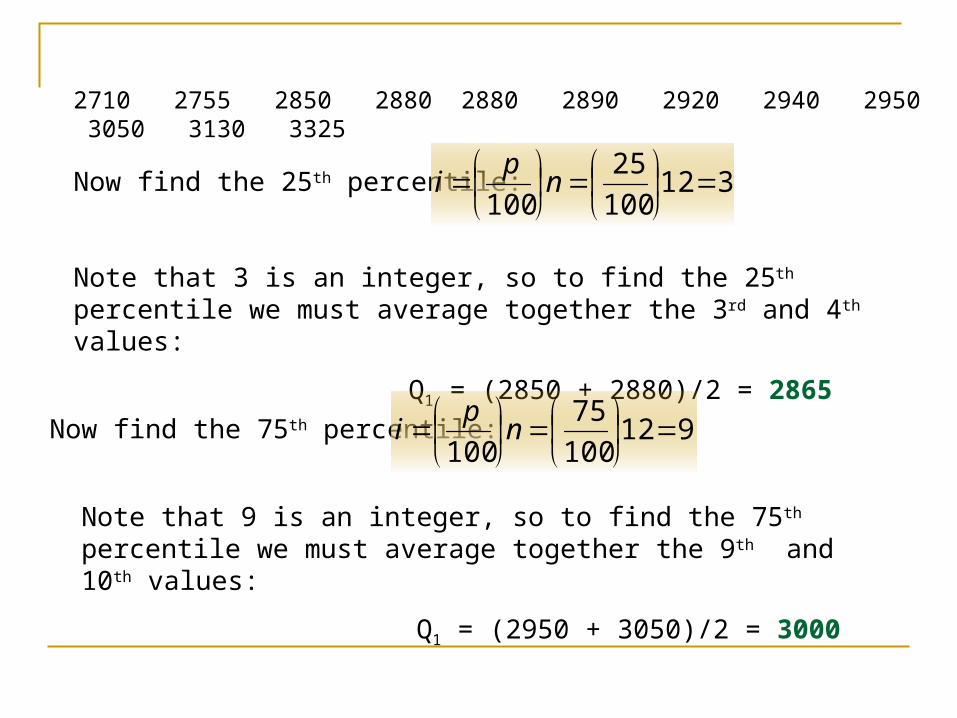
Now find the 25th percentile: 312100
25
100
np
i
2710 2755 2850 2880 2880 2890 2920 2940 2950 3050 3130 3325
Note that 3 is an integer, so to find the 25th percentile we must average together the 3rd and 4th values:
Q1 = (2850 + 2880)/2 = 2865
Now find the 75th percentile: 912100
75
100
np
i
Note that 9 is an integer, so to find the 75th percentile we must average together the 9th and 10th values:
Q1 = (2950 + 3050)/2 = 3000
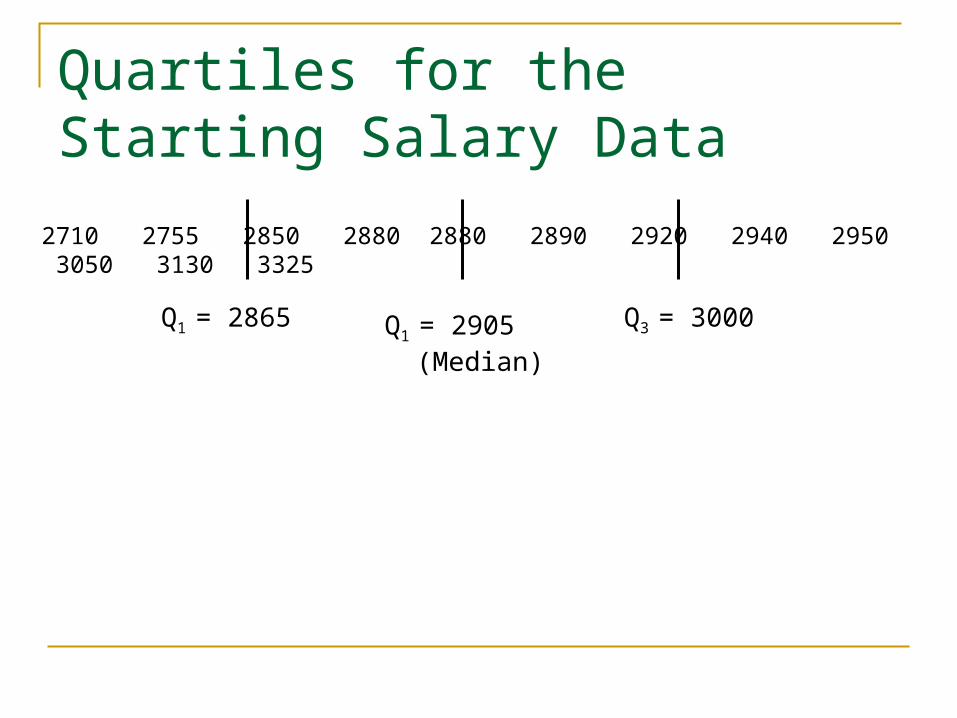
Quartiles for the Starting Salary Data
2710 2755 2850 2880 2880 2890 2920 2940 2950 3050 3130 3325
Q1 = 2865 Q1 = 2905 (Median)
Q3 = 3000
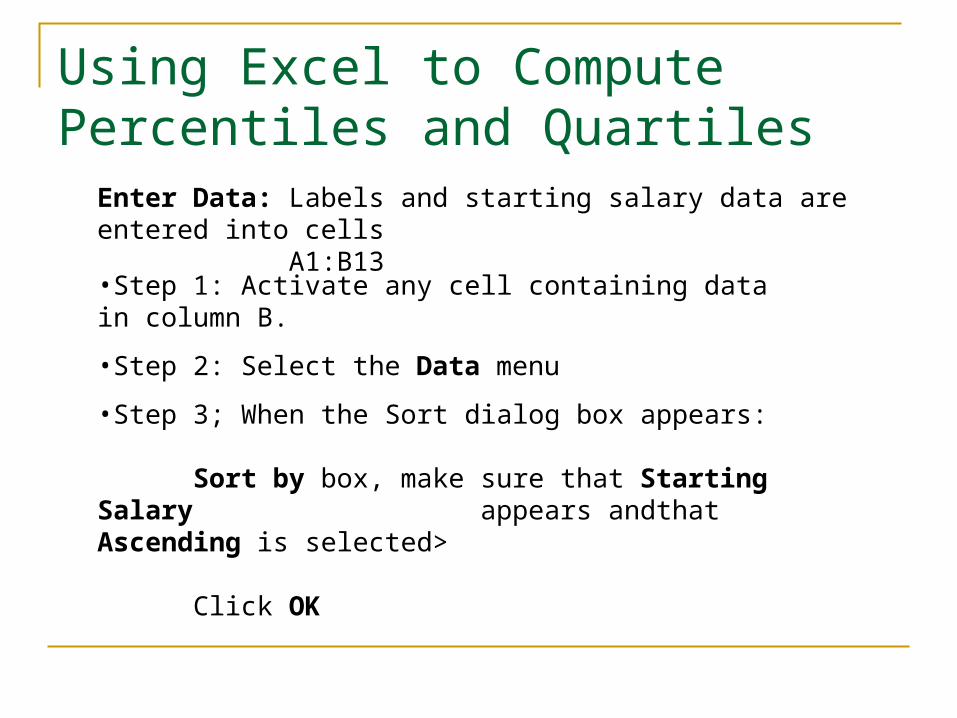
Using Excel to Compute Percentiles and Quartiles
Enter Data: Labels and starting salary data are entered into cells A1:B13
•Step 1: Activate any cell containing data in column B.
•Step 2: Select the Data menu
•Step 3; When the Sort dialog box appears:
Sort by box, make sure that Starting Salary appears andthat Ascending is selected>
Click OK