Embed Size (px)
Citation preview
Descriptive statistics
Statistics
• Many studies generate large numbers of data points, and to make sense of all that data, researchers use statistics that summarize the data, providing a better understanding of overall tendencies within the distributions of scores.
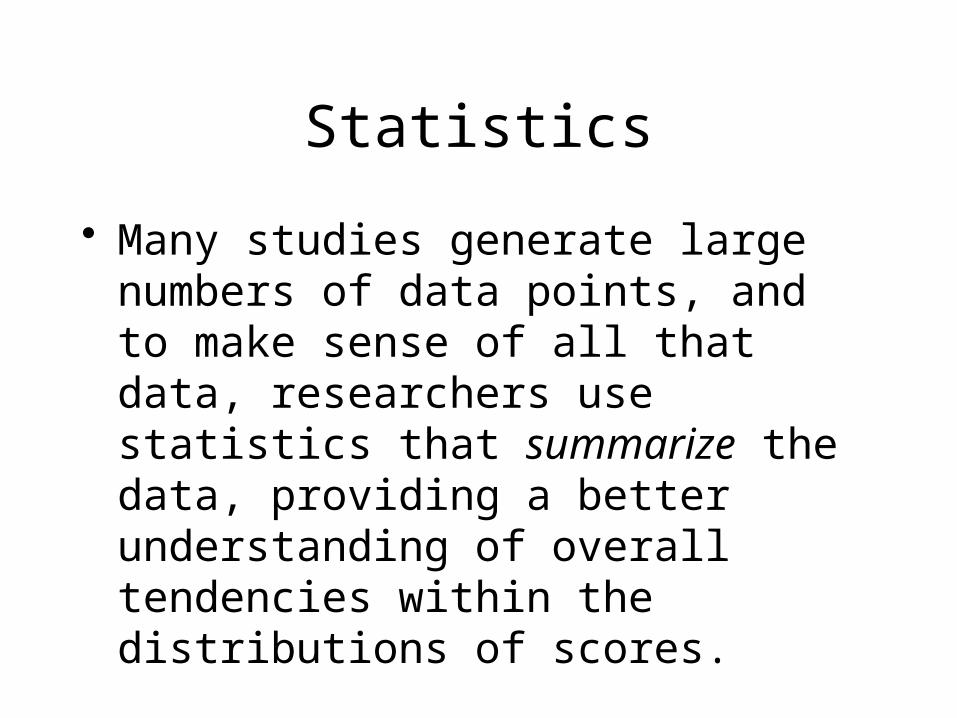
Types of statistics• Types of statistics:
1. descriptive (which summarize some characteristic of a sample) • Measures of central tendency• Measures of dispersion• Measures of skewness
2. inferential (which test for significant differences between groups and/or significant relationships among variables within the sample• t-ratio, chi-square, beta-value
Reasons for using statistics
• aids in summarizing the results• helps us recognize underlying trends and
tendencies in the data• aids in communicating the results to others

Descriptive statistics
• If we wanted to characterize the students in this class we would find that they are:– Young– From Kentucky– Fit– Male
• How young?• How Kentuckian is this class?• How fit is this class?• What is the distribution of males and females?
Frequency distribution
• The frequency with which observations are assigned to each category or point on a measurement scale.– Most basic form of descriptive statistics– May be expressed as a percentage of the total
sample found in each category
Source : Reasoning with Statistics, by Frederick Williams & Peter Monge, fifth edition, Harcourt College Publishers.
Frequency distribution
• The distribution is “read” differently depending upon the measurement level– Nominal scales are read as discrete
measurements at each level– Ordinal measures show tendencies, but
categories should not be compared– Interval and ratio scales allow for comparison
among categories
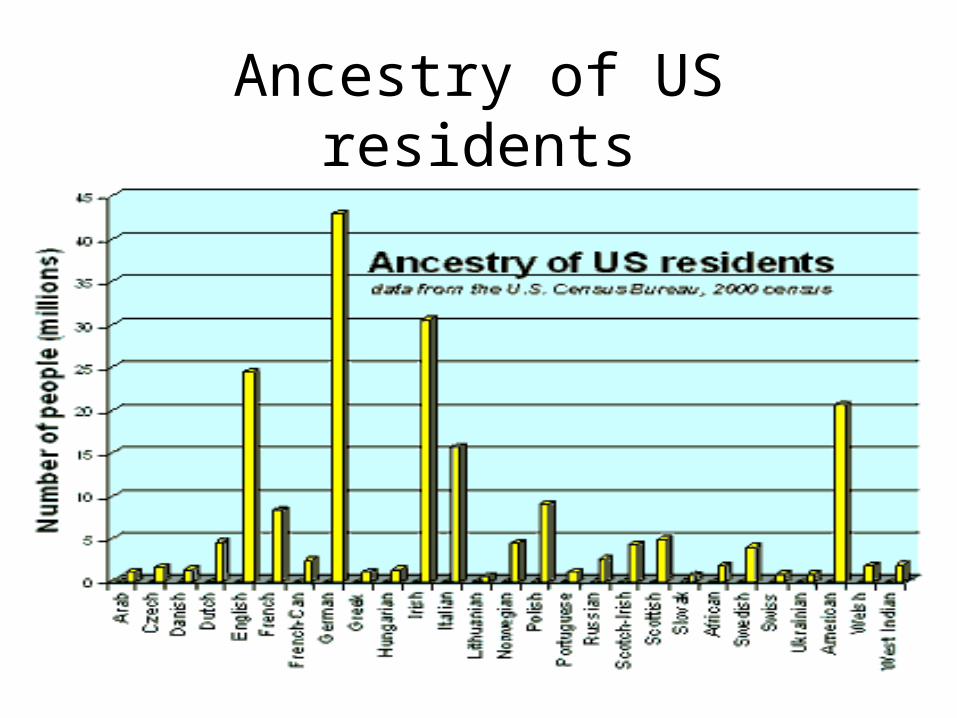
Ancestry of US residents
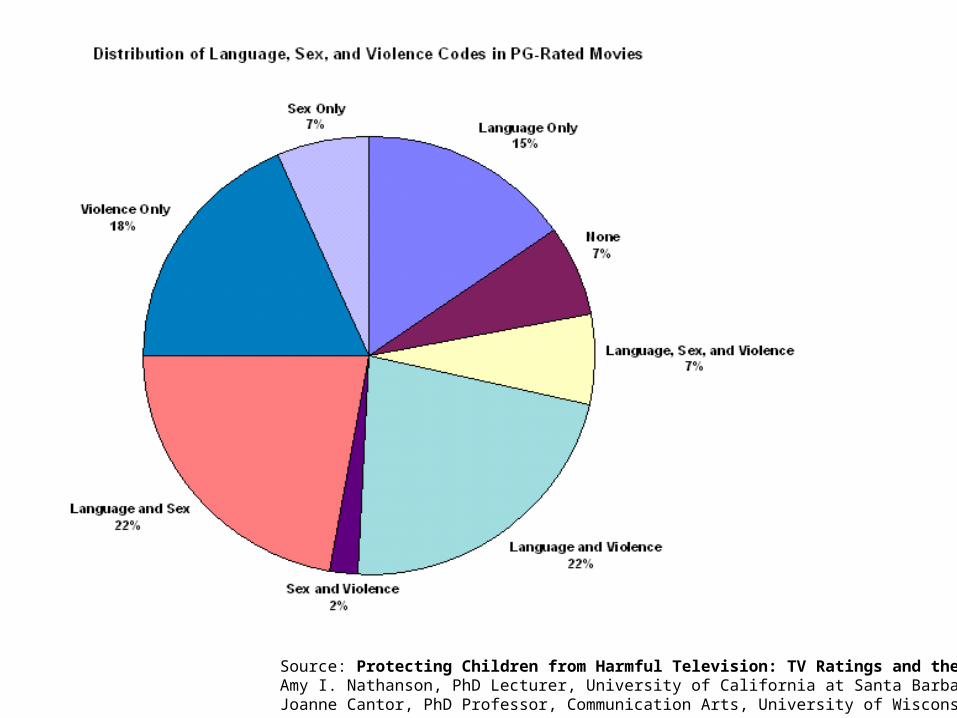
Source: Protecting Children from Harmful Television: TV Ratings and the V-chipAmy I. Nathanson, PhD Lecturer, University of California at Santa BarbaraJoanne Cantor, PhD Professor, Communication Arts, University of Wisconsin-Madison
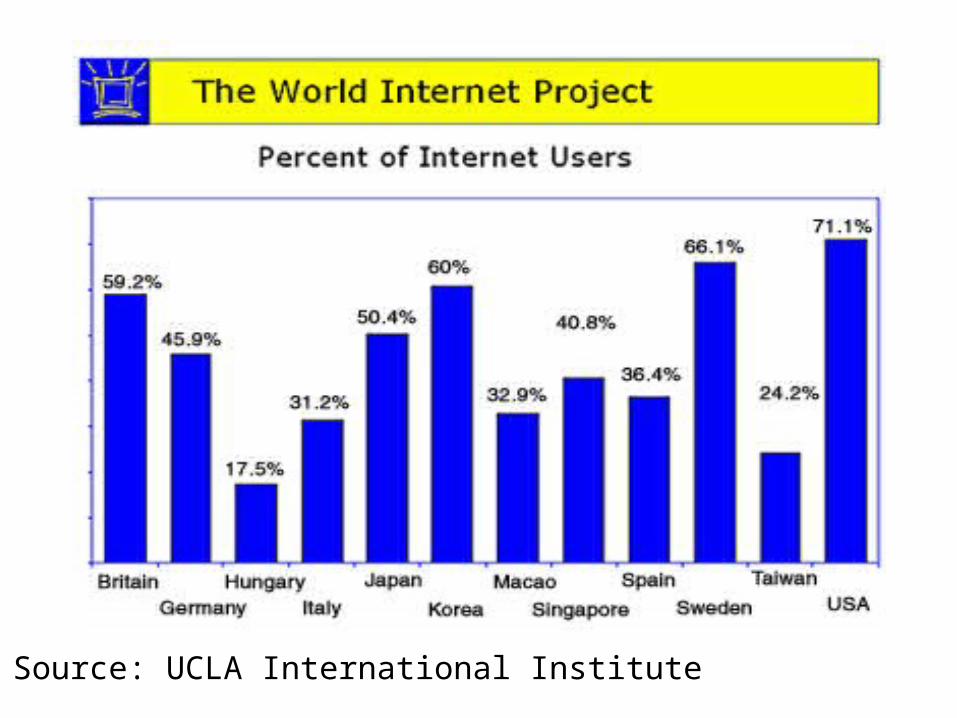
Source: UCLA International Institute
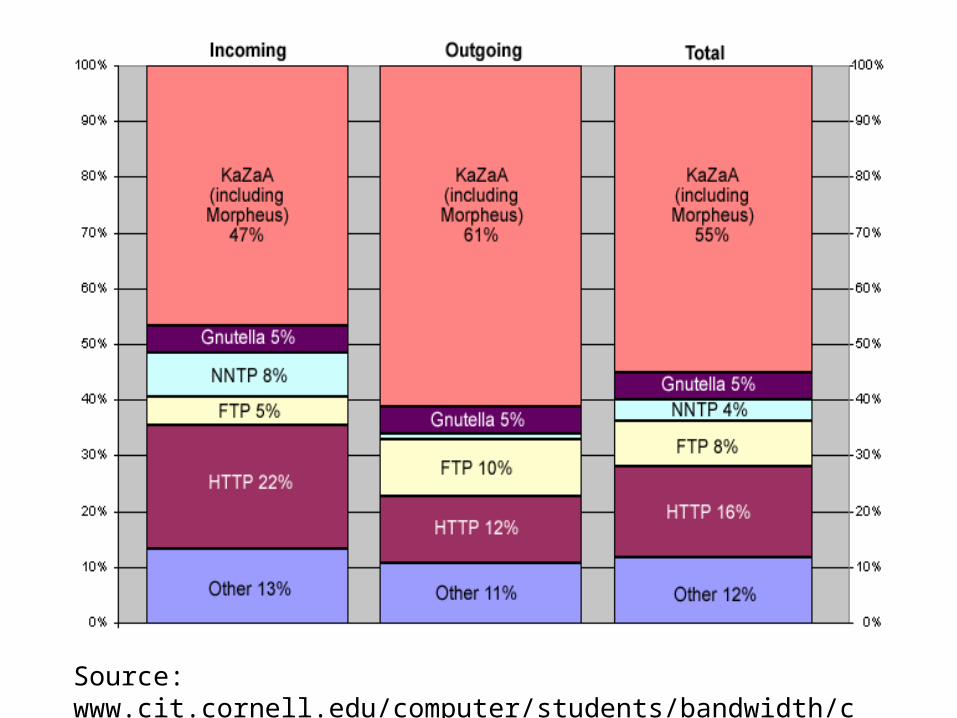
Source: www.cit.cornell.edu/computer/students/bandwidth/charts.html
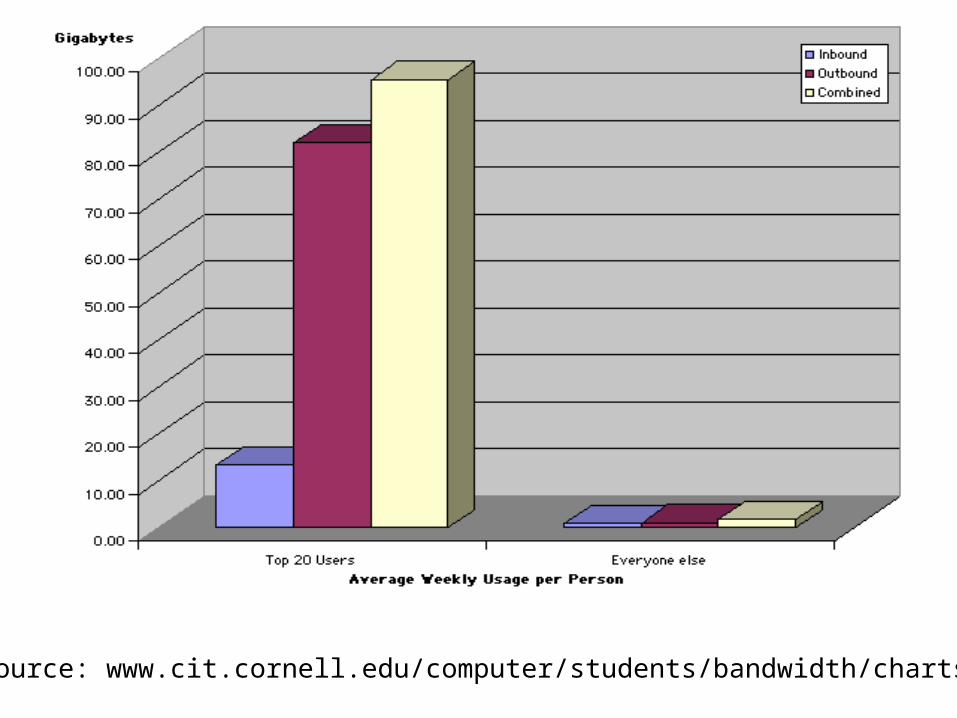
Source: www.cit.cornell.edu/computer/students/bandwidth/charts.html
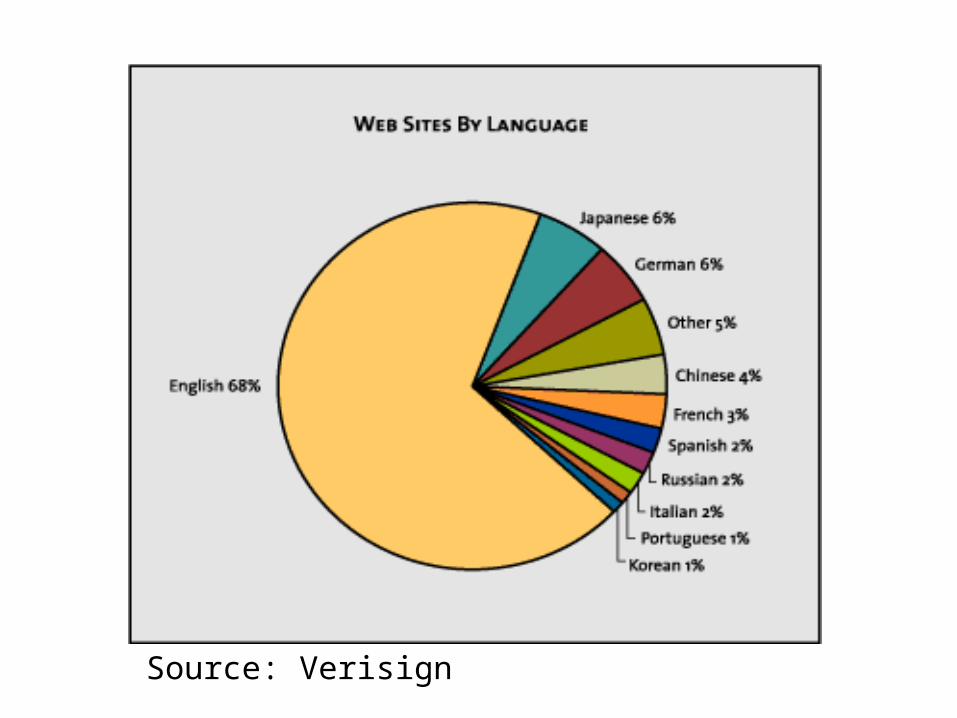
Source: Verisign
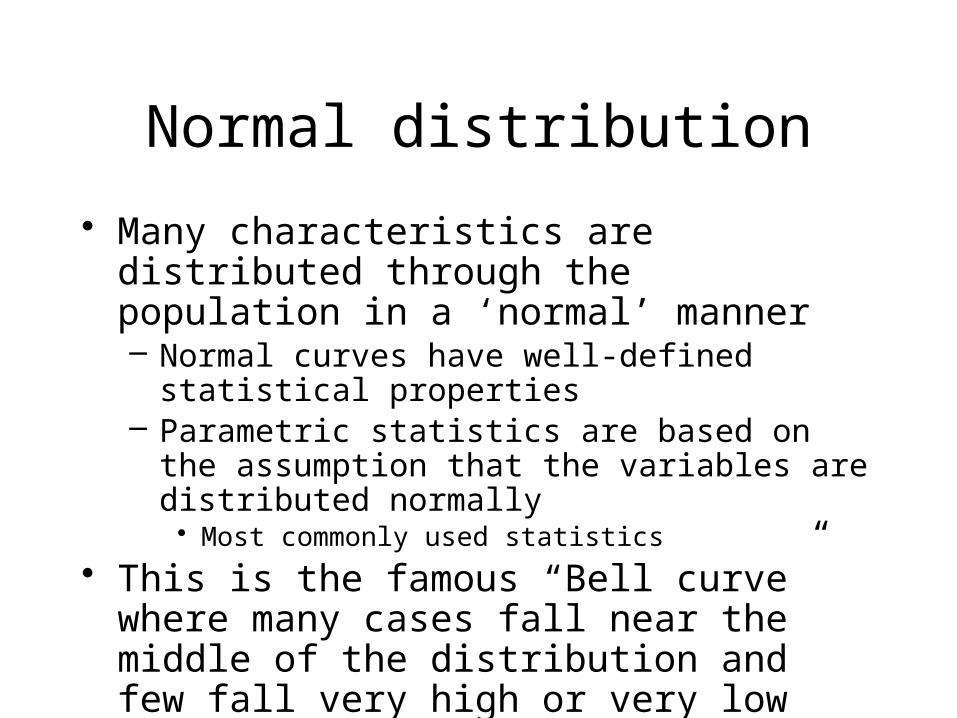
Normal distribution
• Many characteristics are distributed through the population in a ‘normal’ manner– Normal curves have well-defined statistical properties– Parametric statistics are based on the assumption that
the variables are distributed normally• Most commonly used statistics
• This is the famous “Bell curve” where many cases fall near the middle of the distribution and few fall very high or very low– I.Q.
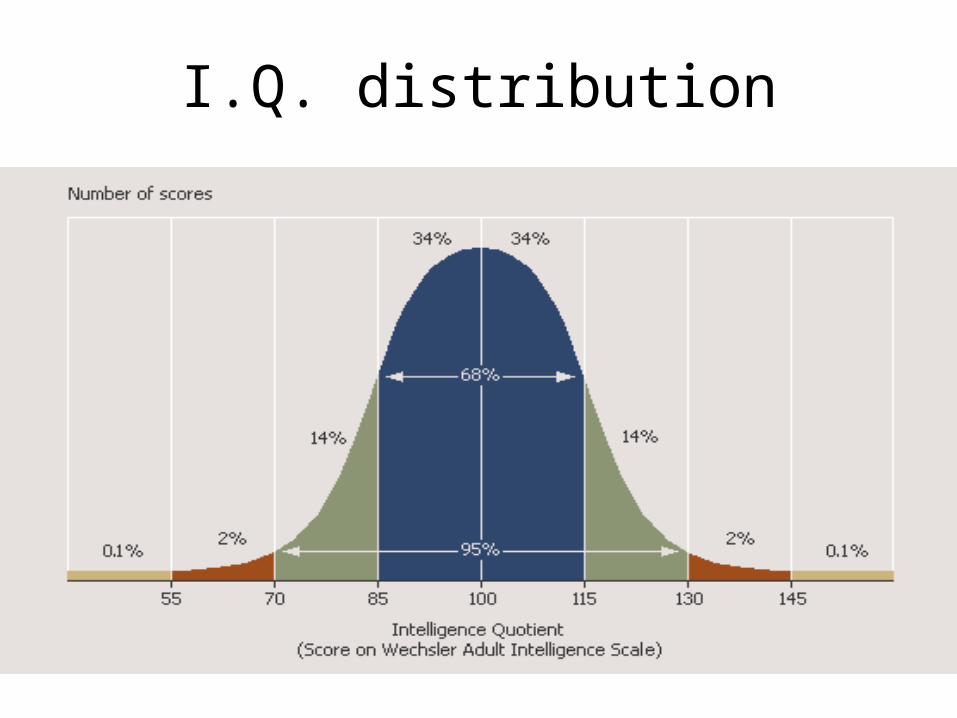
I.Q. distribution
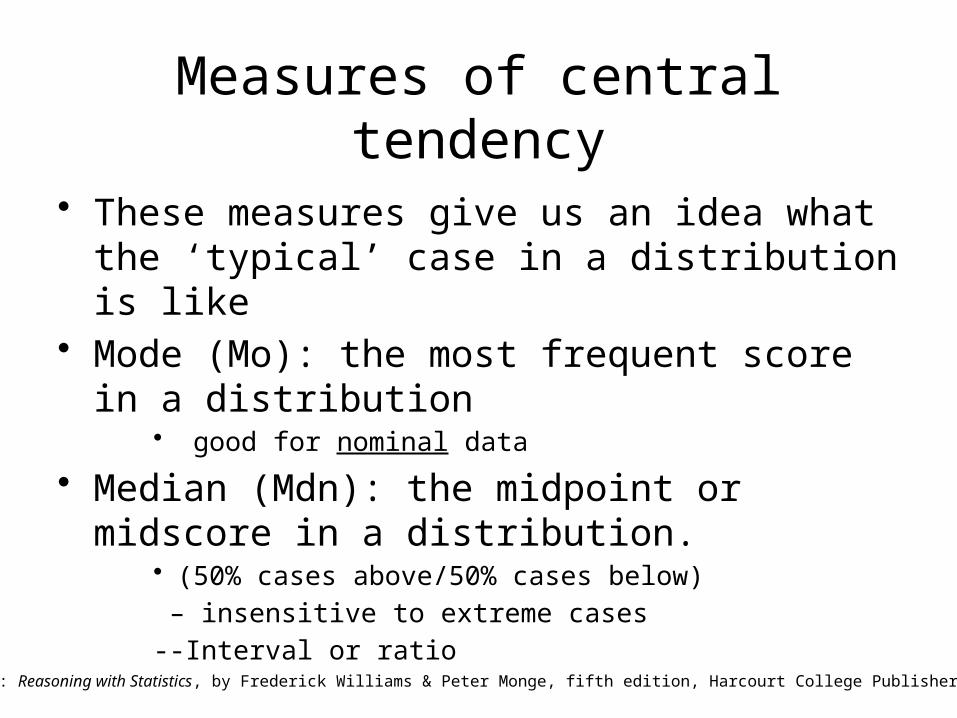
Measures of central tendency
• These measures give us an idea what the ‘typical’ case in a distribution is like
• Mode (Mo): the most frequent score in a distribution• good for nominal data
• Median (Mdn): the midpoint or midscore in a distribution.
• (50% cases above/50% cases below)
– insensitive to extreme cases
--Interval or ratio
Source : Reasoning with Statistics, by Frederick Williams & Peter Monge, fifth edition, Harcourt College Publishers.
Measures of central tendency
• Mean– The ‘average’ score—sum of all individual
scores divided by the number of scores– has a number of useful statistical properties
• however, can be sensitive to extreme scores (“outliers”)
– many statistics are based on the mean
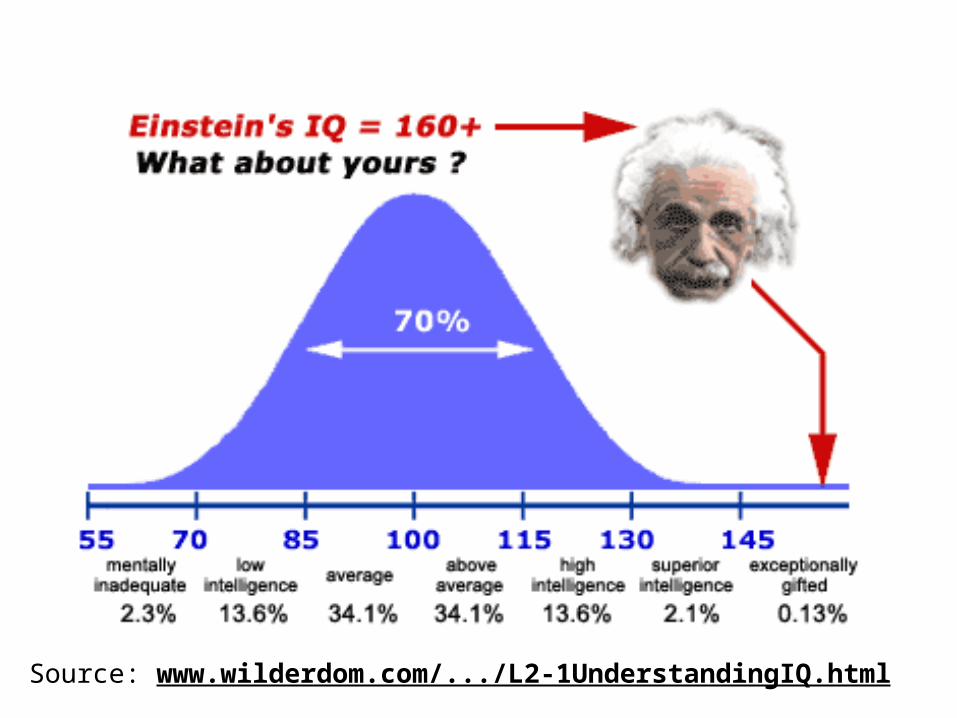
Source: www.wilderdom.com/.../L2-1UnderstandingIQ.html
Statistics estimating dispersion
• Some statistics look at how widely scattered over the scale the individual scores are
• Groups with identical means can be more or less widely dispersed
• To find out how the group is distributed, we need to know how far from or close to the mean individual scores are
• Like the mean, these statistics are only meaningful for interval or ratio-level measures
Estimates of dispersion
• Range• Distance between the highest and lowest scores in
a distribution;• sensitive to extreme scores;• Can compensate by calculating interquartile range
(distance between the 25th and 75th percentile points) which represents the range of scores for the middle half of a distribution
Usually used in combination with other measures of dispersion.
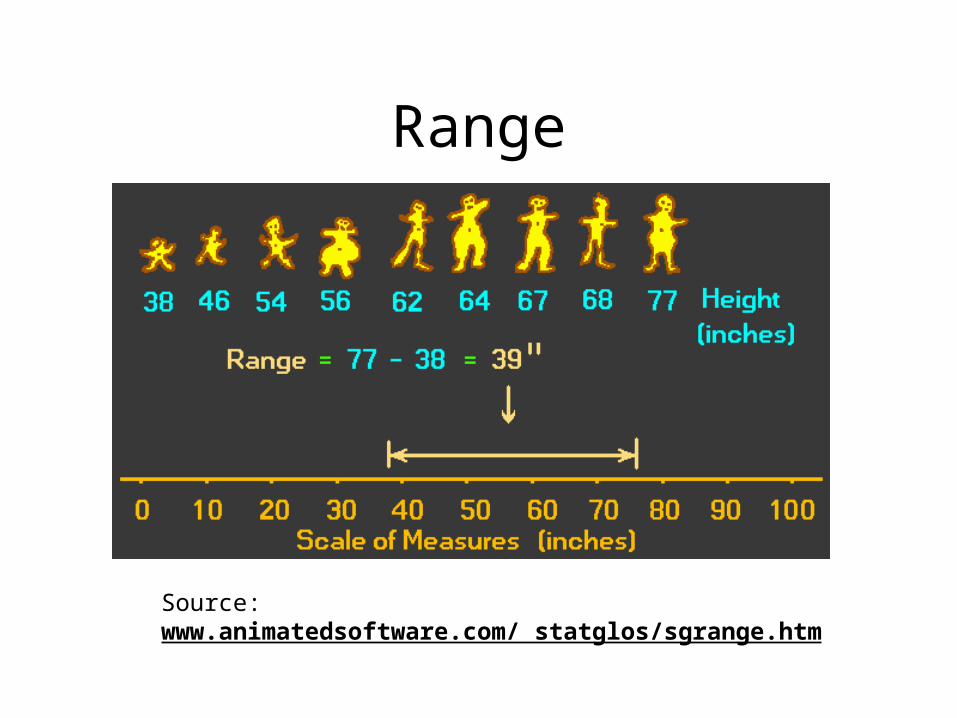
Range
Source: www.animatedsoftware.com/ statglos/sgrange.htm
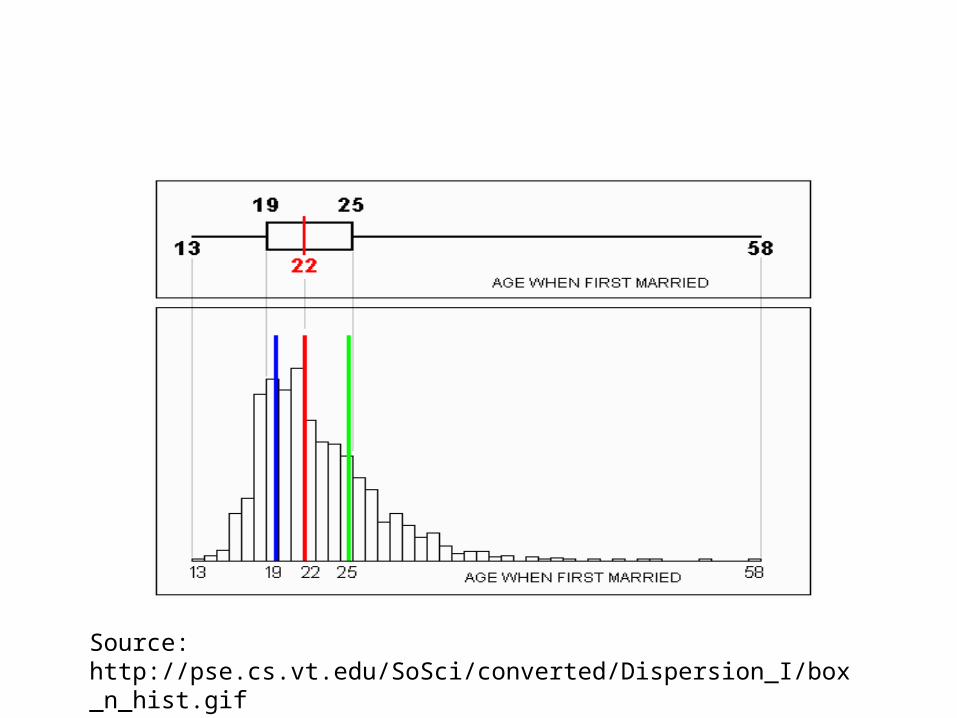
Source: http://pse.cs.vt.edu/SoSci/converted/Dispersion_I/box_n_hist.gif
Variance (S2)– Average of squared distances of individual points from
the mean • sample variance
– High variance means that most scores are far away from the mean. Low variance indicates that most scores cluster tightly about the mean.
– The amount that one score differs from the mean is called its deviation score (deviate)
– The sum of all deviation scores in a sample is called the sum of squares
Estimates of dispersion
A summary statistic of how much scores vary from the mean
Square root of the Variance– expressed in the original units of measurement– Represents the average amount of dispersion in
a sample– Used in a number of inferential statistics
Standard Deviation (SD)
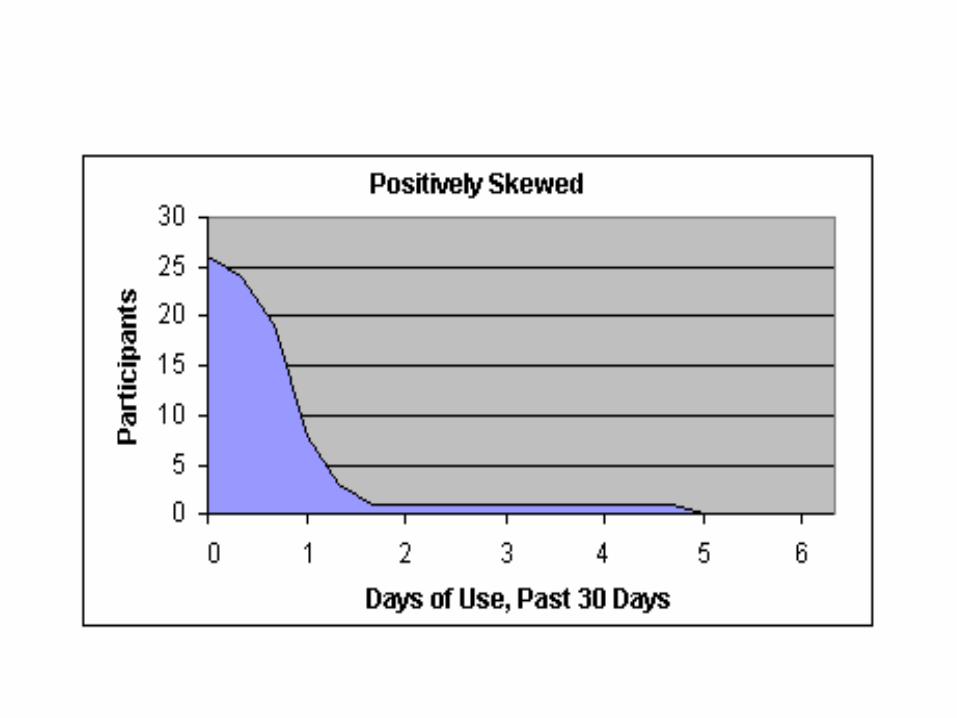
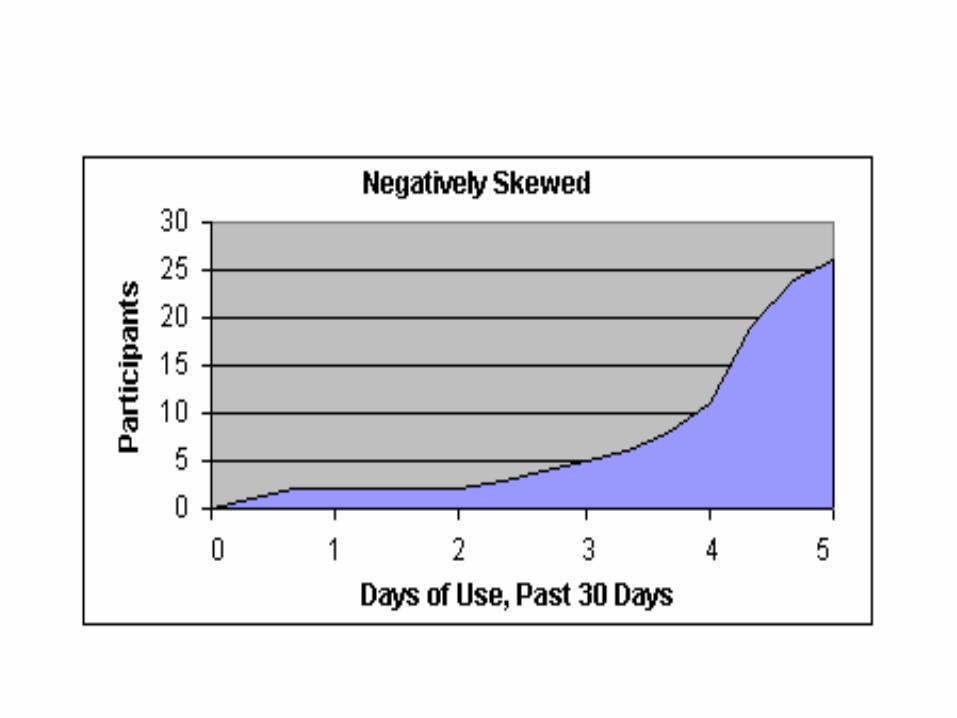
Skewness of distributions
• Measures look at how lopsided distributions are—how far from the ideal of the normal curve they are
• When the median and the mean are different, the distribution is skewed. The greater the difference, the greater the skew.
• Distributions that trail away to the left are negatively skewed and those that trail away to the right are positively skewed
• If the skewness is extreme, the researcher should either transform the data to make them better resemble a normal curve or else use a different set of statistics—nonparametric statistics—to carry out the analysis
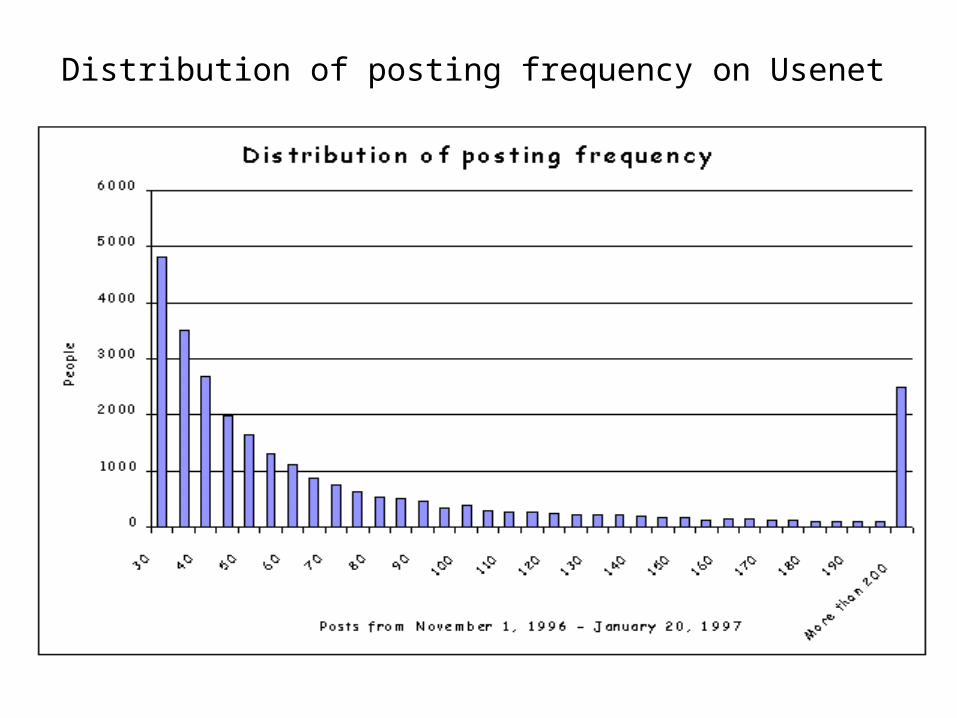
Distribution of posting frequency on Usenet
So
• Descriptive statistics are used to summarize data from individual respondents, etc.– They help to make sense of large numbers of
individual responses, to communicate the essence of those responses to others
• They focus on typical or average scores, the dispersion of scores over the available responses, and the shape of the response curve