Embed Size (px)
Citation preview

UNLV Theses, Dissertations, Professional Papers, and Capstones
2009
Design and characterization of a shock and vibration mitigation Design and characterization of a shock and vibration mitigation
seat system seat system
George Samaan Ladkany University of Nevada Las Vegas
Follow this and additional works at: https://digitalscholarship.unlv.edu/thesesdissertations
Part of the Biomechanical Engineering Commons, and the Biomedical Engineering and Bioengineering
Commons
Repository Citation Repository Citation Ladkany, George Samaan, "Design and characterization of a shock and vibration mitigation seat system" (2009). UNLV Theses, Dissertations, Professional Papers, and Capstones. 171. http://dx.doi.org/10.34917/1394606
This Thesis is protected by copyright and/or related rights. It has been brought to you by Digital Scholarship@UNLV with permission from the rights-holder(s). You are free to use this Thesis in any way that is permitted by the copyright and related rights legislation that applies to your use. For other uses you need to obtain permission from the rights-holder(s) directly, unless additional rights are indicated by a Creative Commons license in the record and/or on the work itself. This Thesis has been accepted for inclusion in UNLV Theses, Dissertations, Professional Papers, and Capstones by an authorized administrator of Digital Scholarship@UNLV. For more information, please contact [email protected].

DESIGN AND CHARACTERIZATION OF A SHOCK AND VIBRATION
MITIGATION SEAT SYSTEM
by
George Samaan Ladkany
Bachelor of Science EngineeringUniversity of Nevada, Las Vegas
2006
A thesis submitted in partial fulfillmentof the requirements for the
Master of Science in Mechanical EngineeringDepartment of Mechanical Engineering
Howard R. Hughes College of Engineering
Graduate CollegeUniversity of Nevada, Las Vegas
December 2009

Copyright by George Samaan Ladkany 2010All Rights Reserved
ii
THE GRADUATE COLLEGE
We recommend that the thesis prepared under our supervision by
George Samaan Ladkany
entitled
Design and Characterization of a Shock and Vibration Mitigation Seat System
be accepted in partial fulfillment of the requirements for the degree of
Master of ScienceMechanical Engineering
Douglas Reynolds, Committee Chair
Brian Landsberger, Committee Member
William Culbreth, Committee Member
Edward Neumann, Graduate Faculty Representative
Ronald Smith, Ph. D., Vice President for Research and Graduate Studiesand Dean of the Graduate College
December 2009
iii
ABSTRACT
Design and Characterization of a Shock and Vibration Mitigation Seat System
by
George Samaan Ladkany
Dr. Douglas Reynolds, Examination Committee ChairProfessor of Mechanical Engineering
University of Nevada, Las Vegas
Extensive research has been conducted into the development of pneumatic seat-
bladder systems for shock and vibration mitigation for use in current U.S military vehicle
envelopes. This research expands on the previous work through an elaborate
experimental characterization of four prototype air bladder seat cushion systems. The
experimental characterization conducted included shock testing, continuous vibration,
and internal dynamic pressure measured during the shock event.
The shock testing was conducted both at the Army Research Lab as well at UNLV.
The shock testing conducted at UNLV was performed on a drop tower designed and
constructed during the time of this research. The scope of the testing was extended
beyond the U.S military’s requirements to include random continuous vibrations which
can cause physical harm to the occupant over extended durations. The primary
considerations are to increase the survivability of crewmembers exposed to mine blasts
and mitigation of the vibration experienced in rough or combat related ride situations.
Various suggestions from the tested prototypes are provided for field implementation.
This study showed that the seat bladder system produced reductions in dynamic response
index (DRI) and from baseline values of pelvic accelerations (up to 77% or 790m/s2),
vibration dosage values (VDV up to 60%), and lumbar spinal load (up to 60% or 6000N).

iv
ACKNOWLEDGEMENTS
I would like to thank all of my family, friends, and advisors that have stood by me
and supported me, not only through this process, but throughout my life. You have been
with me during both the most difficult and the most memorable of times. Without you, I
would not be the man I am today.

v
TABLE OF CONTENTS
ABSTRACT....................................................................................................................... iii
ACKNOWLEDGMENTS ................................................................................................ iv
TABLE OF CONTENTS.................................................................................................... v
LIST OF TABLES ............................................................................................................ ix
LIST OF FIGURES ........................................................................................................... x
CHAPTER 1 INTRODUCTION ........................................................................................ 11.1 The Problem............................................................................................................ 11.2 Characterization of the Mine Blast Threat.............................................................. 21.3 Vehicle Seat Systems.............................................................................................. 21.4 Air Bladder Seat Cushion Concept ......................................................................... 41.5 Overview of Work .................................................................................................. 61.6 Project Objectives ................................................................................................... 6
CHAPTER 2 INJURY ASSESSMENT.............................................................................. 82.1 Injury Criteria and Assessment............................................................................... 82.2 Abbreviated Injury Scale ........................................................................................ 92.3 Evaluation of Human Exposure to Whole Body Vibration .................................. 102.4 Health Risks .......................................................................................................... 112.5 Pelvic and Spinal Injury Criteria........................................................................... 122.6 Mine Blast Injury Criteria..................................................................................... 162.7 NATO Testing and Evaluation Injury Criteria ..................................................... 172.8 ISO Weighting of 1/3-Octave Band Data for
Continuous and Impulsive Vibration ............................................................ 192.8.1 Whole-Body Weighted Acceleration........................................................... 19
2.9 Impulsive Vibration and the Vibration Dosage Value (VDV) ............................. 212.10 Dynamic Response Index (DRI) Measurement .................................................. 21
CHAPTER 3 AIR BLADDER SEAT CUSHION DEVELOPMENT ............................. 243.1 Seat Cushion Description...................................................................................... 243.2 Prototype Configurations for Future Design of Experiment (DOE)..................... 253.3 Previous Modeling ................................................................................................ 263.4 Pressure Consideration.......................................................................................... 293.5 Force- Compression Testing ................................................................................. 303.6 Dynamic Pressure Consideration.......................................................................... 31
CHAPTER 4 TEST PROTOCOLS AND EXPERIMENTAL CHARACTERIZATION 334.1 Army Research Lab Testing ................................................................................. 334.2 UNLV Drop Tower Testing.................................................................................. 344.3 Quasi-Static and Dynamic Pressure Testing......................................................... 36

vi
4.3.1 Force- compression testing .......................................................................... 364.3.2 Dynamic Pressure Testing ........................................................................... 36
4.4 Random Vibration Excitation ............................................................................... 374.4.1 Physical Setup.............................................................................................. 394.4.2 Warrior Signal Characterization .................................................................. 404.4.3 Constant R.M.S-Velocity Signal Characterization ...................................... 414.4.4 Signal Comparison....................................................................................... 43
CHAPTER 5 SEAT VIBRATION TRANSMISSIBILITY RESULTS ........................... 445.1 Signal Characteristics............................................................................................ 44
5.1.1 Warrior Signal.............................................................................................. 455.1.2 Constant RMS Velocity Signal.................................................................... 465.1.3 Signal Comparison Analysis........................................................................ 47
5.2 Coherence ............................................................................................................. 475.3 Seat Pad Autospectrum......................................................................................... 495.4 ISO Weighted Seat Pad Autospectrum ................................................................ 51
5.4.1 ISO 2631 Weighting Factors ....................................................................... 515.4.2 ISO Weighted Seatpad Autospectrum ......................................................... 52
5.5 Seat Transmissibility ............................................................................................ 535.6 Frequency Response ............................................................................................. 54
CHAPTER 6 QUASI-STATIC AND DYNAMIC PRESSURE RESULTS.................... 566.1 Foam and Air Individual Contributions to Force-Compression ........................... 566.2 Dynamic Pressure Consideration.......................................................................... 59
6.2.1 Characterization of the Input Shock for Pressure Consideration................. 596.3 Dynamic Pressure Results..................................................................................... 62
6.3.1 Pressures from 10in Drop Heights............................................................... 626.3.2 Pressures from 20in Drop Heights............................................................... 646.3.3 Pressures from 30in Drop Heights............................................................... 66
CHAPTER 7 ARL SHOCK TESTING AND ANTHROPOMORPHIC RESPONSE RESULTS .............................................................................. 68
7.1 ARL Shock Characterization ................................................................................ 687.2 Presentation of Shock Data Results ...................................................................... 697.3 ARL Anthropomorphic Dummy and Bladder Acceleration Performance ........... 69
7.3.1 Baseline/ATD Acceleration Performance – ARL........................................ 697.3.2 Combined Acceleration Plots for 30in Drop Height– ARL......................... 717.3.3 Bladder 1 Acceleration Performance – ARL............................................... 727.3.4 Bladder 2 Acceleration Performance – ARL............................................... 737.3.5 Bladder 3 Acceleration Performance – ARL............................................... 747.3.6 Bladder 4 Acceleration Performance – ARL............................................... 75
7.4 Spine Load Performance – ARL........................................................................... 767.4.1 Combined Spine Load Performance by Drop Height – ARL...................... 767.4.2 Spine Load Performance by Bladder ........................................................... 78
7.5 Dynamic Response Index Performance ................................................................ 817.5.1 DRI for Each Bladder from 30in Drop Height- ARL.................................. 81

vii
7.5.2 Combined DRI Performance of the Seat Pad from all heights .................... 837.5.3 Combined DRI Performance of the Pelvis from all heights ........................ 85
CHAPTER 8 UNLV SHOCK TESTING RESPONSE RESULTS.................................. 878.1 UNLV Shock Characterization ............................................................................. 878.2 Typical Signal Filtering Results............................................................................ 888.3 Combined Acceleration Performance Plots for all Drop Heights – UNLV.......... 918.4 Seat Acceleration Performance and Kinematics
by Bladder for 30in Drop – UNLV....................................................................... 928.5 Dynamic Response Index Performance – UNLV................................................. 95
8.5.1 DRI for 30in Drop Heights – UNLV ........................................................... 958.5.2 Combined DRI Performance for 30in Drop Heights – UNLV.................... 98
CHAPTER 9 DISCUSSION AND ANALYSIS OF RESULTS...................................... 999.1 Discussion of Seat Vibration Results.................................................................... 99
9.1.1 Vibration Signal Comparison ...................................................................... 999.1.2 Coherence, Frequency Response Function and Transmissibility Function1009.1.3 Seat Cushion Input Autospectra................................................................. 1029.1.4 ISO Weighted Seat Pad Autospectrum Analysis ....................................... 1039.1.5 ISO Weighted R.M.S Acceleration and Vibration Dosage Values ........... 1039.1.6 Overall Pneumatic Air-Bladder
Comparison for Vibration Transmissibility............................................... 1059.2 Discussion of Pressure Testing Results .............................................................. 1069.3 Discussion of ARL Shock Testing and ATD Performance Results ................... 109
9.3.1 Anthropomorphic Dummy/Baseline Testing............................................. 1099.3.2 Typical Bladder Acceleration and Plate Kinematics ................................. 1119.3.3 Individual Bladder Acceleration Performance........................................... 1139.3.4 Spine Load Performance............................................................................ 1149.3.5 Summary of all USARL Peak Values........................................................ 1159.3.6 Dynamic Response Index Performance – ARL......................................... 116
9.4 Discussion of UNLV Shock Performance .......................................................... 1189.4.1 Seat Pad Acceleration Discussion.............................................................. 1209.4.2 Dynamic Response Index Discussion – UNLV......................................... 121
9.5 Comparing ARL and UNLV DRI Performance ................................................. 1229.5.1 Peak DRI Rankings.................................................................................... 1229.5.2 Peak Difference DRI Analysis................................................................... 1239.5.3 DRI Rankings Overview............................................................................ 125
9.6 Review of Total Bladder Performance by Input Acceleration............................ 1259.7 Overall Performance Trends and Conclusions ................................................... 131
CHAPTER 10 CONCLUSIONS AND RECCOMENDATIONS.................................. 13610.1 Pneumatic Seat Cushion Overview................................................................... 13610.2 Previous Work .................................................................................................. 13710.3 Overview of Current Work ............................................................................... 13810.4 Summary of Current Data and Results ............................................................. 13910.5 Conclusions....................................................................................................... 140

viii
10.6 Future Work ...................................................................................................... 14210.7 Final Thoughts .................................................................................................. 142
APPENDIX A SUPPLEMENTAL PLOTS.................................................................... 144
REFERENCES ............................................................................................................... 157
VITA............................................................................................................................... 159

ix
LIST OF TABLES
Table 2.1 Abbreviated Injury Scale Codes ..................................................................... 10Table 2.2 EU Vibration Exposure Limit and Action Value in the Workplace. .............. 12Table 2.3 Lumbar Spine Tolerance Levels Recommended by the U.S. Army............... 15Table 2.4 Landmine Injury Criteria ............................................................................... 16Table 2.5 Landmine Injury Criteria ................................................................................ 17Table 2.6 Third-Octave Band Weighting Factors for the Vertical Direction for Whole
Body Vibration ............................................................................................... 19Table 2.7 Multiplying Factors for Health in the Seated Position ................................... 20Table 3.1 Parameter Configurations of Seat Prototypes................................................. 25Table 3.2 Human Body Model Parameters..................................................................... 28Table 4.1 Warrior Signal Shaker Input Characteristics .................................................. 41Table 4.2 Constant Velocity Signal – Shaker Input Characteristics............................... 43Table 5.1 ISO Weighting Factors for the Vertical Direction (ISO 2631)....................... 51Table 8.1 Summary of Peak Input Acceleration Values................................................. 88Table 8.2 Filtered Acceleration Peak Reduction ............................................................ 90Table 9.1 Review of Bladder Parameter Configurations ................................................ 99Table 9.2 Warrior Signal Weighted R.M.S Acceleration and eVDV........................... 104Table 9.3 Constant Velocity Signal Weighted R.M.S Acceleration and eVDV........... 105Table 9.4 Pressure in Seat Bottom for all Drop Heights............................................... 108Table 9.5 Pressure in Seat Back for all Drop Heights .................................................. 108Table 9.6 Calculated Force Applied to Seated Occupant by
Internal Bladder Pressure.............................................................................. 108Table 9.7 Rankings of Bladders by Applied Force to Seated Occupant of
all Drop Heights............................................................................................ 109Table 9.8 Average USARL Shock Input Peak Accelerations....................................... 109Table 9.9 Summary of USARL ATSD Baseline Values .............................................. 110Table 9.10 Spinal Load Reductions at 30in Drop Height............................................... 114Table 9.11 USARL ATSD Air Bladder Seat Cushion 1 Values..................................... 115Table 9.12 USARL ATSD Air Bladder Seat Cushion 2 Values..................................... 115Table 9.13 USARL ATSD Air Bladder Seat Cushion 3 Values..................................... 115Table 9.14 USARL ATSD Air Bladder Seat Cushion 4 Values..................................... 116Table 9.15 Summary of Bladder Configuration Performance Rankings by DRI ........... 118Table 9.16 Difference in Raw Peak Acceleration Values from ARL to UNLV............. 119Table 9.17 Ranking of Seat-pad DRI Performance – UNLV ......................................... 122Table 9.18 Magnitudes of DRIs from ARL Testing ....................................................... 122Table 9.19 Rankings based on Peak DRIs from UNLV and ARL Testing .................... 123Table 9.20 Magnitude Differences of DRIs from ARL Testing..................................... 123Table 9.21 Magnitude Differences of DRIs from UNLV Testing.................................. 123Table 9.22 Magnitude Differences of DRIs from UNLV Testing.................................. 124Table 9.23 Magnitude Differences of DRIs from ARL and UNLV Testing .................. 124Table 9.24 Summary of DRI Rankings by Criteria and Test Location .......................... 125

x
LIST OF FIGURES
Figure 2.1 Typical Injury Risk Curves ........................................................................... 10Figure 2.2 Shock Motion Terminology ......................................................................... 13Figure 2.3 Shock Input Tolerance Levels for a Seated Man........................................... 14Figure 2.4 Spinal Injury Rate as a Function of DRI for
Aircraft Seat Ejection Events ........................................................................ 14Figure 2.5 Duration and Magnitude of Vertical Acceleration ........................................ 15Figure 2.6 Recommended Injury Criteria for Landmine
Testing by the U.S. Army .............................................................................. 18Figure 2.7 DRI Mass-Spring-Damper System................................................................ 22Figure 3.1 Drawing of Pneumatic Seat-Bladder System with Connected Seat Bottom
and Seat-Back ............................................................................................... 25Figure 3.2 Numerical Model Schematic ......................................................................... 27Figure 3.3 Free Body Diagram ....................................................................................... 28Figure 4.1 Experimental Setup of Seat Vibration Transmissibility................................ 40Figure 4.2 Testing and Instrumentation Schematic ........................................................ 40Figure 4.3 Warrior Signal Time History......................................................................... 41Figure 5.1 Warrior Signal Autospectrum........................................................................ 45Figure 5.2 Warrior Signal FFT ....................................................................................... 45Figure 5.3 Constant R.M.S Velocity Signal Autospectrum............................................ 46Figure 5.4 Constant R.M.S Velocity FFT....................................................................... 46Figure 5.5 Coherence Warrior Signal ............................................................................. 48Figure 5.6 Coherence Constant Velocity Signal............................................................. 48Figure 5.7 Seat Pad Warrior Autospectrum.................................................................... 49Figure 5.8 Seat Pad Constant Velocity Autospectrum.................................................... 49Figure 5.9 Seat Pad Warrior Signal FFT ........................................................................ 50Figure 5.10 Seat Pad Constant Velocity FFT ................................................................... 50Figure 5.11 ISO Weighted Seat Pad Warrior Autospectrum............................................ 52Figure 5.12 ISO Weighted Seat Pad Constant Velocity Autospectrum............................ 52Figure 5.13 Warrior Signal Transmissibility .................................................................... 53Figure 5.14 Constant Velocity Signal Transmissibility.................................................... 53Figure 5.15 Magnitude of Frequency Response Warrior Signal ...................................... 54Figure 5.16 Phase of Frequency Response Warrior Signal .............................................. 54Figure 5.17 Magnitude of Frequency Response Constant Velocity Signal ...................... 55Figure 5.18 Phase of Frequency Response Constant Velocity Signal .............................. 55Figure 6.1 Foam Compression Test Results ................................................................... 57Figure 6.2 Bladder Compression-Pressure Test Results................................................. 57Figure 6.3 Air Bladder Individual Components Performance ........................................ 58Figure 6.4 Air Bladder Compression –Force Results ..................................................... 59Figure 6.5 UNLV Input Shock Profiles from All Drop Heights..................................... 60Figure 6.6 ARL Input Shock Profiles from All Drop Heights........................................ 61Figure 6.7 Bladder 1 Pressure - 10in Drop Height ........................................................ 62Figure 6.8 Bladder 2 Pressure - 10inDrop Height .......................................................... 62Figure 6.9 Bladder 3 Pressure - 10in Drop Height ......................................................... 63Figure 6.10 Bladder 4 Pressure - 10in Drop Height ......................................................... 63

xi
Figure 6.11 Bladder 1 Pressure - 20in Drop Height ......................................................... 64Figure 6.12 Bladder 2 Pressure - 20in Drop Height ......................................................... 64Figure 6.13 Bladder 3 Pressure - 20in Drop Height ......................................................... 65Figure 6.14 Bladder 4 Pressure - 20in Drop Height ......................................................... 65Figure 6.15 Bladder 1 Pressure - 30in Drop Height ......................................................... 66Figure 6.16 Bladder 2 Pressure - 30in Drop Height ......................................................... 66Figure 6.17 Bladder 3 Pressure - 30in Drop Height ......................................................... 67Figure 6.18 Bladder 4 Pressure - 30in Drop Height ......................................................... 67Figure 7.1 ARL Input Shock Profiles from All Drop Heights........................................ 68Figure 7.2 Baseline/Dummy Table Input Accelerations – All Drop Heights................. 70Figure 7.3 Baseline/Dummy Pelvic Accelerations – All Drop Heights ......................... 70Figure 7.4 Seat Pad Accelerations of all Bladders – 30in Drop Height ......................... 71Figure 7.5 Seat Pad Accelerations of all Bladders – 30in Drop Height ......................... 71Figure 7.6 Bladder 1 Seat-pad Accelerations – All Drop Heights.................................. 72Figure 7.7 Bladder 1 Pelvic Accelerations – All Drop Heights...................................... 72Figure 7.8 Bladder 2 Seat-pad Accelerations – All Drop Heights.................................. 73Figure 7.9 Bladder 2 Pelvic Accelerations – All Drop Heights...................................... 73Figure 7.10 Bladder 3 Seat-pad Accelerations – All Drop Heights.................................. 74Figure 7.11 Bladder 3 Pelvic Accelerations – All Drop Heights...................................... 74Figure 7.12 Bladder 4 Seat-pad Accelerations – All Drop Heights.................................. 75Figure 7.13 Bladder 4 Pelvic Accelerations – All Drop Heights...................................... 75Figure 7.14 Baseline/Dummy Spine Loads – All Drop Heights ...................................... 76Figure 7.15 Spine Loads all Bladders– 10in Drop Height................................................ 77Figure 7.16 Spine Loads all Bladders– 20in Drop Height................................................ 77Figure 7.17 Spine Loads all Bladders– 30in Drop Height................................................ 78Figure 7.18 Bladder 1 Spine Loads – All Drop Heights................................................... 78Figure 7.19 Bladder 2 Spine Loads – All Drop Heights................................................... 79Figure 7.20 Bladder 3 Spine Loads – All Drop Heights................................................... 79Figure 7.21 Bladder 4 Spine Loads – All Drop Heights................................................... 80Figure 7.22 Baseline/Dummy DRIs – 25in Drop Height ................................................. 81Figure 7.23 Bladder 1 DRI – 30in Drop Height ............................................................... 81Figure 7.24 Bladder 2 DRI – 30in Drop Height ............................................................... 82Figure 7.25 Bladder 3 DRI – 30in Drop Height ............................................................... 82Figure 7.26 Bladder 4 DRI – 30in Drop Height ............................................................... 83Figure 7.27 Seat-pad DRIs All Bladders – 10in Drop Height .......................................... 84Figure 7.28 Seat-pad DRIs All Bladders – 20in Drop Height .......................................... 84Figure 7.29 Seat-pad DRIs All Bladders – 30in Drop Height .......................................... 85Figure 7.30 Pelvic DRIs All Bladders – 10in Drop Height .............................................. 85Figure 7.31 Pelvic DRIs All Bladders – 20in Drop Height .............................................. 86Figure 7.32 Pelvic DRIs All Bladders – 30in Drop Height .............................................. 86Figure 8.1 UNLV Input Shock Profiles from All Drop Heights..................................... 87Figure 8.2 Typical Raw and Filtered Plate Acceleration - 30in Drop Height ................ 89Figure 8.3 Raw and Filtered Plate Acceleration from - 30in Drop Height..................... 90Figure 8.4 Seat Pad Accelerations - 10in Drop Height................................................... 91Figure 8.5 Seat Pad Accelerations - 20in Drop Height................................................... 91Figure 8.6 Seat Pad Accelerations - 30in Drop Height................................................... 92

xii
Figure 8.7 Baseline Seat Pad Response - 30in Drop Height........................................... 92Figure 8.8 Bladder 1 Seat Pad Response - 30in Drop Height......................................... 93Figure 8.9 Bladder 2 Seat Pad Response - 30in Drop Height......................................... 93Figure 8.10 Bladder 3 Seat Pad Response - 30in Drop Height......................................... 94Figure 8.11 Bladder 4 Seat Pad Response - 30in Drop Height......................................... 94Figure 8.12 Baseline DRI - 30in Drop Height.................................................................. 95Figure 8.13 Bladder 1 DRI - 30in Drop Height ................................................................ 96Figure 8.14 Bladder 2 DRI - 30in Drop Height ................................................................ 96Figure 8.15 Bladder 3 DRI - 30in Drop Height ................................................................ 97Figure 8.16 Bladder 4 DRI - 30in Drop Height ................................................................ 97Figure 8.17 Plate DRI for all Bladders - 30in Drop Height.............................................. 98Figure 8.18 Seat DRI for all Bladders - 30in Drop Height ............................................... 98Figure 9.1 Review of Bladder 2 Acceleration – 30in Drop Height .............................. 111Figure 9.2 Bladder 2 Platform Acceleration – 30in Drop Height................................. 112Figure 9.3 Bladder 2 Platform Velocity – 30in Drop Height ....................................... 112Figure 9.4 Bladder 2 Platform Displacement – 30in Drop Height ............................... 112Figure 9.5 Bladder 1 Pelvic Acceleration versus Plate Acceleration – All Data.......... 127Figure 9.6 Bladder 1 DRI versus Plate Acceleration – All Data .................................. 127Figure 9.7 Bladder 1 Spine Load versus Plate Acceleration – All Data....................... 127Figure 9.8 Bladder 2 Pelvic Acceleration versus Plate Acceleration – All Data.......... 128Figure 9.9 Bladder 2 DRI versus Plate Acceleration – All Data .................................. 128Figure 9.10 Bladder 2 Spine Load versus Plate Acceleration – All Data....................... 128Figure 9.11 Bladder 3 Pelvic Acceleration versus Plate Acceleration – All Data.......... 129Figure 9.12 Bladder 3 DRI versus Plate Acceleration – All Data .................................. 129Figure 9.13 Bladder 3 Spine Load versus Plate Acceleration – All Data....................... 129Figure 9.14 Bladder 4 Pelvic Acceleration versus Plate Acceleration – All Data.......... 130Figure 9.15 Bladder 4 DRI versus Plate Acceleration – All Data .................................. 130Figure 9.16 Bladder 4 Spine Load versus Plate Acceleration – All Data....................... 130Figure 9.17 Comparing Baseline and Bladder 4 Spine Load – 25in Drop Height ......... 132Figure 9.18 Comparing Baseline and Bladder 4 Pelvic
Acceleration – 25in Drop Height ................................................................ 133Figure 9.19 Comparing Baseline and Bladder 4 DRI – 25in Drop Height..................... 134

1
CHAPTER 1
INTRODUCTION
1.1 The Problem
Landmines and improvised explosive devices (IED’s) are a major threat to the
occupants of military vehicles. The variety of these threats has grown significantly during
military operations in Iraq and Afganistan. Landmine and IED blasts can completely
destroy a vehicle, killing all its occupants. They can also disable a vehicle, leaving its
occupants severely injured. Injuries sustained during a landmine or IED blast come from
fragmentation that enters the vehicle through a hull breach, hot gases expanding through
the vehicle, or severe shock acceleration in the vehicle structure that is created from the
extreme pressure of the blast [1]. Mitigating the high shock acceleration experienced by
vehicle occupants during survivable mine blasts is the primary focus of the research
addressed in this thesis
Armoring and blast deflection techniques applied to military vehicles have been
effective in improving the survivability of vehicle occupants when exposed to blasts from
landmines and IED’s [2]. However, severe shock from these blasts can still be
transmitted through a vehicle’s structure. This shock can cause severe leg, spine, neck
and head injuries. These injuries can sometimes be fatal. While musculoskeletal injuries
are more common, severe soft tissue injuries, which include rupture of the bladder, spleen
and aortal artery, can also occur.
Even though the primary focus of this thesis is associated with the mitigation of
injuries associated with landmines and IEDs, injuries to vehicle occupants can also occur
as a result of continued exposure to repeated low-level shocks associated with the travel

2
of military vehicles over rough terrains. ISO Standards 2631, Parts 1 and 5 give guidance
with regard to allowable vehicle occupant vibration exposure amplitudes associated with
this type of vibration and shock exposure [3,4]. They provide methodology for analyzing
such events with frequency weighting designed to account for the human response in
each of the frequency bands.
1.2 Characterization of the Mine Blast Threat
The threat that mine blasts pose to vehicles is not extensive since the blasts can vary
widely in their overall magnitude, pulse shape, and pulse duration. The actual shock
transmitted to the occupant cabin is a function of many factors [5], which include charge
type, amount of explosive used, relative location of the mine or IED to the vehicle, and
the vehicle structural properties. While the primary direction of a blast can vary, the
vertical direction is considered to be the cause of the most critical injuries and is typically
the orientation in which a variety of injury criteria are defined. The U.S. Army Research
Laboratory characterized landmine blasts transmission through the vehicle’s floor
structure as acceleration pulses ranging from 2,000 to over 4,000 m/s2 in magnitude. The
pulse shapes are roughly triangular or half-sine with sustained durations between 5 to 10
ms.
1.3 Vehicle Seat Systems
Mine blast shock energy travels through a vehicle structure to the base or support of
the vehicle seat system. The seat system must be designed to attenuate the acceleration
and force transmitted to the body of the seated occupant, from the mine blast shock, at an

3
amplitude where bodily injury will not result. Seat structures can be attached to the floor,
side walls or top of a vehicle crew compartment. Also the mounting of the seat system
relative to the vehicle’s frame can have a significant effect on the form and effect of the
shock.
A common seat system used to attenuate mine blast shock energy employs a force
limiting structure. The seat structure attenuates mine blast energy directed into its base or
support by applying a nearly constant resisting force that acts over a specified distance,
referred to as the seat stroke length. These seat structures are referred to as energy
absorbing (EA) structures. The seat’s limiting force is selected to be a constant value that,
when applied to the body of the seat occupant, is less likely to result in a spinal injury.
This value is normally less than 1,500 lbf (6,672 N) [6,7]. The limiting force in an EA
seat system can be applied in several ways. These include, but are not limited to,
deformable seat support brackets, collapsible seat frames, crushable-honeycomb panels,
crushable tubing, and frictional-based systems relying on cables or rods in tension [8,9].
There are two disadvantages associated with EA seat structures. The attenuation of
high mine blast energy amplitudes may require longer seat stroke lengths than can be
accommodated in a compact vehicle crew compartment. The second is the inability for
the majority of EA systems, particularly those that undergo permanent deformation, to
deal with multiple or repetitive blasts. There are normally two shock components
associated with a mine blast event. The first is the initial shock from the mine blast.
When the mine blast is of significant amplitude and the vehicle is light weight, the blast
energy will lift the vehicle off the ground. Therefore, a second shock results when the
vehicle impacts the ground at “slam down”. If the mine blast shock energy attenuation

4
obtained through the deformation or collapse of the EA structure is “used up,” the vehicle
occupant will experience the full shock amplitude associated with the vehicle slam down.
This shock can also result in serious spinal or other related injuries to the seat occupant.
Semi-active and active shock and vibration control system have been considered as a
possible means of attenuating mine blast shock energy directed into vehicle seat systems.
However, mine blast event occur sufficiently fast that the event is over before current day
control systems have a chance to respond.
Seat cushions are part of most vehicle seat systems. The effects of typical seat
cushions on the attenuation of mine blast shock are described by E. Wolf [9]. He
observed that seat ejection systems used in aircraft systems with purely foam-filled
cushions performed poorer than when no foam-cushion was used at all [10]. The foam
cushions used in these tests were typically high density foams necessary to support the
weight of the occupant. In some cases these foam cushions even caused acceleration
amplification.
1.4 Air Bladder Seat Cushion Concept
A prototype vehicle air bladder seat cushion has been developed as part of a co-
operative research agreement between the University of Nevada, Las Vegas and the U.S.
Army Research Laboratory. A description of this seat air bladder will be given in Chapter
3. Drop tower tests were conducted at the U.S. Army Research Laboratory, using a
THOR III 50 percentile anthropomorphic test dummy (ATD), to document the
effectiveness of the seat air bladder in attenuating high-intensity shock. While the results
of the of the drop tower tests provided good information on the air bladder in attenuating

5
high-intensity shock, they did not provide information that was necessary to clearly
identify the physical characteristics of the bladder that contributed to and defined its
shock-reducing characteristics. E. Wolf used the results of the drop tower tests to validate
a 5-degree-of-freedom, lump-parameter vibration model that he developed as part of his
doctoral research and that can be used to predict the shock response of an individual
when he is sitting on the seat air bladder and is exposed to a mine blast shock event.
Properties of the air bladder seat cushion including some potential advantages over
common energy-absorbing seat systems include but are not limited to:
o The air bladder seat cushion sustains no permanent deformation under
most conditions, and therefore will protect against multiple repeated shocks.
o Air bladder seat cushions, have low initial stiffness and high final stiffness
under compression, causing acceleration inputs to be gradually decreased.
o Increases in stroke length by additional air bladder seat cushion thickness
can increase acceleration reduction.
o The air bladder seat cushion proposed has an interconnected bottom and
back sections, providing simultaneous protection in multiple axes.
o The air bladder seat cushion response is inherently rate dependant on the
input acceleration due to internal damping caused by the flow of air from one
compartment to another.
o The air bladder seat cushion provides superior support with rough-
ride/vibration situations over traditional foam cushions and even stiffer EA
devices focused more on shock alone.

6
1.5 Overview of Work
The primary objective of the research reported in this thesis was to focus on the
experimental characterization of the seat air bladder for mine blasts and continuous
vibration. This information is essential for the design of future shock and vibration
isolated seat systems that can have a wide variety of applications.
The work previously conducted on the topic of the air-bladder seat concept would be
incomplete without a proper and robust testing phase. This phase is necessary for
immediate implementation of specific bladder configuration in the field, as well as for
future improvement and validations of numerical models.
The body of this work will discuss the most recent design phase, which initiates a
more elaborate design process by creating a series of four-bladder systems that can be
used in a product optimization design of experiment (DOE) in the future. The
configurations were constructed using three-parameters at two levels, resulting in four
prototypes, which will be described in Chapter 3.
The thorough testing of the bladder-system was conducted through shock, continuous
random vibrations including real military ride acceleration data, as well as
characterization of the dynamic pressure in the system, which until now had not been
conducted.
1.6 Project Objectives
1. Develop air bladder seat cushion technology that is effective in reducing the
potential for serious or fatal injuries to military vehicle occupants who are exposed to
extreme shocks from mine blasts and improvised explosive devices. Also extend the

7
technology to also be suitable for reducing the transmitted lower-level continuous
vibration which has serious injury potential over normal ride durations.
2. Develop an understanding of how the different system components associated
with air bladder seat cushions interact with each other in reducing whole body
exposure to shock and vibration through a robust and elaborate testing phase
consisting of shock, vibration, and dynamic pressure measurements.
3. Quantify through measurements the effectiveness of air bladder seat cushions in
reducing the energy associated with shock inputs to seated individuals that is
transferred to the pelvis and spine, through the use of a seated THOR III
antropodynamic dummy by analyzing: pelvic accelerations, spinal loads, and
dynamic response indexes (DRI).
4. Based on the measurements and analyses, make suggestions of air bladder seat
cushion configurations that could be used in production seat cushions or suggestions,
from the available cushions, for immediate field implementation based on a shock or
vibration environment.
5. Create a body of work through measurement information with respect to
reductions of input shock acceleration and continuous vibration to accurately upgrade
or redevelop analytical models used to predict both sir bladder seat cushion
performance and seated biomedical human responses to both shock and vibration.

8
CHAPTER 2
INJURY ASSESSMENT
This chapter will discuss injury assessment criteria including the international and
NATO standards on the human exposure to shock and vibration, and the measurement
and evaluation requirements for shock, impulsive vibration, and continuous vibration
criteria focused on in this work are Peak-Instantaneous Acceleration, Dynamic Response
Index, Spinal Loading, Vibration Dosage Method, and Frequency Weighted Response to
Whole Body Vibration. The experimental protocols, test methodology, and measurement
procedures will be discussed separately in Chapter 4.
2.1 Injury Criteria and Assessment
A major area of emphasis in the study of biomedical or biomechanical engineering is
the quantification and classification of potential injury to the various systems of the body.
Although modes of injury and failure of both musculoskeletal and organ systems have
been tested by various researchers. Musculoskeletal systems are of particular interest
because of their catastrophic nature of their failures. Moreover the most likely initial
cause of damage to the occupants is to their musculoskeletal systems in the form of major
localized trauma and bone fracture. Those injuries can be fatal or cause permanent
damage resulting in the loss of limbs, paralysis, or even simply incapacitation. While not
immediately obvious, incapacitation can be just as hazardous in a combat situation
eliminating the soldier’s ability to defend themselves, leading to capture or death.
Damage to the major organ systems are also relevant as NATO [11] has also
addressed injury criteria to the thorax and acknowledged the potential of death due to

9
aortic complications or traumatic brain injury (TBI), even without the presence of major
skeletal damage. This study will primarily focus on the aforementioned skeletal threat.
Although it should be noted, that given the massive amount of data collected during this
study, this information can lend itself to future analyses of a variety of injury-metrics and
injury-scales.
The complexity of injury biomechanics, as well as the large degree of variability
between individuals makes quantification of a system’s injury reduction potential
difficult. There is still not a single widely accepted metric by which to judge injury.
However for the available metrics currently used in the field, the majority maintain a
“threshold limit,” a defined cutoff number which defines the maximum allowable
exposure. These threshold limits vary between injury metrics.
2.2 Abbreviated Injury Scale
The Abbreviated Injury Scale (AIS) is a common scale that can be found referred to
by several other metrics when describing the severity of an potential injury inducing
event, when a certain threshold limit is reached. It is useful to describe the injury
potential below the threshold value. Risk curves are usually generated using medical data,
particularly ex vivo test information. The vertical motion direction, particularly spinal
damage is the primary focus of most mine blast studies [12]. Figure 2.1 gives examples
of typical risk curves that can be applied to spinal injury in the AIS. Each corresponding
curve corresponds to a specific coding of injury severity, given in Table 2.1. Many injury
metrics choose to refer back to the AIS scale when describing injury potential.

10
Figure 2.1 Typical Injury Risk Curves
AIS Code Injury Description1 Minor2 Moderate3 Serious4 Severe5 Critical6 Maximum (currently treatable)9 Unknown
Table 2.1 Abbreviated Injury Scale Codes
2.3 Evaluation of Human Exposure to Whole Body Vibration
The scope of the ISO Standard 2631 [3,4] encompasses the evaluation of whole body
exposure and response to mechanical vibration and shock. ISO 2631-1 specifically deals
with the “measurement of periodic, random and transient whole-body vibration.” While
this does not directly relate to mine-blasts in particular, it does allow for the additional
classification of a particular seat-system, specifically air-bladder configuration’s response
to a random vibration input. In addition the standard provides a weighting system for the
frequency range of 0.1-80Hz. Specifying 0.1-0.5Hz for motion sickness and 0.5-80Hz for
health, comfort, and perception. Since only the effects of health are considered, the

11
accelerometers used were all of the piezoelectric nature and thus their loss of accuracy
below 1Hz is not an issue.. Whole body-vibration assumes a dose-effect which takes into
account not only the overall magnitude of the vibration, but also the time period of
exposure.
With respect to vibration exposure to health relevant literature indicates that there are
effects to the long-term health of the individual, more specifically risk to the lumbar
spine and the connected nervous system when exposed to long-term high-intensity
vibration. This particular similarity, the concern and evaluation of the lumbar spine, with
mine and shock blasts makes this vibration study on health is interesting. The health risks
are due to the excessive mechanical stress and/or disturbances of nutrition distribution to
the disc tissue. This may contribute to the degenerative processes in the lumbar segments
including spondylosis deformans, osteochondrosis intervertebralis, and arthrosis
deformans. Moreover whole-body vibration exposure may also worsen certain
endogenous pathologic disturbances of the spine.
2.4 Health Risks
The EU Physical Agents Directive on Vibration or PAD(V) [13] sets the following
limiting values for exposure to vibration in the workplace. However it is reasonable to
use a similar approach cannot be applied as a simple means of characterizing how much
exposure a given type of combat ride scenario transmits to its occupants.
12
Daily Exposure LimitDaily Exposure Action
Value
A(8) [m/s2] VDV [m/s1.75 ] A(8) [m/s2] VDV [m/s1.75]
Hand-arm vibration 5 91 1.15 21
Whole-body vibration 2.5 45.5 0.5 9.1
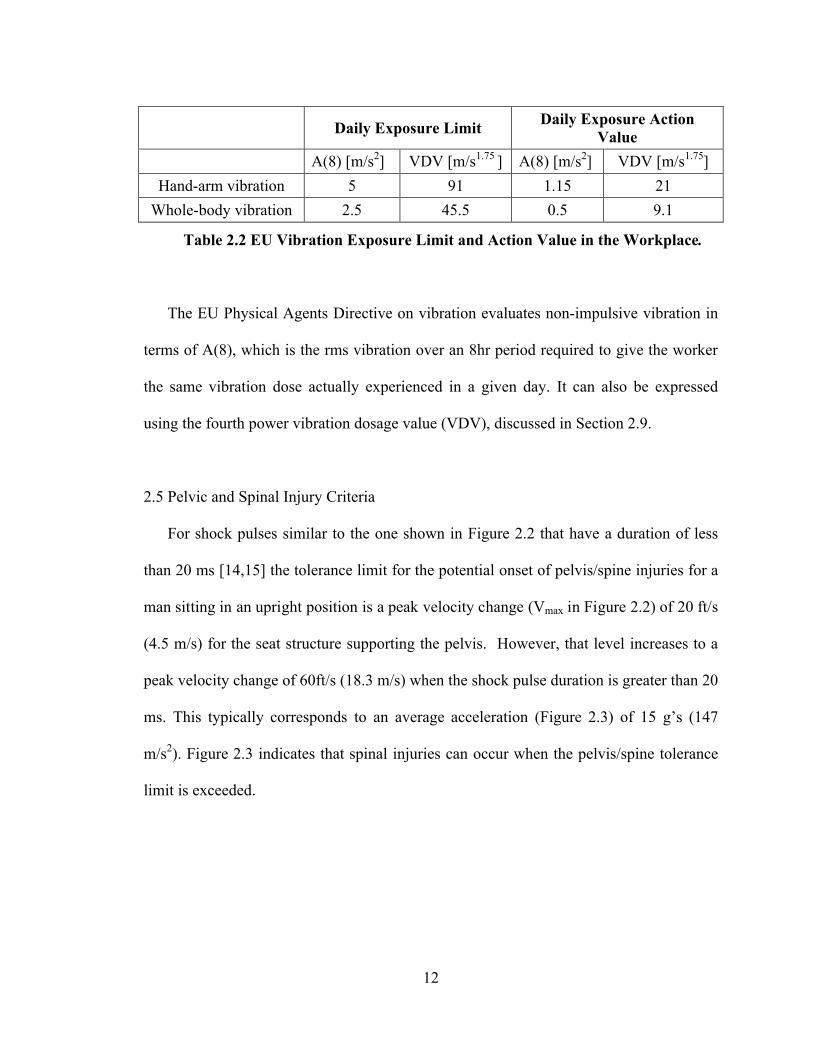
Table 2.2 EU Vibration Exposure Limit and Action Value in the Workplace.
The EU Physical Agents Directive on vibration evaluates non-impulsive vibration in
terms of A(8), which is the rms vibration over an 8hr period required to give the worker
the same vibration dose actually experienced in a given day. It can also be expressed
using the fourth power vibration dosage value (VDV), discussed in Section 2.9.
2.5 Pelvic and Spinal Injury Criteria
For shock pulses similar to the one shown in Figure 2.2 that have a duration of less
than 20 ms [14,15] the tolerance limit for the potential onset of pelvis/spine injuries for a
man sitting in an upright position is a peak velocity change (Vmax in Figure 2.2) of 20 ft/s
(4.5 m/s) for the seat structure supporting the pelvis. However, that level increases to a
peak velocity change of 60ft/s (18.3 m/s) when the shock pulse duration is greater than 20
ms. This typically corresponds to an average acceleration (Figure 2.3) of 15 g’s (147
m/s2). Figure 2.3 indicates that spinal injuries can occur when the pelvis/spine tolerance
limit is exceeded.

13
Figure 2.2 Shock Motion Terminology
The Dynamic Response Index (DRI) was developed to predict the probability of
thoracolumbar-spine fracture, using a one-dimensional displacement model, during an
flight ejection event [14,15,16].
Federal Aviation Regulation 29 sets the maximum allowable lumbar spine load to be
1,500 lb (6,672 N) measured between the pelvis and lumbar spine to be considered safe
[17]. Table 2.3 lists the lumbar spine tolerance levels recommended by the US Army.

14
Figure 2.3 Shock Input Tolerance Levels for a Seated Man [14]
Figure 2.4 Spinal Injury Rate as a Function of DRI for Aircraft Seat Ejection Events [17]

15
Vehicle Occupant Size (Percentile) Lumbar Load Tolerance (lbf)5th Female 1,28150th Female 1,61050th Male 2,06595th Male 2,534
Table 2.3 Lumbar Spine Tolerance Levels Recommended by the U.S. Army
For whole body injuries related to exposure to whole body shock events the Eiband
criterion is used to predict the potential risk [15,16,17]. Vertical peak acceleration for
short-term shock inputs to the pelvis should not exceed 15 g’s [Figure 2.5].
Figure 2.5 Duration and Magnitude of Vertical Acceleration (Eiband) [18]
When considering a soldier’s ability to continue on with their duties, and not
necessarily immediate death, another report prepared by the US Army [18] suggests that

16
complete incapacitation at levels where longitudinal pelvic acceleration exceeding 40 g’s
(392 m/s2) for more than 7 ms or vertical pelvic accelerations exceeding 23 g’s (225
m/s2) for more than 7 ms. Also levels that would render a soldier unable to complete
military tasks occurs with lumber spine bending moments in excess of 10,932 in.-lbf
(1235 N-m) in forward flexion, 3,276 in-lbf (370 N-m) in rearward extension, and 5,976
in-lbf (675 N-m) in lateral bending, regardless of their duration period.
As previously mentioned, such an event can be considered nearly as severe as a fatal
accident because it can expose the soldier to capture, or even the death of the fellow crew
members whom rely on effective performance of said tasks for survival.
2.6 Mine Blast Injury Criteria
In addition to the usage of DRI for evaluation of a mine blast event, Table 2.4
summarizes landmine injury criteria proposed by Axelsson [15]. Table 2.5 summarizes
landmine injury criteria proposed by Alem et. al. [19]. Figure 2.6 summarizes the
recommended injury criteria for vehicles exposed to landmines that is presented in the
U.S. Army’s Occupant Crash Protection Handbook for Tactical Ground Vehicles [17].
Body Part Type of Load Tolerance Value
Brain 1,000
Neck Compression 250-900 lbf
Neck Tension 250-750 lbf
Neck For-Aft Shear 250-700 lbf
Chest Serious Thoratic Injury 60 g'sLumbar Spine Vertical Direction 1,500-1,800 lbf
Seat Design Limit Vertical Direction < 14.5 g's
Table 2.4 Landmine Injury Criteria Proposed by Axelsson.

17
Foot/Ankle Shock AccelerationAverage Acceleration < 10 g’s or
Maximum Velocity Change < 3 m/sAverage Acceleration < 15 g’s or
Maximum Velocity Change < 4.5 m/sPelvis/Spine Shock AccelerationDRI < 16
Table 2.5 Landmine Injury Criteria Proposed by Alem et. al.
2.7 NATO Testing and Evaluation Injury Criteria
The North Atlantic Treaty Organization published a report in April 2007 [11]
summarizes injury criteria for the purpose of the experimental testing and design of
vehicle occupant protection systems. Vehicle and occupant interaction was studied
taking into consideration human biomechanics, vehicle structural behavior during blast
occurrences, and experimental measurements. It is this report that recommends the usage
of the Dynamic Response Index (DRI) for shocks and mine-blast occurrences. They even
suggest that the DRI be the sole evaluation standard for protection against thoraco-lumbar
spine injury. The decision to do so was because only the DRI model accounts for the
duration of the pelvic-acceleration and has been validated with medical data. The NATO
committee recommends using an anthropomorphic test device (ATD) and calculating the
resulting DRI with only the vertical z-axis acceleration from the pelvis, measurement
variability is at a minimum in this location. With this technique a threshold level of 17.7
DRI will correspond to a 10% risk (AIS 2+) spinal vertebrae injuries. The committee
also adds that this is only valid for spine inclinations of less then or equal to 5 degrees.

18
Figure 2.6 Recommended Injury Criteria for Landmine Testing by the U.S. Army [18], 2000

19
2.8 ISO Weighting of 1/3-Octave Band Data for Continuous and Impulsive Vibration
As in the consideration of shock information, although there is some belief that the
horizontal seated axes (x and y axes) could possibly provide some useful information,
only the vertical axis and the concern for the lumbar spine will be analyzed. ISO 2631,
referenced in section 2.3 Evaluation of Human Exposure to Whole Body Vibration
provides a weighting scale shown here. The weighting factors applied in the vertical
direction to a seated-subject (Wk) represented for the relevant 1/3-octave band. For the
purposes of this study, the frequency range is extended to 100Hz:
Hz Wk Hz Wk
1 0.482 12.5 0.902
1.25 0.484 16 0.768
1.6 0.494 20 0.636
2 0.531 25 0.513
2.5 0.631 31.5 0.405
3.15 0.804 40 0.314
4 0.967 50 0.246
5 1.039 63 0.186
6.3 1.054 80 0.132
8 1.036 100 0.0887
10 0.988
Table 2.6 Third-Octave Band Weighting Factors for the Vertical Direction for Whole Body Vibration
2.8.1 Whole-Body Weighted Acceleration
The weighted r.m.s acceleration is expressed in m/s2 for translational vibration and
radians/s2 for rotational vibration. Where T is the measurement duration is seconds, the
weighted r.m.s acceleration should be calculated by:

20
1T 2
2w w
0
1a a (t) dt
T
Equation 2.1
Or the frequency domain equivalent where i represent the frequency band number, in
this case, more specifically the 1/3 octave-band frequencies:
1
N 22
w i ii 1
a W a
Equation 2.2
where:
aw is the frequency weighted acceleration as a function of time (m/s2 or rad/s2).
Wi is the weighting factor for the i-th one-third octave band given in
Table 2.6.
ai is the r.m.s acceleration for the i-th one-third octave band.
If it is determined that there is more than one significant acceleration direction, than the
overall weighted acceleration can be calculated by:
12 2 2 2 2 2 2
v x wx y wy z wza k a k a k a Equation 2.3
Where:
awi refers to the r.m.s weighted acceleration in each basicentric axis
ki are the multiplying factors in each major axis dependent on the body configuration.
Weighting Multiplication Factors
kx ky kz
k=1.4 k=1.4 k=1
Table 2.7 Multiplying Factors for Health in the Seated Position

21
2.9 Impulsive Vibration and the Vibration Dosage Value (VDV)
There has been some discussion to the benefit of using a “dosage method” as opposed
to a purely running r.m.s acceleration method. The vibration dose value (VDV) is more
sensitive to peaks than the basic evaluation method. The fourth-power vibration dose
method (VDV) is in 1.75
m
s or
1.75
rad
s and is defined as:
1T 4
4w
0
VDV a (t) dt
Equation 2.4
However, since vibration measurements are typically conducted in the frequency
domain, it is often more useful to consider a method of evaluating the VDV without the
necessity of measuring and weighting the complete time history of an event. The
estimated vibration dosage value (eVDV) has been used in some studies and shows good
agreement when the crest factor, the ration of the frequency weighted maximum peak to
its r.ms. value, is less than 6.
1
4weVDV 1.4a T Equation 2.5
Where T is again the duration in seconds.
2.10 Dynamic Response Index (DRI) Measurement
The DRI uses a simple mass-spring-damper system (Figure 2.7) with base excitation
to predict the response of an aircrew member subjected to abrupt vertical acceleration
during seat ejection. The equation of motion is given by [DRI EQUATION]:

22
22
n n2
d (t) d (t)2 (t) z(t)
dt dt
Equation 2.6
where
(t) = defection of the seat system (in, m)
= damping ratio (dimensionless)
n = resonance frequency (rad/s)
( )z t = acceleration of seat supporting the pelvis (in/s2, m/s2).
Figure 2.7 DRI Mass-Spring-Damper System
A Equation 2.6, the DRI is representative of the maximum dynamic compression of
the vertebral column. The DRI model assesses the response of the human body to
transient acceleration-time profiles. The equation for computing the DRI is:
2 ( )n MAXtDRI
g
Equation 2.7
where:
max = maximum defection of the seat system (in, m).
23
The solution to the DRI Equation 2.6-2.7 is solved by using a known input
acceleration signal in the vertical direction of the pelvis, ( )z t for the case where n equals
52.9 rad/s (8.4 Hz), equals 0.224 [12], and g is the acceleration of gravity (386 in./s2,
9.8 m/s2. The maximum displacement max (in, m), is used in Equation 2.7 to determine
the DRI value. This pelvis acceleration signal is difficult to obtain unless the researcher
has access to an anthropomorphic dummy. Figure 2.4 shows a plot of the spinal injury
rate percentage as a function of DRI [14,17]. An injury limit of a DRI of 17.7 was used as
a metric during testing at the Army Research Lab as well.

24
CHAPTER 3
AIR BLADDER SEAT CUSHION DEVELOPMENT
Extensive testing at the University of Nevada, Las Vegas, Center for Mechanical and
Environmental Technology laboratory has been performed to determine the physical
parameters of the air pneumatic seat cushion and its response to a variety of shock and
vibration situations. In addition to the more elaborate shock and vibration testing, the seat
cushion development was accomplished in part by creating four prototype cushions, each
with varying parameters designed to fulfill a fractional design matrix for a future design
of experiment (DOE) setup, not conducted in the main body of this work. This was done
with three parameters at two levels each, creating a fully orthogonal Taguchi Test matrix.
A summary of this development is given in this chapter.
3.1 Air Bladder Seat Cushion Description
The air bladder seat cushion was constructed by using a low-density, open-cell foam
which has been bonded only by its top and bottom surfaces in an impermeable outer
covering (Figure 3.1), and allowed to inflate itself to atmospheric pressure, at which time
the air vents are closed and the system becomes completely enclosed. The system itself
consist of two major components, the seat bottom and the seat back, which are joined by
a series of tubes acting as vents to allow the passage of air from the seat bottom to the
back as the seat is compressed during any number of vibration or shock events. To
facilitate the flow of the air between the two components, the foam has had channels
cored through it using a proprietary process, the pattern of which is also proprietary.

25
Figure 3.1 Drawing of Pneumatic Seat-Bladder System with Connected Seat-Bottom and Seat-Back
3.2 Prototype Configurations for future Design of Experiment (DOE)
A total of four seat configurations are being tested in hopes of leading towards a more
ideal configuration for latter phases of the design project. Three parameters are varied at
two levels in order to perform a fully orthogonal Taguchi-test matrix. The parameters are
Foam Density, Foam Hole Diameter, orifice-tube inner-diameter. The prototypes were
redesigned to accommodate simultaneous dynamic pressure testing of both the seat
bottom and seat back of the pneumatic air-cushion.
Bladder Configuration ParametersBladder Number
Foam Density Foam Hole Diameter
Internal Tube Diameter
1 1 lb/ft3 0.5 in 0.375 in2 1 lb/ft3 1 in 0.25 in3 2 lb/ft3 0.5 in 0.25 in4 2 lb/ft3 1 in 0.375 in
Table 3.1 Parameter Configurations of Seat Prototypes

26
3.3 Previous Modeling
The previous work developed an intricate numerical model of the body, cushion, and
load-limiter interactions. However, a significant portion of the modeling revolved and
depended upon the ability to predict the effect of internal pressure, and its effects on
stiffness and damping, and thus the transmissibility to the seated occupant. The response
of the air was determined using an isentropic compression equation.
A finite differencing, marching solution was chosen to solve the equations in terms of
the known input acceleration of the floor. Velocity and displacement were calculated by:
tiziziz )1()()1( 000 Equation 3.1
tiziziz )1()()1( 000 Equation 3.2
where:
Δt = the numerical solution time step (s).
The numerical model to determine the performance of seat system components, a
multi-dimensional model was written in MATLAB. The model was a five-degree-of-
freedom mass-spring-damper (MCK) representation of the seat system’s components and
a human occupant. Figure 3.2 and Figure 3.3 shows the schematic of Wolf’s model and
its free-body diagram respectively.

27
Figure 3.2 Numerical Model Schematic
The MCK parameters for the human body that were used were developed by Cheng
[8]. That work developed the human model for use in modeling helicopter seat cushions.
Cheng’s two-mass model is a semi-definite system with a resonance frequency (52.9
rad/sec) and damping ratio (0.224) equal to that of the DRI model, and found in the
NATO standard.

28
Figure 3.3 Free Body Diagram
Component Mass K (N/m) C (Ns/m)Legs 12Pelvis 8.18 8065.2 513.7 Upper Torso 34.52 96600 818.8 Resonant Frequency 52.0 rad/sDamping Ratio 0.224
Table 3.2 Human Body Model Parameters [12]

29
3.4 Pressure Consideration
While this model worked reasonably well, it is believed that the model
underestimated the dynamic magnitude of the pressure. This is one issue that is addressed
in this study as the dynamic pressure in both the seat-bottom and seat-back are now
measured.
The numerical portion of the model representing the pressure response to
compression, as previously mentioned, is that of isentropic compression.
1
2
1
2
atm
:
ratio of specific heats ( )
V the total volume of the seat cushion m
V =the reduced vloume of the cushion during compression (m)
P atmospheric pressure 101325 Pa
cush atm atm
CpCv
VP P P
V
where
Equation 3.3
The model assumed that the volume of the seat back expands linearly while the seat-
bottom is compressed until it the back is fully inflated or stretched, at which point it
ceases to expand. The resilient material of the cushion covering is responsible for this.
Moreover, during the initial compression of the bottom, the cross-sectional perimeter
does not change, stating that this results in a minimal pressure increase at the beginning
of the cycle. Wolf accounts for this by modifying the isentropic pressure equation to:
atm
γ
cush2
cushleg01
1atmcush P
]}δ)δ[(L{VEFV
VPP Equation 3.4
where:
Pcush = internal cushion pressure (Pa)

30
EF = the expansion factor, a ratio representing the expansion of the seat cushion
back to the compression of the bottom. (0.58)
V1 = the original air cushion volume (m3)
V0 = the original seat cushion bottom volume (m3)
Lleg = the length of the leg contacting the seat cushion (m)
δcush = the z-axis compression of the cushion bottom (m).
3.5 Force- Compression Testing
This portion of the testing was conducted both at the original conception of the
project and during this current characterization phase. All variations of the seat
underwent low speed compressions on a Material Test Systems (MTS) hydraulic tensile
test machine. In order to separate previous work (with Wolf and Ladkany) with current
testing, all of the most recent testing protocols will be located in Chapter 4 while all
pressure testing results will be presented in Chapter 6.
The previous round of testing on the MTS machine was done by placing the seat
cushion bottom oversized aluminum plate on the bottom and a human seat form made
from dense fiberboard. The internal pressure of the cushion at the start of the test was 0
psig. The same procedure was repeated with the bottom of the seat cushion separated
entirely from the back to determine the response of the foam alone. The principle behind
the testing was to validate the numerical model and was done so by assuming that the
foam and the air responses could be calculated using the principle of superposition.
Discussion of the pressure and force-compression measurements will be provided in
Chapter 6 along with the dynamic pressure data collected simultaneously from UNLV
drop tower shock tests.

31
3.6 Dynamic Pressure Consideration
While the Wolf’s numerical model shows strong agreement with the experimental
results at low speeds, and even reasonable agreement with peak responses for both pelvic
accelerations as well as DRI the remainder of the response would benefit from
improvement. More importantly the four prototype configurations previously described
were configured with two ports, one on the seat bottom while the second on the seat back
allowing for simultaneous dynamic pressure measurements. This is of great interest
because it provides a foundation for future work in developing a more accurate and
complete model of coupled air-bladder seat systems. This gives the design potential for
modifications to suit a wider variety of applications and shock and vibration profiles. In
doing so, such systems could be relatively quickly, individually tailored for any
application, whether it be for commercial trucking, landmine occupant protection, or even
medium-scale repetitive shocks.
One of the issues in the previous experimental testing addressed in this study was the
nonlinearity during shock and impulse events. The numerical modeling was fairly
successful in describing the response of the cushion as a whole, and this is in part to the
detailed description of the isentropic pressure within the cushion. Preliminary testing
showed that the dynamic pressure could reach as high as 12psig in the seat bottom when
drop heights were set as high as 50in with a violent non-periodic pulse.
The high internal pressures in the seat cushion during a dynamic compression caused
by shock were not discovered until the testing drop/shock towers at UNLV were
constructed and dynamic pressure measurements were even possible. A more complete
description will be given in Chapter 6 along with a description of the shock profiles

32
causing the dynamic pressure pulses, while a description of the UNLV shock
performance is given in Chapter 8.

33
CHAPTER 4
TEST PROTOCOLS AND EXPERIMENTAL CHARACTERIZATION
As previously mentioned, the primary focus of this project is the experimental
characterization of various configurations of the pneumatic seat cushion. In order to
provide a complete representation of the seat system’s capability and provide information
for future modeling and design iterations the following general experimental test
categories were explored: internal pressure (both quasi-static and dynamic), force-
deflection, vibration transmissibility, and shock response.
During the previous phase of this project one configuration of the cushion was
actually tested at the Army Research Lab in Maryland, and this test was only performed
using a drop tower at their facility. Moreover the drop tower used only a single
configuration of mitigating material to create the shape of shock pulse. This shock pulse
on average, had a pulse width of 5 ms and amplitude dependent on the drop height used
for that specific experiment.
The testing performed at UNLV's own facilities was more extensive and also
included quasi-static and dynamic pressure as well as random vibration testing.
4.1 Army Research Lab Testing
All though the Army tests were both informative and useful; they only represented
one possible configuration for this pneumatic seat cushion. Three separate trips and
testing series were conducted in Maryland all of which were of a shock nature and
consistently produced of 5 ms sine shock pulse. This was done because of the Army's
particular interest in the usage of the Dynamic Response Index (DRI) to characterize
34
damage to the spinal column, where DRI has been validated through aircraft ejection seat
studies, catapult tests, and drop tests [20,21] however a 2007 ARL report by McAndrew
[22] states that using DRI to predict injury sustained from blast loading has not yet been
validated.
The data collected during the drop tests was done using a THOR III 50% male
anthropomorphic dummy weighing 170lbs. This anthropomorphic test device (ATD) is
designed to mimic of the human body and is instrumented in many measurement
locations. Of particular interest to ARL and our testing are the pelvic acceleration as well
as the force measured in the spinal column. In addition to the instrumentation in the
ATD, two accelerometers are in the base of the drop platform, one on each side; the
shock pulse shown is an average of the two signals. Also an SAE seat-pad accelerometer,
the same used in the UNLV drop tests with a nominal sensitivity of 10mV/g, and peak
acceleration of 500g was used.
4.2 UNLV Drop Tower Testing
Two drop towers were designed and constructed in-house over the course of the
grant. One of the drop tower stands at the total height of 12 feet, with a steel platform
weighing in excess of 300 lbs. The first drop tower uses two robust bearing shafts,
located on either side, which controlled the dissent of the seat platform. The second of the
drop towers was much lighter in its overall construction carrying an lighter aluminum
platform which consisted of four bearing shafts one located at each of the corners of the
seat platform. The usage or four bearing shafts, as well as a lighter platform and an
impacting surface of the smaller area, capable of various mitigating materials, were

35
implemented in hopes of creating a less noisy input signal and a more controlled descent
than that of the larger and heavier drop tower.
For instrumentation the same SAE seat-pad accelerometer was used to measure
acceleration at the seat-butt interface, and a 2mV/g dytran shock-accelerometer, capable
of a 2500g peak. The shock accelerometer was mounted into the impact plate. This
accelerometer was chosen because other more typical accelerometers which are designed
with a lower sensitivity and capable of much higher accelerometers have a much higher
noise floor, and a more sensitive accelerometer while also limiting the overall noise of
the measured acceleration, is more appropriate for the testing done at the UNLV
facilities.
Moreover, a 6 x 6" impacting plate on the located the bottom surface of the seat
platform was used in order to place different mitigating materials, typically rubbers of
different durometers, in order to create different shaped and width shock input pulses.
Although many materials were experimented with as the impacting and mitigating
contacts material, eventually a combination of a 1in thick rubber plate on the impact plate
along with a thin gel-elastomer “impact gel” on the striking plate were used. This is in
contrast to ARLs drop tower which uses a large mass for its strinking plate designed to
smooth out the pulse and a “pulse programmer,” which helps shape a drop acceleration
into a variety of desired profiles.

36
4.3 Quasi-Static and Dynamic Pressure Testing.
4.3.1 Force- compression testing
While using the MTS machine, the seat cushion bottom was placed between an
oversized aluminum plate on the bottom and a human seat form made from MDF
fiberboard. The human butt form that was used was created using specifications of the
British Military of a 50% soldier’s seated-impression, and had a surface area of 0.108 m2.
The test was run at the maximum speed of the test machine at 2ips, or 0.0508m/s in
compression. The acquired data was from both the machine’s load cell, and simultaneous
pressure measurement mounted on both fill tubes, from the seat bottom and the seat back.
The internal pressure of the cushion at the start of the test was 0 psig. The cushion was
also tested with both fill tubes completely opened to the atmosphere, so that only the
foam-bladder skin response could be measured. It is assumed that at the low compression
speed that any internal air movement would be negligible and not contribute to the
foam’s response, as it would if the fill tubes and the system were closed.
4.3.2 Dynamic Pressure Testing
While Wolf’s numerical model shows strong agreement with the experimental results
at low speeds, and even reasonable agreement with peak responses for both pelvic
accelerations as well as DRI (See Chapter 3), the remainder of the response would benefit
from improvement, in this case particularly a direct measurement of the dynamic pressure
during a shock scenario.
The four prototype configurations previously described were configured with two
ports, one on the seat bottom while the second on the seat back allowing for simultaneous
dynamic pressure measurements. This is of great interest because it provides a foundation

37
for future work in developing a more accurate and complete model of coupled air-bladder
seat systems. This gives the design potential for modifications to suit a wider variety of
applications and shock and vibration profiles. In doing so, such systems could be
relatively quickly, individually tailored for any application, whether it be for commercial
trucking, landmine occupant protection, or even medium-scale repetitive shocks.
One of the issues in the previous experimental testing addressed in this study was the
nonlinearity during shock and impulse events. The numerical modeling was fairly
successful in describing the response of the cushion as a whole, and this is in part to the
detailed description of the isentropic pressure within the cushion. Preliminary testing
showed that the dynamic pressure could reach as high as 12psig in the seat bottom when
drop heights were set as high as 50in with a violent non-periodic pulse. However, this
was not discovered until the testing drop/shock towers at UNLV were constructed and
dynamic pressure measurements were even possible. All of the pressure measurements
were acquired with Omega pressure transducers with a constant applied voltage of 5V
with a range of 0-15psig.
A complete discussion of the data will be given in Chapter 6 along with an
introduction to the shock profiles associated with it. The complete description of the
shock testing conducted at UNLV, during which the dynamic pressure was measured,
will be provided in Chapter 8.
4.4 Random Vibration Excitation
Although only one shaker system was actually used; due to the programmability of
the shaker controller a variety of vibration input spectra were capable of being tested or

38
recreated. Of particular interest was a signal provided to the project by the British
Military. This signal was of a rough-terrain condition in a Warrior Military Transport
Vehicle at the bare seat-pan. Essentially saying that this acceleration signal was taken at
the soldier’s seated location without any available cushioning. This is of particular
interest because although this signal lacks the easily controllable profile of an artificially
created signal, it gives us an insight into the actual conditions that a soldier may
experience in the field. Moreover it allows us to create other vibration profiles, while
acknowledging them as unrealistic field scenarios, which will be of more appropriate
vibration magnitudes. This is important to realistically characterize such a device so that
no artificial skewing of mitigating performance will take place.
ISO 10819 [23] discusses the methodology for testing anti-vibration gloves in
accordance with other standards governing the health of individuals experiencing hand-
arm vibrations. The standard is mentioned, because unlike ISO 2631, which discusses the
measurement analysis of whole body vibration, potential revisions to ISO 10819 provides
a suggested random vibration profile. That specific vibration profile, in regards to hand-
arm vibration, is a random vibration profile consisting of a constant r.m.s-velocity of 0.01
m/s in each of the third octave center band frequencies between 25 to 1250 Hz.
For whole body vibration, the frequency range of interest is more practically between
1 and 100 Hz. It was decided to adopt the same principle of a constant r.m.s-velocity
random vibration spectrum, to develop a new vibration profile that the cushion system
would be subjected to. The warrior signal has more energy in the lower frequencies, so
this profile would be developed to instead have higher energy levels at the higher
frequencies.

39
One advantage afforded to the project during any and all of the vibration testing is the
usage of a one-dimensional anthropomorphic dummy, which replicates the damping
features of the human body and places the natural frequency of the dummy near that of
the human body near 5 Hz. This 1-D “HVLab” Passive Anthropodynamic Dummy has
been developed by the University of Southhampton [24]. For the vibration-
transmissibility measurements, rather than using the same SAE seat-pad accelerometer
used in the shock testing, a more sensitive SAE seat-pad accelerometer with a nominal
sensitivity of 100mv/g and capable of only peak accelerations of 60gs was used. Again
this choice for an increased sensitivity transducer was made based on the lower
magnitude of the peak accelerations experienced during the two vibration signals.
4.4.1 Physical Setup
The physical seat-frame is clamped to the input-plate of the shaker in order to prevent
any unwanted vertical motion. A pneumatic-seat cushion is placed in a standard seated
configuration. The SAE Seat-pad accelerometer is mounted to the center of the seat
cushion at the approximate location of the center of mass of a seated individual. A
fiberboard butt-form is placed on top of the accelerometer and a 1-D Anthropomorphic
Dummy is secured on top of the butt-form and strapped to the seat back to prevent any
transverse motion of the Dummy.

40
Figure 4.2 Testing and Instrumentation Overview
4.4.2 Warrior Signal Characterization
The warrior signal acquired from the British Military was a 20 second signal which
was converted into a random-vibration signal with controlled frequency components from
1-400Hz. The signal was placed on an infinite loop so that the accelerometer
Figure 4.1 Experimental Setup for Seat Vibration Transmissibility

41
measurements could take place over several cycles to ensure an ergodic signal. The signal
had the following dynamic properties:
Warrior Signal – Shaker Input Characteristicsr.m.s Acceleration 1.866 m/s2
Peak Acceleration 17.727 m/s2
Peak Velocity 15.7653 m/sPeak Displacement 0.1000 m peak-peak
Table 4.1 Warrior Signal Shaker Input Characteristics
These properties were calculated by the shaker and were the global properties of
the signal containing all frequency components. However the actual signal properties
within the 1-100Hz range, measured at the input plate are presented in the Signal
Comparison section.
Figure 4.3 Warrior Signal Time History
4.4.3 Constant R.M.S-Velocity Signal Characterization
This signal was designed so that it has an overall ISO weighted r.ms. acceleration

42
similar to that of the Warrior Signal, while maintaining a constant r.m.s Velocity across
each of the third octave bandwidth frequencies. Knowing that the r.m.s acceleration at a
given frequency, based on its r.m.s velocity is determined by:
r.m.s r.m.s
th
thr.m.s
thr.m.s
a (i) 2 f (i)v (i)
where :
f (i) i frequency band[Hz]
v (i) r.m.s velocity in the i frequency band
a (i) r.m.s acceleration in the i frequency band
Equation 4.1
The Power-Spectral-Density profile that the shaker system uses for its controller was
developed by squaring the resulting R.M.S acceleration in each of the 1/3-Octave bands
and dividing it by the appropriate frequency-bandwidth.
2 2 2r.m.s
1/3 Octave
thr.m.s
th1/3 Octave
a (i) (m / s )P.S.D(i)
f (i) Hz
where :
a (i) r.m.s acceleration in the i 1/3-octave frequency band
f the frequency range of the i 1/3-octave frequency band
Equation 4.2

43
The resulting signal had the following dynamic properties calculated by the
shaker and contain all present frequency components:
Constant Velocity Signal – Shaker Input Characteristicsr.m.s Acceleration 7.381 m/s2
Peak Acceleration N/APeak Velocity N/A
Peak Displacement 0.0055 m peak-peak
Table 4.2 Constant Velocity Signal – Shaker Input Characteristics
Again the signal properties within the 1-100Hz range, measured at the input plate are
presented in the Signal Comparison section. Since this signal was not created from an
actual time-history, peak instantaneous acceleration and velocity are not calculated nor
were they measured separately.
4.4.4 Signal Comparison
The frequency composition of the Warrior signal could not be altered to contain only
the frequencies of interest, nor was that deemed beneficial or necessary and therefore,
was left unaltered. However to gain a better understanding of the signal properties and
how they compare to each other, the actual outputted acceleration to the shaker plate was
measured and presented here. These vibration signals and their respective outputs are
weighted according to the ISO 2631:1 standard, whose weighting factors can be found in
Table 2.6.

44
CHAPTER 5
SEAT VIBRATION TRANSMISSIBILITY RESULTS
The two aforementioned signals used in these analyses are the Warrior Transport
Vehicle signal collected from a real world ride situation, and the developed Constant-
RMS Velocity Signal inspired by the revision to ISO 10819. As discussed in Chapter 4,
the tests were conducted on an electro-magnetic shaker, using each cushion, an SAE seat-
pad accelerometer, and a 1-D anthropomorphic dummy developed by the University of
Southhampton.
The signal characteristics, the vibration-transmissibility, frequency-response, and
measurement characteristics are presented in this chapter. The complete discussion and
analysis of the data presented here can be found in Chapter 9.
5.1 Signal Characteristics
The signals development and their acceleration profiles as entered into the shaker are
presented in Chapter4.4.4. The measured plate inputs of each signal with each of the
individual bladders are shown in sections 5.1.1 and 5.1.2 which characterize the two
signal.
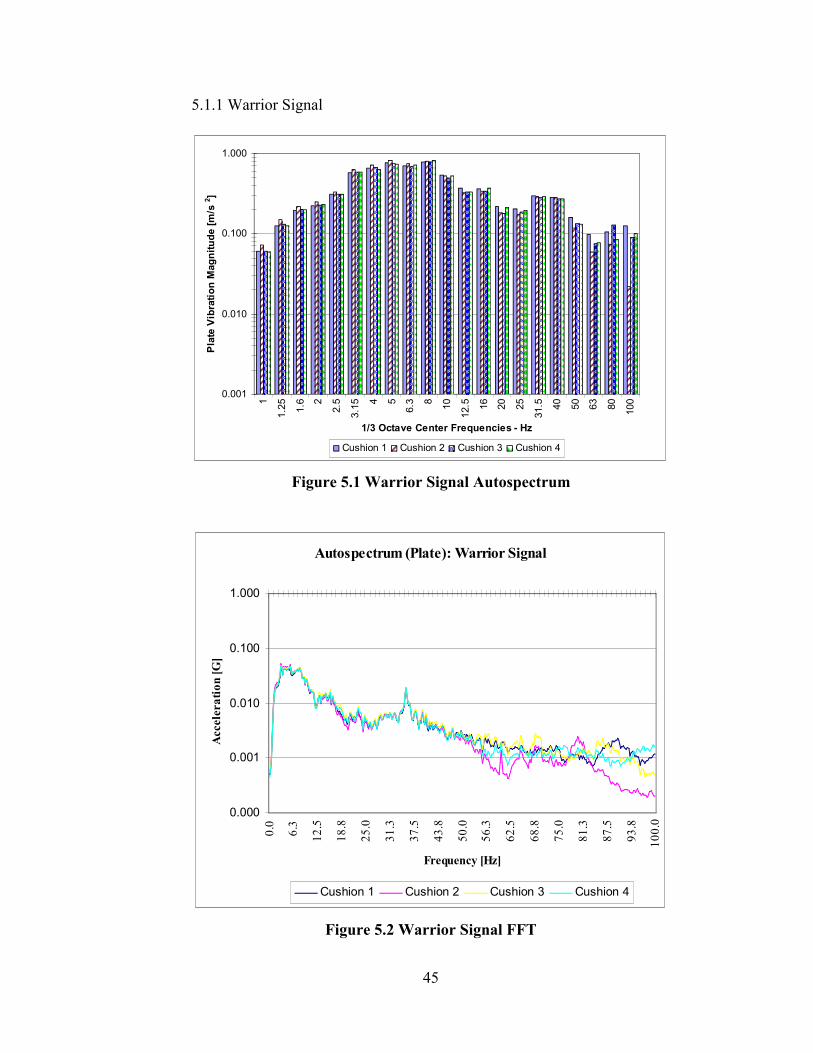
45
5.1.1 Warrior Signal
0.001
0.010
0.100
1.000
1
1.25 1.6 2
2.5
3.15 4 5
6.3 8 10
12.5 16 20 25
31.5 40 50 63 80 100
1/3 Octave Center Frequencies - Hz
Pla
te V
ibra
tio
n M
agn
itu
de
[m/s
2 ]
Cushion 1 Cushion 2 Cushion 3 Cushion 4
Figure 5.1 Warrior Signal Autospectrum
Autospectrum (Plate): Warrior Signal
0.000
0.001
0.010
0.100
1.000
0.0
6.3
12.5
18.8
25.0
31.3
37.5
43.8
50.0
56.3
62.5
68.8
75.0
81.3
87.5
93.8
100.
0
Frequency [Hz]
Acc
eler
atio
n [G
]
Cushion 1 Cushion 2 Cushion 3 Cushion 4
Figure 5.2 Warrior Signal FFT
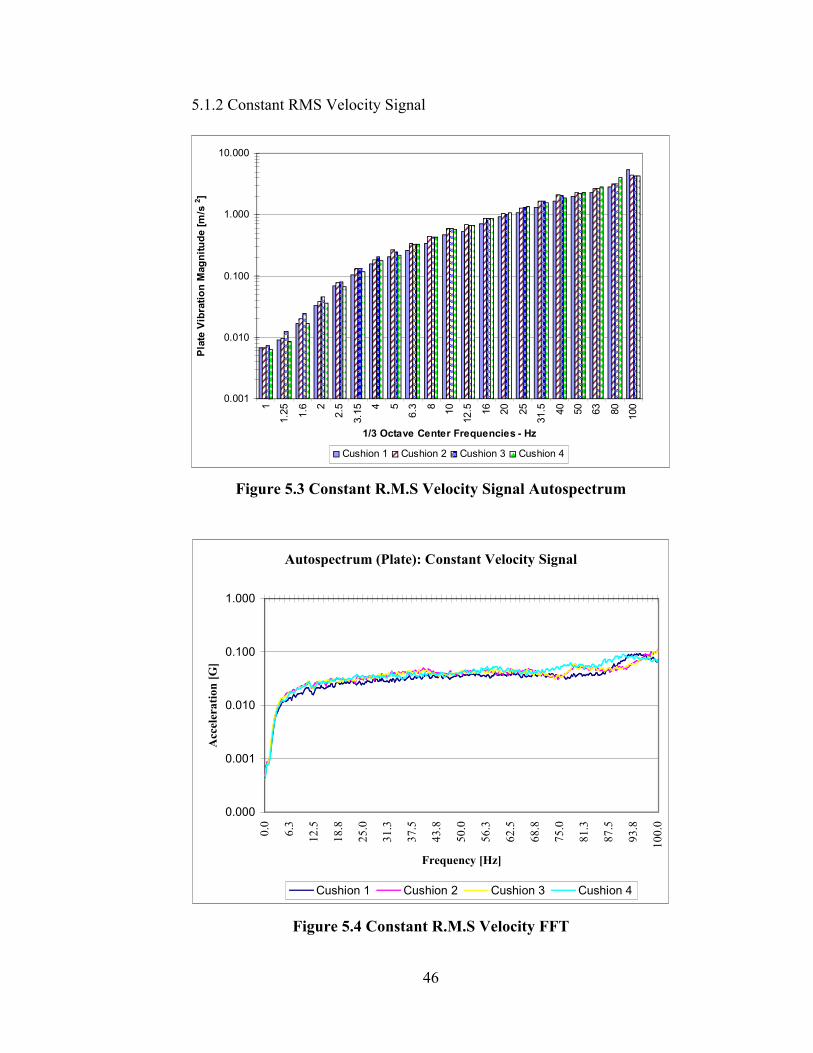
46
5.1.2 Constant RMS Velocity Signal
0.001
0.010
0.100
1.000
10.000
1
1.25 1.6 2
2.5
3.15 4 5
6.3 8 10
12.5 16 20 25
31.5 40 50 63 80 100
1/3 Octave Center Frequencies - Hz
Pla
te V
ibra
tio
n M
agn
itu
de
[m/s
2]
Cushion 1 Cushion 2 Cushion 3 Cushion 4
Figure 5.3 Constant R.M.S Velocity Signal Autospectrum
Autospectrum (Plate): Constant Velocity Signal
0.000
0.001
0.010
0.100
1.000
0.0
6.3
12.5
18.8
25.0
31.3
37.5
43.8
50.0
56.3
62.5
68.8
75.0
81.3
87.5
93.8
100.
0
Frequency [Hz]
Acc
eler
atio
n [
G]
Cushion 1 Cushion 2 Cushion 3 Cushion 4
Figure 5.4 Constant R.M.S Velocity FFT

47
5.1.3 Signal Comparison Analysis
In comparing the structure and frequency-composition of the two signals the warrior
signal contains significantly more energy in the lower 1/3 Octave Bands, and is again
obtained from a real ride-terrain experiment. However the constant-r.m.s velocity signal
is designed to have nearly the opposite property, increasing the energy in the higher
bands. The robustness of the two signals in their respective range allows for a complete
testing of the cushion, in two different scenarios, across the entire frequency range of
interest from 1-100Hz.
However it should be remembered that the coherence will be low in each signal’s
frequency range where the energy level is low, ultimately affecting the validity of the
data in that range for each signal.
5.2 Coherence
The coherence is presented here before presenting the Seat Pad Output in order to
give the reader perspective on the validity and reliability of the remainder of the data.
The coherence gives an indication of the validity of a single output caused by a single
input. That is to say that if there is a low coherence, a valid conclusion cannot be made
that the output at a given frequency is caused by the reference input at that same
frequency. See Equation 9.2.

48
0
0.2
0.4
0.6
0.8
1
1.2
1
1.25 1.6 2
2.5
3.15 4 5
6.3 8 10
12.5 16 20 25
31.5 40 50 63 80 100
1/3 Octave Center Frequencies - Hz
Co
her
ence
Mag
nit
ud
e
Cushion 1 Cushion 2 Cushion 3 Cushion 4
Figure 5.5 Coherence Warrior Signal
0
0.2
0.4
0.6
0.8
1
1.2
1
1.25 1.6 2
2.5
3.15 4 5
6.3 8 10
12.5 16 20 25
31.5 40 50 63 80 100
1/3 Octave Center Frequencies - Hz
Co
her
ence
Mag
nit
ud
e
Cushion 1 Cushion 2 Cushion 3 Cushion 4
Figure 5.6 Coherence Constant Velocity Signal

49
5.3 Air Bladder Seat Pad Cushion Autospectrum
0.0010
0.0100
0.1000
1.0000
1
1.25 1.6 2
2.5
3.15 4 5
6.3 8 10
12.5 16 20 25
31.5 40 50 63 80 100
1/3 Octave Center Frequencies - Hz
Sea
t V
ibra
tio
n M
agn
itu
de
[m/s
2 ]
Cushion 1 Cushion 2 Cushion 3 Cushion 4
Figure 5.7 Seat Pad Warrior Autospectrum
0.001
0.010
0.100
1.000
1
1.25 1.6 2
2.5
3.15 4 5
6.3 8 10
12.5 16 20 25
31.5 40 50 63 80 100
1/3 Octave Center Frequencies - Hz
Sea
t V
ibra
tio
n M
agn
itu
de
[m/s
2 /m/s
2 ]
Cushion 1 Cushion 2 Cushion 3 Cushion 4
Figure 5.8 Seat Pad Constant Velocity Autospectrum

50
Autospectrum (Seat Pad): Warrior Signal
0.000
0.001
0.010
0.100
1.000
0.0
6.3
12.5
18.8
25.0
31.3
37.5
43.8
50.0
56.3
62.5
68.8
75.0
81.3
87.5
93.8
Frequency [Hz]
Acc
eler
atio
n [G
]
Cushion 1 Cushion 2 Cushion 3 Cushion 4
Figure 5.9 Seat Pad Warrior Signal FFT
Autospectrum (Seat Pad): Constant Velocity Signal
0.000
0.000
0.001
0.010
0.100
1.000
0.0
6.3
12.5
18.8
25.0
31.3
37.5
43.8
50.0
56.3
62.5
68.8
75.0
81.3
87.5
93.8
Frequency [Hz]
Acc
eler
atio
n [G
]
Cushion 1 Cushion 2 Cushion 3 Cushion 4
Figure 5.10 Seat Pad Constant Velocity FFT

51
By looking at the spectrum-response of the seat-pad accelerometer we can see that
there is a peak in the response at approximately 5Hz for all the cushions in both signals.
This is to be fairly expected since the natural frequency of the 1-D Anthropomorphic
Dummy is tuned to that of the human-body, which also lies at approximately 5Hz.
5.4 ISO Weighted Seat Pad Autospectrum
The ISO weighting used is for a human in the seated position for the vertical
direction. It is described in ISO 2631 and is relevant between 1-100Hz for issues relating
to human health.
5.4.1 ISO 2631 Weighting Factors
The frequency weighting for the 1/3-octave bands in the vertical direction are:
Hz Wk Hz Wk
1 0.482 12.5 0.902
1.25 0.484 16 0.768
1.6 0.494 20 0.636
2 0.531 25 0.513
2.5 0.631 31.5 0.405
3.15 0.804 40 0.314
4 0.967 50 0.246
5 1.039 63 0.186
6.3 1.054 80 0.132
8 1.036 100 0.0887
10 0.988
Table 5.1 ISO Weighting Factors for the Vertical Direction (ISO 2631)

52
5.4.2 ISO Weighted Seatpad Autospectrum
0.001
0.010
0.100
1.000
1
1.25 1.6 2
2.5
3.15 4 5
6.3 8 10
12.5 16 20 25
31.5 40 50 63 80 100
1/3 Octave Center Frequencies - Hz
ISO
Wei
gh
ted
Sea
t V
ibra
tio
n M
agn
itu
de
[m/s
2 ]
Cushion 1 Cushion 2 Cushion 3 Cushion 4
Figure 5.11 ISO Weighted Seat Pad Warrior Autospectrum
0.001
0.010
0.100
1.000
1
1.25 1.6 2
2.5
3.15 4 5
6.3 8 10
12.5 16 20 25
31.5 40 50 63 80 100
1/3 Octave Center Frequencies - Hz
ISO
Wei
gh
ted
Sea
t V
ibra
tio
n M
agn
itu
de
[m/s
2/m
/s2]
Cushion 1 Cushion 2 Cushion 3 Cushion 4
Figure 5.12 ISO Weighted Seat Pad Constant Velocity Autospectrum

53
5.5 Seat Transmissibility
For the purpose of the Transmissibility ratio of output/input, the figures only show the
frequencies that had good coherence. Warrior Signal={1,10}Hz and Constant Velocity
Signal={1.6,40}Hz.
0.01
0.1
1
10
1
1.25 1.6 2
2.5
3.15 4 5
6.3 8 10
1/3 Octave Center Frequencies - Hz
Tra
nsm
issi
bil
ity
Mag
nit
ud
e [m
/s2/m
/s2 ]
Cushion 1 Cushion 2 Cushion 3 Cushion 4
Figure 5.13 Warrior Signal Transmissibility
0.01
0.1
1
10
1.6 2
2.5
3.15 4 5
6.3 8 10
12.5 16 20 25
31.5 40
1/3 Octave Center Frequencies - Hz
Tra
nsm
issi
bil
ity
Mag
nit
ud
e [m
/s2 /m
/s2]
Cushion 1 Cushion 2 Cushion 3 Cushion 4
Figure 5.14 Constant Velocity Signal Transmissibility

54
5.6 Frequency Response
0.01
0.1
1
10
1
1.25 1.6 2
2.5
3.15 4 5
6.3 8 10
12.5 16 20 25
31.5 40 50 63 80 100
1/3 Octave Center Frequencies - Hz
Fre
qu
ency
Res
po
nse
Mag
nit
ud
e [m
/s2 /m
/s2 ]
Cushion 1 Cushion 2 Cushion 3 Cushion 4
Figure 5.15 Magnitude of Frequency Response Warrior Signal
-4
-3
-2
-1
0
1
2
3
1
1.25 1.6 2
2.5
3.15 4 5
6.3 8 10
12.5 16 20 25
31.5 40 50 63 80 100
1/3 Octave Center Frequencies - Hz
Ph
ase
Fre
qu
ency
Res
po
nse
[ra
d]
Cushion 1 Cushion 2 Cushion 3 Cushion 4
Figure 5.16 Phase of Frequency Response Warrior Signal

55
Figures 5.17 and 5.18 show the amplitude of the magnitude and phase associated with
the air bladder seat cushion configurations excited with the constant velocity signal.
0.01
0.1
1
10
1
1.25 1.6 2
2.5
3.15 4 5
6.3 8 10
12.5 16 20 25
31.5 40 50 63 80 100
1/3 Octave Center Frequencies - Hz
Fre
qu
ency
Res
po
nse
Mag
nit
ud
e [
m/s
2 /m/s
2 ]
Cushion 1 Cushion 2 Cushion 3 Cushion 4
Figure 5.17 Magnitude of Frequency Response Constant Velocity Signal
-4
-3
-2
-1
0
1
2
3
1
1.25 1.6 2
2.5
3.15 4 5
6.3 8 10
12.5 16 20 25
31.5 40 50 63 80 100
1/3 Octave Center Frequencies - Hz
Ph
ase
Fre
qu
ency
Res
po
nse
[ra
d]
Cushion 1 Cushion 2 Cushion 3 Cushion 4
Figure 5.18 Phase of Frequency Response Constant Velocity Signal

56
CHAPTER 6
QUASI-STATIC AND DYNAMIC PRESSURE RESULTS
The internal pressure of the pneumatic seat system, of both the seat bottom and the
seat back were tested under two separate testing conditions: quasi-static using the
Material Test Systems (MTS) hydraulic tensile test machine with a fiberboard butt-form;
and dynamic pressure measured during the battery of drop-tower shock tests conducted at
UNLV. The complete discussion and analysis of the data presented here can be found in
Chapter 9.
6.1 Foam and Air Individual Contributions to Force-Compression
The foam’s response to experimental, quasi static compression was previously
calculated and fit with an empirical function:
7.2foam005.1
448.4F
Equation 6.1
where ε is the cushion compression divided by the original thickness (cushion strain).
This equation gives the foam force in units of Newton’s.
Figure 6.1 shows the air pressure sensor data plotted against the predicted results of
Equation 6.1. The foam and air forces were treated as parallel springs. Figure 6.3 shows
the results associated with adding the foam and air pressure results.

57
Bladder Foam Curve Fit
0
2000
4000
6000
8000
10000
12000
0 10 20 30 40 50 60 70 80 90 100
Percent Compression
Fo
rce
(Lb
f)
Calculated
Measured
Figure 6.1 Foam Compression Test Results
Air Bladder Pressure Comparison
0.00
0.50
1.00
1.50
2.00
2.50
3.00
0 10 20 30 40 50 60 70 80 90 100
Percent Compression
Pre
ss
ure
(P
SI)
Measured
Calculated
Figure 6.2 Bladder Compression-Pressure Test Results

58
The Air + Foam curve represents the compressive force measured by the test machine
load cell on a closed cushion system. The Air curve is derived from the pressure sensor
data from the same test multiplied by 2 times the surface area of the seat form. The Foam
curve is a load cell force measurement from a separate test on a cushion opened to the
atmosphere. Figure 6.4 shows a comparison between predicted results and measured data
for the cushion force.
Air Bladder Test Data
0
200
400
600
800
1000
1200
1400
0 10 20 30 40 50 60 70 80 90 100
Percent Compression
Fo
rce
(Lb
f)
Air
Foam
Air + Foam
Figure 6.3 Air Bladder Individual Components Performance

59
Air Bladder Compression Force
0
200
400
600
800
1000
1200
1400
0 10 20 30 40 50 60 70 80 90 100
Percent Compression
Fo
rce
(Lb
f)
Measured
Calculated
Figure 6.4 Air Bladder Compression –Force Results
6.2 Dynamic Pressure Consideration
The directly measured dynamic pressure from both the seat bottom and the seat back
were acquired from drops at 10, 20, and 30in with the 150lb Sandbag Dummy placed
directly on-top of the cushion. First an example of the shocks at each of the drop heights
are provided as a reference, and then the individual pressure performances are given for
each of the bladders.
6.2.1 Characterization of the Input Shock for Pressure Consideration
The shocks produced by the UNLV drop tower consistently have multiple pulses with
approximately 2-5 millisecond pulse widths. This is different than the pulse produced by
the Army Research Lab which are simple shocks consisting of half-sine pulses of
approximately 5 milliseconds.
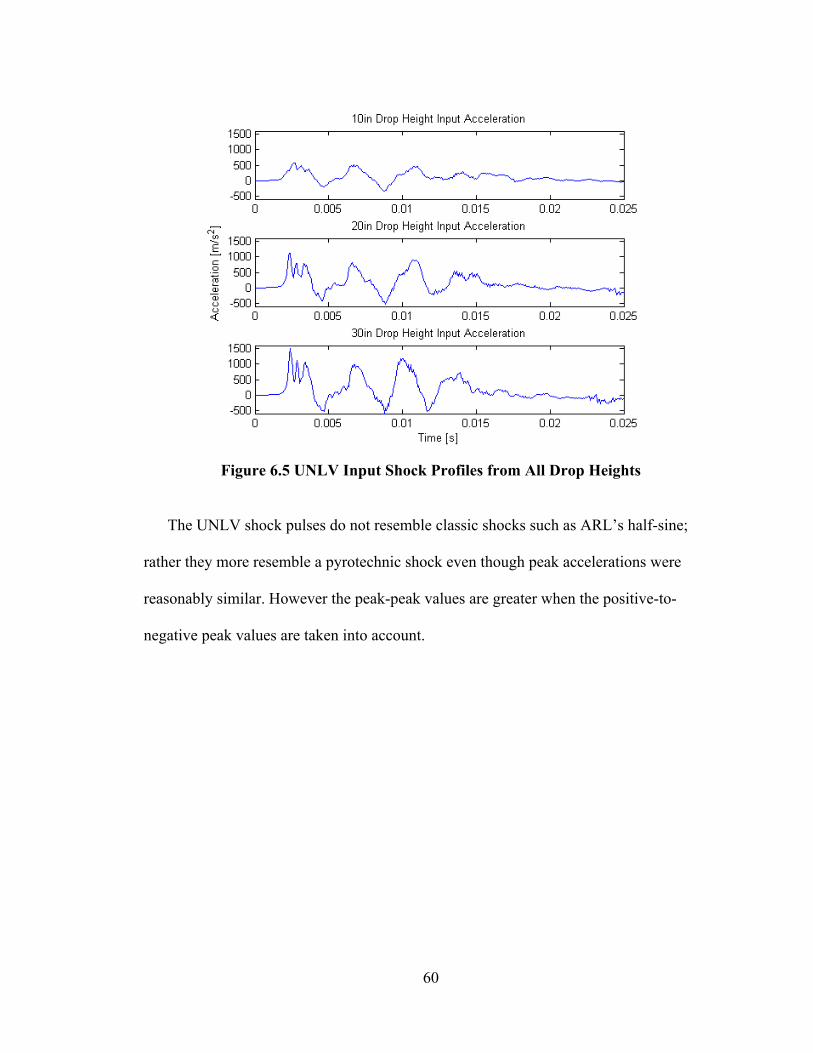
60
Figure 6.5 UNLV Input Shock Profiles from All Drop Heights
The UNLV shock pulses do not resemble classic shocks such as ARL’s half-sine;
rather they more resemble a pyrotechnic shock even though peak accelerations were
reasonably similar. However the peak-peak values are greater when the positive-to-
negative peak values are taken into account.

61
Figure 6.6 ARL Input Shock Profiles from All Drop Heights
The difference in the appearance of the input is a welcomed fact in this case because
it subjects the air cushions to a second variety of shock inputs. Moreover it showcases the
ability of the cushion to act like a mechanical filter, producing resulting in nearly half-
sine pressure histories, regardless of the more dynamic shock acceleration inputs.

62
6.3 Dynamic Pressure Results
6.3.1 Pressures from 10in Drop Heights
Figure 6.7 Bladder 1 Pressure- 10in Drop Height
Figure 6. 8 Bladder 2 Pressure- 10in Drop Height

63
Figure 6.9 Bladder 3 Pressure- 10in Drop Height
Figure 6.10 Bladder 4 Pressure- 10in Drop Height

64
6.3.2 Pressures from 20in Drop Heights
Figure 6.11 Bladder 1 Pressure- 20in Drop Height
Figure 6.12 Bladder 2 Pressure- 20in Drop Height

65
Figure 6.13 Bladder 3 Pressure- 20in Drop Height
Figure 6.14 Bladder 4 Pressure- 20in Drop Height

66
6.3.3 Pressures from 30in Drop Heights
Figure 6.15 Bladder 1 Pressure- 30in Drop Height
Figure 6.16 Bladder 2 Pressure- 30in Drop Height

67
Figure 6.17 Bladder 3 Pressure - 30in Drop Height
Figure 6.18 Bladder 4 Pressure- 30in Drop Height

68
CHAPTER 7
ARL SHOCK TESTING AND ANTHROPOMORPHIC RESPONSE RESULTS
7.1 ARL Shock Characterization
The ARL Drop tower configuration uses a pulse programmer to consistently produce
a nearly 5ms shock pulse with amplitude depending on the height of the drop occurrence.
This shock is a simple-zero-mean shock with no rebound. The UNLV shock profile, its
corresponding test results, and a comparison to the ARL Shock Profile will be discussed
in Chapter 8. The complete discussion and analysis of the data presented here can be
found in Chapter 9.
Figure 7.1 ARL Input Shock Profiles from All Drop Heights

69
7.2 Presentation of Shock Data Results
Because of the large amount of data collected in this series of tests, portions of the
data can be found in the Appendix. Therefore this presentation will focus on the most
severe of the drops at 30in, for many of the data sets from both the UNLV and ARL
battery of tests. The results from all three drop heights will be presented in a few
examples for the purpose of giving the reader context to the difference in magnitudes and
wherever else is deemed necessary.
7.3 ARL Anthropomorphic Dummy and Bladder Acceleration Performance
A series of tests were performed on the Anthropomorphic Test Dummy (ATD) in
order to get a baseline for the remainder of the tests. From hereon out, the ATD
performance will be designated as Baseline. Figure 6.2 of the Baseline Input
Accelerations can be considered the input for the remainder of the ARL Drop Tests.
7.3.1 Baseline/ATD Acceleration Performance – ARL
ARL did not perform drop tests with the ATD at heights above 25 in for fear of
damaging the instrumented dummy. The input accelerations associated with the
following plots were similar to the acceleration profiles shown in Figure 7.1. The
acceleration profiles for both the seat-pad acceleration and the pelvic accelerations can be
compared to the input profile in figures that have similar scales for ease of comparison
and analysis. To reduce the overall length of this chapter, the combined response plots for
10 and 20 in. drop heights will be provided in the Appendix.

70
Figure 7.2 Baseline/Dummy Table Input Accelerations – All Drop Heights
Figure 7.3 Baseline/Dummy Pelvic Accelerations – All Drop Heights

71
7.3.2 Combined Acceleration Plots for 30 in. Drop Height– ARL
Figure 7.4 Seat Pad Accelerations of all Bladders – 30in Drop Height
Figure 7.5 Seat Pad Accelerations of all Bladders – 30in Drop Height

72
7.3.3 Bladder 1 Acceleration Performance – ARL
Figure 7.6 Bladder 1 Seat-pad Accelerations – All Drop Heights
Figure 7.7 Bladder 1 Pelvic Accelerations – All Drop Heights

73
7.3.4 Bladder 2 Acceleration Performance – ARL
Figure 7.8 Bladder 2 Seat-pad Accelerations – All Drop Heights
Figure 7.9 Bladder 2 Pelvic Accelerations – All Drop Heights

74
7.3.5 Bladder 3 Acceleration Performance – ARL
Figure 7.10 Bladder 3 Seat-pad Accelerations – All Drop Heights
Figure 7.11 Bladder 3 Pelvic Accelerations – All Drop Heights

75
7.3.6 Bladder 4 Acceleration Performance – ARL
Figure 7.12 Bladder 4 Seat-pad Accelerations – All Drop Heights
Figure 7.13 Bladder 4 Pelvic Accelerations – All Drop Heights

76
7.4 Spine Load Performance – ARL
One major issue to be discussed, in hopes of future research, is the validity of the
Dynamic Response Index as a true measure for injury criteria. The measured spine loads
from the ATD are presented here. Future reference will be made in comparing the
reduction of measured spine load, as compared to the calculated reduction in DRI which
is designed to be a predictor of spine load damage.
7.4.1 Combined Spine Load Performance by Drop Height - ARL
Figure 7.14 Baseline/Dummy Spine Loads – All Drop Heights

77
Figure 7.15 Spine Loads all Bladders– 10in Drop Height
Figure 7.16 Spine Loads all Bladders– 20in Drop Height

78
Figure 7.17 Spine Loads all Bladders– 30in Drop Height
7.4.2 Spine Load Performance by Bladder
Figure 7.18 Bladder 1 Spine Loads – All Drop Heights

79
Figure 7.19 Bladder 2 Spine Loads – All Drop Heights
Figure 7.20 Bladder 3 Spine Loads – All Drop Heights

80
Figure 7.21 Bladder 4 Spine Loads – All Drop Heights

81
7.5 Dynamic Response Index Performance
7.5.1 DRI for Each Bladder from 30 in. Drop Height- ARL
Figure 7.22 Baseline/Dummy DRIs – 25 in. Drop Height
Figure 7.23 Bladder 1 DRI – 30 in. Drop Height

82
Figure 7.24 Bladder 2 DRI – 30in Drop Height
Figure 7.25 Bladder 3 DRI – 30in Drop Height

83
Figure 7.26 Bladder 4 DRI – 30in Drop Height
7.5.2 Combined DRI Performance of the Seat Pad from all heights
The SAE seat-pad accelerometer was not used during baseline testing. In the
following figures to more accurately compare the Bladders performance, the figures have
been zoomed to the area of interest near the peak DRI value. While the scale in each
figure might differ, the range was maintained to give the reader an accurate perspective.
Also this was necessary because the difference in peak DRIs were not overly significant
from bladder to bladder.

84
Figure 7.27 Seat-pad DRIs All Bladders – 10 in. Drop Height
Figure 7.28 Seat-pad DRIs All Bladders – 20 in. Drop Height

85
Figure 7.29 Seat-pad DRIs All Bladders – 30in Drop Height
7.5.3 Combined DRI Performance of the Pelvis from all heights
Figure 7.30 Pelvic DRIs All Bladders – 10in Drop Height

86
Figure 7.31 Pelvic DRIs All Bladders – 20in Drop Height
Figure 7.32 Pelvic DRIs All Bladders – 30in Drop Height

87
CHAPTER 8
UNLV SHOCK TESTING RESPONSE RESULTS
8.1 UNLV Shock Characterization
The shocks produced by the UNLV drop tower consistently have multiple pulses with
approximately 2-5 millisecond pulse widths. This is different than the pulse produced by
the Army Research Lab which are simple shocks consisting of half-sine pulses of
approximately 5 milliseconds. The complete discussion and analysis of the data presented
here can be found in Chapter 9.
Figure 8.1 UNLV Input Shock Profiles from All Drop Heights
The UNLV shock pulses do not resemble classic shocks such as ARL’s half-sine;
rather they more resemble a pyrotechnic shock even though peak accelerations were
reasonably similar. However the peak-peak values are greater when the positive-to-

88
negative peak values are taken into account. It should be noted that both shock types are
considered zero-mean shocks because their velocities begin and end at zero.
A summary of the peak input accelerations from both ARL and UNLV is provided
below. The UNLV accelerations are characterized in two ways here, first only its
maximum positive acceleration is noted, while the “max peak-to-peak” is the total
magnitude from the first positive peak to the first negative peak. This is shown here
because, unlike the ARL shock profiles, the UNLV shock profiles do rebound producing
negative accelerations.
PEAK ACCELERATIONS [m/s2]Height UNLV (max peak) UNLV (max peak-to-peak) ARL
10in 582 916 885
20in 1120 1647 1437
30in 1496 2114 1847
Table 8.1 Summary of Peak Input Acceleration Values
8.2 Typical Signal Filtering Results
The UNLV signal’s minimum pulse width of approximately 2ms, causes a
fundamental pulse frequency to be:
pulsepulse
1f
2 t
Equation 8.1
Where the sampling rate should equal
sampling pulsef 10f Equation 8.2
And the filter-frequency 3dB cutoff point for a low-pass filter to be:

89
filter pulsef 5f Equation 8.3
Both of these conditions are satisfied and a filter frequency of 1250Hz is applied to all the
following acceleration signals, regardless of their individual pulse width (as in the case of
the seat-pad acceleration).
An example of each the raw and filtered input shock acceleration and the raw and
filtered seat-pad acceleration are provided below with a summary of their percentage of
peak-reduction from filtering which follows.
Figure 8.2 Typical Raw and Filtered Plate Accelerations - 30in Drop Height

90
Figure 8.3 Typical Raw and Filtered Seat Accelerations - 30in Drop Height
Input Acceleration Seat-Pad AccelerationMaximum Filtered Peak Value 1156 m/s2 209 m/s2
Percentage Filtered Peak Reduction 22.8% 6.5%
Table 8.2 Filtered Acceleration Peak Reduction

91
8.3 Combined Acceleration Performance Plots for all Drop Heights - UNLV
Figure 8.4 Seat Pad Acceleration - 10 in. Drop Height
Figure 8.5 Seat Pad Acceleration - 20 in. Drop Height
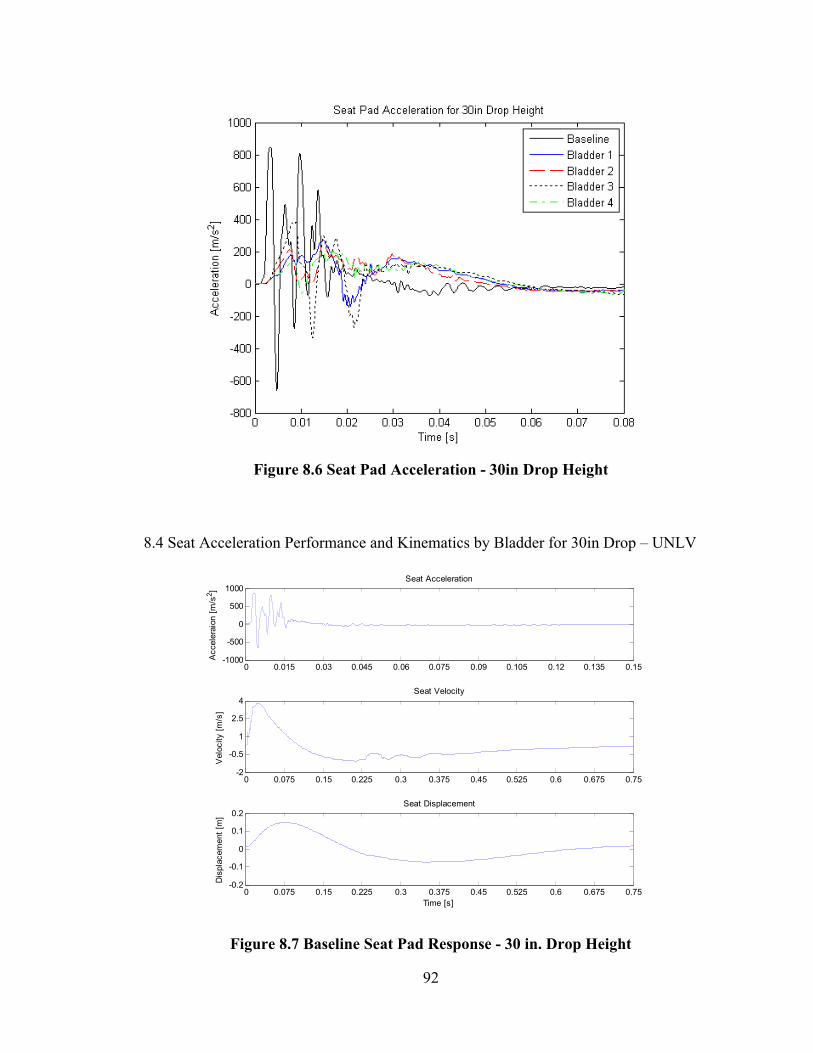
92
Figure 8.6 Seat Pad Acceleration - 30in Drop Height
8.4 Seat Acceleration Performance and Kinematics by Bladder for 30in Drop – UNLV
0 0.015 0.03 0.045 0.06 0.075 0.09 0.105 0.12 0.135 0.15-1000
-500
0
500
1000Seat Acceleration
Acc
eler
aion
[m
/s2 ]
0 0.075 0.15 0.225 0.3 0.375 0.45 0.525 0.6 0.675 0.75-2
-0.5
1
2.5
4Seat Velocity
Vel
ocity
[m
/s]
0 0.075 0.15 0.225 0.3 0.375 0.45 0.525 0.6 0.675 0.75-0.2
-0.1
0
0.1
0.2Seat Displacement
Time [s]
Dis
plac
emen
t [m
]
Figure 8.7 Baseline Seat Pad Response - 30 in. Drop Height

93
0 0.015 0.03 0.045 0.06 0.075 0.09 0.105 0.12 0.135 0.15-200
-50
100
250
400Seat Acceleration
Acc
eler
aion
[m
/s2 ]
0 0.075 0.15 0.225 0.3 0.375 0.45 0.525 0.6 0.675 0.75-2
-0.5
1
2.5
4Seat Velocity
Vel
ocity
[m
/s]
0 0.075 0.15 0.225 0.3 0.375 0.45 0.525 0.6 0.675 0.75-0.2
-0.1
0
0.1
0.2Seat Displacement
Time [s]
Dis
plac
emen
t [m
]
Figure 8.8 Bladder 1 Seat Pad Response - 30 in. Drop Height
0 0.015 0.03 0.045 0.06 0.075 0.09 0.105 0.12 0.135 0.15-200
-50
100
250
400Seat Acceleration
Acc
eler
aion
[m
/s2 ]
0 0.075 0.15 0.225 0.3 0.375 0.45 0.525 0.6 0.675 0.75-2
-0.5
1
2.5
4Seat Velocity
Vel
ocity
[m
/s]
0 0.075 0.15 0.225 0.3 0.375 0.45 0.525 0.6 0.675 0.75-0.2
-0.1
0
0.1
0.2Seat Displacement
Time [s]
Dis
plac
emen
t [m
]
Figure 8.9 Bladder 2 Seat Pad Response - 30 in. Drop Height

94
0 0.015 0.03 0.045 0.06 0.075 0.09 0.105 0.12 0.135 0.15-500
-250
0
250
500Seat Acceleration
Acc
eler
aion
[m
/s2]
0 0.075 0.15 0.225 0.3 0.375 0.45 0.525 0.6 0.675 0.75-2
-0.5
1
2.5
4Seat Velocity
Vel
ocity
[m
/s]
0 0.075 0.15 0.225 0.3 0.375 0.45 0.525 0.6 0.675 0.75-0.2
-0.1
0
0.1
0.2Seat Displacement
Time [s]
Dis
plac
emen
t [m
]
Figure 8.10 Bladder 3 Seat Pad Response - 30 in. Drop Height
0 0.015 0.03 0.045 0.06 0.075 0.09 0.105 0.12 0.135 0.15-200
-50
100
250
400Seat Acceleration
Acc
eler
aion
[m
/s2]
0 0.075 0.15 0.225 0.3 0.375 0.45 0.525 0.6 0.675 0.75-2
-0.5
1
2.5
4Seat Velocity
Vel
ocity
[m
/s]
0 0.075 0.15 0.225 0.3 0.375 0.45 0.525 0.6 0.675 0.75-0.2
-0.1
0
0.1
0.2Seat Displacement
Time [s]
Dis
plac
emen
t [m
]
Figure 8.11 Bladder 4 Seat Pad Response - 30 in. Drop Height

95
8.5 Dynamic Response Index Performance - UNLV
A major difference in this analysis to the one conducted for ARL was the usage of the
ATD. Without the ATD and the direct pelvis acceleration measurement, an actual Pelvic-
DRI cannot be calculated. While observations will be made to the possible DRI for this
battery of tests based on correlations from the ARL Drop tests, it is more likely that
future work including repeat tests with an instrumented ATD and numerical analyses
would be necessary to develop any relevant correlations.
8.5.1 DRI for 30in Drop Heights – UNLV
Figure 8.12 Baseline DRI - 30 in. Drop Height

96
Figure 8.13 Bladder 1 DRI - 30 in. Drop Height
Figure 8.14 Bladder 2 DRI - 30 in. Drop Height
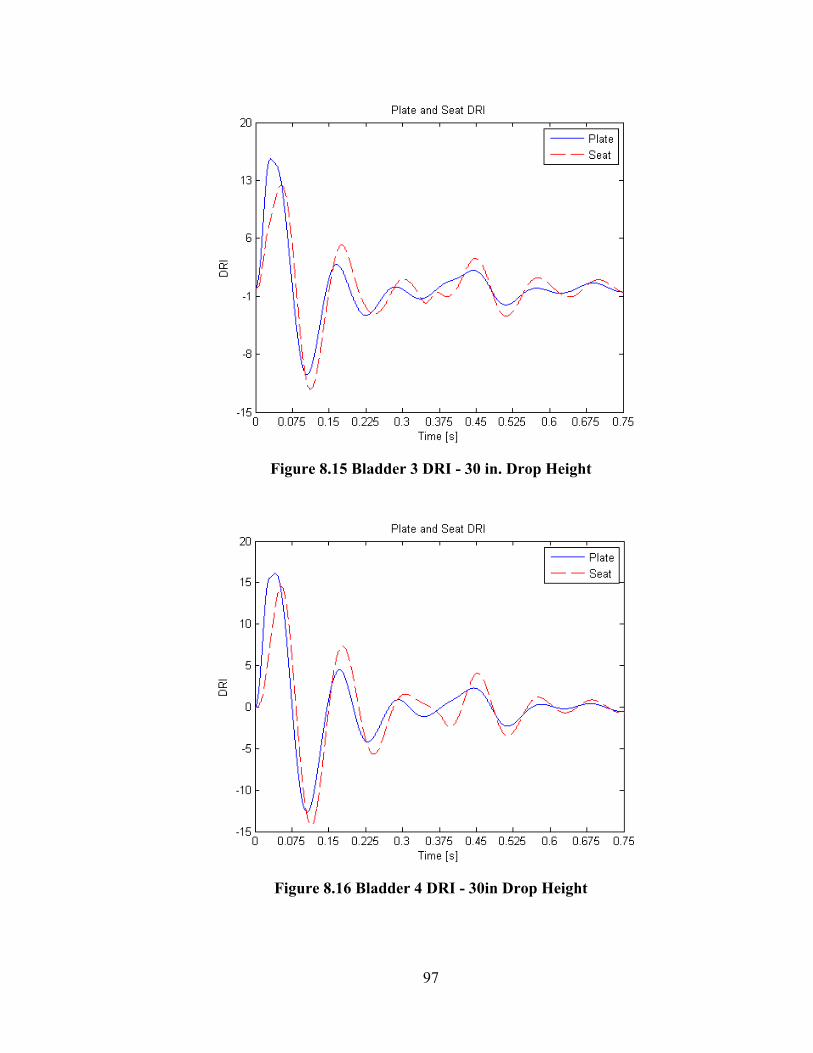
97
Figure 8.15 Bladder 3 DRI - 30 in. Drop Height
Figure 8.16 Bladder 4 DRI - 30in Drop Height

98
8.5.2 Combined DRI Performance for 30in Drop Heights – UNLV
Figure 8.17 Plate DRI for all Bladders - 30in Drop Height
Figure 8.18 Seat DRI for all Bladders from 30in Drop Height

99
CHAPTER 9
DISCUSSION AND ANALYSIS OF RESULTS
The data developed during this study will be analyzed in this chapter both by section
and by making comparisons across chapters. The investigation of air bladder seat cushion
performance in reducing whole body shock and vibration exposure was a major objective
of this project. Therefore, the relevant design parameters of the air bladder seat cushion
that were investigated are provided in Table 9.1.
Bladder Number Foam Density Foam Hole Diameter Internal Tube Diameter1 1 lb/ft3 0.5 in. 0.375 in.2 1 lb/ft3 1 in. 0.25 in.3 2 lb/ft3 0.5 in. 0.25 in.4 2 lb/ft3 1 in. 0.375 in.
Table 9.1 Review of Bladder Parameter Configurations
9.1 Discussion of Seat Vibration Results
9.1.1 Vibration Signal Comparison
As discussed in Chapter 5.1.3, the Warrior ride scenario signal and the constant r.m.s
velocity signal have their own strengths and weaknesses and are expected to reveal
different properties of the air bladder seat cushions. The warrior signal contains a
significant amount of energy at the lower frequencies, but it has near negligible energy as
frequencies approach 100 Hz (Figure 5.1 and Figure 5.2). The constant-RMS velocity
signal was used for this reason. The constant velocity signal has low energy values at low
frequencies and energy increase as frequency increases (Figure 5.3 and Figure 5.4). The
energy levels as a function of frequency in each signal affected the coherence between
the vibration inputs and outputs associated with each air bladder seat cushion. By using

100
the two signals, the entire frequency range of interest from 1-100Hz was excited with
significant energy by at least one, if not both, of the signals.
9.1.2 Coherence, Frequency Response Function and Transmissibility Function
The amount of energy contained in both the Warrior and constant r.m.s velocity input
signals within each of the 1/3-octave bandwidths directly affected the coherence of the
input-output relationships associated with the different air bladder seat cushion
configurations. The seat cushion is inherently a “soft” system that contrasts with a rigid
structure where energy-transmissibility more readily occurs. The coherence function is
defined as:
2
xy2xy
xx yy
2xy
xy
xx
yy
G (f )Coherence (f )
G (f )G (f )
where γ (f) 1and
G Cross-Power Spectral Density of the Input and Ouput
G Auto-Power Spectral Density of the Input
G Auto-Power Spectral Density of the Outp
ut
Equation 9.1
Figure 5.5 shows the coherence of the Warrior signal. The coherence for all seat
bladder configurations dropped off drastically after the 10 Hz 1/3 octave band. The FFT
of the input Warrior Signal (Figure 5.2), indicates that the magnitude of the individual
frequencies dropped below 0.100 m/s2 above the 10 Hz 1/3 octave band, contributing to
the poor coherence.
The coherence of the constant-velocity signal (Figure 5.6) was satisfactory for all seat
bladder configurations above 1.6 Hz 1/3 octave band and strong at frequencies above the
2 Hz 1/3 octave band. Bladder 1, which is the “softest” of all the air bladder seat cushion
configurations, was the only bladder to suffer from a poor coherence above the 40 Hz 1/3

101
octave band. This was possibly associated with the low stiffness of this cushion
configuration, resulting in less energy transfer.
The frequency response, FRF(f), and transmissibility, TR(f), functions are calculated
differently. The frequency response function, FRF(f), which is a function of the
coherence function, 2xy , is obtained from:
2xyxx out
yy in
xy xx out
yy in
xx out
yy in
G (f ) fFRF f G jf
G (f )
where:
f = coherence function between the output, G f ,
and the input, G
G Auto-Power Spectral Density of the Ouput
G Auto-Power Spectral Density of the Input
Equation 9.2
The transmissibility function, TR(f), is obtained from:
xx
yy
yy
xx
G (f )TR(f )
G (f )
where:
G Auto-Power Spectral Density of the Input
G Auto-Power Spectral Density of the Output
Equation 9.3
Figures 5.15 and 5.17 show the magnitudes of the frequency response functions for the
air bladder seat configurations for the Warrior and constant velocity signals, respectively,
at frequencies where 2xy 0.9 . Figures 5.13 and 5.14 show the magnitudes of the
transmissibility functions for the air bladder seat configurations for the Warrior and
constant velocity signals, respectively, at frequencies where 2xy 0.9 .

102
9.1.3 Seat Cushion Input Autospectra
The 1/3 octave band autospectra of the vibration response of the different air bladder
seat cushions associated with the Warrior excitation signal (Figures 5.7 and 5.9) peaked
between the 3.15 - 5 Hz 1/3 octave bands. This implies a system resonance within this
frequency range. The coherence associated with the seat cushion responses to the Warrior
signal was very low at frequencies above the 10 Hz 1/3 octave band (Figure 5.5). This
indicates the measured autospectra were not or were weakly associated with the Warrior
excitation signal. The lack of coherence at frequencies at frequencies above the 10 Hz 1/3
octave band is due in part to the very low vibration values at these higher frequencies
(Figure 5.2) Also, the one-degree-of-freedom antropodynamic dummy that was placed on
the seat cushions rattled during the Warrior signal tests. Therefore, it is speculated that
the measured autospectra of the vibration response of the seat cushions at frequencies
above the 10 Hz 1/3 octave band were mainly associated with vibration within the
antropodynamic dummy.
The 1/3 octave band autospectra of the vibration response of the different air bladder
seat cushions associated with the constant velocity excitation signal (Figures 5.8 and
5.10) shows a slight peak between the 3.15 - 5 Hz 1/3 octave bands. This is associated
with the system resonance that was identified with the Warrior signal. The seat cushion
1/3 octave band autospecta values continue to increase at frequencies above the 5 Hz 1/3
octave band because the corresponding 1/3 octave band levels associated with the
constant velocity input also increase (Figure 5.3). The coherence associated with the seat
cushion responses to the constant velocity signal became low at 1/3 octave band
frequencies below 2 Hz and above 40 Hz for seat cushion configuration1and above 63 Hz

103
for seat cushion configurations 2 - 4 (Figure 5.6). This indicates the measured autospectra
values were not or were weakly associated with the constant velocity excitation signal at
these frequencies.
9.1.4 ISO Weighted Seat Pad Autospectra Analyses
The frequency weighting (Wk) for a seated human defined by ISO 2631 (Table 5.1)
emphasizes the effects of whole body vibration exposure at frequencies between the 4 to
12 Hz 1/3-octave band frequencies by giving then weighting factors between 0.9 and
1.06. This is associated with the fact that the seated human body has resonance
frequencies at around 5.8 and 8 Hz. Although it is not common to plot the ISO 1/3
octave band autospectra, it is interesting to note the effects of the ISO 2631 weighting
factors on the measured air bladder seat cushion acceleration values. Figure 5.11 and
Figure 5.12 show the effects of the resonant peak within the 4 and 5 Hz 1/3 octave bands.
9.1.5 ISO Weighted r.m.s. Acceleration and Vibration Dosage Values
The ISO weighted r.m.s. acceleration (aW) and the fourth-power vibration dose
values (VDV) were calculated as a single value that represented the overall exposure to
the Warrior and constant velocity excitation signals. While the weighted r.m.s
acceleration is inherently corrected for time, the VDV value is a factor of the exposure
time. When whole body vibration signal is continuous with time, the aW and VDV values
are given by:

104
1/22T2
W w
0
1/44T1.75
w
0
w
1a a (t) dt [m/s ]
T
VDV a (t) dt [m/s ]
where:
a (t) weighted r.m.s acceleration as a function of time history
T= duration of measurement [s]
Equation 9.4
Equation 9.5
However, when vibration spectra are given as 1/3 octave band values, the aw and VDV
values can be calculated by:
1/2
2 2W i i
i
i
i
a (W a ) [m/s ]
where:
W the weighting factor for the i-th 1/3-octave band
a the r.m.s acceleration for the i-th 1/3-octave band
Equation 9.6
and VDV is estimated by:
1/4 1.75WeVDV 1.4a T [m/s ]
where:
eVDV estimated Vibration Dosage Value
T Duration of Measurement [s]
Equation 9.7
A summary of the measured aW and eVDV values are provided below:
Bladder 1 Bladder 2 Bladder 3 Bladder 4
Plate Seat Pad Plate Seat Pad Plate Seat Pad Plate Seat Pad
aW (m/s2) 1.75 1.51 1.82 1.65 1.72 1.70 1.74 1.63
eVDV (m/s1.75) 6.83 5.90 7.09 6.45 6.69 6.64 6.79 6.36
Output/Input Ratio 0.86 0.91 0.99 0.94
Table 9.2 Warrior Signal Weighted R.M.S Acceleration and eVDV

105
Bladder 1 Bladder 2 Bladder 3 Bladder 4
Plate Seat PadPlateSeat PadPlateSeat PadPlateSeat Pad
aW (m/s2) 1.73 0.78 2.07 0.81 2.05 1.07 2.07 0.84
eVDV (m/s1.75) 6.72 3.04 8.06 3.15 7.97 4.18 8.06 3.29Output/Input
Ratio 0.45 0.39 0.52 0.41
Table 9.3 Constant Velocity Signal Weighted R.M.S Acceleration and eVDV
The output/input ratios associated with the air bladder seat cushions were close to one
when they were excited with the Warrior signal because the majority of the vibration
energy in the signal was between the 2 to 16 Hz 1/3 octave bands. This is the region
where the ISO weighing is near unity and the region where the vibration transmissibility
of the seat cushions are near or slightly greater than unity. The output/input ratios
associated with the seat cushions were significantly less than one when they were excited
by the constant velocity signal because the majority of the vibration energy in the signal
was in the higher 1/3 octave bands where the vibration transmissibility of the seat
cushions were significantly less than one. Tables 9.2 and 9.3 indicates that seat cushion
configuration 1 performed best for the Warrior signal and seat cushion configuration 3
performed the worst. Seat cushion configuration 2 performed the best for the constant
velocity signal and seat cushion configuration 3 performed the worst.
9.1.6 Overall Air Bladder Seat Cushion Performance Comparison for Vibration Transmissibility
The 1/3 octave band frequency response magnitudes were used to compare the
performances of the four air bladder seat cushion configurations. Both Figure 5.15 for
the Warrior input signal and Figure 5.17 for the constant velocity input signal showed the

106
same frequency response trends. Seat cushion configurations 1 and 2 demonstrated a
better performance in the critical 1/3 octave bands between 2.5 and 8 Hz.
For both the ISO weighted acceleration values, aW, and the vibration dose values,
eVDV, the output/input ratios associated with the air bladder seat cushions were close to
one when they were excited with the Warrior signal because the majority of the vibration
energy in the signal was between the 2 to 16 Hz 1/3 octave bands. This is the region
where the ISO weighing is near unity and the region where the vibration transmissibility
of the seat cushions are near or slightly greater than one. The output/input ratios
associated with the seat cushions were significantly less than one when they were excited
by the constant velocity signal because the majority of the vibration energy in the signal
was in the higher 1/3 octave bands where the vibration transmissibility of the seat
cushions were significantly less than one. Tables 9.2 and 9.3 indicates that seat cushion
configuration 1 performed best for the Warrior signal and seat cushion configuration 3
performed the worst. Seat cushion configuration 2 performed the best for the constant
velocity signal and seat cushion configuration 3 performed the worst.
9.2 Discussion of Pressure Testing Results
Figure 6.2 represents a typical plot of the internal pressure of the seat bottom with
respect to percent-compression of the seat cushion air bladder. This compression test was
performed with a seat-butt attached to the MTS system in order to simulate the
compression that would occur by a human subject compression during a shock event,
such as a mine blast. It shows that the internal pressure reaches approximately 2.0 psi.

107
However, this these quasi-static test results are of less interest when relating internal seat
cushion air bladder pressure to an extreme shock event, such as a mine blast.
Internal dynamic pressures measured simultaneously in the seat-bottom and seat-back
during drop tower tests indicate that the peak pressures reached in the seat-bottom during
a shock event were much greater than those experienced on the MTS machine at a crush
speed of 2 in./s. Seat bottom pressures for the MTS tests ranged from 0 to 2.5 psi as the
seat bottom was compressed. Pressure pulse that were observed in the seat bottom during
drop tower tests were roughly shaped as a half-sine with a pulse width that ranged from
around 7.5 to 10 ms and a pulse height that ranged from around 3 to 8 psi, depending on
drop height and air bladder seat cushion configurations.
Many of the pressure-pulses in the seatback appeared to be affected by electronic
noise or another type of electronic disturbance. This was a transducer anomaly that
appeared at an early stage in the testing program and that could not be removed. The
problem could have been associated with the fact that the measured pressure values were
close to the noise floor of the transducer. It was not possible to purchase a replacement
pressure transducer, nor was there time to switch the pressure transducers between the
seat bottom and seatback and repeat the drop tower tests. Therefore, the seatback pressure
data were considered to be useful only for providing an understanding of the approximate
peak-pressures in the seatback, as well as, the time delay between the peak pressures in
the seat-bottom and the seatback.
Table 9.4 shows a summary of the seat bottom peak pressures, and Table 9.5 shows a
summary of the seatback peak pressures.

108
Pressure in Seat-Bottom [psi]Bladder 1 Bladder 2 Bladder 3 Bladder 4
10in 3.45 4.30 3.00 4.2420in 5.46 6.00 5.12 5.9930in 7.73 7.50 5.97 7.35
Table 9.4 Pressure in Seat Bottom for all Drop Heights
Pressure in Seat-Back [psi]Bladder 1 Bladder 2 Bladder 3 Bladder 4
10in 0.49 0.71 0.54 0.5320in 1.25 0.97 0.78 0.9130in 1.11 1.25 1.55 1.18
Table 9.5 Pressure in Seat Back for all Drop Heights
The area of a human butt form is 167 in.2. Therefore, the seat-bottom peak pressure
can be converted to an applied force on the seated-human. This assumes constant contact
between the seated human and the seat bottom. The seated applied force can provide an
interesting insight to the design of future air bladder seat cushions. Table 9.6 shows a
summary of the calculated peak forces applied to a seated occupant by the seat bottom.
Force Applied to Seated Occupant by Seat Bottom [N]Bladder 1 Bladder 2 Bladder 3 Bladder 4
10in 129.5 161.4 112.6 159.220in 205.0 225.2 192.2 224.930in 290.2 281.6 224.1 275.9
Table 9.6 Calculated Force Applied to Seated Occupant by Internal Bladder Pressure
As a final comparison, the bladders are ranked by least amount of applied force to the
seated occupant by drop height. This ranking is summarized in Table 9.7. Bladder 3
delivered the least amount of force to the occupant across all drop heights and Bladder 1

109
delivered the most greatest amount at 30in while Bladder 2 did so for 10 and 20in
heights..
Ranking by Force Applied per Drop HeightBladder 1 Bladder 2 Bladder 3 Bladder 4
10in 2nd 4th 1st 3rd
20in 2nd 4th 1st 3rd
30in 4th 3rd 1st 2nd
Table 9.7 Rankings of Bladders by Applied Force to Seated Occupant of all Drop Heights
9.3 Discussion of ARL Shock Testing and ATD Performance Results
The shock pulses produced the drop tower at the U.S. Army Applied Research
Laboratory (USARL) were consistently simple, zero-mean, half-sine pulses with
approximately 5 ms pulse widths (Figures 7.1 and 7.2). Table 9.8 shows a summary of
the peak acceleration amplitudes measured on the mounting plate of the USARL drop
tower as a function of drop height
AVERAGE USARL SHOCK PEAK ACCELERATIONS [m/s2]10 in. Drop Height 913
20 in. Drop Height 1,464
30 in. Drop Height 1,848
Table 9.8 Average USARL Shock Input Peak Accelerations
9.3.1 Anthropomorphic Dummy/Baseline Testing
Initially the anthropodynamic shock dummy (ATSD) was tested at three drop heights
when seated directly on the drop tower platform: 10 in., 20 in., and 25 in. The ATSD was
not tested at a drop height of 30 in. because of a fear of damaging the internal sensors in

110
the dummy. Table 9.9 shows baseline pelvis acceleration, DRI and spine load for the
three drop heights. The values for the 30 in. drop height were obtained from a 2nd order
polynomial regression equation of the respective data.
USARL ATSD Baseline Values
Drop Height (in.)
Platform Peak Accel.
(m/s2)
Pelvis Peak Accel. (m/s2)
Pelvis Peak Accel./ Platform Peak Accel. DRI
Spine Load (N)
10 942 257 0.27 10.5 3,67420 1,472 647 0.44 14.8 6,67225 1,677 851 0.51 16.6 8,852
(30) 1,844 (1,030) 0.56 (17.9) (10,087)
Table 9.9 Summary of USARL ATSD Baseline Values
Just by analyzing the pelvic acceleration variation from height to height, we see that
as the drop height, and impact velocity increase, the dummy’s natural damping decreases.
If it performed linearly in this range of inputs, then theoretically the pelvic acceleration
would increase by a factor of 2 for every doubling of drop height, simply by
considering the change in impact velocity.
While the dummy reduces the peak acceleration in the pelvis in the 10in drop to
nearly 75% of the input, that number drops to 57% in the 20in, and 53% in the 30in. The
seat-pad accelerometer was not used in this series of measurements.
9.3.2 Typical Bladder Acceleration and Plate Kinematics
Due to the large number of recorded measurements, and in order to reduce to total
volume of figures presented in the main body of the text, additional drop heights
performances will be presented in the Appendices.

111
Figure 7.4 shows the performance of the seat-pad accelerometer for each of the
bladders. Again the dummy could not be compared in these figures because no seat-pad
accelerometer was used in the dummy’s baseline testing.
We can see a recurring theme that Bladder 1 will respond with a larger acceleration
magnitude. Bladders 2, 3 and 4 have seat pad acceleration responses that do resemble
each other. However Figure 7.4 interestingly shows that rebound acceleration increases
for each of the remaining bladders. Also where Bladder 3 has the largest overall peak-
peak acceleration Bladder 1 actually has the lowest. However Bladder 1 still produces the
highest Pelvic acceleration (Figure 7.5) and even the highest Spinal Load nearing almost
5000N Figure 7.17 (Section 7.4.1 and 7.4.2). Bladder 2 had the lowest spine load.
Figures 9.1-9.4 review the acceleration, and kinematic platform profiles for Bladder 2
30in drop as typical profiles for all bladders.
Figure 9.1 Review of Bladder 2 Acceleration – 30in Drop Height

112
Figure 9.2 Bladder 2 Platform Acceleration – 30in Drop Height
Figure 9.3 Bladder 2 Platform Velocity – 30in Drop Height
Figure 9.4 Bladder 2 Platform Displacement – 30in Drop Height

113
9.3.3 Individual Bladder Acceleration Performance
Each of the bladders is characterized and presented individually from section 7.3.2 to
7.3.6. Looking at Bladder 1 independently in Figure 7.4 and Figure 7.6, remembering the
1lb bladder with the largest internal tube diameter, is structurally stiffer than the 0.5in
foam hole diameter of Bladder 2, it appears that Bladder 2 smaller orifice diameter
allowed slower back flow of air from the seat-back to the seat-bottom, possibly
accounting for the noticeably larger negative-rebound acceleration. This property again
becomes apparent when comparing Bladder 3 and 4; Bladder 3 having larger orifice-
diameter, has larger negative acceleration.
The interesting difference between the peak negative acceleration between Bladder 1
and Bladder 2, and then again between Bladder 3 and 4, are nearly the same for both sets.
This possibly presents the idea that the increase in negative rebound-acceleration can be
calculated by knowing the increase in orifice-diameter. Predicting response by changing
orifice diameter is a prime topic for future study.
While the differences in Pelvic accelerations are actually low, Bladder 1 does have
the largest magnitude, but only within the range of 50m/s2, slightly more than 5 g’s. And
while the remaining bladders are within approximately 10m/s2 of eachother, Bladder 4
does have the lowest response by a slim margin.
By looking at all of the individual bladder performances, sorted by drop height we
also see an expected result that as the drop height, and impact velocity increase, the pulse
width decreases and any peak magnitudes, both positive and negative, also increase.

114
9.3.4 Spine Load Performance
The spinal load injury criteria discussed in Chapter 2, and presented in Table 2.6
shows that the lumbar-spine limit in the vertical direction is between 6672-8007N. Figure
7.14 shows the spinal-loads in the vertical direction for all three of the dummy’s drop
heights [10, 20, 25in]. At the lowest height, the baseline 10in drop already produces a
load of nearly half the tolerance limit, the 20in drop does fall within the tolerance range
and the 30in exceeds it.
For both the 20 and 30in drops Bladder 2 had the lowest response in terms of spine
loading. At the 20in drop, Figure 7.16, we see that there are two groupings Bladder
1/Bladder 4 and Bladder2/Bladder 3. Again these two groupings only have internal-
tube/orifice diameter in common. The lower spine-load response coming from the
bladder grouping with the smaller of the two tube diameters at 0.25in.
At 30in however, while Bladder 1 still had the worst response and Bladder 2 had the
best, Bladders 3 and 4 had nearly identical responses and peaks.
Table 9.7 summarizes the baseline/dummy response including predicted values for a
30in drop. Table 9.8 shows spinal load reduction.
Spinal Load and Percent Reduction from 30in Drop HeightSpinal Load (N) Spinal Peak Reduction
Baseline/Dummy 10,087 N/ABladder 1 4,893 51.49%Bladder 2 4,119 59.17%Bladder 3 4,425 56.13%Bladder 4 4,448 55.90%
Table 9.10 Spinal Load Reductions at 30in Drop Height

115
9.3.5 Summary of all USARL Peak Values
Tables 9.10-9.14 review the peak values for platform acceleration, pelvic acceleration
and their ratio, spine load, and DRI. Figures 9.5-9.16 show the trends, versus peak plate
acceleration, for all collected data (ranging from 5-30 in. drop heights) for peak pelvic
acceleration, DRI, and spine load. The figures emphasize a major issue discussed here:
that while DRI values can remain relatively unchanged, peak pelvic accelerations and
spine load are significantly and drastically reduced.
USARL ATSD Air Bladder Seat Cushion 1 ValuesDrop
Height (in.)Platform Peak Accel. (m/s2)
Pelvis Peak Accel. (m/s2)
Pelvis Peak Accel./ Platform Peak Accel.
DRISpine
Load (N)10 907 89 0.10 9.4 2,33020 1,467 167 0.11 14.1 3,61230 1,859 310 0.17 17.8 4,893
Table 9.11 USARL ATSD Air Bladder Seat Cushion 1 Values
USARL ATSD Air Bladder Seat Cushion 2 ValuesDrop
Height (in.)Platform Peak Accel. (m/s2)
Pelvis Peak Accel. (m/s2)
Pelvis Peak Accel./ Platform Peak Accel.
DRISpine
Load (N)10 899 92 0.10 9.4 2,33520 1,447 167 0.12 13.7 3,39430 1,854 255 0.13 17.0 4,119
Table 9. 12 USARL ATSD Air Bladder Seat Cushion 2 Values
USARL ATSD Air Bladder Seat Cushion 3 ValuesDrop
Height (in.)Platform Peak Accel. (m/s2)
Pelvis Peak Accel. (m/s2)
Pelvis Peak Accel./ Platform Peak Accel.
DRISpine
Load (N)10 927 85 0.09 9.3 2,31720 1,472 154 0.11 13.7 3,38930 1,839 258 0.14 17.5 4,425
Table 9.13 USARL ATSD Air Bladder Seat Cushion 3 Values

116
USARL ATSD Air Bladder Seat Cushion 4 ValuesDrop
Height (in.)Platform Peak Accel. (m/s2)
Pelvis Peak Accel. (m/s2)
Pelvis Peak Accel./ Platform Peak Accel.
DRISpine
Load (N)10 893 91 0.10 9.6 2,24220 1,462 163 0.11 14.2 3,53630 1,844 241 0.13 18.1 4,448
Table 9.14 USARL ATSD Air Bladder Seat Cushion 4 Values
9.3.6 Dynamic Response Index Performance - ARL
The DRI model was developed to characterize the response of the spinal column to
short duration accelerations. Its parameters have been validated through aircraft ejection
seat studies, catapult tests, and drop tests [20,21]. However its validity from predicting
injury sustained from blast loading has actually not been validated [22]. To review, the
DRI formulation is based on a 1-D Lumped Parameter model of the spine based on the
maximum displacement of that 1-D model, equation Chapter 2.9, with natural frequency
of 52.9 /rad s and damping ratio of 0.224 [12].
The DRI lumped parameter model and equation are based upon an acceleration input.
Therefore theoretical DRI of any shock pulse can be calculated by applying any
acceleration profile as the 2nd order linear differential equation’s forcing function. In the
case of ARL requirements, the pelvic accelerations are used as the primary input.
However, for the sake of comparison, all acceleration values were used as inputs. This
was done so that the amount of theoretical “DRI-reduction” can be calculated.
Figure 7.22 shows that from pelvic DRI nearly matches that Table based DRI.
Figures 7.22-7.26 show each bladder’s DRI performance for the 30in drop height. While
all of the bladders produced a reduction in input-to-pelvic-DRI at 30in, none produced a
reduction above 3-DRI values.

117
In the context of an injury likelihood, Figure 2.5 shows the spinal injury rate as a
function of DRI for Aircraft Seat Ejection Events, a DRI of 16 is considered to have 1%
spinal injury rate, while a DRI of 20 would result in a 10% spinal injury rate. This
number is in contrast to NATOs value of 17.7 as a 10% spinal injury level. Thus a
difference of 3 DRI can be considered significant.
When comparing the pelvic-DRI for each of the bladder in Figures 7.30-7.32 we see
that in the 10in Drop height all of the bladders have a DRI near or below 9.5 resulting in
essentially no risk for spinal-injury, although the baseline DRI for this test was only in
the range of 10.5 DRI. At 20in the difference is more pronounced. While Bladder 3 had
the lowest DRI value near 13.5 and Bladder 4 had the highest at nearly 14, the familiar
grouping of Bladder 2/3 and Bladder 1/4 appeared again, showing that the bladders with
the smaller internal diameter ports to have the better performance. This trend is repeated
at 30in (Figure 7.32), except Bladder 2 coming out to be the clear winner, with the only
bladder producing a pelvic-DRI of less than 17. Bladder 3, the stiffer of the smaller
internal-tubed bladders rating at 17.5. Bladders 1 and 4, both of which have the larger
0.375in internal-tube diameter performed worse, where Bladder 1 bordered the 17.7 DRI
limit for injury and Bladder 4 failed that criteria. Figure 7.32 and Table 9.1 show the
bladders with the smaller internal diameter ports have the better performance than their
larger ported counterparts.
Table 9.13 lists the apparent ranking of the bladder performance, by DRI, for the 30in
drop height. While this rank was not the case through all drop heights, 30in was the first
height to produce clear and significant differences. This ranking assumes that same trend
will continue for greater drop heights and only absolute magnitude of the Pelvic-DRI.

118
Rank Bladder
1st Bladder 2 [0.25in Internal Tube Diameter, 1lb Density Foam]
2nd Bladder 3 [0.25in Internal Tube Diameter, 2lb Density Foam]
3rd Bladder 1 [0.375in Internal Tube Diameter, 1lb Density Foam]
4th Bladder 4 [0.375in Internal Tube Diameter, 2lb Density Foam]
Table 9.15 Summary of Bladder Configuration Performance Rankings by DRI
9.4 Discussion of UNLV Shock Performance
The difference in the UNLV and the ARL drop tests are the absence of an
instrumented anthropomorphic dummy and the non-simple shock profile used. While
ARL’s profile was a classic half-sine pulse with essentially zero-negative acceleration or
rebound, UNLV’s profile is believed to more resemble data showing actual blast profiles.
The discussion of severity of shocks is an ongoing one in the study of vibrations, and the
variety of injury metrics and shock-characterization tools show that there is no clear
solution. The characterization of a shock severity, particularly in reference to induction of
human injury, will hopefully be discussed in future studies.
Table 8.1 shows a summary of all of the peak acceleration value of both the UNLV
and ARL drop tests. And Figures 7.1 and 8.1 show a summary of the shock profiles,
zoomed to the fundamental pulses. While the UNLV shock pulses appear more violent
and dynamic, they still had overall smaller peak acceleration. Table 8.1 also shows the
maximum peak values of UNLV’s drop tests when measured from maximum peak-to-
negative peak. However if only initial peak acceleration is considered then the ARL pulse
peaks were on average 324m/s2 (33 g’s) greater than the UNLV pulses.

119
Drop Height ARL-UNLV Peak Input Acceleration Difference10in 303 m/s2
20in 317 m/s2
30in 351 m/s2
Table 9.4 Difference in Raw Peak Acceleration Values from ARL to UNLV
The recommended values for sampling and filtering data are 10-times fundamental
pulse width and 5-times fundamental pulse widths respectively, Equations 8.1-8.3. While
the data was oversampled, the filtering frequency suggestion was met exactly. While the
UNLV pulse consisted of pulse widths of up to 5ms, the primary pulses were from 2-3ms
in width, so a filtering frequency of 1250Hz was applied to all subsequent shock data,
including the seat-pad acceleration even though its pulse widths were much greater.
Figure 8.2-8.3 shows baseline raw and filtered acceleration for both the input plate and
seat-pad respectively. Table 8.2 shows a summary of the peak reduction by filtering;
while the seat-pad during baseline tests only saw a 6.46% reduction, the input
acceleration saw a 22.76% reduction.
9.4.1 Seat Pad Acceleration Discussion
The usage of a sandbag dummy will affect the overall impedance of the system, and
therefore the acceleration profile of the seat-pad. However usage of such a dummy is
largely preferred to that of a rigid mass when comparisons to the ATD used at ARL are
desired. Yet without a direct comparison of the sandbag-dummy and the THOR III ATD
using the same input signal, it would be difficult to state any conclusive differences. Such
a study would also be future goal.
Figures 8.4-8.6 showcase the unique performance of the seat-pad acceleration under
the UNLV shock pulse. All of the bladders exhibit an interesting negative acceleration

120
after their initial positive-peak. The negative peak decreases for all bladders as the drop
height and input acceleration magnitudes increase, while the initial positive peaks
continue to increase. Because of the convention used in the acceleration direction the
negative acceleration is essentially the rebound, or the motion and acceleration in the
positive vertical direction. This feature is most prominently displayed in the 10in drop
height where Bladder 1 has a negative peak approximately 2.5-times greater than its
positive peak and Bladder 3 displays a similar behavior at a negative peak at
approximately 2-times its positive peak. It is believed that the reduced internal-tube
diameter of Bladders 2/3 are effectively decreasing this spring-back effect by increasing
the damping of the system by slowing the air flow from the seat bottom to the seat back,
also slowing the decent of the seat/butt surface.
9.4.2 Dynamic Response Index Discussion – UNLV
Again, two important piece of information that cannot be gathered from the series of
tests conducted at UNLV are the pelvic-acceleration and the spine-load because of the
lack of an instrumented-ATD. However, as in the ARL-DRI analysis, DRI values can be
calculated from the available acceleration data, and compared to the ARLresults.
A discussion of the combined analysis of the DRI values from both testing facilities is
presented in section 9.5.
Regardless of the more dynamic nature of UNLV’s shock input, the DRI plots from
ARL (Figures 7.22-7.26 ) and UNLV (8.12-8.16) look strikingly similar. This is due to
the nature of the DRI calculation; DRI is directly proportional to the displacement output
of a 2nd order underdamped system and therefore less sensitive to minor changes in the
shape of the input acceleration profile. Where ARL input acceleration produces a DRI of

121
nearly 20 from a 30in drop height, UNLV input DRIs range from 15.8-17.4 with an
average DRI of 16.4. This is due to the smaller UNLV peak acceleration.
Where ARL input acceleration profiles resulted in essentially identical max DRI
values, the UNLV input profiles did result in slightly different DRI values per-drop
occurrence. The differences are enough to require the peak values of the input and seat-
pad output DRIs for accurate comparison as can be seen in Figure 8.17. Figure 8.18
shows all of the bladders and the baseline DRIs for the seat-pad output.
If we compare these bladders using only peak DRI value, in this case the seat-pad
accelerometer is the highest level of measurement available. At first glance we see that
Bladder 3 has the lowest DRI with Bladder 1 ranking second. Bladder 2 which was the
leader in the ARL test group ranked last. However because this DRI ranking is based on
the seat-pad acceleration and not the pelvic-acceleration the two series of tests must be
compared in a different fashion.
9.5 Comparison of ARL and UNLV DRI Performances
We see a deviation from the previous pattern observed in the DRI performance at
ARL. In the ARL testing the bladders with the smaller, 0.25in internal tube diameter
were the clear winners, with the lighter density foam bladders performing better within
each grouping of internal-tube diameters, see Table 9.9. However no such clear pattern
was seen for the UNLV tests.

122
9.5.1 Peak DRI Rankings
A ranking system based purely on peak DRIs may not be sufficient, especially since
Pelvic-DRIs were not available during the UNLV testing. The next section compares the
testing series by looking at the magnitudes of DRI reduction in each bladder
configuration.
Peak DRI Magnitudes – 30in UNLVInput DRI Seat Pad DRI
Bladder 1 16.32 13.49Bladder 2 17.44 15.23Bladder 3 15.60 12.41Bladder 4 16.13 14.58
Baseline/Sandbag Dummy 17.24 15.87
Table 9.5 Magnitudes of DRIs from UNLV Testing
Peak DRI Magnitudes – 30in ARL Input DRI Seatpad DRI Pelvic DRI
Bladder 1 19.38 17.27 17.77Bladder 2 20.05 17.29 16.93Bladder 3 19.37 18.84 17.56Bladder 4 20.35 16.64 18.03
Baseline/Dummy(25in) 16.69 N/A 16.54
Table 9.6 Magnitudes of DRIs from ARL Testing
Table 9.16 shows that in some cases seatpad DRI to be unexpectedly lower than
pelvic DRI. Minor variations in the dummy placement, its movement during the drop and
even during rebound will affect the seat-pad accelerations and thus DRI. Mathematically
the only way the seat-pad DRI can be lower than that of the pelvis is if the pelvic
acceleration profile would cause the 1-D to undergo a greater maximum displacement
than that of the seat-pad, even though the peak seat pad acceleration can be up to 3-times
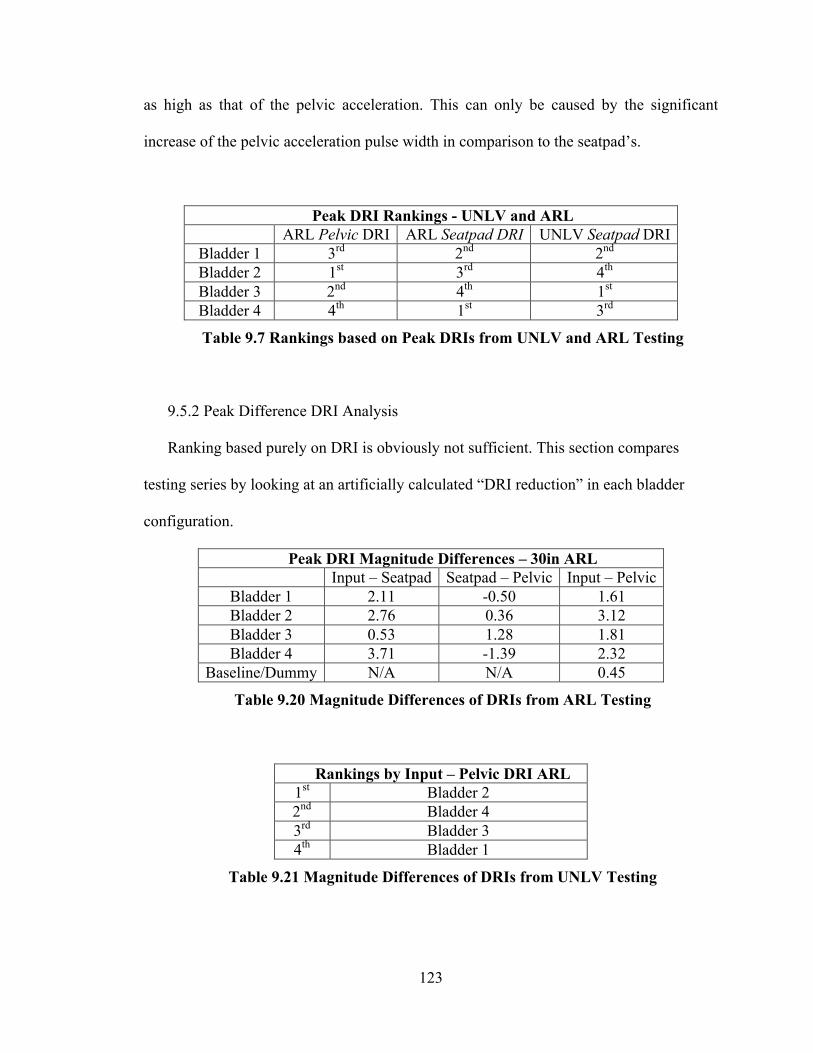
123
as high as that of the pelvic acceleration. This can only be caused by the significant
increase of the pelvic acceleration pulse width in comparison to the seatpad’s.
Peak DRI Rankings - UNLV and ARL ARL Pelvic DRI ARL Seatpad DRI UNLV Seatpad DRI
Bladder 1 3rd 2nd 2nd
Bladder 2 1st 3rd 4th
Bladder 3 2nd 4th 1st
Bladder 4 4th 1st 3rd
Table 9.7 Rankings based on Peak DRIs from UNLV and ARL Testing
9.5.2 Peak Difference DRI Analysis
Ranking based purely on DRI is obviously not sufficient. This section compares
testing series by looking at an artificially calculated “DRI reduction” in each bladder
configuration.
Peak DRI Magnitude Differences – 30in ARLInput – Seatpad Seatpad – Pelvic Input – Pelvic
Bladder 1 2.11 -0.50 1.61Bladder 2 2.76 0.36 3.12Bladder 3 0.53 1.28 1.81Bladder 4 3.71 -1.39 2.32
Baseline/Dummy N/A N/A 0.45
Table 9.20 Magnitude Differences of DRIs from ARL Testing
Rankings by Input – Pelvic DRI ARL1st Bladder 22nd Bladder 43rd Bladder 34th Bladder 1
Table 9.21 Magnitude Differences of DRIs from UNLV Testing

124
This ranking, Table 9.20, which shows DRI-differences may be more meaningful
than Table 9.17 which ranks the ARL DRI based purely on peak DRI. While this takes
into account the difference between the input and the output DRIs. While Bladder 4
performed the worst in overall pelvic DRI, when considering this metric its ranking
increases to second place. The relative order of the remaining bladders did not change.
Peak DRI Magnitude Differences – UNLVInput – Seatpad DRI Seatpad – Pelvic DRI
Bladder 1 2.83Bladder 2 2.21Bladder 3 3.20Bladder 4 1.56
Baseline/Sandbag Dummy 1.26
N/A
Table 9.8 Magnitude Differences of DRIs from UNLV Testing
Rankings by Input – Seatpad DRIARL UNLV
1st Bladder 4 Bladder 32nd Bladder 2 Bladder 13rd Bladder 1 Bladder 24th Bladder 3 Bladder 4
Table 9.9 Magnitude Differences of DRIs from ARL and UNLV Testing
Notice that if the difference in DRI from the Input-to-Seatpad is used, then no clear
pattern whatsoever is present. In fact the rankings have been completely reversed.
9.5.3 DRI Rankings Overview
Because of the large variety of ways that the bladders can be ranked, a summary of
the rankings discussed above have been provided here. In some cases to see trends the

125
bladders have been organized by ranking rather than the other way around, as can be seen
in some of the above figures.
Pelvic DRI Seatpad DRI Input – Seatpad DRI Input – Pelvic DRIARL UNLV ARL UNLV ARL UNLV ARL UNLV
Bladder 1 3rd 2nd 2nd 3rd 2nd 4th
Bladder 2 1st 3rd 4th 2nd 3rd 1st
Bladder 3 2nd 4th 1st 4th 1st 3rd
Bladder 4 4th
N/A
1st 3rd 1st 4th 2nd
N/A
Table 9.10 Summary of DRI Rankings by Criteria and Test Location
9.6 Review of Total Bladder Performance by Input Acceleration
The individual performance trends between bladders for the seatpad acceleration and
the spinal load are discussed in detail in Section 9.3.3-9.3.4 for the ARL series of tests
and in Section 9.4.1 for the UNLV series. This section provides an overview of the peak
values of pelvic-acceleration and spine load throughout the ARL battery of tests and
compares that information to the applied usage of DRI.
The following figures will show the relationship and the difference in magnitudes
between each bladder and the baseline/dummy values for:
Peak Pelvic Acceleration vs Peak Input Acceleration
Peak DRI vs Peak Input Acceleration
Peak Spine Load vs Peak Input Acceleration
Previously only three drop heights were used in the presentation of data, for consistency
and as a sufficient representation. However, all available drop heights per bladder are
represented in the following figures.

126
They consistently show that the bladders only marginally reduce the pelvic-DRI value
when compared to the baseline test. However, in contrast they show that peak pelvic
accelerations, and the potentially more important spine loads are significantly reduced.
Also the spine load never met or exceeded the maximum spine load limit of
approximately 6,672N (1,500lbf); where it was regularly exceeded by the baseline tests.
In fact the peak difference is typically on the order of 4,000N (900lbf). Moreover, the
magnitude of the pelvic acceleration showed the typical peak difference to be on the
order of 600m/s2.

127
Figure 9.5 Bladder 1 Pelvic Acceleration versus Plate Acceleration – All Data
Figure 9.6 Bladder 1 DRI versus Plate Acceleration – All Data
Figure 9.7 Bladder 1 Spine Load versus Plate Acceleration – All Data

128
Figure 9.8 Bladder 2 Pelvic Acceleration versus Plate Acceleration – All Data
Figure 9.9 Bladder 2 DRI versus Plate Acceleration – All Data
Figure 9.10 Bladder 2 Spine Load versus Plate Acceleration – All Data

129
Figure 9.11 Bladder 3 Pelvic Acceleration versus Plate Acceleration – All Data
Figure 9.12 Bladder 3 DRI versus Plate Acceleration – All Data
Figure 9.13 Bladder 3 Spine Load versus Plate Acceleration – All Data

130
Figure 9.14 Bladder 4 Pelvic Acceleration versus Plate Acceleration – All Data
Figure 9.15 Bladder 4 DRI versus Plate Acceleration – All Data
Figure 9.16 Bladder 4 Spine Load versus Plate Acceleration – All Data

131
9.7 Overall Performance Trends and Conclusions
By ARL standards and test methodology, which is based on the NATO standard, only
the peak pelvic-DRI is considered. It is being used as the sole metric by which seat
systems are evaluated. While Figures 9.5-9.16 show that drastic and significant
reductions in pelvic accelerations and spinal loads, even when DRI values only see minor
reductions. Since there are clear limits to spine load tolerance, DRI’s sole usage has
begun to be questioned.
As Table 9.18 shows, calculating the difference in Input-DRI and Pelvic-DRI from
blast event to blast event helps to account for even minor differences in the blast event.
This was shown that even with ARLs drop tower there were minor differences from drop
to drop, even with identical massed objects being placed on the drop platform.
From the perspective of vibration transmissibility, Bladder 2 is the clear winner with
Bladder 3 showing the greatest vibration-dosage and frequency weighted acceleration
transmitted to the occupant over both input acceleration signals. Bladder 2 is chosen as
the performance leader in this case because while Bladder 1 outperformed Bladder 2 in
the Warrior signal by 5%, Bladder 2 outperformed Bladder 1 by 13.7% in the constant-
velocity signal.
If the data gathered from ARL alone was used, then Bladder 2 would win on
essentially all accounts, lowest peak-pelvic DRI, peak DRI reduction, and lowest peak
spinal load. However, the UNLV data would suggest the usage of Bladder 3 by its
greatest DRI-reduction and peak seat-pad accelerations; it also has the best performance
in the calculated peak force transmitted by the pressure in the seat-bottom, where Bladder

132
2 interestingly has the worst performance in overall in that category and Bladder 1 had
the worst for the 30in drop.
From the perspective of the configuration parameters of the prototypes, designed to
satisfy a fractional factorial DOE in future studies, we see that while the bladders with the
smaller of the internal tube diameters, Bladder 2 and 3, showed the overall lowest peak
pelvic DRI at ARL, if the difference in Input-to-Output DRIs are considered, while
Bladder 2 still remains the winner. Bladder 4, ranked last by peak-DRI, ranks second in
performance if the DRI-difference is used instead.
It is the opinion of this study that the usage and analysis of spinal loading is
underemphasized in several current standards. While two separate blasts events can
produce nearly identical pelvic DRI, the reduction in pelvic acceleration, and the
extremely important spinal load is drastic. Figures 9.17-9.19 show this fact using the 25in
drop height, because it is the largest drop-event in which the baseline/dummy was used
without a bladder.
Figure 9.17 Comparing Baseline and Bladder 4 Spine Load – 25in Drop Height
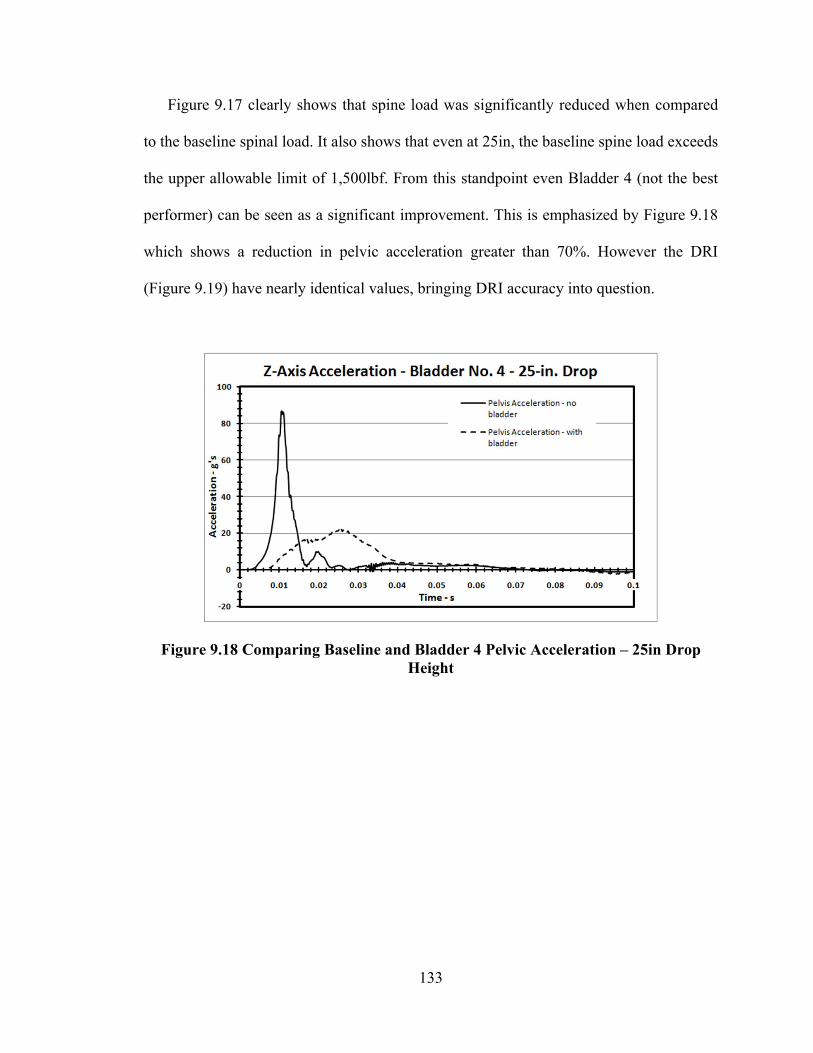
133
Figure 9.17 clearly shows that spine load was significantly reduced when compared
to the baseline spinal load. It also shows that even at 25in, the baseline spine load exceeds
the upper allowable limit of 1,500lbf. From this standpoint even Bladder 4 (not the best
performer) can be seen as a significant improvement. This is emphasized by Figure 9.18
which shows a reduction in pelvic acceleration greater than 70%. However the DRI
(Figure 9.19) have nearly identical values, bringing DRI accuracy into question.
Figure 9.18 Comparing Baseline and Bladder 4 Pelvic Acceleration – 25in Drop Height

134
Figure 9.19 Comparing Baseline and Bladder 4 DRI – 25in Drop Height
Future models predicting an anthropomorphic-dummy response to a given seat-pad
input would make comparison and analysis more direct, especially when data from
multiple tests sites is available. However, given the available data, and the
characterization tests performed it is suggested that for shock excitation events,
decreasing the internal-tube/orifice diameter linking the seat bottom and seat back
together creates an increase in damping. With that primary goal met, the seated occupant
reaches his peak velocity more gradually, decreasing peak-DRI, and peak spinal load.
From the current configurations, the bladders with the smaller, 0.25in internal-tube
diameters, Bladders 2 and 3 are recommended for shock and blast events.
Given the current data and the overall performance of the bladders across both shock
excitation testing series and their performances against two random and impulsive
vibration profiles, Bladder 2 is considered to be the best performing bladder.

135
While this decision is given with respect to the current configurations, it should be
remembered that the parameters chosen for each bladder configuration, satisfied a
fractional-factorial taguchi test matrix, for a future design of experiment analyses. Doing
so, with the large amount of available data compiled and analyzed by this work will help
guide future iterations of research. And an understanding of the effects of individual
parameters can allow tailoring of individual pneumatic air-bladders to specific vibration
and shock environments.

136
CHAPTER 10
CONCLUSIONS AND RECCOMENDATIONS
The result of the extensive experimental testing, characterization and analyses of the
pneumatic-seat bladder system has provided validation or previously untested theoretical
work and valuable information for future work into application shock or vibration events.
The experimental focus of this work can be separated into five equally important,
while principally independent categories: creation of four prototype bladder
configurations, dynamic pressure consideration, vibration transmissibility, ARL shock
testing, and shock testing conducted at UNLV.
This chapter will succinctly discuss the important aforementioned data and analyses
including important trends occurring from design decisions. Recommendations and
conclusions will be provided based on performance and internal design parameters of
individual bladders. It will also make recommendations for the usage of current bladder
configurations appropriate for immediate implementation and recommendations for
future work.
10.1 Pneumatic Seat Cushion Overview
The air bladder system’s properties and key features can be summarized as follows:
Self contained shock and vibration attenuation system. Consists of two
interconnected foam-air bladders making up the seat-bottom and seat-back.
Easily deployable to any location or vibration application.
Can be added as an addition to essentially any existing seat system.

137
Does not contain any permanently-deforming energy absorbing device. Mitigation
takes place internally within the air-bladder compartments. Bladder will return to
original shape under most conditions.
Deals with shock and vibration environments, where other shock mitigation
systems are not also adept at simultaneously dealing with non-impulsive
vibration.
Major strength is that it is ideal for situations with multiple shock events because
no permanent deformation takes place. This includes blast events with slam down,
which is not easily dealt with current EA systems.
10.2 Previous Work
The design of the bladder and the previous work included:
Designed the concept of the interconnected pneumatic seat bladder system.
Limited to a single cushion configuration and data validation of the numerical
model was only performed with a limited number of drop tests.
Numerical agreement was only high for peak acceleration values at certain drop
heights.
Pressure information into the numerical model was done only quasi-statically.
Numerical model was two-dimensional, five-degree-of-freedom, mass-spring-
damper model of the upper legs, thighs, pelvis/lower-torso and upper torso coupled to
seat shock isolation system.
The model was robust and provides a strong construct for future work and
modification based on this study’s experimental results, analyses, and insights.

138
10.3 Overview of Current Work
Four prototype bladders were constructed to fulfill future needs of a fractional
taguchi test matrix. The bladder configurations can be reviewed in Table 9.1.
Two vibration signals were used to test the vibration transmissibility of the
bladder systems.
o The Warrior Signal: A 20s real ride signal obtained from the seat-pan of
the Warrior British military vehicle. This signal contains large amounts of
energy in the lower frequency bands, and little at median and high
frequencies.
o The Constant rms-Velocity Signal: A random vibration signal designed to
have a constant rms-velocity in each of the 1/3-octave bands.
o A 1-D passive anthropomorphic dummy weighing 120lbs was used in this
battery of tests.
Shock testing was performed at both UNLV and ARL.
o The tests conducted at ARL used an instrumented THOR III
anthropomorphic dummy weighing 170lb.
o The drop testing conducted at UNLV was performed on a lightweight drop
tower designed and built on the premises.
o The tests conducted at UNLV used a 150lb sandbag dummy with the
weight distributed to better mimic an anthropomorphic dummy.
During the UNLV series of drop tests pressure measurements were taken from
both the seat-bottom and the seat-back.

139
10.4 Summary of Current Data and Results
Chapter 9 provided an in-depth discussion of the individual portions of the data,
trends, and conclusions as to bladder configuration preferences.
Bladder Parameters
Bladder 1 [0.375in Internal Tube Diameter, 1lb Density Foam]
Bladder 2 [0.250in Internal Tube Diameter, 1lb Density Foam]
Bladder 3 [0.250in Internal Tube Diameter, 2lb Density Foam]
Bladder 4 [0.375in Internal Tube Diameter, 2lb Density Foam]
Table 10.1 Review of Bladder Configuration Parameters
Quasi-static pressure testing showed peak pressures of only 2.5psi in the seat
bottom. However dynamic pressure testing revealed that the pressure in the seat-
bottom from 3psi at the lowest drop height to 7.73psi.
o If the bladders are ranked by the amount of force delivered to the seated
occupant, based on pressure in the seat-bottom, then Bladder 3 was the
clear winner at all drop heights.
o Bladder 2, which also had the smaller of the internal-tube diameters,
performed the worst in this testing.
While both random vibration signals delivered similar weighted acceleration and
vibration dosage levels, the bladders were more effective at attenuating higher
frequency energies.
o Bladder 2 had the overall greatest reduction in rms weighted acceleration
and VDV when both input signals are taken into account.
o Bladder 3 had the worst performance.

140
o The less-stiff Bladder 1 performed near that of Bladder 2 and performed
better under the Warrior Signal.
ARL drop testing with the THOR III dummy showed that Bladder 2 had the best
performance, if only peak DRI was to be considered.
o Bladder 2 also showed the greatest peak spine load reduction.
The UNLV testing utilized a non-simple shock, resembling real blasts more so
than a simple pulse would, providing added variety to the testing.
o Because the UNLV drop tests lacked an instrumented ATD, direct
comparison between UNLV and ARL testing is difficult.
o Seat-pad acceleration data is difficult to draw conclusions with. No clear
trends are apparent when attempting to relate seat-pad DRI or differences
in DRI to pelvic-DRI.
o However, by UNLV data alone, Bladder 3 showed the overall greatest
reductions in seat-pad accelerations and relative DRIs.
10.5 Conclusions
Performance and ranking of bladders were expected to differ depending on the
application, whether shock or lower level random-vibration.
The internal tube diameter, connecting the seat-bottom to the seat-back, was
expected to have the greatest influence on performance, with foam density being
the next most influential factor.
For non-shock vibration events, the lower density foam pads outperformed the
rest. While the stiffest bladder configuration, Bladder 3, performed the worst. The

141
implication is that the reduced stiffness was advantageous for this application.
The effect of orifice-diameter is still unclear because Bladder 1 and Bladder 2
each out-performed the other in one of the input signals.
The dynamic pressure results show entirely the opposite result of the vibration-
transmissibility. Bladder 3, the stiffest of the configurations produced the lowest
pressure peak, where Bladder 2 produced the highest peaks. The effects of
internal pressure seem to be closely linked to seat-pad DRI and input-to-seat pad
DRI differences.
Shock testing at both locations provided a wealth of information, particularly
DRIs summarized in Table 9.18. However, without an instrumented
anthropomorphic dummy, conclusions on pelvic accelerations and spinal loads are
difficult. However based on the available data from both centers Bladders 2 and 3
are considered to be the top performers.
o The two bladders share the common smaller internal orifice diameter. The
smaller orifice was originally chosen to increase the internal damping by
slowing the flow of air into the seat back, slowing the overall decent of the
occupant and reducing the transmitted load.
The leading performer in essentially all tests was a bladder configuration with the
smaller orifice-tube diameters: Bladder 2 and Bladder 3.

142
10.6 Future Work
The drop tests conducted at UNLV would benefit most from the availability of an
instrumented human dummy. It is suggested that both simple shocks, such as
those produced at ARL, and non-classical blasts as seen at UNLV be used.
While an ATD is considered more beneficial, a commercial drop tower with
readily available pulse programmers would provide more consistent shock events
and provide a greater variety of potential inputs.
Rather than relying solely on DRI, other metrics relating input accelerations,
velocities, and spinal load profiles to injury potential are hoped to be discussed in
future works.
Using the wealth of experimental data in this work, modifications and
enhancements of the previously developed numerical model is to be performed.
o A further advancement of this model by experimental validation will allow
for future bladder systems to be tailored to their vibration environment.
10.7 Final Thoughts
The work conducted in this study is the result and proof of concept for the pneumatic
seat-bladder system. While there are many avenues for future work and enhancement this
phase has created and tested 4 prototype variations of the system and shown that it is
effective at reducing random and impulsive vibration events. In some cases the same
bladder is capable of performing well in both environments. The bladder systems benefit
from being easily deployable or used as an addition to other current seat systems. It has

143
the advantage of not relying on permanently deforming EAs, providing continuous
protection against repetitive impulses, a feature lacked by most seat systems.
At the time of this writing, the work conducted here has earned further funding by the
Army Air Medical Research Lab for implementation of this technology in military
stretcher systems exposed to a variety of shock and vibration events.

144
APPENDIX A
SUPPLEMENTAL PLOTS
A.1 Supplemental ARL Drop Test Plots
Figure A.1 Table Input Accelerations for 10 in. Drop Height-ARL
Figure A.2 Seat Pad Accelerations for 10 in Drop Height-ARL

145
Figure A.3 Pelvic Accelerations for 10 in. Drop Height-ARL
Figure A.4 Table Input Accelerations for 20 in. Drop Height-ARL

146
Figure A.5 Seat Pad Accelerations for 20 in. Drop Height-ARL
Figure A.6 Pelvic Accelerations for 20 in. Drop Height-ARL
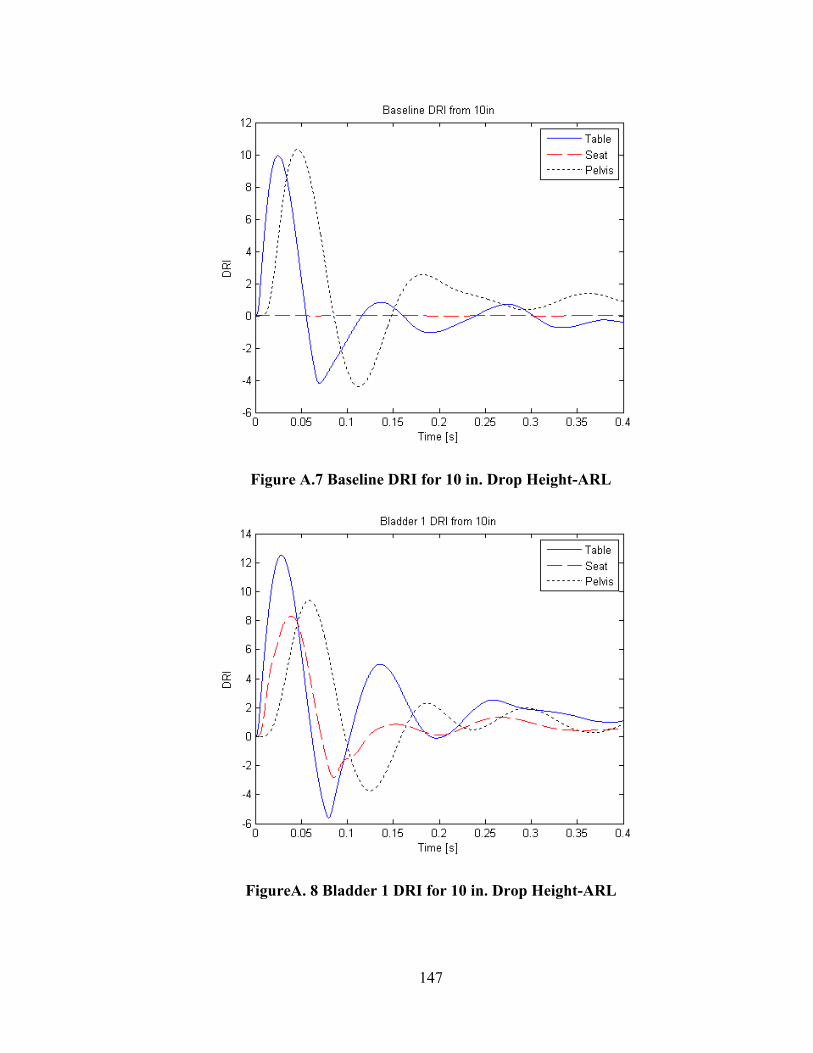
147
Figure A.7 Baseline DRI for 10 in. Drop Height-ARL
FigureA. 8 Bladder 1 DRI for 10 in. Drop Height-ARL

148
Figure A.9 Bladder 2 DRI for 10 in. Drop Height-ARL
Figure A.10 Bladder 3 DRI for 10 in. Drop Height-ARL

149
Figure A.11 Bladder 4 DRI for 10 in. Drop Height-ARL
Figure A.12 Baseline DRI for 20 in. Drop Height-ARL

150
Figure A.13 Bladder 1 DRI for 20 in. Drop Height-ARL
Figure A.14 Bladder 2 DRI for 20 in. Drop Height-ARL

151
Figure A.15 Bladder 3 DRI for 20 in. Drop Height-ARL
Figure A.16 Bladder 4 DRI for 20 in. Drop Height-ARL

152
A.2 Supplemental UNLV Drop Test Plots
Figure 17 Baseline DRI for 10 in. Drop Height-UNLV
Figure A.18 Bladder 1 DRI for 10 in. Drop Height-UNLV

153
Figure A.19 Bladder 2 DRI for 10 in. Drop Height-UNLV
Figure A.20 Bladder 3 DRI for 10 in. Drop Height-UNLV

154
Figure A.21 Bladder 4 DRI for 10 in. Drop Height-UNLV
Figure A.22 Baseline DRI for 20in Drop Height-UNLV

155
Figure A.23 Bladder 1 Baseline DRI for 20in Drop Height-UNLV
Figure A.24 Bladder 2 Baseline DRI for 20in Drop Height-UNLV

156
Figure A.25 Bladder 3 DRI for 20in Drop Height-UNLV
Figure A.26 Bladder 4 DRI for 20in Drop Height-UNLV

157
REFERENCES
[1] Lafrance, L.P., “Mine Blast Protection System for Military Support Vehicles”,American Society of Mechanical Engineers PVP, Vol. 361, c1998, pg 305-309
[2] Axelsson, H. and Odd S., January 2003. “Mine Clearance Vehicles, Crew Safety Standard.” The Swedish Defense Material Administration, Test Range Karlsborg 8.
[3] ISO 2631-1:1997, “Mechanical Vibration and Shock-Evaluation of human exposure to whole-body vibration-Part 1:General Requirements,” ISO, 1997.
[4] ISO 2631-5: 2004, “Mechanical Vibration and Shock-Evaluation of human exposure to whole-body vibration-Part 5: Method for evaluation of vibration containing multiple shocks,” ISO, 2004.
[5] Durocher, Robert, Jowz Valley Mine Strike Preliminary Technical Report,Defense research and Development Center, Canada – Valcartier c2003
[6] Coltman, J.W., C. Van Ingen, N.B. Johnson, and R.E. Zimmermann, December 1989. “Aircraft Crash Survival Design Guide Volume II-Aircraft Design Crash Impact Conditions and Human Tolerance.
[7] Aircraft Crash Survival Design Guide Final Report Volume IV, Aircraft Seats, Restraints, Litters, and Cockpit/cabin Delethalization, USAAVSCOM TR 89-D-22D, Simula Inc., c1989.
[8] Moore H., Testerman R., “Effects of Structural and Occupant Provision Improvements to the Static and Dynamic Response of the V-22 Osprey Energy Attenuating Troop Seating System”, Proceedings of 61st Annual Forum of the American Helicopter Society, 2005.
[9] Wolf, E. “Development of Seat Shock Isolation Systems,” UNLV Dissertation, 2007.
[10] Perry C., Nguyen T., Pint S., “Evaluation of Proposed Seat Cushions to VerticalImpact”, Proceedings of Annual Symposium, SAFE Association, 2000, p 50-55.
[11] HFM-090 Task Group 25 , “Test Methodology for Protection of VehicleOccupants against Anti-Vehicular Landmine Effects,” NATO, 2007.
[12] Cheng, Z.Q., Pilkey, W.D., Balandin, D.V., Bolotnik, N.N., Crandall, J.R., and Shaw, C.G., 2001. “Optimal Control of Helicopter Seat Cushions for the Reduction of Spinal Injuries.” International Journal of Crashworthiness. Volume 6.3.
[13] BS 6841, “Guide to measurement and evaluation of human exposure to whole-body mechanical vibration and repeated shock,” British Standards, 1987.

158
[14] Hirsch, A.H., January 1964. “Man’s Response to Shock Motions.” Report 1797.David Taylor Model Basin, Structural Mechanics Laboratory, Washington D.C.
[15] Axelsson, H. and Odd S., January 2003. “Mine Clearance Vehicles, Crew Safety Standard.” The Swedish Defense Material Administration, Test Range Karlsborg 8.
[16] Stech, E.L. and Payne, P.R., November 1969. “Dynamic Models of the Human Body.” AMRLTR-66-157, Wright-Patterson AFB, Ohio.
[17] Department of Army, “Occupant Crash Protection Handbook For Tactical Ground Vehicles (Light, Medium, and Heavy Duty).”, November 2000.
[18] Eiband, M.A., “Human Tolerance to Rapidly Applied Accelerations: A Summary of the Literature,” NASA Memo 5-19-59E, 1959.
[19] Alem, N.M., 2004. Personal Correspondence. Aircrew Protection Division, U.S. Army Aeromedical Research Laboratory, Fort Rucker, Alabama.
[20] Payne, P. R.; Stech, E. L. Dynamic Models of the Human Body; AMRL-TR-66-157; Aerospace Medical Research Laboratory: Wright-Patterson Air Force Base, OH, 1969.
[21] Brinkley, J.W.; Shaffer, J.T. Dynamic Simulation Techniques for the Design of Escape Systems; AMRL-TR-71-292; Aerospace Medical Research Laboratory: Wright-Patterson Air Force Base, OH, 1971.
[22] McAndrew, B. “Shock Isolation Parameters Based on a Damped Harmonic Oscillator Model for Mine Blast Protected Seating,” ARL-TR-436, Army Research Lab, 2007.
[23] ISO 10819: 1996, “Mechanical Vibration and Shock- and-arm vibration -- Method for the measurement and evaluation of the vibration transmissibility of gloves at the palm of the hand,” ISO, 1996.
[24] Toward, M, Griffin, M, “HVLab Passive Anthropodynamic Dummy Manual,” Institute of sound and Vibration Research, University of Southhampton, 2004.

159
VITA
Graduate CollegeUniversity of Nevada, Las Vegas
George Samaan Ladkany
Degrees:Bachelor of Science in Engineering, 2006University of Nevada, Las Vegas
Special Honors and Awards: Summa Cum Laude
Departmental Honors Scholar
Graebel Mechanical Engineering Student of the Year Award 2005
Publications:G. Ladkany and M. B. Trabia, “Incorporating Twinkling in Genetic Algorithms for Global Optimization,” 34th Design Automation Conference, New York, New York, August 2008.
Theis Title: Design and Characterization of a Shock and Vibration Mitigation Seat System
Thesis Examination Committee:Chairperson, Dr. Douglas Reynolds, Ph.D.Committee Member, Dr. Brian. Landsberger, Ph.D.Committee Member, Dr. William Culbreth, Ph.D.Graduate Faculty Representative, Dr. Edward Neumann, Ph.D.