Embed Size (px)
Citation preview

Scholars' Mine Scholars' Mine
Masters Theses Student Theses and Dissertations
Spring 2011
Design and development of manufacturing methods for Design and development of manufacturing methods for
manufacturing of PEM fuel cell MEA's manufacturing of PEM fuel cell MEA's
Nikhil Pramod Kulkarni
Follow this and additional works at: https://scholarsmine.mst.edu/masters_theses
Part of the Mechanical Engineering Commons
Department: Department:
Recommended Citation Recommended Citation Kulkarni, Nikhil Pramod, "Design and development of manufacturing methods for manufacturing of PEM fuel cell MEA's" (2011). Masters Theses. 6790. https://scholarsmine.mst.edu/masters_theses/6790
This thesis is brought to you by Scholars' Mine, a service of the Missouri S&T Library and Learning Resources. This work is protected by U. S. Copyright Law. Unauthorized use including reproduction for redistribution requires the permission of the copyright holder. For more information, please contact [email protected].


DESIGN AND DEVELOPMENT OF MANUFACTURING METHODS FOR
MANUFACTURING OF PEM FUEL CELL MEA‘S
by
NIKHIL PRAMOD KULKARNI
A THESIS
Presented to the Faculty of the Graduate School of the
MISSOURI UNIVERSITY OF SCIENCE AND TECHNOLOGY
In Partial Fulfillment of the Requirements for the Degree
MASTER OF SCIENCE IN MECHANICAL ENGINEERING
2011
Approved by
Frank W. Liou
Joseph W. Newkirk
K. Chandrashekhara

ii
2011
Nikhil Pramod Kulkarni
All Rights Reserved

iii
PUBLICATION THESIS OPTION
This thesis is presented in publication format and is divided into two separate
papers. Pages 2 through 34 are published at the 2009 International Solid Freeform
Fabrication Conference for publication in the symposium proceedings under the title,
―Fuel Cell Development using Additive Manufacturing Technologies - A Review‖.
Pages 35 through 66 are to be submitted for publication in the Journal of Sustainable
manufacturing and renewable energy, under the title, ―Comparison of Direct Deposition
Process and Electro-write Process for Proton Exchange Membrane Fuel cell MEA
manufacturing‖.

iv
ABSTRACT
This thesis focuses on design and manufacturing of Fuel cell components using
Additive Manufacturing techniques and then in the later part on design and
manufacturing of Membrane Electrode Assembly (MEA) which is a very important
component in fuel cells. Additive manufacturing methods are fast and efficient
manufacturing methods which are additive building up components layer by layer instead
of conventional subtractive manufacturing techniques. This ensures low cost and faster
manufacturing. Additive manufacturing is important for fuel cell component
manufacturing since it is important in fuel cells to minimize wastage and reduce the cost.
MEA is the basis of the cost factor in Proton Exchange Membrane (PEM) fuel cells. It
contributes for more than 50% of the cost in a fuel cell. In order to reduce the cost of a
fuel cell/kW, it is necessary to achieve the maximum performance of the fuel cell using
least amount of the platinum catalyst. The best way to achieve that is to achieve a
uniform loading of the catalyst through the entire area of the MEA. Along with this, it is
important to have an efficient and at the same time a fast manufacturing method for
MEA‘s. This thesis discusses two methods, namely Direct Deposition Process (DDP) and
Electro-Write Process (EWP) and compares the efficiencies of the two using a novel way
employing Scanning Electron Microscopy (SEM) and Energy Dispersive X-ray
Spectroscopy (EDS) techniques. This thesis also focuses on the importance of cost model
and efficiency measurement techniques for monitoring a manufacturing method in order
to know the impact of every manufacturing method of individual components on the total
cost of the product.

v
ACKNOWLEDGMENTS
I am greatly indebted to my advisor, Dr. F.W. Liou, whose encouragement,
guidance, and support helped me throughout my research and writing of my thesis. He
provided expertise, inspiration and support for this research without which my studies
would not have taken place.
I would like to thank Dr. J.W. Newkirk for giving me the required guidance in my
research, suggesting me novel techniques to carry out tasks and Dr. K. Chandrashekhara
for serving as committee members and examining the thesis. I would sincerely like to
thank all the members of the LAMP lab, especially Todd Sparks for helping me during
the experiments and providing me with valuable suggestions which have been very
critical in completeing my research work. My sincere appreciation to Miss Shruti
Mahadik from the Chemistry department for the help she extended to me for nanoparticle
measurements. I would also like to thank my friends here in Rolla, who have made the
past two years memorable.
The financial assistance provided to me in the form of Graduate Research
Assistantship and Graduate Teaching Assistantship through the Intelligent Systems
Center and Department of Mechanical and Aerospace Engineering are gratefully
acknowledged.
Finally, I would like to thank my family, most especially, my parents Gauri and
Pramod Kulkarni, my brother Aditya Kulkarni for their help, encouragement and
motivation throughout my life without which I would not have accomplished this task. I
would like to dedicate this thesis to my parents.
vi
TABLE OF CONTENTS
Page
PUBLICATION THESIS OPTION ............................................................................. iii
ABSTRACT .................................................................................................................. iv
ACKNOWLEDGEMENTS ........................................................................................... v
LIST OF ILLUSTRATIONS ........................................................................................ ix
LIST OF TABLES ........................................................................................................ xi
SECTION
1. INTRODUCTION .................................................................................................. 1
PAPER
I. FUEL CELL DEVELOPMENT USING ADDITIVE MANUFACTURING
TECHNIQUES- A REVIEW ...................................................................................... 2
ABSTRACT ................................................................................................................. 2
1. INTRODUCTION ................................................................................................... 3
2. FDM (FUSED DEPOSITION MODELING) ......................................................... 8
2.1. DESIGN AND CHARACTERISTICS OF A PLANAR ARRAY PEMFC .. 12
2.2. PERFORMANCE TEST IN PARALLEL CONNECTION .......................... 12
2.3. PERFORMANCE TEST IN SERIES CONNECTION ................................. 13
3. 3D INKJET PRINTING ........................................................................................ 15
3.1. 3D INKJET PRINTING AS COMPARED TO OTHER PRINTING
TECHNIQUES ................................................................................................. 16
3.2. SETUP USED FOR THE EXPERIMENT .................................................... 18
3.3. RESULTS AND DISCUSSION .................................................................... 18
3.4. PERFORMANCE OF SINGLE CELLS ....................................................... 22

vii
4. SELECTIVE LASER SINTERING ...................................................................... 26
4.1. MATERIAL SELECTION FOR BIPOLAR PLATE .................................... 26
4.2. SETUP AND PROCEDURE FOR THE EXPERIMENT ............................. 27
4.3. RESULTS AND DISCUSSION .................................................................... 30
5. CONCLUSIONS ................................................................................................... 32
6. ACKNOWLEDGEMENTS .................................................................................. 32
7. REFERENCES ...................................................................................................... 33
II. COMPARISON OF DIRECT DEPOSITION PROCESS AND ELECTRO-WRITE
PROCESS FOR PROTON EXCHANGE MEMBRANE FUEL CELL MEA
MANUFACTURING ................................................................................................ 35
ABSTRACT .............................................................................................................. 35
1. INTRODUCTION ................................................................................................. 36
2. EXPERIMENTAL WORK ................................................................................... 38
2.1. CATALYST INK PREPARATION .............................................................. 39
2.2. FLOWCHART FOR PREPARING THE MEA ............................................ 40
3. ELECTROSPRAY PROCESS MODEL............................................................... 41
3.1. ELECTROSPRAYING PROCESS COST MODEL ..................................... 43
3.2. EXPERIMENT CONCLUSION ................................................................... 47
4. ANALYSIS OF EXPERIMENTS ......................................................................... 48
4.1. EFFICIENCY CALCULATION FLOWCHART ......................................... 49
4.2. DDP EFFICIENCY CALCULATION .......................................................... 50
4.3. EWP EFFICIENCY CALCULATION.......................................................... 54
4.4. PROCESS COMPARISON OBSERVATIONS............................................ 56
4.5. VERTICAL VARIATION IN EWP .............................................................. 58
4.6. HORIZONTAL VARIATION IN EWP ........................................................ 61

viii
5. CONCLUSIONS ................................................................................................... 65
6. ACKNOWLEDGEMENTS .................................................................................. 65
7. REFERENCES ...................................................................................................... 66
SECTION
2. CONCLUSION .................................................................................................... 67
VITA ........................................................................................................................ 68

ix
LIST OF ILLUSTRATIONS
Paper I
Figure Page
1. Process of FDM .......................................................................................................... 9
2. Construction of the stack .......................................................................................... 10
3. Layout of the stack ................................................................................................... 10
4. Comparison of forced and natural convection in a parallel connection ................... 12
5. Comparison of forced and natural convection in a series connection ...................... 13
6. Sample catalyst layers printed using inkjet printing ................................................ 16
7. Time illustration of inkjet printing compared to hand painting ............................... 17
8. Catalyst layer on cellulose acetate substrate ............................................................ 19
9. Catalyst layer on Nafion® ........................................................................................ 19
10. Optical micrographs of printed layers taken at 15x magnification ........................ 20
11. TEM image of printed catalyst layers before processing ....................................... 21
12. TEM image of printed catalyst layers after hot pressing ........................................ 21
13. Graph comparing printed MEA with processed MEA‘s ........................................ 22
14. Power curves comparing a commercial MEA with printed MEA‘s ...................... 23
15. Graded catalyst layer .............................................................................................. 25
16. Performance comparison of a standard uniform catalyst & graded catalyst .......... 25
17. Improvement in electrical conductivity with each step .......................................... 31

x
Paper II
1. Flowchart for MEA manufacturing .......................................................................... 40
2. Horizontal electrospray apparatus ............................................................................ 42
3. Tool path for horizontal electrospray process .......................................................... 43
4. XYZ platform used for both the DDP and EWP ...................................................... 48
5. Efficiency calculation flowchart for DDP and EWP ................................................ 49
6. Efficiency calculation procedure for DDP and EWP ............................................... 51
7. SEM image of the GDE manufactured using the DDP ............................................ 53
8. SEM image of the GDE manufactured using the EWP ............................................ 55
9. Horizontal and vertical variation study for the EWP ............................................... 58
10. (a) Catalyst particles in top section, (b) middle section and (c) bottom section
with EWP .................................................................................................................. 59
11. Vertical variation of number of particles as a function of trackwidth .................... 60
12. Ink path section for horizontal variation analysis .................................................. 61
13. (a) Catalyst particles in top section, (b) middle section and (c) bottom section
with EWP .................................................................................................................. 62
14. Horizontal variation of number of particles as a function of track width .............. 63
15. Additional path for catalyst ink deposition in the EWP ......................................... 64

xi
LIST OF TABLES
Paper I
Table Page
1. Contribution of the components to the entire cost of the fuel cells ............................ 4
2. Comparison of different methods for fabricating the flow field geometry ............ 11
3. Performance characteristics in a parallel connection ............................................. 13
4. Performance characteristics in a series connection ................................................ 14
5. Usual properties for home/office printer inks .......................................................... 17
6. Catalyst ink characteristics ....................................................................................... 18
7. Specifications of the MEA ....................................................................................... 22
8. Comparison of the improved MEA with the commercial MEA .............................. 24
9. Key process parameters for SLS process ................................................................. 28
10. Temperature rise and the ramp rates ...................................................................... 29
11. Properties of the SLS bipolar plates ....................................................................... 30
12. Enhancement in electrical conductivity ................................................................. 31
Paper II
1. Optimum parameters for electrospray process ......................................................... 42
2. Catalyst ink component cost ..................................................................................... 44
3. Catalyst ink preparation cost .................................................................................... 44
4. MEA component cost ............................................................................................... 44
5. Electropsray apparatus cost ...................................................................................... 45
6. Hot pressing cost ...................................................................................................... 46
7. Total cost of MEA manufacturing ............................................................................ 46
1. INTRODUCTION
The development of Proton Exchange Membrane Fuel cells has been taking place
since many decades but it has not been able to generate significant interest for portable
fuel cell applications due to varioius reasons such as cost, ease of manufacturing etc.
Additive manufacturing is an exciting new arena in the field of manufacturing
which intends to reduce time of manufacturing and cost due to its fundamental principle
which is to build equipments by addition of materials in place of conventional subtractive
manufacturing which leads to a lot of material wastage and hence higher costs. The
number of materials which can be employed with Additive manufacturing is also
increasing by the day, hence opening up a wide number of applications for it.
The first section presents a study of additive manufacturing processes which can
be used for fuel cell manufacturing. The second section is a comparison of two such
processes, namely Direct Deposition process and Electro-write process followed by the
in-depth study of the process which is more efficient. This is very important since, in fuel
cell manufacturing it is very important to reduce the manufacturing cost to reduce the
cost of the product.
The second section also gives a very simple method of determining the efficiency
of the processes using the SEM and the EDS techniques.

2
PAPER
I. FUEL CELL DEVELOPMENT USING ADDITIVE
MANUFACTURING TECHNIQUES - A REVIEW
N. P. Kulkarni, G. Tandra, F. W. Liou, T. E. Sparks, J. Ruan
Department of Mechanical and Aerospace Engineering, Missouri University
of Science and Technology, Rolla, MO 65401 USA
ABSTRACT
Fuel cells are being perceived as the future clean energy source by many
developed countries in the world. The key today for clean power is the reliance of fuel
cells not only to power automobiles but also for residential, small commercial, backup
power etc. which calls for production on a large scale. Additive manufacturing is
perceived as a way to develop cost effective fuel cells. It imparts flexibility to design
different kinds of fuel cells along with reduction in material wastage. This paper deals
with the review of additive manufacturing processes for research and development of fuel
cell components, such as synthesizing and prototyping new materials for fuel cell
components, fuel cell system design and prototyping, designing well sealed fuel cells,
bridging from fuel cell design to manufacturing tooling, etc.

3
1. INTRODUCTION
Fuel cells are electrochemical devices similar to batteries which convert energy
from chemical state to electricity. There is an anode side and a cathode side in it. Fuel
enters the cell from the anode side and oxidant flows into it from the cathode side. The
reactants react inside the cell and the reaction products or the waste products flow out of
it. The basic difference between batteries and a fuel cell is that fuel cell is only an energy
conversion device and not energy storage device. Fuel cells consume reactant (fuel) from
an external source which must be replenished. Hence, fuel cells represent a
thermodynamically open system. However, batteries are both energy storage and
conversion devices and hence they represent a thermodynamically closed system. The
advantage of separating the storage and conversion functions is that power and energy
capacity can be sized independently of each other. Also, many different fuels can be used
as the primary energy source of the fuel cell setup depending on the types of fuels
compatible with the type of fuel cell being employed [Spiegel 2006].
This paper primarily discusses Proton Exchange Membrane (PEM) fuel cells
because most of the research regarding fuel cells has been undertaken with regards to
PEM fuel cells, due to its many advantages such as versatility. PEM fuel cells can be
employed for various uses starting from portable power to automotive power to stationary
residential power. The by-product of a PEM fuel cell is water, which is not only non-
polluting but can be used as a potable water supply.

4
In the PEM fuel cell, hydrogen is the fuel which enters the fuel cell through the
anode end and oxygen through the cathode end. The following reactions take place at the
cathode and the anode
Anode: H2 (g) 2H +
(aq) + 2e-
Cathode: 1/2 O2 (g) + 2H+ (aq) + 2e
- H2O (l)
Overall Reaction: H2 (g) + 1/2 O2 (g) H2O (l)
The components in a fuel cell are:
1. Bipolar Plates.
2. Membrane Electrolyte Assemblies (MEA‘s).
3. Gas diffusion electrode layers.
Apart from this there are various auxiliary components such as gas flow pipes, the
gaskets(seals), the connectors, end plates and cooling plates(required in fuel cell stack).
The cost of these auxiliary components is relatively insignificant as compared to the cost
of the major components. The percentage cost of components is illustrated in Table 1.
Table 1 Contribution of the components to the entire cost of the fuel cells [DOE 2005]
Cell Stack
Membrane 35~40 %
Catalyst 15~20 %
Bipolar plates 10~15 %
MEA‘s 30~35 %
MEA is the heart of the fuel cell; rather it is the distinguishing criteria for
different types of fuel cells. An MEA, as the name suggests, is the assembly of the

5
membrane and two electrodes on either side of the membrane. An electrode is a carbon
cloth which is fabricated in a particular pattern depending on the mesh size required.
Also, it needs to have specific properties to facilitate proper water management
throughout the cell.
As for the membrane, it is the electrolyte which is being employed for that
particular fuel cell. The most common electrolyte used for a PEM fuel cell has been
Nafion®
. Nafion®
is a generic brand name given by its developer DuPont. Its chemical
name is sulfonated Polytetrafluoroethylene (PTFE). Although Nafion®
is the most
common polymer membrane employed in PEMFC, extensive research is being carried
out to find a cost effective alternative which is as mechanically and chemically stable as
Nafion®
[Payne 2009].
The most common catalyst used for the PEMFC is Platinum due to its stability in
highly corrosive atmospheres as well as its performance characteristics. The methods
used for applying the catalyst are screen printing and hand painting. However, the
uniformity of the catalyst deposited is not easily controlled. Also, these processes are
time consuming, and require iterations of painting, drying and massing to achieve the
required loading of the catalyst. The reproducibility of these methods is poor. There is
considerable amount of catalyst wasted in the feed lines due to clogging which results in
an increase in the production cost [Taylor 2007].
The aforementioned commercial methods of producing major components of fuel
cells are not in accordance with the economic threshold value as required by the US
Department of Energy. These processes combine costly materials and processes that
result in increased costs of fabrication of fuel cells.

6
To achieve the target of production cost of $30/kw by 2015 as set by the US DOE
[DOE 2005], there is a need to achieve low cost fabrication of fuel cells and use alternate
cheaper materials in the manufacturing processes. Based on the Results of the Workshop
on Manufacturing R&D for the Hydrogen Economy, several challenges confront the
transformation of the U.S. manufacturing sector to support the hydrogen energy economy
such as:
Develop innovative, low-cost manufacturing technologies for new materials and
material applications.
Adapt laboratory fabrication methods to low-cost, high-volume production.
Rapid manufacturing is an innovative manufacturing technique which can be used
for the fabrication of fuel cells which goes hand-in-hand with the aim of US DOE. Rapid
prototyping is defined as a machine technology which is used to fabricate 3-dimensional
models and prototype parts from a numerical description (typically a CAD model) using
an additive approach to form physical models. That is why Rapid prototyping is also
referred to as ‗Additive Manufacturing‘. Additive Manufacturing (AM), as the name
suggests is the process of fabrication of physical models or prototypes by addition of
materials. This addition takes place layer by layer incrementally. By this process, the
problems of form generation and material composition are addressed. The smaller the
incremental volume of material better is the accuracy of the form generated and also the
control over system parameters. AM doesn‘t require any external tooling for the
manufacturing of 3D freeform objects.

7
There are various kinds of Additive Manufacturing techniques such as:
1. Selective Laser Sintering(SLS)
2. Fused Deposition Modeling (FDM)
3. Stereolithography (SLA)
4. 3D printing
5. Laminated object manufacturing (LOM)
6. Electron Beam Melting (EBM)
Variations of these processes also exist but it is not important to be listed above
since a small variation of some system parameters might lead to an entirely different
process. For the manufacturing of PEM fuel cells, more importance has been given to a
few processes such as Fused Deposition Modeling (FDM), 3D Printing and Selective
Laser Sintering (SLS) which are discussed in detail in this paper.
The advantages of AM itself make it an attractive way to build fuel cells. With
additive manufacturing technologies, you have the flexibility to change the design of the
fuel cells without the need to change the entire setup as would be required with regards to
conventional manufacturing technologies. In this paper, there is an example of a planar
array fuel cell with a mono polar plate design. It gives a good proof of the flexibility of
additive manufacturing technology. This feature of AM enhances the prospects of further
cost reduction. Inkjet printing aids the process of precision manufacturing since we can
deposit materials with micrometer precision thereby again reducing material waste.
Impressive results from the three processes as described in this paper maximize the scope
of AM for building fuel cells. It might happen that, under a single roof, we see multiple
AM techniques used to build an entire fuel cell.

8
2. FDM (FUSED DEPOSITION MODELING)
Fused Deposition Modeling is an additive fabrication technology which
constructs superior rapid prototypes from 3D CAD data where in a thermo plastic
material is extruded in the form of beads layer by layer using a temperature controlled
head which is actually controlled by Computer Aided Manufacturing (CAM) software
[Zhong 2000].
A plastic filament supplies material to an extrusion nozzle which is heated so as to
melt the material and deposit the required amount of material in horizontal and vertical
directions(i.e., wherever it is necessary).The material hardens as soon as it is extruded
from the nozzle.
The thermoplastic materials used in the FDM process have good stability and
durability of the mechanical properties over time; they have high heat resistance and also
produce smooth parts with all the finest details intact. The commonly used materials with
this process are Acrylonitrile Butadiene Styrene (ABS) polymer, elastomers, investment
casting wax and some of the water soluble materials are used in this process which acts as
support structures during the manufacturing process [Masood 2004]. In Figure 1, the
schematic of the FDM process is illustrated.

9
Figure 1 Process of FDM
FDM has been used for the fabrication of miniature fuel cell stack in a planar
array form [Chen 2008]. For the development of miniature fuel cells, it is required to
have pin-point precision, since the aim of this type of fuel cell is to have high power
density in a small stack. A study has been made to develop a 10 cell planar array air
breathing fuel cell using FDM as the RP (Rapid Prototyping) process [Chen 2008].
Figure 2 shows the construction of the stack using components manufactured by FDM
process and Figure 3 shows the layout of the 10 cells for the analysis of the
configurations in series and parallel.

10
Figure 2 Construction of the stack [Chen 2008]
Figure 3 Layout of the stack [Chen 2008]

11
The alternative processes for the development of such miniature fuel cell are the
Micro-Electro-Mechanical processes (MEMS) and the conventional CNC machining
processes. The flow field plates were the parts which were fabricated using RP, more
specifically Fused Deposition Modeling (FDM). Acrylonitrile-butadiene-styrene (ABS)
was the material used for the fabrication of flow field plates since it has high mechanical
strength, low cost and easy to fabricate by RP. Table 2 gives a comparison of the
manufacturing time required for the geometry of flow field plates by different processes
[Chen 2008].
Table 2 Comparison of different methods for fabricating the flow field geometry [Chen 2008]
Process Time (approx)
Rapid Prototyping 1 hour
CNC 2hours
MEM‘s 12-36 hours
It is noted that RP is faster than the rest of the methods. Also, if the flow field
plate is designed more and more complicated, CNC machining may not be possible at all.
This kind of miniature PEM planar array FC stack is a first try in both academic as well
as industrial world.
The FDM process used for planar array fuel cell fabrication is described next with
respect to the design and performance of the PEMFC.

12
2.1 DESIGN AND CHARACTERISTICS OF A PLANAR ARRAY PEMFC
There are 10-segments in the PEM. Hence the total reactive area is 17cm2
The cell operating temperature is 70oC internal and ambient
temperature is 25oC.
Two configurations have been tried: Parallel and series with natural and forced
convection
The anode is on the same side of the membrane whereas the cathode is on the
opposite end or the ventilated end. Hence, it is called as a mono-polar stack
design.
In Figures 4 and 5, the performance curves of the cell stack in parallel and series
connection is illustrated, respectively, and Tables 3 & 4 state the performance statistics.
2.2 PERFORMANCE TEST IN PARALLEL CONNECTION
Figure 4. Comparison of forced and natural convection in a parallel connection [Chen 2008]

13
Table 3 Performance characteristics in a parallel connection [Chen 2008]
Table 3
Voltage Current Density Power Density
Free convection 0.425 V 233 mA/cm2 99 mW/ cm
2
Forced Convection 0.425 289 mA/cm2 123 mW/ cm
2
2.3 PERFORMANCE TEST IN SERIES CONNECTION
Figure 5 Comparison of forced and natural convection in a series connection [Chen 2008]

14
Table 4 Performance characteristics in a series connection [Chen 2008]
Voltage Current Density Power Density
Free convection 4.25 V 216 mA/cm2 92 mW/ cm
2
Forced Convection 5.25 V 200 mA/cm2 105 mW/ cm
2
The parallel connection stack had higher power density than the serial connected
stack since some cells performing badly will affect serial connection where parallel
connection won‘t be affected a lot. [Chen 2008]. The performance of the stack reached
power density of the state of the art planar array fuel cells (100-120 mW/cm2) [Chen
2008].Clearly, fuel cell components made by RP (FDM) instead of conventional CNC
machining or more costly MEM processes do deliver performances as required which
does speak about the reliability of the process. So, we infer that RP is a successful
procedure in prototyping the components. In the future, we might even see RP being
applied for larger scale production.

15
3. 3D INKJET PRINTING
3D Inkjet printing (3D IJP) is yet another form of Additive Manufacturing. What
differentiates 3D printing from other forms of additive manufacturing is that it is much
more affordable than other processes existing till date. Inkjet printers are plug and play
devices that require little setup, training or maintenance.
Inkjet printing utilizes drop-on-demand technology to deposit various materials in
a colloidal ink form. Also, there is no contact between the printer head and the substrate
on which it is going to be deposited. There are two types of inkjet printers- one which use
piezoelectric transducers and one which use thermal resistors to expel droplets through
the nozzles. Development of inkjet printers will result in smaller nozzle sizes and hence
ink droplets, which will result in higher resolution (dots per inch) as well as in printing
intricate features, patterns which is advantageous in the development of fuel cell
components.
Inkjet printing can be employed in printing different MEA‘s since the
composition is not very different from each other. Inkjet printing can be considered as an
efficient method used for the deposition of catalyst layers because of the performance it
gives in terms of controlled catalyst deposition for ultra loadings of Platinum which
results in a better utilization of Pt as compared to conventional catalyst deposition
methods like Screen Printing and Hand Painting. Inkjet printing will also help in
optimizing the Pt loading which will result in reduction of costs. The reproducibility
produced in the catalyst printing is incredible and this will in turn lead to lesser cell
failure rates. Figure 6 shows some of the shapes of catalyst layers printed with 3D IJP.

16
Figure 6 Sample catalyst layers printed using inkjet printing [Taylor 2007]
3.1 3D INKJET PRINTING AS COMPARED TO OTHER PRINTING
TECHNIQUES
IJP as compared to other printing techniques proves to be more advantageous as it
allows for a uniform distribution of catalyst material onto the surface of GDL and
provides picolitre precision and control of the deposition of each print and thus paves a
way for ultra low loadings. IJP is also found to be reproducible due to the elimination of
some of the intermediate steps of drying and massing which are two important steps in
Hand painting and screen printing [Taylor 2007]. The comparison of the Hand painting
method which is the conventional method for catalyst layer printing and that of 3D Inkjet
Printing is shown in Figure 7.

17
Figure 7 Time illustration of inkjet printing compared to hand painting [Taylor 2007]
Catalyst inks should be similar to the OEM inks as specified by the manufacturer
so that the printing can be executed smoothly. These properties are specified in table 5.
Table 5 Usual properties for home/office printer inks [Towne 2007]
Property Range
Viscosity 1-4 cP
Surface tension 30-35 mN/m
Average Particle size 0.2 μm

18
3.2 SETUP USED FOR THE EXPERIMENT
Catalyst formation takes place by thoroughly mixing a carbon supported catalyst
with Nafion®
solution and de-ionized water. Water, ethylene glycol and isopropanol are
added to achieve the required properties of surface tension and viscosity. The Nafion®
membrane is prepared by washing in 3% wt H2O2 for 1 hour, rinsed and boiled in de-
ionized water for 1 hour and stored in Milli-Q grade de-ionized water. The printers
considered for this experiment were simply off the shelf printers whose cartridges were
cleaned of the original ink and replaced with the catalyst ink with the help of a syringe.
Illustrator software is used for making different size and shape electrodes and for
different amounts of platinum loading by changing the hue, saturation and luminescence
[Towne 2007].
3.3 RESULTS AND DISCUSSION
The characteristics of the ink prepared by the process stated earlier are tabulated
in Table 6.
Table 6 Catalyst ink characteristics [Towne 2007]
Property Result Within range Comments
Particle size < 2µm No Not within range but the
ink is maintaining
colloidal stability.
Surface Tension 35.5 mN/m No Just a tad out of range.
Viscosity 3.35 cP Yes

19
There were two attempts to print the catalyst layers. One was on a cellulose
acetate substrate and the other was on Nafion®
substrate. These two attempts are shown
in Figures 8 & 9.
Figure 8 Catalyst layer on cellulose acetate Figure 9 Catalyst layer on Nafion®
substrate
In Figure 8, the catalyst layer is seen between the epoxy layer and the substrate
and its thickness is 1.02 μm thick since below the thickness of 580 nm, the resistivity of
the catalyst increases tremendously which is detrimental to our interests. In Figure 9, a
layer thickness up to 3.2 µm was measured. We can observe here that the thickness of the
catalyst layer is not uniform and is very uneven. This happens due to swelling of the
Nafion® membrane.
As expected, the Nafion®
substrate swells due to the water and alcohol in the
catalyst ink. Water alone can lead to swelling of the membrane by 32%. This results in

20
uneven printing. The cross section of the single layer catalyst section as seen in Figure 9
clearly shows the swelling of the membrane.
The next analysis presented in the paper is about the control of the deposition of
the catalyst ink onto the GDL using illumination characteristics such as brightness and
tint. The Figure 10 shows the optical micrographs of the same.
Figure 10 Optical micrographs of printed layers taken at 15x magnification; these images show
evidence of banding in three samples of different thickness [Towne 2007]
The three figures above show 3 single layer inkjet printed catalysts. They have
different amounts of thicknesses (drop amounts). The darker the layer, the thicker it is
and hence well connected. This leads to better conductivity. It is evident from these
images that inkjet printing allows excellent control over the individual layer thicknesses.
Hence, many layers and ultimately thicker electrodes can be deposited.
The earlier images show that it is difficult to print the catalyst layer on a Nafion®
membrane, however, with some post processing, the catalyst layer can be made uniform
as well as well mechanically adhered to the membrane. The usual post processing steps
are hot pressing and water extraction.

21
Hot pressing leads to removal of ethylene glycol and also it leads to more uniform
catalyst formation on the membrane. The Transmission Electron Microscopy (TEM)
images are of the catalyst layers before and after processing are shown in Figures 11 &
12.
Figure 11 TEM image of printed catalyst layers Figure 12 TEM image of printed catalyst
before processing [Towne 2007] layers after hot pressing [Towne 2007]
In Figure11, the arrow represents carbon particles and depicts the discrete nature
of platinum and carbon particles. This definitely affects the interconnectivity and thus the
conductivity. In Figure 12, you cannot make out the separate layers of carbon and
platinum particles, thus showing the continuity. Hot pressing was done at 2045 psi, 125oC
for 5 min.

22
3.4 PERFORMANCE OF SINGLE CELLS
The testing of these catalyst printed membranes was carried out by making a
single cell out of it. MEA‘s had printed layers on both anode and cathode. Only 2.75%
H2 was used for initial studies. The specifications of the MEA are shown in Table 7.
Table 7 Specifications of the MEA [Towne 2007]
Active area of the MEA 2.25 cm2
Platinum loading 0.094 mg/cm2
Drop size 3 pL
In Figure 13, the comparison of unprocessed MEA with MEA‘s processed at
different pressures at 125°C is shown.
Figure 13 Graph comparing printed MEA with processed MEA‘s [Towne 2007]
23
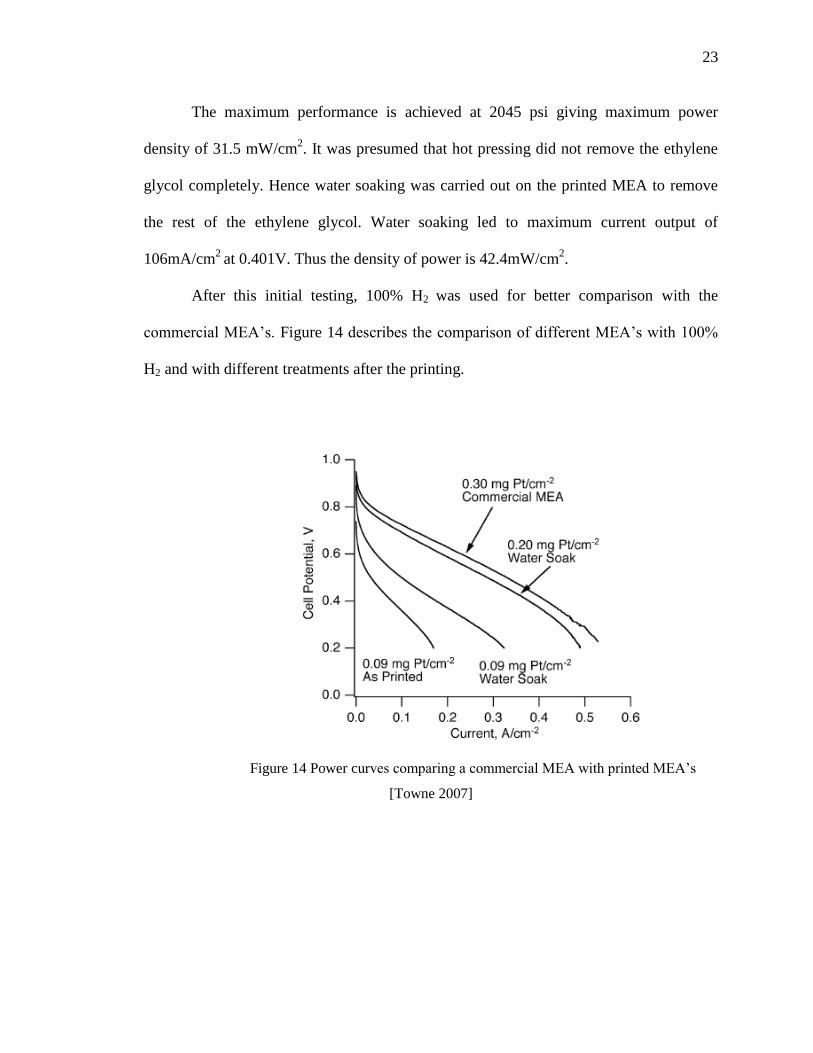
The maximum performance is achieved at 2045 psi giving maximum power
density of 31.5 mW/cm2. It was presumed that hot pressing did not remove the ethylene
glycol completely. Hence water soaking was carried out on the printed MEA to remove
the rest of the ethylene glycol. Water soaking led to maximum current output of
106mA/cm2
at 0.401V. Thus the density of power is 42.4mW/cm2.
After this initial testing, 100% H2 was used for better comparison with the
commercial MEA‘s. Figure 14 describes the comparison of different MEA‘s with 100%
H2 and with different treatments after the printing.
Figure 14 Power curves comparing a commercial MEA with printed MEA‘s
[Towne 2007]

24
In Figure 14, it is clear the commercial MEA‘s outperformed those inkjet printed
MEA‘s are having the catalyst loading of 0.094 mg Pt/cm2. However, when the catalyst
loading was 0.2 mg Pt/cm2, it was a comparable performance as compared to commercial
MEA‘s, which is tabulated in Table 8.
Table 8 Comparison of the improved MEA with the commercial MEA [Towne 2007]
Type of MEA Platinum loading
( mg Pt cm-2
)
Peak power density
( mWcm-2
)
Inkjet printed 0.2 155
Commercial 0.3 167
Hence, with a 33% lower catalyst loading, only 7% lower power density was
obtained. This result proves that inkjet printed MEA‘s can compete with the commercial
ones.
Thus, it is evident how efficient can inkjet printing method for fabricating MEA‘s
is as compared to commercial MEA‘s. The efficiency of the catalyst usage or loading can
be further enhanced by grading the amount of platinum loading in every layer. Previous
literatures suggest that the graded catalysts were found to perform better than the
uniformly loaded catalyst in every layer [Xie 2005, Wang 2004].
Paganin et al. clearly suggests that platinum is better utilized when it is more
concentrated near either the GDE layer or the electrolyte membrane layer [Paganin
1996]. Inkjet printing makes it possible to grade the platinum loading print after print.
Previous research carried out by Taylor et al. demonstrated that a graded catalyst of Pt
wt% 10-50 on carbon black outperformed the uniform catalyst structure of 20 % wt Pt on

25
carbon black at nearly the same amount of overall platinum loading [Taylor 2007]. Figure
15 shows the possible grading scheme for better performance and Figure 16 shows the
performance comparison of a standard catalyst to that of a graded catalyst.
Figure 15 Graded catalyst layer [Taylor 2007] Figure 16 Performance comparison of a standard
uniform catalyst & graded catalyst[Taylor 2007]

26
4. SELECTIVE LASER SINTERING
The functions of bipolar plate are:
To provide electrical contact between two adjacent MEA‘s.
Uniformly distribute hydrogen gas and oxygen gas/air to the anode and the
cathode side of the MEA respectively.
To serve as a platform to support the soft MEA.
To act as an outlet medium for heat and water vapor generated from the net
reaction.
Hence, the requirements for a bipolar plate accordingly are:
High electrical conductivity
Plate material electrically compatible with the electrode
Very low gas permeability for reactant gases.
High thermal conductivity to make use of the waste heat.
Chemical stability i.e. corrosion resistant.
Low density plate material to keep the stack weight low.
Inexpensive plate material.
4.1 MATERIAL SELECTION FOR BIPOLAR PLATE
There are three types of materials identified for the manufacture of fuel cell
bipolar plates which are: pure graphite, metallic materials, and carbon-polymer
composites.

27
Pure graphite, with peak conductivity of 1.44x10³ S/cm is suitable for Bipolar
Plates because they need to be highly conductive. Graphite is very difficult to machine
when it comes to the machining of the flow field channels because of its flaky
microstructure and irregular geometry. This also reduces its mechanical strength [Chen
2006].
Metals such as stainless steel, titanium, gold, aluminum, have good machining
characteristics as compared to graphite. However, gold and titanium are very costly.
Aluminum can be used with a gold coating. However, there is large difference in co-
efficient of thermal expansion which leads to micro-cracks in the coating. Stainless steel
has corrosion issues [Maeda 2004, Chen 2006].
Composite materials suitable for the application of bipolar plates are a
combination of porous graphite along with polycarbonate plastic. Graphite is an allotrope
of carbon and a semimetal. The carbon based materials suitable are resins such as
polyethylene, phenolic, Vinyl ester etc. with filler materials like carbon black and
carbon/graphite powders. These composite systems provide electrical conductivity as
well as corrosion resistance and mechanical strength [Chen 2006].
4.2 SETUP AND PROCEDURE FOR THE EXPERIMENT
There are two kinds of SLS procedures namely, Direct and Indirect. Direct SLS
means parts are produced by just laser sintering of the powder without any post
processing measures. Indirect SLS involved production of a porous green part held
together by a certain polymer binder followed by some post processing measures.

28
According to the research conducted by Chen, indirect SLS of carbon based
composite material accommodates the material and procedure selection criteria for the
PEM fuel cell bipolar plate fabrication [Chen 2006]. This Indirect SLS proceeded in 3
stages to meet all the plate requirements:
1. SLS of bipolar plates
2. Carbonization of the binder
3. Epoxy infiltration
In Table 9, the parameters for the first stage which is the SLS process are shown.
Table 9 Key process parameters for SLS process [Chen 2006].
Powder constituents Graphite (GrafTech GS150E) and Phenolic
resin (Georgia Pacific GP5546)
Composition: 70w% graphite and 30 w% phenolic resin
Average particle size Graphite: 80 μm Phenolic resin:11μm
SLS machine DTM Sinterstation 2000
CO2 laser power 10~20 W
Laser scan speed 60 in/s
Powder layer thickness 0.004 in
Powder bed preheating Temp 60˚C
Purging gas Nitrogen
After the SLS process, post processing of the bipolar plates was further carried
out. The post processing basically consisted of two steps of binder carbonization and
epoxy infiltration.

29
Carbonization process
A vacuum furnace was used for this purpose. The maximum heating capacity of
the vacuum furnace being 2000˚C.Argon gas was filled into the chamber to prevent
oxidation of carbonized phenolic resins which reduce the glassy carbon yields. The
temperature rise and the ramp rates for this process are tabulated in Table 10.
Table 10 Temperature rise and the ramp rates [Chen 2006]
Temperature Ramp Rate
Initial Profile Room Temp-200˚C 60˚C/hr
Intermediate Profile 200˚C-600˚C 30˚C/hr
Final Profile At 800˚C 0
At 800˚C, the dwell time was 1 hour. During this process the phenolic binders are
burned off and a part of it was converted into glassy carbon. This resulted in good
interconnected pores which increased the electrical conductivity.
Epoxy infiltration for final sealing
After the carbonization process, the structure was still found to be porous. Epoxy
resin was chosen as the infiltrant to seal these pores because of its good mechanical
strength, chemical stability and ability to wet most substrate materials. Clear coat resin
which is a mixture of more than 70% diglycidyl ether of bisphenol A and less than 30%
alkylglycidyl ether was used for this purpose. The resin was initially cured with the help
of a hardener and then diluted with solvents like toluene, xylene etc., this was done in
order to reduce the viscosity of the resin so that it can easily penetrate through the cured
30
pore structure. The epoxy, hardener and the solvent should be mixed in proper ratios
(2:1:1) to avoid the formation of un-reacted epoxy and hardener which affect the final
part properties. So as to form a gas tight plate structure the brown part were immersed in
the infiltrant at least twice. The parts were then oven dried at 60˚C for several hours to
remove residual moisture. The electrical conductivity of the infiltrated parts was found to
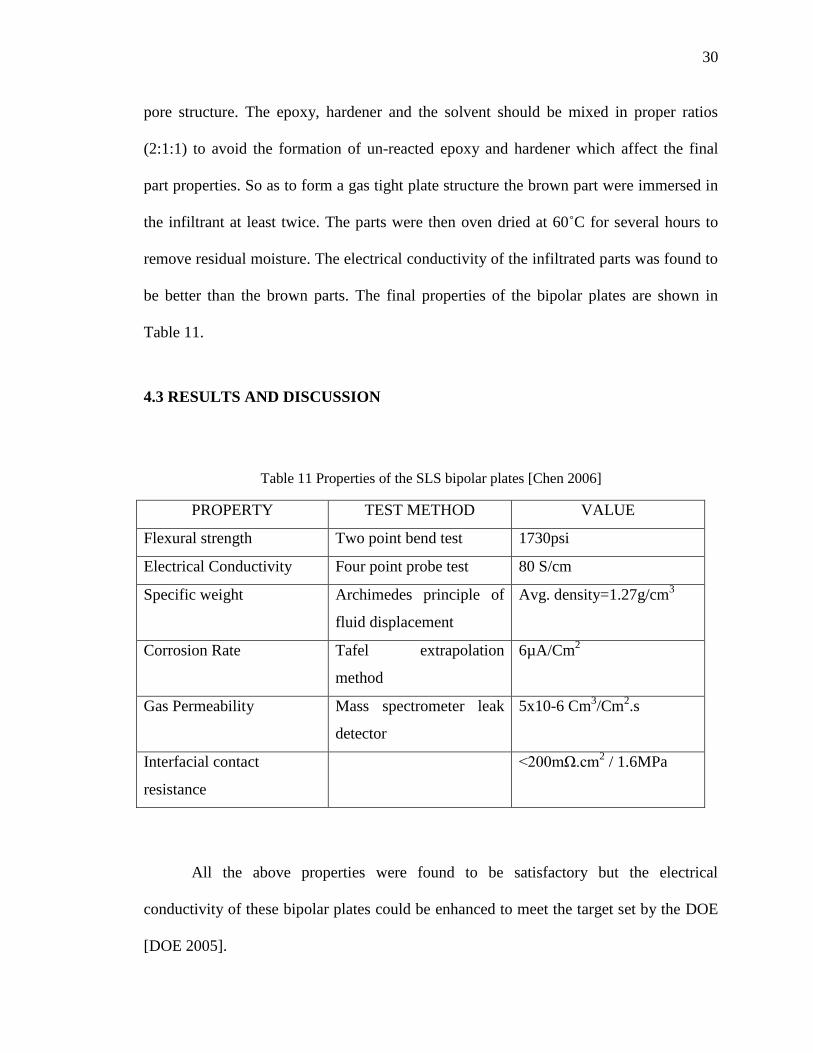
be better than the brown parts. The final properties of the bipolar plates are shown in
Table 11.
4.3 RESULTS AND DISCUSSION
Table 11 Properties of the SLS bipolar plates [Chen 2006]
PROPERTY TEST METHOD VALUE
Flexural strength Two point bend test 1730psi
Electrical Conductivity Four point probe test 80 S/cm
Specific weight Archimedes principle of
fluid displacement
Avg. density=1.27g/cm3
Corrosion Rate Tafel extrapolation
method
6µA/Cm2
Gas Permeability Mass spectrometer leak
detector
5x10⁻⁶ Cm3/Cm
2.s
Interfacial contact
resistance
<200mΩ.cm2 / 1.6MPa
All the above properties were found to be satisfactory but the electrical
conductivity of these bipolar plates could be enhanced to meet the target set by the DOE
[DOE 2005].

31
The following methods were followed to improve the electrical conductivity [Chen
2006]:
Infiltration of brown parts with conductive polymer
Addition of a liquid phenolic infiltration/re-curing step prior to final sealing
Reduction of glassy carbon resistivity by curing process parameter control
These processes showed results which are quantified as below in Table 12 and the
improvements in electrical conductivity are illustrated in Figure 17.
Table 12 Enhancement in electrical conductivity
First Infiltration/Recurring step ~108 S/cm (35% boost in the
conductivity)
Second Infiltration/Recurring step ~117 S/cm (8.3% further enhancement)
Figure 17 Improvement in electrical conductivity with each step [Chen 2006]

32
5. CONCLUSIONS
The paper reviews three Additive Manufacturing (AM) processes. Each process is
suitable for building specific fuel cell components. Performance characteristics of these
components fabricated using AM processes prove that they give performance equal or
better than the components fabricated by conventional techniques. Inkjet printing,
amongst all AM processes is the process where most of the research has been undertaken
with regards to building fuel cell components. The reason for that is it is easiest to
commercialize as compared to rest of the methods since off the shelf printers have been
demonstrated to produce components competitive with the commercial ones. FDM is
convenient for planar array fuel cells as compared to MEMS and CNC manufacturing.
Indirect SLS of graphite composite bipolar plate demonstrates fabrication of plates
having superior characteristics which also meet DOE specifications. Development of
these processes on a commercial basis is still under a lot of investigation.
6. ACKNOWLEDGEMENTS
This research was supported by a grant from the U.S. Air Force Research
Laboratory contract #FA4819-09-C-0018. Support from the Missouri S&T Intelligent
Systems Center is also greatly appreciated.

33
7. REFERENCES
[Ahn 2009] Daekeon Ahn, Jin-Hwe Kweon, Soonman Kwon, Jungil Song, Seokhee Lee,
Representation of surface roughness in fused deposition modeling, Journal of
Materials Processing Technology, 2009.
[Chen 2006] Ssuwei Chen, Fabrication of PEM Fuel Cell Bipolar Plate by Indirect
Selective Laser Sintering, Doctor of Philosophy thesis, University of Texas at
Austin, 2006.
[Chen 2008] Chen-Yu Chen, Wei-Hsiang Lai, Biing-Jyh Weng, Huey-Jan Chuang,
Ching-Yuan Hsieh, Chien-Chih Kung, Planar array stack design aided by rapid
prototyping in development of air-breathing PEMFC Journal of Power Sources
179 (2008) 147–154, 2007.
[DOE 2005] Department of Energy,Roadmap on Manufacturing R&D for the Hydrogen
Economy, Washington, D.C., 2005.
[Grimm 2009] User‘s Guide to Rapid Prototyping SME
[Lee 2007] Won Ho Lee, Fabrication of MEA Using Inkjet Printing Technology, 2007
Fuel Cell Seminar, October 15-19, 2007, San Antonio, Texas
[Liou 2007] Frank W. Liou, Rapid prototyping and Engineering Applications CRC Press
NY, 2007
[Maeda 2004] K. Maeda, T.H.C. Childs, Laser sintering (SLS) of hard metal powders for
abrasion resistant coatings, Journal of Materials Processing Technology 149
(2004) 609–615
[Masood 2004] S.H. Masood, W.Q. Song, Development of new metal/polymer materials
for rapid tooling using Fused deposition modeling, Materials and Design 25
(2004) 587–594
[Paganin 1996] V.A. Paganin, E.A. Ticianelli, E.R. Gonzalez, Development and
electrochemical studies of gas diffusion electrodes for polymer electrolyte fuel
cells, J. Applied Electrochem. 26 (1996) 297–304.
[Payne 2009] Payne, John, "Nafion® - Perfluorosulfonate Ionomer", Mauritz, 06/25/09
http://www.psrc.usm.edu/mauritz/nafion.html
[Spiegel 2006] Colleen Spiegel, Designing and Building Fuel Cells, McGraw-Hill
Professional

34
[Taylor 2007] André D. Taylor, Edward Y. Kim, Virgil P. Humes, Jeremy Kizuka, Levi
T. Thompson, Inkjet printing of carbon supported platinum 3-D catalyst layers for
use in fuel cells, Journal of Power Sources 171 (2007) 101–106, 2007.
[Towne 2007] Silas Towne, Vish Viswanathan, James Holbery, Peter Rieke , Fabrication
of polymer electrolyte membrane fuel cell MEAs utilizing inkjet print technology,
Journal of Power Sources 171 (2007) 575–584,2007.
[Wang 2004] Qianpu Wang, Michael Eikerling, Datong Song, Zhongsheng Liu, Titichai
Navessin, Zhong Xie and Steven Holdcroft, Functionally Graded Cathode
Catalyst Layers for Polymer Electrolyte Fuel Cells, I. Theoretical Modeling,
Journal of The Electrochemical Society, 151 (7) A950-A957(2004)
[Xie 2005] Zhong Xie, Titichai Navessin, Ken Shi, Robert Chow, Qianpu Wang, Datong
Song, Bernhard Andreaus, Michael Eikerling, Zhongsheng Liu and Steven
Holdcroft, Functionally Graded Cathode Catalyst Layers for Polymer
Electrolyte Fuel Cells, II. Experimental Study of the Effect of Nafion
Distribution, Journal of the Electrochemical Society, 152 (6) A1171-A1179
(2005)
[Yang 2009] Chi-Jen Yang, An impending platinum crisis and its implications for the
future of the automobile, Energy Policy 37 (2009) 1805–1808
[Zhong 2000] Weihong Zhong, Fan Li, Zuoguang Zhang, Lulu Song, Zhimin Li, Short
fiber reinforced composites for fused deposition modeling, Materials Science and
Engineering A301 (2001) 125–130

35
II. COMPARISON OF DIRECT DEPOSITION PROCESS AND
ELECTRO-WRITE PROCESS FOR PROTON EXCHANGE
MEMBRANE FUEL CELL MEA MANUFACTURING
Nikhil Kulkarnia, F. W. Liou
a and J. W. Newkirk
b
aDepartment of Mechanical and Aerospace Engineering, Missouri University
of Science and Technology, Rolla, MO 65409 USA
bDepartment of Material Science and Engineering, Missouri University of
Science and Technology, Rolla, MO 65409 USA
ABSTRACT
Fuel cells are an important source of power for the future. Being in an energy
demanding era, we are in dire need of new efficient power sources. However, there are
issues regarding fuel cell manufacturing which need urgent attention. The paper discusses
the manufacturing of the Proton Exchange Membrane (PEM) fuel cell MEA‘s by two
methods, namely Direct Deposition Process (DDP) and Electro-write Deposition Process
(EWP). The comparison is carried out to provide us with the knowhow of the most
suitable method for MEA manufacturing. The paper discusses the impact on the cost of
the fuel cell by means of comparison of the two processes, the DDP and EDP in terms of
their efficiency by a unique method. This paper is an introductory work for forming a
basis of comparison and more detailed works will follow.

36
1. INTRODUCTION
In most countries around the world, the current energy supply system is
considered as not being sustainable, in particular because of climate change impacts and
the consumption of non-renewable energy resources [Krewitt 2006]. It is clear that
transition from conventional fuels to clean and non-exhaustible ones is unavoidable
[Asghari 2010]. Among the various renewable energy sources, fuel cell technology has
received considerable attention as an alternative to the conventional power units due to its
higher efficiency, clean operation and cost-effective supply of power demanded by the
consumers [Erdinc 2010]. For small portable applications, fuel cells are the closest
possible alternative to batteries since batteries do not provide the expected power density.
Amongst all the different types of fuel cells, the Proton Exchange Membrane (PEM) fuel
cells have received the highest attention due to low fuel permeability, high proton
conductivity, high efficiency and good thermal stability [Peighambardoust 2010]. The
main shortcomings for fuel cell development, however, are the cost and non-feasibility of
mass production. The two factors however are interlinked with each other. If fuel cells
could be mass produced in the near future, the cost will go down substantially. The other
factors which can reduce the cost of PEM fuel cells are the high utilization of catalysts,
low cost manufacturing process, use of different catalysts, heat and water management.
A fuel cell consists of many components such as Bipolar Plates, Gas Diffusion
Layers (GDL), Membrane Electrode Assemblies (MEA‘s) etc. The GDL allows direct
and uniform access of the fuel and oxidant to the catalyst layer, which stimulates each
half reaction [Mehta 2003].

37
The cost of a fuel cell is highly dependent on the utilization of the catalysts.
Hence, to minimize the wastage of catalysts, research has been carried out to spray the
catalyst onto the GDL with maximum efficiency. However, there is no sure way to
estimate how efficient the process is. The paper discusses the efficiency of a
manufacturing process in detail with regards to two catalyst spraying processes, the
Direct Deposition Process (DDP) and the Electro-Write Process (EWP)

38
2. EXPERIMENTAL WORK
MEA manufacturing is the most complicated manufacturing process of all the
components in a fuel cell. It‘s mainly because MEA is not a single component but a
series of components which need to be bonded precisely. For this reason, the manufacture
of MEA proceeds in multiple steps. Hence, initially a cost model was estimated to
analyze the costs incurred in an MEA manufacturing process. After it was calculated, the
next important step is to analyze which is the most critical step in the entire
manufacturing process. For this critical step, it is important to know what the most
efficient manufacturing process is for it. This was carried out using the surface
characterization techniques such as Scanning Electron Microscopy (SEM) and Energy-
dispersive X-ray spectroscopy (EDS). SEM is a high resolution imaging technique that
helps in analyzing the surface characteristics of the sample and EDS helps to identify the
elemental nature of the surface. As described earlier, MEA manufacturing proceeds in
multiple steps such as Catalyst Ink preparation followed by Catalyst spraying, which is
spraying the catalyst ink onto the GDL using an XYZ platform and syringe disposing
gear. After the catalyst spraying process, the GDL becomes a GDE (Gas Diffusion
Electrode) since now the GDL contains the catalyst and thus becomes an electrode of the
fuel cell. This is followed by hot pressing, in which the proton exchange membrane is
pressed between two GDE‘s to form an MEA. The flowchart for MEA manufacturing is
presented in the following sections of this paper.

39
2.1 CATALYST INK PREPARATION
The catalyst ink was prepared using catalyst particles and Nafion LQ-1105 5% by
weight NAFION®
, 1100 EW. From the literature survey, it is known that Nafion® forms
solutions having dielectric constants i.e. ‗ε‘ more than 10, colloidal solution for ε between
3 and 10, while precipitate for ε less than 3 [Shin 2002]. Isopropyl alcohol has ε of 18.3
and hence it was used. Isopropyl alcohol and a dispersant were added to ensure uniform
dispersion. The quantity of these ingredients was chosen in a way so that the solution has
a required range of viscosity and surface tension. The range of viscosity chosen was
between 2-5 cP and the range of surface tension chosen was between 35-40 mN/m. This
range for both the viscosity and the surface tension was chosen so that the solution does
not form lumps on the surface of the substrate or it does not remain in the syringe
disposer for a long time either. After adding the ingredients, the ink was kept for stirring
for approximately 36 hours using Fisher Scientific Isotemp magnetic stirrer. The stirring
was carried out to make sure the solution has a uniform dispersion. In general, the nano
scaled catalyst particles should come in touch with other components uniformly which is
why the stirring is carried out [Zhang 2008]. The mixing was initially carried out in small
steps by adding the ingredients slowly and simultaneously checking for its viscosity and
surface tension to ensure that they stay in the desired range.
The flowchart is Figure 1 describes the flowchart for the MEA manufacturing
process.

40
2.2 FLOWCHART FOR PREPARING THE MEA
Figure 1 Flowchart for MEA manufacturing
Ink preparation
• Taking optimum quantity of Nafion solution, Isopropyl Alcohol, Catalyst
• Mixing the components and stirring using magnetic stirrers for 24-48 hours
Spraying
• Taking the prepared catalyst ink and loading into the dispensing syringe
• Using the process to spray the catalyst ink onto the Carbon Paper substrate
Hot Pressing
• Drying the Substrate containing the sprayed ink
• Hot pressing the 2 sprayed substrates onto two sides of the proton exchange membrane at 1250 psi, 110°C for 3 minutes

41
3. ELECTROSPRAY PROCESS MODEL
In this paper, unlike the usual performance analysis, the efficiency of a process is
compared. Before the comparison, it is necessary to understand which the most critical
process is in the entire MEA manufacturing process. For this, an experiment is carried out
using a horizontal electrospraying apparatus to spray the catalyst ink onto the GDL which
is the Toray Paper TGP H-090.
The electrospraying process was taken into consideration initially for the
manufacture of GDE. A 5cm×5cm Toray cloth was the GDL for the process. The Iridium
oxide catalyst content was 25 mg/10ml of ink. Hence, for achieving a loading of
0.4mg/cm2 which is considered as a standard loading, we prepared only 4 ml of ink. To
achieve uniform dispersion, it was stirred additionally for 1 hour before it was loaded in
the syringe.
The optimum parameters for the electrospraying process were fixed by
experimentation. In this, one parameter which was the droplet ejaculation rate was fixed
and the other two parameters which are the voltage and the distance of the needle from
the GDL were varied. The droplet ejaculation rate was also found out by a similar method
in which the other two factors were fixed and only the droplet ejaculation rate was varied
to find out the optimum rate at which the droplet is absorbed into the GDL without
formation of the drop on the surface of the GDL. In this way, the following parameters
were found are best for the electrospraying process to manufacture a GDE which are
listed in Table 1.

42
Table 1 Optimum parameters for electrospraying process
Voltage Droplet Ejaculation Rate Distance from the GDL
3 75-80 µL/min 0.25 cm
After this task, the electrospraying apparatus is mounted on a XYZ table and
automatic electrospraying of the catalyst ink onto the GDL is carried out. From this
study, the optimum traversing speed for the electrospraying process was found out to be 2
in/min for the entire quantity of ink to spread uniformly on the surface of the GDL. This
optimum speed is found on the basis of visual inspection of non-formation of any droplet
on the surface of the GDL. The setup of the process is shown in Figure 2.
Figure 2 Horizontal electrospray apparatus

43
The pattern in which the ink is sprayed on the GDL is shown below. The
spraying was started from the left bottom end of the GDL and then the progress is as
shown in the figure. Totally, it took 25 minutes for the entire GDL to be sprayed with the
optimum amount of ink which is 4 ml. The pattern is shown in Figure 3
Figure 3 Tool path for horizontal electrospray process
3.1 ELECTROSPRAYING PROCESS COST MODEL
The cost model for the electrospraying process was calculated considering the
cost of the process per liter of catalyst ink. The catalyst loading considered for the MEA
is 0.2 mg/cm2, a standard loading according to previous literature review.
As every process has certain wastage associated with it, a wastage rate of 10%
was considered for each of the process in the final cost. Tables 2-7 list the processes and
the component costs in the entire MEA manufacturing process.

44
Table 2 Catalyst ink component cost
Ingredient for 10 ml for 1 liter Cost
Nafion liquid 1ml 100 ml $ 105
Catalyst particles 10mg 1 g $ 110
Isopropyl alcohol 8ml 800 ml $ 5
Dispersing agent 1 ml 100 ml $ 5
Total cost
$ 225
Final Cost (10% wastage considered)
$ 247.5
Table 3 Catalyst ink preparation cost
Description Cost/Quantity
No of stirrers 2 units
Stirrer cost ($) /liter ~ $ 0.71
power consumed $ 1
1 liter beaker cost for 2 units $ 18
Total operational cost $ 19.71
Number of MEA‘s using loading of 0.2 mg/cm2 using 1 liter catalyst ink is 100.
For making 100 MEA‘s number of GDL‘s required will be 200 and number of
membranes required will be 100. The following table gives the material costs.
Table 4 MEA component cost
Component Units required Cost
GDL 200 $ 235
Membranes 100 $ 750
Total material cost $ 985
Final Cost(10% wastage considered) $ 1083.5

45
Table 5 Electropsray apparatus cost
Activity Time/Cost
Catalyst spraying time with electrospray apparatus 30 minutes
Considering there are 10 machines in the shop 300 minutes
Setup time for 1 run 10 minutes
Labor cost ($20/hr, 4 employees) $ 480
Equipment cost for 10 syringe dispensers 3200/240 $ 13.33
Battery and power supply cost for 10 dispensers 2220/240 $ 9.25
Syringe costs for 1 liter ink 20 syringes/liter $ 10
Total operational cost $ 512.58
Final cost(10% wastage considered) $ 563.84
In Table 5, the equipment cost for the syringes dispensers is considered as per day
cost. The total cost of 10 syringe dispensers for a day is stated in the last column and the
same holds true for the battery and power supple equipments too. The number of working
days in an year is considered to be 240 days.
After the electrospraying operation, the next step requires some post processing in
order to bond the GDE‘s with the membranes. The best parameters identified for the hot
pressing are 1000 psi, 100°C and 2 minutes [Therdthianwong 2007]. Also, the equipment
depreciation has to be taken into consideration while computing the process cost. The life
time of the hot pressing apparatus is considered to be 7 years. Thus the hot pressing
apparatus cost can be calculated using the following equation
Hot pressing cost =N A
Y D
...................................................................... (1)
where,
N= Number of machines required

46
A= Cost of 1 machine
Y= Life of the equipment in number of years
D= Number of operational days in an year
Thus, the hot pressing cost will be = N A
Y D
=
2 25000
7 240
= 29.7619
Considering the hourly labor charges as $20, 5 hours would be required to hot
press 100 MEA‘s. Accordingly, for 1 employee, the labor cost comes to $100.
Table 6 Hot pressing cost
Activity Cost
Hot pressing apparatus cost $ 29.7619
Labor cost ($20/hr,1 employee) $ 100
Total operational cost $ 129.76
Final cost $ 129.76
Table7 Total cost of MEA manufacturing
Operation Cost
Components for catalyst ink $ 247.5
Catalyst ink preparation $ 19.71
MEA components $ 1083.5
Electrospraying $ 563.84
Hot pressing $ 129.76
Total cost $ 2044.31

47
3.2 EXPERIMENT CONCLUSION
Thus the total cost of preparation of 100 MEA‘s comes out to be $2044.31. Hence
the cost per piece is $20.44, which is considerably less expensive as compared to the
commercially available MEA‘s. However, it is understood from the overall study that the
cost depends primarily on the process of GDE preparation because the other costs
incurred are mainly raw material costs. Hence, if the process of GDE preparation is
optimized to achieve best results in shortest time, a lot of cost reduction can be achieved.
Optimizing the GDE preparation process means that the speed of the process
should be increased so that it does not act as a bottleneck. If it takes 25 minutes to spray
the ink over 1 MEA, it will certainly act as a bottleneck to the entire MEA manufacturing
assembly. Hence, to accelerate the process, DDP (Direct Deposition Process) and EWP
(Electro-write process) are chosen to be compared since they are the faster than
conventional catalyst ink spraying processes such has hand painting and screen printing
processes [Taylor 2007]. DDP consists of a vertical syringe mounted on an XYZ platform
and which can be programmed to deposit over a tool path. Hence, the Z axis doesn‘t
move as might be expected from an XYZ platform. EWP is essentially the same process
as DDP except the fact that the electrospraying circuit is added to the DDP process to
accelerate it by increasing the rate of deposition. The rate of deposition increases because
of the external electric field wherein the syringe needle acts as the anode and the
substrate as the cathode thereby attracting the catalyst ink from the syringe needle.

48
4. ANALYSIS OF EXPERIMENTS
For the analysis, an X-Y-Z platform was constructed using the Fab@home model
2 apparatus. This apparatus is equipped with printing head capable of moving along the X
&Y axes whereas the loading base moves vertically to give the 6 degrees of freedom. For
the EWP, a power supply and a battery had to be used. During the EWP, the loading base
was treated as cathode whereas the syringe needle was the anode. Other than the power
supply and the battery, rest of the apparatus was common for both the DDP and the EWP.
Figure 4 shows the setup of the apparatus.
Figure 4 XYZ platform used for both the DDP and EWP

49
4.1 EFFICIENCY CALCULATION FLOWCHART
Figure 5 Efficiency calculation flowchart for DDP and EWP
The flowchart explains the steps required to calculate the efficiency of the catalyst
ink spraying process. Next, the paper describes the efficiency calculation of the DDP in
detail. To compare the two processes, it is necessary to set some common parameters. For
the experiment described in this paper, the common parameters were:
Quantity of the ink sprayed onto the GDL
Translational speed of the XYZ platform
Tool Path
Time taken by the machine to complete the tool path
Spraying the catalyst ink onto the carbon paper substrate
Analyzing the substrate under the SEM and using EDS Technique
Calculation of the volume of the particles analyzed under the SEM as against the
loading used gives us the efficiency
50
4.2 DDP EFFICIENCY CALCULATION
After the catalyst spraying process, the carbon substrate was analyzed by SEM
and checked for the Iridium oxide particles. For the efficiency calculation, Iridium oxide
particles were used because it is one of the novel catalysts in the field of PEM fuel cells
and Iridium particles are easier to identify by SEM. 5 ml of Iridium oxide catalyst ink
containing Nafion solution, Isopropyl alcohol, dispersant and Iridium oxide catalyst
particles. A total of 6.25 mg of Iridium oxide was loaded into the ink. The ink was
sprayed onto 25 cm2 of carbon paper giving it a loading of 0.25 mg/cm
2. After the
spraying operation, small sections of the GDE from the entire area of the GDE were cut
to be analyzed by SEM techniques. This was carried out in order to collect information
from the entire GDE and hence random sections were chosen. To identify the elemental
nature of the surface characteristics, Energy Dispersive X-ray Spectroscopy (EDS)
technique was used.
During the SEM analysis, every possible particle in the image was analyzed by
Electro-Discharge Spectroscopy using the EDAX Genesis software. Each particle was
analyzed and was checked for its elemental nature. Many such trials were carried out to
know if it‘s an Iridium particle or any other. After analyzing around 50 such particles, the
rest of the particle count was carried out using just simple judgment since an Iridium
particle stands out having a very high brightness as compared to the otherwise dark
background. The procedure of calculation of efficiency in described next. Flowchart in
Figure 6 demonstrates the steps required for calculating the efficiency.

51
Figure 6 Efficiency calculation procedure for DDP and EWP
The above flowchart describes efficiency calculation procedure for the processes.
This procedure is common for both the processes. In the second step, while calculating
the diameter, its assumed the catalyst particles as spherical. Considering they are finely
ground particles, it is a fair assumption.
Determine the number of particles by using SEM & EDS techniques
Analyze the particle diameter and hence the volume of the catalyst
Volume multiplied by the density of the catalyst gives us the mass.
The mass divided by the area of the GDE gives us the loading/cm2
The calculated loading divided by the initial loading gives us the efficiency

52
Iridium oxide catalyst ink was deposited using the XYZ platform apparatus onto
the Toray cloth. After deposition, the deposited Gas Diffusion Electrodes (GDE) were
allowed to dry for a full day so that all the volatile ingredients from the ink evaporate.
After drying it for a day, small samples of the GDE‘s were cut from different areas of the
GDE to be analyzed under the Scanning Electron Microscope (SEM). The high resolution
images were captured using the SEM and then analyzed using the ImageJ software. The
images were analyzed using the SEM Hitachi S-4700.
To identify if the particles are catalyst particles, EDS techniques were used.
During EDS analysis, high energy beam of charged particles is focused onto the sample
which leads to an emission of charateristic X-rays which are specific to individual
elements. This is how the elements present in the sample were identified, which in this
case are the catalyst particles.
Thus the average number of particles ranged from 11-23 in each image. After
spotting the particles, the average particle diameter was analyzed using the ImageJ
software and was found out to be 1.69 µm ± 0.17 µm. The average number of particles
was found to be 14.125. Figure 7 shows the sample image of the GDE manufactured
using the DDP and the arrow shows the catalyst particle. In this figure, it can be observed
that the particle spread is less. The spread of the catalyst particles was similar in all the
images captured.

53
Figure 7 SEM image of the GDE manufactured using the DDP
After the analysis of the images and calculating volumes, the following are the results
For 25 cm2, the total volume of the catalyst particles was 0.082 mm
3
The density of catalyst is 22.42 mg/mm3 and hence, the mass is 1.837 mg
Considering the initial loading as 12.5 mg for 25 cm2 area, the efficiency will be
Efficiency = Calculated Loading
15%Initial Loding
............................................................... (2)
Thus, the efficiency of the DDP comes out to be 15% according the calculation
procedure adopted here, which is common for both the DDP and the EWP.
Catalyst
particle

54
4.3 EWP EFFICIENCY CALCULATION
The calculation of the EWP process is calculated in the similar way as for the
DDP. As explained earlier the EWP is similar to DDP except the following addition of
the Electrospray apparatus in which the substrate acts as a Cathode and the syringe needle
acts as an Anode. The perceived advantages of this process are:
The ink flow rate is more than in DDP because of the extra electric field.
The ink stream is more uniform and very linear.
The same procedure was carried out to study the images and to find the volume of
the particles and then accordingly the efficiency. During the SEM analysis, many random
images were captured from various different parts of the GDE to study the surface
characteristics with regards to the spread and distribution of the catalyst particles over the
area of the GDE. The particles in the images were analyzed using the EDS techniques for
examining their elemental nature and verifying if they are the catalyst particles. The
images were captured using the SEM Hitachi S-570 and the Revolution 4 pi software was
used to use the EDS techniques for examination. After analyzing many such particles, the
rest of the particle count was carried out using simple visual judgment since the catalyst
particle stands out having a very high brightness as compared to the otherwise dark
background.

55
Figure 8 shows a sample image of one of the areas of the GDE manufactured
using the EWP. This image was taken with the SEM Hitachi S-570. In Figure 8, it is
evident that the spread of catalyst particles is more than that observed in DDP.
Figure 8 SEM image of the GDE manufactured using the EWP
Catalyst
particles

56
After the analysis of the images and calculating volumes, the following are the results
For 25 cm2, the total volume of the catalyst particles was 0.025 mm
3
The density of catalyst is 22.42 mg/mm3 and hence, volume × density= mass.
The mass thus calculated is 0.57 mg
Considering the initial loading as 1.25 mg for 25 cm2 area, the efficiency will be
Efficiency=Calculated Loading
45.6%Initial Loding
............................................................. (3)
Thus, the efficiency of the EWP comes out to be 45.6% which is more than 3 times
that of the DDP.
4.4 PROCESS COMPARISON OBSERVATIONS
One analysis which is important other than the efficiency is to know the
uniformity of the ink which has been sprayed onto the GDL. The number of particles in
the images can help in this regard.
For the DDP, 8 random images were taken with the same magnification from the
various parts of the GDE and analyzed by the SEM. The number of particles ranged from
10 particles as the least number of particles to 19 particles as the most particles. The
standard deviation for the DDP was 2.65.
For the EWP 6 images were taken with the same magnification from the various
parts of the GDE and analyzed by the SEM and the number of particles ranged from 10
particles as the least number of particles to 33 particles as the most particles. The
standard deviation for the EWP was 8.8.

57
This shows that there is a large variation in the number of particles found at
different places on the GDE manufactured using the EWP. This can also affect the
performance of the MEA.
This leads to a conclusion that deeper understanding of the EWP is needed to
demonstrate its spraying uniformity. Hence, it was necessary to map the spread of the
particles in various areas of the GDE to understand the variations in the amount of
catalyst spread. It is necessary to do that in accordance with the tool path used for the
EWP, which is similar to the DDP as already mentioned earlier. Hence, an analysis of the
horizontal variation and the vertical variation in the density of the catalyst particles is
carried out in the next part of the paper.
In this analysis, 2 small sections of the GDE manufactured by EWP, 5 mm in
length are cut, one in horizontal direction, one in vertical direction. The horizontal section
is the path where the ink has been deposited. Since, the ink spread is not 5 mm, the
vertical section contains the path wherein some of the path might not have the ink spread
which is what would be analyzed in this section. Figure 9 shows the same vertical and
horizontal variation.

58
Figure 9 Horizontal and vertical variation study for the EWP
The Figure 9 shows the tool path on a 5cm×5cm carbon paper GDL. The
horizontal variation and the vertical variation in the density of the catalyst sprayed onto
the GDL have been analyzed in the next part of the paper. These variations have also
been analyzed using the SEM and the EDS techniques.
4.5 VERTICAL VARIATION IN EWP
For studying the vertical variation, a 5 mm piece of the GDL where the top and
the bottom boundaries are exactly the ink paths have been taken into consideration. The
EDS was used to spot the Iridium particles and the particle count was taken in various
places along the vertical length i.e. starting from top and ending at the bottom of the 5
mm piece. This variation is shown in Figure 10.

59
Figure 10 (a) Catalyst particles in top section, (b) middle section and (c) bottom section with
EWP
The Figure 10 shows that quite a few particles can be spotted in the top section
and the bottom section of the 5 mm piece. However, very few particles can be spotted in
the middle section as seen from the image. However, there is need to quantify to know
a b
c

60
the variation. Hence, finding the number of particles using EDS and ImageJ software is
carried out in the next part of the paper. The variation of the count of particles as a
function of the track width is shown in Figure 11
Figure 11 Vertical variation of number of particles as a function of trackwidth
The above figure shows the graph of the vertical variation in the number of
catalyst particles as a function of distance from the top of the 5 mm GDE piece. In the Y
axis scale, the ‗t‘ stands for the track width point; for e.g. 0.6t means at 3/5th
the distance
from the top. It is evident from the figure that there is a lot of variation in the vertical
direction and it valleys in the middle section where there has been no spraying of catalyst.
0
2
4
6
8
10
12
14
16
0.2t 0.4t 0.6t 0.8t 1t
Nu
mb
er
of
Par
ticl
es
Path width

61
4.6 HORIZONTAL VARIATION IN EWP
For studying the horizontal variation, a 5 mm rectangular piece of the GDE is
taken into consideration which has been the ink path while spraying. The EDS technique
was used to spot the Iridium particles and the particle count was taken in many places.
The particle count was taken along the horizontal length. The Figure 12 shows the
horizontal piece and Figure 13 shows the horizontal variation of the number of particles
as analyzed by the SEM. Figure 14 graphically describes this variation.
Figure 12 Ink path section for horizontal variation analysis

62
Figure 13 (a) Catalyst particles in the left section, (b) middle section and (c) right section with
EWP
a b
c

63
Figure 14 Horizontal variation of number of particles as a function of track width
The above figure shows the graph of the horizontal variation in the number of
catalyst particles as a function of distance from the left of the 5 mm GDE piece. It is
evident from the figure that there is not a high variation in the horizontal direction as
much as it was in the vertical direction. This is primarily because of the high stirring in
the ink which results in uniform spread of the catalyst particles in the entire volume of the
ink. This proves that the uniformity in the catalyst layer on the GDE resulting in higher
performance of the fuel cell in less cost.
0
2
4
6
8
10
12
14
16
18
20
0.2t 0.3t 0.4t 0.5t 0.6t 0.7t 0.8t 0.9t 1t
Nu
mb
er
of
Par
ticl
es
Distance from the left end

64
From the above experiments, the most favorable conclusions which come out are
that ink spread is substantially uniform in the horizontal directions of the tool path but not
the vertical ones. It is hence imperative to spray the ink twice and the 2nd
tool path should
be covering the areas which are left out from the first too path. Figure 15 illustrates the
procedure.
Figure 15 Additional path for catalyst ink deposition in the EWP
Thus, from the above conclusions, it is understood that it is necessary to have the
2nd
tool path 2.5 mm away from the first tool path to achieve a uniform loading of the
catalyst on the entire GDL.

65
5. CONCLUSIONS
This paper presents the unexplored part in fuel cell science such as catalyst
spraying process efficiency. The cost model gives an idea of the most important process
involved in the process of MEA manufacturing, which in turn needs to be optimized to
achieve lower costs and efficiency. It is very important to focus on the efficiency of the
process in order to reduce the cost and make fuel cells more efficient. From the study, it
is evident that the electrospraying process is suitable for catalyst spraying operation as it
is fast and efficient and along with a low cost XYZ translational platform can also be an
inexpensive operation. The use of SEM and EDS techniques for calculating the
efficiencies of the process gives accurate results. The EWP achieves more than 3 times
the efficiency than that of DDP. In order to make the MEA more efficient, a second tool
path to cover up the un-sprayed regions has been suggested.
6. ACKNOWLEDGEMENTS
This research was supported by the National Science Foundation grants DMI-
9871185 and IIP-0637796, and a grant from the U.S. Air Force Research Laboratory
contract. Support from Product Innovation and Engineering, LLC, MISSOURI S&T
Intelligent Systems Center, is also greatly appreciated.

66
7. REFERENCES
[Zhang 2008] Jiujun Zhang, PEM Fuel Cell Electrocatalysts and Catalyst Layers,
Springer-Verlag London Limited, 2008
[Shin 2002] S.-J. Shin, J.-K. Lee, H.-Y. Ha, S.-A. Hong, H.-S. Chun, I.-H. Oh, Effect of
the catalytic ink preparation method on the performance of polymer electrolyte
membrane fuel cells, Journal of Power Sources 106 (2002), 146–152
[Therdthianwong 2007] Apichai Therdthianwong, Phochan Manomayidthikarn, Supaporn
Therdthianwong, Investigation of membrane electrode assembly (MEA) hot-
pressing parameters for proton exchange membrane fuel cell, Energy 32 (2007)
2401–2411, 2007
[Burns 2002] Ralph Burns, Fundamentals of Chemistry (4th
Edition), Prentice Hall
Edition Fourth Edition
[Erdinc 2010] O. Erdinc , M. Uzunoglu, Recent trends in PEM fuel cell-powered hybrid
systems: Investigation of application areas, design architectures and energy
management approaches, Renewable and Sustainable Energy Reviews 14 (2010)
2874–2884
[Mehta 2003] Viral Mehta, Joyce Smith Cooper, Review and analysis of PEM fuel cell
design and manufacturing, Journal of Power Sources 114(2003) 32-53
[Taylor 2007] André D. Taylor, Edward Y. Kim, Virgil P. Humes, Jeremy Kizuka, Levi
T. Thompson, Inkjet printing of carbon supported platinum 3-D catalyst layers for
use in fuel cells, Journal of Power Sources 171 (2007) 101–106, 2007.
[Krewitt 2006] Wolfram Krewitt, Joachim Nitsch, Manfred Fischedick, Martin Pehnt,
Heiner Temming, Market perspectives of stationary fuel cells in a sustainable
energy supply system—long-term scenarios for Germany, Energy Policy 34
(2006) 793–803
[Peighambardoust 2010] S.J. Peighambardoust, S. Rowshanzamir, M. Amjadi, Review of
the proton exchange membranes for fuel cell applications, International Journal of
Hydrogen Energy 35(2010) 9349-9384
[Asghari 2010] S. Asghari*, M.H. Shahsamandi, M.R. Ashraf Khorasani, Design and
manufacturing of end plates of a 5 kWPEM fuel cell, International Journal of
Hydrogen Energy 35(2010) 9291-9297

67
SECTION
2. CONCLUSION
This paper gives a lot of details about the applications of additive manufacturing
for manufacturing fuel cell components. Fuel cell components being small and detailed,
additive manufacturing can open up wide number of areas for their manufacturing at low
cost. Amongst various processes, SLS is the most suited process for bipolar plate
manufacturing. 3D inkjet printing can be effectively used for the catalyst spraying
process which is complicated and needs to be precise to spread the catalyst over the entire
GDL uniformly. In the second part of the thesis, a method for comparison of the two
processes used for manufacturing the MEA‘s has been devised. The comparison and the
efficiency calculation have been carried out using SEM and EDS techniques. This is very
easy and cost-effective. Amongst the two processes compared for catalyst spraying
operation, EWP came out topping the efficiency at 45.6% whereas the DDP was only
15% efficient. The EWP is further analyzed for further variation in its spraying. Further
analysis of the EWP method led to a conclusion that because of the ink spread not being
across the entire area of the GDL, an alternate ink path at 2.5 mm from the original ink
path is warranted.

68
VITA
Nikhil Pramod Kulkarni, son of Gauri and Pramod Kulkarni was born on
November 27, 1986 in Mumbai, India. He received his bachelors in Mechanical
Engineering from University of Mumbai, India in July 2008. In August 2008, he joined
Missouri University of Science and Technology for pursuing his Masters in Mechanical
Engineering. Nikhil worked with Dr Frank Liou, Professor of Mechanical & Aerospace
Engineering Department and Senior Research Investigator of Intelligent Systems Center
at the Missouri University of Science and Technology. His research was focused on
design and development of the Membrane Electrode Assemblies (MEA‘s) for portable
Proton Exchange Membrane Fuel Cells. Nikhil got his Masters in Mechanical
Engineering in May 2011.