Embed Size (px)
Citation preview
Design and Implementation of Standard Work on Care Delivery Performance: A Quasi-Experimental Investigation
Aravind Chandrasekaran Fisher College of Business The Ohio State University
Gopesh Anand University of Illinois
Peter Ward Fisher College of Business The Ohio State University
Luv Sharma
University of South Carolina
Susan Moffatt-Bruce The Ohio State Wexner Medical Center
March 2017
1
Design and Implementation of Standard Work on Care Delivery Performance: A Quasi-Experimental Investigation
Abstract
This research offers insights on how to carry out process change in high-contact service settings. Focusing on
healthcare delivery, we investigate the effect of standard work, put in place following Lewin’s theory of social
change, on 30-day readmission rates and patient satisfaction. Our quasi-experimental design involved working
with 40 caregivers and over 100 patients for more than two years to implement a new process for educating
kidney transplant recipients before discharge from the hospital. We examine the efficacy of the new process
through a difference-in-difference approach using data over three years from 702 transplant patients, including
heart and liver transplant recipients from the same hospital as a control group. Our results indicate that the
likelihood of 30-day readmission is about one-third lower for kidney transplant recipients (treatment) post-
implementation compared with recipients of other transplants (control group) for which the discharge-
education process remained unchanged. This improvement is estimated to generate average annual savings of
$133,346 for the hospital. We also find a 10% increase in overall patient satisfaction, measured using the
Hospital Consumer Assessment of Healthcare Providers and Systems (HCAHPS) survey, for the treatment
group compared with the control group. Furthermore, our first-hand observations over two years offer new
theoretical insights on initiating, implementing, and sustaining process change in high-contact service settings.
Key words: employee engagement; healthcare operations; process improvement; quasi-experimental; standard work 1.0. Introduction
Researchers studying process improvement have recognized the importance of involving frontline
employees in developing standardized work practices (Adler et al. 1999, Lawler 1994). Frontline employee
engagement can generate mindful adherence to standardized work practices and can further lead to effective
improvements of these practices (Spear and Bowen 1999). Despite a large body of literature on the overall
merits of implementing process improvement (e.g., Zhang and Zia 2013, Hendricks and Singhal 1997), there is
limited knowledge on how employee developed standard work1 affects the intended outcomes (Gino and
Pisano 2008). This is especially true in high-contact service settings such as healthcare, which have complex
care delivery processes (Nembhard and Tucker 2011, Gittell 2002) and high process variability related to the
different customer/patient needs and preferences (Hartzband and Groopman 2016, LeBaron et al. 2016).
1 We use standard work and standardized work practices interchangeably in the manuscript.
2
Furthermore, there is a lack of theoretical understanding on how to make systematic changes to processes and
sustain standard work in such settings (Staats et al. 2016).
In this research, we address these issues by adopting a multimethod empirical approach, which includes
action research and a quasi-experiment that allows us to compare results before and after implementing new
standard work for a healthcare delivery process. Our intervention is designed based on Lewin’s (1947) theory
of planned change, and we define standard work as a set of activities consistent in terms of content, sequence,
timing, and outcome with flexibility for some customer-centric customization (Spear and Bowen 1999). We
address the following research question: What is the effect of caregiver-designed and implemented standard work on care
delivery outcomes, namely occurrence of patient readmission within 30 days after discharge and patient satisfaction?
Our study differs from existing research on process improvement in four ways. First, we observe,
through participation, the implementation of standard work in a highly regulated service environment but in
which providers and consumers coproduce. Second, we compare service outcomes before and after the
development and implementation of the new standard work. We do so by using a quasi-experimental research
design that involves a control group. We collect and compile primary and secondary data from multiple sources
over a period of more than three years and control for several other factors that could have an impact on service
outcomes. Third, we study how the process change affects two service outcomes: the intended process outcome
and the process customer’s satisfaction. We include both these outcomes because the former may not always
align with the latter, especially in unwelcome but necessary services such as surgical procedures. Fourth, after
close observation of the development and implementation of the standard work over more than two years
(January 2014 – April 2016), we describe in detail the changes made toward delivering standardized service.
These descriptions illustrate how to increase employee mindfulness in day-to-day operational processes by
involving them in designing their own standard work. Overall, this study is the first to directly assess the effects
of process change on process outcomes using a quasi-experimental research design and a control group.
Moreover, we are also the first to combine rich observational data, spanning the period from recognizing the
need for change in work practices to sustained use of newly developed practices, with quantitative secondary
data tracked over the same longitudinal period.
Our empirical context is patient education and discharge instructions delivered after kidney transplant
surgery. Kidney transplantation is the preferred treatment for end-stage renal diseases (Abecassis et al. 2008).
Over 390,000 kidney transplants were performed between 1988 and 2016 (Health Resource Administration
2016), far outpacing other types of transplants (e.g., liver or heart) (UNOS 2016). In 2014 alone, 17,000 patients
received kidney transplants in the United States, and this number continues to grow annually (HRSA 2016).
These transplant recipients require prolonged periods of post-discharge care; thus, the quality of instructions
delivered before discharge plays an important role in preventing readmissions and improving post-transplant
3
quality of life (Gordon et al. 2009). Unfortunately, more than 30% of these recipients are readmitted within 30
days of discharge because of transplant-related problems, many stemming from patients’ difficulty in complying
with complex post-surgical discharge instructions (Lubetzky et al. 2016). These readmissions drive up costs for
the healthcare system and patients, who additionally endure preventable suffering (Axelrod et al. 2016). In this
context, standardizing care (i.e., following evidence-based standards of care) is important, so that multiple
caregivers, including inpatient and outpatient nurses, provide consistent information to patients and their
families at different points in time. At the same time, patient-centricity (i.e., altering patient education modes
based on learning styles) remains critical to ensure patients’ engagement during education and discharge and,
subsequently, adherence to post-discharge instructions (Damali et al. 2016). Implementing standard work for
the transition process after surgery can save money and lives while increasing patient satisfaction and reducing
anxiety levels. Insights gained from developing and implementing such process improvements are, moreover,
readily applicable to other transplant procedures, surgeries, and bundled-payment models that include
complicated post-surgical homecare (Verhaegh et al. 2014).
We observed and analyzed the design and implementation of standard work for education and training
of patients prior to their discharge after kidney transplant surgery. A team of 32 caregivers, which included
discharge nurses, surgeons, social workers, and their supervisors, redesigned the standard work for patient
education and training, incorporating inputs from 15 transplant patients. This redesign also served as the first
such systematic clinical process improvement effort, marking the start of an initiative for ongoing continuous
improvement of this and other processes across the hospital. To assess the effects of the process change, we
used patient-level data from 702 patients who had undergone transplant surgeries between January 2013 and
April 2016, combining it with in-depth observations throughout the period. Our analysis revealed that the newly
designed and implemented standard work resulted in more engaged patients, better-coordinated care, and
ultimately, improved patient health outcomes at lower costs. Specifically, the likelihood of readmission was
one-third lower for transplant recipients after our implementation (treatment group) compared with patients in
a different, comparable transplant process (control group) that were not part of any change in standard work.
On average, this amounted to a 25% reduction in overall readmission rates for the treatment group after the
intervention, resulting in a conservative estimate of $133,346 annual savings for the hospital. We also found
that patients in the treatment group rated the overall quality of their experience 10% higher on the HCAHPS
survey. During the same period, the control group experienced a decline of 11% in these scores. The
implementation of the process change that we describe can guide the deployment of similar process
improvements in healthcare as well as other service and manufacturing contexts. Furthermore, the insights
from tracking process and customer outcomes throughout the deployment process, and comparing before- and
after-change outcomes are applicable to process improvement initiatives in all operations management
contexts.
4
2.0. Theoretical Background and Hypotheses
We apply Lewin’s theory of facilitating social and organizational change (Burnes 2004, Lewin 1947) to
the context of implementing change in standard work. This theory recognizes the existence of two
counteracting forces that restrain and drive change in organizations. Forces for stability, which are
operationalized in our context through compliance with standard work, enable coordination of operations and
support organizational learning (LeBaron et al. 2016, Gittell 2002). While on the one hand, maintaining stability
can be a challenge, on the other hand, stability can be carried too far, and inertial tendencies can result in
preserving existing practices despite reasons for change (de Holan and Phillips 2004, Van de Ven 1986). To
drive desirable change, periods of stability need to be punctuated by actions for updates in work practices that
then need to be successfully adopted and sustained until the next cycle of change. However, we have limited
understanding on how stability and change can be simultaneously sustained, especially in high contact settings
such as healthcare.
In our empirical context, guiding the caregiving team in developing new standard work involved not
only making changes to the discharge education process but also putting in place a system for further such
cycles of changes in the process and for similar implementations in other processes. The process for patient
education and discharge after kidney transplant surgery is extremely complex, as it covers more than 45 different
patient-education topics covered in the four days prior to discharge. These topics range from medication
protocols, signs and symptoms of rejections, doctor visits, and dietary modifications, to infection prevention,
lab compliance, wellness requirements, and fluid intake. Patients must absorb an overload of information, which
can increase their anxiety, which is usually already high having experienced extensive pre-transplant medical
care, and the surgery for the transplant. The discharge education process is also rife with uncertainty. Patients,
families, and caregivers may experience interruptions necessitating adjustments to the standardized delivery of
education. Also, process regulations and mandates may change, warranting changes to the content of education.
Following Lewin’s theory, we propose that changes to standard work, made by the caregiving teams,
are likely to result in successful outcomes for the patients (Schein 1996). The implementation of new standard
work consists of the three stages of “unfreezing, changing, and refreezing.” The “unfreezing” of current
practices involves creating an environment in which employees feel psychologically safe to recognize threats
and opportunities for their work practices and feel encouraged to share ideas for changes with the group
(Siemsen et al. 2007). In our context, “unfreezing” involves nurses and physicians understanding the
deficiencies in the care delivery processes and sharing ideas to improve these processes. Following “unfreezing,”
the stage of “changing” calls for exploring different work practices to come up with new and improved work
practices. This stage calls for resources, including organizational infrastructure and employee time, for
systematic learning (Anand et al. 2009). In our context, the caregivers who deliver discharge education explore
new practices for their current work. The dual purpose of the subsequent stage of “refreezing” is to overcome
5
any resistance against the changes and to sustain the changes, preventing a return to old work practices (Naveh
and Erez 2004). The new work practices created at the group level in the “changing” stage are standardized and
serve as restraining forces to target adherence by individuals in their day-to-day work. With the iterative nature
of this framework, the caregivers following the standard work (in the “frozen” stage) are simultaneously
considering opportunities for improving the work practices to bring to the attention of the group (for
“unfreezing” and “changing”).
While previous studies of process improvement address a single stage of such a cycle, a comprehensive
application and study of the iterative stages is missing in the literature. For example, Staats et al.’s (2016) study
of compliance with handwashing focused on the immediate and individual impacts of electronic monitoring.
They explicitly left factors for sustaining results and impacts of coworker behavior to future research, and called
for using longer duration field experiments to study such questions. While the Staats et al. (2016) paper focused
on the effectiveness of frozen work practices, Nembhard and Tucker (2011) focused on deliberate learning
activities (DLAs) used for changing existing work practices. While their study found DLAs to result in
collaboration among healthcare workers and an initial dip in performance before turning around, they called
for future research to investigate these phenomena over a longer duration and based on in-depth observation.
Our study answers the calls of such researchers by studying systematic unfreezing, changing, and refreezing
work practices with close observation and metrics at each stage and over an extended period.
Using an integrated approach to make work practice changes in healthcare settings following the three
stages suggested by Lewin (1947) is likely to result in caregivers complying with newly developed standard work
resulting in better patient outcomes. Based on these arguments, we propose the following two hypotheses
regarding the relationship between standard work and patient outcomes.
H1: Standard work implementation in kidney transplant discharge education that follows an iterative process of unfreezing,
changing, and freezing work practices will reduce the likelihood of patients getting readmitted within 30 days after surgery.
H2: Standard work implementation in kidney transplant discharge education that follows an iterative process of unfreezing,
changing, and freezing work practices will positively impact patient satisfaction during the hospital stay.
Previous studies applying Lewin’s three-stage framework to manage organizational change (Huarng
and Mas-Tur 2016, Burnes 2004) have primarily focused on minimizing employee-introduced variation by
developing best practices and standardizing processes in one specific area. Most of these studies have applied
the framework to static contexts as in instituting a prescribed protocol or best practice (Shirey 2013), and, as
such, neither account for the mindful execution of standard work by employees doing the work nor for the
proactive search focusing on opportunities for further change. In addition, these studies have often failed to
acknowledge the challenges posed by the power differences among the people (e.g., physicians and nurses)
attempting these changes (Denis et al. 1996). In the following section, we present some of the unique challenges
faced by healthcare organizations implementing changes to work practices that have remained relatively
unexplored in research. We devised actions to counter these challenges during our implementation. By
6
describing these countermeasures, we also offer new theoretical insights on how to apply Lewin’s theory to
high contact and dynamic settings.
3.0. Understanding the three stages of process change in standard work implementation The intervention described in this research consists of the implementation of the initiation, discovery,
implementation, and sustainment of work practices. However, within the three stages of Lewin’s framework,
we relied on extant empirical research in organizational learning to design our intervention. While we selected
a single approach for each inhibiting or facilitating factor anticipated in the implementation, alternative
approaches could be adopted. Thus, we offer the actions that we included in our intervention within the three
stages of the process change as propositions. Furthermore, these inhibiting and facilitating factors shed light
on specific factors to consider in attempting process change, especially in high-contact work environments.
Unfreezing
Despite the focus on standardization in process improvement, there is limited evidence on how to
implement new standard work, especially in high contact service contexts. Decrees from upper management
have proven inadequate for instituting improvement in healthcare standard work (Cosgrove 2013, Gawande
and Lloyd 2010). This is because adopting new standard work does not automatically lead to employee
acceptance. Repenning and Sterman (2001), when studying process improvement initiatives, succinctly argue,
“You can’t buy a turnkey six sigma quality program. Rather [successful implementation requires that] it must
be developed from within” the unit (p. 65). However, the question of how to increase buy-in for standard work
changes among skeptics remains unanswered in the literature. A common refrain from employees, when
proponents of process improvement in service operations try to sell it by discussing its success in other contexts,
is that each context is different; thus, the changes that worked elsewhere would not work well in the current
“unique” context.
To address this challenge in our standard work implementation, we involved the entire care team,
including the physicians, nurses, social worker, and information technology (IT) specialists, in a discovery phase
designed to study the existing work practices and to collect data about the functioning of those practices in that
unit. This approach, consisting of service providers studying the current state of their own service delivery
process, can augment their understanding of the gaps in service quality and help “unfreeze” and initiate change.
Thus, we propose:
Proposition 1: Self-evaluation of the limitations in current work practices, conducted by the people doing the work, will help unfreeze
current processes and drive process change in high-contact service settings.
Changing
Researchers have pointed out that implementations of new standard work often result in an initial
decline in performance before generating improvements (Adler and Clark 1991, Nembhard and Tucker 2011).
For instance, in a study of lean implementation in automobile plants, Netland and Ferdows (2016) found that
7
plant productivity worsened initially before improving. An underlying reason for such initial decline is the
unplanned variations introduced by the newly developed processes (Knott and McKelvey 1999). In healthcare,
such decline in performance can be detrimental to the success of the overall implementation of new processes,
as caregivers may react to it by showing little commitment toward the change and even dismissing it as a
management fad (Repenning and Sterman 2002). Existing literature has provided little guidance on how
organizations can design process implementation initiatives to prevent or mitigate the effect of such initial
performance declines.
We argue, based on existing literature on organizational learning, that involving caregivers in designing
standard work can result in mindful execution of work processes (Laureiro-Martinez et al. 2015, Adler et al.
1999). By participating in process design, the caregivers doing the work gain a better understanding of the
relationships between steps in their work processes and the outcomes of such processes (Zollo and Winter
2002). They are able to better take care of the teething problems, separating such problems from ones that need
further investigation for improving the process. Participating in standard work design also allows them to design
in some flexibility in the use of standard work that can be useful to mitigate the effect of unplanned variations.
These arguments suggest the following regarding the role of the care team during new process implementation:
Proposition 2: In high-contact service settings, employee-driven change management is more likely to result in mindful integration
of new standard work, reducing any initial dip in performance.
In high-contact service settings, developing new processes also can benefit from appropriate inputs
from the customers. This is especially true with respect to delivering discharge instructions. Studies show that
patients have different learning styles (e.g., visual versus verbal) and are more likely to retain post-discharge
information when caregivers deliver instructions that align with their learning styles (Clancy 2009).
Unfortunately, patients are also considered as “end products” of the care delivery process, and there are mixed
evidences on the efficacy of incorporating their input in the design of care delivery processes (Tinetti and Basch
2013). Research shows that caregivers discourage the idea of using patient input, dismissing them to have
inadequate knowledge of the care delivery process (Buckley et al. 2013). However, finding a way to include
input from patients during the development of new standard practices can enable them to appreciate a care
team’s efforts and provide impetus for employees toward mindful adherence of standard work practices (Cukor
et al. 2016). This suggests:
Proposition 3: Carefully managed involvement of customers in identifying improvements in high contact service settings is useful in
building customer centricity into standard work.
Refreezing
Research shows that adherence to standard work can be challenging to sustain over time, especially in
high contact service settings (Ton and Huckman 2008, Knott 2001). Take, for example, Staats et al. (2016)’s
observation that, even after caregivers established handwashing routines under monitoring, compliance rates
dropped soon after monitoring was discontinued. Deterioration in standard work is primarily due to less-than-
8
mindful process execution, which affects the standardized aspects of processes. Barring a few descriptive
studies from Spear and Bowen (1999) and Adler et al. (1999), however, there is a dearth of guidance and
empirical support on how to sustain employee engagement in process improvement initiatives and adherence
to standard work.
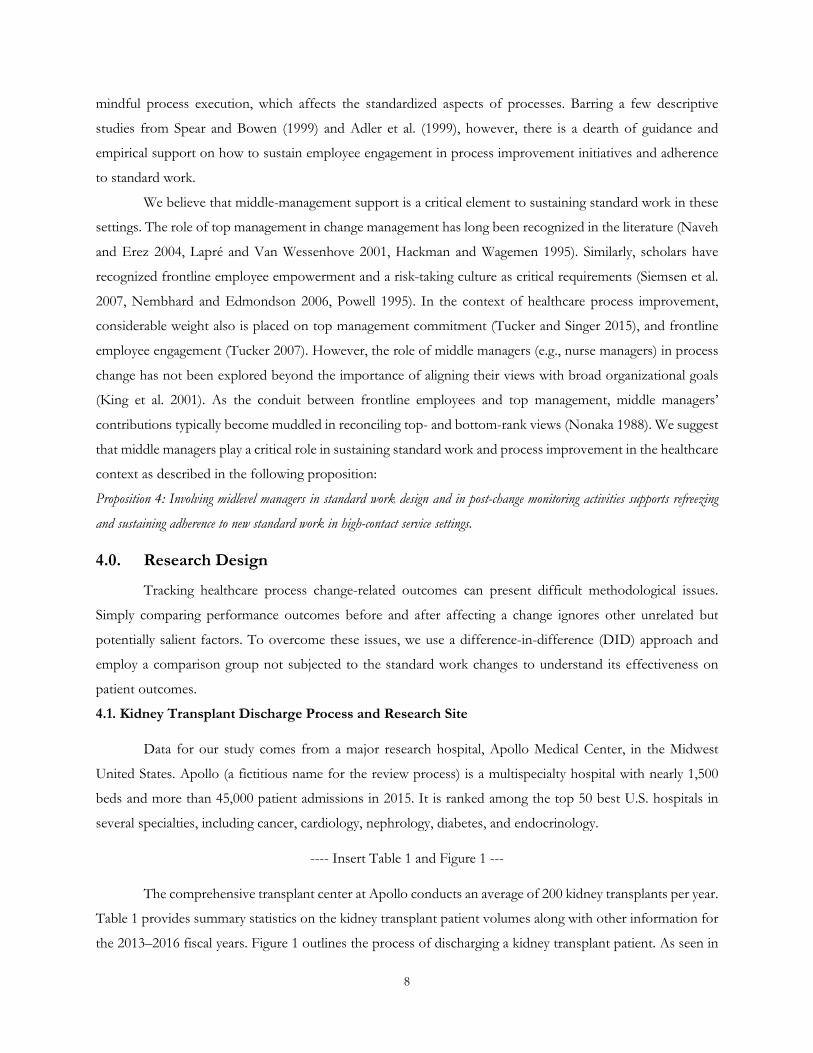
We believe that middle-management support is a critical element to sustaining standard work in these
settings. The role of top management in change management has long been recognized in the literature (Naveh
and Erez 2004, Lapré and Van Wessenhove 2001, Hackman and Wagemen 1995). Similarly, scholars have
recognized frontline employee empowerment and a risk-taking culture as critical requirements (Siemsen et al.
2007, Nembhard and Edmondson 2006, Powell 1995). In the context of healthcare process improvement,
considerable weight also is placed on top management commitment (Tucker and Singer 2015), and frontline
employee engagement (Tucker 2007). However, the role of middle managers (e.g., nurse managers) in process
change has not been explored beyond the importance of aligning their views with broad organizational goals
(King et al. 2001). As the conduit between frontline employees and top management, middle managers’
contributions typically become muddled in reconciling top- and bottom-rank views (Nonaka 1988). We suggest
that middle managers play a critical role in sustaining standard work and process improvement in the healthcare
context as described in the following proposition:
Proposition 4: Involving midlevel managers in standard work design and in post-change monitoring activities supports refreezing
and sustaining adherence to new standard work in high-contact service settings.
4.0. Research Design
Tracking healthcare process change-related outcomes can present difficult methodological issues.
Simply comparing performance outcomes before and after affecting a change ignores other unrelated but
potentially salient factors. To overcome these issues, we use a difference-in-difference (DID) approach and
employ a comparison group not subjected to the standard work changes to understand its effectiveness on
patient outcomes. 4.1. Kidney Transplant Discharge Process and Research Site
Data for our study comes from a major research hospital, Apollo Medical Center, in the Midwest
United States. Apollo (a fictitious name for the review process) is a multispecialty hospital with nearly 1,500
beds and more than 45,000 patient admissions in 2015. It is ranked among the top 50 best U.S. hospitals in
several specialties, including cancer, cardiology, nephrology, diabetes, and endocrinology.
---- Insert Table 1 and Figure 1 ---
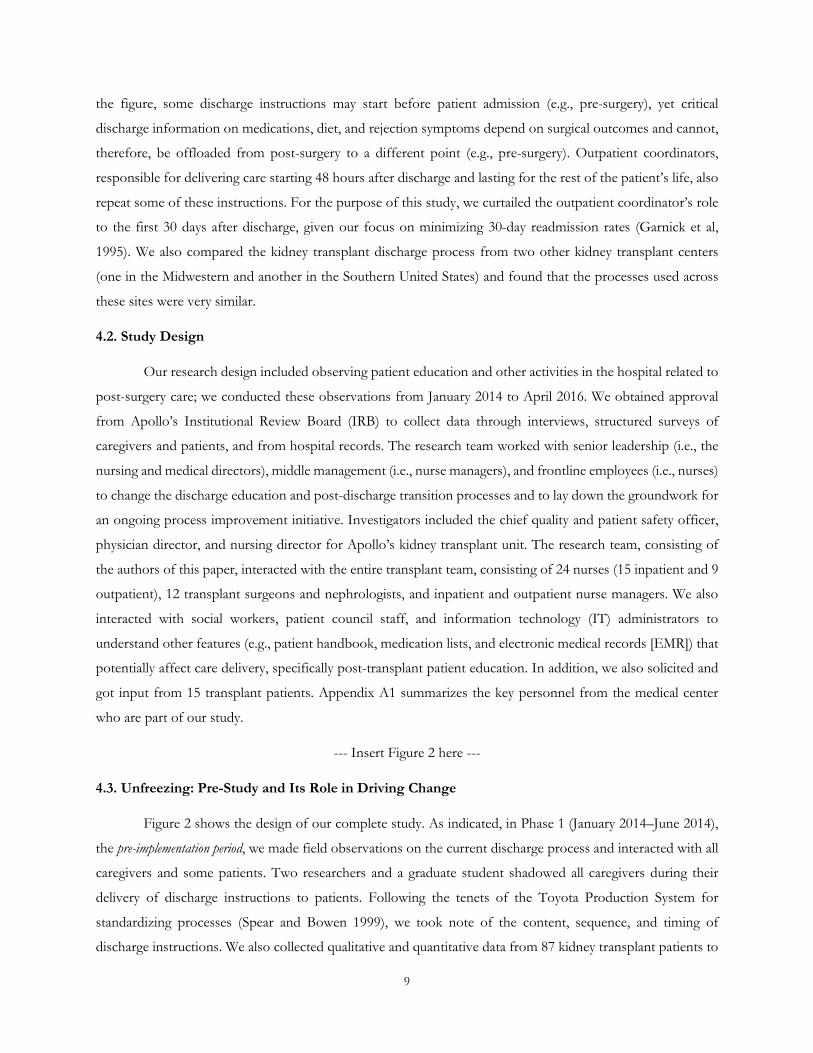
The comprehensive transplant center at Apollo conducts an average of 200 kidney transplants per year.
Table 1 provides summary statistics on the kidney transplant patient volumes along with other information for
the 2013–2016 fiscal years. Figure 1 outlines the process of discharging a kidney transplant patient. As seen in
9
the figure, some discharge instructions may start before patient admission (e.g., pre-surgery), yet critical
discharge information on medications, diet, and rejection symptoms depend on surgical outcomes and cannot,
therefore, be offloaded from post-surgery to a different point (e.g., pre-surgery). Outpatient coordinators,
responsible for delivering care starting 48 hours after discharge and lasting for the rest of the patient’s life, also
repeat some of these instructions. For the purpose of this study, we curtailed the outpatient coordinator’s role
to the first 30 days after discharge, given our focus on minimizing 30-day readmission rates (Garnick et al,
1995). We also compared the kidney transplant discharge process from two other kidney transplant centers
(one in the Midwestern and another in the Southern United States) and found that the processes used across
these sites were very similar.
4.2. Study Design
Our research design included observing patient education and other activities in the hospital related to
post-surgery care; we conducted these observations from January 2014 to April 2016. We obtained approval
from Apollo’s Institutional Review Board (IRB) to collect data through interviews, structured surveys of
caregivers and patients, and from hospital records. The research team worked with senior leadership (i.e., the
nursing and medical directors), middle management (i.e., nurse managers), and frontline employees (i.e., nurses)
to change the discharge education and post-discharge transition processes and to lay down the groundwork for
an ongoing process improvement initiative. Investigators included the chief quality and patient safety officer,
physician director, and nursing director for Apollo’s kidney transplant unit. The research team, consisting of
the authors of this paper, interacted with the entire transplant team, consisting of 24 nurses (15 inpatient and 9
outpatient), 12 transplant surgeons and nephrologists, and inpatient and outpatient nurse managers. We also
interacted with social workers, patient council staff, and information technology (IT) administrators to
understand other features (e.g., patient handbook, medication lists, and electronic medical records [EMR]) that
potentially affect care delivery, specifically post-transplant patient education. In addition, we also solicited and
got input from 15 transplant patients. Appendix A1 summarizes the key personnel from the medical center
who are part of our study.
--- Insert Figure 2 here ---
4.3. Unfreezing: Pre-Study and Its Role in Driving Change
Figure 2 shows the design of our complete study. As indicated, in Phase 1 (January 2014–June 2014),
the pre-implementation period, we made field observations on the current discharge process and interacted with all
caregivers and some patients. Two researchers and a graduate student shadowed all caregivers during their
delivery of discharge instructions to patients. Following the tenets of the Toyota Production System for
standardizing processes (Spear and Bowen 1999), we took note of the content, sequence, and timing of
discharge instructions. We also collected qualitative and quantitative data from 87 kidney transplant patients to
10
ascertain the relationship between care quality and patient outcomes (see Appendix A2 for the type of data
collected during Phase 1). Using this data, we examined the relationships among standardized and patient-
centric aspects of the discharge process and 30-day readmission outcomes. Findings from that study published
in a medical journal (reference deleted for review) indicated that a lack of standard work was associated with
increases in patient anxiety levels and readmissions. These findings generated an awareness of the need to make
changes in the post-transplant education process used at the unit.
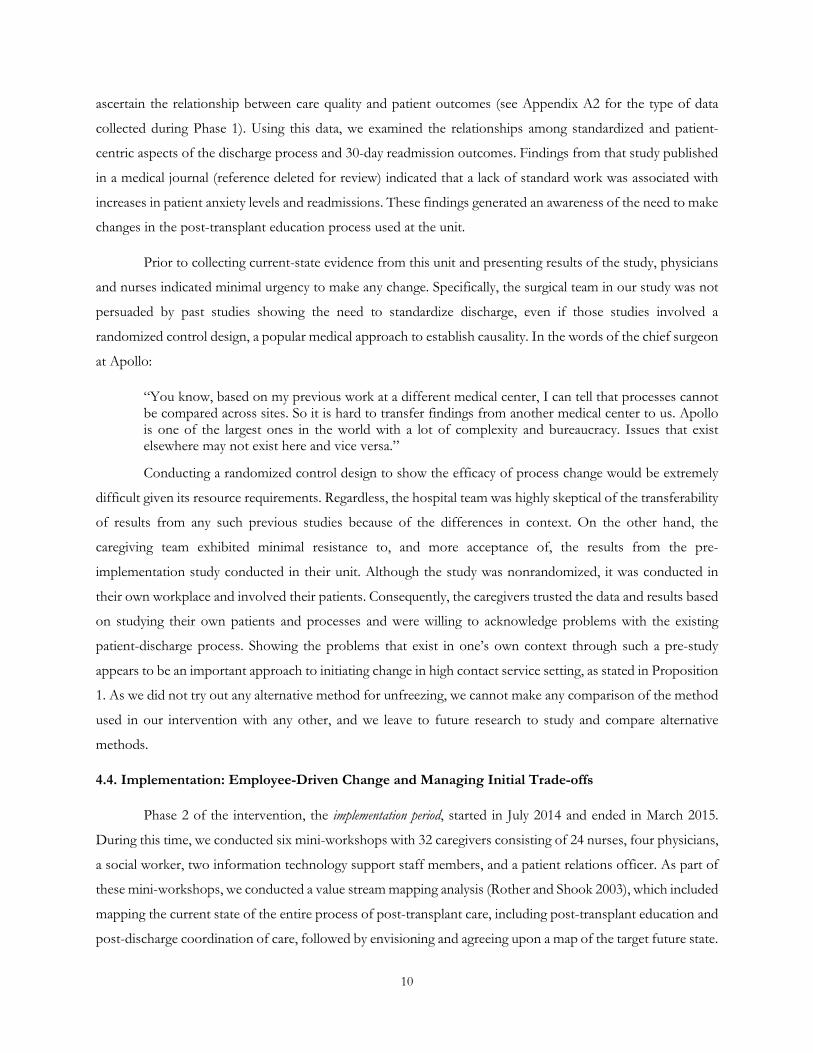
Prior to collecting current-state evidence from this unit and presenting results of the study, physicians
and nurses indicated minimal urgency to make any change. Specifically, the surgical team in our study was not
persuaded by past studies showing the need to standardize discharge, even if those studies involved a
randomized control design, a popular medical approach to establish causality. In the words of the chief surgeon
at Apollo:
“You know, based on my previous work at a different medical center, I can tell that processes cannot be compared across sites. So it is hard to transfer findings from another medical center to us. Apollo is one of the largest ones in the world with a lot of complexity and bureaucracy. Issues that exist elsewhere may not exist here and vice versa.”
Conducting a randomized control design to show the efficacy of process change would be extremely
difficult given its resource requirements. Regardless, the hospital team was highly skeptical of the transferability
of results from any such previous studies because of the differences in context. On the other hand, the
caregiving team exhibited minimal resistance to, and more acceptance of, the results from the pre-
implementation study conducted in their unit. Although the study was nonrandomized, it was conducted in
their own workplace and involved their patients. Consequently, the caregivers trusted the data and results based
on studying their own patients and processes and were willing to acknowledge problems with the existing
patient-discharge process. Showing the problems that exist in one’s own context through such a pre-study
appears to be an important approach to initiating change in high contact service setting, as stated in Proposition
1. As we did not try out any alternative method for unfreezing, we cannot make any comparison of the method
used in our intervention with any other, and we leave to future research to study and compare alternative
methods.
4.4. Implementation: Employee-Driven Change and Managing Initial Trade-offs
Phase 2 of the intervention, the implementation period, started in July 2014 and ended in March 2015.
During this time, we conducted six mini-workshops with 32 caregivers consisting of 24 nurses, four physicians,
a social worker, two information technology support staff members, and a patient relations officer. As part of
these mini-workshops, we conducted a value stream mapping analysis (Rother and Shook 2003), which included
mapping the current state of the entire process of post-transplant care, including post-transplant education and
post-discharge coordination of care, followed by envisioning and agreeing upon a map of the target future state.
11
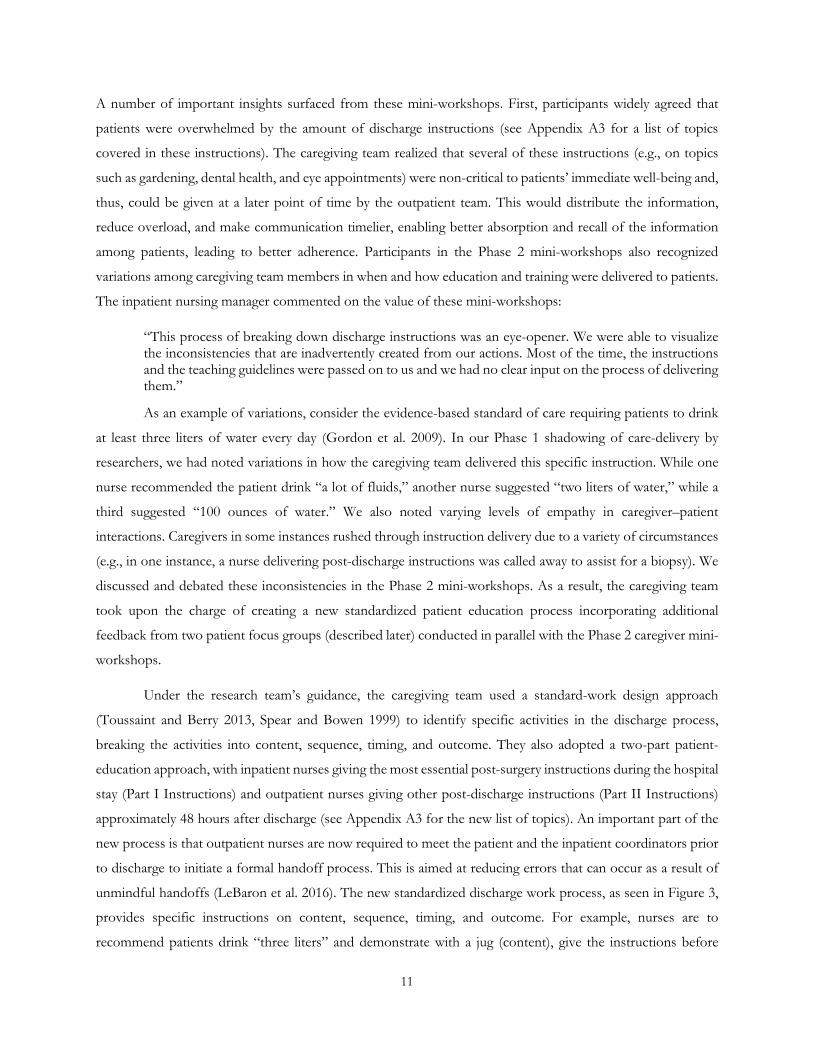
A number of important insights surfaced from these mini-workshops. First, participants widely agreed that
patients were overwhelmed by the amount of discharge instructions (see Appendix A3 for a list of topics
covered in these instructions). The caregiving team realized that several of these instructions (e.g., on topics
such as gardening, dental health, and eye appointments) were non-critical to patients’ immediate well-being and,
thus, could be given at a later point of time by the outpatient team. This would distribute the information,
reduce overload, and make communication timelier, enabling better absorption and recall of the information
among patients, leading to better adherence. Participants in the Phase 2 mini-workshops also recognized
variations among caregiving team members in when and how education and training were delivered to patients.
The inpatient nursing manager commented on the value of these mini-workshops:
“This process of breaking down discharge instructions was an eye-opener. We were able to visualize the inconsistencies that are inadvertently created from our actions. Most of the time, the instructions and the teaching guidelines were passed on to us and we had no clear input on the process of delivering them.”
As an example of variations, consider the evidence-based standard of care requiring patients to drink
at least three liters of water every day (Gordon et al. 2009). In our Phase 1 shadowing of care-delivery by
researchers, we had noted variations in how the caregiving team delivered this specific instruction. While one
nurse recommended the patient drink “a lot of fluids,” another nurse suggested “two liters of water,” while a
third suggested “100 ounces of water.” We also noted varying levels of empathy in caregiver–patient
interactions. Caregivers in some instances rushed through instruction delivery due to a variety of circumstances
(e.g., in one instance, a nurse delivering post-discharge instructions was called away to assist for a biopsy). We
discussed and debated these inconsistencies in the Phase 2 mini-workshops. As a result, the caregiving team
took upon the charge of creating a new standardized patient education process incorporating additional
feedback from two patient focus groups (described later) conducted in parallel with the Phase 2 caregiver mini-
workshops.
Under the research team’s guidance, the caregiving team used a standard-work design approach
(Toussaint and Berry 2013, Spear and Bowen 1999) to identify specific activities in the discharge process,
breaking the activities into content, sequence, timing, and outcome. They also adopted a two-part patient-
education approach, with inpatient nurses giving the most essential post-surgery instructions during the hospital
stay (Part I Instructions) and outpatient nurses giving other post-discharge instructions (Part II Instructions)
approximately 48 hours after discharge (see Appendix A3 for the new list of topics). An important part of the
new process is that outpatient nurses are now required to meet the patient and the inpatient coordinators prior
to discharge to initiate a formal handoff process. This is aimed at reducing errors that can occur as a result of
unmindful handoffs (LeBaron et al. 2016). The new standardized discharge work process, as seen in Figure 3,
provides specific instructions on content, sequence, timing, and outcome. For example, nurses are to
recommend patients drink “three liters” and demonstrate with a jug (content), give the instructions before
12
addressing signs of rejection (sequence), spend about a minute on the activity (timing), and confirm the patient
understood the instructions (output). Specifying standard work in terms of content, sequence, timing, and
outcome by the caregiving team led to mindful execution of new standard work, and perhaps resulted in
minimizing any decline in performance in the initial stages of the change (as indicated by the statistical analysis
results described later), supporting Proposition 2.
We also conducted two patient focus groups in September and December 2014 in parallel with the
caregiver mini-workshops. The parallel conduct of these patient focus groups enabled an interchange of
questions across both forums while maintaining some separation. This combination helped consider aspects
that warrant either more strict standardization or more flexibility-in-use for caregivers in the design of standard
work. We invited to the focus group meetings 15 patients who had undergone a transplant within the last six
months. Family members providing post-discharge care accompanied most patients. Through these workshops,
the caregiving team integrated patient needs and preferences in designing the care delivery process. For the
focus groups, we ensured diversity among patients in terms of age, gender, donor type (cadaveric kidney versus
living donor), pre-existing conditions, socioeconomic status, and education level. The first patient focus group
meeting was used to obtain feedback on the topics included in the two parts of the discharge work (i.e., the
contents of Part I and II instructions). It is important to note that patient-feedback was primarily used to inform
sequencing, not content, which was determined based on evidence-based best practices. The second patient
focus group discussed outcomes and instruction delivery aspects (e.g., use of visuals, teach-back standards) and
helped resolve inconsistencies in the delivery. For example, patients noted the confusion that arose when
inpatient nurses used a medication’s chemical name (e.g., “Cyclosporine”) while outpatient nurses used its
generic name (e.g., “Neural”). We worked to resolve such issues through the caregiver mini-workshops being
conducted in the same period and then rolled out a training program for all the nurses on the delivery of new
instructions.
In general, having patient input in parallel offered insights that were not otherwise considered by the
caregiving team. As an example, data from the focus groups suggested that some patients preferred visuals for
discharge instructions while others preferred detailed explanations through narratives. This information was
then used by the caregiving team, which developed both visual and conversational teaching (teach-back)
techniques to accommodate the variation among patients. In line with proposition 3, having patient feedback
through parallel workshops offered newer insights into improvement opportunities. Figure 2 represents the
activities that constituted the research team’s intervention that was completed by April 2015.
4.5. Refreezing: Sustaining Standard Work
Phase 3 represents the post-implementation period. The research team observed the delivery of new
discharge instructions, interacted with patients, and collected qualitative feedback on the new design during this

13
phase. We also facilitated activities for institutionalizing continuous improvement of the discharge process by
helping the caregivers set up daily (inpatient) and weekly (outpatient) huddles to address day-to-day issues and
further improvements (Provost et al. 2015). These huddles are standup meetings of about 10 minutes and focus
on solving problems and sharing best practices. In the past, this hospital unit had started similar huddle-
meetings on two separate occasions and both efforts had been short-lived. In 2011, senior management had
implemented huddles (top-down) but the initiative had lasted only a few months, apparently due to a lack of
buy-in from the frontline caregivers. Later, in 2012, morning shift frontline caregivers had initiated huddles
(bottom-up) to solve discharge-related problems, but even these were discontinued after a few months,
reportedly due to lack of management support and resources.
This time around, with input from our research team, frontline nurses designed and developed the
huddles with support from middle and top management. In fact, outpatient and inpatient nurse managers (i.e.
middle management) made this a part of their weekly and bi-weekly routines. They created a structure to
facilitate the huddles (less than 10 minutes), monitored them, and offered problem-solving support. This gave
rise to a weekly, Monday meeting between the inpatient and outpatient manager that the nursing director (senior
management) also attended. Managers in these meetings shared information on patients and the discharge
process, and updated each other on huddles in their respective units. The use of these huddles organically
created a tiered management structure that now allows important frontline issues to cascade through middle
management to senior management, and this appears to have helped sustain standard work adherence as well
as process improvement, supporting Proposition 4. Figure 3 provides an overview of the elements of the
discharge process after the standard work implementation. It also shows the tiered management structure that
originated from these changes. The huddles that began in May 2015 were still being regularly conducted after
22 months of the initial implementation in February 2017.
Appendix A4 provides details on the huddles and the role of middle management. When attending
these huddles, we found nurse managers to be pivotal in ensuring frontline nurses had the necessary resources.
They also met with the nursing director (senior leadership) on a weekly basis to communicate information from
across the hospital. All the changes and improvements to the discharge process made during these huddles
were tweaks to the newly designed standard work (i.e., nothing changed with respect to the content of the
discharge process). Overall, we were able to develop a “learning community” (Brown and Duguid 1991) at the
medical center through our intervention2. Our study ended in April 2016 with the collection of interview and
survey data from more than 80 patients who underwent transplant after the deployment of the new discharge
process in June 2015. In order to enable a comparison, we used the same questions for our interviews and
2 As an example, the caregiving team has begun work on a follow-up project focusing on the role of former transplant patients in mentoring new transplant recipients on how to manage post-discharge anxiety and psychological stress.
14
survey that we had used in Phase 1. We include these data to analyze the impact of our intervention and the
resulting process changes.
--- Insert Figure 3 here ----
5.0. Patient and Process Data 5.1 Treatment Group: Kidney Transplant Discharge Process
The intervention in our study was the redesign of the education and training process for patients after kidney
transplant surgeries. The research team had access to various forms of secondary data related to before and
after the process redesign intervention, as well as primary data collected during the intervention. These multiple
sources of data enabled us to triangulate our findings. The first author in this study was a constant participant
throughout the process redesign intervention. The first author attended all meetings with caregivers and
patients, shadowed with nurses and physician leadership before and after the intervention, and reviewed
patients’ medical and other information. Overall, the research team conducted more than 50 semi-structured
interviews with patients and caregivers before, during, and after the intervention. These interviews enabled us
to gather rich and detailed data on the process and its context. We also collected data from patients and
caregivers on various aspects of healthcare delivery (pre- and post-intervention). The patient surveys were used
to collect information on communication with physicians, consistency of processes, level of empathy in care
delivery, and clarity of discharge instructions.
During 2013–2016, 571 patients underwent kidney transplants at the Apollo Medical Center (See Table
2). Of those, 304 patients received cadaveric kidneys (53%) while 267 received them from living donors (47%).
40% of patients were female, and the average age of all patients was 50.3 years. We conducted statistical tests
to compare the averages for different descriptive characteristics for our sample with averages for data obtained
from the National Kidney Foundation for all transplants conducted in the United States during the study period.
Average readmission rates observed in our sample were 40%, not significantly different from the national
average (p>0.25). Differences in other demographic and donor-type statistics also were non-significant
(p>0.30). In addition to readmissions, we also had access to data from the HCAHPS patient satisfaction survey
for the hospital unit. Scores from this survey have become a critical target of hospital administrators’
improvement efforts since the Centers for Medicare and Medicaid Services (CMS) reimbursements and
penalties have been tied to HCAHPS scores through its value based purchasing (VBP) program
(Chandrasekaran et al. 2012). We aggregated HCAHPS monthly scores at the patients’ post-surgery hospital
unit level where post-surgery education and training was delivered. Given the importance of these scores for
reimbursements, we also looked at monthly changes to the overall survey measure from our intervention.
5.2. Control Group – Other Transplant Recipients
Although we collected pre- and post-intervention data from the kidney transplant process, other
hospital-level activities—EMR implementation, hospital-wide training programs, and health system design
15
changes—occurring during the period could have also impacted patient outcomes. Thus, assessing the efficacy
of our intervention solely based on a pre- vs. post-intervention analysis would be problematic. One approach
to control for characteristics unobservable to the researcher that may influence outcomes (Imbens and
Woolridge 2009) would be to collect data from another hospital’s kidney transplant site that did not undergo
this intervention. However, such an approach would not resolve the potential impact of internal hospital
improvement initiatives that could additionally affect patient outcomes. Another approach would be collecting
data from another transplant process within the same hospital and using it as a control group, adjusting for
patient and other transplant characteristics. We adopted this latter approach as such a comparison provides a
stronger test of the intervention, given commonalities between discharge processes, organizational culture, and
incentives.
Through discussions with the chief medical officer, and quality and patient safety officers at Apollo,
we identified the heart and liver transplant processes as our control group. Patients undergoing heart and liver
transplants experience similar outpatient questions as kidney transplant recipients (Dew et al. 2007). The post-
transplant education delivery process, moreover, shares many commonalities with the kidney transplant
process, as shown in Figure 1. At Apollo, an internal quality and patient-safety committee had streamlined all
three processes prior to our study. It is important to note that the heart and liver units only experienced routine
hospital-wide quality and safety efforts at Apollo, also applied to the kidney unit, and did not undergo other
initiatives such as our intervention, during our period of study. For these reasons, we collected patient and
process data for all heart and liver transplant patients for the same period (January 2013–April 2016). During
this period, 62 heart transplants and 103 liver transplants were conducted at Apollo. Table 2 provides details
on the patient and process characteristics for this control group.
5.3 Variables
30-day Readmission. The first dependent variable of interest is whether the patient was readmitted to the
Apollo or any other hospital within 30 days after being discharged from Apollo. The 30-day readmission rate
is a performance measure included in the VBP and readmission reduction programs of CMS (CMS 2016). The
overall readmission rates for our sample were consistent with the national averages for the treatment and
control groups.
Overall Quality Rating. For our second dependent variable, we collected unit-level HCAHPS scores, which
assess overall quality using a scale of 0-10 (10 being the best) as perceived by the patients during their stay.
Consistent with previous studies (Senot et al. 2016, Chandrasekaran et al. 2012), we used the percentage of
patients who answered “always” (scores 8, 9 and 10) as a measure of overall quality, and adjusted them for
factors such as education, self-rated health, primary language, age, socioeconomic status, and delay in survey
16
response (see hcapsonline.org for more details). We obtained these scores for the treatment and control group
units for each month during our study period3.
Implementation Phases. In our study, we specifically focused on differences in readmissions and HCAHPS
scores between the treatment group (kidney) and control group (heart and liver) across three different time
periods. T3 is a binary variable representing transplants at both treatment and control units between May 2015
and April 2016. It is used to test the performance differences across units’ post-implementation period (i.e.,
Phase 3). There were 167 kidney transplants (used to measure treatment effect), 37 liver, and 30 heart
transplants (used as control group) during this time period. T2 captures all transplants performed between July
2014 and March 2015 across both the units, which helps test their performance differences during the
implementation period (i.e., Phase 2). This period saw 147 kidney, 15 heart, and 22 liver transplants. T1 captures
all transplants performed between Jan 2014 and June 2014, which we use to investigate the differences during
pre-implementation period (i.e., Phase 1). During this period, there were 74 kidney, 14 liver, and seven heart
transplants.
Patient Controls. Our analyses controlled for several patient-level factors that can potentially impact
readmissions and HCAHPS scores. Our discussions with the medical team helped identify the following
controls: patient age, length of stay, gender, type of transplanted organ4 (living vs. cadaveric), and patient
ethnicity (African-American, Caucasian, and others). We also controlled for pre-existing conditions such as
diabetes, transplanted organ function (graft function) upon discharge (Lubetzky et al. 2016), and 30-day
mortality. Finally, we added dummy variables to control for the year and quarter of transplant for readmission
analyses, and year and month dummies for overall quality ratings (HCAHPS scores) analyses.
Process Controls. In addition to patient characteristics, other process changes in both the treatment and
control units could affect the discharge process. Our conversations with hospital leadership suggested several
related measures which we controlled for in the analyses. VBP is a binary variable that captures the effect of
the October 2013-launched CMS program, which can affect the discharge process across both the treatment
and control groups. In addition, we included the following three factors: EMR implementation (EMR) that put
caregivers through additional training; outpatient EMR glitches and integration issues at the outpatient facilities
for both groups (Integration); and transition of care for the kidney unit (Transition), reflecting the June to August
2015 period when the outpatient clinic moved between facilities. We also checked the turnover levels for nurses,
physicians, and surgeons during our study period, and found them to be minimal. For the analyses of the overall
quality rating, we controlled for the number of transplants conducted by the corresponding units since a larger
number of transplants during a given month could affect the participation rates in the HCAHPS surveys.
3 All kidney transplant recipients stayed in Unit A while all liver and some heart transplants patients stayed in Unit B after surgery. 4 All of our heart and liver transplants were cadaveric organs
17
Finally, we verified with the surgical team that patients were readmitted if they had electrolyte abnormalities
and/or organ dysfunctions. These criteria remained the same throughout our study period, minimizing
concerns of administrative changes that could have impacted our results. Table 2 presents the definitions, and
means and standard deviations for all variables used in our analyses.
--- Insert Table 2 here ---
6.0. Analyses
From the 736 patients in our sample, we deleted 34 patients who had multiple transplants due to rejections that
occurred during their post-surgery hospital stay, and which lasted for more than 30 days after the initial
procedure. Thus, the final sample for analyses included 702 patients (563 kidney, 48 heart, and 91 liver).
We used a difference in difference (DID) approach to estimate the causal effects of the change in
patient-education standard work on readmission outcomes. Studying the DID of readmissions between kidney
transplant and other transplant recipients over time allowed us to control for unobservable performance-
influencing characteristics (Imbens and Wooldrige 2009). Several other researchers recommend using this
approach when dealing with non-randomized experiments (Dimick and Ryan 2014). The new standard work
implementation constitutes our experimental treatment or intervention that resulted in an exogenous shock to
the transplant discharge process beginning in January 2014. This approach accounts for differences in baseline
readmission rates across the two transplant groups and mitigates the effects of any ongoing hospital
improvement efforts independent of our intervention.
Before using the DID approach, we first examined whether readmission rates between kidney and
other transplant groups exhibited a parallel trend prior to our intervention (Abadie 2005). We analyzed quarterly
readmission rates between the treatment and control group for the period from January 2013 to June 2014.
During this period, there were 367 kidney, 29 heart, and 64 liver transplants. Comparing the readmission slopes
for the two groups—kidney versus other—suggests the coefficients were not statistically different (χ2 = 4.41,
p = 0.35). Thus, any post-implementation reduction in readmission would indicate the presence of treatment
effects.
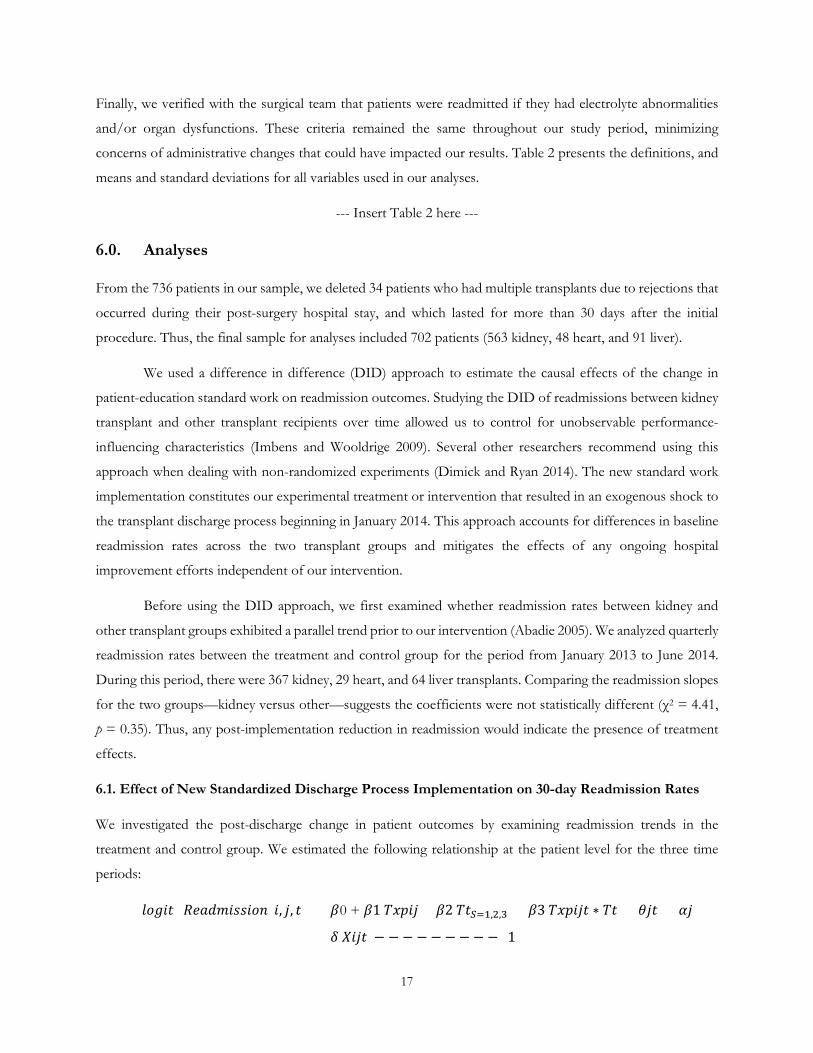
6.1. Effect of New Standardized Discharge Process Implementation on 30-day Readmission Rates
We investigated the post-discharge change in patient outcomes by examining readmission trends in the
treatment and control group. We estimated the following relationship at the patient level for the three time
periods:
𝑙𝑙𝑙𝑙𝑙𝑙𝑙𝑙𝑙𝑙 (𝑅𝑅𝑅𝑅𝑅𝑅𝑅𝑅𝑅𝑅𝑙𝑙𝑅𝑅𝑅𝑅𝑙𝑙𝑙𝑙𝑅𝑅)𝑙𝑙, 𝑗𝑗, 𝑙𝑙 = 𝛽𝛽0 + 𝛽𝛽1 𝑇𝑇𝑇𝑇𝑇𝑇𝑙𝑙𝑗𝑗 + 𝛽𝛽2 𝑇𝑇𝑙𝑙𝑆𝑆=1,2,3 + 𝛽𝛽3 𝑇𝑇𝑇𝑇𝑇𝑇𝑙𝑙𝑗𝑗𝑙𝑙 ∗ 𝑇𝑇𝑙𝑙 + 𝜃𝜃𝑗𝑗𝑙𝑙 + 𝛼𝛼𝑗𝑗 +
𝛿𝛿 𝑋𝑋𝑙𝑙𝑗𝑗𝑙𝑙 −−−−−−−−− (1)
18
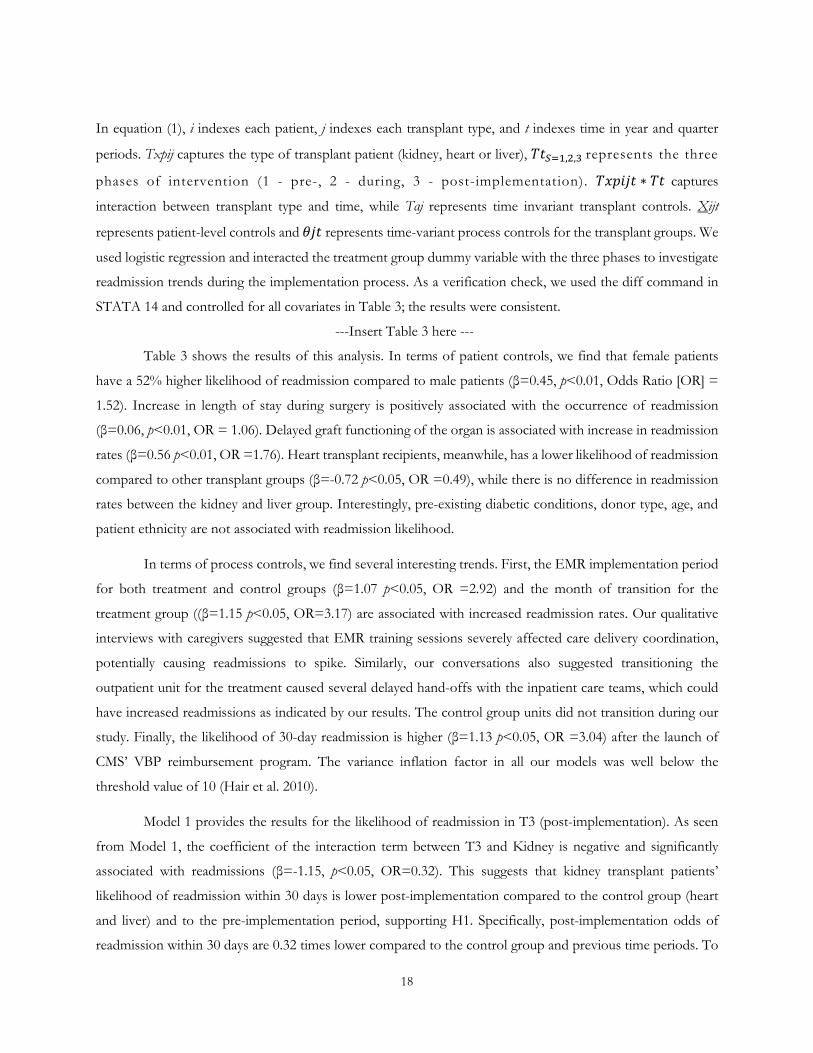
In equation (1), i indexes each patient, j indexes each transplant type, and t indexes time in year and quarter
periods. Txpij captures the type of transplant patient (kidney, heart or liver), 𝑇𝑇𝑙𝑙𝑆𝑆=1,2,3 represents the three
phases of intervention (1 - pre-, 2 - during, 3 - post-implementation). 𝑇𝑇𝑇𝑇𝑇𝑇𝑙𝑙𝑗𝑗𝑙𝑙 ∗ 𝑇𝑇𝑙𝑙 captures
interaction between transplant type and time, while Tαj represents time invariant transplant controls. Xijt
represents patient-level controls and 𝜃𝜃𝑗𝑗𝑙𝑙 represents time-variant process controls for the transplant groups. We
used logistic regression and interacted the treatment group dummy variable with the three phases to investigate
readmission trends during the implementation process. As a verification check, we used the diff command in
STATA 14 and controlled for all covariates in Table 3; the results were consistent.
---Insert Table 3 here ---
Table 3 shows the results of this analysis. In terms of patient controls, we find that female patients
have a 52% higher likelihood of readmission compared to male patients (β=0.45, p<0.01, Odds Ratio [OR] =
1.52). Increase in length of stay during surgery is positively associated with the occurrence of readmission
(β=0.06, p<0.01, OR = 1.06). Delayed graft functioning of the organ is associated with increase in readmission
rates (β=0.56 p<0.01, OR =1.76). Heart transplant recipients, meanwhile, has a lower likelihood of readmission
compared to other transplant groups (β=-0.72 p<0.05, OR =0.49), while there is no difference in readmission
rates between the kidney and liver group. Interestingly, pre-existing diabetic conditions, donor type, age, and
patient ethnicity are not associated with readmission likelihood.
In terms of process controls, we find several interesting trends. First, the EMR implementation period
for both treatment and control groups (β=1.07 p<0.05, OR =2.92) and the month of transition for the
treatment group ((β=1.15 p<0.05, OR=3.17) are associated with increased readmission rates. Our qualitative
interviews with caregivers suggested that EMR training sessions severely affected care delivery coordination,
potentially causing readmissions to spike. Similarly, our conversations also suggested transitioning the
outpatient unit for the treatment caused several delayed hand-offs with the inpatient care teams, which could
have increased readmissions as indicated by our results. The control group units did not transition during our
study. Finally, the likelihood of 30-day readmission is higher (β=1.13 p<0.05, OR =3.04) after the launch of
CMS’ VBP reimbursement program. The variance inflation factor in all our models was well below the
threshold value of 10 (Hair et al. 2010).
Model 1 provides the results for the likelihood of readmission in T3 (post-implementation). As seen
from Model 1, the coefficient of the interaction term between T3 and Kidney is negative and significantly
associated with readmissions (β=-1.15, p<0.05, OR=0.32). This suggests that kidney transplant patients’
likelihood of readmission within 30 days is lower post-implementation compared to the control group (heart
and liver) and to the pre-implementation period, supporting H1. Specifically, post-implementation odds of
readmission within 30 days are 0.32 times lower compared to the control group and previous time periods. To

19
better understand this effect, we created a conditional effects plot (Figure 4) using the margins command in
STATA. Here, the predicted probabilities of readmission for the control group remain essentially the same
before and after T3, while changes to the discharge process drop the predicted probability by 25% in the
treatment group (p<0.05).
To assess the effectiveness of our intervention, we also calculated the net savings in terms of bed
occupancy rates and operating costs. We could obtain direct costs (e.g., room and board, labs, medical supplies,
and pharmacy) and indirect costs (e.g., lab equipment, patient services, salaries, and benefits) data for every
readmission that occurred during the study period. See Appendix A5 for details. The hospital readmission
reduction program (HRRP) currently penalizes 30-day readmissions for heart attack, heart failure, and
pneumonia conditions, and does not apply to the transplant population (see cms.gov). As a result, hospitals are
currently reimbursed for transplant readmissions. Nevertheless, our data show that total kidney transplant
readmissions decreased from 37.29% in pre-implementation and implementation periods (T1 and T2) to
31.93% during the post-implementation period (T3). This equates to a raw readmission reduction of 5.35%, or
about nine fewer readmissions among T3’s 167 kidney patients. The average total cost for a readmitted patient
was about $14,804, making total cost savings through reductions to be about $133,236 in this period. This is a
conservative estimate, and moreover, does not account for other intangible benefits such as increased transplant
activity at the hospital by avoiding readmissions, and improved patient quality of life after discharge.
--- Insert Figure 4 here ---
Models 2 and 3 show the likelihood of readmission during T2 (implementation period) and T1 (pre-
implementation). It is important to note that these regressions were run comparing the discharge process of
the treatment group (kidney) with the control group (heart and liver) and pre-phase characteristics (pre-T2 and
pre-T1), which explains different sample sizes for both these regressions (n = 487 patients for T2 and n = 308
for T1). It is also important to note that some of process controls (e.g., Move and Transition) occurred after T2,
and were therefore dropped in the pre-implementation and implementation models. VBP, meanwhile, launched
just prior to T1, thus was dropped from this analysis. Results of Models 2 and 3 highlight several important
observations: The treatment group’s likelihood of readmission during these two periods is no different than
that of the control group and pre-phase time periods (p>0.20). This suggests that the benefits of our
intervention can only be seen after the discharge process is fully implemented. Nevertheless, we also find no
deterioration in performance during these periods compared to the control group, as expected based on the
prior literature (Fedrows 2015, Tyre and Orlikowski 1994). Performance across both the treatment and control
group, however, is worse than the other time periods. That is, the coefficient of T2 is significantly associated
with readmissions (β=1.12, p<0.10, OR=3.07) suggesting the likelihood of readmission within 30 days is
significantly higher during this period. Without a DID approach, we would have incorrectly concluded

20
performance deteriorated during our study. We do not find this effect for T1. Finally, we also find that the
patient controls and time-relevant process controls remain consistent across all three phases, suggesting their
effects are consistent during the study period.
6.2. Effect of Standardized Discharge Process Implementation on Overall Quality of Care
We also had access to monthly HCAHPS data for both the kidney transplant unit (Unit A) and the
liver5 unit (Unit B) in the hospital. Appendix A shows HCAHPS monthly trends for the overall quality rating
for both the units. It is important to note that these units were located in different buildings in the hospital and
had no common caregivers. This reduced the possibility of carry-over learning effects between the two groups
that would have impacted our study. We estimated the following relationship between the implementation
phases and the overall quality ratings at the unit level.
𝑂𝑂𝑂𝑂𝑅𝑅𝑂𝑂𝑅𝑅𝑙𝑙𝑙𝑙 𝑄𝑄𝑄𝑄𝑅𝑅𝑙𝑙𝑙𝑙𝑙𝑙𝑦𝑦 𝑅𝑅𝑅𝑅𝑙𝑙𝑙𝑙𝑅𝑅𝑙𝑙𝑅𝑅 𝑙𝑙, 𝑙𝑙 = 𝛽𝛽0 + 𝛽𝛽1 𝑇𝑇𝑇𝑇𝑇𝑇𝑙𝑙 + 𝛽𝛽2 𝑇𝑇𝑙𝑙𝑆𝑆=1,2,3 + 𝛽𝛽3 𝑇𝑇𝑇𝑇𝑇𝑇𝑙𝑙𝑙𝑙 ∗ 𝑇𝑇𝑙𝑙 + 𝜃𝜃𝑗𝑗𝑙𝑙 + 𝛼𝛼𝑗𝑗 +
−−−−−−−−−(2)
In equation (2), i indexes the transplant type and t indexes time in year and months periods. Txpi
captures the type of transplant patient (i = 1 kidney; i = 0 heart or liver), 𝑇𝑇𝑙𝑙𝑆𝑆=1,2,3 represents the three
phases of the intervention (1- pre-, 2- during, and 3- post-implementation). 𝑇𝑇𝑇𝑇𝑇𝑇𝑙𝑙𝑙𝑙 ∗ 𝑇𝑇𝑙𝑙 captures
transplant type and time interaction, while Tαj represents time invariant transplant controls and 𝜃𝜃𝑗𝑗𝑙𝑙 represents
time-variant process controls for the transplant groups.
--- Insert Table 4 here ---
Testing the HCAHPS scores between the two units, we find the coefficients to be statistically similar
(χ2 = 1.48, p = 0.23) pre-intervention, indicating that the slopes are similar across the groups. Between January
2013 and April 2016, raw overall quality scores at the kidney unit increase 10% while those at the liver unit
decrease 11%. Table 4 gives the DID analyses to test the effect of intervention across all three phases between
the control and treatment group. Similar to our earlier analyses, we included all process-level controls (e.g.,
VBP, EMR, etc.) along with relevant time intervals (e.g., T3, T2, and T1) when comparing the two units, hence
the difference in the number of months. Models 4, 5, and 6 provide results for post-implementation,
implementation and pre-implementation periods, respectively.
5 We did not include the unit in which heart transplant patients stayed because that unit also had patients who had undergone other cardiac procedures, and as such, might not adequately reflect true HCAHPS scores related to transplants. Additionally, there were a few beds in the liver unit that were dedicated for heart transplant patients, given the similarities in post-transplant care and education.
21
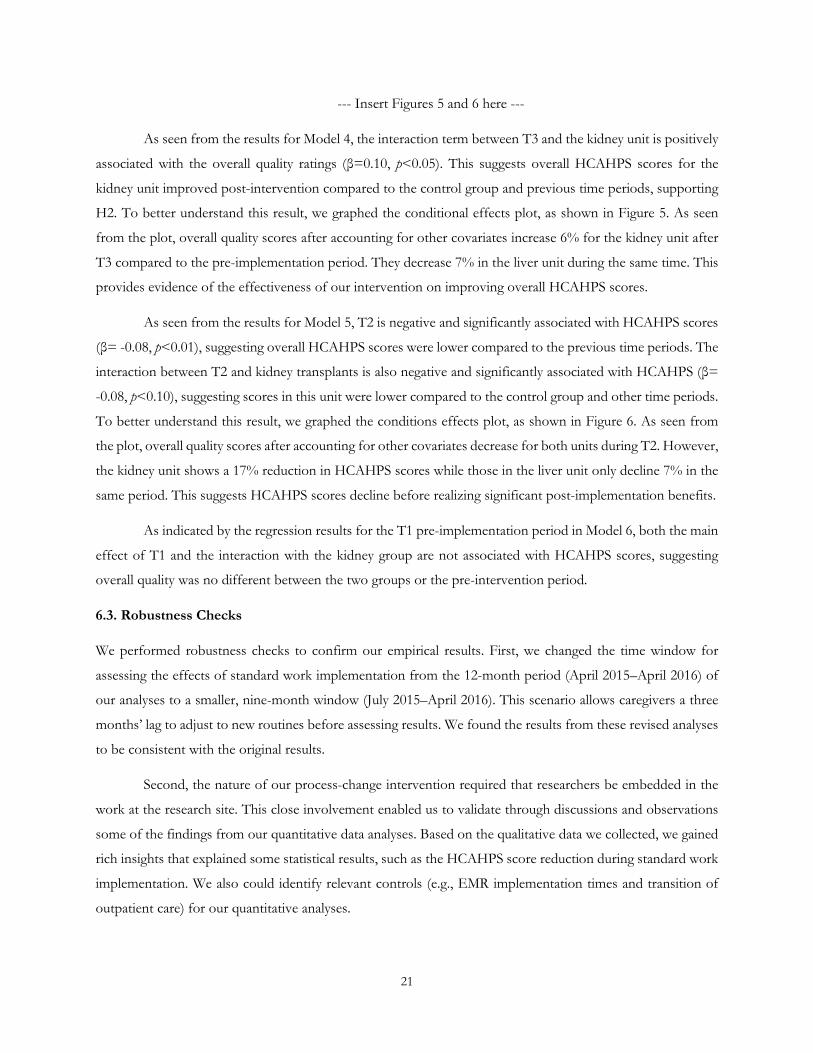
--- Insert Figures 5 and 6 here ---
As seen from the results for Model 4, the interaction term between T3 and the kidney unit is positively
associated with the overall quality ratings (β=0.10, p<0.05). This suggests overall HCAHPS scores for the
kidney unit improved post-intervention compared to the control group and previous time periods, supporting
H2. To better understand this result, we graphed the conditional effects plot, as shown in Figure 5. As seen
from the plot, overall quality scores after accounting for other covariates increase 6% for the kidney unit after
T3 compared to the pre-implementation period. They decrease 7% in the liver unit during the same time. This
provides evidence of the effectiveness of our intervention on improving overall HCAHPS scores.
As seen from the results for Model 5, T2 is negative and significantly associated with HCAHPS scores
(β= -0.08, p<0.01), suggesting overall HCAHPS scores were lower compared to the previous time periods. The
interaction between T2 and kidney transplants is also negative and significantly associated with HCAHPS (β=
-0.08, p<0.10), suggesting scores in this unit were lower compared to the control group and other time periods.
To better understand this result, we graphed the conditions effects plot, as shown in Figure 6. As seen from
the plot, overall quality scores after accounting for other covariates decrease for both units during T2. However,
the kidney unit shows a 17% reduction in HCAHPS scores while those in the liver unit only decline 7% in the
same period. This suggests HCAHPS scores decline before realizing significant post-implementation benefits.
As indicated by the regression results for the T1 pre-implementation period in Model 6, both the main
effect of T1 and the interaction with the kidney group are not associated with HCAHPS scores, suggesting
overall quality was no different between the two groups or the pre-intervention period.
6.3. Robustness Checks
We performed robustness checks to confirm our empirical results. First, we changed the time window for
assessing the effects of standard work implementation from the 12-month period (April 2015–April 2016) of
our analyses to a smaller, nine-month window (July 2015–April 2016). This scenario allows caregivers a three
months’ lag to adjust to new routines before assessing results. We found the results from these revised analyses
to be consistent with the original results.
Second, the nature of our process-change intervention required that researchers be embedded in the
work at the research site. This close involvement enabled us to validate through discussions and observations
some of the findings from our quantitative data analyses. Based on the qualitative data we collected, we gained
rich insights that explained some statistical results, such as the HCAHPS score reduction during standard work
implementation. We also could identify relevant controls (e.g., EMR implementation times and transition of
outpatient care) for our quantitative analyses.
22
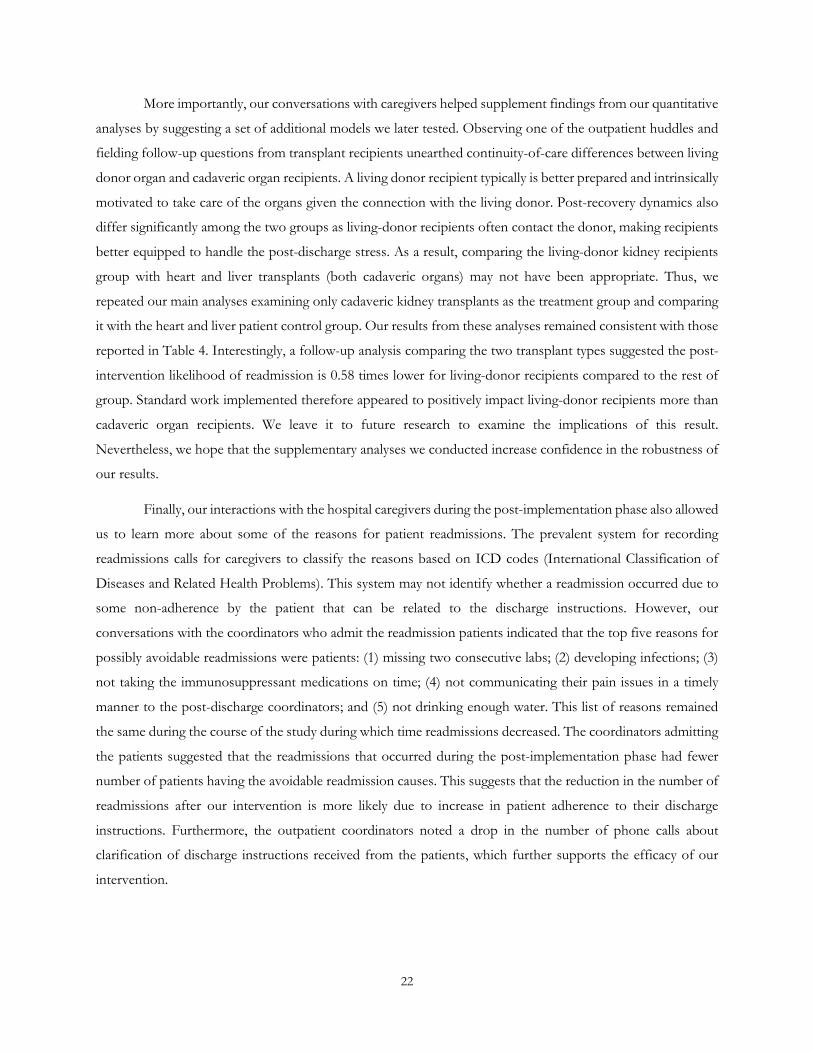
More importantly, our conversations with caregivers helped supplement findings from our quantitative
analyses by suggesting a set of additional models we later tested. Observing one of the outpatient huddles and
fielding follow-up questions from transplant recipients unearthed continuity-of-care differences between living
donor organ and cadaveric organ recipients. A living donor recipient typically is better prepared and intrinsically
motivated to take care of the organs given the connection with the living donor. Post-recovery dynamics also
differ significantly among the two groups as living-donor recipients often contact the donor, making recipients
better equipped to handle the post-discharge stress. As a result, comparing the living-donor kidney recipients
group with heart and liver transplants (both cadaveric organs) may not have been appropriate. Thus, we
repeated our main analyses examining only cadaveric kidney transplants as the treatment group and comparing
it with the heart and liver patient control group. Our results from these analyses remained consistent with those
reported in Table 4. Interestingly, a follow-up analysis comparing the two transplant types suggested the post-
intervention likelihood of readmission is 0.58 times lower for living-donor recipients compared to the rest of
group. Standard work implemented therefore appeared to positively impact living-donor recipients more than
cadaveric organ recipients. We leave it to future research to examine the implications of this result.
Nevertheless, we hope that the supplementary analyses we conducted increase confidence in the robustness of
our results.
Finally, our interactions with the hospital caregivers during the post-implementation phase also allowed
us to learn more about some of the reasons for patient readmissions. The prevalent system for recording
readmissions calls for caregivers to classify the reasons based on ICD codes (International Classification of
Diseases and Related Health Problems). This system may not identify whether a readmission occurred due to
some non-adherence by the patient that can be related to the discharge instructions. However, our
conversations with the coordinators who admit the readmission patients indicated that the top five reasons for
possibly avoidable readmissions were patients: (1) missing two consecutive labs; (2) developing infections; (3)
not taking the immunosuppressant medications on time; (4) not communicating their pain issues in a timely
manner to the post-discharge coordinators; and (5) not drinking enough water. This list of reasons remained
the same during the course of the study during which time readmissions decreased. The coordinators admitting
the patients suggested that the readmissions that occurred during the post-implementation phase had fewer
number of patients having the avoidable readmission causes. This suggests that the reduction in the number of
readmissions after our intervention is more likely due to increase in patient adherence to their discharge
instructions. Furthermore, the outpatient coordinators noted a drop in the number of phone calls about
clarification of discharge instructions received from the patients, which further supports the efficacy of our
intervention.

23
7.0. Discussion and Conclusion
Our data analysis and participation with the caregivers in the standard work implementation unearthed
several theoretical and managerial insights that we detail below.
7.1. Theoretical Implications
First, results from the analyses showed a significant reduction in treatment group readmissions after
the implementation of the new standard work when compared to the control group. Additionally, the overall
HCAHPS scores for the treatment group increased post-implementation while those of the control group
declined. Thus, we find support for both our hypotheses relating the implementation of the new standard work
to readmissions and patient experience outcomes. Implementing new processes in the context of healthcare
delivery involves designing work standards that considers the variations introduced by patients. The
implementation process involves multiple professionals at different hierarchical levels in the delivery process.
Unfortunately, there is lack of knowledge on how to bring about process change in such settings and about the
relationship of specific changes with their intended outcomes. Our research therefore offers, to the best of our
knowledge, the first empirical evidence for Lewin’s (1947) theory of organizational change applied to high
contact service settings and the inherent conditions of customer-related variations and heterogeneous groups
of employees executing the processes. We show that a systemic approach to triggering change would result in
minimal tradeoffs among process outcomes even in the initial stages after implementation and would sustain
compliance over time while seeking opportunities for further changes.
Second, our action-based research design offers new insights on the process of initiating and
successfully implementing process changes in high contact service settings. Through our use of rich qualitative
data and on-the-ground observations, we show how to initiate healthcare process improvements using
employee and patient input; we offer testable propositions based on these actions. We included patient input
in the design of the new standard work. It is important to note that patients’ role in our process improvement
was confined only to input on the standards developed by the caregiving team. We intentionally did not include
patients in the caregiver workshops to maintain anonymity, and to ensure that both patients and caregivers
would share their perspectives without fear of negative consequences. Patients may not have provided frank
and critical feedback in the presence of caregivers, some of whom may be involved in providing continuing
care for chronic conditions. In addition, caregivers may have feared discussing specific variations in care delivery
that individual patients necessitate. Thus, we gathered patient input separately but in tandem with caregiver
workshops, and iterated through exchanges and input syntheses from both sets of participants. This approach
proved particularly useful in making changes to delivery of education and training for patients. Although
previous studies on process changes have advocated for customizing service process delivery (e.g., Boone et al.
2008), they shed little light on how to incorporate customer input during design and development. Studies
24
suggest surveying customers to gauge their perceptions of the process and use them for the design (Bendapudi
and Leone 2003). Others recommend using service provider–customer focus groups to simultaneously consider
their viewpoints (Gittell 2003). Neither, however, may work well in healthcare because of reasons described
earlier. Although patient input can be useful to understand modes of discharge instruction delivery, it sheds
little insight on how to design an intervention to achieve this goal. Our research, by contrast, delineates a new
strategy for incorporating patient feedback in improving healthcare delivery. Hospitals find themselves
continually redesigning service delivery in response to reimbursement changes (e.g., VBP requirements) or new
care delivery models (e.g., Accountable Care Organizations – Shortell et al. 2014; Population Health Models –
Moffat-Bruce et al. 2014). Findings from our research suggest that using the caregiving team’s evidence-based
standards for process changes and, in parallel, incorporating customer-centric features based on their feedback
can be an effective approach for care delivery process redesign. The initially sequential then separate but
simultaneous collection of caregiver and patient viewpoints can be useful in synthesizing information and
counterbalancing process features. Ultimately, this can help achieve better patient health outcomes and higher
customer satisfaction.
Third, we increased caregiver acceptance by conducting a process study prior to considering process
change. Though we had senior management support at the outset, the nurses and surgeons at Apollo were
uncommitted to the process change initiatives. Initial interviews with nurses suggested some surgeons were
dissuading them from participating altogether. For example, a nurse commented, prior to the intervention, that
it was “just another organizational reaction to the changing regulations.” The results of our pre-intervention
study, however, sparked a stark contrast in nurses and surgeons’ attitude toward the need for change, leading
to enthusiastic workshop participation and continuing involvement from all caregivers. This evolution, from
skepticism to enthusiasm, is reported in the operations management and organizational routines literatures
(Staats et al. 2016, Nembhard and Tucker 2011, Adler et al. 1999, Sterman et al, 1997). Previous research studies
however, do not describe how change was initiated, a gap that is perhaps responsible for the failure to reap
benefits from improvement efforts in all sectors, including manufacturing (Kelley 2011, Pay 2008). By
demonstrating the effectiveness of pre-intervention studies and analyses, we add specificity that can help
organizations better initiate process changes.
Fourth, we offer insights on how to sustain process change. Our findings and continuing observations after
the intervention suggest the caregiving team has been diligently monitoring and improving the standard work
even after the initial implementation concluded in May 2015. Inpatient and outpatient nurse teams at Apollo’s
transplant unit have practiced regular huddles for nearly two years with sustained enthusiasm. This was not the
case at the unit during two previous process transformation attempts. On this matter, past research has shown
that fewer than 25% of change management initiatives sustain over time (Towers Watson 2015, Mendelbaum
2006). Evidence on how to sustain new process implementation efforts is lacking even outside of healthcare
25
(Choo et al. 2007). Success in sustaining the initiative introduced through our intervention can be attributed to
the midlevel management’s continuous engagement in ensuring resource availability for huddles. Figure 3 shows
the tiered leadership approach that allowed inpatient and outpatient nurse managers to exchange information
weekly. This middle-up-down method also helped unit frontline nurses and senior leadership connect in a
timely and sustained manner. Nurse managers from the heart and liver transplant control group noted that such
coordination of care in their units was, in contrast, mostly ad-hoc and non-routine. Very limited research exists
on the role of middle management in sustaining process changes (Tabrizi 2014). In practice, middle managers
(e.g., project managers, architectural leads, store and nurse managers, etc.) often are labeled the “muddle in the
middle” and considered obstructions for change initiatives (Burgess and Currie 2013). In our study, we found
these managers to be critical elements in sustaining changes following process redesign. Expecting senior
management (e.g., medical and nursing directors) to exhibit the same level of effort and commitment to daily
problem solving was implausible given Apollo’s size. Instead, inpatient and outpatient nursing managers took
the lead—not by leading huddles but by ensuring frontline nurses drove bottom-up process changes. They also
acted as liaisons between frontline nurses and medical and nursing directors, ensuring necessary resources for
improving standard work.
Finally, our research design provides a methodological contribution to the operations management
literature for deriving causal inferences. We find that a vast amount of knowledge on process implementation
has been derived from case studies (e.g., Eisenhardt et al. 2010, Adler et al. 1999) or pre- and post-
implementation data collection (e.g., Choo et al. 2015, Nembhard and Tucker 2011). While case studies derive
rich qualitative insights, they do have some limitations for empirical generalization when drawing inferences
(Eisenhardt 1989). Similarly, pre- and post-implementation data cannot account for unobservable factors that
may affect outcomes. Had we only collected pre- and post-implementation data from the kidney transplant
process, we would have incorrectly identified a performance deterioration during implementation. Our quasi-
experimental study design, which includes data from a comparable process within the same setting and
incorporates rich field observations, overcomes some limitations of previous studies in deriving causal
inferences. Though common in healthcare and public policy literature (e.g., Ryan et al. 2015, Dimick and Ryan
2014), this approach is only beginning to receive attention among operations management scholars (Song et al.
2016). Nonetheless, it can be useful in scenarios that do not allow for a randomized control (RCT) approach.6
We encourage future studies to adopt such an analytical approach, allowing researchers to account for several
organizational confounding elements while deriving inferences.
6 An RCT design in our case would require multiple kidney transplant facilities in the same Apollo unit that have different employees, wherein the treatment (standard work) can be randomly assigned.
26
7.2. Implications for Practice
Our results also offer important managerial insights. During implementation (Phase 2), we observed the
treatment group HCAHPS scores decline while the readmission rate remained unchanged. Upon discussing
this result with the caregivers, a possible explanation emerged. Phase 2 required caregivers to dedicate time to
focus groups, training workshops, and efforts to change discharge information delivery. Moreover, during this
phase, patients experienced caregivers following now-standardized protocols more strictly. These two factors
likely drove patients to give lower ratings on the HCAHPS surveys. Supporting this possible explanation,
multiple patients said during Phase 2 interviews that they received instructions from a veteran nurse who was
using the teach-back method with inpatient nurses, which they said degraded their patient experience. One
patient even described feeling like a “test subject” at the time. Regardless of patients’ perceptions, their health
outcomes, measured using 30-day readmission rates, were not harmed during Phase 2. These results point to
two practical insights for implementing process improvement initiatives in high-contact service processes. First,
service providers must actively manage customers’ perceptions of process improvement activities when
conducted in their presence to mitigate any potential decline in satisfaction. Second, measures of patient
satisfaction and patient health outcomes may diverge during care delivery. It is important to note, however, that
neither declined post-implementation. By striving for caregiver engagement during process development and
including patient input in implementation, we averted the expected initial dip in results following new-process
or new-technology adoption (Nembhard and Tucker 2011, Knott and McKelvey 1999).
Perhaps the most valuable practical insight gained from this research addresses critics who dismiss process
improvement in healthcare as “medical Taylorism” (Hartzband and Groopman 2016). Medicine is governed by
the requirement to follow evidence-based standards, yet their implementation allows the care team much
discretion. By seeking to eliminate process variation, the standardized work in this research somewhat limits
that discretion but honors it nonetheless by introducing patient-centric elements (e.g., using multiple learning
aids, having teach-back conversation, etc.). Applying standard practices in repetitive processes has been shown
to improve quality in many industries, yet processes are never “exactly repetitive” in a patient-care setting
because of the variation patients introduce. This, therefore, necessitates a standard process design that allows
for patient-induced variation. Such design is necessarily iterative and the product of collaborative work by the
care team informed by needs the patient articulates. As such, it is not Taylorism. Rather than dictating scientific
management, this standardization incorporates the ideas of those who do the work (including physicians and
nurses) as well as those affected by it (patients). The design, implementation, and sustaining of standardized,
patient-centric processes requires intensive team effort. The evidence provided here suggests it can result in
greater patient satisfaction and better medical outcomes.

27
7.3 Limitations and Future Research
We recognize the following limitations, which may serve as directions for future research. First, all insights
from our study are derived from one hospital unit. Although we collected data from multiple sources, validated
our findings through post-hoc employee and patient interviews, and ensured the patient mix in our sample
compared with national demographics, we must exercise caution when generalizing our findings to other
transplant units. Second, we note that our research is limited to the context of kidney transplant discharges,
thus caution must be used in extending the benefits of standard work to other types of healthcare delivery.
Apollo already has seen evidence of efforts to adopt similar standard work changes in its hip and knee
replacement units. We encourage more research from other contexts, which can help strengthen the benefits
of patient-centric standard work to healthcare delivery.
7.4. Conclusion
Notwithstanding the above limitations, our study offers important implications for managers and
scholars. We provide detailed insights on how to trigger new process change within an organization, especially
amid cultural resistance. We demonstrate the key elements of employee engagement and patient input and how
these two enable standardization in high contact service settings. Finally, we also shed light on the often-ignored
middle manager, essential for sustaining change over an extended period. Our paper also contributes to the
operations management literature. By focusing our research design on a fundamental element of process,
namely standard work, we empirically demonstrate its benefits. This addresses the questions raised by skeptics
about the use of standardization in high-contact service settings.
References
Abadie, A. (2005). Causal inference. Encyclopedia of social measurement, 1, 259-266.
Abecassis, M., Bartlett, S. T., Collins, A. J., Davis, C. L., Delmonico, F. L., Friedewald, J. J., ... Merion, R. M. (2008). Kidney transplantation as primary therapy for end-stage renal disease: A National Kidney Foundation/Kidney Disease Outcomes Quality Initiative (NKF/KDOQI™) conference. Clinical Journal of the American Society of Nephrology, 3(2), 471-480.
Adler, P. S., Clark, K. B. (1991). Behind the learning curve: A sketch of the learning process. Management Science, 37(3), 267-281.
Adler, P. S., Goldoftas, B., Levine, D. I. (1999). Flexibility versus efficiency? A case study of model changeovers in the Toyota production system. Organization Science, 10(1), 43-68.
Anand, G., Ward, P. T., Tatikonda, M. V., Schilling, D. A. (2009). Dynamic capabilities through continuous improvement infrastructure. Journal of Operations Management, 27(6), 444-461.
Axelrod, D. A., Schnitzler, M. A., Xiao, H., Naik, A. S., Segev, D. L., Dharnidharka, V. R., ... Lentine, K. L. (2016). The changing financial landscape of renal transplant practice: A national cohort analysis. American Journal of Transplantation.
Bendapudi, N., Leone, R. P. (2003). Psychological implications of customer participation in co-production. Journal of marketing, 67(1), 14-28.
Boone, T., Ganeshan, R., Hicks, R. L. (2008). Learning and knowledge depreciation in professional services. Management Science, 54(7), 1231-1236.
28
Brown, J. S., Duguid, P. (1991). Organizational learning and communities-of-practice: Toward a unified view of working, learning, and innovation. Organization science, 2(1), 40-57.
https://www.cms.gov/Medicare/Quality-Initiatives-Patient-Assessment-instruments/HospitalQualityInits/HospitalHCAHPS.html
Buckley, B. A., McCarthy, D. M., Forth, V. E., Tanabe, P., Schmidt, M. J., Adams, J. G., Engel, K. G. (2013). Patient input into the development and enhancement of ED discharge instructions: A focus group study. Journal of Emergency Nursing, 39(6), 553-561.
Burgess, N., Currie, G. (2013). The knowledge brokering role of the hybrid middle level manager: the case of healthcare. British Journal of Management, 24(S1), S132-S142.
Burnes, B. (2004). Kurt Lewin and the planned approach to change: a re‐ appraisal. Journal of Management studies, 41(6), 977-1002.
Chandrasekaran, A., Senot, C., Boyer, K. K. (2012). Process management impact on clinical and experiential quality: Managing tensions between safe and patient-centered healthcare. Manufacturing and Service Operations Management, 14(4), 548-566.
Choo, A. S., Linderman, K. W., Schroeder, R. G. (2007). Method and context perspectives on learning and knowledge creation in quality management. Journal of Operations Management, 25(4), 918-931.
Choo, A. S., Nag, R., Xia, Y. (2015). The role of executive problem solving in knowledge accumulation and manufacturing improvements. Journal of Operations Management, 36, 63-74.
Clancy, C. M. (2009). Reengineering hospital discharge: a protocol to improve patient safety, reduce costs, and boost patient satisfaction. American Journal of Medical Quality, 24(4), 344-346.
Cosgrove, T. (2013). The Cleveland Clinic Way: Lessons in Excellence from One of the World's Leading Health Care Organizations: Lessons in Excellence from One of the World's Leading Health Care Organizations VIDEO ENHANCED EBOOK. McGraw Hill Professional.
Cukor, D., Cohen, L. M., Cope, E. L., Ghahramani, N., Hedayati, S. S., Hynes, D. M., ... Cohen, S. (2016). Patient and other stakeholder engagement in patient-centered outcomes research institute funded studies of patients with kidney diseases. Clinical Journal of the American Society of Nephrology, CJN-09780915.
Damali, U., Miller, J. L., Fredendall, L. D., Moore, D., Dye, C. J. (2016). Co-creating value using customer training and education in a healthcare service design. Journal of Operations Management, 47, 80-97.
de Holan, P. M. D., Phillips, N. (2004). Remembrance of things past? The dynamics of organizational forgetting. Management science, 50(11), 1603-1613.
Denis, J. L., Langley, A., Cazale, L. (1996). Leadership and strategic change under ambiguity. Organization Studies, 17(4), 673-699.
Dew, M. A., DiMartini, A. F., Dabbs, A. D. V., Myaskovsky, L., Steel, J., Unruh, M., ... Greenhouse, J. B. (2007). Rates and risk factors for nonadherence to the medical regimen after adult solid organ transplantation. Transplantation, 83(7), 858-873.
Dimick, J. B., Ryan, A. M. (2014). Methods for evaluating changes in health care policy: the difference-in-differences approach. Jama, 312(22), 2401-2402.
Eisenhardt, K. M. (1989). Building theories from case study research. Academy of Management Review, 14(4), 532-550.
Eisenhardt, K. M., Furr, N. R., Bingham, C. B. (2010). CROSSROADS-Microfoundations of performance: Balancing efficiency and flexibility in dynamic environments. Organization Science, 21(6), 1263-1273.
Garnick, D. W., DeLong, E. R., Luft, H. S. (1995). Measuring hospital mortality rates: are 30-day data enough? Ischemic Heart Disease Patient Outcomes Research Team. Health Services Research, 29(6), 679.
Gawande, A., Lloyd, J. B. (2010). The checklist manifesto: How to get things right (Vol. 200). New York: Metropolitan Books.
29
Gino, F., Pisano, G. (2008). Toward a theory of behavioral operations. Manufacturing and Service Operations Management, 10(4), 676-691.
Gittell, J. H. (2002). Coordinating mechanisms in care provider groups: Relational coordination as a mediator and input uncertainty as a moderator of performance effects. Management Science, 48(11), 1408-1426.
Gittell, J. H. (2003). The Southwest Airlines way: Using the power of relationships to achieve high performance. New York: McGraw-Hill.
Gordon, E.J., Prohaska, T., Gallant, M., Siminoff, L., (2009). Self-care strategies and barriers among kidney transplant recipients: a qualitative study. Chronic Illness, 5(2) 75-91.
Hackman, J. R., Wageman, R. (1995). Total quality management: Empirical, conceptual, and practical issues. Administrative science quarterly, 309-342.
Hartzband, P., Groopman, J. (2016). Medical Taylorism. New England Journal of Medicine, 374(2), 106-108.
Health Resources and Services Administration. https://optn.transplant.hrsa.gov/. Accessed January 15, 2016.
Hendricks, K. B., Singhal, V. R. (1997). Does implementing an effective TQM program actually improve operating performance? Empirical evidence from firms that have won quality awards. Management science, 43(9), 1258-1274.
Huarng, K. H., Mas-Tur, A. (2016). Turning Kurt Lewin on his head: Nothing is so theoretical as a good practice. Journal of Business Research, 69(11), 4725-4731.
Imbens, G. W., Wooldridge, J. M. (2009). Recent developments in the econometrics of program evaluation. Journal of Economic Literature, 47(1), 5-86.
Kelley L (2011) Refresh and revitalize. Quality Progress. February: 18-23
King, A. W., Fowler, S. W., Zeithaml, C. P. (2001). Managing organizational competencies for competitive advantage: The middle-management edge. The Academy of Management Executive, 15(2), 95-106.
Knott, A. M. (2001). The dynamic value of hierarchy. Management Science, 47(3), 430-448.
Knott, A. M., McKelvey, B. (1999). Nirvana efficiency: a comparative test of residual claims and routines. Journal of Economic Behavior and Organization, 38(4), 365-383.
Lapré, M. A., Van Wassenhove, L. N. (2001). Creating and transferring knowledge for productivity improvement in factories. Management Science, 47(10), 1311-1325.
Laureiro‐Martínez, D., Brusoni, S., Canessa, N., Zollo, M. (2015). Understanding the exploration–exploitation dilemma: An fMRI study of attention control and decision‐making performance. Strategic Management Journal, 36(3), 319-338.
Lawler, E. E. (1994). Total quality management and employee involvement: Are they compatible? The Academy of Management Executive, 8(1), 68-76.
LeBaron, C., Christianson, M. K., Garrett, L., Ilan, R. (2016). Coordinating flexible performance during everyday work: An ethnomethodological study of handoff routines. Organization Science, 27(3), 514-534.
Lewin, K. (1947). Group decision and social change. Readings in social psychology, 3, 197-211.
Lubetzky, M., Yaffe, H., Chen, C., Ali, H., Kayler, L. K. (2016). Early readmission after kidney transplantation: examination of discharge-level factors. Transplantation, 100(5), 1079-1085.
Mendelbaum, G., 2006. Keep your eye on the ball. APICS Magazine, January 2006
Naveh, E., Erez, M. (2004). Innovation and attention to detail in the quality improvement paradigm. Management Science, 50(11), 1576-1586.
Nembhard, I. M., Edmondson, A. C. (2006). Making it safe: The effects of leader inclusiveness and professional status on psychological safety and improvement efforts in health care teams. Journal of Organizational Behavior, 27(7), 941-966.

30
Nembhard, I. M., Tucker, A. L. (2011). Deliberate learning to improve performance in dynamic service settings: Evidence from hospital intensive care units. Organization Science, 22(4), 907-922.
Netland, T. H., Ferdows, K. (2016). The S‐Curve Effect of Lean Implementation. Production and Operations Management.
Nonaka, I. (1988). Toward middle-up-down management: accelerating information creation. Sloan management review, 29(3), 9-18.
Pay, R. (2008). Everybody’s jumping on the lean bandwagon, but many are being taken for a ride. Industry Week, 5.
Powell, T. C. (1995). Total quality management as competitive advantage: a review and empirical study. Strategic Management Journal, 16(1), 15-37.
Provost, S. M., Lanham, H. J., Leykum, L. K., McDaniel Jr, R. R., Pugh, J. (2015). Health care huddles: Managing complexity to achieve high reliability. Health Care Management Review, 40(1), 2-12.
Repenning, N. P., Sterman, J. D. (2001). Nobody ever gets credit for fixing problems that never happened: creating and sustaining process improvement. California Management Review, 43(4), 64-88.
Repenning, N. P., Sterman, J. D. (2002). Capability traps and self-confirming attribution errors in the dynamics of process improvement. Administrative Science Quarterly, 47(2), 265-295.
Rother, M., Shook, J. (2003). Learning to see: value stream mapping to add value and eliminate muda. Lean Enterprise Institute.
Ryan, A. M., Burgess, J. F., Dimick, J. B. (2015). Why We Should Not Be Indifferent to Specification Choices for Difference‐in‐Differences. Health Services Research, 50(4), 1211-1235.
Schein, E. H. (1996). Kurt Lewin's change theory in the field and in the classroom: Notes toward a model of managed learning. Systems Practice, 9(1), 27-47.
Senot, C., Chandrasekaran, A., Ward, P. T., Tucker, A. L., Moffatt-Bruce, S. (2016). The Impact of Combining Conformance and Experiential Quality on Health Care Clinical and Cost Performance. Management Science.
Shirey, M. R. (2013). Lewin’s theory of planned change as a strategic resource. Journal of Nursing Administration, 43(2), 69-72.
Shortell, S. M., Wu, F. M., Lewis, V. A., Colla, C. H., Fisher, E. S. (2014). A taxonomy of accountable care organizations for policy and practice. Health Services Research, 49(6), 1883-1899.
Siemsen, E., Balasubramanian, S., Roth, A. V. (2007). Incentives that induce task-related effort, helping, and knowledge sharing in workgroups. Management Science 53(10), 1533-1550.
Song, H., Tucker, A. L., Murrell, K. L., Vinson, D. R. (2016). Closing the Productivity Gap: Improving Worker Productivity through Public Relative Performance Feedback and Validation of Best Practices. (December 12, 2016). Boston University Questrom School of Business Research Paper No. 2884282. Available at SSRN: https://ssrn.com/abstract=2884282 or http://dx.doi.org/10.2139/ssrn.2884282
Spear, S., Bowen, H. K. (1999). Decoding the DNA of the Toyota production system. Harvard Business Review, 77, 96-108.
Staats, B. R., Dai, H., Hofmann, D., Milkman, K. L. (2016). Motivating process compliance through individual electronic monitoring: An empirical examination of hand hygiene in healthcare. Management Science.
Sterman, J. D., Repenning, N. P., Kofman, F. (1997). Unanticipated side effects of successful quality programs: Exploring a paradox of organizational improvement. Management Science, 43(4), 503-521.
Tabrizi, Benham (2014). The Key to Change Is Middle Management https://hbr.org/2014/10/the-key-to-change-is-middle-management
Tinetti, M. E., Basch, E. (2013). Patients' responsibility to participate in decision making and research. JAMA, 309(22), 2331-2332.
31
Ton, Z., Huckman, R. S. (2008). Managing the impact of employee turnover on performance: The role of process conformance. Organization Science, 19(1), 56-68.
https://www.towerswatson.com/
Tucker, A. L. (2007). An empirical study of system improvement by frontline employees in hospital units. Manufacturing and Service Operations Management, 9(4), 492-505.
Tucker, A. L., Singer, S. J. (2015). The Effectiveness of Management‐By‐Walking‐Around: A Randomized Field Study. Production and Operations Management, 24(2), 253-271.
https://www.unos.org/
Van de Ven, A. H. (1986). Central problems in the management of innovation. Management Science, 32(5), 590-607.
Verhaegh, K. J., MacNeil-Vroomen, J. L., Eslami, S., Geerlings, S. E., de Rooij, S. E., Buurman, B. M. (2014). Transitional care interventions prevent hospital readmissions for adults with chronic illnesses. Health Affairs, 33(9), 1531-1539.
Zhang, G. P., Xia, Y. (2013). Does quality still pay? A reexamination of the relationship between effective quality management and firm performance. Production and Operations Management, 22(1), 120-136.
Zollo, M., Winter, S. G. (2002). Deliberate learning and the evolution of dynamic capabilities. Organization Science, 13(3), 339-351.
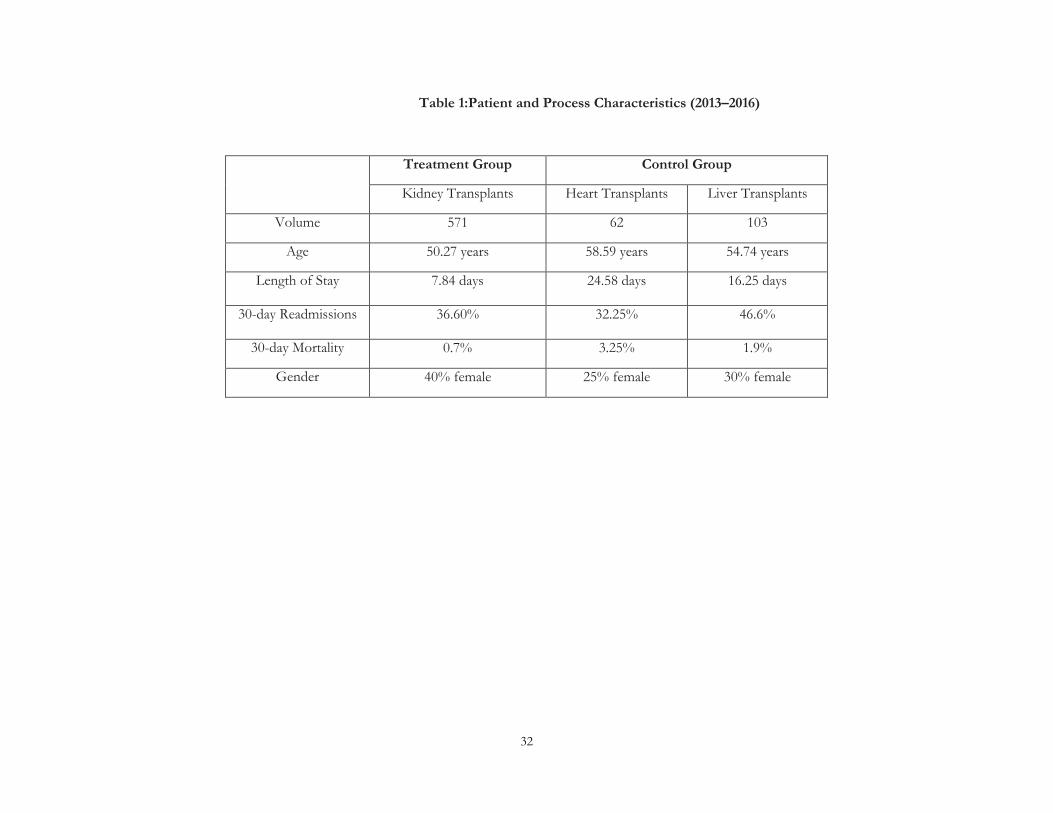
32
Table 1:Patient and Process Characteristics (2013–2016)
Treatment Group Control Group
Kidney Transplants Heart Transplants Liver Transplants
Volume 571 62 103
Age 50.27 years 58.59 years 54.74 years
Length of Stay 7.84 days
24.58 days 16.25 days
30-day Readmissions 36.60%
32.25%
46.6%
30-day Mortality 0.7% 3.25% 1.9%
Gender 40% female 25% female 30% female

33
Table 2: Variables Used in the Study
Variable name Mean Std. dev. Variable definition Dependent variables Readmit 0.37 0.48 Patient readmitted back within 30-days (1 = yes, 0 = no) HCAHPS 0.69 0.10 Monthly overall quality ratings for treatment and control groups Independent variables T3 0.30 0.46 Binary variable to capture the post-implementation time period (May 2015 – April 2016, 0 = otherwise) T2 0.25 0.43 Binary variable to capture the implementation time period (July 2014 – March 2015, 0 = otherwise) T1 0.16 0.37 Binary variable to capture the pre-implementation time period (Jan 2014 – June 2014, 0 = otherwise) Patient Controls Mortality 0.01 0.10 Binary variable to account for patient death within 30 days after transplant LOS 8.87 4.82 Length of stay of the patient during hospitalization (in days) Age 51.5 12.3 Age of the transplant patient Gender 0.38 0.48 Gender of the Transplant Patient (0 = Male, 1 = Female) Kidney 0.81 0.39 Binary variable to capture if the patient had a kidney transplant Heart 0.07 0.25 Binary variable to capture if the patient had a heart transplant Donor Type 0.37 0.49 Type of transplant donor (1 = Living, 0 = Cadaveric) White 0.75 0.45 Binary variable capturing patient ethnicity (white); Other is control group African American 0.20 0.40 Binary variable capturing patient ethnicity (African American); other is control group Graft Health 0.09 0.28 Condition of the transplanted organ during discharge (1 = Delayed Function, 0 = Healthy) Pre-existing Cond 0.25 0.75 Patient with pre-existing diabetes condition (1 = Yes, 0 = No) Year Dummies Three year dummies to reflect year of transplant (2013, 2014, 2015: 2016 – base group) Quarter Dummies Three quarter dummies to reflect the quarter in which transplant is done (Q1, Q2, Q3: Q4 – base quarter) Month Dummies Eleven month dummies to reflect the month of transplant for Overall Quality Rating Analysis Process Controls VBP 0.81 0.39 Binary variable to capture the value based purchasing program (1 = after Q3 2013, 0 = otherwise) EMR 0.56 0.49 Binary variable to capture the EMR implementation across hospital (1 = June – Aug 2014, 0 = otherwise) Transition 0.18 0.38 Binary variable to capture the transition of outpatient clinic for kidney (1 = June – Aug 2015, 0 = otherwise) Integration 0.06 0.23 Binary variable to capture outpatient EMR issues for all transplants (1 = August 2015, 0 = otherwise) # of Transplants Number of transplants performed by the treatment and control group per month
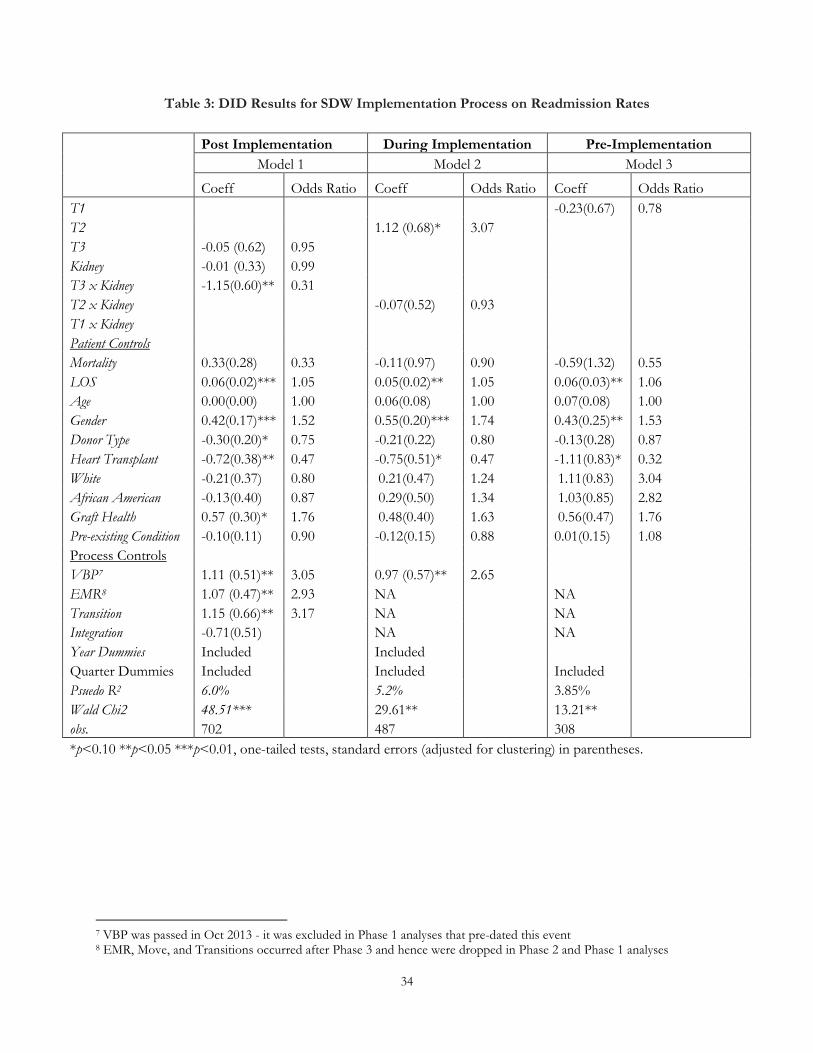
34
Table 3: DID Results for SDW Implementation Process on Readmission Rates
7 VBP was passed in Oct 2013 - it was excluded in Phase 1 analyses that pre-dated this event 8 EMR, Move, and Transitions occurred after Phase 3 and hence were dropped in Phase 2 and Phase 1 analyses
Post Implementation During Implementation Pre-Implementation
Model 1 Model 2 Model 3
Coeff Odds Ratio Coeff Odds Ratio Coeff Odds Ratio T1 -0.23(0.67) 0.78 T2 1.12 (0.68)* 3.07 T3 -0.05 (0.62) 0.95 Kidney -0.01 (0.33) 0.99 T3 x Kidney -1.15(0.60)** 0.31 T2 x Kidney -0.07(0.52) 0.93 T1 x Kidney Patient Controls Mortality 0.33(0.28) 0.33 -0.11(0.97) 0.90 -0.59(1.32) 0.55 LOS 0.06(0.02)*** 1.05 0.05(0.02)** 1.05 0.06(0.03)** 1.06 Age 0.00(0.00) 1.00 0.06(0.08) 1.00 0.07(0.08) 1.00 Gender 0.42(0.17)*** 1.52 0.55(0.20)*** 1.74 0.43(0.25)** 1.53 Donor Type -0.30(0.20)* 0.75 -0.21(0.22) 0.80 -0.13(0.28) 0.87 Heart Transplant -0.72(0.38)** 0.47 -0.75(0.51)* 0.47 -1.11(0.83)* 0.32 White -0.21(0.37) 0.80 0.21(0.47) 1.24 1.11(0.83) 3.04 African American -0.13(0.40) 0.87 0.29(0.50) 1.34 1.03(0.85) 2.82 Graft Health 0.57 (0.30)* 1.76 0.48(0.40) 1.63 0.56(0.47) 1.76 Pre-existing Condition -0.10(0.11) 0.90 -0.12(0.15) 0.88 0.01(0.15) 1.08 Process Controls VBP7 1.11 (0.51)** 3.05 0.97 (0.57)** 2.65 EMR8 1.07 (0.47)** 2.93 NA NA Transition 1.15 (0.66)** 3.17 NA NA Integration -0.71(0.51) NA NA Year Dummies Included Included Quarter Dummies Included Included Included Psuedo R2 6.0% 5.2% 3.85% Wald Chi2 48.51*** 29.61** 13.21** obs. 702 487 308 *p<0.10 **p<0.05 ***p<0.01, one-tailed tests, standard errors (adjusted for clustering) in parentheses.

35
Table 4: DID Results for SDW Implementation Process on HCAHPS Scores
*p<0.10 **p<0.05 ***p<0.01, one-tailed tests, standard errors (adjusted for clustering) in parentheses
HCAHPS Overall Quality Scores
Post-Implementation
Model 4
During Implementation
Model 5
Pre-Implementation
Model 6
Coeff Coeff Coeff T1 -0.07 (0.05)* T2 -0.09 (0.03)** T3 -0.06 (0.04)* Kidney -0.02 (0.07) -0.05(0.07) -0.13 (0.10) T3 x Kidney 0.10(0.04)** T2 x Kidney -0.08(0.04)** T1 x Kidney 0.03 (0.06) Patient Controls # of Transplants 0.00(0.00) 0.01(0.00)* 0.01(0.00)* Process Controls VBP 0.02 (0.03) 0.02 (0.03) 0.04 (0.04) EMR -0.02 (0.02) 0.08 (0.02)** 0.11 (0.03)** Transition -0.08 (0.03)*** NA NA Integration -0.03(0.03) NA NA Year Dummies Included Included Included Month Dummies Included Included Included R2 17.18% 15.42% 24.40% Wald Chi2 67.11** 60.15** 28.67** obs. 80 54 36
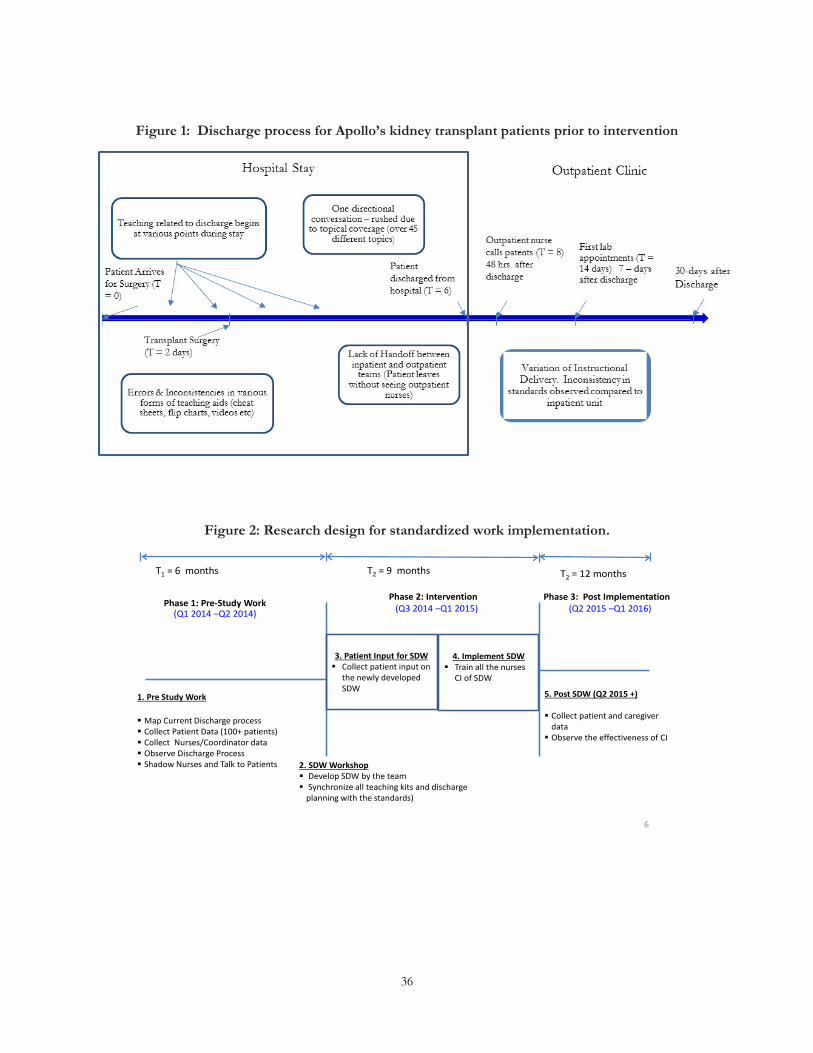
36
Figure 1: Discharge process for Apollo’s kidney transplant patients prior to intervention
Figure 2: Research design for standardized work implementation.
6
1. Pre Study Work
Map Current Discharge process Collect Patient Data (100+ patients) Collect Nurses/Coordinator data Observe Discharge Process Shadow Nurses and Talk to Patients 2. SDW Workshop
Develop SDW by the team Synchronize all teaching kits and discharge
planning with the standards)
T1 = 6 months T2 = 12 months
4. Implement SDW Train all the nurses
CI of SDW
3. Patient Input for SDW Collect patient input on
the newly developed SDW 5. Post SDW (Q2 2015 +)
Collect patient and caregiver data Observe the effectiveness of CI
Phase 2: Intervention (Q3 2014 –Q1 2015)
Phase 3: Post Implementation(Q2 2015 –Q1 2016) Phase 1: Pre-Study Work
(Q1 2014 –Q2 2014)
T2 = 9 months
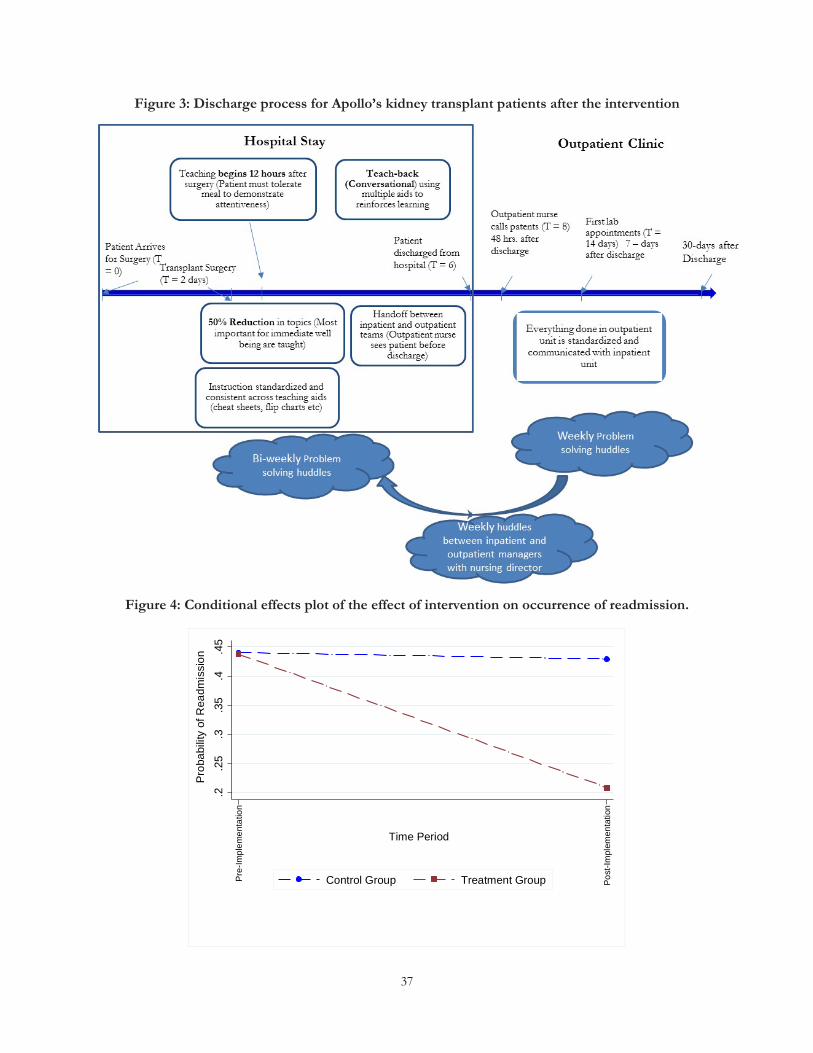
37
Figure 3: Discharge process for Apollo’s kidney transplant patients after the intervention
Figure 4: Conditional effects plot of the effect of intervention on occurrence of readmission.
.2.2
5.3
.35
.4.4
5P
roba
bilit
y of
Rea
dmis
sion
Pre
-Impl
emen
tatio
n
Pos
t-Im
plem
enta
tion
Time Period
Control Group Treatment Group
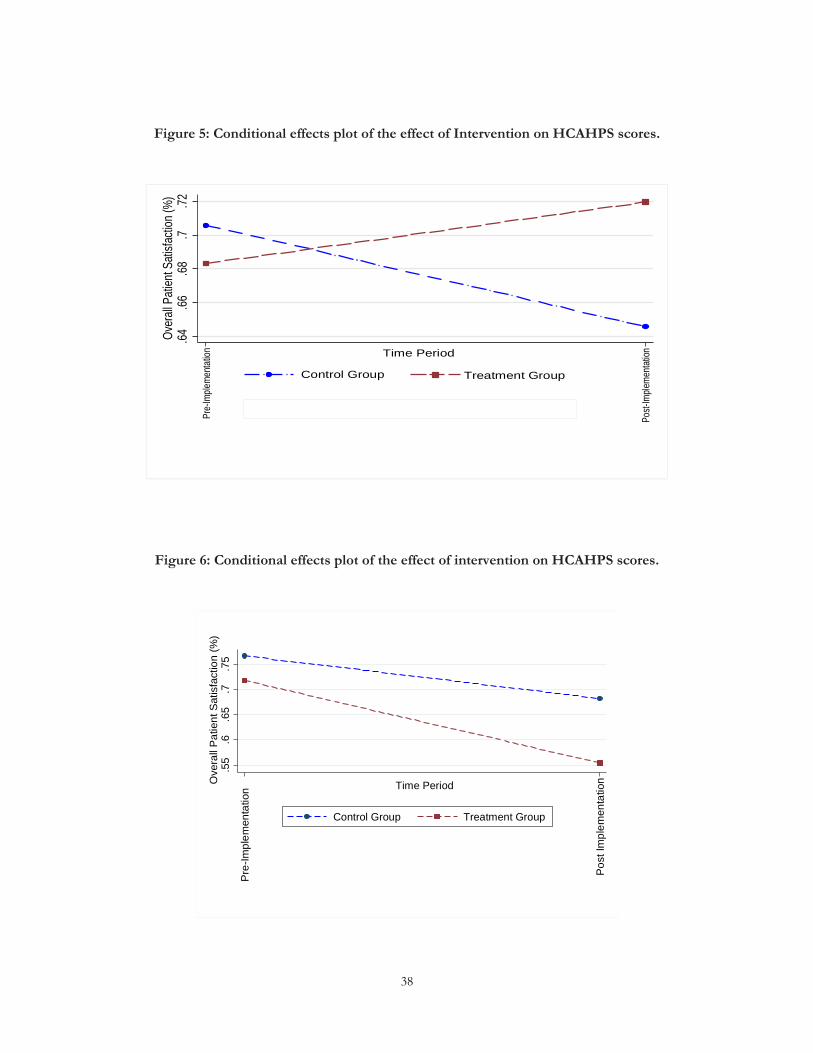
38
Figure 5: Conditional effects plot of the effect of Intervention on HCAHPS scores.
Figure 6: Conditional effects plot of the effect of intervention on HCAHPS scores.
.64.66
.68.7
.72Ov
erall
Pati
ent S
atisfa
ction
(%)
Pre-
Imple
menta
tion
Post-
Imple
menta
tionTime Period
Control Group Treatment Group
.55
.6.6
5.7
.75
Ove
rall
Pat
ient
Sat
isfa
ctio
n (%
)
Pos
t Im
plem
enta
tion
Pre
-Impl
emen
tatio
n Time Period
Control Group Treatment Group
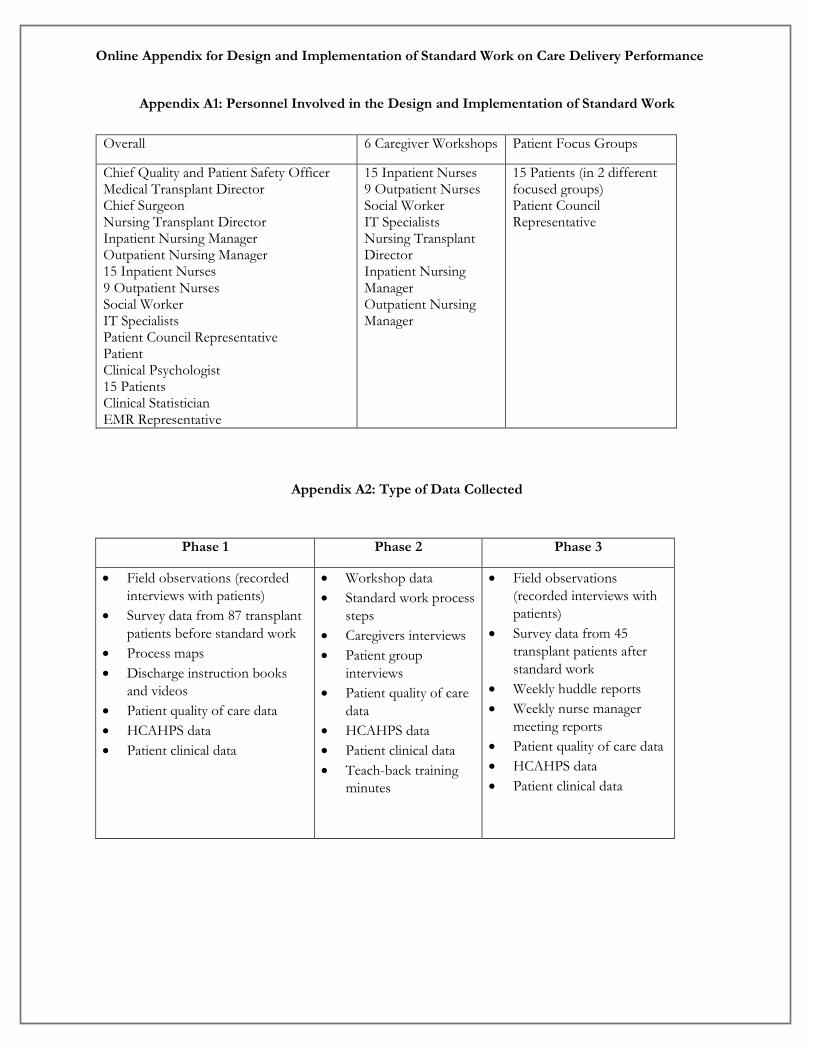
Online Appendix for Design and Implementation of Standard Work on Care Delivery Performance
Appendix A1: Personnel Involved in the Design and Implementation of Standard Work
Appendix A2: Type of Data Collected
Phase 1 Phase 2 Phase 3
• Field observations (recorded interviews with patients)
• Survey data from 87 transplant patients before standard work
• Process maps • Discharge instruction books
and videos • Patient quality of care data • HCAHPS data • Patient clinical data
• Workshop data • Standard work process
steps • Caregivers interviews • Patient group
interviews • Patient quality of care
data • HCAHPS data • Patient clinical data • Teach-back training
minutes
• Field observations (recorded interviews with patients)
• Survey data from 45 transplant patients after standard work
• Weekly huddle reports • Weekly nurse manager
meeting reports • Patient quality of care data • HCAHPS data • Patient clinical data
Overall 6 Caregiver Workshops Patient Focus Groups
Chief Quality and Patient Safety Officer Medical Transplant Director Chief Surgeon Nursing Transplant Director Inpatient Nursing Manager Outpatient Nursing Manager 15 Inpatient Nurses 9 Outpatient Nurses Social Worker IT Specialists Patient Council Representative Patient Clinical Psychologist 15 Patients Clinical Statistician EMR Representative
15 Inpatient Nurses 9 Outpatient Nurses Social Worker IT Specialists Nursing Transplant Director Inpatient Nursing Manager Outpatient Nursing Manager
15 Patients (in 2 different focused groups) Patient Council Representative
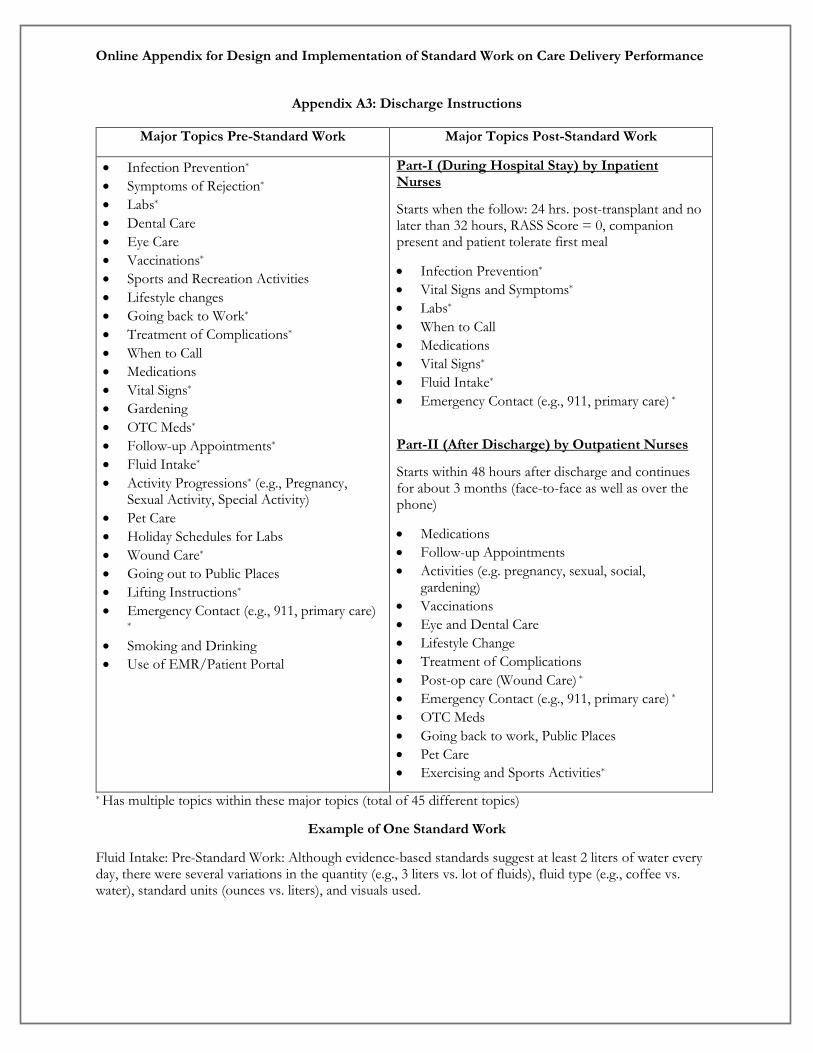
Online Appendix for Design and Implementation of Standard Work on Care Delivery Performance
Appendix A3: Discharge Instructions
* Has multiple topics within these major topics (total of 45 different topics)
Example of One Standard Work
Fluid Intake: Pre-Standard Work: Although evidence-based standards suggest at least 2 liters of water every day, there were several variations in the quantity (e.g., 3 liters vs. lot of fluids), fluid type (e.g., coffee vs. water), standard units (ounces vs. liters), and visuals used.
Major Topics Pre-Standard Work Major Topics Post-Standard Work
• Infection Prevention* • Symptoms of Rejection* • Labs* • Dental Care • Eye Care • Vaccinations* • Sports and Recreation Activities • Lifestyle changes • Going back to Work* • Treatment of Complications* • When to Call • Medications • Vital Signs* • Gardening • OTC Meds* • Follow-up Appointments* • Fluid Intake* • Activity Progressions* (e.g., Pregnancy,
Sexual Activity, Special Activity) • Pet Care • Holiday Schedules for Labs • Wound Care* • Going out to Public Places • Lifting Instructions* • Emergency Contact (e.g., 911, primary care)
* • Smoking and Drinking • Use of EMR/Patient Portal
Part-I (During Hospital Stay) by Inpatient Nurses
Starts when the follow: 24 hrs. post-transplant and no later than 32 hours, RASS Score = 0, companion present and patient tolerate first meal
• Infection Prevention* • Vital Signs and Symptoms* • Labs* • When to Call • Medications • Vital Signs* • Fluid Intake* • Emergency Contact (e.g., 911, primary care) *
Part-II (After Discharge) by Outpatient Nurses
Starts within 48 hours after discharge and continues for about 3 months (face-to-face as well as over the phone)
• Medications • Follow-up Appointments • Activities (e.g. pregnancy, sexual, social,
gardening) • Vaccinations • Eye and Dental Care • Lifestyle Change • Treatment of Complications • Post-op care (Wound Care) * • Emergency Contact (e.g., 911, primary care) * • OTC Meds • Going back to work, Public Places • Pet Care • Exercising and Sports Activities*

Online Appendix for Design and Implementation of Standard Work on Care Delivery Performance
Fluid Intake: After Standard Work
Content: Established 3 liters as a standard for kidney and pancreas patients. There is a visual aid used – an Apollo jug that can fill 1.5 liters of water. Thus, the instruction is to drink twice this amount daily. Sequence: Fluid intake is grouped with diet instructions and given as the first set of instructions. Timing: Instruction starts 24 hours after surgery and no later than 32 hours. Outcome: Nurse explains the result of noncompliance to the water intake increases creatine levels that can result in increased blood pressure, which can trigger readmission or adverse event.
Appendix A4: Weekly and Bi-Weekly Huddles
The inpatient (twice a week) and outpatient (once a week) huddles had the following formats with some minor variations. The huddles lasted for 10 minutes before the beginning of their shift.
• Who are getting discharged – and their aptitude on discharge instructions • Staffing levels in the unit for that day • Hand-off process between inpatient and outpatient unit (has the outpatient coordinator met the
patient and discussed Part 2 of the instructional delivery) • Improvements to teaching process • Celebrations or other news
Appendix A5: Cost Accounting Analyses for Readmissions
We had access to individual cost data for every readmission that occurred during our study period (2013–2016). To calculate the average cost of readmissions, we divided the annual direct and indirect costs by the total number of readmissions that occurred during the year. Specifically, we used the following direct and indirect cost for each readmitted patients:
Direct Costs • Room and Board Expenses • Pharmacy • Intensive Care and Post ICU • Blood Storage • Drugs • Labs (includes ultrasound, immunology, urology, other therapeutics) • Renal Dialysis and Hemodialysis • Emergency Rooms • Anesthesia • Miscellaneous (e.g., CT scanner, cardiology, MRI)
Indirect costs • Salaries and Benefits • Drugs • Equipment/Depreciation • Building • Purchased Services • Medical Supplies • Lab/Transfusion • Other Supplies and Miscellaneous


![Implementing PAS 55, Asset Management Standard, … · [Type text] WHITE PAPER Implementing PAS 55, Asset Management Standard, Through FMRIMS and MAINTintellegence Synergy By …](https://img.pdfslide.net/doc/110x75/5b365d757f8b9a436d8e3672/implementing-pas-55-asset-management-standard-type-text-white-paper-implementing.jpg)