Embed Size (px)
Citation preview

NASA TECHNICAL NOTE N A S A JJ e. I
-D-4095
F nI zL
DESIGN AND PERFORMANCE OF A NUCLEAR REACTOR SIMULATOR FOR NONNUCLEAR TESTING OF SPACE POWER SYSTEMS
i
by Kent S. Jefferies, Donald R. Pucke, and RaZph T. Dittrich
Lewis Research Center CZeveZand, Ohio
N A T I O N A L AERONAUTICS A N D SPACE A D M I N I S T R A T I O N W A S H I N G T O N , D. C. AUGUST 1967 $ i
https://ntrs.nasa.gov/search.jsp?R=19670023042 2018-09-06T19:05:01+00:00Z
TECH LIBRARY KAFB, NM
IIllill11111lllllllllllllllllllllllllIll1Ill1 0131002
DESIGN AND PERFORMANCE OF A NUCLEAR REACTOR SIMULATOR
FOR NONNUCLEAR TESTING OF SPACE POWER SYSTEMS
By Kent S. Jefferies, Donald R. Packe, and Ralph T. Dittrich
Lewis Research Center Cleveland, Ohio
NATIONAL AERONAUTICS AND SPACE ADMINISTRATION
For sale by the Clearinghouse for Federal Scientific and Technical Information Springfield, Virginia 22151 - CFSTI price $3.00
I
DESIGN AND PERFORMANCE OF A NUCLEAR REACTOR SIMULATOR
FOR NONNUCLEAR TESTING OF SPACE POWER SYSTEMS
by K e n t S. Jefferies, Donald R. Packe, a n d Ralph T. D i t t r i c h
Lewis Research Center
SUMMARY
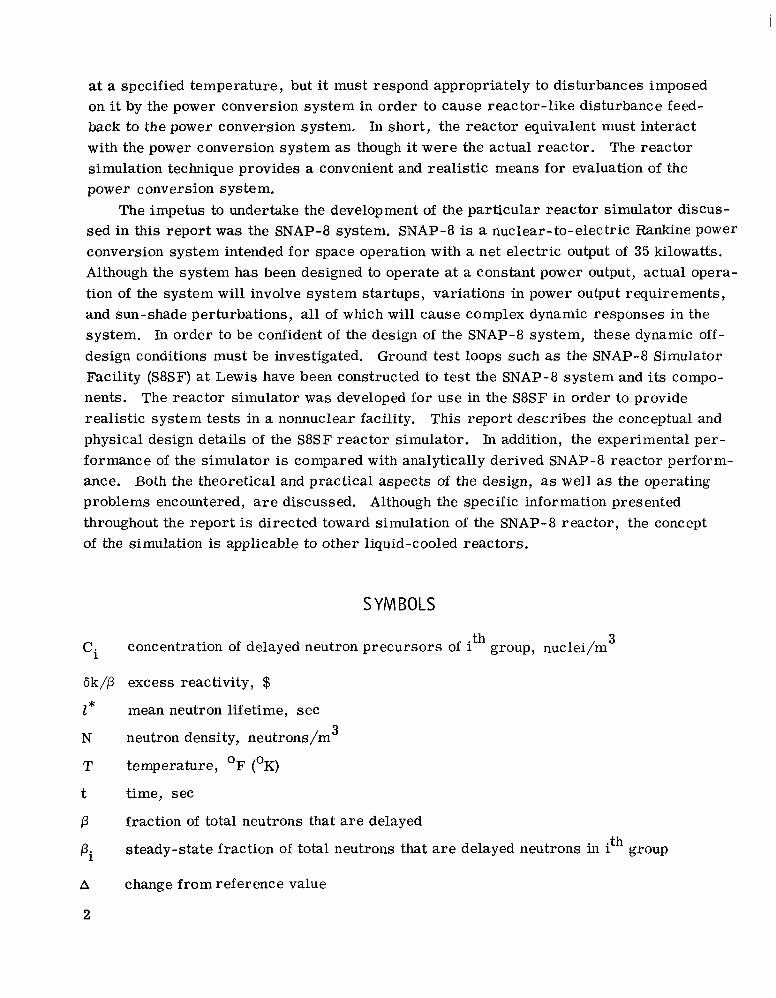
A SNAP-8 reactor simulator consisting primarily of an electric heater and an analog computer w a s designed and tested at the NASA Lewis Research Center. The simulation method w a s to represent three distinct subdivisions of the reactor dynamics independently. An electric heater represented reactor thermodynamics; an analog computer simulated both reactor nucleonics and reactor control.
A digital-computer model of the SNAP-8 reactor w a s used to evaluate the performance of the reactor simulator. This computer model was shown to agree approximately with the limited amount of SNAP-8 reactor data available. When both the simulator and the digital-computer model w e r e perturbed by the same slow change of reactor coolant inlet temperature, good agreement was observed. However when both systems were perturbed by the same step change of coolant flow the simulator responded more slowly than the digital-computer model. This effect was attributed to the particular heater used, which had too large a thermal mass to simulate SNAP-8 reactor thermodynamics accurately. This heater was used in the simulation because the original, faster responding heater failed electrically.
INTRODUCTION
The anticipated need for high-level electric power production in space is prompting the development of nuclear reactors as a primary heat source for space power systems. Inasmuch as system testing with a reactor is difficult, time consuming, and expensive, it is advantageous in the development of a complete space power system to utilize a reactor-equivalent heat source to conduct power conversion subsystem testing and evaluation. In order to provide assurance that the subsystem tests a r e representative of actual operating conditions, the reactor equivalent must not only supply the proper heat level
at a specified temperature, but it must respond appropriately to disturbances imposed on it by the power conversion system in order to cause reactor-like disturbance feedback to the power conversion system. In short, the reactor equivalent must interact with the power conversion system as though it were the actual reactor. The reactor simulation technique provides a convenient and realistic means for evaluation of the power conversion system.
The impetus to undertake the development of the particular reactor simulator discussed in this report was the SNAP-8 system. SNAP-8 is a nuclear-to-electric Rankine power conversion system intended for space operation with a net electric output of 35 kilowatts. Although the system has been designed to operate at a constant power output, actual operation of the system will involve system startups, variations in power output requirements, and sun-shade perturbations, all of which will cause complex dynamic responses in the system. In order to be confident of the design of the SNAP-8 system, these dynamic off-design conditions must be investigated. Ground test loops such as the SNAP-8 Simulator Facility (S8SF) at Lewis have been constructed to test the SNAP-8 system and its components. The reactor simulator w a s developed for use in the S8SF in order to provide realistic system tests in a nonnuclear facility. This report describes the conceptual and physical design details of the S8SF reactor simulator. In addition, the experimental performance of the simulator is compared with analytically derived SNAP-8 reactor performance. Both the theoretical and practical aspects of the design, as well as the operating problems encountered, a r e discussed. Although the specific information presented throughout the report is directed toward simulation of the SNAP-8 reactor, the concept of the simulation is applicable to other liquid-cooled reactors.
‘i
6k/P
I*
N
T
t
P
Pi A
2
SYMBOLS
concentration of delayed neutron precursors of ith group, nuclei/m
3
excess reactivity, $
mean neutron lifetime, sec
neutron density, neutrons/m 3
temperature, OF (OK)
time, sec
fraction of total neutrons that a r e delayed
steady-state fraction of total neutrons that a r e delayed neutrons in ith group
change from reference value
Xi decay constant of delayed neutron precursor of ithgroup
'cd position of control drum, rad
wN NaK flow rate, lb/hr (kg/sec)
Subscripts:
C core
dp design point
in inlet
lg lower grid plate
out outlet
ug upper grid plate
CONCEPTUAL DESIGN OF REACTOR SIMULATOR
SNAP-8 Reactor Description
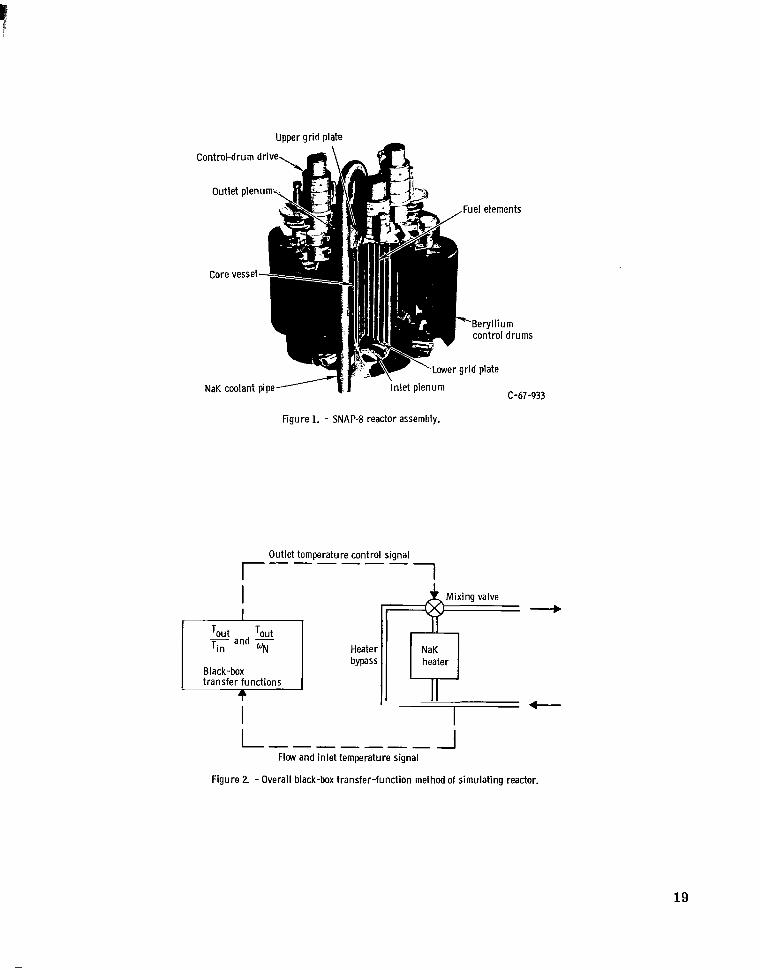
As the primary energy source of the SNAP-8 system, the purpose of the reactor is to heat the NaK (the eutectic of sodium and potassium) flowing through it to 1300' F (977.8' K). It is capable of producing 600 kilowatts of thermal power continuously during a 10 000-hour SNAP-8 mission. The reactor core consists of 211 fuel elements held in position by two grid plates, as shown in figure 1. The control drums, which surround the reactor core, control the nucleonic reaction by reflecting neutrons back into the core. To provide an inherent power stability, the reactor core was designed to have negative temperature coefficients of reactivity through physical expansion effects. For example, a random increase in power resulting in a rise in reactor temperature will expand the core structure thereby increasing leakage of neutrons from the core and reducing the power back toward its original level.
Six control drums are the only devices used to control the SNAP-8 reactor. Three of the drums have two positions, f u l l in and full out, and are used for initiating reactor startup. The other three drums can be moved in small steps and are used for completing reactor startup, for reactor control during power conversion system startup and other transients, and for balancing the reactivity changes caused by fuel depletion.
3
I
Selection of Simulation Concept
The significant aspect of the reactor for the simulator design is its thermodynamic performance as a heat exchanger with internally generated power dependent on inherent temperature effects and control-drum position. A simulation of the reactor thermodynamic performance must include the effects of the control drums, the temperature reactivity coefficients, the thermal mass, and the heat-transfer characteristics of the core. A simulation of these effects could be accomplished in several ways.
One possible method for simulating the reactor is the overall 'lblack-boxll transfer-function method, as illustrated in figure 2. The black box represents the transfer functions of NaK outlet temperature to flow rate and NaK outlet temperature to inlet temperature of the actual reactor. There are several reasons, however, why this technique of simple input-output transfer functions was not attempted: (1) the SNAP-8reactor transfer functions, particularly NaK outlet temperature to inlet temperature, are not known sufficiently well; (2) the reactor is not linear; that is, the transfer functions are different for different power levels and are not valid for large changes of the input variables; and (3) certain parameters such as reactor power level, control-drum position, and internal temperature distribution, which are important in interpreting dynamic behavior would not be available as outputs of a simple black-box simulation.
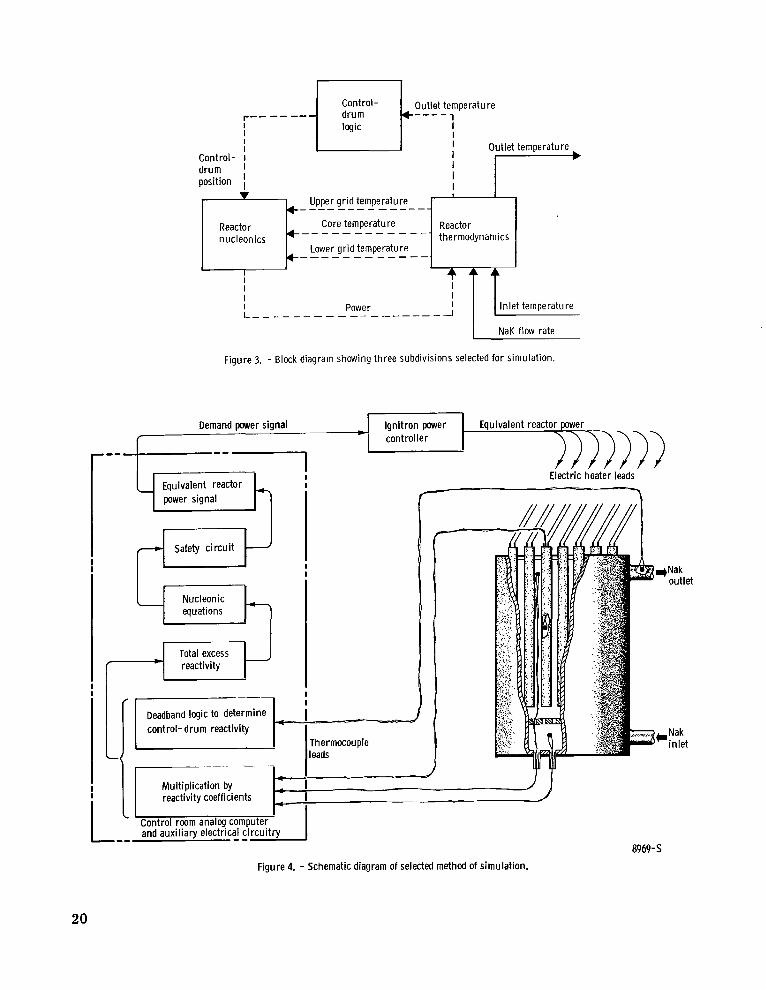
It was therefore alternatively decided to divide the reactor simulation into three smaller blocks: control-drum logic, reactor nucleonics, and reactor thermodynamics, as shown in figure 3. The reactor control-drum logic has reactor outlet temperature as its input and position of the control drums as its output. Reactor nucleonics is the determination of reactor power based on control-drum position and internal reactor temperature distribution. Reactor thermodynamics is the determination of reactor outlet temperature and internal temperature distribution based on reactor power, inlet temperature, and NaK flow rate. These three blocks have physical significance since they represent the functions of the reactor control mechanism, the reactor fuel, and the reactor core geometry and are natural subdivisions of a reactor simulation.
With the preceding three sections, there is still a wide range of simulation methods. An extreme would be to have all three sections simulated on a computer. The outlet temperature demand value generated by the computer would then be used to control a valve that mixes hot and cold streams from a heater and heater bypass, respectively. Less extreme simulations are those in which some blocks are analytical representations, and the remaining blocks are physical representations. The simulation method selected consisted of analytical representations of the reactor nucleonics and control-drum logic and a physical representation of the reactor thermodynamics. The method of simulating each-block was chosen on the basis of various considerations. It was decided to use an electrically heated heat exchanger to simulate the thermodynamic behavior of the core be
4
cause there would be considerable equipment needed to program this behavior validly on a computer. Electrical power was chosen to enable fast, accurate control and because electric heater elements could be physically similar to reactor fuel rods. It was decided to simulate the reactor nucleonics on an analog computer, because a physical simulation was impractical. For convenience, the reactor controller was simulated by using the analog computer.
The selected simulation method is shown in figure 4. The two major components of the S8SF reactor simulator a r e the electric heater and an analog computer. Auxiliary electrical circuitry is used with the computer to simulate the control drums and an ignitron power controller is used to manipulate the electric power. The heater consists of a bundle of heater rods which heat the NaK flowing through it. The analog computer and the auxiliary electrical circuitry receive signals from the NaK heater thermocouples and use standard nucleonic equations (refs. 1 and 2) to compute equivalent reactor power. The ignitron power controller receives the analog computer demand signal and regulates the heater electrical power to equal the demand power.
DESIGN DETAILS OF REACTOR SIMULATOR
Electr ic Heater
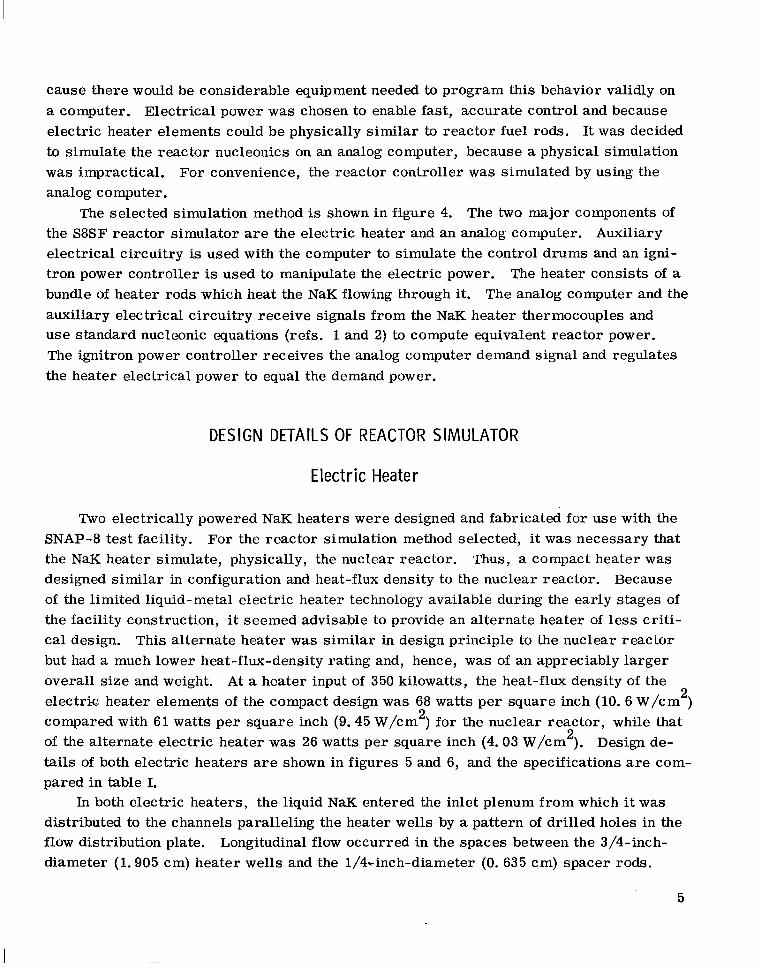
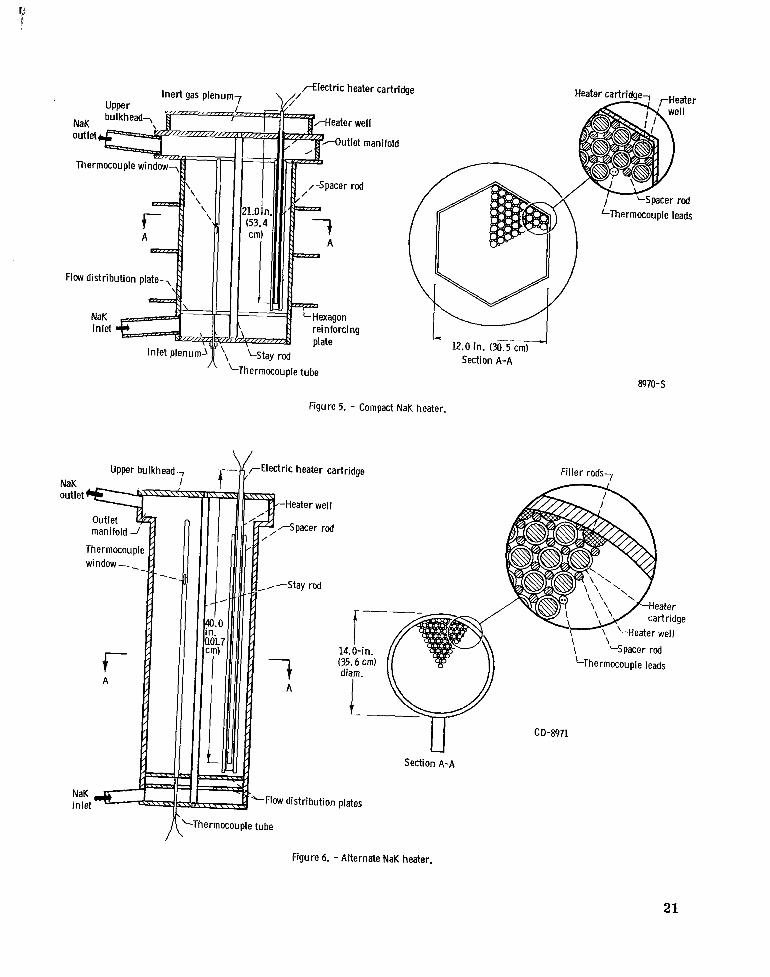
Two electrically powered NaK heaters were designed and fabricated for use with the SNAP-8 test facility. For the reactor simulation method selected, it was necessary that the NaK heater simulate, physically, the nuclear reactor. ,Thus, a compact heater was designed similar in configuration and heat-flux density to the nuclear reactor. Because of the limited liquid-metal electric heater technology available during the early stages of the facility construction, it seemed advisable to provide an alternate heater of less critical design. This alternate heater was similar in design principle to the nuclear reactor but had a much lower heat-flux-density rating and, hence, was of an appreciably larger overall size and weight. At a heater input of 350 kilowatts, the heat-flux density of the electric heater elements of the compact design was 68 watts per square inch (10. 6 W/cm 2) compared with 61 watts per square inch (9.45 W/cm 2) for the nuclear reactor, while that of the alternate electric heater was 26 watts per square inch (4.03 W/cm 2). Design details of both electric heaters are shown in figures 5 and 6, and the specifications are compared in table I.
In both electric heaters, the liquid NaK entered the inlet plenum from which it was distributed to the channels paralleling the heater wells by a pattern of drilled holes in the flow distribution plate. Longitudinal flow occurred in the spaces between the 3/4-inchdiameter (1.905 cm) heater wells and the 1/4+inch-diameter (0. 635 cm) spacer rods.
5
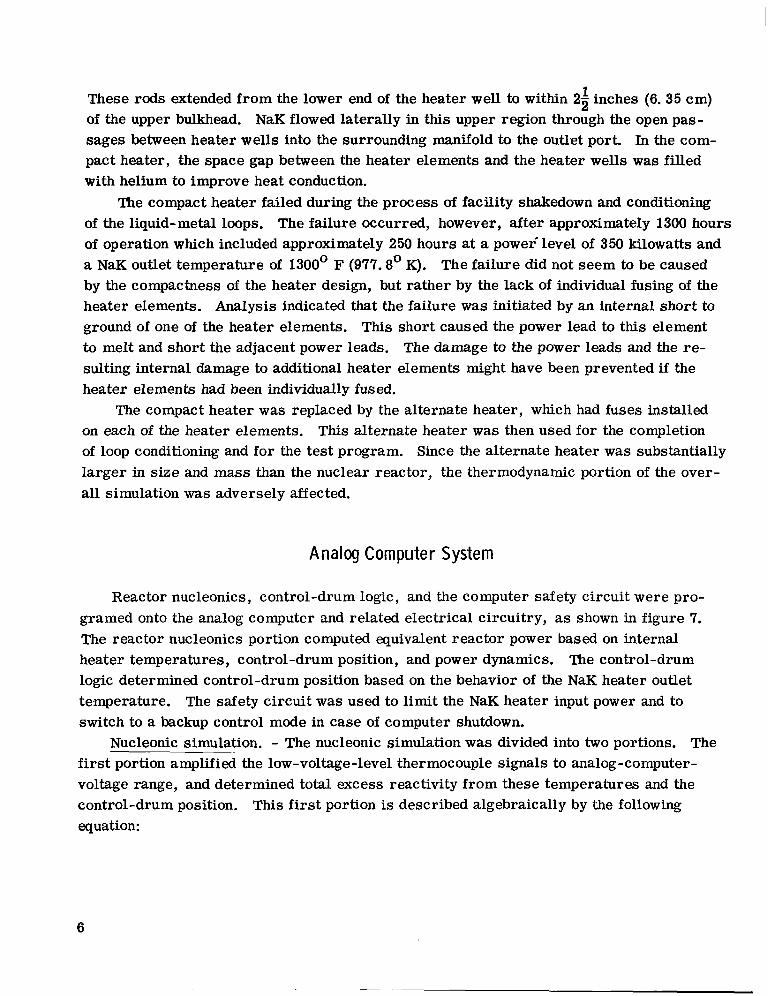
These rods extended from the lower end of the heater well to within 221 inches (6.35 cm) of the upper bulkhead. NaK flowed laterally in this upper region through the open passages between heater wells into the surrounding manifold to the outlet port. In the compact heater, the space gap between the heater elements and the heater wells was filled with helium to improve heat conduction.
The compact heater failed during the process of facility shakedown and conditioning of the liquid-metal loops. The failure occurred, however, after approximately 1300 hours of operation which included approximately 250 hours at a power'level of 350 kilowatts and a NaK outlet temperature of 1300' F (977.8' K). The failure did not seem to be caused by the compactness of the heater design, but rather by the lack of individual fusing of the heater elements. Analysis indicated that the failure was initiated by an internal short to ground of one of the heater elements. This short caused the power lead to this element to melt and short the adjacent power leads. The damage to the power leads and the resulting internal damage to additional heater elements might have been prevented if the heater elements had been individually fused.
The compact heater was replaced by the alternate heater, which had fuses installed on each of the heater elements. This alternate heater was then used for the completion of loop conditioning and for the test program. Since the alternate heater was substantially larger in size and mass than the nuclear reactor, the thermodynamic portion of the overall simulation was adversely affected.
Analog Computer System
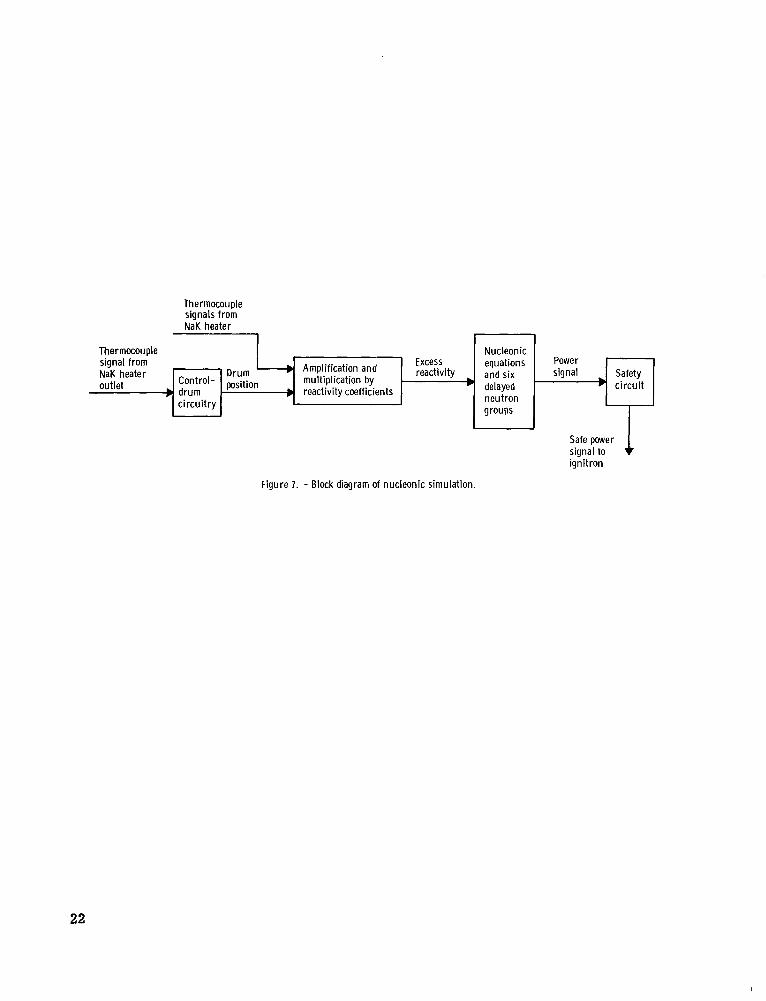
Reactor nucleonics, control-drum logic, and the computer safety circuit were programed onto the analog computer and related electrical circuitry, as shown in figure 7. The reactor nucleonics portion computed equivalent reactor power based on internal heater temperatures, control-drum position, and power dynamics. The control-drum logic determined control-drum position based on the behavior of the NaK heater outlet te.mperature. The safety circuit was used to limit the NaK heater input power and to switch to a backup control mode in case of computer shutdown.
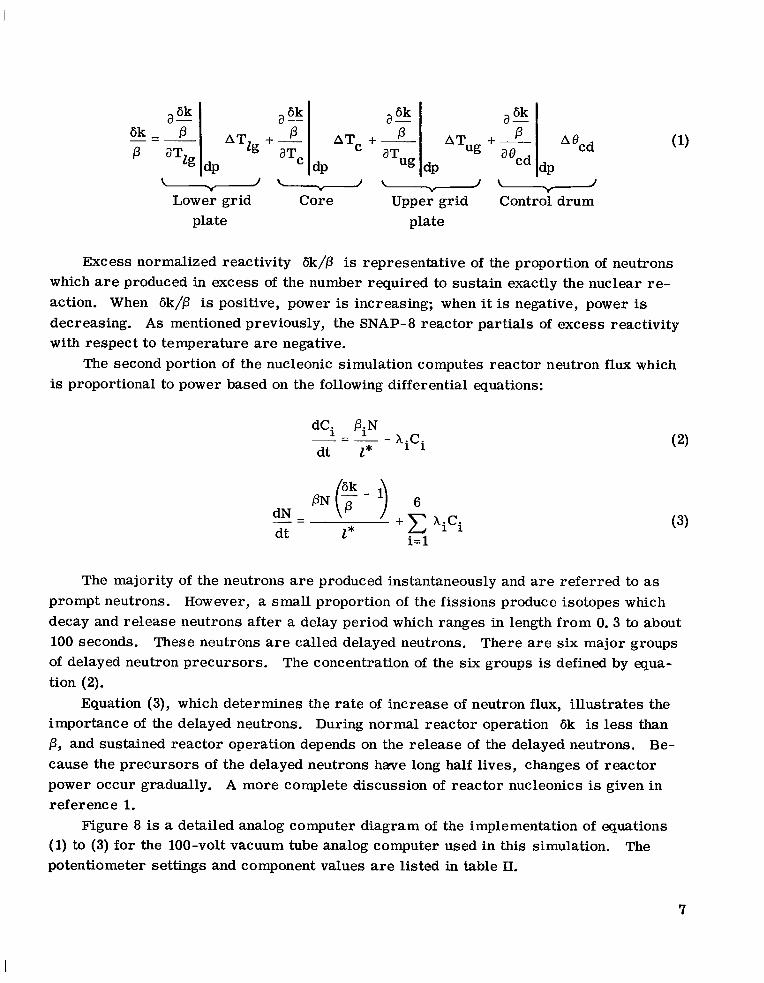
Nucleonic simulation. - The nucleonic simulation was divided into two portions. The first portion amplified the low-voltage-level thermocouple signals to analog-computervoltage range, and determined total excess reactivity from these temperatures and the control-drum position. This first portion is described algebraically by the following equation:
6
- - - -
a-6k a-6k a-6k a-6k
6 k - AT2g
+- P ATc +- ATug +-- P A 'cd aTzg dp aTc dp aTug dp a 'cd dP
Excess normalized reactivity 6k/P is representative of the proportion of neutrons which are produced in excess of the number required to sustain exactly the nuclear reaction. When 6k/P is positive, power is increasing; when it is negative, power is decreasing. As mentioned previously, the SNAP-8 reactor partials of excess reactivity with respect to temperature are negative.
The second portion of the nucleonic simulation computes reactor neutron flux which is proportional to power based on the following differential equations:
dCi PiN XiCi-dt 2*
& '-1 (3)dt z* i=1
The majority of the neutrons are produced instantaneously and a r e referred to as prompt neutrons. However, a small proportion of the fissions produce isotopes which decay and release neutrons after a delay period which ranges in length from 0.3 to about 100 seconds. These neutrons are called delayed neutrons. There are six major groups of delayed neutron precursors. The concentration of the six groups is defined by equation (2).
Equation (3), which determines the rate of increase of neutron flux, illustrates the importance of the delayed neutrons. During normal reactor operation 6k is less than P , and sustained reactor operation depends on the release of the delayed neutrons. Because the precursors of the delayed neutrons have long half lives, changes of reactor power occur gradually. A more complete discussion of reactor nucleonics is given in reference 1.
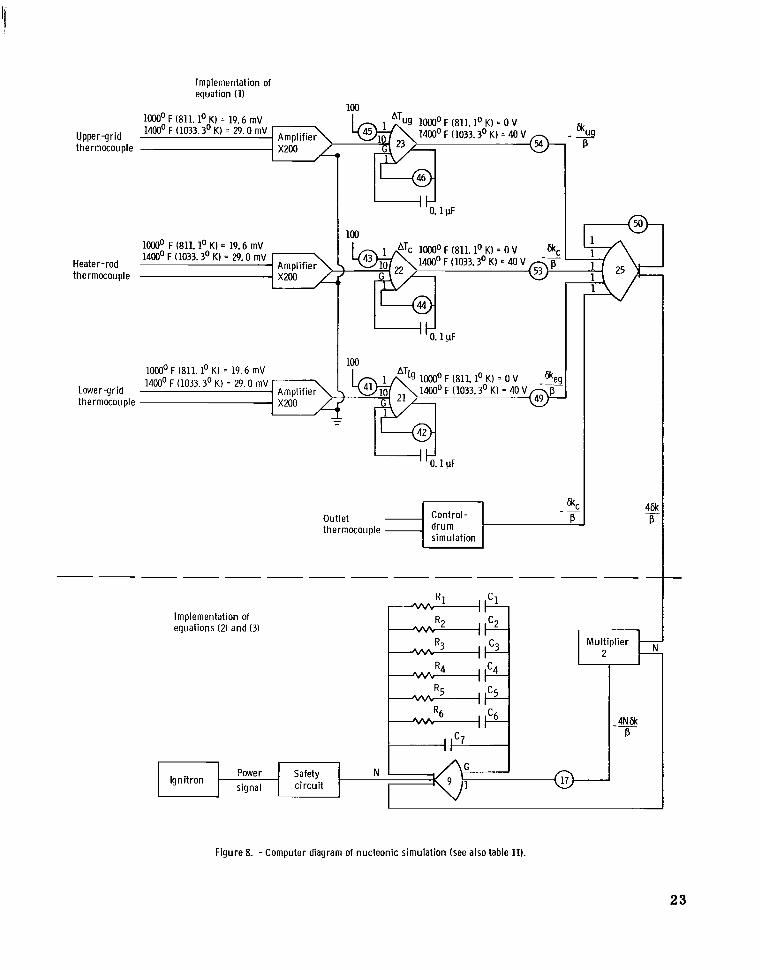
Figure 8 is a detailed analog computer diagram of the implementation of equations (1) to (3) for the 100-volt vacuum tube analog computer used in this simulation. The potentiometer settings and component values are listed in table II.
7
I
Equation (1)is represented by the upper portion of figure 8. The four key temperatures (upper grid, core, lower grid, and outlet) were measured by thermocouples appropriately located within the electric heater.
Because the NaK heater thermocouples were grounded to the heater at the point where the temperature was measured, both sides of the thermocouple output had electrical potential with respect to ground. Inputs to the analog computer, however, must have one side at ground potential. It was therefore necessary to provide isolation amplifiers between the thermocouples and the analog computer inputs.
Three of these isolation amplifiers are the gain 200 amplifiers in the upper left corner of figure 8. The fourth is part of the block labeled control-drum simulation. 'The three computer amplifiers (21, 22, and 23) were used to convert the amplified thermocouple signals to the computer scaling ( lOOOo F (811. 1' K) = 0 V, 1400' F (1033. 3' K) = 40 V) and to filter out high-frequency electrical noise. Potentiometers 49, 53, and 54 multiplied the lower-grid, core, and upper-grid temperatures by the appropriate normalized reactivity coefficients. Amplifier 25 summed the normalized reactivity due to the three temperatures with the control-drum normalized reactivity and multiplied the sum by a computer scale factor of 4 to increase the accuracy of multiplier 2.
Equations (2) and (3) were represented by multiplier 2 and amplifier 9. The concentration of delay neutron precursors in each delay group Ci was represented by the charge on each of the six capacitors in the feedback of amplifier 9, which were in ser ies with resistors. These RC feedback circuits produced response lags commensurate with the lags displayed by each of the delay groups. The seventh capacitor represented the mean lifetime. Multiplier 2 and potentiometer 17 were used to provide the product NGk/P at the input to amplifier 9. The output of amplifier 9 was scaled to provide the proper power signal to the ignitron. A detailed discussion of this analog network is presented in reference 3.
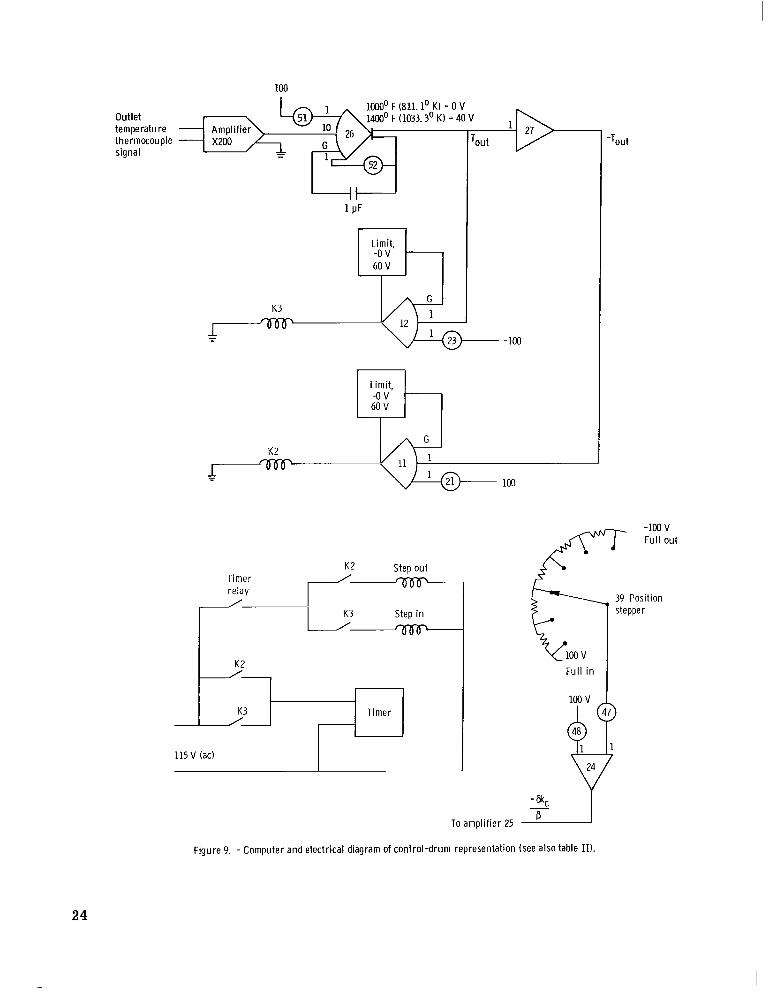
Control-drum simulation. - The SNAP-8 reactor control is designed to maintain the coolant outlet temperature within a narrow range around the design value by incrementally changing the control-drum position immediately each time the outlet temperature falls below the lower limit or rises above the upper limit. If the outlet temperature stays outside the deadband range for a programed time interval, a second step is taken. Additional steps a r e taken at equal time intervals as long as the outlet temperature remains beyond the deadband limits. If the outlet temperature is above the upper limit, the drum is stepped outward in order to reflect less neutmns into the core thus reducing excess reactivity and causing reactor power to decrease. Likewise, if the outlet temperature is below the lower deadband limit, the reflector drum is stepped inward in order to increase reactor power.
The control drums were simulated by electrical relays, a timer, a stepping relay, and the analog computer, as shown in figure 9. The outlet temperature and the deadband
8
limits were inputs to two relay driver amplifiers (11and 12). Limiting circuits were constructed around these amplifiers so that during operation within the deadband, the amplifier outputs were zero and the relays were open. However, when a deadband limit was exceeded, the appropriate relay (K2 or K3)closed which started the timer and stepped the stepping relay in the appropriate direction (in or out). If the outlet temperature remained beyond the deadband limit for the programed interval, the timer recycled and an additional step in the same direction was taken. This stepping continued until the outlet temperature returned to the deadband range.
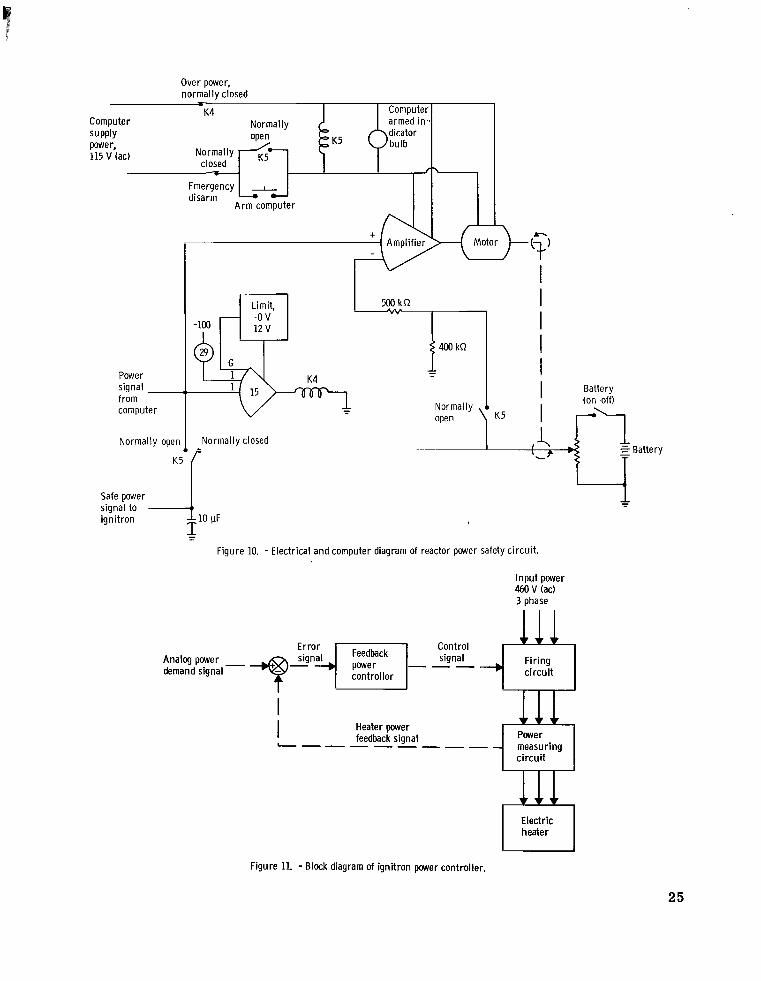
Safety circuit. - The purpose of the safety circuit was to supply a command value of electric power when the analog computer was not controlling power safely. This circuit, shown schematically in figure 10, disarmed the computer in response to any of the following three events: (1) a manual switch was set to "emergency disarm, ? ' (2) the computer reactor simulator power signal exceeded a preset limit, o r (3) the analog computer 115-volt alternating-current power was interrupted.
Once the safety circuit acquired control of the power command signal, i t held this power at the last value computed, until it was changed manually o r the computer was again "armed.
Ignitron Power Controller
A power controller was needed in the reactor simulator to vary the actual power into the electric heater in response to the power demand signal generated by the analog computer. For the S8SF, an ignitron type was chosen because of its inherent high speed of response to control demand signals and also because of its ability to modulate power to complete turnoff.
High accuracy of the ignitron control was achieved by using a feedback power controller, as shown in figure 11. Total heater input power was measured and compared with the analog power demand signal with the controller designed to minimize the difference. The ignitron e r ror was kept within 1percent of demand power by using this feedback control system.
The ignitron-control-system time constant can be very small, a few sixtieths of a second, because the ignitron tubes control power by conducting during a portion of each cycle of the 60-hertz voltage sine wave, as shown in figure 12. The ignitron tubes are given a current pulse to initiate conduction and then continue to conduct until the voltage wave changes sign. The ignitron power controller is capable of a full-scale change of output power within 1/2 second.
The ignitron power controller, however, proved to cause considerable electrical noise. The waveform shown in figure 13 is typical of the ambient control room noise
9
that existed while the ignitron was operating. There are six pulses (two from each phase), which correspond to the ignition of each of the six ignitron tubes, during each cycle of the 60-hertz ambient electrical noise. The ignitron noise caused the analog computer operation to be less stable. More frequent computer maintenance was therefore required. It also decreased the accuracy of the digitally recorded data even though all the signals were shielded.
TEST FACILITY, INSTRUMENTATION, AND DIGITAL MODEL DESCRIPTION
Test F a dIity
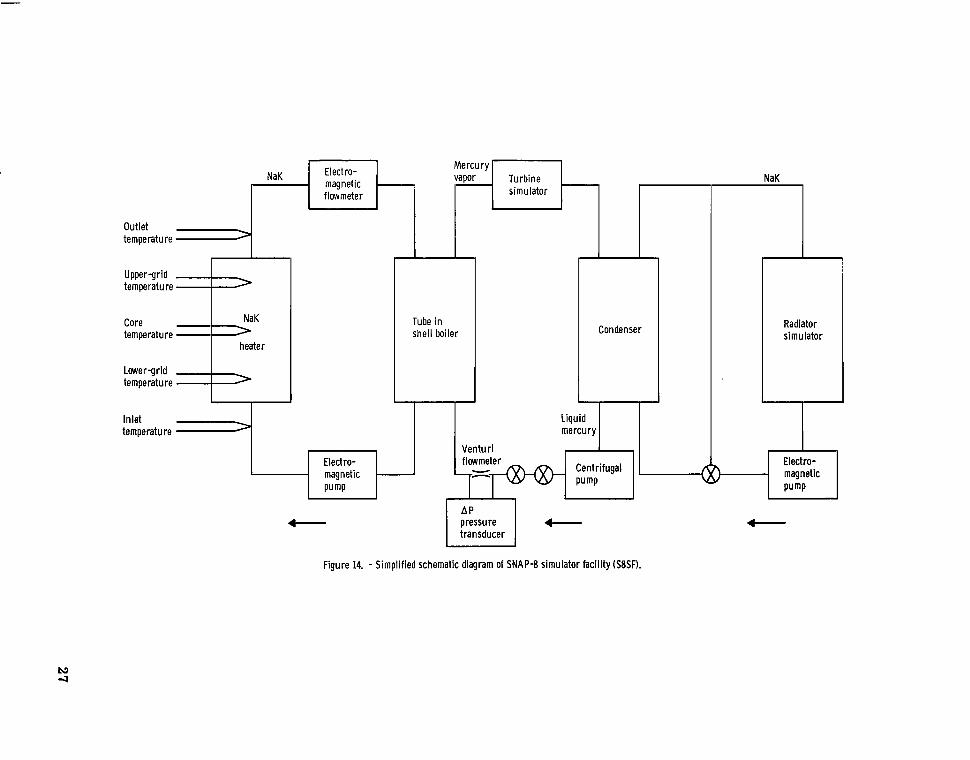
The reactor simulator consisting of the electric heater, the analog computer, the auxiliary electric circuitry, and the ignitron power controller was assembled and tested as part of the S8SF. For these tests, the other major components of the S8SF were a tube-in-shell boiler, a flight-type SNAP-8 condenser, and a radiator simulator. These components were arranged as shown infigure 14. The heat energy from the electric heater was transferred to the mercury boiler by :he first-loop NaK. After passing through a system which was designed to simulate the turbine, the mercury vapor was condensed. In the condenser, the heat energy was transferred to the third-loop NaK. The NaK was cooled in the airblast heat exchangers that together with an analog computer airblast control circuit constituted the radiator simulator (ref. 4).
Instrumentation
Although the S8SF was thoroughly instrumented, only a few measurements are r e ferred to in this report. The instruments used in obtaining the data presented herein a r e shown schematically in figures 11and 14. A measurement of electric power into the heater was obtained by multiplying voltage and current of each phase and totaling the three products. Mercury flow rate was determined by measuring the pressure differential across a calibrated venturi. NaK flow rate was measured by an electromagnetic flow-meter. Temperatures were measured by Chromel-Alumel thermocouples and thermocouple reference ovens held at 150' F (338.9' K).
All these reactor simulator instrumentation signals were digitized and recorded at a rate of one recording of each variable per second during reactor simulator transients. The plotted points of reactor simulator inlet and outlet temperature data that appear herein were determined by averaging the 10 values recorded during a 10-second time interval in order to eliminate high-frequencyaoise.
10
Description and Evaluation of Digital Model
For the evaluation of the reactor simulator, only a limited amount of dynamic test data from the SNAP-8 Experimental Reactor (S8ER) was available, and it was not possible to duplicate the disturbance function experimentally for these data in the testing of the reactor simulator. Therefore, it was decided to evaluate the reactor simulator performance by comparison with analytical information generated by a digital computer model of the SNAP-8 reactor. The reactor data, however, were used to help establish confidence in the digital-computer model.
The digital-computer model of the SNAP-8 reactor used in evaluating the S8SF reactor simulator consisted of representations of the reactor thermodynamics, the reactor nucleonics, and the reactor control-drum logic. The thermodynamic representation was subdivided into 24 nodes as follows: one inlet plenum, one lower grid plate, twenty nodes along the axis of the reactor core, one upper grid plate, and one outlet plenum. Reactor power was distributed axially along the twenty core nodes according to a cosine distribution. The nucleonic representation used the equations presented earlier in this report (eqs. (1)to (3)). The logic of the control-drum stepping mechanism was simulated on the digital computer. The dynamic equations for the thermodynamic, nucleonic, and control-drum representations were solved by an iterative integration procedure.
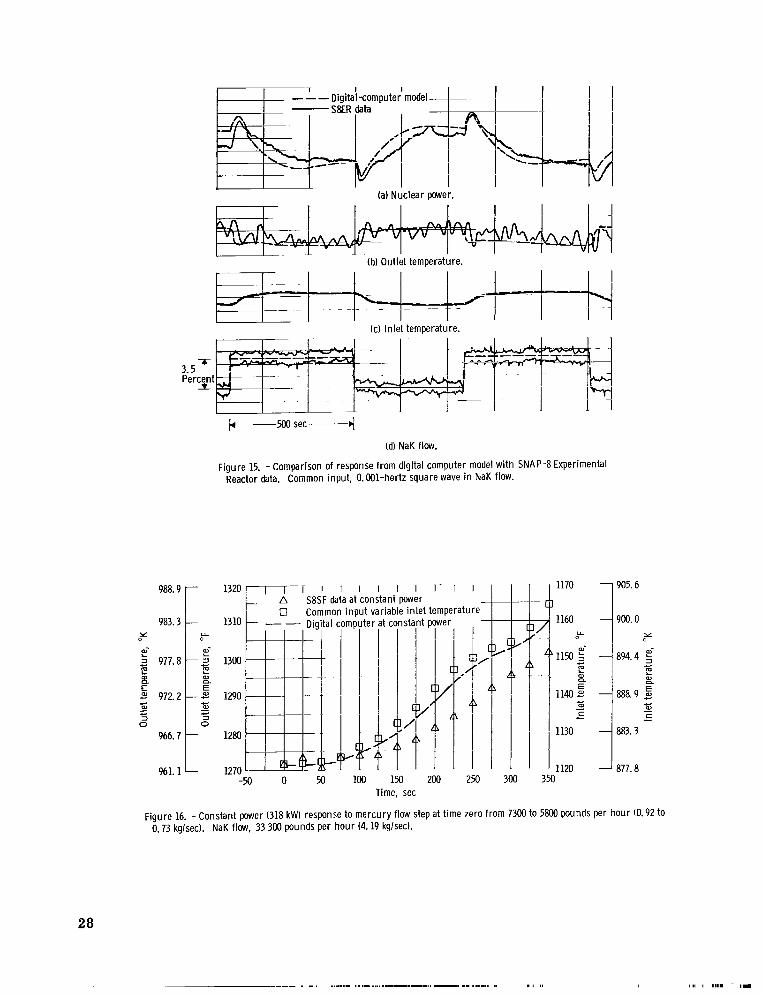
The responses of the digital simulation of the SNAP-8 reactor and of the S8ER to a 0.001-hertz square wave of NaK flow are shown in figure 15. The amplitude of the input square wave is 3.5 percent of the total NaK flow. The S8ER data in this figure were duplicated from reference 5. It can be seen from figure 15 that the transients in reactor power and outlet temperature are similar. The experimental data, however, are very noisy making an exact comparison impossible. However, it was concluded that the digital computer reactor was sufficiently like the S8ER in performance to be useful in evaluating the S8SF reactor simulator.
RESULTS AND DISCUSSION
Effects of NaK Heater Mass
The first comparison of data from the S8SF NaK heater to the digital-computer reactor model is shown in figure 16. In this case, the electric heater was being operated at constant power to isolate the thermodynamic effectsfrom the nuclear effects; the analog computer representation of reactor nucleonics was not being used. The digital run was also at constant power. The S8SF transient resulted from a step decrease of mercury flow rate. This mercury flow step caused the ramp increase of NaK heater inlet
11
I
temperature, which is shown in figure 16. In the digital program the actual S8SF data of the NaK heater inlet temperature transient was used as the input. Additional inputs also taken from S8SF data were power level and NaK flow rate. The curves (fig. 16) of outlet temperature transient from the S8SF NaK heater and from the digital simulation of a constant power reactor show that the S8SF heater has a thermal lag of 100 seconds, which is about three times the lag of the actual reactor.
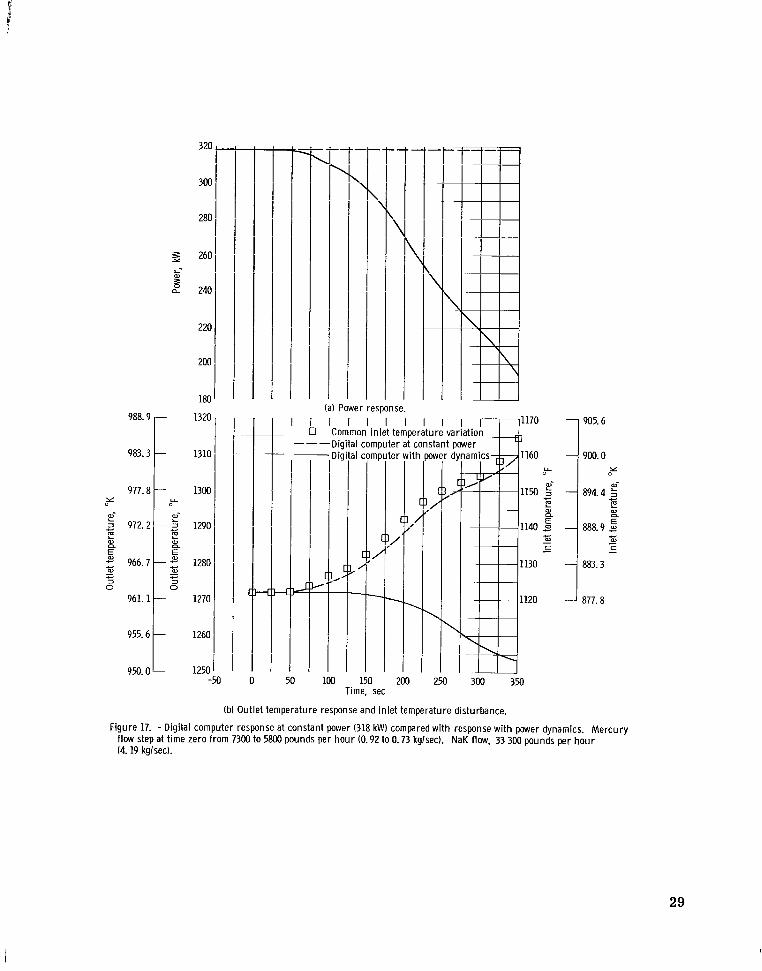
This thermodynamic difference, however, does not necessarily preclude a reasonable reactor simulation. The dynamics of reactor power, which weFe missing in the preceding comparison, play a dominant role in determining reactor response, as can be seen from the results of two digital computer runs shown in figure 17. Both runs were computer simulations of the S8ER, but one was at constant power whereas the other used the nucleonic equations to determine power. The contrast between the two digital computer runs is striking. In response to the same transient inlet temperature input, the outlet temperature increased during the constant power run and decreased during the variable power run. The rise in inlet temperature, through its negative reactivity coefficient, caused the net excess reactivity to become negative which in turn caused the decrease in reactor power shown in figure 17. This decrease in power continued until the core temperature and outlet temperature decreased sufficiently to bring the net excess reactivity back to zero. The drop in reactor power caused the outlet temperature to fall even though the inlet temperature was rising.
Reactor-Simulator Trans ients Imposed by Steps in M e r c u r y o r NaK Flow
In order to make a thorough evaluation of the S8SF reactor simulator, transients of various magnitudes at different operating points of the S8SF reactor simulator were applied. Similar transients were then run on the digital-computer model of the reactor. Most of these S8SF runs used constant values of the reactivity coefficients that were determined theoretically before the S8ER testing. To make realistic comparisons, each digital run used the same reactivity coefficients as the corresponding S8SF run. The comparison runs include a small and large step in mercury (boiling fluid) flow with reactor flow constant, a small and a large step in NaK (reactor coolant) flow with mercury flow constant, and a mercury loop startup.
The first group of data was generated by causing step changes of mercury flow rate in the S8SF loop in order to introduce changes in the S8SF reactor simulator inlet temperature. The responses of the S8SF reactor simulator and of the digital computer model to these inlet temperature transients are shown in figures 18 and 19.
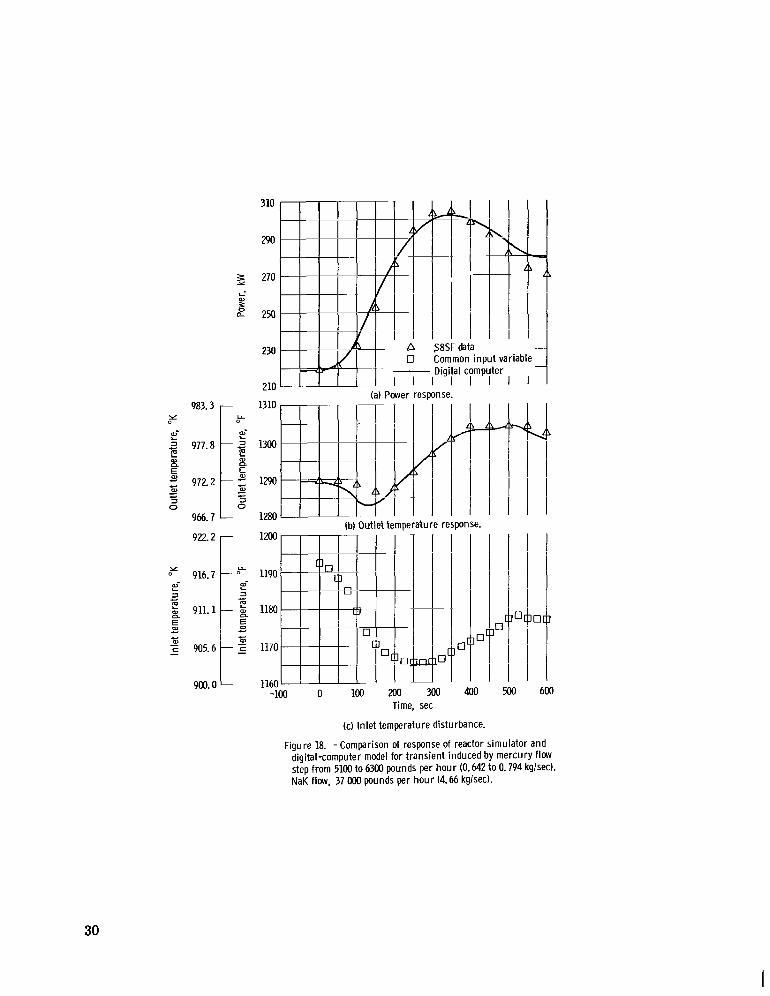
The S8SF transient presented in figure 18 was initiated by a step of mercury flow rate from 5100 to 6300 pounds per hour (0.642 to 0.794 kg/sec). The digital transients
12
were obtained by using the S8SF initial operating point and inlet temperature transient plotted in figure 18. The outlet temperature deadband limits, set at 1278' and 1325' F (965.6' and 991.7' K), were not exceeded by either the S8SF or the digital-computer outlet temperature transient. The outlet temperature transients in figure 18 display closer agreement than the constant power outlet temperature transients in figure 16, because the nucleonics, which were programed from the same equations for both the S8SF and the digital program, have a significant influence on the outlet transient.
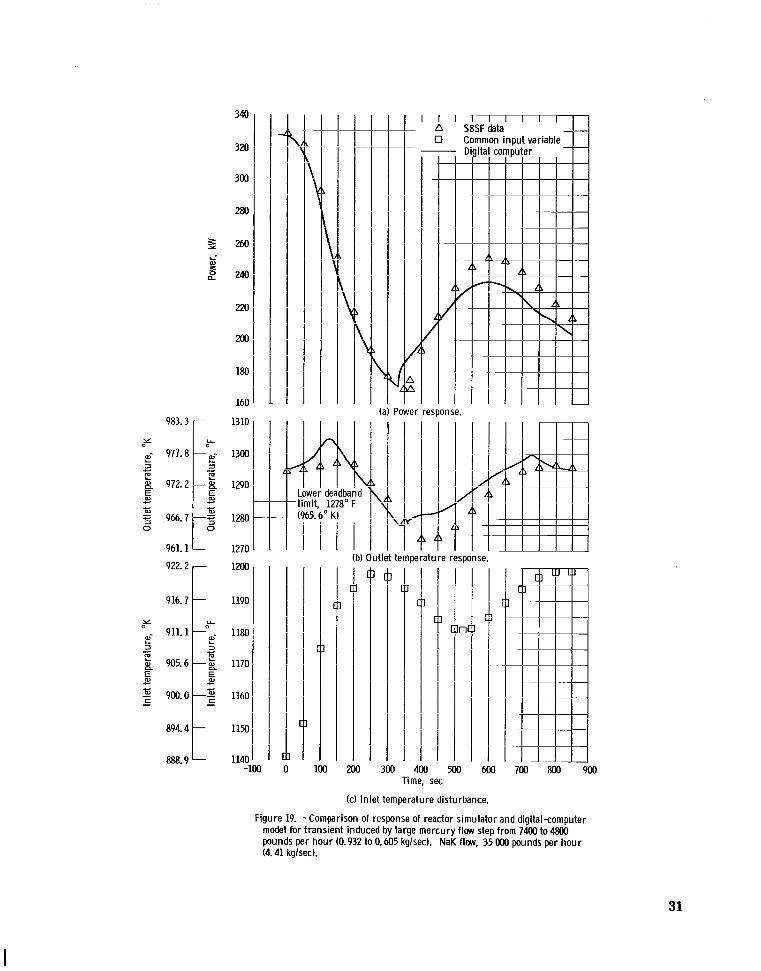
The transients shown in figure 19 were caused by a larger change of mercury flow than those shown in figure 18. The initial operating point is also somewhat different. The mercury flow was stepped f rom 7400 to 4800 pounds per hour (0.932 to 0.605 kg/sec) at time zero. The NaK flow was 35 000 pounds per hour (4 .41 kg/sec) and the initial power was 328 kilowatts. In both the S8SF and the digital transients, the lower deadband limit (1278' F (965. 6OK)) was crossed and a control-drum step was taken. The two instants at which the control steps occurred can be recognized on the power transients (fig. 19) by the sudden increases of power which occur at 330 seconds on the digital transient and at 365 seconds on the S8SF transient. The gradual r ise of power, which continues for approximately 250 seconds after the sudden increase, is also a result of the control-dru m step.
From the comparisons of figures 18 and 19, it can be observed that the reactor simulator performance was in close agreement with that of the digital model of the reactor for both the small and large steps in mercury flow.
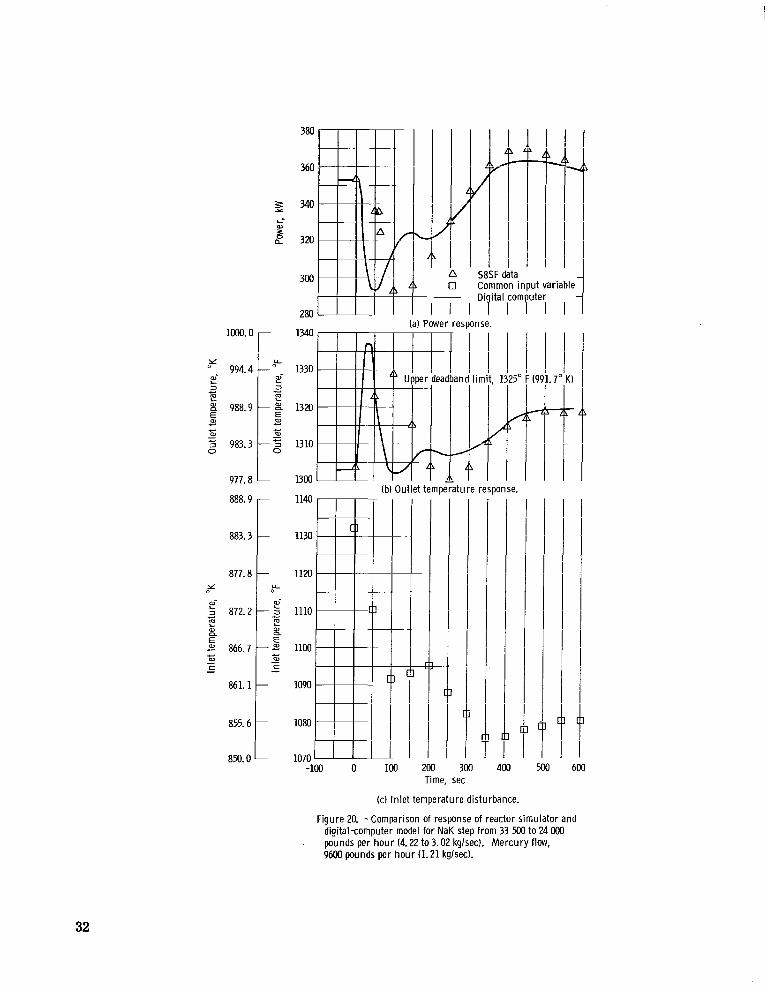
Two S8SF transients initiated by NaK flow disturbances are shown in figures 20 and 21. The digital runs shown in the figures were run using as inputs the corresponding S8SF data for initial power, time history of NaK flow, and time history of NaK inlet temperature. The NaK flow steps caused a more abrupt change in reactor operation than did the mercury flow steps.
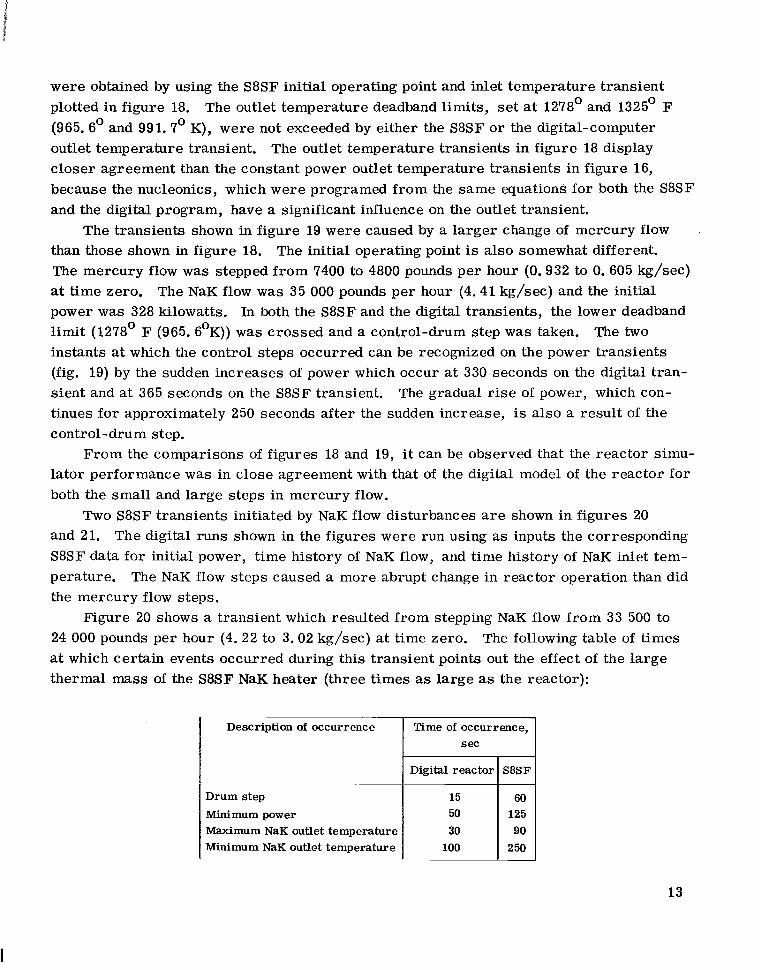
Figure 20 shows a transient which resulted from stepping NaK flow from 33 500 to 24 000 pounds per hour (4 .22 to 3.02 kg/sec) at time zero. The following table of times at which certain events occurred during this transient points out the effect of the large thermal mass of the S8SF NaK heater (three times as large as the reactor):
Description of Occurrence
~~
Drum step Minimum power Maximum NaK outlet temperature Minimum NaK outlet temperature
Time of occurrence, sec
I
Digital reactor I SBSF1A250100
13
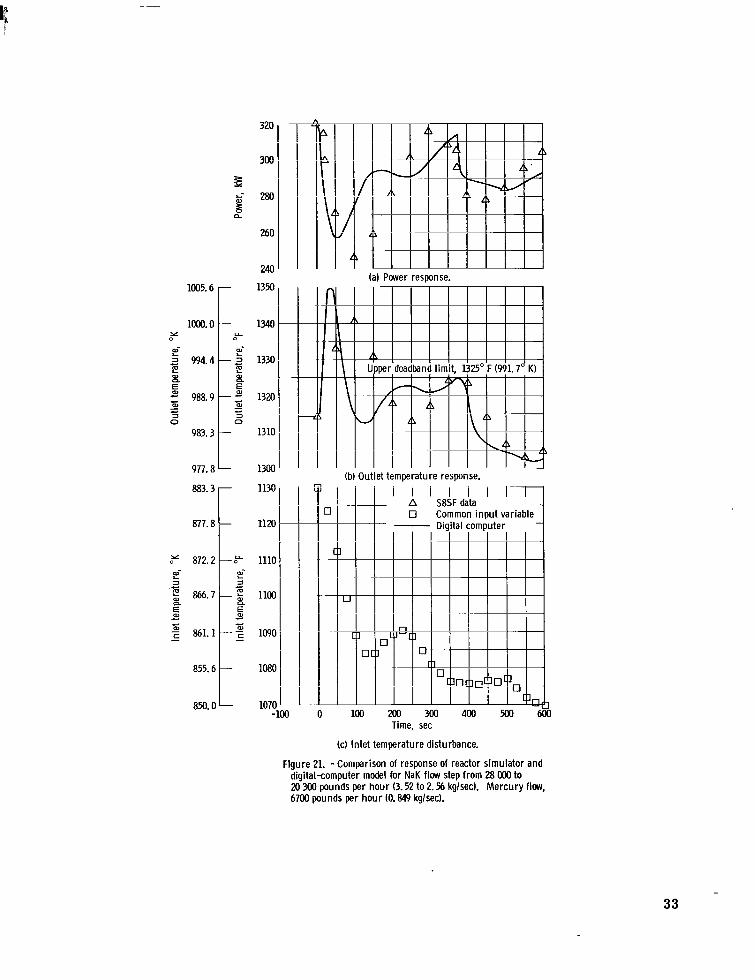
The transients plotted in figure 21 resulted from a step of NaK flow from 28 000 to 20 300 pounds per hour (3. 52 to 2. 56 kg/sec) at time zero. Control-drum steps occurred at approximately the same times in both simulations. All four control-drum steps resulted when the upper deadband limit was crossed. The digital simulation had control-drum steps at 10 and 375 seconds, and the S8SF simulation had steps at 20 and 370 seconds.
The major difference between this transient and the previously discussed transient (fig. 20) is that, in this case, two drum steps were required to keep the outlet temperature within the deadband range. The second drum step was required because the initial value of outlet temperature was close to the deadband limit. I�the S8SF had recorded data for a longer time than the 600 seconds plotted in the figures, the two simulations would have agreed on the final steady-state values of power and outlet temperature.
From the comparisons of figures 20 and 21 it can be concluded that with the poor thermodynamic simulation used, the reactor simulation responded too slowly to the abrupt changes resulting from large steps in NaK flow.
Startup Transient
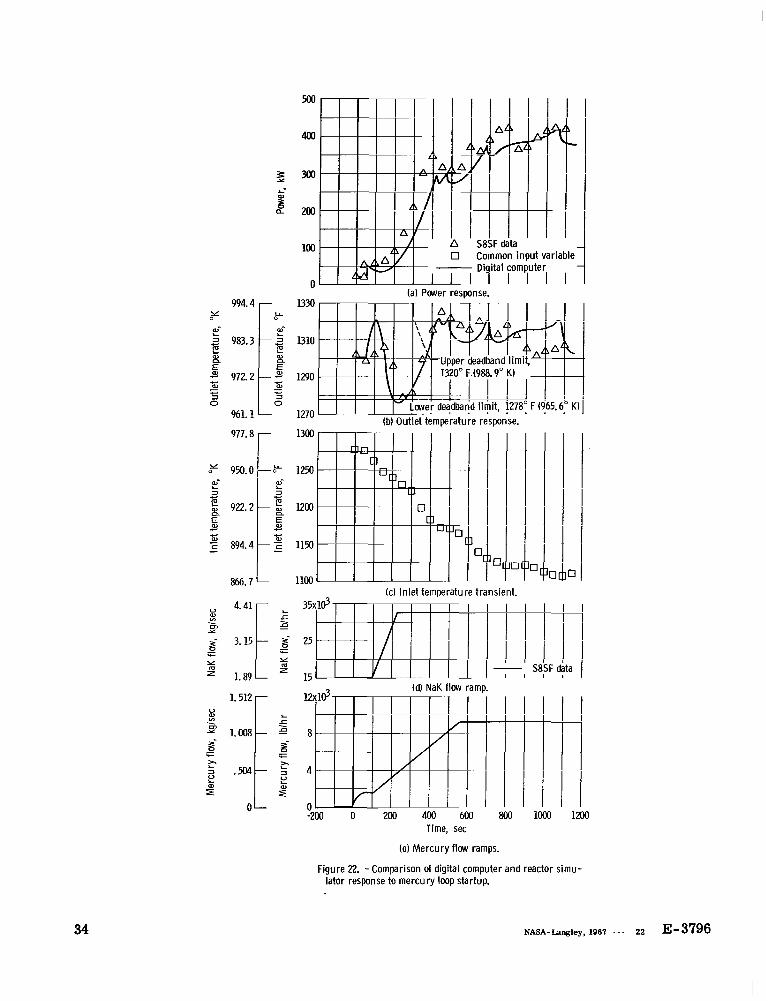
One of the most important uses of a reactor simulator is the investigation of power conversion system startup. During the SNAP-8 startup of the mercury loop, primary loop NaK flow is increased rapidly from 50 percent of design to its design value, and mercury flow is increased gradually from zero to its design value. An important constraint on the rate of increase of mercury flow rate is the avoidance of extreme reactor temperature overshoots.
A ser ies of mercury-loop startup runs were made in the S8SF with the reactor simulator. One of these is plotted in figure 22 along with the corresponding run of the digital model of the reactor. The runs are reasonably similar indicating that the current reactor simulation is useful for pointing out generalized effects of startup parameters. However, the differences that exist in the runs indicate that an improved reactor simulation is needed for determining, in detail, an optimum startup procedure.
CONCLUDING REMARKS
A nuclear reactor simulator incorporating an electric heater and an analog computer was developed to make the nonnuclear testing of the SNAP-8 system more realistic. Although the simulator was designed to represent the SNAP-8 reactor, the technique employed should be applicable to the simulation of other liquid-cooled reactors.
14
I
A compact heater that closely matched the thermodynamic design of the actual reactor was operated successfully for 1300 hours of loop shakedown before it failed. An electric heater of less critical design that was approximately three times slower in thermodynamic response than the SNAP-8 reactor was used in this simulation. However, since reactor transient response is more dependent on nucleonic than on thermodynamic characteristics and since nucleonic equations, which describe the nucleonic behavior of the real reactor, were programed on the analog computer, the nucleonic effect tended to override the inaccuracy of the thermodynamic simulation. The total simulation, therefore, was generally similar in transient behavior to the SNAP-8 reactor. 'This similarity was shown by using a digital computer representation of the SNAP-8 reactor, which agreed reasonably well in transient response with test data of the SNAP-8 Experimental Reactor.
Specifically, the comparison of the S8SF reactor simulator with the digital-computer model showed close agreement for the relatively slowly changing inlet temperature transients caused by step changes of mercury flow. However, for the more abrupt transients caused by step changes of NaK flow, the S8SF reactor simulator was less satisfactory. A comparison of the responses of the digital model and of the S8SF reactor simulator to the transients caused by a mercury-loop startup showed reasonable agreement. However, the reactor simulator that was used does not seem to be sufficiently accurate to use in determining the details of an optimum system startup scheme. In all these comparisons of the S8SF reactor simulator with the digital-computer model, the differences seemed to be caused primarily by the differences in thermal mass.
A significant problem that was caused by using an ignitron power controller to control electric heater input power was the electromagnetic noise introduced into test instrumentation by the firing of the ignitron tubes.
Of the many changes considered to improve the reactor simulation, perhaps the most important is a heater designed to simulate reactor thermodynamics more closely. Another important consideration was that the analog computer w a s a vacuum tube model that was troublesome because of its susceptibility to electromagnetic noise. The use of a less noise-sensitive, transistorized computer would be desirable for future operation.
Lewis Research Center, National Aeronautics and Space Administration,
Cleveland, Ohio, March 9, 1967, 701-04-00-02-22.
15
REFERENCES
1. Schultz, Mortimer A. : Control of Nuclear Reactors and Power Plants. Second ed., McGraw-Hill Publ. Co. , 1961.
2. Glasstone, Samuel: Principles of Nuclear Reactor Engineering. D. Van Nostrand Book Co. , 1955.
3. Anon. : Simulation of the Primary Loop of a Nuclear Power Plant with a Small General Purpose Analog Computer. Bull. No. ALAC 6300 1 ab, Appl. Studies 13.42 A, Electronic Associates, Inc. , 1964.
4. Schoenberg, Andrew A. ; Bilski, Raymond S. ; and Thollot, Pierre A. : Theory and Testing of a Space Radiator Simulator for a SNAP-8 Ground-Test Facility. NASA TM X- 1375, 1967.
5. Pekrul, P. J. : Dynamic Measurements of SNAP-8ER Feedback Coefficients. Am. Nucl. SOC. Trans. , vol. 8, no. 2, Nov. 1965, pp. 452-453.
16
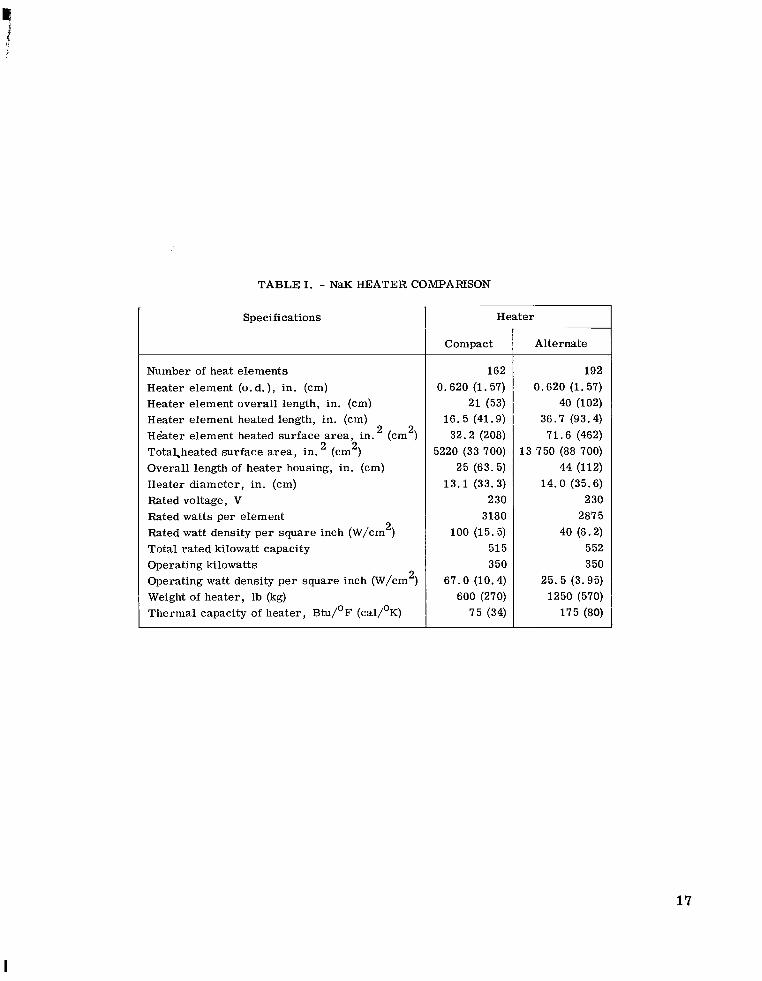
TABLE I. - NaK HEATER COMPARISON
Specifications Heater
Compact Alternate
Number of heat e lements 162 192
Heater element (0.d. ), in. (cm) 0.620 (1.57) 0.620 (1.57)
Heater element overall length, in. (cm) 2 1 (53) 40 (102)
Heater element heated length, in. (cm) 16.5 (41.9) 36.7 (93.4) H6ater element heated surface a rea , in. (cm
2) 32.2 (208) 71.6 (462)
Total,heated surface a r e a , in. (cm2) 5220 (33 700) 13 750 (88 700)
Overall length of heater housing, in. (cm) 25 (63.5) 44 (112)
Heater diameter, in. (cm) 13.1 (33.3) 14.0 (35.6)
Rated voltage, V 2 30 230
Rated watts per element 3180 2875
Rated watt density pe r square inch (W/cm 2) 100 (15.5) 40 (6.2) Total ra ted kilowatt capacity 515 552
Operating kilowatts 350 350
Operating watt density pe r square inch (W/cm 2) 67.0 (10.4) 25.5 (3.95)
Weight of heater, lb (kg) 600 (270) 1250 (570)
Thermal capacity of heater, Btu/OF (cal/OK) 75 (34) 175 (80)
17
I
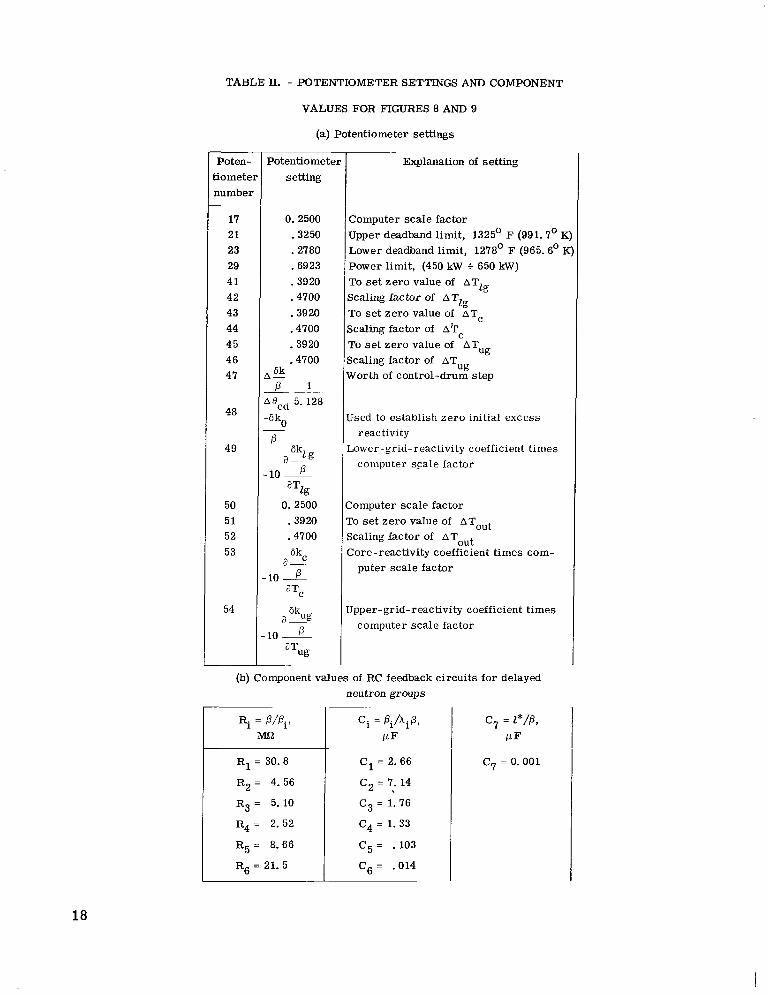
TABLE II. - POTENTIOMETER SETTINGS AND COMPONENT
VALUES FOR FIGURES 8 AND 9
(a) Potentiometer settings
Poten- ?otentiometei Explanation of setting tiometei setting number
17 0. 2500 Computer scale factor 21 .3250 Upper deadband limit, 1325' F (991.7' K 23 .2780 Lower deadband limit, 1278' F (965.6' K 29 .6923 Power limit, (450 kW + 650 kW) 41 .3920 To se t zero value of AT
Lg
43 .3920 To set zero value of a T c 44 .4700 scaling factor of a T c 45 .3920 To s e t zero value of AT 46 .4700 scaling factor of AT
ug ug
42 .4700 Scaling factor of ATLg
47 ,-6k Worth of control-drum step .-P I
5. 128 48
5 0 Jsed to establish zero initial excess
P reactivity 49
a--6kL g Lower -grid- r eactivity coefficient times
10 ~
P computer scale factor
aTzg 50 0.2500 2omputer scale factor 51 .3920 ro set zero value of AToUt 52 .4700 Waling factor of ATout
a -. LO P puter scale factor
aTC 54 a-6kug
PLO __
Jpper-grid-reactivity coefficient times computer scale factor
aTug
53 6kC :ore-reactivity coefficient times com
(b) Component values of RC feedback circuits for delayed neutron groups
~~ ~
ci = P,/A,P, c 7 = l* /P, P F P F
~
R1 = 30.8 C1 = 2.66 c7= 0.001
R2 = 4.56 C2 = 7. 14
R3 = 5. 10 C3 = 1.76
R4 = 2. 52 c4= 1.33
R 5 = 8.66 C5 = .103
R6 = 21.5 C6 = .014
18
-----
UDwr qr id plate.. - -
Controtdrumdrive, \ - e Outlet plen kt ,Fuel elements
Core vessel
NaK coolant pipe’ 11 In let plenum C-67-933
Figure 1. - SNAP-8 reactor assembly.
Outlet temperature control signal
1r-Mixing valve
T,,t Toutand -
Tin WN Heater bypass heater
Black-box t ransfer functions
I-Flow and in let temperature signal
Figure 2. - Overall black-box transfer-function method of simulat ing reactor
19
- - --
- -
- -
Upper gr id temperature-------- --Core temperature ReactorReactor --- ----- ---
nucleonics thermodynamics Lower gr id temperature- -- -- -----.
I I I I I I PowerL _ _ _ _ _ _ _ _ _ _ _ _ _ _ _ _ _ -_I
I Inlet temperature
NaK flow rate
Figure 3. - Block diagram showing three subdivisions selected for simulation.
Demand power signal
Electric heater leads
8969-S Figure 4. - Schematic diagram of selected method of simulation.
20
I
Iner t gas Dlenum, \ N r E l e c t r i c heater cartridge Heater cartridae, ..
NaK A=== 1 - 1' ' !
" LThermocouple tube
Figure 5. - Compact NaK heater.
Upper bulkhead, rYr E l e d r i c heater cartridge
Outlet
Thermocouple window -_
A kl I I I 3 A
412.0 in. (30.5 cm) Section A-A
mm-s
Fil ler rods7
'\ \"Spacer rod
h e r m o c o u p l e leads
U CD-8971
Section A-A
NaK inlet A-t-Flo~ distr ibution plates
<Thermocouple tube
Figure 6. - Afternate NaK heater.
21
Thermocouple signals from NaK heater 1
Thermocouole I I Nucleonic Excess equations Power
Drum Amplification and reactivity and six signal Safetymult ipl icat ion byoutlet drum h reactivity coefficients
I delayed c i rcu i tIc i rcu i t ry I - neutron groups
Safe power signal to ignitron
Figure 7. - Block diagram of nucleonic simulation.
22
‘I
Upper-gridthermocouple
Heater-rod thermocouple
Lower-g r i d thermocouple
461Outlet Control-thermocouple d rum
simulat ion
Implementation of equations (2) and (3)
Ignitron Power Safety N signal c i rcu i t
Figure 8. -Computer diagram of nucleonic simulat ion (see also table 11).
23
Outlet temperature thermocouple I -Tout signal
Limit, --0 v 60 V
K2
1-100
Full out
Step out Timer r -lmV relay
39-Position stepper
Full in
1
115 V ( a d I F24
- % IP
To amplifier 25
Figure 9. - Computer and electrical diagram of control-drum representation (see also table 11).
24
---
------ ---
Over power, normally closed i
K4 Computer Computer Normally armed in-supply dicator
K5 bulb 115 V (ac)
closed
Emergency disarm c
A r m computer
Motor
I I I
400 kR I Power I signal Battery from computer Normally ,
open
Normally open 1 &
Normally closed F
Safe power -signal to ign i t ron
Figure 10. - Electrical and computer diagram of reactor power safety c i rcui t .
Input power460 V (ac) 3 phase
Control Analog power signal F i r ingdemand signal c i rcu i t
I I
I Heater power feedback signal
measuring c i rcu i t
Electric heater
Figure 11. - Block diagram of ignitron power controller.
25
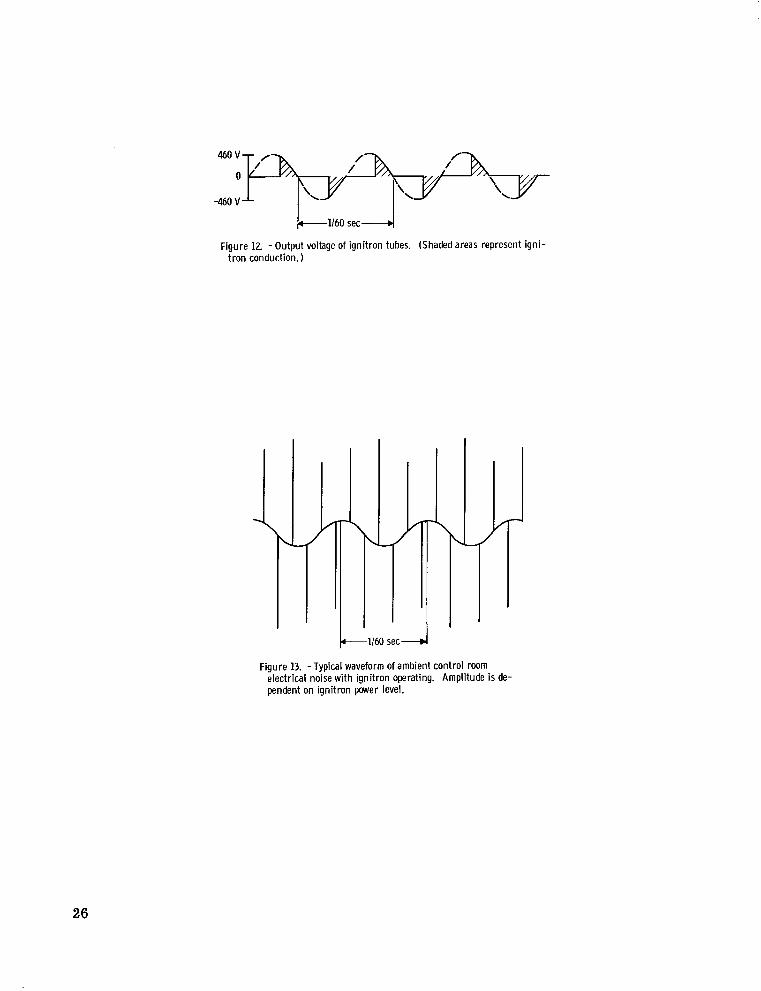
Figure 12. -Output voltage of ignitron tubes. (Shaded areas represent ignitron conduction.)
4 /1-1160 s e c d
Figure 13. -Typical waveform of ambient control room electrical noise with ignitron operating. Amplitude is dependent on ignitron power level.
26
Electro- Mercury
magnetic vapor Turbine NaK
flowmeter simulator
Outlet temperature
Upper-grid temperature
Tube in Radiator temperature she1I boiler Condenser simulator
heater
temperature =b I
1 1Inlet Liquid temperature mercury
Venturi Eledro- Electromagnetic Centrifugal magnetic
Pump
A P pressure - -transducer
Figure 14. - Simplified schematic diagram of SNAP-8 simulator facility (SISF).
W
c
c
al
c
---Digital-computer model S E R data
I 7 I Ik5K.m N I I I
/'Y I I I -+----
IW I I I I I" I (a) Nuclear power.
(c) Inlet temperature. I I I I I I 1
T 3.5 Percent
I_
I I 1 I
k-m sec -4 (d) NaK flow.
Figure 15. - Comparison of response from digital computer model wi th SNAP-8 Experimental Reactor data. Common input, 0.001-hertz square wave in NaK flow.
905.6
988.9 r 900.0
0Y 983.3 te Y
W-LaE 977.8 2 894.4 5
cmL 2 a. a. B5 972.2 5 888.9 5 -W -W W c 3 3
0
966.7 I0
883.3
c
961.1 t 877.8
Figure 16. -Constant power (318 kW) response to mercury flow step at time zero from 7300 to 5800 pounds per hour (0.92 to 0.73 kglsec). NaK flow, 33 300 pounds per hour (4.19 kglsec).
28
877.8
320 r 300 II 280 I
i 2601H 2401
2 m 1 II
180 I (a) Power response.
988.9 - I I I I I I I ~~#,170 1 9 0 5 . 6
- 0 Common in temperatureI variation _ _ _ Die 11 comi er at constant paver-983.3 D ic er witt I
II -977.8 x Y
a.- a.-L L a 972.2 -2 1290c e e a. n B /Y1. 5 5 c 966.7 1280 c a, -a.-c c 3 a 0 0 L
961.1 - 1270 I 1883.3
-955.6 200I
300950.0- 1250 -50 0 50 100 150
I250 a350
Time, sec
(bl Outlet temperature response and inlet temperature disturbance.
Figure 17. - Digital computer response at constant power (318 kW) compared wi th response w i th power dynamics. Mercury flow step at t ime zero from 7300 to 5800 pounds per hour (0.92 to 0.73 kglsec). NaK flow, 33 300 pounds per h o u r (4.19 kglsec).
29
310
z 270 i m
5 2%
230 0 Common inpu t variable
210 (a) Power response.
1310 983-3 re
2-E al al a. a.
al c c 3 0 0
966.7 1280 (b) Outlet temperature response.
922.2 I LL
916.7
c
II911.1 36III
c c
900.0 600 Time, sec
(c) Inlet temperature disturbance.
Figure 18. -Comparison of response of reactor simulator and digital-computer model for transient induced by mercury flow step from 5100 to 6300 pounds per hou r (0.642 to 0.794 kglsec). NaK flow, 37 OOO pounds per hou r (4.66 kglsec).
30
L-
c
c
340 I I I T I I I I I - A S8SF data
3
O I320
300
280
5 260 m
2 240
220
200
180
160
983.3
Y
977.8 L a c
972.2 E,c c c cm
0 0
961.1 1270I 922.2
916.7
Y L
911.1 i m-L a lI8O I
Ic m,E 905.6 c
-m c-
E,
900.0I[1170 I II $-c 894.4 11501 888.9 t 11401
I
Power response.
(b) Outlet temperature response.
f-In'I
dl I -100 0 300 -400 500 600 700 800 900
Time, sec
(c) Inlet temperature disturbance.
IIIIIIIIIII
Figure 19. -Comparison of response of reactor simulator and digital-computer model for transient induced by large mercury flow step from 7400to 4800 pounds per hour (0.932to 0.605 kglsec). NaK flow, 35 OOO pounds per hour (4.41kglsec).
31
0)
c a
380
360
z 340 i
a 320
UM Common input variable
280
ionse. aaa. 9 II
II
883.3
877. a Y
c$ 872.2 E a
5 866.7 -c-
861.1
855.6 II II I
I
I I
am. o 300 400 500 600
Time, sec
(c) Inlet temperature disturbance.
Figure 20. - Comparison of response of reactor simulator and digital-computer model for NaK step from 33 500 to 24 OOO
. pounds per hou r (4.22 to 3.02 kglsec). Mercury flow, 9600 pounds per hou r (1.21 kglsec).
32
320
300
2 6 280 s a
260
24C 1005.6 - 1350
1wo.0 - 1340 Y L
E- aa 994.4 -2 1330 2x E
E,E, 988.9 -c 1320 -a -al c c 3 3 0 0
983.3 - 1310
977.8 - 1300
1130
877.8 1120
855.6
850.0
(a) Power response.
(b) Outlet temperature response.
A S8SF data 0 Common inout variable
0 100 200 300 400 500 600 Time, sec
(c) Inlet temperature disturbance.
Figure 21. -Comparison of response of reactor simulator and digital-computer model for NaK flow step from 28 OOO to 20 300pounds per hour (3.52 to 2.56 kglsec). Mercury f l w , 6700 pounds per hour (0.849 kglsec).
33
al
x
500
400
2300 i
200
100
0
994.4 r z
983.3 2 e B
972.2 -cal -al c "-. S 30 !0
961.1
977.8 c 1300
950.0 t- 1250
1200
1150
866.7 L 1100
4.41 35~10~ -Y) -.!= m EYd 3.15 25
-"..
W % =
-
1.89 t z - 15
1.512 L
1.008 2 -d "..
.m z 2t
" 2
-200 0
Figure 22.
0 Common input variable
(a) Power response.
IIIIII
1.4 7
(c) Inlet temperature transient.
l/ I I I I I I I I I
/ I 1 I-, S8,SFdata I I l l I
I- - t i + 1I l l II
ll
ll 1
II I
I1 I 200 400 600 800 loo0 1200
Time, sec
(e) Mercury flow ramps.
- Comparison of digital computer and reactor simulator response to mercury loop startup.
34 NASA-Langley, 1967 -22 E-3796

“The aeronautical and space activities of the United States shall be conducted so as to contribute . . . to the expansion of human knowledge of phenomena in the atmosphere and space. The Administration shall provide for the widest practicable and appropriate dissemination of information concerning its activities and the resdts #bereof.”
-NATIONAL ~ER0NAUllC.S AND SPACE ACT OF 1958
NASA SCIENTIFIC AND TECHNICAL PUBLICATIONS
TECHNICAL REPORTS: Scientific and technical information considered important, complete, and a lasting contribution to existing knowldge.
TECHNICAL NOTES: Infomation less broad in scope but nevertheless of importance as a contribution to existing knowledge.
TECHNICAL MEMORANDUMS: Information receiving limited distributionbecause of preliminary data, security classification, or other reasons.
CONTRACTOR REPORTS: Scientific and technical information generated under a NASA contract or grant and considered an important contribution to existing knowledge.
TECHNICAL TRANSLATIONS: Information published in a foreign language considered to merit NASA distribution in English.
SPECIAL PUBLICATIONS: Information derived from or of value to NASA activities. Publications include conference proceedings, monographs, data compilations, handbooks, sourcebooks, and special bibliographies.
TECHNOLOGY UTILIZATION PUBLICATIONS: Information on technology used by NASA that may be of particular interest in commercial and other non-aerospace applications. Publications include Tech Briefs, Technology Utilization Reports and Notes, and Technology Surveys.
Details on the availability of these publications may be obtained from:
SCIENTIFIC AND TECHNICAL INFORMATION DIVISION
NAT10NA L A ER 0NA UTICS A ND SPACE A DMI NI STR AT10N
Washington, D.C. PO546