Embed Size (px)
Citation preview
372 J. GUIDANCE AND CONTROL VOL. 1,NO. 5
Design and Reconstruction of theViking Lander Descent Trajectories
E.A. Euler,* G.L. Adams,t and F.W. Hopper}Martin Marietta Corporation, Denver, Colo.
The design of the Viking descent trajectory, sequence of events, and associated onboard guidance parametersevolved over many years and changed frequently as the design of the Viking Lander matured. An extremelyconservative approach was taken in the design of all descent mission phases due to the lack of previous ex-perience with a spacecraft of this type, the desire to provide maximum margin since the entire descent was ac-complished without ground intervention, and the large degree of uncertainty in the Mars environment (at-mosphere density profile, winds, terrain characteristics) that existed prior to the mission. This paper discussesthe final Viking Lander preflight capability, the rationale for the trajectory design, and the postflight recon-struction. The latter includes the reconstructed flight path, landing site errors, and engineering estimates of theMars environment.
Introduction
THE two Viking spacecraft, consisting of the VikingOrbiter (VO), Viking Lander (VL), and the VL adapter
were launched from Cape Kennedy aboard Titan IIIE/Centaurs on Aug. 20 and Sept. 9, 1975, respectively. Aftera series of midcourse correction maneuvers, the twospacecraft were injected into Mars orbit on June 19 and Aug.7, 1976. After the difficult task of finding an acceptablelanding site, Viking Lander 1 landed on the surface of Marson July 20 at 11:53:06 UTC. Viking Lander 2 landed on Sept.3 at 22:37:50 UTC. All four vehicles are still operating suc-cessfully today and have sent back a wealth of scientific in-formation about Mars. References 1-8 are representativepapers dealing with various aspects of the entire mission.
The final spacecraft orbit from which the VL descents weremade was highly elliptic (e = 0.76) with a Mars-synchronousperiod of 24.62 h and a periapsis altitude of 1500 km abovethe Mars surface. The orbit orientation was selected toachieve the desired target latitude and sun elevation anglewhen the VO was over the landing site. The VL was separatedfrom the VO at a true anomaly of 217 deg (Fig. 1), and aftercoasting several minutes to achieve the necessary separationbetween vehicles, an attitude maneuver was made to achievethe desired inertial orientation for the deorbit burn.
After completion of the 22-min burn, the vehicle main-tained the desired inertial attitude until shortly before entryinto the Mars atmosphere. During this inactive period ofabout 3 h, the attitude control system (ACS) engine pulseswere monitored and commanded to achieve at least fourpulses ever 70 s to prevent engine freeze. Accurate modelingof this mission phase was necessary to maintain the desiredtrajectory accuracy.
The atmospheric entry point was defined to be at 243.8 km(800,000 ft) above the Mars reference surface (areoid),although significant aerodynamic forces did not occur untilmuch lower. The areoid is the equipotential surface derivedfrom Mariner 9 data and defined in Ref. 9. At 9 min prior toentry another attitude maneuver was performed to properly
Presented at the AAS/AIAA Astrodynamics Specialist Conference,Jackson Hole, Wyo., Sept. 7-9, 1977; submitted Nov. 11, 1978;revision received March 10, 1978. Copyright © American Institute ofAeronautics and Astronautics, Inc., 1977. All rights reserved.
Index categories: Entry Vehicle Mission Studies and FlightMechanics; Entry Vehicles and Landers; Spacecraft Navigation,Guidance, and Flight-Path Control.
*Chief, Mission Analysis Section. Member AIAA.tSenior Staff Engineer, Mission Analysis Section. Member AIAA.JFormerly Senior Staff Engineer. Member AIAA.
orient the vehicle body axes with respect to the relativevelocity vector (angle of attack = - 20 deg) to acquire upperatmosphere science data. Also, a programmed pitch rate wasinitiated to follow the flight path angle change and maintainthe desired angle of attack.
At entry a step change was made in pitch to achieve thedesired angle of attack of -11.1 deg. The vehicle attitude wasactively controlled until 0.05 g was sensed at an altitude ofabout 91 km. At this time the vehicle was allowed to trim tothe aerodynamic equilibrium angles of attack and sideslip.Pitch and yaw rates were controlled to be less than 1 deg/sand roll control was achieved by keeping the yaw axis per-pendicular to the local vertical direction.
At a sensed condition of 5.79 km above the local terrain,the parachute was deployed and 7 s later the aeroshell wasjettisoned. At this time the terminal descent propulsionsystem roll thrusters were activated to provide roll control andthe vehicle remained uncontrolled in pitch and yaw untilterminal descent engine ignition.
At a sensed altitude of 1.49 km above the terrain the mainterminal descent engines (3) were ignited. The engines werewarmed up for 2 s, at which time the parachute and basecoverwere separated. The VL then pitched into the relative velocityand performed a gravity turn to near-touchdown whilefollowing a preprogrammed altitude-velocity profile. At asensed condition of 16.8 m or 2.4 m/s relative velocity the VLdescended vertically to the surface at constant speed. Whentouchdown was sensed, the propulsion system was sealed andthe landed mission program begun.
Preflight CapabilityThe relevant preflight system and mission constraints are
summarized next. Because of VL aeroshell structurallimitations the maximum dynamic pressure (^max.) ex~perienced by the VL during entry could not exceed 144 psf.The total stagnation heat load (0 during entry could notexceed 1510 btu/ft2 , while the stagnation heating rate (Q)could not exceed 26 btu/ft2 - s. At parachute deployment thedynamic pressure (qD) had to be between 5.0 and 8.6 psf andthe Mach number (MD) less than 2.1. The maximum deorbitAK of 156 m/s was determined by propellant loaded,propellant margin, and VL mass. VL thermal and powerconstraints dictated that VL coast time from deorbit to entrycould not exceed 5 h. Finally, in order to insure required biterror rates during data transmission from the VL to the VOduring descent and the initial postland link, the relativeVL/VO geometry had to provide for relay communications

SEPT.-OCT. 1978 VIKING LANDER DESCENT TRAJECTORIES 373
Fig. 1 Nominal VL descent trajectory.
system performance which exceeded the sum of adversetolerances and permitted an initial link duration of at least10.4 min. In addition, it was desired to minimize the entryweight (or equivalently, use the maximum AK capability,thereby maximizing deorbit propellant usage within con-straints) and select trajectories to minimize the landeddispersions.
All of these constraints were satisfied under stacked worst-case conditions. Worst-case conditions were obtained byselecting each relevant statistical error source at its 3amagnitude and with its worst-case sign. Winds were selectedat their 99% magnitude and in the worst-case direction. Inaddition, the worst-case atmosphere model was selected fromone of the five equally probable atmosphere models shown inFig. 11.
This was not the entire set of constraints to be satisfied.However, they were the constraints which governed the designof the descent trajectory. Other constraints, which weresatisfied by orienting the VL attitude properly during descent,will be discussed in a subsequent paragraph.
One of the key concepts for expressing VL capability is thatof accessible area. The accessible area is that region in inertialspace within which the VL could land from a given separationorbit without violating mission or system constraints. As theVL trajectory design evolved, the accessible area becameprogressively reduced in size as new system requirements anddesires became known. In the following discussion, the threemajor accessible area concepts will be presented. The firstaccessible area is termed the maximum accessible area. Thisaccessible area represents the region in which the VL couldland if it were utilizing its maximum capabilities and if therewere no trajectory dispersions. The second accessible area istermed the targeting region, and reflects entry corridor (yE)dispersions and a more conservative utilization of VLcapabilities. The third accessible area is termed the preferredtargeting region, and refers to a small entry flight path angleband of ±0.1 deg centered about the nominal entry flightpath angle. This region was employed in the targeting of thefinal VO site acquisition maneuvers and the final design of VLdescent trajectories. It reflects a design objective introducedby project management during flight operations in order tomaximize the probability of mission success.
Maximum Accessible AreaThe procedure for constructing the maximum accessible
area will be described and, in so doing, it will be shown howall of the constraints summarized earlier were satisfied. Theprocess begins by determining the entry corridor, i.e., the yEregion between the steepest and shallowest permissible entryflight path angle at fixed entry altitude. The entry corridor isdetermined by the entry phase constraints on <7max.» Q> Q> QD>and MD. These parameters were examined over a broad rangeof entry flight path angles, for all five equally probable
NOMINAL
NOMINAL+99% HEADWIND
MAX /^ ATMOSPHERE
-15 -16 -17 -18ENTRY FLIGHT PATH ANGLE, DEG
Fig. 2 Sensitivity of </max. to entry errors.
Fig. 3 Parachute phase < 12dynamic pressure and Mach |number vs altitude. ^ n
(NOMINAL!^, ^
Ml N X > ATMOSPHERE
99%TAILWIND
MAXIMUMPARACHUTE
•2.1 DEPLOYMENTALTITUDE
7.0 8.0 9.0 10.0DYNAMIC PRESSURE. PSF
Martian atmospheres, and with worst-case winds and VLaeroshell aerodynamic characteristics. Figure 2 shows that themaximum qmax was attained in the max ps atmosphere with a99% headwind, 5% (3a) low aeroshell CD, and a 0.02 (3o) lowLID. The steepest 7^ permitted under these conditions wasyE = - 17.7 deg, since qmax equaled the constraint value of 144psf at this value of yE. Although the shallowest conceivableentry flight path angle is the skip-out flight path angle, whichwas -13.5 deg, the shallowest permissible entry flight pathangle was actually determined by the parachute deploymentconstraints. Figure 3 shows qD and MD vs altitude above theareoid (near the end of the aeroshell phase) for a range ofentry flight path angles. The worst-case conditions whichmaximized qD and MD are listed on the figure. This figuresuggests that yE could not be more shallow than - 16 deg inorder to satisfy the parachute deployment constraints. Anearlier analysis showed that the constraints could be satisfiedat the same altitude for yE of -15.9 deg. Subsequent en-vironmental model adjustments shifted the curves, causing aminor violation of the deployment dynamic pressure foryE= -15.9 deg. The project decided to accept this minorconstraint violation rather than change the deploymentaltitude, which would have caused a redesign of otherparameters in terminal descent. A similar sensitivity analysiswas performed for Q and Q and showed that these constraintswere also satisfied between the upper and lower bounds.10
Thus, the VL entry corridor was bounded by a shallow yE of- 15.9 deg and a steep yE of - 17.7 deg.
It will be useful at this point to define relevant descentparameters to aid in the remaining discussion of the maximumaccessible area. Cone angle (CA)"is the in-plane thrustpointing angle; clock angle (CLA), the out-of-plane thrustpointing angle. Entry lead angle (X£) is defined as the angularseparation betweeen the VL and the VO when the VL arrivesat the entry radius. A negative lead angle means the VL isleading the VO , and this is the normal situation. The PER

374 EULER, ADAMS, AND HOPPER J. GUIDANCE AND CONTROL
MAXIMUM COAST TIME= 5 HOURS
/ /-MAXIMUM— ~7\/ ACCESSIBLE AREA
(GETING REGION
—TARGETING REGION
Fig. 4 Targeting regions.
NON-STATISTICALERRORS
TOTALERROR
Fig. 5 Components of touchdown dispersion ellipse SMA and SMBover targeting region.
angle is the angle between VO periapsis and the VL attouchdown. The cross-range angle (XR) is the angulardisplacement of the VL out of the VO orbital plane attouchdown. Coast time (tc) is measured from the beginning ofthe deorbit burn maneuver to entry.
The final step in constructing the VL maximum accessiblearea was to determine the XR capability for the entry corridordefined earlier. XR capability was determined primarily bymaximum deorbit AKand tc. The maximum available deorbitpropellant of 160.1 Ib was determined by subtracting the ACSpropellant and all propellant margins from the totalpropellant loaded in the tanks. This in turn, along with initialVL mass and deorbit propulsion system Isp, determined amaximum available deorbit A K o f 156 m/s. The maximumcoast time was stated earlier to be 5 h, and resulted from aworst-case power and thermal analysis for VL descent.Finally, analysis showed that for the entry corridor specifiedearlier, a lead angle of -20 deg would always permitsatisfaction of the descent and initial postland relay linkconstraints. These three parameters—AKof 156 m/s, tc of 5h, and \E of - 20 deg, and the entry corridor specified earlier,completely defined the maximum accessible area shown inFig. 4. Each convex subregion in this figure corresponded to aspecified entry flight path angle and was determined by themaximum AFand tc boundaries.
Targeting Region and Preferred Targeting RegionThe targeting region is a subregion of the maximum ac-
cessible area and is obtained by acknowledging entry flightpath angle dispersions due to orbit determination and deorbitexecution errors, and by utilizing VL capabilities in a moreconservative fashion. To protect against entry flight pathangle dispersions causing entry outside the entry corridor, itwas necessary to constrict the entry corridor on both theshallow and steep boundaries by the expected (3a) yEdispersions. These dispersions increased significantly with XR
and, to a lesser extent, with yE.10 A decision was made tolimit the maximum yE dispersion, thereby bounding thetouchdown dispersion ellipse size. This was accomplished bylimiting XR to a ± 3 deg range.
Finally, the deorbit AKwas set at its maximum value of 156m/s in order to minimize entry weight and coast time. Thishad the effect of eliminating the convex subregions for eachyE in the maximum accessible area and reducing it to a singleT£ arc.
The targeting region obtained by constricting the entrycorridor by the yE dispersions and by fixing deorbit A V at itsmaximum value is shown in Fig. 4. Also shown is thesuperimposed maximum accessible area, as well as the thirdaccessible area concept mentioned earlier, the preferredtargeting region. This latter region was obtained from thetargeting region by defining a mini-entry corridor of ±0.1 degabout the nominal flight path angle, which for VL1 was -16.8 deg and for VL2 was - 17.0 deg. After the nominal entryflight path angle was selected for the actual descent, the finalVO site acquisition maneuver was designed to keep theselected landing site within this band.
Landing AccuracyIf the landing site is selected to lie within the targeting
region described earlier, we are assured of a descent trajectorywhich satisfies all relevant system and mission constraints.The measure of the VL's capability of landing close to thatselected site is given by the touchdown dispersion ellipse. This99% ellipse is centered at the nominal touchdown site and isdefined by the downrange semimajor axis (SMA) and thecrossrange semiminor axis (SMB).
Figure 5 shows both the total SMA and SMB of thetouchdown dispersion ellipse, as well as the contribution ofeach important error source to the total. Statistical com-ponents were root-sum-squared to obtain the total statisticalerror. The total error was obtained by adding the totalstatistical error to the algebraic sum of the nonstatisticalerrors. The trapezoidal bars represent the variation in eacherror source from XR = 0 deg to XR = 3 deg. It should benoted that SMA and SMB showed very little variation overthe entry corridor, so that the results shown in Fig. 5 wereapplicable to the entire targeting region.
Deorbit execution errors resulted from errors in deorbit A Vmagnitude (due to accelerometer bias), in-plane pointing, andout-of-plane pointing. The relative importance of each ofthese three errors was unusual for the Viking deorbit in thatA V magnitude was the dominant contributor to yE errors andSMA, out-of-plane pointing was the dominant contributor toSMB, while in-plane pointing was an insignificant errorsource as far as yE, SMA and SMB were concerned.
Entry systems errors were comprised of winds and errors inpredicting VL aerodynamic characteristics. Each of these twosources made roughly equal contributions to SMA, whileSMB was due primarily to winds. Since the direction of thewind was assumed to be random, winds made equal con-tributions of 19 km to both SMA and SMB. The errors in VLaerodynamics which contributed to SMA were VL LID, CL,and CD errors. This should be apparent since these errorsinduce errors in the lift and drag vector magnitudes and in-plane directions. The only VL aerodynamic errors whichcontributed to SMB were the VL entry roll angle and laterale.g. offset errors. These errors act by tilting the VL lift vectorout of the entry plane.
Since the touchdown dispersion ellipse was very importantin the selection of a suitable landing site, i.e., the ellipse couldnot include potentially hazardous surface features, the un-certainty in the location of a given point on the Martiansurface also had to be factored into the dispersion ellipse. Thetwo error sources which produced errors in locating a point onthe Martian surface were the Martian pole error and the maperror. These error sources together made equal contributionsof 45 km to both SMA and SMB.

SEPT.-OCT. 1978 VIKING LANDER DESCENT TRAJECTORIES 375
o 21
I"0
" 19
18
99% TOUCHDOWNDISPERSION ELLIPSE
52 51 50 49 48 47 46 45 44 43 42
WEST LONGITUDE— DEG
Fig. 6 Final VL1 targeting region and landing site.
The accelerometer thermal bias shift error (ATBS) was anonstatistical error. The possibility of such an error waspostulated during preflight analysis when it was shown thatmoderately large temperature transients might occur at theaccelerometers due to ACS engine firings during deorbit.
Five equally probable atmosphere models were assumed forpreflight analyses. Since only one atmosphere can be used fortargeting the actual descent trajectory, it is important to knowhow the touchdown point would be shifted if one of the otheratmosphere models were encountered during descent. ForViking, the mean atmosphere model was used for targeting.The maximum displacements of the touchdown point wereinduced by the min p and max p models. This should beexpected since these were the models having the minimum andmaximum upper atmosphere densities, respectively. Sinceeach atmosphere was assumed to be equally probable, theconservative approach was to add this touchdown erroralgebraically to the total statistical error. The touchdownerror due to atmospheres was totally an SMA error, with nocontribution whatever to SMB.
Design of the Actual Viking Descent TrajectoriesThe design of each actual Viking descent trajectory and the
corresponding descent guidance parameters began after thefinal landing site had been selected. For a given separationorbit and epoch, the XR/PER targeting region discussedearlier defined a corresponding latitude/longitude targetingregion in which the desired landing site could be selected. Ifno site within this targeting region was acceptable, thetargeting region could be shifted in latitude/longitude spaceby performing small VO orbital trim maneuvers. For VL1 thetargeting region was shifted significantly when VO ob-servations of the primary landing area showed unexpectedterrain roughness. For VL2 the targeting region was selectedprior to the last scheduled VO orbital trim maneuver.
The final targeting region for VL1 is shown in Fig. 6.Centered about the nominal landing site is the 99% touch-down dispersion ellipse. Also shown in this figure is thepredicted ground trace of the VL as it approaches the landingsite.
The final targeting region for VL2 was similar, except thatthe touchdown dispersion ellipse for VL2 was smaller than thepreflight ellipse used for VL1. There were several reasons forthis. First, analysis of actual VL1 deorbit data showed thattemperatures were stable during deorbit and no ATBS hadoccurred. It was for this reason that the ATBS was deleted asa VL2 error source. Second, the reconstruction process, asexpected, was able to reduce the degree of atmospheric un-certainty; consequently, the in-plane nonstatistical touchdowndispersions due to the unknown atmosphere were reducedfrom ±30 km for VL1 to ± 12 km for VL2. Third, as a resultof landed VL1 tracking, the pole component of the map/poledispersion was greatly reduced. This permitted the 45 x 45 km
map and pole error contribution used for VL1 to be reducedto 30x30 km for VL2, which essentially was the map erroronly.
In addition, the nominal VL2 entry flight path angle wasselected to be - 17.0 deg, unlike the - 16.8 deg angle for VL1.There were two reasons for this. First, the fact that VL1 hadactually entered with a flight path angle of - 17.0 deg andlanded successfully provided a strong argument for doing thesame thing with VL2. Second, the VL2 site nominal at-mosphere extrapolated from the atmosphere reconstructedfrom the actual VL1 data showed that entry at an anglesteeper than - 16.8 deg was entirely satisfactory since thecharacteristics of the reconstructed atmosphere at highaltitude meant that a lower qmax would be encountered.
The targets used to define the final VL trajectories were 1)areographic latitude-22.6 deg N (VL1), 47.89 deg N (VL2);2) longitude = 47.5 deg W (VL1), 225.86 deg W (VL2); 3)deorbit AV= 156 m/s, and 4) entry lead angle = -20 deg. Theselection of deorbit AK as a target is consistent with thedecision discussed earlier to select the deorbit AF at itsmaximum value in order to minimize coast time and entryweight. Entry lead angle was selected as a target because thetargeting region employed in landing site selection was basedon a lead angle of - 20 deg to insure acceptable descent andinitial postland relay link performance. Note that entry flightpath angle yE was not a target since selection of the landingsite within the targeting region automatically determined yE(observe the yE arcs in Fig. 6).
After the VL descent trajectory had been, designed, acorresponding set of descent guidance parameters had to becomputed. These constituted a set of commands which wereuplinked to the spacecraft and which, when executed,produced the desired descent trajectory. The descent guidanceparameters represented the culmination of the descenttrajectory design process and guaranteed satisfaction of alltrajectory-related constraints and requirements discussedearlier. They also guaranteed satisfaction of certain con-straints and requirements imposed on the VL attitude duringdescent. These attitude-related constraints and requirementsare described subsequently as part of the discussion of thespecific functions of certain descent guidance parameters.
All VL attitudes prior to entry (E) are defined by the matrixtransformation from body axes at separation (SEP) to thedesired orientation. This separation coordinate frame wasdefined by the ideal VO celestial lock orientation corrected forthe predicted VO roll drift while the VO was on roll inertialhold from SEP - 3 h to SEP.
The first required orientation after separation was for thedeorbit burn. This matrix defined the required pointing of theVL x axis for the deorbit burn, as determined by the targetingprocess. It also defined the VL roll orientation about the xaxis (longitudinal) which resulted in minimum sensitivity ofentry flight path angle errors to deorbit pointing errors in theevent of excessive tipoff rates at separation (or a VL lateralaccelerometer failure).
Following the deorbit burn, the VL was reoriented toprepare for the long coast phase of the descent trajectory. Inthe case of VL1 a roll maneuver about the x axis was per-formed to position the VL z axis perpendicular to the sundirection. This maneuver, plus another 180-deg roll midwaythrough the long coast prevented uneven heating of the IRU,which was located on the z axis. In the case of VL2, thereorientation after the deorbit burn involved a repositioningof the x axis as well as a roll about the x axis. Therepositioning of the VL2 x axis was required to shield theretarding potential analyzer (RPA) mounted on the aeroshellfrom the sun during the long coast.
The pre-entry phase for VL1 began at E-6 min, whichrequired that the attitude maneuver for pre-entry be initiatedat E-9 min. The pre-entry phase for VL2 was delayed until E-3min. in order to keep the sun out of the RPA port whileelectron temperature measurements were being made. This
376 EULER, ADAMS, AND HOPPER J. GUIDANCE AND CONTROL
required that the VL2 attitude maneuver for pre-entry beinitiated at E — 6 min. The VL began a slow pitch maneuverfrom this attitude in order to maintain the RPA port essen-tially parallel to the VL relative velocity vector until entry.The slow pitch was interrupted momentarily at entry by a stepchange in pitch to place the VL in the aerodynamicallytrimmed orientation. The slow pitch maneuver then main-tained this trimmed orientation until aerodynamic momentstook over at 0.05 g.
A parachute phase roll command was designed to producethe required VL leg no. 1 azimuth at touchdown, which forVL1 was 320 deg and for VL2 was 210 deg. The VL leg no. 1azimuth was selected to provide proper relay link per-formance during postland relay links and optimum cameralighting during real-time imaging sequences when the VO wasoverhead.
Reconstruction of the Descent Trajectoriesand Mars Environment
Because of the large degree of uncertainty in the Marsenvironment discussed earlier and the absence of VL flighttest data, plans were made to reconstruct the VL trajectoryduring mission operations to estimate flight performance andderive engineering estimates of the environment. This was ofparticular importance after the VL1 descent so that changescould be made in targeting and selection of guidanceparameters for VL2, if necessary. In addition, much of thedata were necessary to support the entry science investigationsof atmosphere structure and composition.
The entry trajectory reconstruction process was used toestimate the position, velocity, and attitude profile from thenominal entry time to touchdown. The entry data used for thisreconstruction were provided by 3-axis gyro, accelerometer,radar altimeter (RA), terminal descent and landing (doppler)radar (TDLR), stagnation pressure, recovery temperature,and ambient temperature and pressure measurements. Notethat there were no tracking data (e.g., doppler or range) torelate the VL position to the VO or to Earth during entry,except for a landed position fix obtained from direct trackingof the VL after touchdown. The accelerometer and gyro data(called dynamic data) were first edited, smoothed, and filled.Then they were differentiated to produce a continuous timehistory of angular velocity and acceleration for each vehicleaxis.
Using the dynamic data plus the planet gravitational model,the a priori entry state and attitude were propagated forwardin time in the manner of a strap-down inertial navigator. In sodoing, angular velocity data were integrated to keep track ofvehicle attitude, and total acceleration was integrated toprovide vehicle velocity and position time histories. Atselected time points RA and TDLR measurements wereprocessed with a Kalman-Schmidt filter to correct vehiclestate and parameter estimates. After similarly processing theposition fix slightly before touchsown, the resulting final statewas integrated back to entry to provide a final continuousreconstructed trajectory.
The environmental estimates were then obtained using thefinal reconstructed trajectory. Working from entry totouchdown, the dynamic pressure was computed from sensedacceleration, using a priori aerodynamic data. Density wascomputed from dynamic pressure, based on the velocityhistory from the estimated trajectory (modified by windestimates). Pressure was computed by integration of densitywith respect to altitude in the hydrostatic equation. Tem-perature was then computed from density and pressure bymeans of the equation of state. Wind estimates were based ona comparison of a priori aerodynamic trim predictions withthose computed for the estimated trajectory on a no-windbasis. Pressure and temperature measurements wereprocessed at selected times to provide atmospheric correc-tions. Finally, a continuous reconstructed atmosphere wasobtained by means of a deterministic run of the estimated
150 200 250 300 350 400 450
TIME FROM ENTRY-SEC
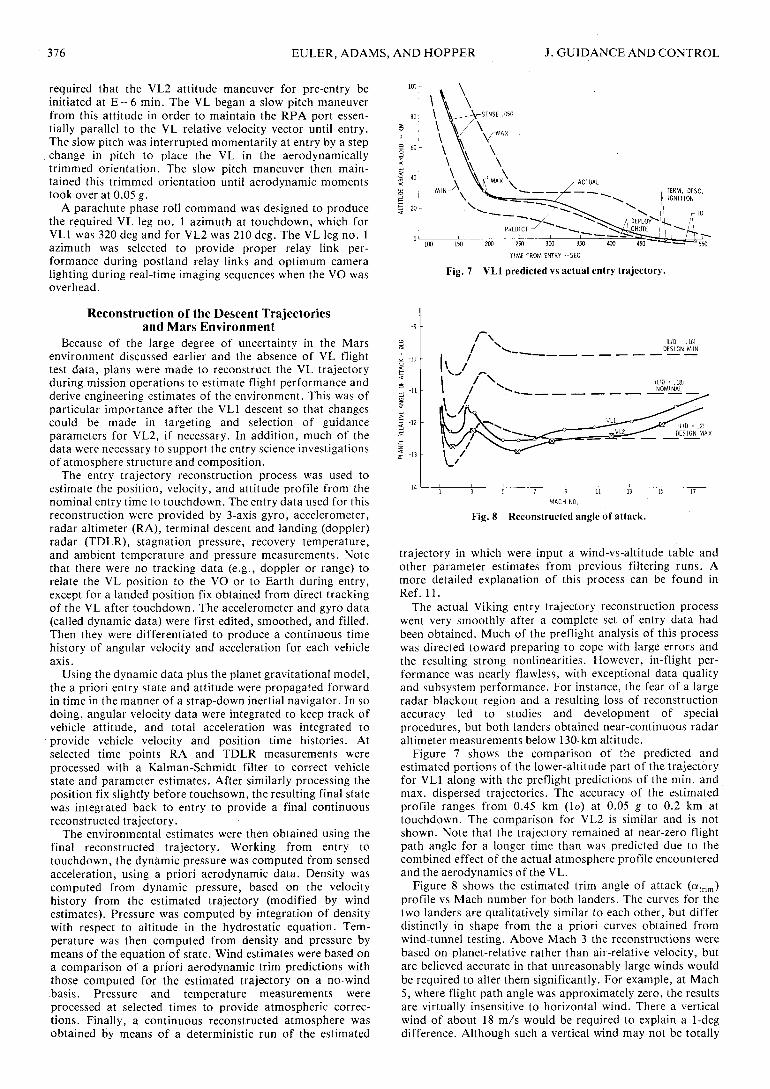
Fig. 7 VL1 predicted vs actual entry trajectory.
7 9 11MACH NO.
Fig. 8 Reconstructed angle of attack.
trajectory in which were input a wind-vs-altitude table andother parameter estimates from previous filtering runs. Amore detailed explanation of this process can be found inRef. 11.
The actual Viking entry trajectory reconstruction processwent very smoothly after a complete set of entry data hadbeen obtained. Much of the preflight analysis of this processwas directed toward preparing to cope with large errors andthe resulting strong nonlinearities. However, in-flight per-formance was nearly flawless, with exceptional data qualityand subsystem performance. For instance, the fear of a largeradar blackout region and a resulting loss of reconstructionaccuracy led to studies and development of specialprocedures, but both landers obtained near-continuous radaraltimeter measurements below 130-km altitude.
Figure 7 shows the comparison of the predicted andestimated portions of the lower-altitude part of the trajectoryfor VL1 along with the preflight predictions of the min. andmax. dispersed trajectories. The accuracy of the estimatedprofile ranges from 0.45 km (la) at 0.05 g to 0.2 km attouchdown. The comparison for VL2 is similar and is notshown. Note that the trajectory remained at near-zero flightpath angle for a longer time than was predicted due to thecombined effect of the actual atmosphere profile encounteredand the aerodynamics of the VL.
Figure 8 shows the estimated trim angle of attack (o:trim)profile vs Mach number for both landers. The curves for thetwo landers are qualitatively similar to each other, but differdistinctly in shape from the a priori curves obtained fromwind-tunnel testing. Above Mach 3 the reconstructions werebased on planet-relative rather than air-relative velocity, butare believed accurate in that unreasonably large winds wouldbe required to alter them significantly. For example, at Mach5, where flight path angle was approximately zero, the resultsare virtually insensitive to horizontal wind. There a verticalwind of about 18 m/s would be required to explain a 1-degdifference. Although such a vertical wind may not be totally

SEPT.-OCT. 1978 VIKING LANDER DESCENT TRAJECTORIES 377
1 - ORBIT DETERMINATION- 2 - DEORBIT EXECUTION ERROR
3 - ATMOSPHERE4 - WINDS5 - VL AERODYNAMICS
- 6 - UNEXPLAINED
U 48.0 47.9 47.8 47.7 47.6 47.5 47.4
LONGITUDE ~ °W
Fig. 9 VLl landing site error. a) DENSITY, GM/CC
© - TARGETX - CURRENT BEST ESTIMATE
1 - ORBIT DETERMINATION ERROR2 - DEORBIT EXECUTION ERROR3 - ATMOSPHERE
- 4 - WINDS5 - VL AERODYNAMICS6 - UNEXPLAINED
226.4 226.3 226.2 226.1 226.0 225.9 225.8 225.7 225.6 225.5 225.4 225.3
L O N G I T U D E ~ ° W
JFig. 10 VL2 landing site error. b)Fig. 11
DENSITY, GM/CC
Reconstructed density vs altitude.
unreasonable considering surface slopes, it was fairly wellruled out as a factor by the similarity of the VLl and VL2curves.
Below Mach 3, where winds were being estimated, theaccuracy of the a priori curve becomes quite important. Herethe estimation process tends to reconstruct a wind which,when combined with planet-relative velocity, results in areconstructed atrim curve qualitatively similar to the a priorinominal, though biased away from it.
In addition to the foregoing, the axial force coefficients forboth VLs were estimated, on the average, to be about l°7ohigher than the a priori values, and the average value of theparachute drag coefficient was estimated to be about 8%higher than nominal. Both of these estimates were within thepreflight uncertainty. Further discussion of the VLaerodynamics can be found in Ref. 12.
Figures 9 and 10 depict the current best estimates of thecontributions of all error sources to the VLl and VL2 landingsite errors, respectively. The reconstructed error sourcescorrespond to reconstructed entry state, atmosphere, winds,terrain, and VL LID characteristics. Note that in the case ofVLl, high-altitude winds were not explicitly solved for in theatmospheric reconstruction process. However, there werestrong indications of a 30-m/s wind from the East. For VLlthe dominant contributor to the landing site error was thedeorbit execution error—more specifically, the deorbit AKmagnitude error. The errors due to VL aerodynamics andwinds were also important. Although the deorbit executionerror was also important for VL2, the dominant contributorto the VL2 landing site error was the VL LID modeling errordiscussed earlier. The smaller contribution of the deorbitexecution error to VL2 is very likely because the VL2 axial
accelerometer was more stable than the VLl axial ac-celerometer. During VL2 preseparation checkout the ac-celerometer bias stability data showed very little variability,unlike the relatively large variations which were observedduring the VLl preseparation checkout. In Figs. 9 and 10 areshown two la dispersion ellipses. The large ellipse representsthe a priori control dispersions which were predicted prior toseparation. The small ellipse represents the knowledgedispersions for the final estimate of the landing site from VLpost-touchdown tracking.
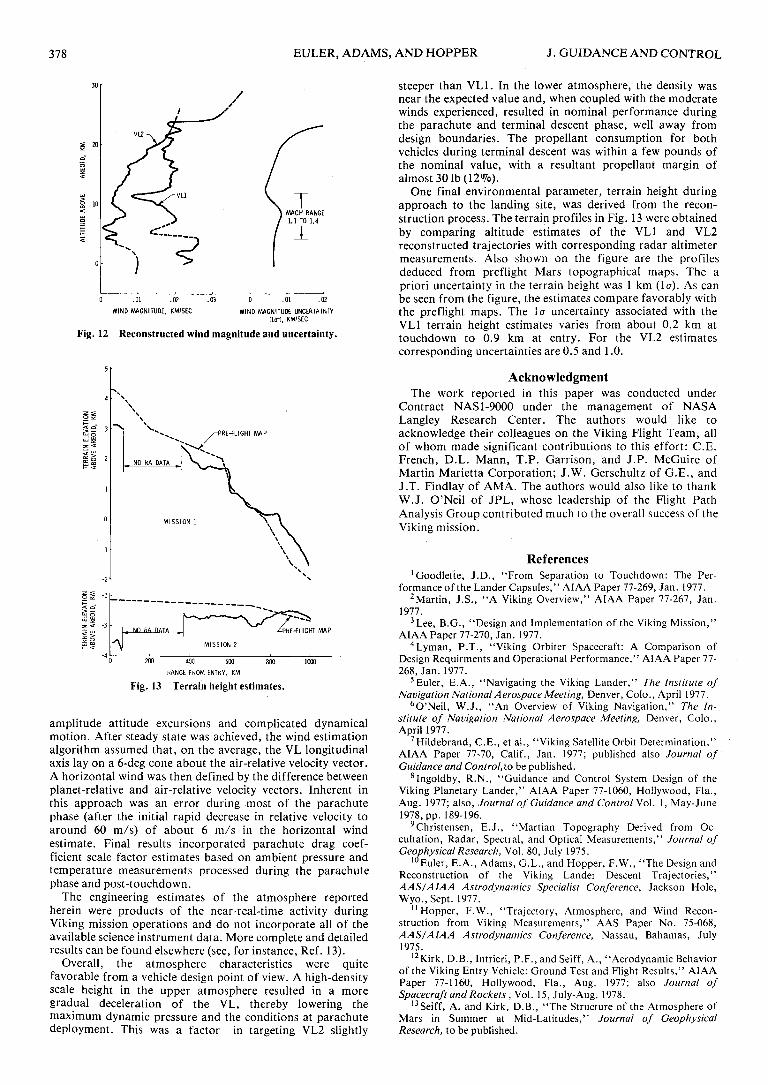
The estimate of the density profile obtained from the entrytrajectory reconstruction process is shown in Figs, l l a andl i b along with the preflight model profiles. The windmagnitude estimates along with their uncertainty are shown inFig. 12.
The atmosphere estimation scheme is different during thedifferent flight regimes. At altitudes above 25 km theestimates are quite stable and not dependent on windestimates. During the phase of near-zero flight path angle, in-plane winds cannot be estimated, yet they can introduce errorsin the density computations which can be significant at lowerrelative velocities. Below 25 km, when the relative flight pathangle is less than - 6 deg, the winds are estimated using the apriori trim characteristics of the VL with corrections from thestagnation pressure data. Note that the wind uncertainties inFig. 12 are of the same order of magnitude as the estimatesthemselves, especially in the case of VL2, for which the windsappear to have been small enough during the aeroshell phaseto be ignored in the atmosphere computations.
The wind and atmosphere reconstruction was extremelydifficult during the parachute deployment phase due to large
378 EULER, ADAMS, AND HOPPER J. GUIDANCE AND CONTROL
0 .01 .02 .03
WIND MAGNITUDE, KM/SEC WIND MAGNITUDE UNCERTAINTY(Iff-), KM/SEC
Fig. 12 Reconstructed wind magnitude and uncertainty.
•PRE-FLIGHT MAP
200 400 600
KANGE FKOM ENTKY. KM
Fig. 13 Terrain height estimates.
amplitude attitude excursions and complicated dynamicalmotion. After steady state was achieved, the wind estimationalgorithm assumed that, on the average, the VL longitudinalaxis lay on a 6-deg cone about the air-relative velocity vector.A horizontal wind was then defined by the difference betweenplanet-relative and air-relative velocity vectors. Inherent inthis approach was an error during most of the parachutephase (after the initial rapid decrease in relative velocity toaround 60 m/s) of about 6 m/s in the horizontal windestimate. Final results incorporated parachute drag coef-ficient scale factor estimates based on ambient pressure andtemperature measurements processed during the parachutephase and post-touchdown.
The engineering estimates of the atmosphere reportedherein were products of the near-real-time activity duringViking mission operations and do not incorporate all of theavailable science instrument data. More complete and detailedresults can be found elsewhere (see, for instance, Ref. 13).
Overall, the atmosphere characteristics were quitefavorable from a vehicle design point of view. A high-densityscale height in the upper atmosphere resulted in a moregradual deceleration of the VL, thereby lowering themaximum dynamic pressure and the conditions at parachutedeployment. This was a factor in targeting VL2 slightly
steeper than VL1. In the lower atmosphere, the density wasnear the expected value and, when coupled with the moderatewinds experienced, resulted in nominal performance duringthe parachute and terminal descent phase, well away fromdesign boundaries. The propellant consumption for bothvehicles during terminal descent was within a few pounds ofthe nominal value, with a resultant propellant margin ofalmost 30 Ib (12%).
One final environmental parameter, terrain height duringapproach to the landing site, was derived from the recon-struction process. The terrain profiles in Fig. 13 were obtainedby comparing altitude estimates of the VL1 and VL2reconstructed trajectories with corresponding radar altimetermeasurements. Also shown on the figure are the profilesdeduced from preflight Mars topographical maps. The apriori uncertainty in the terrain height was 1 km (la). As canbe seen from the figure, the estimates compare favorably withthe preflight maps. The la uncertainty associated with theVL1 terrain height estimates varies from about 0.2 km attouchdown to 0.9 km at entry. For the VL2 estimatescorresponding uncertainties are 0.5 and 1.0.
AcknowledgmentThe work reported in this paper was conducted under
Contract NAS1-9000 under the management of NASALangley Research Center. The authors would like toacknowledge their colleagues on the Viking Flight Team, allof whom made significant contributions to this effort: C.E.French, D.L. Mann, T.P. Garrison, and J.P. McGuire ofMartin Marietta Corporation; J.W. Gerschultz of G.E., andJ.T. Findlay of AM A. The authors would also like to thankW.J. O'Neil of JPL, whose leadership of the Flight PathAnalysis Group contributed much to the overall success of theViking mission.
References^oodlette, J.D., "From Separation to Touchdown: The Per-
formance of the Lander Capsules," AIAA Paper 77-269, Jan. 1977.2Martin, J.S., "A Viking Overview," AIAA Paper 77-267, Jan.
1977.3 Lee, B.C., "Design and Implementation of the Viking Mission,"
AIAA Paper 77-270, Jan. 1977.4Lyman, P.T., "Viking Orbiter Spacecraft: A Comparison of
Design Requirments and Operational Performance," AIAA Paper 77-268, Jan.1977.
5Euler, E.A., "Navigating the Viking Lander," The Institute ofNavigation National Aerospace Meeting, Denver, Colo., April 1977.
6O'Neil, W.J., "An Overview of Viking Navigation," The In-stitute of Navigation National Aerospace Meeting, Denver, Colo.,April 1977.
7Hildebrand, C.E., et al., "Viking Satellite Orbit Determination,"AIAA Paper 77-70, Calif., Jan. 1977; published also Journal ofGuidance and Control,to be published.
8Ingoldby, R.N., "Guidance and Control System Design of theViking Planetary Lander," AIAA Paper 77-1060, Hollywood, Fla.,Aug. 1977; also, Journal of Guidance and Control Vol. 1, May-June1978, pp.189-196.
9Christensen, E.J., "Martian Topography Derived from Oc-cultation, Radar, Spectral, and Optical Measurements," Journal ofGeophysical Research, Vol. 80, July 1975.
10Euler, E.A., Adams, G.L., and Hopper, F.W., "The Design andReconstruction of the Viking Lander Descent Trajectories,"A AS I AIAA Astrodynamics Specialist Conference, Jackson Hole,Wyo.,Sept. 1977.
11 Hopper, F.W., "Trajectory, Atmosphere, and Wind Recon-struction from Viking Measurements," AAS Paper No. 75-068,AAS/AIAA Astrodynamics Conference, Nassau, Bahamas, July1975.
1 2Kirk, D.B., Intrieri, P.F., and Seiff, A., "Aerodynamic Behaviorof the Viking Entry Vehicle: Ground Test and Flight Results," AIAAPaper 77-1160, Hollywood, Fla., Aug. 1977; also Journal ofSpacecraft and Rockets , Vol. 15, July-Aug. 1978.
13Seiff, A. and Kirk, D.B., "The Structure of the Atmosphere ofMars in Summer at Mid-Latitudes," Journal of GeophysicalResearch, to be published.