Embed Size (px)
Citation preview

Design Consideration for Smart In-Situ Gas Lift
by
Mohd Hafizuddin Bin Mahusin
14523
Dissertation submitted in partial fulfillment of
the requirements for the
Bachelor of Engineering (Hons)
(Petroleum)
SEPTEMBER 2014
Universiti Tekonologi PETRONAS
Bandar Seri Iskandar
31750 Tronoh
Perak Darul Ridzuan

`
i
CERTIFICATION OF APPROVAL
Design Consideration for Smart In-Situ Gas Lift
by
Mohd Hafizuddin Bin Mahusin
14523
A project dissertation submitted to the
Petroleum Engineering Programme
Universiti Teknologi PETRONAS
in partial fulfilment of the requirement for the
BACHELOR OF ENGINEERING (Hons)
(PETROLEUM)
Approved by,
_________________________
(Muhammad Aslam Md Yusof)
UNIVERSITI TEKNOLOGI PETRONAS
TRONOH, PERAK
September 2014

`
ii
CERTIFICATION OF ORIGINALITY
This is to certify that I am responsible for the work submitted in this project, that the
original work is my own except as specified in the references and
acknowledgements, and that the original work contained herein have not been
undertaken or done by unspecified sources or persons.
_______________________________________
MOHD HAFIZUDDIN BIN MAHUSIN

`
iii
ABSTRACT
A smart in-situ gas lift is the latest emerging technology in the oil and gas
production. This intelligent system requires the reservoir to have high amount of gas
supply either from reservoir’s gas cap itself or another gas formation. The aim of this
study is to select the design consideration for smart in-situ gas lift. Theoretical
analysis, simulation and also field applications have been critically reviewed to
notice their effects on the field development and production strategy. Compared to
conventional gas lift design, four main design factors have been addressed namely
interval control valves (ICV), well selection, valve setting depth and valve opening.
To further validate the effectiveness of the smart in-situ gas lift, the design has been
applied on a well which is located in L-Field. The application of smart in-situ gas lift
show great improvement to the productivity of the well when the natural production
rate has increased up to 27% compared to the impact of conventional gas lift on
natural production rate which has increased about 11% from natural production rate.
Plus, the implementation of smart in-situ gas lift has maximized the production of oil
from reservoir that characterize by large gas cap size. This paper generally endorses
the fact that in situ gas lift method gives big advantage in extending the well life
even at high water cut and reducing the high cost of installing expensive gas lift
infrastructures in the conventional gas lift system.
`
iv
ACKNOWLEDGEMENT
First and foremost, the author would like to express his appreciation and praise to
God for His guidance and blessing throughout this entire final year project (FYP).
Special appreciation shall goes to FYP supervisor, Mr Muhammad Aslam Md Yusof,
who became the important person to guide the author and for all the invaluable
knowledge and advices that have been shared to the author throughout completing
this project.
Deepest gratitude goes to all Petroleum Engineering lecturers that gave full support
and willingness to share the knowledge and expertise which enabled the author to
complete this thesis.
Apart from that, the appreciation also goes to the author’s family and friends for their
endless support and advices throughout completing this final year project. Lastly, the
author would like to bid adieu to all the parties that have been guiding and helping
him throughout his final year project directly and indirectly.

`
v
TABLE OF CONTENT
CERTIFICATION OF APPROVAL ............................................................................ i
CERTIFICATION OF ORIGINALITY ...................................................................... ii
ABSTRACT ................................................................................................................ iii
ACKNOWLEDGEMENT .......................................................................................... iv
LIST OF FIGURES ................................................................................................... vii
LIST OF TABLES .................................................................................................... viii
NOMENCLATURES ............................................................................................... viii
CHAPTER 1: INTRODUCTION ................................................................................ 1
1.1 Background ........................................................................................................ 1
1.1.1 Field Description.......................................................................................... 2
1.2 Problem Statement ............................................................................................. 3
1.2.1 Problem Identification ................................................................................. 3
1.3 Objective and Scope of Study ............................................................................ 4
CHAPTER 2: LITERATURE REVIEW ..................................................................... 5
2.1 Artificial Lift ...................................................................................................... 6
2.2 Conventional Gas Lift ........................................................................................ 7
2.3 Conventional Gas Lift Design Consideration .................................................... 9
2.3.1 Gas Injection Pressure ............................................................................... 10
2.3.2 Valve Spacing ............................................................................................ 11
2.3.3 Tubing and Flowline Size .......................................................................... 13
2.3.4 Differential Pressure at the Point of Gas Injection .................................... 14
2.3.5 Well Performance ...................................................................................... 15
2.3.6 Water Cut ................................................................................................... 17
2.4 Smart In-Situ Gas Lift ...................................................................................... 17
2.5 Smart In-Situ Gas Lift Design Consideration .................................................. 18
2.5.1 Interval Control Valve (ICV) ..................................................................... 19
2.5.2 Well Selection ............................................................................................ 20
2.5.3 Setting Depth for Smart In-Situ Gas Lift Valve ........................................ 22
2.5.4 Valve Opening ........................................................................................... 23
2.6 Application of Smart In-Situ Gas Lift .............................................................. 24
CHAPTER 3: METHODOLOGY ............................................................................. 27

`
vi
3.1 Gantt Chart ....................................................................................................... 27
3.2 Flow of Process ................................................................................................ 29
3.2.1 Preliminary Study ...................................................................................... 30
3.2.2 Simulation Work ........................................................................................ 30
3.2.3 Result and discussion ................................................................................. 31
CHAPTER 4: RESULT AND DISCUSSION ........................................................... 32
4.1 Inflow/ Outflow Performance Relationship ..................................................... 32
4.2 Gas Lift Design ................................................................................................ 36
4.2.1 Conventional Gas Lift Valve Design ......................................................... 36
4.2.2 Smart In-Situ Gas Lift Valve Design ......................................................... 37
4.3 Advanced Smart In-Situ Gas Lift Valve Modeling .......................................... 38
4.4 Sensitivity Analysis .......................................................................................... 39
4.4.1 Water cut analysis ...................................................................................... 40
4.4.2 Valve differential pressure analysis ........................................................... 43
4.5 Smart In-Situ Gas Lift Production Forecast ..................................................... 44
CHAPTER 5: CONCLUSION AND RECOMMENDATION ................................. 47
REFERENCES ........................................................................................................... 48

`
vii
LIST OF FIGURES
Figure 1: Reservoir cross section of L-Field (Yaliz et al., 2002) ................................. 3
Figure 2: IPR and VLP Curve (Beggs, 2003) .............................................................. 7
Figure 3: Valve Spacing (Kirkpatrick, 1959) ............................................................. 13
Figure 4: Vogel's IPR Curve (Vogel, 1968) ............................................................... 16
Figure 5: Interval Control Valve (Youl, Harkomoyo, & Finley, 2010) ..................... 20
Figure 6: Example of conventional gas lift and smart in-situ gas lift system ............ 24
Figure 7: Flow of Process .......................................................................................... 29
Figure 8: Flow of result .............................................................................................. 31
Figure 9: Vogel's IPR curve ....................................................................................... 32
Figure 10: Inflow/outflow performance curve for naturally flowing well ................. 33
Figure 11: Inflow/Outflow Performance Curve for Gas Lift Well ............................ 34
Figure 12: Inflow/Outflow Performance Curve for Smart In-Situ Gas Lift Well ...... 35
Figure 13: Summary of inflow and outflow performance curve for the well ............ 36
Figure 14: Conventional gas lift valve plot ................................................................ 37
Figure 15: Smart in-situ gas lift valve plot................................................................. 38
Figure 16: Valve performance curve for interval control valve (ICV) ...................... 39
Figure 17: Water cut analysis for natural flow well ................................................... 40
Figure 18: Water cut analysis for conventional gas lift well ..................................... 41
Figure 19: Water cut analysis for smart in-situ gas lift well ...................................... 42
Figure 20: Valve differential pressure analysis for conventional gas lift well .......... 43
Figure 21: Valve differential pressure analysis for conventional smart in-situ gas lift
well ............................................................................................................................. 44
Figure 22: Oil production forecast ............................................................................. 45

`
viii
LIST OF TABLES
Table 1: Comparison between conventional gas lift and smart in-situ gas lift 26
Table 2 : Gantt chart (FYP1) 27
Table 3: Key milestone (FYP 1) 27
Table 4: Gantt chart (FYP 2) 28
Table 5: Key milestone (FYP 2) 28
Table 6: Conventional gas lift valve design 37
Table 7: Oil production rate with different water cut values for natural flow well 41
Table 8: Oil production rate with different water cut values for conventional gas lift
well 41
Table 9: Oil production rate with different water cut values for smart in-situ gas lift
well 42
Table 10: Smart in-situ gas lift well production forecast 45
Table 11: Summary of comparison between natural flow, conventional gas lift &
smart in-situ gas lift 46
NOMENCLATURES
= Area of annulus
= Bellows area
=Area of tubing (
= Temperature correction factor
= Datum depth
= Injection pressure difference from surface to valve depth
= depth of gas lift valve, n=1, 2, 3…
= Spring differential pressure
= static injection gas pressure at depth gradient, psi/ft
= static load fluid gradient
= unloading flowing pressure at depth gradient above the point of gas injection
= Dead-liquid unloading gradient
= Permeability
= Depth to the first valve
= Depth of static-fluid level
=Distance between valve 1 and valve 2

`
ix
= Surface casing injection pressure
= Dome pressure
= injection gas pressure at surface, psia
= injection gas pressure at depth, psia
= pressure of flowing production
= Productivity index
= surface kick off pressure
= Flowing production pressure at valve depth
= Reservoir pressure
= Back pressure at the tubing well head
= Surface closing pressure of valve
= Tubing pressure
Valve closing pressure at depth
at = Dome pressure at test rack temperature
= Valve opening pressure at depth
= Test rack opening pressure
= Bottom hole flowing pressure
= unloading wellhead pressure
= maximum unloading injection gas rate, MSCF/D
= gas flow rate
= liquid production rate,B/D
= Maximum unloading GLR, scf/STB

`
1
CHAPTER 1
INTRODUCTION
1.1 Background
The production stage plays an important role in producing oil and gas. Once a
reservoir starts to produce, it will flows naturally for some period of time. Oil wells
that are flow naturally by natural energy are called flowing wells. This natural energy
is provided by the pressure differential between reservoir and wellbore to lift the
fluids to the surface. In order for the fluid to be lifted from the bottom of a well to the
surface facilities, sufficient energy must be required to overcome the friction losses
in the system (Osuji, 1994)
When the producing well continuously consumes this energy and reaches at some
point, it will encounter pressure drop naturally and the reservoir is depleted when the
natural flow started to cease (McAfee, 1961; Tutschulte, 1945). By this time, the
reservoir’s production tends to be fall from expected volume of oil and gas that can
be produced. This happens because there is insufficient pressure differential between
the reservoir and wellbore to cause the well to flow (Fotouh, Eissa, & Al Gharabawy,
1999; Takacs, 2005).
One of the types of artificial lift is gas lift. According to Institute (1992), gas lift is
the only type of artificial lift that does not use mechanical pump in order to lift the
fluid from bottom of a well to the surface. Gas lift always is a preferable choice when
a reservoir has readily natural energy stored in it. The availability of gas either as
dissolved gas or outsource gas makes the gas lift method as a better choice among
other artificial methods. Gas lift is applied in the oil well to lift fluids from well by
continuous injecting high pressure gas in tubing string at certain depth in order to

`
2
reduce the density of fluid column and lightening the hydrostatic column to lift the
oil to the surface (Kirkpatrick, 1959) .This type of gas lift is called continuous flow
gas lift.
The second method of gas lift is called intermittent gas lift where high instantaneous
rate of gas is injected to a well to increase the potential energy of the liquid slug
(Hernandez et al., 1999). The slug will accumulate at the bottom of the well and the
high rate of gas is injected below the slug to cause it to lift to the surface (Pittman,
1982). In contrast to other artificial lift method, gas lift system has flexibility in few
aspects such as in production, high gas oil ratio (GOR) and water oil ratio (WOR),
high temperature wells and compatibility with sand production makes gas lift as
preferable choice among operators around the world (Kumar, 2005).
In this paper, the rare case of gas lift design is discussed briefly which is in-situ gas
lift design. In-situ gas lift used gas from its own producing gas zone without injecting
the outsource gas into the well (Vasper, 2008). This means that the well will use its
own gas from gas cap to lift the oil from producing zone. This is different from the
conventional gas lift where predetermined amount of gas is injected from surface
into the tubing string to increase the production rate on the depleted or dead well. In-
situ gas lift use flow control valve which allows the gas to flow inside the tubing at a
controlled flow rate. The oil production in the tubing will commingled with the
natural lift gas that is flowing from the gas cap in order to lighten the density of
produced fluid and increase the inflow of oil from oil producing zone by lowering
the hydrostatic head in the production fluid (Limbachiya et al, 2010).
Furthermore, in situ gas lift method give big advantage in reducing high cost of
installing expensive gas lift infrastructure especially at the offshore platform. By
reducing the needs of gas lift facilities at the surface, the platform load requirement
and space limitation on the platform can be reduced. This in situ gas lift system can
be a great achievement in replacing the conventional gas lift system.
1.1.1 Field Description
For this project, L-Field is chosen to apply the application of in-situ gas lift and to
study the impact of smart in-situ gas lift implementation on the field’s production.

`
3
The field is characterized by large gas cap volume and thick oil zone which are about
750ft thick and 143 ft respectively. The estimated Gas Initially in Place (GIIP) was
about 497 BCF and oil production recorded in January 2002 was 43 MMSTB. The
reservoir contains light and saturated oil reservoir (45 API) and has low water cut
(2%). The porosity and permeability of the reservoir range from 13% to 20% and
hundreds mD to ten Darcy respectively at bubble point of 1620 psia (Yaliz,
Chapman, & Downie, 2002).
The structure of this field is faulted and rollover anticline on the hanging wall of the
Formby Point Fault. The east part of L-Field is tilted fault block while at the western
part of the field shows no faulting and gently dips toward other direction. The water
oil contact recorded is at 3400 ft TVDSS and gas oil contact is at 3257 ft TVDSS.
The reservoir contains dry gas with a gas ratio of 3 stb/mmscf with the gas expansion
factor of 125 scf/rcf.
Figure 1: Reservoir cross section of L-Field (Yaliz et al., 2002)
1.2 Problem Statement
1.2.1 Problem Identification
In the oil and gas field development, there is a situation where a potential well is
located at far distance from the main processing platform due to some reasons. This

`
4
potential well is characterized by large gas cap size that can be used to supplement
the natural energy to increase the production of the well.
The problem arises when the operators want to install facilities such as pipeline for
gas transportation or for artificial lift purpose due to space restriction and big
investment needed to install those facilities. The main concern is to increase the
production of the well by utilizing the gas cap.
A case study was conducted on a well located in L-Field. This well has large gas cap
above the oil producing zone .The abundant amount of gas from the gas cap zone can
be used as a lift medium in order to increase the oil production in that well.
Unfortunately, this well is isolated from other wells and located far distance from
central processing platform. Large amount of moneys need to be invested if the
artificial lift facilities want to be installed at the platform of the well. Plus, the space
limitation on the platform makes the installation of other surface facilities for
artificial lift purpose is quite difficult for the operators.
1.3 Objective and Scope of Study
The objectives in conducting this project are:
i. To identify design consideration for smart in-situ gas lift system
ii. To predict the production and well performance after implementing smart
in-situ gas lift system.
The scope of study cover by this project is predicting well performance by doing
simulation. The simulation can be done by using Wellflo software in order to analyse
the inflow and outflow performance and production of well after in-situ gas lift
system. Plus, the depth of injection point, numbers of gas lift valves needed, and the
gas flow rate can be estimated by performing this simulation

`
5
CHAPTER 2
LITERATURE REVIEW
Artificial lift will be useful in helping a flowing well to increase the production rate
or to help a dead well to start the production again. There are a few methods of
artificial lift that are commonly used which are sucker rod or beam pumping, gas lift,
electric submersible pumping, and hydraulic pumping (Beggs, 2003). The selection
of artificial lift system must depends on several factors such as depth of well,
availability of gas, production rate required, hole deviation, etc.
Plus, artificial lift is needed to provide the additional energy and to increase the fluid
flow required by well to lift the fluids to the surface (McAfee, 1961). The artificial
lift is used to reduce the flowing bottom-hole pressure of the well. When the bottom-
hole flowing pressure decreases, the production rate of a well will increase.
In order to sustain the production of oil, artificial lift method plays crucial part in
continuously producing the oil as the oil fields mature. Factors such as decreasing in
reservoir pressure and increasing water cut cause the natural flow of wells come to
the end. By implementing in-situ gas lift, the availability of gas from gas bearing
formation can sustain the production of a well by continuously flow the gas at
controlled rate. In addition, the high cost of gas handling and gas compression
facilities can be cut since the in situ gas lift design does not require those surface
facilities. Besides, the life of a well can be extend by operating the in-situ gas lift
since this method help high water cut wells to become active wells and start produce
the oil (Warren et al., 2009).
`
6
2.1 Artificial Lift
In the early stage of oil productions from a flowing well, the reservoir fluids being
lifted from the bottom of a well to the surface by means of natural energy (Takacs,
2005). According to API Gas Lift Manual (1994), the pressure differential of
reservoir and producing facilities on the surface cause the oil to be produced from a
well. As the time goes and the oil fields become mature, the reservoir pressure will
depletes and the well will have insufficient energy to lift the oil to the surface
(Fotouh et al., 1999).
The artificial lift methods help to kick off the dead wells to start reproduced again
and to increase the fluid flow rate from the bottom of well to the surface (Tutschulte,
1945). By implementing the artificial lift methods, the abandonment well can be
produced again. The artificial lift methods need to be choose wisely and depends on
many factors which includes reservoir pressure, depth of well, potential of well and
type of the produced fluid (Naguib, Shaheen, Bayoumi, & El-Emam, 2000).
Improper selection of artificial lift methods can lead to the reduction of production
and cause high operating cost. Brown (1982) discussed in details about the design of
artificial lift systems.
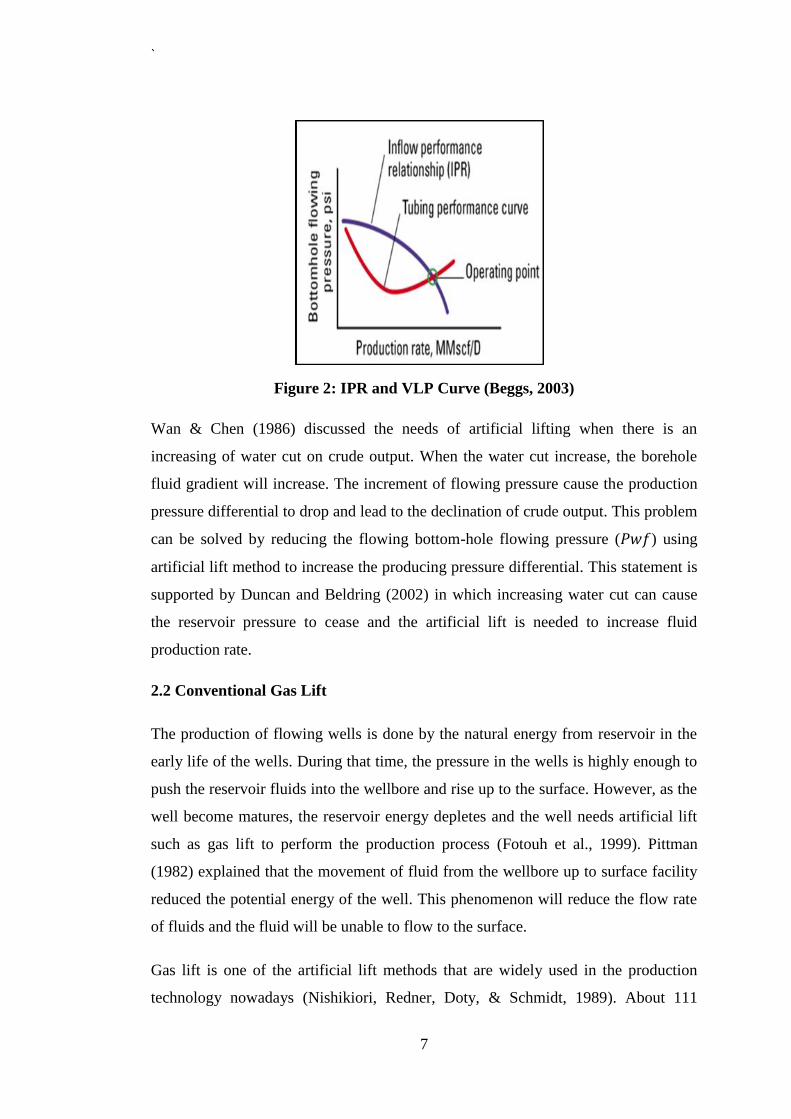
There are two main considerations in designing the artificial lift system which are the
inflow and outflow performance relationship. The inflow performance relationship
(IPR) represents the ability of reservoir to push the fluids into the wellbore. The
inflow performance of a reservoir can be determined by plotting well production rate
against bottom-hole pressure (BHP).
According to Beggs (2003), pressure maintenance or secondary recovery can be the
best ways to keep the inflow performance of well high after the well is stimulated.
The outflow performance or Vertical Lift Performance (VLP) describes the fluid
flow inside the tubing up to surface by considering pressure losses (McAfee, 1961).
The outflow components such as tubing string restriction, safety valve, chokes,
tubing string, separator, flowline, flowline restrictions and artificial lift mechanisms
need to be considered when doing the analysis and designing of artificial lift system
(Brown, 1982).
`
7
Figure 2: IPR and VLP Curve (Beggs, 2003)
Wan & Chen (1986) discussed the needs of artificial lifting when there is an
increasing of water cut on crude output. When the water cut increase, the borehole
fluid gradient will increase. The increment of flowing pressure cause the production
pressure differential to drop and lead to the declination of crude output. This problem
can be solved by reducing the flowing bottom-hole flowing pressure ( ) using
artificial lift method to increase the producing pressure differential. This statement is
supported by Duncan and Beldring (2002) in which increasing water cut can cause
the reservoir pressure to cease and the artificial lift is needed to increase fluid
production rate.
2.2 Conventional Gas Lift
The production of flowing wells is done by the natural energy from reservoir in the
early life of the wells. During that time, the pressure in the wells is highly enough to
push the reservoir fluids into the wellbore and rise up to the surface. However, as the
well become matures, the reservoir energy depletes and the well needs artificial lift
such as gas lift to perform the production process (Fotouh et al., 1999). Pittman
(1982) explained that the movement of fluid from the wellbore up to surface facility
reduced the potential energy of the well. This phenomenon will reduce the flow rate
of fluids and the fluid will be unable to flow to the surface.
Gas lift is one of the artificial lift methods that are widely used in the production
technology nowadays (Nishikiori, Redner, Doty, & Schmidt, 1989). About 111

`
8
producing oil wells in the Teak, Samaan and Pouio oil fields of Trinidad applying
gas lift method (Laing, 1989). While Cedeno and Ortiz (2007) mentioned that about
4500 wells in Lake Maracaibo are using gas lift method. Conventional gas lift
method used outsources gas supply to continuously inject the well. Gas lift method is
the extension of natural flow since this method needs the continuous injection of
natural gas (Winkler, 1987). The only requirement for the gas lift to be applied on a
well is the availability source of injection gas (Blann & Williams, 1984; Kirkpatrick,
1959).
According to Gilbertson, Hover, and Freeman (2013), gas lift being used to increase
the production rate in the flowing naturally wells and to produce the oil from the
dead wells. Besides, Kirkpatrick (1959) mentioned in his article that the injection of
gas on the vertical wellbores help to lift the fluids to the surface. Basically, gas lift is
applied by the injection of natural gas through the gas lift mandrel and valves into the
tubing at some downhole point. The gas will mixes with the produced fluid and
lighten the density of the fluids (Decker, 2007; Duncan & Beldring, 2002;
Tutschulte, 1945) . This will reduce the weight of the fluid column and gas will lift
the fluids to the surface (Blann & Williams, 1984; Cedeno & Ortiz, 2007). At this
point, the bottom-hole flowing pressure ( ) will reduce and create required
drawdown or pressure differential between the reservoir and wellbore for production
of a well. The equation below shows the relationship of productivity index (PI) with
pressure drawdown.
As the pressure drawdown increases, the production flow rate ( increases.
The gas lift method can be applied in two ways which are continuous flow and
intermittent gas lift. The first method of gas lift which is continuous gas lift is much
more similar to the naturally flowing wells since the gas is injected from surface into
the tubing continuously (Duncan & Beldring, 2002). While Kirkpatrick (1959)
mentioned in his article that this type of gas lift is suitable for most of flowing wells
that have good productivity index (PI) and bottom-hole pressure maintenance. The
gas lift valves being set at fixed depth to allow the injection gas to pass through the
unloading valve to unload all the kill fluid inside the wellbore and continuously
`
9
injected at operating valve. The injection gas then mixes with the producing fluid to
increase gas liquid ratio (GLR).
As gas liquid ratio increases, the hydrostatic pressure gradient in the tubing will
decrease and cause reduction on bottom-hole flowing pressure (BHFP) (Blann &
Williams, 1984; Mach, Proano, Mukherjee, & Brown, 1983). Beggs (2003)
explained that the gas lift valve can be set at any depth and depend on the availability
of injection pressure. According to Duncan and Beldring (2002), the higher the
pressure injection available, the deeper the injection can be done. For the deeper
injection point, less amount of injection gas is required to achieve the same bottom-
hole flowing pressure of the well and increase oil production rate (Mukherjee &
Brown, 1986).
When the reservoir pressure decline, the typical gas lift method must be replaced
with other method since the wells are incapable to continuously producing the oil.
Intermittent gas lift is applied by injecting large volume of gas periodically under the
formation of a column or slug of liquid at the bottom of the well. The high
instantaneous rate of injection causes the slug to move up to the surface (Pittman,
1982). The injection of gas in the intermittent gas lift is done by cycle process in
which a new column of liquid needs to build up again at the bottom of well before
the gas injection can be done (Takacs, 2005). However, the intermittent gas lift
method cause the well to be an abandoned well or other artificial lift must be applied
to keep the well producing because the intermittent lift no longer profitable
(Hernandez et al., 1999).
2.3 Conventional Gas Lift Design Consideration
The design of gas lift system and installation is an important factor for a well to have
an efficient gas lift system. One of the main design consideration that need to be
considered when designing gas lift system is effect of gas injection pressure on gas
lift well (Decker, 2007; Jones & Brown, 1971; Mukherjee & Brown, 1986; Takacs,
2005).
In addition, valve design and spacing also are the main factors for contributing to the
success of gas lift system (Beggs, 2003; Jones & Brown, 1971; Pittman, 1982). Other

`
10
than that, a good gas lift design also must specify the tubing and flowline size to
optimize the production of well (Mukherjee & Brown, 1986).
Besides, one of the design consideration that need to pay attention in designing gas
lift system is the well performance (Beggs, 2003; Hepguler, Schmidt, Blais, & Doty,
1993). Meanwhile, (Mach et al. (1983); Mukherjee and Brown (1986)) stated that the
differential pressure at the gas injection point also is an important design criteria for
gas lift system.
Furthermore, the effect of water cut also need to be considered when designing gas
lift system (Blann & Williams, 1984; Mukherjee & Brown, 1986).
From the design consideration that has been discussed above, the main consideration
for designing gas lift are gas injection pressure, valve spacing, tubing and flowline
size, differential pressure at the point of gas injection, well performance, and water
cut.
2.3.1 Gas Injection Pressure
The first design consideration is the effect of gas injection pressure on depth (Blann
& Williams, 1984; Kanu, Mach, & Brown, 1981; Mach et al., 1983; Mukherjee &
Brown, 1986; Redden, Sherman, & Blann, 1974). According to Mukherjee and
Brown (1986), the depth of injection can be control by the amount of gas injected.
While Mach et al. (1983) explain that the flowing bottom hole pressure can be
reduced by amount of gas to be injected and depth of injection point can be
controlled by changing the differential pressure.
The lower the pressure differential will lead to the lower injection point before the
bottom-hole injection. As more gas is injected into the well, the density of gas liquid
ratio decreases (Tutschulte, 1945). This cause reduction in the weight of the column
produced fluid and less volume of gas is needed for the fluid to be lift to the surface
(Blann & Williams, 1984).
Somehow, higher pressure of gas need to be injected as the injection depth increase
(Pittman, 1982). As more volume of gas is injected into the tubing, the production of
oil increases (Lo, 1992). When additional amount of gas is injected beyond

`
11
minimum gradient, flowing bottom hole pressure will increase as a result of friction
loss effect (Cedeno & Ortiz, 2007).
However, (Redden et al. (1974); Saputelli (1997)) mentioned that excessive amount
volume of gas injection beyond maximum production rate can cause production to be
decline.
Factors such as suitable injection gas quantity, pressure of injected gas and depth of
gas injection point are very important in order to get optimum production from a gas
lift well (Adiyodi, Kumar, & Singh, 1999).
2.3.2 Valve Spacing
Gas lift valve is an important element in the gas lift system in which injected gas
from the surface will flow from annulus into the tubing through valve located in
mandrel (Beggs, 2003; Cedeno & Ortiz, 2007; Jones & Brown, 1971; Kirkpatrick,
1959; Walker, 1929). Adiyodi et al. (1999) mentioned that the quality of gas lift
valve have major impact in achieving maximum efficiency of a gas lift system and to
make sure the production of oil and gas run smoothly. The equation below shows the
gas lifts design equation for static force balance when the gas lift valve start to open
to allow the gas flow.
( represent the closing force while represent the
opening force. As the valve start to close, the static force balance equation can be
referred as below.
The design of spacing and pressure setting in any gas lift well must be able to lift the
liquid downwards from the casing to the predetermined depth. In addition, the design
also must allow any valve under producing operation to be open without letting the
above valve to open. According to Blann and Williams (1984), very close valve
spacing is needed for a well that have low gas injection pressure and high wellhead
back pressure due to less amount of pressure differential between produced fluid and
injection gas pressure

`
12
The differential pressure is directly proportional to the maximum valve spacing, as
the differential pressure increase, the larger the valve spacing is needed (Mach et al.,
1983).
According to Kirkpatrick (1959), the position of first valve in the well completion
can be determined from equation below when the static-fluid level of the well is near
the surface and the well is to unload into the pit.
or, if unloading into the separation, the equation will be represented as per below.
When the static fluid starts to decrease in the wellbore, the spacing of the first valve
can be determined using equation below.
(
)
The following spacing of valves can be determined by equation below.

`
13
Figure 3: Valve Spacing (Kirkpatrick, 1959)
2.3.3 Tubing and Flowline Size
According to Mukherjee and Brown (1986), sizing of tubing and flowline are
important factors in desigining gas lift system and flow well design. While Jones and
Brown (1971) explained when larger size of tubing is selected for gas lift design,
lower flowing bottom-hole pressure (FBHP) will be created, hence the production of
oil increased and the reservoir is expexcted to produce more longer time. This is
supported by Gunawan and Dyer (1996) in which suitable selection size of tubing
can maximize economic reserve recovery from depleted gas drive reservoir. This can
be prove by the equation below.
The production rate increases as the pressure decreases due to increase in size of
tubing. Besides, the vertical pressure gradient changes as the tubing size change
since there is a different in the liquid removal efficiency and frictional losses

`
14
(Greene, 1983). By plotting an outflow performance curve, the effect of changing
tubing size on well performance can be predicted.
The selection of suitable tubing size can prevent the problem of well load up with
liquid. This is because too large size of tubing will cause well to load up and dies.
Turner, Hubbard, and Dukler (1969) mentioned that there are two methods in
identifying when well will load up and dies which are Nodal Analysis and physical
model based on reservoir inflow performance and two phase flow correlations.
According to Turner et al. (1969), well will not load up with the accumulated liquid
and continue to flow if the velocity in the tubing is high enough to lift the liquid to
the surface.
The formation of slug at the bottom of well must be consider when selecting the
tubing and flowline size since it will reduce gas lift efficiency. This is supported by
Slupphaug, Hole, and Bjune (2006) in which slug instabilities can cause operational
challenges and need proper reservoir management to handle it. Duncan and Beldring
(2002) discussed in their paper about slugging effect in gas lift well and can be
solved by injecting more gas into the tubing to increase the velocity of superficial gas
and stabilized the fluid flow in flow regime.
2.3.4 Differential Pressure at the Point of Gas Injection
According to Mach et al. (1983), one of the important consideration in completing
the continuous flow gas lift design is the differential pressure at the point of gas
injection and since production and valve spacing is based on differential pressure.
Low pressure differential wells means the well are producing with high production
rate.
The differential pressure between casing and tubing indicates the need of additional
energy into well and for the condition of gas to be injected into the tubing, the casing
pressure must be greater than tubing pressure. (Mukherjee & Brown, 1986).
While Blann and Williams (1984) explained that in order to create a pressure
differential, sufficient amount of gas injection pressure must be greater than the
flowing production pressure at well depth and zero differential pressure means no
injection gas is required.
`
15
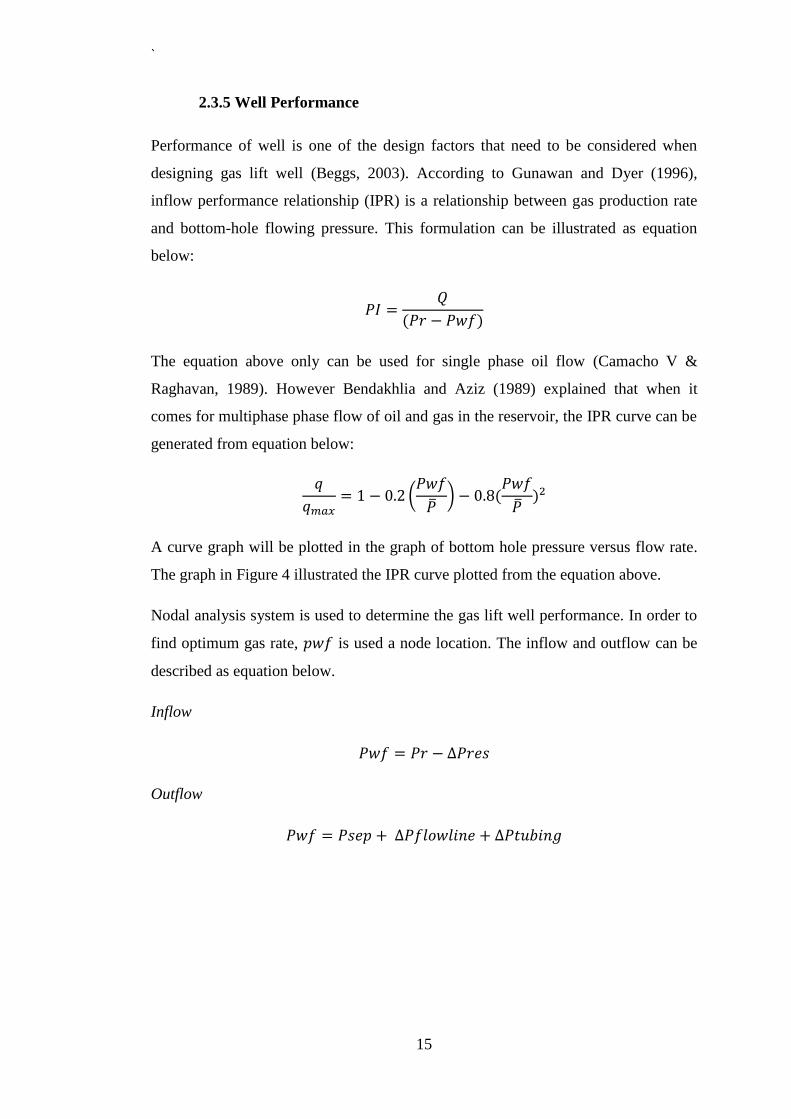
2.3.5 Well Performance
Performance of well is one of the design factors that need to be considered when
designing gas lift well (Beggs, 2003). According to Gunawan and Dyer (1996),
inflow performance relationship (IPR) is a relationship between gas production rate
and bottom-hole flowing pressure. This formulation can be illustrated as equation
below:
The equation above only can be used for single phase oil flow (Camacho V &
Raghavan, 1989). However Bendakhlia and Aziz (1989) explained that when it
comes for multiphase phase flow of oil and gas in the reservoir, the IPR curve can be
generated from equation below:
(
)
A curve graph will be plotted in the graph of bottom hole pressure versus flow rate.
The graph in Figure 4 illustrated the IPR curve plotted from the equation above.
Nodal analysis system is used to determine the gas lift well performance. In order to
find optimum gas rate, is used a node location. The inflow and outflow can be
described as equation below.
Inflow
Outflow

`
16
Figure 4: Vogel's IPR Curve (Vogel, 1968)
In addition, Winkler (1987) mentioned that initial installation design of gas lift wells
should have reliable inflow well performance in order to determine accurate gas
injection point in deep wells. While Decker (2007) stated that inflow and outflow
analysis can predict the depth of operating point and production rate of a well.
Greene (1983) explained in his article that the performance of gas well can be
analysed by referring to the equation below:
While Gunawan and Dyer (1996) mentioned that the inflow performance curve for
pseudo-steady state gas flow can be constructed by using the equation below:
(
)
According to Vogel (1968), as the reservoir pressure decreases in solution gas drive
reservoir, the productivity index (PI) decreases due to higher gas saturation which
cause high resistance to oil flow.

`
17
2.3.6 Water Cut
(Cedeno and Ortiz (2007); Kanu et al. (1981)) stressed out the importance of
considering water cut when conducting gas lift since water cut can affect gas
allocation and total gas liquid ratio.
Blann and Williams (1984) mentioned that the higher amount of gas needed to be
injected to create higher pressure drawdown. The higher pressure drawdown needed
to overcome the wells that have high water cut since the wells will have small
amount of gas to lift the formation oil to the surface.
The depletion of reservoir cause by influx in water drive reservoir increases water cut
which lead to the problems such as increase in the density of produced fluid and
formation oil-water emulsion due to increase in the viscosity of the produced fluid
may occur and will reduce the production rate of well. (Mukherjee & Brown, 1986).
2.4 Smart In-Situ Gas Lift
Smart in-situ gas lift is a gas lift design that fully utilizes the natural energy from gas
cap or gas formation to lift oil to the surface (Konopczynski, 2007; Peringod et al.,
2011; Vasper, 2008). This means no outsource gas is injected from the surface unlike
the conventional gas lift system. This is supported by Al-Otaibi, Al-Gamber,
Konopczynski, and Jacob (2006) in which smart well technology application used in
Abqaiq field utilize free energy from overlying gas cap in order to produce low
productivity and high water cut wells. While Al-Kasim, Synøve, Jakobsen, Tang, and
Jalali (2002) mentioned that excessive pressure from gas cap can be fully utilized for
smart in-situ gas lift and gas influx is allowed to flow into wellbore for liquid lifting
process.
Konopczynski (2007) stated that the smart in-situ gas lift system is a system whereby
the gas producing from reservoir is commingled with oil production zone to decrease
the hydrostatic pressure of producing fluid and eliminate the effect of water cut to
increase the production rate. This statement is supported by Warren et al. (2009) in
which high water cut well can still producing oil by implementing smart in-situ gas
lift. The primary objective of smart in-situ gas lift is to increase oil production by
`
18
utilizing the natural energy from the reservoir’s gas cap itself (Betancourt, Dahlberg,
Hovde, & Jalali, 2002; Peringod et al., 2011; Vasper, 2008).
While Jin, Sommerauer, Rahman, and Yong (2005) explained the concept of smart
in-situ gas lift which is source for internal gas lifting can be used from a reservoir
that has sufficient amount of energy and reserve. Plus, the life of a well can be
extended by eliminating the effect of high water cut. Betancourt et al. (2002)
explained the continuous flow of gas into the well can eliminate high water cut.
According to Vasper (2008), flowing gas from gas formation is let to flow into the
tubing by flow control valve and the valve’s opening can be control at the surface.
Application of smart in-situ gas lift have been installed at many wells such as in the
Panna field (India), North Sea, Egret field (Brunei), Abqaiq field (Saudi Arabia),
Norne field (Norway), Troll oil field (Norway) and Oman (Al-Kasim et al., 2002; Al-
Otaibi et al., 2006; Betancourt et al., 2002; Jin et al., 2005; Konopczynski, 2007;
Peringod et al., 2011; Warren et al., 2009).
2.5 Smart In-Situ Gas Lift Design Consideration
A smart completion system such as in-situ gas lift was designed to utilize the
downhole smart choke and in-situ gas lift valve (Jin et al., 2005). The design of in-
situ gas lift is very important in order for the system to be operated successfully. This
is supported by Konopczynski (2007) in which the design of in-situ gas lift should
takes into account of possible range of uncertainties that is related to reservoir and
well performance.
Parameters such as oil and gas zone productivity index, fluid composition of oil and
gas zone and reservoir pressure of oil and gas zone should be considered in designing
process since these parameters represent of both reservoir uncertainties and expected
to change throughout the life of a well (Al-Otaibi et al., 2006; Konopczynski, 2007).
One of the main factors that need to be considered when designing in-situ gas lift is
interval control valve (Al-Kasim et al., 2002; Al-Otaibi et al., 2006; Gilbertson et al.,
2013; Jin et al., 2005; Warren et al., 2009).

`
19
While (Konopczynski (2007); Peringod et al. (2011); Warren et al. (2009)) discussed
in their paper that selection of well can be important factor in designing in-situ gas
lift well.
In addition, setting depth for smart in-situ gas lift well also plays a major role in
producing a good in-situ gas lift system (Al-Otaibi et al., 2006; Vasper, 2008).
Meanwhile, (Al-Kasim et al. (2002); Vasper (2008)) stated that the opening of valve
can affect the performance and production rate of in-situ gas lift well.
From the view of many experts, the main design consideration for smart in-situ gas
lift system are interval control valves (ICV), well selection, setting depth and valve
opening for smart in-situ gas lift well.
2.5.1 Interval Control Valve (ICV)
One of the main considerations for designing smart in-situ gas lift system is in-situ
gas lift valve or specifically called interval control valve. In-situ gas lift system is
much different from conventional gas lift system in term of flow of gas injection
where gas from gas cap will flow into the tubing through a remotely down-hole flow
control device (ICV) that is connected by control line at surface (Al-Otaibi et al.,
2006). The design of in-situ gas lift system must have hydraulic control line that
connects the control line at surface and down-hole operating valve. By having this
feature, the gas injection rate can be easily control by hydraulic or electric activation
or both of the combinations (Betancourt et al., 2002).
Interval control valve (ICV) is highlighted as one of the important design
consideration for in-situ gas lift since ICV will be a medium to allow the fluid or
gases to communicate between the production tubing and annulus inside the wellbore
(Shaw, 2011). This ICV can be in different shapes and designs such as ball valve,
sliding sleeve and can be offset which looks similar to side pocket mandreal.

`
20
Figure 5: Interval Control Valve (Youl, Harkomoyo, & Finley, 2010)
The ICV is designed to adapt to the changes of reservoir condition, pressure and
temperature. Plus, the ICV have special ability to handle condensate, water and small
particles that are produced in the producing fluids which come from the formation
(Rahman, Allen, & Bhat, 2012).
The ICV or downhole choke which is used to control the flow at the bore or targeted
producing zone has the sensors (pressure and temperature) for data acquisition
purposes (Davies & Ebadi, 2006).
For the number of valve, it may be varies depending on flow selection either discrete
or continuous flow that is determined at the flow control system. Continuous flow
may have infinite position and numbers of valves, while discrete flow signifies the
fixed numbers of valves ranging from 6-10 valves needed in the in-situ gas lift
system (Betancourt et al., 2002).
2.5.2 Well Selection
Besides, the good selection of well for the in-situ gas lift implementation can sustain
the smart in-situ gas lift well. According to Peringod et al. (2011), the existence of
continuously gas injection can be a good selection for in-situ gas lift well.
While Konopczynski (2007) stated there are three condition for a well to be
completed with in-situ gas lift which includes the pressure of gas reservoir must
higher than the hydrostatic pressure of the column of fluid in the tubing, gas reservoir

`
21
must have high production rate and the volume of gas reserve must be large enough
to maintain the productivity of the well though different producing conditions.
Other than that, a reservoir with small producing oil zones, having a gas cap on top
of oil layer and equipped with aquifer layer underneath of oil layer can be regarded
as a natural candidate for implementation of in-situ gas lift system. In addition, the
in-situ gas lift also can be applied to the depleted reservoirs that have some access for
source of gas from nearest well within the reservoirs (A.K., 2010).
One of the type of well that can be considered to implement with in-situ gas lift
system is high water cut well since the well need some sort of energy which is gas
from gas producing zone to achieve the production rate required (Betancourt et al.,
2002).
According to Warren et al. (2009), the in-situ gas lift performance can be represented
by the equation below:
From the oil zone to the injection point:
From the gas zone to the injection point:
From surface to the injection point:
For , Vogel equation is used to represent the oil rate that can be produced
from the reservoir:
(
) (
)
For ,back pressure equation is used to represent gas rate that can be produced
from the reservoir:
`
22
(
)
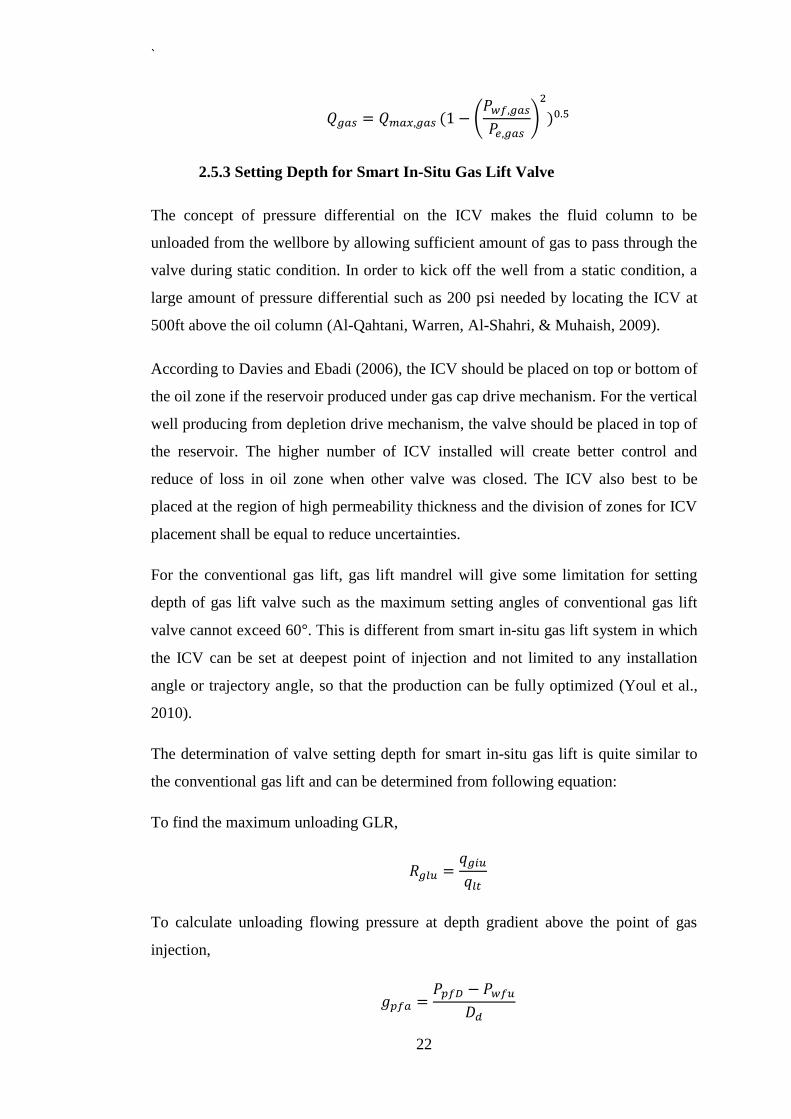
2.5.3 Setting Depth for Smart In-Situ Gas Lift Valve
The concept of pressure differential on the ICV makes the fluid column to be
unloaded from the wellbore by allowing sufficient amount of gas to pass through the
valve during static condition. In order to kick off the well from a static condition, a
large amount of pressure differential such as 200 psi needed by locating the ICV at
500ft above the oil column (Al-Qahtani, Warren, Al-Shahri, & Muhaish, 2009).
According to Davies and Ebadi (2006), the ICV should be placed on top or bottom of
the oil zone if the reservoir produced under gas cap drive mechanism. For the vertical
well producing from depletion drive mechanism, the valve should be placed in top of
the reservoir. The higher number of ICV installed will create better control and
reduce of loss in oil zone when other valve was closed. The ICV also best to be
placed at the region of high permeability thickness and the division of zones for ICV
placement shall be equal to reduce uncertainties.
For the conventional gas lift, gas lift mandrel will give some limitation for setting
depth of gas lift valve such as the maximum setting angles of conventional gas lift
valve cannot exceed 60 . This is different from smart in-situ gas lift system in which
the ICV can be set at deepest point of injection and not limited to any installation
angle or trajectory angle, so that the production can be fully optimized (Youl et al.,
2010).
The determination of valve setting depth for smart in-situ gas lift is quite similar to
the conventional gas lift and can be determined from following equation:
To find the maximum unloading GLR,
To calculate unloading flowing pressure at depth gradient above the point of gas
injection,

`
23
In order to calculate the static injection gas pressure at lower end of production fluid,
To calculate depth of gas lift valve,
Besides, the valve should be located between the two packers because the zones of
oil and gas must be isolated (Al-Otaibi et al., 2006). This valve also is positioned at
the zones that capable for gas breakthrough, so that the gas from gas cap can be
easily reached and supplied into the production tubing (Rahman et al., 2012).
2.5.4 Valve Opening
The design of in-situ gas lift valve must have optimum slot width and must be small
enough to prevent from backflow of high pressure gas into oil zone and large enough
to have maximum gas flowing into production tubing (Al-Kasim et al., 2002; Vasper,
2008).
The ICV can be divided into three types of control which are two position valve
either open or close, infinitely variable valves and multiple step valve. This valve
will be operated based on the nature of the reservoir which represented by choke
application (Davies & Ebadi, 2006).
Meanwhile Warren et al. (2009) mentioned that ICV have various setting that can
control gas production which related to the gas trim application and the opening of
ICV is controlled by a shifting piston. Other than that, ICV needs to have check
valve in order to prevent the back flow of fluid into the annulus (Jin et al., 2005).
The main principle to operate the ICV is pressure in which metal-to-metal seal will
be unlocked by minimum pressure differential of 250 psi to open up the ICV at
desired opening and it can be closed by applying pressure on the closed line (Youl et
al., 2010).
The injection gas pressure can be determined by equation below:
`
24
In case of gas coning or gas breakthrough, the well is said to be uneconomical since
the gas influx will occur in the well and oil production start to decline. Somehow, the
ICV can be used in efficient way to handle this problem by controlling the opening
of the valve, so that the gas coning problem can be used to optimize the reservoir’s
production (Leemhuis, Belfroid, & Alberts, 2007).
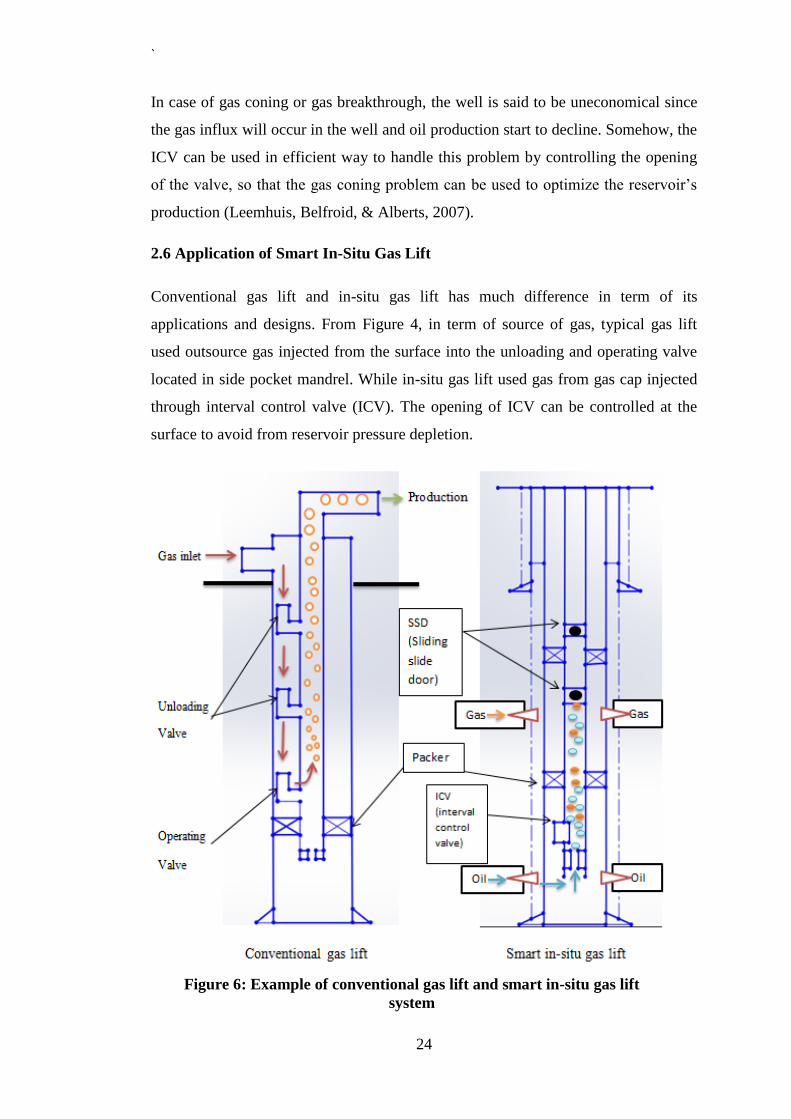
2.6 Application of Smart In-Situ Gas Lift
Conventional gas lift and in-situ gas lift has much difference in term of its
applications and designs. From Figure 4, in term of source of gas, typical gas lift
used outsource gas injected from the surface into the unloading and operating valve
located in side pocket mandrel. While in-situ gas lift used gas from gas cap injected
through interval control valve (ICV). The opening of ICV can be controlled at the
surface to avoid from reservoir pressure depletion.
Figure 6: Example of conventional gas lift and smart in-situ gas lift
system

`
25
The application of in-situ gas lift gives various advantages to the oil and gas industry.
According to Al-Kasim et al. (2002), application of in-situ gas lift can save 3-4 rig
days and increase liquid production rates. Plus, in-situ gas lift design reduces the
platform load requirement and replaces the conventional gas lift equipment with
much more simple setup, thus reducing the operating cost (Al-Otaibi et al., 2006;
Vasper, 2008). By using this method, the capital expenditure (CAPEX) can be
reduced and prove to be a cost effective artificial (Konopczynski, 2007; Peringod et
al., 2011).
In economic point of view, Jin et al. (2005) mentioned that by having a smart
technology like in-situ gas lift, the liquid recovery can be maximized by producing
from small oil rim. In addition, in-situ gas lift prove to be a smart system which can
extend the life of a well by allowing the continuous production from a high water
cut well (Warren et al., 2009).
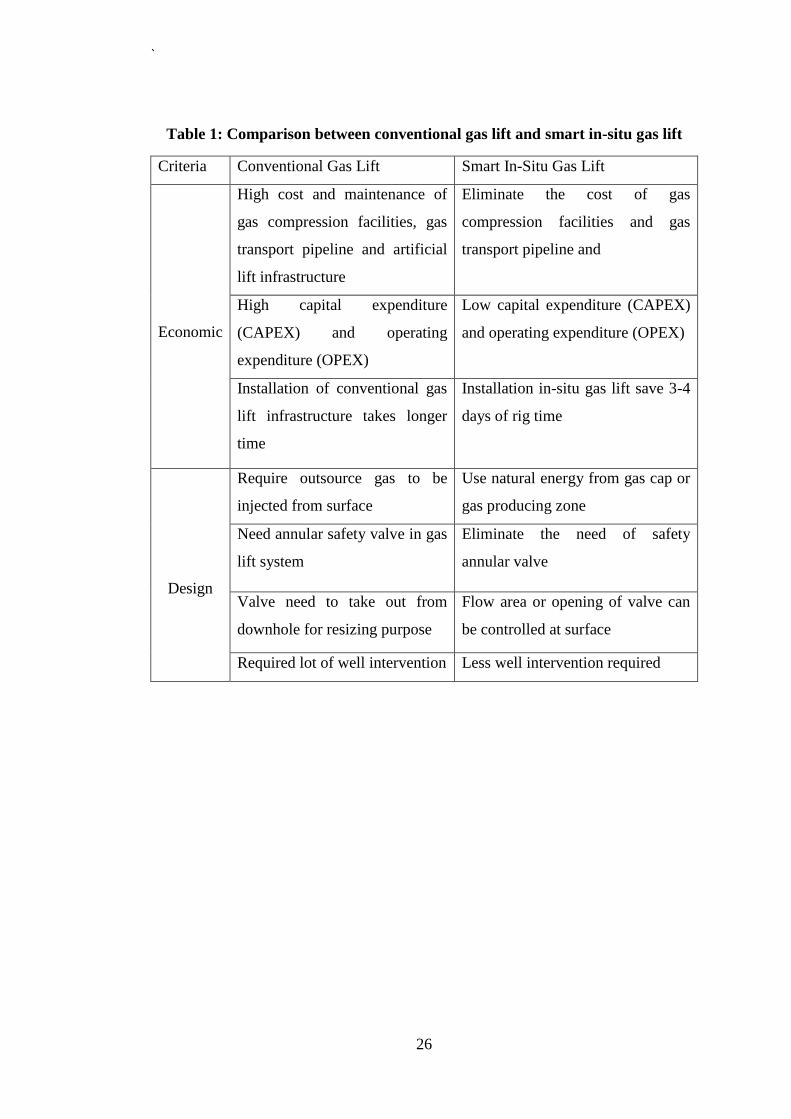
(Peringod et al. (2011)) also highlighted the advantages of using in-situ gas lift which
includes stability of production rate, less time taken for a well to start-up after plant
shutdown, superior well integrity and reduction of footprint. The comparison
between the conventional gas lift and in-situ gas lift application can be summarized
in Table 1.
`
26
Table 1: Comparison between conventional gas lift and smart in-situ gas lift
Criteria Conventional Gas Lift Smart In-Situ Gas Lift
Economic
High cost and maintenance of
gas compression facilities, gas
transport pipeline and artificial
lift infrastructure
Eliminate the cost of gas
compression facilities and gas
transport pipeline and
High capital expenditure
(CAPEX) and operating
expenditure (OPEX)
Low capital expenditure (CAPEX)
and operating expenditure (OPEX)
Installation of conventional gas
lift infrastructure takes longer
time
Installation in-situ gas lift save 3-4
days of rig time
Design
Require outsource gas to be
injected from surface
Use natural energy from gas cap or
gas producing zone
Need annular safety valve in gas
lift system
Eliminate the need of safety
annular valve
Valve need to take out from
downhole for resizing purpose
Flow area or opening of valve can
be controlled at surface
Required lot of well intervention Less well intervention required

`
27
CHAPTER 3
METHODOLOGY
3.1 Gantt Chart
Table 2 : Gantt chart (FYP1)
Table 3: Key milestone (FYP 1)
KEY MILESTONE
Week 6 Completing the introduction part
Week 7 Completing writing methodology
Week 8 Submission of extended proposal
Week 9 Proposal defence presentation
Week 12 Data collection and start doing simulation
Week 13 Submit the draft for interim report
Week 14 Submit interim report
Activities
Week No.
1 2 3 4 5 6 7 8 9 10 11 12 13 14
Selection of Project
Topic
Introduction
-Identify the problem &
objectives
Literature Review
-Conventional gas lift
-In-situ gas lift
Submission of
Extended Proposal
Proposal Defence
Simulation (Wellflo)
Submission of Interim
Draft Report
Submission of Interim
Report
`
28
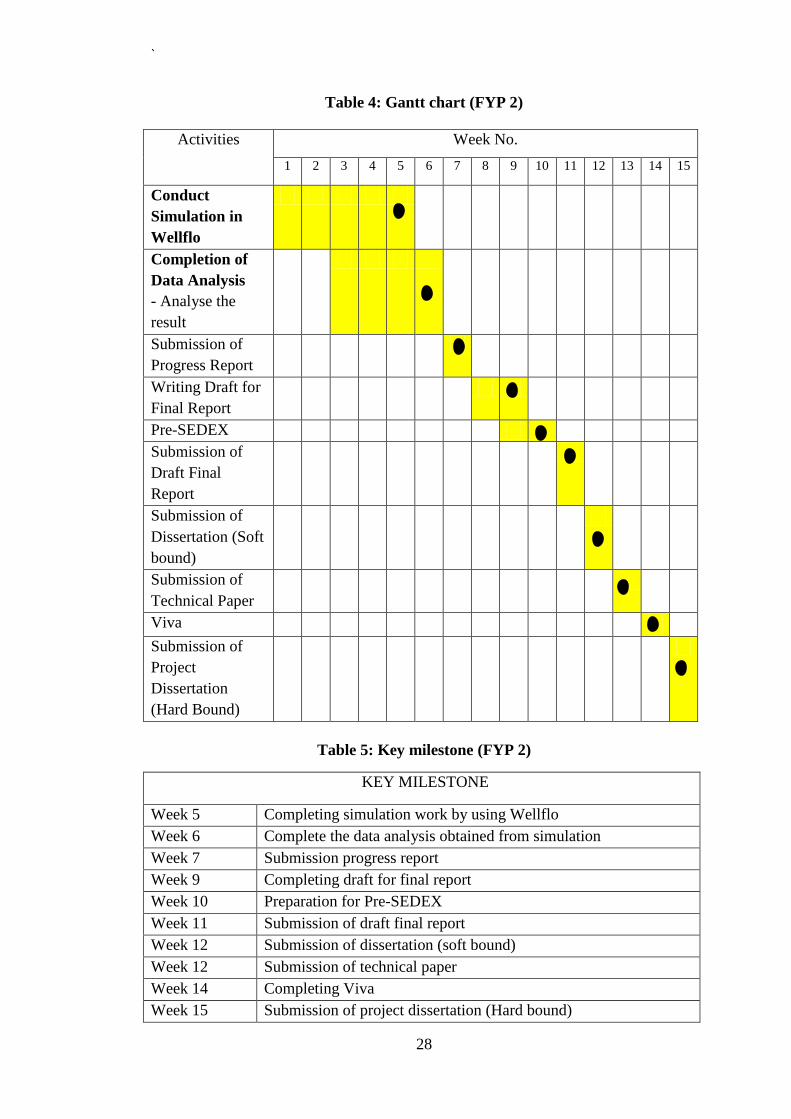
Table 4: Gantt chart (FYP 2)
Table 5: Key milestone (FYP 2)
KEY MILESTONE
Week 5 Completing simulation work by using Wellflo
Week 6 Complete the data analysis obtained from simulation
Week 7 Submission progress report
Week 9 Completing draft for final report
Week 10 Preparation for Pre-SEDEX
Week 11 Submission of draft final report
Week 12 Submission of dissertation (soft bound)
Week 12 Submission of technical paper
Week 14 Completing Viva
Week 15 Submission of project dissertation (Hard bound)
Activities
Week No.
1 2 3 4 5 6 7 8 9 10 11 12 13 14 15
Conduct
Simulation in
Wellflo
Completion of
Data Analysis
- Analyse the
result
Submission of
Progress Report
Writing Draft for
Final Report
Pre-SEDEX
Submission of
Draft Final
Report
Submission of
Dissertation (Soft
bound)
Submission of
Technical Paper
Viva
Submission of
Project
Dissertation
(Hard Bound)

`
29
3.2 Flow of Process
Figure 7: Flow of Process

`
30
The flow of process for this project can be divided into three main phases which are
preliminary study, simulation work and discussion of results.
3.2.1 Preliminary Study
In this part, the project started by focusing on the project planning and literature
review about the topic which includes the understanding the concept of artificial lift,
gas lift and in-situ gas lift. Plus, selection of design criteria for gas lift and in-situ gas
lifts also being studied and shortlisted in the report. From this point, the comparison
of the design for both of gas lift and in-situ gas lift are drawn to get more
understanding on both design considerations. The main interest of this research will
be the determination of design consideration for in-situ gas lift and prediction of well
performance and production evaluation after performing in-situ gas lift system.
3.2.2 Simulation Work
After that, the work project continues with the gathering set of data for simulation
purpose. The Wellflo software is used for modelling and simulation by using Nodal
analysis method. By using this software, production optimization and forecasting of
well performance can be done. In order to perform in-situ gas lift design in Wellflo, a
model must be built and perform diagnostic analysis. Plus, the depth of injection
point, numbers of gas lift valves needed, and the gas flow rate can be estimated by
performing this simulation.
The in-situ gas lift well can be modelled in the software by specifying the
components such as gas lift valve, tubing size, etc. The software will provide all gas
lift calculation after the sensitivity variables such as amount of gas injection being
inserted in the software. Once the in-situ gas lift model has been designed and
inserted with real data, Wellflo can accurately analyse the inflow performance,
predict the optimum injection point and injection pressure needed for gas lift system.
The set of data needed for simulation includes well data, fluid parameters, PVT data,
inflow parameters, gas lift data, production information and test data.

`
31
3.2.3 Result and discussion
By performing simulation using Wellflo, the design consideration of smart in-situ
gas lift system can be applied in the software. From this application, the results
obtained in the can proved that all the design consideration listed for smart in-situ
gas lift system as discussed in the literature review are true and the production of the
well is expected to increase.
From the result obtained using software, the comparison and discussion will be made
based on three types of well conditions which are natural flow well, conventional gas
lift well and smart in-situ gas lift well. From this comparison study, the analysis of
smart in-situ gas lift well to the normal well and conventional gas lift well can be
made clearly.
Figure 8: Flow of result

`
32
CHAPTER 4
RESULT AND DISCUSSION
After done with simulation work, the results obtained are divided into several main
components which includes of inflow/outflow performance curve, gas lift design and
smart in-situ gas lift design.
4.1 Inflow/ Outflow Performance Relationship
Vogel was chosen as IPR model because the reservoir is classified as saturated
reservoir since reservoir pressure is below bubble point pressure. As shown by
vogel’s IPR plot in figure 10, the productivity index recorded for this well was 8.5
STB/d/psi with absolute open flow (AOF) of 7486.4 STB/d.
Figure 9: Vogel's IPR curve
The simulation for three different cases was done in Wellflo. The first case/ base case
represented the natural flow well, the second case represented the well with

`
33
conventional gas lift and the third case represented the well with smart in-situ gas
lift. The optimum tubing size of 3.5 inch and optimum gas injection rate of 2.01
MMSCF/d were selected to be used for that well.
For the base case, the performance of the well without installing any artificial lift or
produce naturally was well described by the plot of inflow and outflow performance
curve in figure 10. The well was capable to produce liquid rate of 3974 STB/d with
oil rate of 3895 STB/d and formation gas rate of 2.53 MMSCF/d. Meanwhile, the
produced GOR recorded was 650 SCF/STB. However, the production rate depleted
as the reservoir pressure decrease with time.
From figure 10, the operating point of the well can be seen at the intersection
between the inflow performance relationship (IPR) curve and vertical lift
performance (VLP) curve where the operating pressure was 1080 psia and the
operating rate was 3780 STB/d.
Figure 10: Inflow/outflow performance curve for naturally flowing well
The second case was represented by figure11, by installing the conventional gas lift,
the oil production rate of this well increased to 4326 STB/d by injecting gas at rate of

`
34
2.01 MMSCF/d. The injection gas rate has reduced the fluid average density, so that
the available reservoir energy can cause inflow and ease the process of lifting oil to
the surface.
Figure 11: Inflow/Outflow Performance Curve for Gas Lift Well
Besides that, the operating point has decreased after conventional gas lift was
implemented in this well (Figure 11). The operating pressure and rate recorded for
conventional gas lift well were 968 psia and 4414 STB/d respectively. Plus, the
injection of outsource gas into the well has caused the produced GOR increase to
1115 SCF/STB.
Lastly, for the smart in-situ gas lift application on the well, the performance of the
well throughout the production time which was shown in figure 12 proved to be
much better than using the conventional gas lift system. The implementation of smart
in-situ gas lift system in the well has caused the total liquid production increased to
5031 STB/d compared to naturally flowing well (3974 STB/d) and conventional gas
lift well (4350 STB/d). The oil production rate for smart in-situ gas lift well has
improved about 26 % from natural production well due to help from gas cap zone.

`
35
Figure 12: Inflow/Outflow Performance Curve for Smart In-Situ Gas Lift Well
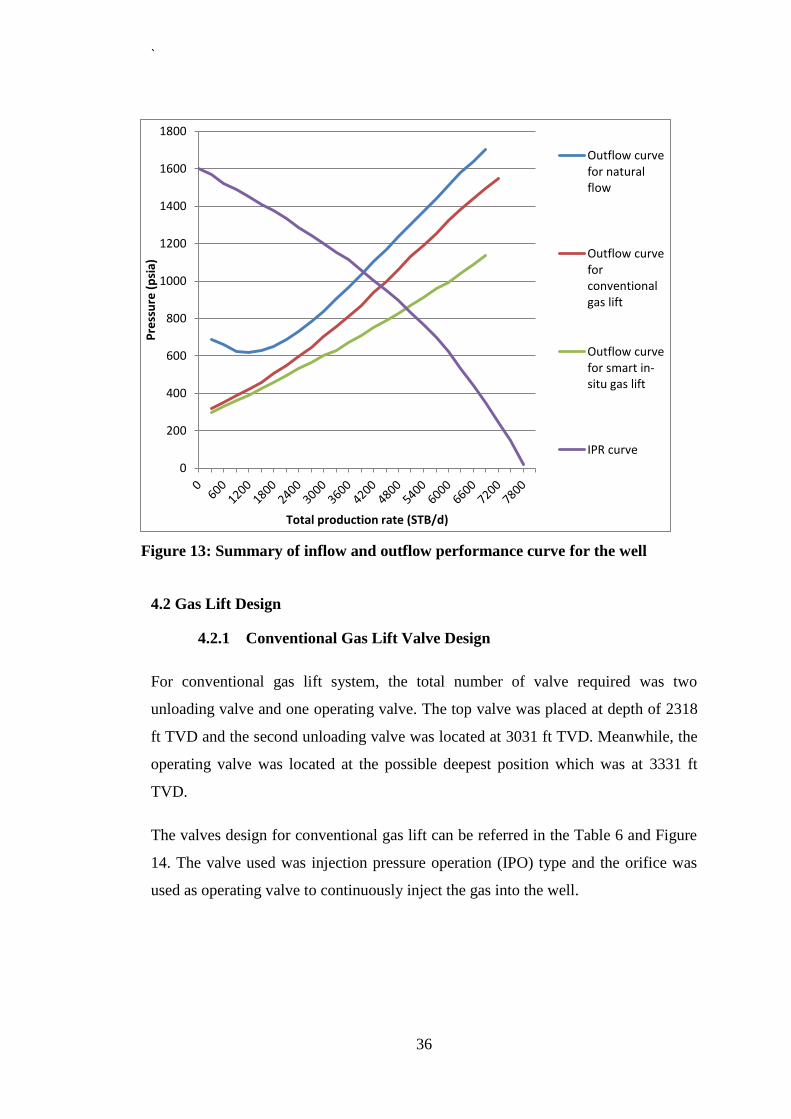
The summary of inflow and outflow performance for the well is represented in figure
13. Through this figure, it can be conclude that the installation of conventional gas
lift gave little improvement to the well performance compared to the impact of smart
in-situ gas lift on the well.
The implementation of smart in-situ gas lift has allowed gas from gas cap zone to
commingle with produced fluid and lightened the fluid density to ease of oil lifting
process to the surface.
`
36
4.2 Gas Lift Design
4.2.1 Conventional Gas Lift Valve Design
For conventional gas lift system, the total number of valve required was two
unloading valve and one operating valve. The top valve was placed at depth of 2318
ft TVD and the second unloading valve was located at 3031 ft TVD. Meanwhile, the
operating valve was located at the possible deepest position which was at 3331 ft
TVD.
The valves design for conventional gas lift can be referred in the Table 6 and Figure
14. The valve used was injection pressure operation (IPO) type and the orifice was
used as operating valve to continuously inject the gas into the well.
0
200
400
600
800
1000
1200
1400
1600
1800
Pre
ssu
re (
psi
a)
Total production rate (STB/d)
Outflow curvefor naturalflow
Outflow curveforconventionalgas lift
Outflow curvefor smart in-situ gas lift
IPR curve
Figure 13: Summary of inflow and outflow performance curve for the well

`
37
Table 6: Conventional gas lift valve design
In the Wellflo, the maximum deepest point of injection for operating valve was set at
any deepest injection depth according to the conventional method of placing the
valve. The valve differential pressure used was 30 psi and the calculated minimum
valve spacing was 88 ft.
Figure 14: Conventional gas lift valve plot
4.2.2 Smart In-Situ Gas Lift Valve Design
While for the smart in-situ gas lift, one ICV was required to allow the gas from
producing cap to enter the casing. From the gas lift plot in Wellflo, it was assumed
that the ICV could be placed at the deeper depth to replace the orifice. Bases on the
graph of gas lift design plotted in figure 15, the ICV was set at depth of 3120 ft TVD.

`
38
The smart in-situ gas lift design can be referred in figure 15. Based on the literature
review, the interval control valve should be located at the top or bottom of oil zone if
the reservoir is operating under gas cap drive mechanism or the valve should be
placed at 500 ft above oil column (Al-Qahtani et al., 2009). Therefore, in the
Wellflo, the valves were designed to be placed at any depth above oil column to meet
the design criteria. From figure 15, the result shown that the deepest ICV can be
placed at 3120 ft TVD.
Besides, the valve differential pressure is one of the factors needs to be considered
when designing smart in-situ gas lift valve. From the literature study, in order to kick
off the well from the static condition, large amount of valve differential pressure is
required (Al-Qahtani et al., 2009). In the Wellflo, the valve differential pressure was
set at 200 psi, so that the requirement to design the ICV could be met.
4.3 Advanced Smart In-Situ Gas Lift Valve Modeling
In addition, the true performance of interval control valve (ICV) with sensitivity to
port size, gas injection rate and tubing pressure was done in the Wellflo. To perform
Figure 15: Smart in-situ gas lift valve plot

`
39
this simulation, various port sizes were selected which includes of 12, 16, 20, 24 and
28 (64th
in) at the injection pressure of 750 psia. The plot of valve performance based
on the well performance can be referred in the Figure 16.
Based on the graph plotted in the Figure 16, it can be concluded that the rate of gas
entering the valve increases as the port with bigger size is used.
Figure 16: Valve performance curve for interval control valve (ICV)
4.4 Sensitivity Analysis
After done with designing the smart in-situ gas lift system, the overall well
performance need to be analyzed based on several sensitivity parameters. The
objective of running this sensitivity study is to determine and predict how the
performance of smart in-situ gas lift well affected by comparing with different
sensitivity cases. In order to evaluate the well performance before and after
implementing smart in-situ gas lift system, sensitivity parameters such as water cut,
lift gas injection rate and valve differential pressure were done. The sensitivity

`
40
analysis will be compared between the naturally flowing well, gas lift well and smart
in-situ gas lift well.
4.4.1 Water cut analysis
Sensitivity analysis for water cut was run in the Wellflo with different values of
water cut which ranging from 10% until 80% were used to measure the effect of
water cut to the inflow and outflow performance of the naturally flowing well,
conventional gas lift well and smart in-situ gas lift well. The analysis of water cut to
the three different cases of well was listed in the figure 17, 18, 19 and table 7, 8, 9.
Figure 17: Water cut analysis for natural flow well
`
41
Table 7: Oil production rate with different water cut values for natural
flow well
Water
cut (%)
10 20 30 40 50 60 70 80
Qo
(stb/d)
3291 2786 2289 1812 1355 904 470 -
For the base case, the well was economically to be produced if the water cut was
below than 80%. When the water cut reached 80%, no oil production recorded from
the well.
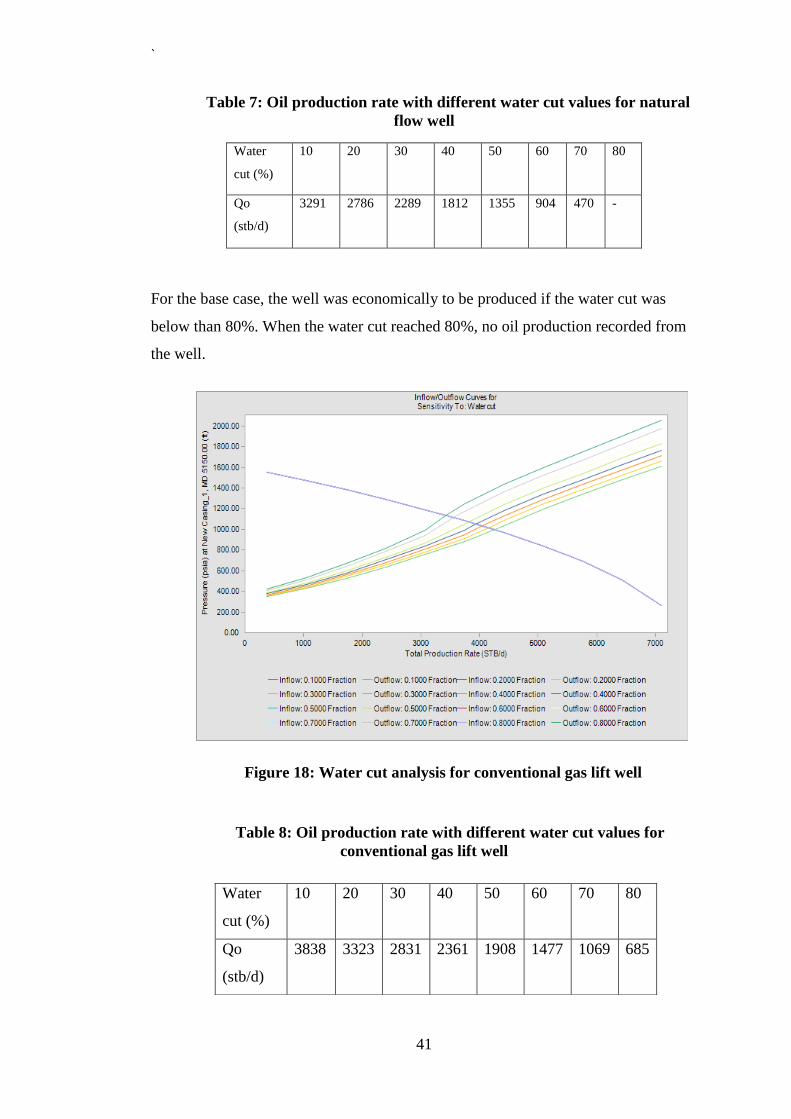
Table 8: Oil production rate with different water cut values for
conventional gas lift well
Water
cut (%)
10 20 30 40 50 60 70 80
Qo
(stb/d)
3838 3323 2831 2361 1908 1477 1069 685
Figure 18: Water cut analysis for conventional gas lift well

`
42
Table 9: Oil production rate with different water cut values for smart in-
situ gas lift well
From the figures 17, 18 and 19, it can be concluded that as water cut increases, the
total liquid production rate will be decreases. This was proved when the value of
water cut was at 60%, the total oil rate produced decreased to 904 STB/d for
naturally flowing well, 1477 STB/d for conventional gas lift well and 1748 STB/d
for smart in-situ gas lift well. From this observation, the smart in-situ gas lift well
still can be produced at higher rate even at high amount of water cut.
Water
cut (%)
10 20 30 40 50 60 70 80
Qo
(stb/d)
4457 3880 3318 2772 2251 1748 1269 812
Figure 19: Water cut analysis for smart in-situ gas lift well

`
43
4.4.2 Valve differential pressure analysis
Valve differential pressure is one of the main design considerations for constructing
smart in-situ gas lift system. The sensitivity analysis to valve differential pressure
was conducted to identify the ideal pressure used to kick off the well from static
condition.
To perform the sensitivity analysis in Wellflo, six different values of differential
pressure which includes of 0, 200, 400, 600, 800 and 1000 psia were analysed on
both type of gas lift valve.
From the analysis in figure 20, for the conventional gas lift, the valve can be set at
differential pressure range from 0 to 200 psi which is the optimum differential
pressure since the maximum liquid production recorded at this pressure was 4200
STB/d. Further increment in the valve differential pressure will cause the oil
production rate to drop.
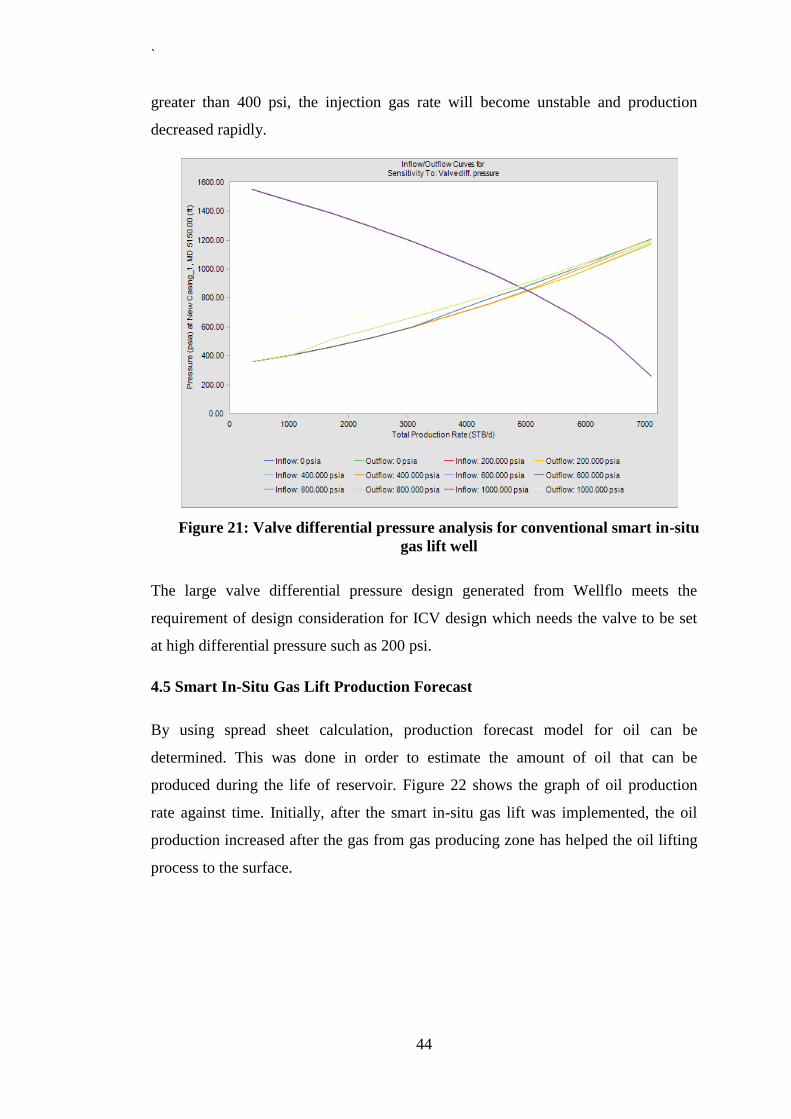
Meanwhile, figure 21 shows the valve differential pressure analysis for the smart in-
situ gas lift well. The optimum valve differential pressure for this well can be set at
range of pressure from 100 to 400 psi. If the valve is set at differential pressure
Figure 20: Valve differential pressure analysis for conventional gas lift
well
`
44
greater than 400 psi, the injection gas rate will become unstable and production
decreased rapidly.
The large valve differential pressure design generated from Wellflo meets the
requirement of design consideration for ICV design which needs the valve to be set
at high differential pressure such as 200 psi.
4.5 Smart In-Situ Gas Lift Production Forecast
By using spread sheet calculation, production forecast model for oil can be
determined. This was done in order to estimate the amount of oil that can be
produced during the life of reservoir. Figure 22 shows the graph of oil production
rate against time. Initially, after the smart in-situ gas lift was implemented, the oil
production increased after the gas from gas producing zone has helped the oil lifting
process to the surface.
Figure 21: Valve differential pressure analysis for conventional smart in-situ
gas lift well

`
45
0
1000
2000
3000
4000
5000
6000
2014 2015 2016 2017 2018 2019 2020 2021 2022
Qo
. STB
/d
Years
Oil Production Forecast
Oil rate
After one year, the production started to decrease due to concern of reduction in
reservoir pressure. However, the interval control valve is capable to adjust the rate of
gas flow entering the well can help in maintaining the reservoir pressure. From the
estimated total oil production rate, the well is expected to continue produce the oil
under the smart in-situ gas lift for more than 10 years.
The summary of production forecast for the well after the implementation of smart
in-situ gas lift is represented in the table 10. The well is expected to continue produce
after ten years of production.
Table 10: Smart in-situ gas lift well production forecast
Year 2014 2015 2016 2017 2018 2019 2020 2021 2022
Oil
production
(STB/yr)
4931
4373
3879
3440
3051
2706
2400
1888
1675
Figure 22: Oil production forecast

`
46
Table 11: Summary of comparison between natural flow, conventional gas lift &
smart in-situ gas lift
To summarize the performance of the well, the comparison was made between the
condition of the well in the state of natural flow, conventional gas lift and smart in-
situ gas lift. By referring to table 11, the oil production rate increase by 11% from the
base case if the well was operating under conventional gas lift. Meanwhile, the smart
in-situ gas lift gave big impact to the productivity of the well when this method
managed to increase about 27% from the production of natural flow well. Besides,
the smart in-situ gas lift method which allowed the flow of gas from gas producing
zone into the well show highest gas production rate compared to natural flow and
conventional gas lift.
Despite the advantages show after the smart in-situ gas lift was applied in the target
well, there was a concern about this method in which the reservoir pressure was
expected to be depleted faster than the well in natural flow and conventional gas lift.
This problem was handled by having intelligent valve (ICV) and downhole chokes
which controlled the injection gas rate from gas cap into the well.
Type of well
Parameter
Natural
Flow (Base
Case)
Conventional
Gas Lift
Smart In-
Situ Gas
Lift
Oil production rate (STB/d) 3895 4326 4931
Percentage increase of oil
production based on base case (%)
- 11 27
Gas production rate (MMSCF/d) 2.53 2.81 3.21
Water rate (STB/d) 79.5 88.3 100
Minimum valve spacing (ft) - 88 355
Valve differential pressure (psia) - 50 200
Deepest injection point (MD) - 3331 3120

`
47
CHAPTER 5
CONCLUSION AND RECOMMENDATION
At the end of the project, the objectives of this project which were to identify the
design consideration of smart in-situ gas lift and to predict well performance after the
smart in-situ gas lift system being applied at the target well has achieved. From the
simulation and analysis that have been done using Wellflo, the smart in-situ gas lift
injection method had improved the productivity of the tested well. The oil production
rate has increased up to 27% from the natural production rate that can be produced.
Meanwhile, the implementation of conventional gas lift can only lift up the
production rate up to 11% from the normal production rate of the well.
From this project, the smart in-situ gas lift which was designed to replace the
conventional gas lift provide the financial advantage over the conventional method
by eliminating the needs for high cost of traditional gas lift facilities. Moreover, this
method also provides the solution for the space restrictions that eliminate the needs
of conventional gas lift facilities such as gas compressor facilities. Plus, the
capability of smart in-situ gas lift to deliver the production in high water rate
environment give a great advantage to optimize the production from the target well.
For the recommendation, it is hoped that the project can be done in more details and
critical ways by having the real gas lift data from the field. Plus, critical analysis
shall be done on the valve performance in order to know more details about the
optimum gas injection rate and pressure to pass through the valve. Besides, the cost
analysis for the smart in-situ gas lift well shall be performed, so that it can be
compared with the application of conventional gas lift.

`
48
REFERENCES
1. A.K., L. V. S. N. N. K. S. (2010). Auto/Natural/In-situ Gas Lift- A new Artificial
lift approach for production of hydro carbons from isolated pools of B&S Asset in
Western offshore,Mumbai-A case Study.
2. Adiyodi, K. S., Kumar, R. S., & Singh, R. (1999). Probe Testing of Gas Lift
Valves for Effective Performance Prediction and Better Gas Lift Design.
3. Al-Kasim, F. T., Synøve, T., Jakobsen, K. A., Tang, Y., & Jalali, Y. (2002).
Remotely Controlled In-Situ Gas Lift on the Norne Subsea Field.
4. Al-Otaibi, N. M., Al-Gamber, A. A., Konopczynski, M. R., & Jacob, S. (2006).
Smart Well Completion Utilizes Natural Reservoir Energy To Produce High
Water-Cut And Low Productivity Index Well In Abqaiq Field.
5. Al-Qahtani, H. B., Warren, P. B., Al-Shahri, A., & Muhaish, A. (2009). SS -
Reservoir Management Practices In The Offshore Oil Fields Of Saudi Arabia.
6. Beggs, H. D. (2003). Production Optimization Using Nodal Analysis. Tulsa:
OGCI and Petroskills Publications.
7. Bendakhlia, H., & Aziz, K. (1989). Inflow Performance Relationships for
Solution-Gas Drive Horizontal Wells.
8. Betancourt, S., Dahlberg, K., Hovde, Ø., & Jalali, Y. (2002). Natural Gas-Lift:
Theory and Practice.
9. Blann, J. R., & Williams, J. D. (1984). Determining the Most Profitable Gas
Injection Pressure for a Gas Lift Installation (includes associated papers 13539
and 13546 ). doi: 10.2118/12202-PA
10. Brown, K. E. (1982). Overview of Artificial Lift Systems. doi: 10.2118/9979-PA
11. Camacho V, R. G., & Raghavan, R. (1989). Inflow Performance Relationships for
Solution-Gas-Drive Reservoirs. doi: 10.2118/16204-PA
12. Cedeno, M., & Ortiz, J. L. (2007). SOLAG: An Intelligent Gas Lift Optimization
System for Continuous and Intermittent Gas Lift Wells: Society of Petroleum
Engineers.
`
49
13. Davies, D. R., & Ebadi, F. (2006). Techniques for Optimum Placement of Interval
Control Valve(s) in an Intelligent Well.
14. Decker, K. L. (2007). IPO Gas Lift Design Using Valve Performance.
15. Duncan, G. J., & Beldring, B. (2002). A Novel Approach to Gas Lift Design for
40,000 BPD Subsea Producers.
16. Fotouh, M. A., Eissa, M., & Al Gharabawy, A. (1999). Enhancing Low
Productivity Wells Using Special Gas Lift Design.
17. Gilbertson, E., Hover, F., & Freeman, B. (2013). A Thermally Actuated Gas-Lift
Safety Valve. doi: 10.2118/161930-PA
18. Greene, W. R. (1983). Analyzing the Performance of Gas Wells. doi:
10.2118/10743-PA
19. Gunawan, R., & Dyer, G. R. (1996). Tubing Size Optimization in Gas Depletion
Drive Reservoirs.
20. Hepguler, G., Schmidt, Z., Blais, R. N., & Doty, D. R. (1993). Dynamic Model of
Gas-Lift Valve Performance. doi: 10.2118/21637-PA
21. Hernandez, A., Gasbarri, S., Machado, M., Marcano, L., Manzanilla, R., &
Guevara, J. (1999). Field-Scale Research On Intermittent Gas Lift.
22. Jin, L., Sommerauer, G., Rahman, S. H. A., & Yong, Y.-C. (2005). Smart
Completion Design with Internal Gas Lifting Proven Economical for an Oil
Development Project in Brunei Shell.
23. Jones, D. L., & Brown, K. (1971). Application of Systems Analysis Can Increase
Production by 200 Percent in High Volume Gas Lift Wells.
24. Kanu, E. P., Mach, J., & Brown, K. E. (1981). Economic Approach to Oil
Production and Gas Allocation in Continuous Gas Lift (includes associated papers
10858 and 10865 ). doi: 10.2118/9084-PA
25. Kirkpatrick, C. V. (1959). Advances in Gas-lift Technology.
26. Konopczynski, M. R. (2007). Intelligent Well Technology Used for Oil Reservoir
Inflow Control and Auto-Gaslift, Offshore India.
27. Kumar, S. (2005). Design of Gas Lift System To Increase Oil Production For
Offshore Wells With High Water Cut. 499-505.
28. Laing, C. M. (1989). Gas-Lift Design and Production Optimization Offshore
Trinidad. doi: 10.2118/15428-PA

`
50
29. Leemhuis, A. P., Belfroid, S., & Alberts, G. (2007). Gas Coning Control for
Smart Wells.
30. Lo, K. K. (1992). Optimum Lift-Gas Allocations Under Multiple Production
Constraints: Society of Petroleum Engineers.
31. Mach, J. M., Proano, E. A., Mukherjee, H., & Brown, K. E. (1983). A New
Concept in Continuous-Flow Gas-Lift Design. doi: 10.2118/8026-PA
32. McAfee, R. V. (1961). The Evaluation of Vertical-Lift Performance in Producing
Wells. doi: 10.2118/1557-G-PA
33. Mukherjee, H., & Brown, K. E. (1986). Improve Your Gas Lift Design.
34. Naguib, M. A., Shaheen, S. E., Bayoumi, A. E.-W., & El-Emam, N. A. (2000).
Review of Artificial Lift in Egypt.
35. Nishikiori, N., Redner, R. A., Doty, D. R., & Schmidt, Z. (1989). An Improved
Method for Gas Lift Allocation Optimization.
36. Osuji, L. C. (1994). Review Of Advances In Gas Lift Operations: Society of
Petroleum Engineers.
37. Peringod, C., Al-Ruheili, S. M., apos, Kerecin, Z., Sonti, K., & Sukkestad, T.
(2011). Successful Auto gaslift using intelligent completion boosted oil production
- A case history from Petroleum Development Oman.
38. Pittman, R. W. (1982). Gas Lift Design and Performance.
39. Rahman, J. U., Allen, C., & Bhat, G. (2012). Second Generation Interval Control
Valve (ICV) Improves Operational Efficiency and Inflow Performance in
Intelligent Completions.
40. Redden, J. D., Sherman, T. A. G., & Blann, J. R. (1974). Optimizing Gas-Lift
Systems.
41. Saputelli, L. (1997). Combined Artificial Lift System - An Innovative Approach.
42. Shaw, J. (2011). Comparison of Downhole Control System Technologies for
Intelligent Completions.
43. Slupphaug, O., Hole, H., & Bjune, B. (2006). Active Slug Management.
44. Takacs, G. (2005). Gas Lift Manual. Miskolc: PennWell.
45. Turner, R. G., Hubbard, M. G., & Dukler, A. E. (1969). Analysis and Prediction
of Minimum Flow Rate for the Continuous Removal of Liquids from Gas Wells.
doi: 10.2118/2198-PA
46. Tutschulte, A. C. (1945). The Performance Of Gas Lift Through Small Tubing.

`
51
47. Vasper, A. C. (2008). Auto, Natural, or In-Situ Gas-Lift Systems Explained. doi:
10.2118/104202-PA
48. Vogel, J. V. (1968). Inflow Performance Relationships for Solution-Gas Drive
Wells. doi: 10.2118/1476-PA
49. Walker, M. (1929). Intermittent Injection of Gas in Gas-lift Installations. doi:
10.2118/929151-G
50. Wan, R., & Chen, X. (1986). Artificial Lift Techniques In China.
51. Warren, P. B., Logan, S. A., Zubail, M. A., Balto, A. A., Perez, S. P., Villarreal,
A. A., & Beccera, O. (2009). Utilization of In-Situ Gas Lift System to Increase
Production in Saudi Arabia Offshore Oil Producers.
52. Winkler, H. W. (1987). Gas Lift (1987 PEH Chapter 5): Society of Petroleum
Engineers.
53. Yaliz, A., Chapman, T., & Downie, J. (2002). Case Study of a Quad-Lateral
Horizontal Well in the Lennox Field: A Triassic Oil-Rim Reservoir.
54. Youl, K. S., Harkomoyo, & Finley, D. B. (2010). Indonesian Operator's First
Field-Wide Application of Intelligent-Well Technology -- A Case History.