Embed Size (px)
Citation preview
Design of a new anti-reflective caisson
Steven Feys
Tutors: Prof. dr. ir. J. De Rouck, Prof. dr. J.R. Medina
Master dissertation presented to obtain the academic degree:
Master of Civil Engineering
Academic year 2008-2009
School of Civil engineering Faculty of Engineering
Laboratory of Ports and Coasts Department of Civil engineering
Head: Prof. dr. J.R. Medina Head: Prof. dr. ir. J. De Rouck
The author gives the permission to use this thesis for consultation and to copy parts of it for
personal use. Every other use is subject to the copyright laws, more specifically the source
must be extensively specified when using from this thesis.
Valencia, August 2009
The author
Steven Feys
Preface
First of all, I would like to thank Prof. Medina for giving me the great opportunity to make
my final year project at the Laboratory of Ports and Coasts of the Universidad Politecnica
de Valencia, and for his guidance as my tutor throughout the project.
Special thanks goes to Prof. De Rouck as the Belgian tutor of this thesis and coordinator of
my Erasmus experience.
Deep gratitude goes to Guillermo Zarranz, for his guidance throughout the project and for
sharing his experience. Of course, I also want to thank Mireille, Jorge, Vicente, Enrique, Lien,
Pepe and Cesar for their help and because they made it a pleasant stay at the laboratory.
Furthermore, I would like to thank my parents. They gave me the opportunity to study and
to have this wonderful experience abroad. And also thanks to my girlfriend for her love,
understanding and patience during my time away.
Finally I wish to thank all my friends and family for giving me a wonderful time as a student
and especially my mother, for her fantastic care and support during these years.
Steven Feys
Valencia, August 2009
ii
Design of a new anti-reflective
caisson
by
Steven Feys
Master dissertation presented to obtain the academic degree:
Master of Civil Engineering
Academic year 2008-2009
Tutors: Prof. dr. ir. J. De Rouck, Prof. dr. J.R. Medina
School of Civil engineering Faculty of Engineering
Laboratory of Ports and Coasts Department of Civil engineering
Head: Prof. dr. J.R. Medina Head: Prof. dr. ir. J. De Rouck
Summary
In this report, the reflectivity of a new wave-absorbing caisson is studied within the frameworkof the MUCAR-project. This research and development project has as purpose to developa new caisson for antireflective quay walls that overcomes the limitations of the verticalquay walls. Therefore research is done in the Laboratory of Ports and Coasts (LPC) at theUniversidad Politecnica de Valencia (UPV). The reflection behaviour of 2 breakwater modelsections of the Jarlan-type is tested in the wave flume for different wave and sea conditions.
Further, the literature relating to models describing the reflection behaviour is studied, anda simplified model is selected for a comparison with the experimental data. Because everytheory has its own assumptions, no clear prediction for the reflection coefficients will benoticed. Nevertheless the test results seems to agree with the observations made for thedifferent Jarlan-type structures.
Keywords
Perforated-wall caisson, Wave dissipation, Reflection coefficient, Laboratory tests, Theoreticalmodel
Contents
Preface ii
Overview iii
Contents iv
Table of abbreviations and symbols vii
1 Introduction 1
2 The MUCAR Project 4
2.1 Objectives of the project . . . . . . . . . . . . . . . . . . . . . . . . . . . . . . 4
2.2 The experiments in the LPC . . . . . . . . . . . . . . . . . . . . . . . . . . . 6
3 State of the art 8
3.1 State of the art . . . . . . . . . . . . . . . . . . . . . . . . . . . . . . . . . . . 8
3.1.1 General considerations . . . . . . . . . . . . . . . . . . . . . . . . . . . 8
3.1.2 Models . . . . . . . . . . . . . . . . . . . . . . . . . . . . . . . . . . . 10
3.1.2.1 Empirical models . . . . . . . . . . . . . . . . . . . . . . . . 10
3.1.2.2 Theoretical models . . . . . . . . . . . . . . . . . . . . . . . . 12
3.1.2.3 Numerical models . . . . . . . . . . . . . . . . . . . . . . . . 14
3.1.3 Patents . . . . . . . . . . . . . . . . . . . . . . . . . . . . . . . . . . . 16
3.1.3.1 Adaptation of caissons . . . . . . . . . . . . . . . . . . . . . 16
3.1.3.2 Other typologies . . . . . . . . . . . . . . . . . . . . . . . . . 19
3.2 Prior art . . . . . . . . . . . . . . . . . . . . . . . . . . . . . . . . . . . . . . . 21
3.2.1 Perforated caissons . . . . . . . . . . . . . . . . . . . . . . . . . . . . . 22
3.2.2 Caisson with curved front wall . . . . . . . . . . . . . . . . . . . . . . 23
iv
Contents v
3.2.3 Caisson with cilindrical chamber . . . . . . . . . . . . . . . . . . . . . 24
3.2.4 Casisson with stone filled chamber . . . . . . . . . . . . . . . . . . . . 25
3.2.5 Other typologies . . . . . . . . . . . . . . . . . . . . . . . . . . . . . . 25
3.2.5.1 Wave chambers with perforated bottom . . . . . . . . . . . . 25
3.2.5.2 Sloping-wall caissons . . . . . . . . . . . . . . . . . . . . . . . 26
3.2.5.3 Perforated screens . . . . . . . . . . . . . . . . . . . . . . . . 27
3.2.5.4 Piles . . . . . . . . . . . . . . . . . . . . . . . . . . . . . . . . 27
3.2.5.5 Cribwork . . . . . . . . . . . . . . . . . . . . . . . . . . . . . 27
3.2.5.6 Prefabricated pieces . . . . . . . . . . . . . . . . . . . . . . . 28
4 The theoretical model 34
4.1 Introduction . . . . . . . . . . . . . . . . . . . . . . . . . . . . . . . . . . . . . 34
4.2 Parameters of a perforated breakwater . . . . . . . . . . . . . . . . . . . . . . 34
4.3 The model of Fugazza and Natale (1992) . . . . . . . . . . . . . . . . . . . . . 36
5 Experiments 40
5.1 Introduction . . . . . . . . . . . . . . . . . . . . . . . . . . . . . . . . . . . . . 40
5.2 The experimental setup . . . . . . . . . . . . . . . . . . . . . . . . . . . . . . 41
5.2.1 Description of the test equipment of the Laboratory of Ports and Coasts(LPC) . . . . . . . . . . . . . . . . . . . . . . . . . . . . . . . . . . . . 41
5.2.1.1 The wave flume . . . . . . . . . . . . . . . . . . . . . . . . . 41
5.2.1.2 The wave generation system . . . . . . . . . . . . . . . . . . 41
5.2.1.3 The wave measurement . . . . . . . . . . . . . . . . . . . . . 44
5.2.1.4 The control room . . . . . . . . . . . . . . . . . . . . . . . . 45
5.2.2 Construction of the model . . . . . . . . . . . . . . . . . . . . . . . . . 45
5.2.3 The MUCAR experiments . . . . . . . . . . . . . . . . . . . . . . . . . 46
5.2.3.1 Regular tests . . . . . . . . . . . . . . . . . . . . . . . . . . . 48
5.2.3.2 Irregular tests . . . . . . . . . . . . . . . . . . . . . . . . . . 49
5.3 Process to analyze the data . . . . . . . . . . . . . . . . . . . . . . . . . . . . 51
5.3.1 Separating the incident and reflected waves . . . . . . . . . . . . . . . 51
5.3.2 Analysis of the wave recordings . . . . . . . . . . . . . . . . . . . . . . 53
6 Results of the experiments & comparison with the theory 55
6.1 Preliminary analysis . . . . . . . . . . . . . . . . . . . . . . . . . . . . . . . . 55
6.2 Analysis of the results . . . . . . . . . . . . . . . . . . . . . . . . . . . . . . . 57
6.2.1 Regular tests . . . . . . . . . . . . . . . . . . . . . . . . . . . . . . . . 58
Contents vi
6.2.2 Irregular tests . . . . . . . . . . . . . . . . . . . . . . . . . . . . . . . . 59
6.3 Comparison with the results of existing models . . . . . . . . . . . . . . . . . 60
6.3.1 The Model of Fugazza and Natale (1992) . . . . . . . . . . . . . . . . 60
6.3.2 The antireflective GMAR modular elements . . . . . . . . . . . . . . . 62
7 Conclusions 64
A Nomenclature of the MUCAR experiments 66
B Example of a test report 69
C Solution of the Linearized Wave Problem 72
Bibliography 76
List of Figures 79
List of Tables 82
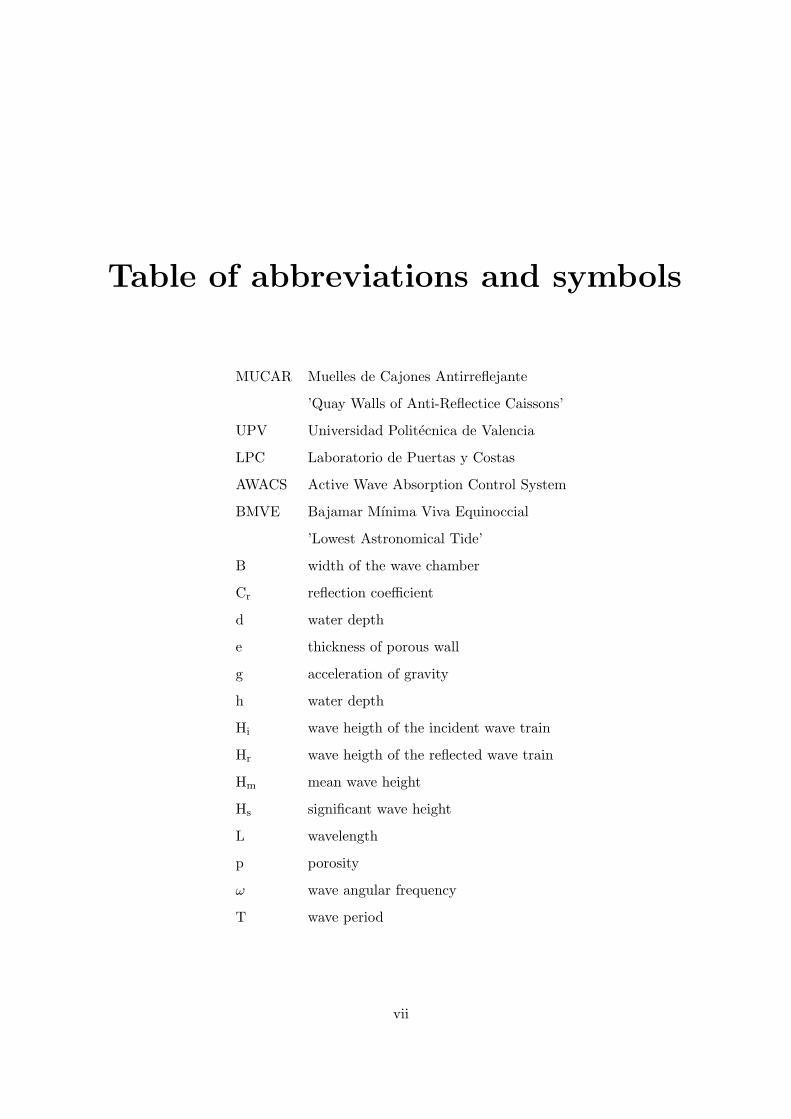
Table of abbreviations and symbols
MUCAR Muelles de Cajones Antirreflejante
’Quay Walls of Anti-Reflectice Caissons’
UPV Universidad Politecnica de Valencia
LPC Laboratorio de Puertas y Costas
AWACS Active Wave Absorption Control System
BMVE Bajamar Mınima Viva Equinoccial
’Lowest Astronomical Tide’
B width of the wave chamber
Cr reflection coefficient
d water depth
e thickness of porous wall
g acceleration of gravity
h water depth
Hi wave heigth of the incident wave train
Hr wave heigth of the reflected wave train
Hm mean wave height
Hs significant wave height
L wavelength
p porosity
ω wave angular frequency
T wave period
vii
Chapter 1
Introduction
For centuries the loading and unloading operations of ships were done in harbours which were
located on places were there was natural shelter. However, the growing need of port areas
and the shortage of natural locations led to construction of artificial seaward areas which are
protected by breakwaters. These coastal structures are designed mainly to provide protection
by reflection and/or dissipation of wave energy.
Until a few years ago the most common used breakwaters for sheltering harbours were rubble
mound breakwaters. They have as main objective to break the waves against a rough slope
of quarry stone or special shaped armour units and use the voids in the structure to dissipate
the wave energy. These breakwaters are the most easy to construct, making them above
all suitable for locations with little depth, intensive waves and heterogeneous seabed of low
quality.
Though during the last two decades there is an important development in international trade
and ship transport which reflects on the requirements of the harbours. More and more
there is a demand to expand existing ports or to make them more profound. The material
required for rubble mound breakwaters increase quadratic with depth. Therefore the cost
and the environmental problems related with the construction process increase dramatically
with water depth.
1
Chapter 1. Introduction 2
All this adjusted to a big boom in the construction of caisson vertical breakwaters and quay
walls. They act as a proper alternative for the protection at great depths and in general,
caisson-type breakwaters may improve hydraulic performance, total costs, quality control,
environmental aspects, construction time and maintenance.
These vertical breakwaters offer to the waves an impermeable face that reflects a great part
of the incoming energy. This high reflectivity can introduce some important drawbacks. The
interaction of incident and reflected waves may lead to steep and unstable waves which makes
it more difficult for vessels to moor and manoeuvre into the harbour. The reflected waves
may also propagate into the sheltered area creating problems for moored vessels or during
cargo operations. Additional problems are the increase of overtopping, bigger forces on the
structure, local erosion, the effects on littoral drift and enhancement of resonant episodes due
to the long wave energy trapped inside the harbour.
As a consequence various vertical breakwaters and quay walls are developed with low reflec-
tivity in order to reduce these drawbacks. The first well-documented innovation is attributed
by Jarlan (1961) who introduced the idea of a perforated front wall and an energy-dissipating
chamber with an impermeable back wall. Based on a similar idea, several structures to reduce
wave reflections have been proposed and tested. They mainly exists of hollow chambers in
which the water can enter through holes in the faces.
The research and development project MUCAR (Spanish acronym for ”Muelles de Cajones
Antirreflejantes” -” Quay walls of anti-reflective caissons”) has as purpose to develop a new
caisson for antireflective quay walls that overcomes the limitations of the vertical quay walls.
Therefore research is done in the Laboratory of Ports and Coasts (LPC) at the Universidad
Politecnica de Valencia (UPV). The reflection behaviour of 2 breakwater model sections of
the Jarlan-type is tested in the wave flume for different wave and sea conditions.
For this final year project, tests were carried out within the framework of the MUCAR
project. In Chapter 2 a description of this project is given. Chapter 3 contains an overview
of the empirical, theoretical and numerical models that are relevant for this project and
also the most widespread types of the absorbing-type vertical breakwaters and quay walls.
Chapter 1. Introduction 3
Chapter 4 describes the simplified theoretical model that is used for the comparison with the
experimental data. In Chapter 5 both the experimental setup and the procedure to analyze
the data is described. Chapter 6 contains the results of the tests and a comparison with the
simplified model described in chapter 4. Finally, conclusions of the realized work are given in
chapter 7.
Chapter 2
The MUCAR Project
2.1 Objectives of the project
The research and development project MUCAR has as purpose to reduce the reflection from
quay walls of commercial ports and this for quays that are constructed with floating caissons.
It is desirable to do this without altering significantly the procedures, the time and the cost
of the manufacturing of conventional caissons.
The convenience of reducing the reflections is very clear for quay walls, not only for the
environmental benefits but also for its operativeness. Still the existing solutions are clearly
deficient. Basically the existing solutions for anti-reflective caissons can be classified into
two groups. First there are the ’theoretical’ solutions that are based on patents or specific
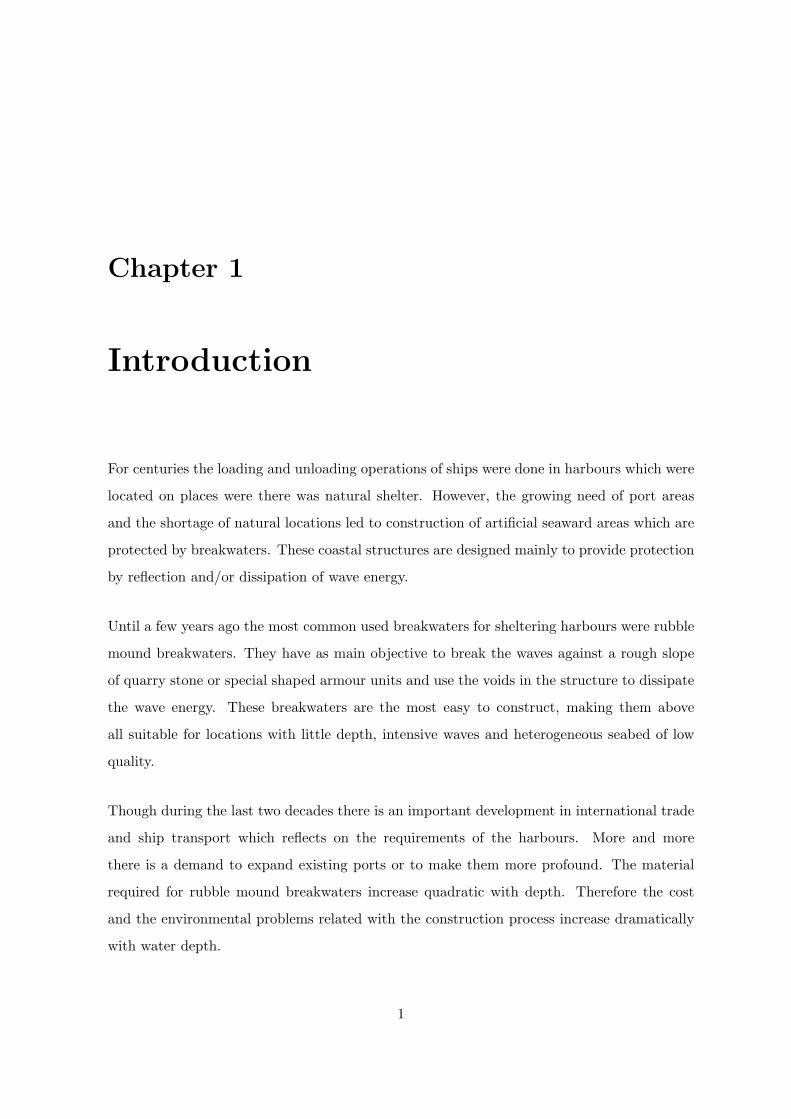
designs and that are very difficult and/or expensive to apply in practice. Secondly there are
the ’practical’ solutions that are based on cutting windows in the cells of already existing
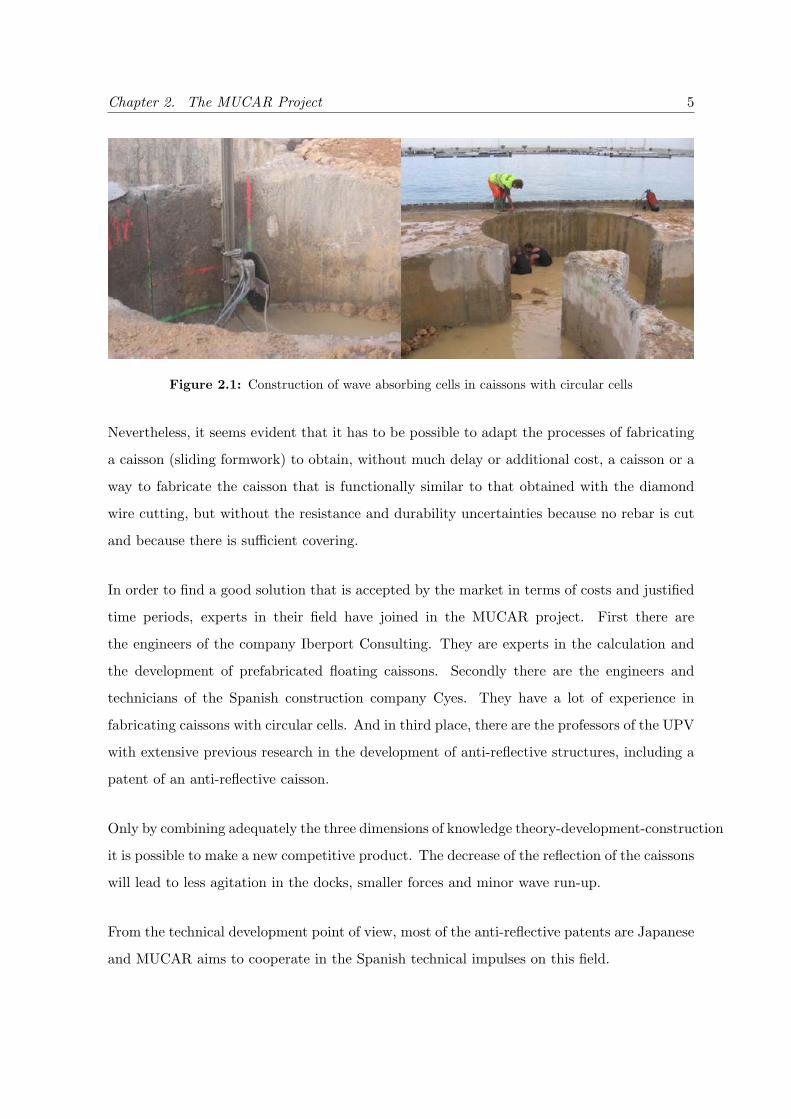
caissons. This is done with the use of diamond wire cutting machines (see Figure 2.1).
This cutting involves delays, bigger costs and serious disadvantages arising from the lack of
control of the durability, resistance and rebar corrosions. But in spite of this, the market real-
ity is that the specific designs are less used on the Spanish market because of the constructive
difficulty and the bigger cost they generate.
4
Chapter 2. The MUCAR Project 5
Figure 2.1: Construction of wave absorbing cells in caissons with circular cells
Nevertheless, it seems evident that it has to be possible to adapt the processes of fabricating
a caisson (sliding formwork) to obtain, without much delay or additional cost, a caisson or a
way to fabricate the caisson that is functionally similar to that obtained with the diamond
wire cutting, but without the resistance and durability uncertainties because no rebar is cut
and because there is sufficient covering.
In order to find a good solution that is accepted by the market in terms of costs and justified
time periods, experts in their field have joined in the MUCAR project. First there are
the engineers of the company Iberport Consulting. They are experts in the calculation and
the development of prefabricated floating caissons. Secondly there are the engineers and
technicians of the Spanish construction company Cyes. They have a lot of experience in
fabricating caissons with circular cells. And in third place, there are the professors of the UPV
with extensive previous research in the development of anti-reflective structures, including a
patent of an anti-reflective caisson.
Only by combining adequately the three dimensions of knowledge theory-development-construction
it is possible to make a new competitive product. The decrease of the reflection of the caissons
will lead to less agitation in the docks, smaller forces and minor wave run-up.
From the technical development point of view, most of the anti-reflective patents are Japanese
and MUCAR aims to cooperate in the Spanish technical impulses on this field.
Chapter 2. The MUCAR Project 6
2.2 The experiments in the LPC
For the MUCAR project the investigation team of the LPC, in which I was enrolled for my
final year project, provides the scientific assistance in the development of the new caisson for
Cyes and carries out the basic 2D physical experiments that allow to evaluate the reflectivity
of the new caisson and its basic design factors.
The 2D physical experiments are done in the wave flume of the laboratory and are directed
by professor Josep Ramon Medina Folgado, with the participation of professor Jose Alberto
Gonzalez Escriva. Two different sections, with two different connections between the cells
and 2 distinct internal depths for each section, are tested. The tests have to determinate the
reflectivity of each section with respect to its anti-reflective capacity, the run-up characteristics
with respect to the operative waterline and the pressures and subpressures with respect to
the stability. In this dissertation the focus goes only to the first objective.
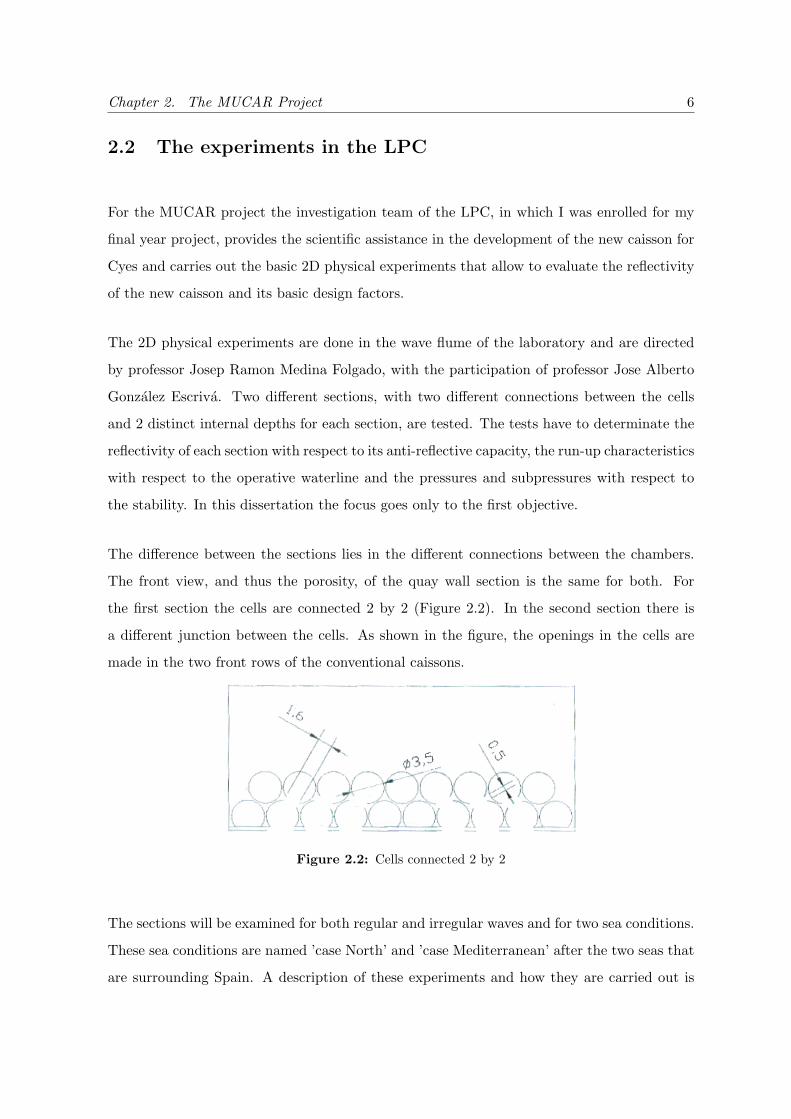
The difference between the sections lies in the different connections between the chambers.
The front view, and thus the porosity, of the quay wall section is the same for both. For
the first section the cells are connected 2 by 2 (Figure 2.2). In the second section there is
a different junction between the cells. As shown in the figure, the openings in the cells are
made in the two front rows of the conventional caissons.
Figure 2.2: Cells connected 2 by 2
The sections will be examined for both regular and irregular waves and for two sea conditions.
These sea conditions are named ’case North’ and ’case Mediterranean’ after the two seas that
are surrounding Spain. A description of these experiments and how they are carried out is

Chapter 2. The MUCAR Project 7
given in Chapter 5.
Chapter 3
State of the art
3.1 State of the art
3.1.1 General considerations
Maritime anti-reflective structures are based on the principle of energy dissipating chambers
with perforated walls. The incoming waves partially reflect on the first front wall and partially
transmit through one or more chambers of the caisson to be reflected with a phase difference
further inside the caisson. These waves interfere with the ones first reflected on the front
facing. The energy dissipation follows from the viscosity of the flow as it passes through the
perforations of the wall and from the interference between the waves.
In the case of one chamber, these losses depend mainly on the wave periods and on the
distance (B) between the perforated front wall and the back wall. The maximum energy
loss occurs when the velocity induced by the waves against the wall reaches its maximum
on the perforated wall. This will happen when the width of the chamber is approximately
one quarter of the wavelength (L) inside the chamber (B≈L/4). On the contrary, when the
velocity is small, the loss of energy is low and the single chamber is not very efficient (B≈L/2).
Therefore, there exist optimal dimensions for the perforated wall and for the chamber to reach
a minimum reflection.
8
Chapter 3. State of the art 9
On the other hand, there is a dissipation of energy inside the chamber due to other factors
such as the interaction of the water jets, coming from the openings in the perforated wall,
with the water stored in the chamber and the turbulences that appear with it. Furthermore,
the effect of the difference in depths between the interior and the outside of the chamber
could be considered as an additional cause of energy dissipation. All this, together with the
numerous variables that take part in the process, both geometrical variables as well as wave
characteristics, makes the study of the flow behaviour in this type of maritime structures very
complex.
Starting from the original idea presented by Jarlan (1961,1965) and the application in Canada
(Comeau Bay, 1966) and in Japan (Kobe Port, 1969 and Takamatsu Port, 1970), many
varieties have been realized over the years. Particularly in Japan (Takahashi, 1996), where
there have been constructed slit-caissons, caissons with multiple chambers, vertical, inclined
and curved ones. Or in Italy, where perforated breakwaters have been installed in Porto
Torres, Sardinia, Palermo and Sicily (Franco, 1994).
Among the most used we can distinguish the perforated-wall caissons for the construction
of vertical breakwaters, the structures formed by simple or multiple screens with variable
porosity and spacing, and the prefabricated pieces or blocks for quay walls. Typically, the
walls have vertical and horizontal grooves or circular or rectangular orifices. The porosity of
the wall, defined as the ratio between the perforated area and the total area of wall, usually
lies between 15-40%. The width of the chamber, B, usually lies between 1/10 and 1/4 of the
local wavelength or of the wavelength in the vicinity of the breakwater.
To sum up, there is a wide range of typologies of maritime anti-reflective structures and
the use of them continues to rise. Nevertheless, the knowledge with respect to its complex
hydrodynamic behaviour towards the design is limited, as well as the optimization of the
constructive processes. All this will be described in the next subsections regarding the ”state
of the art” and in the following section ”prior art”.
Chapter 3. State of the art 10
3.1.2 Models
A lot of empirical, analytical and numerical models have been developed to explain the com-
plex hydrodynamic phenomenon of wave absorption. In what is coming the most interesting
ones for the purpose of this project are considered.
3.1.2.1 Empirical models
The first important experimental study of anti-reflective breakwaters was done by Jarlan in
1961. He introduced the concept of energy dissipating chambers in the interior of caisson-type
structures. The problem of reflection against a perforated wall was part of a big research and
Jarlan applied the acoustic wave theory to examine the reflective properties of a perforated
wall breakwater. On scale 1:30 he tested a perforated wall caisson with a single chamber and
porosity 0.49. Among the conclusions of the research, he stressed that the design criteria
should be related to the following basic parameters:
the relationship between the width of the chamber and the wavelength
the thickness of the perforated wall (the length of the holes and diameter of the holes)
the relationship between the perforated and the not perforated surface
The results showed that for certain values of the wavelength, the decrease of the wave reflection
was significant.
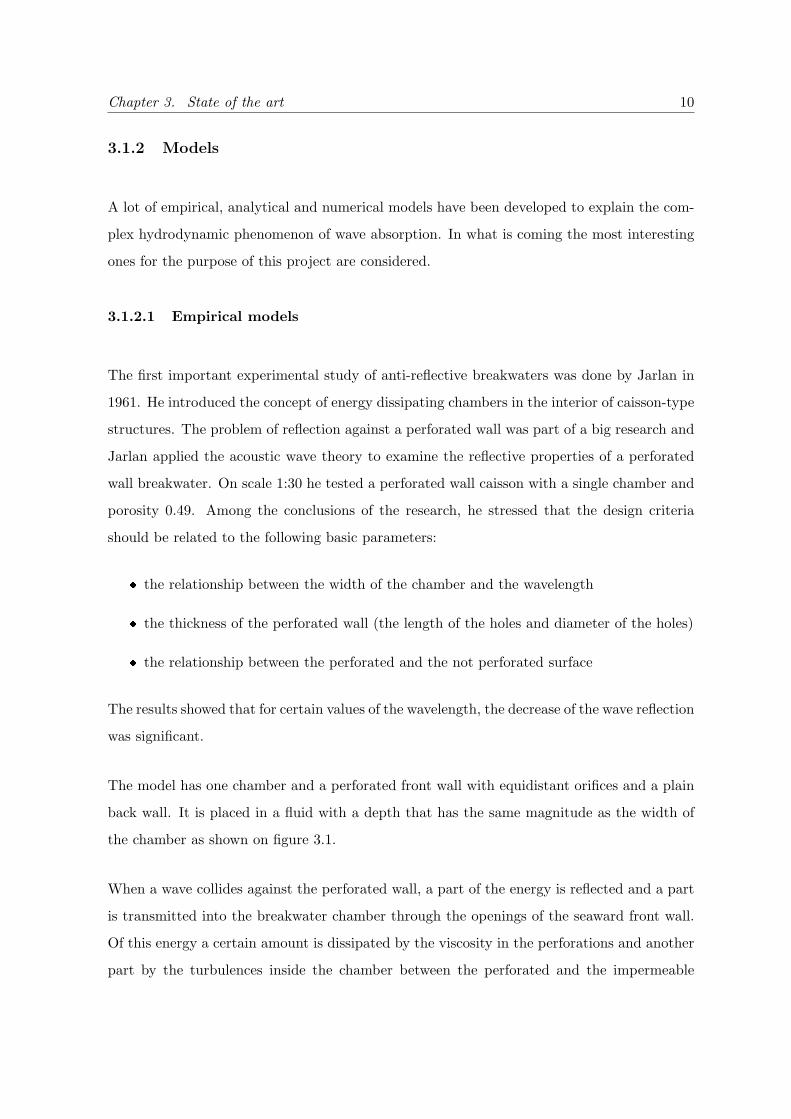
The model has one chamber and a perforated front wall with equidistant orifices and a plain
back wall. It is placed in a fluid with a depth that has the same magnitude as the width of
the chamber as shown on figure 3.1.
When a wave collides against the perforated wall, a part of the energy is reflected and a part
is transmitted into the breakwater chamber through the openings of the seaward front wall.
Of this energy a certain amount is dissipated by the viscosity in the perforations and another
part by the turbulences inside the chamber between the perforated and the impermeable
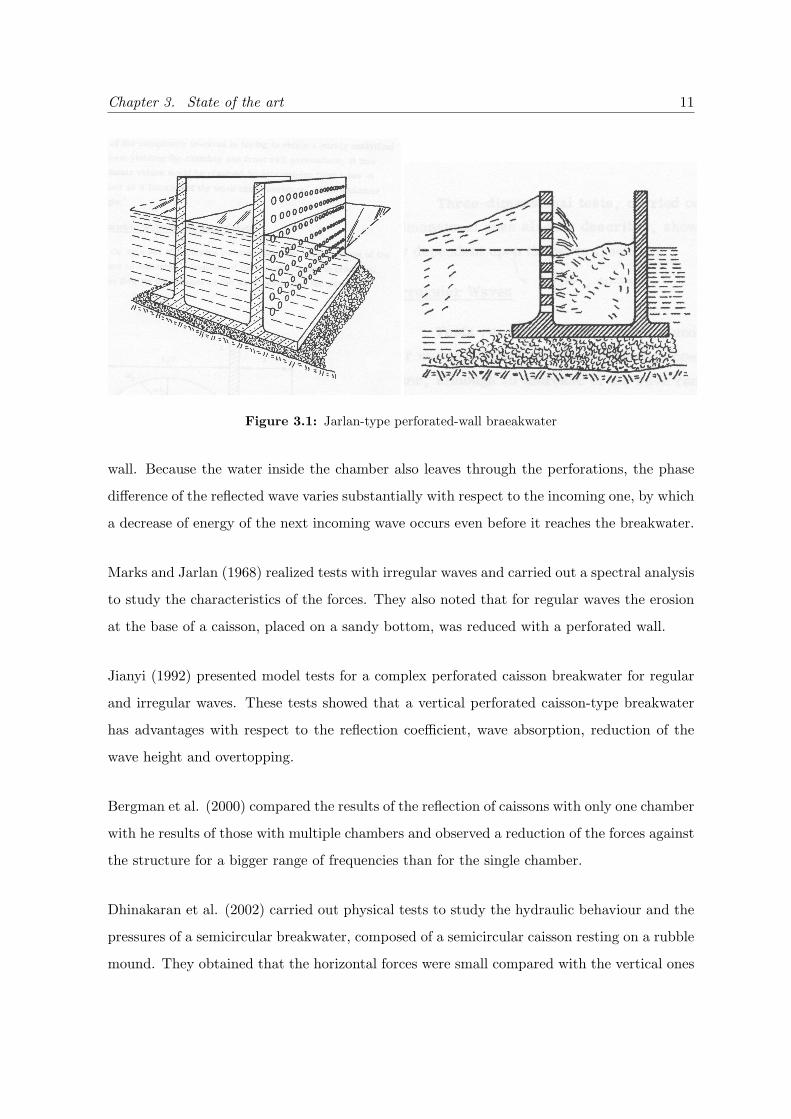
Chapter 3. State of the art 11
Figure 3.1: Jarlan-type perforated-wall braeakwater
wall. Because the water inside the chamber also leaves through the perforations, the phase
difference of the reflected wave varies substantially with respect to the incoming one, by which
a decrease of energy of the next incoming wave occurs even before it reaches the breakwater.
Marks and Jarlan (1968) realized tests with irregular waves and carried out a spectral analysis
to study the characteristics of the forces. They also noted that for regular waves the erosion
at the base of a caisson, placed on a sandy bottom, was reduced with a perforated wall.
Jianyi (1992) presented model tests for a complex perforated caisson breakwater for regular
and irregular waves. These tests showed that a vertical perforated caisson-type breakwater
has advantages with respect to the reflection coefficient, wave absorption, reduction of the
wave height and overtopping.
Bergman et al. (2000) compared the results of the reflection of caissons with only one chamber
with he results of those with multiple chambers and observed a reduction of the forces against
the structure for a bigger range of frequencies than for the single chamber.
Dhinakaran et al. (2002) carried out physical tests to study the hydraulic behaviour and the
pressures of a semicircular breakwater, composed of a semicircular caisson resting on a rubble
mound. They obtained that the horizontal forces were small compared with the vertical ones
Chapter 3. State of the art 12
and significantly reduced due to the curvature of the surface if compared to those against a
vertical breakwater.
Tabet-Aoul and Lambert (2003) realized tests within the European project PROVERBS
and proposed an empirical method for the calculation of maximum horizontal forces. They
formulated this method starting from the results of the tests and they controlled it with the
existing data in prototype.
Garrido and Medina (2006) and Garrido et al. (2005) presented the experimental results of the
reflection of waves by anti-reflective vertical breakwaters from the Jarlan-type with one, two
and three chambers, for perforated screens with both slots and orifices. These experiments
where done within the MUDIVAR project, developed by the research group of the LPC-UPV.
The obtained results for breakwaters with only one chamber showed reflection coefficients Cr¡
40% for ranges of relative width (B/L) between 0.1 and 0.3, similar like the ones obtained
during the PROVERBS project, and with porosity of the front wall between 20 and 40%.
The experimental results have been compared with the formula of Fugazza and Natale (1992)
showing a certain overestimation in the formula. This formula will be described in the next
subsection and in Chapter 4.
3.1.2.2 Theoretical models
Jarlan (1965) applied the acoustic theory to the wave reflection in maritime structures
Kondo (1979) presented an analytical approach to predict the reflection and the transmission
coefficients for permeable and impermeable breakwaters with two perforated walls. Kondo
concluded that the breakwater with two perforated walls could give a much lower reflection
coefficient than the ones having one perforated wall.
Hagiwara (1984) proposed a theoretical analysis to predict the reflection and transmission
coefficients of wave dissipating vertical structures using an integral equation derived for the
unknown components of the vertical velocity in the perforated wall. He also studied the
influence on the structural characteristics and on the waves of the dissipating capacity from
Chapter 3. State of the art 13
breakwaters that are permeable at both sides, land and sea.
Fugazza and Natale (1992) analyzed the wave attenuation produced by a permeable structure
and proposed a formula to optimize the hydraulic design of breakwaters of the Jarlan-type.
For a perforated-wall caisson lying on a flat sea bottom they showed that the reflection of
waves normally incident to the caisson is at its minimum when the wave chamber width is
about one quarter of the wave length. In contrast to the conclusion made by Kondo (1979),
Fugazza and Natale showed that the perforated-wall breakwater with a single wave chamber
could give the largest reduction of wave reflection in the range of practical applications.
Suh and Park (1995) introduced a numerical model, based on the Galerkin method, for the
calculation of the reflection coefficient of perforated caissons mounted on a rubble mound
foundation. The model is, in the first place, applied to the case of a caisson without a rubble
mound foundation, just lying on a flat sea bottom, and its results are identical at the ones
obtained with the formula of Fugazza and Natale (1992). This indicates that, independent of
the numerical tool used by Suh et al. (1995), the model is the same as the one proposed by
Fugazza and Natale (1992). The rubble mound foundation on which the caisson is mounted is
considered impermeable. This gives more security since it leaves aside the dissipative effects
of the passage of flow through it and only takes into account the steepness of the slope and
the height of the mound.
To compare the result obtained when considering the presence of the rubble mound foundation
with the result obtained by applying the formula of Fugazza and Natale, the incident height is
considered at the depth of the foundation, and from there the formula for linear wave shoaling
is used over the mound slope towards its bottom. Except for very high mound with very mild
slope, the reflection coefficient calculated by Suh and Park (1995) is slightly higher than that
calculated by Fugazza and Natale (1992). In the practical range of mound heights and slope
values the difference between the two theories is negligible. Thus the formula developed by
Fugazza and Natale (1992) along with the linear shoaling analysis over the mound slope, could
be used for most practical situations if the waves are normally incident to the breakwater.
William et al. (2000) introduced a damping factor in the formulation of Fugazza and Natale
Chapter 3. State of the art 14
(1992) and proposed a simplified formulation for the calculation of the reflection coefficient
of an impermeable caisson breakwater with one or two perforated or slotted front faces.
Suh et al. (2006) described how to apply the analytical model developed by Suh and Park
(1995) on a partial perforated vertical breakwater and with irregular incoming waves. The
difference lies in considering the not perforated part of the caisson as a part of the rubble
mound foundation with a very steep slope. They tested several slopes until arriving at a
constant Cr for slopes starting from 2:1 of the ”fictitious” mound that represents the not
perforated part of the caisson wall.
Liu et al. (2007) examined the variation of the reflection coefficient for oblique incidence of
the waves against a partially perforated caisson of one chamber. They found that for angles
of incidence between π/6 and π/4 the reflection coefficients are lower than with perpendicular
incidence.
Of all the previous models, it can be said that the theoretical model of Fugazza and Natale
(1992) is the one that includes best the theoretical basics of our studied object until now.
Starting from this model, the other ones incorporate some improvements like the consideration
of damping inside the chamber as seen in the model of William et al. (2000), which on the
other hand proposes a simplification with respect to the one proposed by Fugazza. The
development of this model will be described in Chapter 4 as it is this model that we are using
to estimate a Cr for the comparison with the coefficient obtained from the experimental data.
3.1.2.3 Numerical models
The development of numerical models is recent for this field. Takahashi et al. (2002) were the
ones that started to use the numerical VOF (Volume Of Fluid) method to study the reflection
in a perforated caisson.
Kakuno et al. (2003) applied a design procedure based on the BIM (Boundary Integral
Method) method. Its objective was to achieve a reflection coefficient of 40% in a widespread
frequency range and for a double slit-wall design.
Chapter 3. State of the art 15
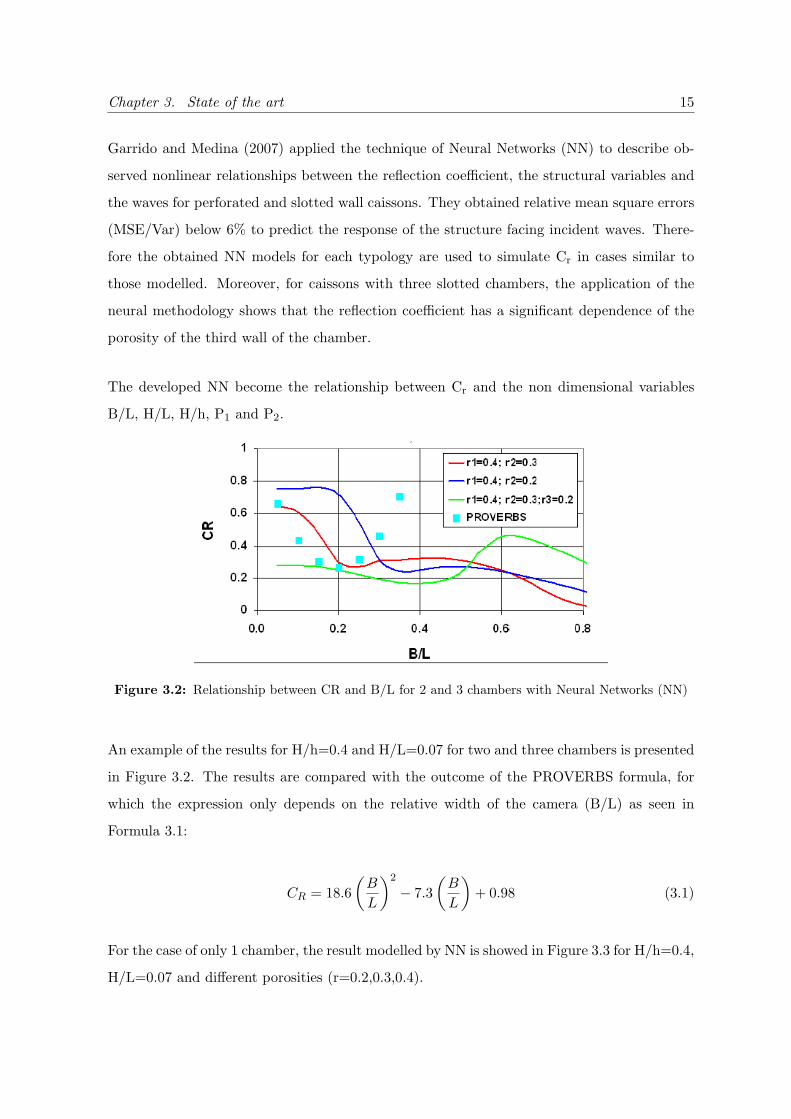
Garrido and Medina (2007) applied the technique of Neural Networks (NN) to describe ob-
served nonlinear relationships between the reflection coefficient, the structural variables and
the waves for perforated and slotted wall caissons. They obtained relative mean square errors
(MSE/Var) below 6% to predict the response of the structure facing incident waves. There-
fore the obtained NN models for each typology are used to simulate Cr in cases similar to
those modelled. Moreover, for caissons with three slotted chambers, the application of the
neural methodology shows that the reflection coefficient has a significant dependence of the
porosity of the third wall of the chamber.
The developed NN become the relationship between Cr and the non dimensional variables
B/L, H/L, H/h, P1 and P2.
Figure 3.2: Relationship between CR and B/L for 2 and 3 chambers with Neural Networks (NN)
An example of the results for H/h=0.4 and H/L=0.07 for two and three chambers is presented
in Figure 3.2. The results are compared with the outcome of the PROVERBS formula, for
which the expression only depends on the relative width of the camera (B/L) as seen in
Formula 3.1:
CR = 18.6(B
L
)2
− 7.3(B
L
)+ 0.98 (3.1)
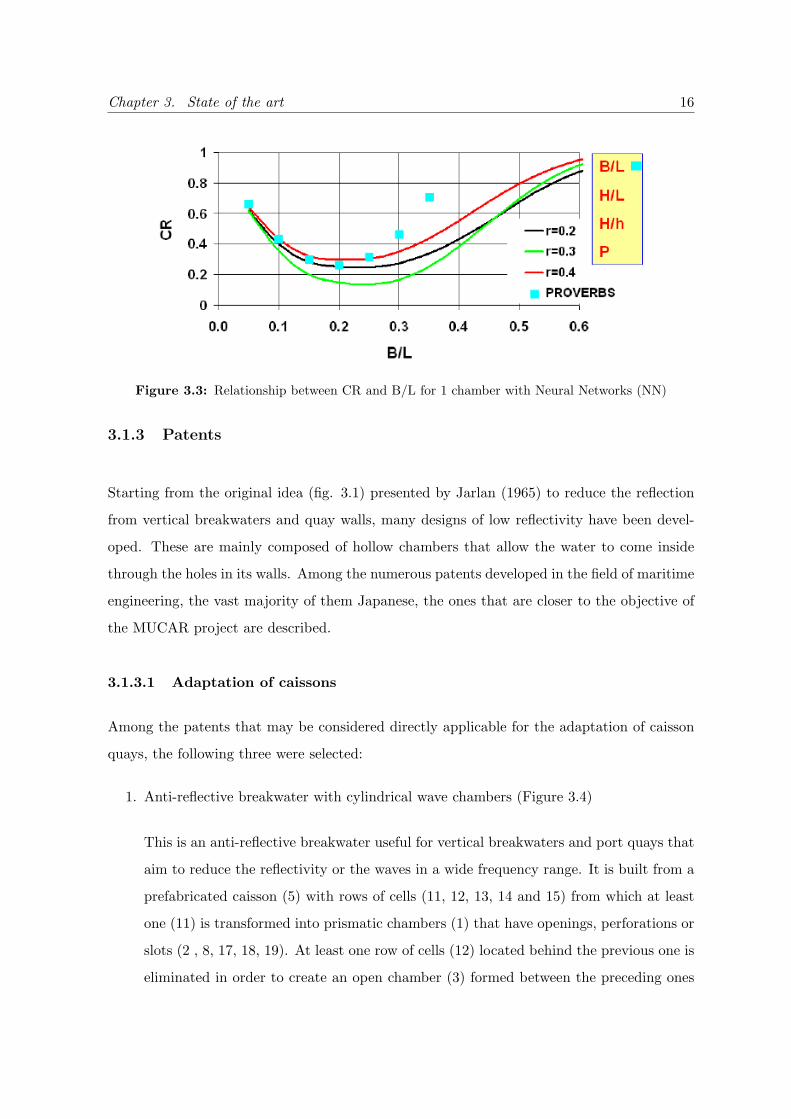
For the case of only 1 chamber, the result modelled by NN is showed in Figure 3.3 for H/h=0.4,
H/L=0.07 and different porosities (r=0.2,0.3,0.4).
Chapter 3. State of the art 16
Figure 3.3: Relationship between CR and B/L for 1 chamber with Neural Networks (NN)
3.1.3 Patents
Starting from the original idea (fig. 3.1) presented by Jarlan (1965) to reduce the reflection
from vertical breakwaters and quay walls, many designs of low reflectivity have been devel-
oped. These are mainly composed of hollow chambers that allow the water to come inside
through the holes in its walls. Among the numerous patents developed in the field of maritime
engineering, the vast majority of them Japanese, the ones that are closer to the objective of
the MUCAR project are described.
3.1.3.1 Adaptation of caissons
Among the patents that may be considered directly applicable for the adaptation of caisson
quays, the following three were selected:
1. Anti-reflective breakwater with cylindrical wave chambers (Figure 3.4)
This is an anti-reflective breakwater useful for vertical breakwaters and port quays that
aim to reduce the reflectivity or the waves in a wide frequency range. It is built from a
prefabricated caisson (5) with rows of cells (11, 12, 13, 14 and 15) from which at least
one (11) is transformed into prismatic chambers (1) that have openings, perforations or
slots (2 , 8, 17, 18, 19). At least one row of cells (12) located behind the previous one is
eliminated in order to create an open chamber (3) formed between the preceding ones
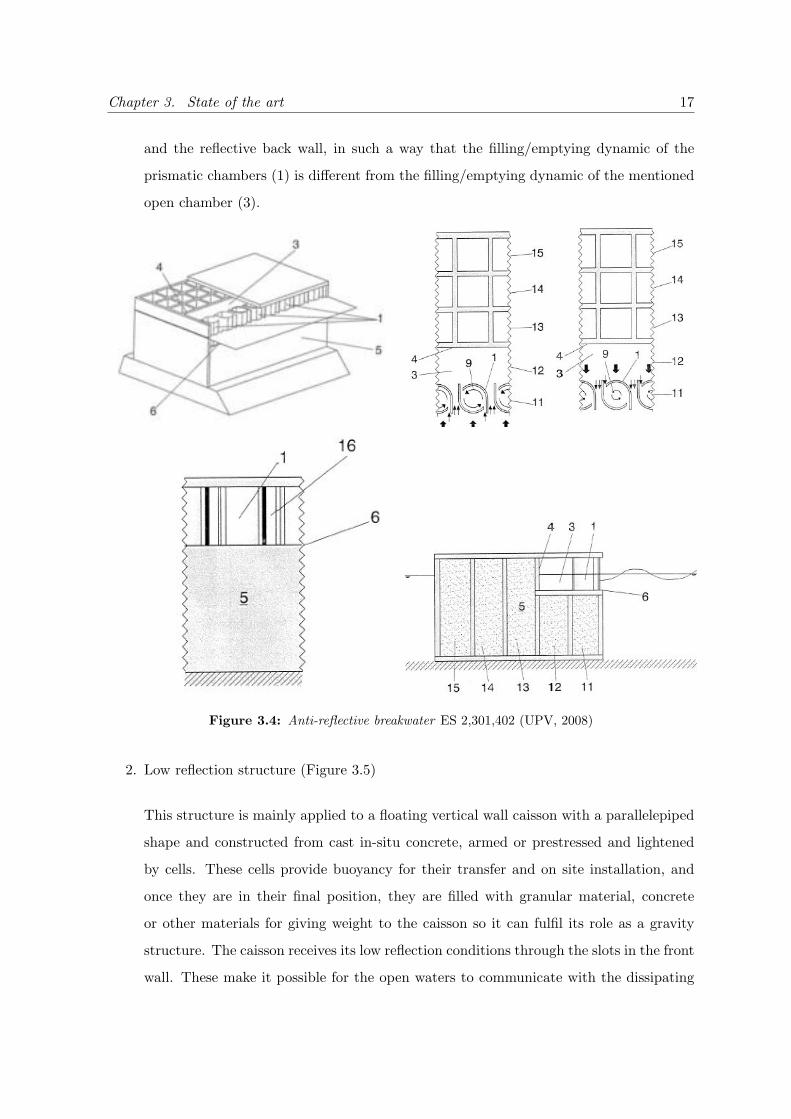
Chapter 3. State of the art 17
and the reflective back wall, in such a way that the filling/emptying dynamic of the
prismatic chambers (1) is different from the filling/emptying dynamic of the mentioned
open chamber (3).
Figure 3.4: Anti-reflective breakwater ES 2,301,402 (UPV, 2008)
2. Low reflection structure (Figure 3.5)
This structure is mainly applied to a floating vertical wall caisson with a parallelepiped
shape and constructed from cast in-situ concrete, armed or prestressed and lightened
by cells. These cells provide buoyancy for their transfer and on site installation, and
once they are in their final position, they are filled with granular material, concrete
or other materials for giving weight to the caisson so it can fulfil its role as a gravity
structure. The caisson receives its low reflection conditions through the slots in the front
wall. These make it possible for the open waters to communicate with the dissipating
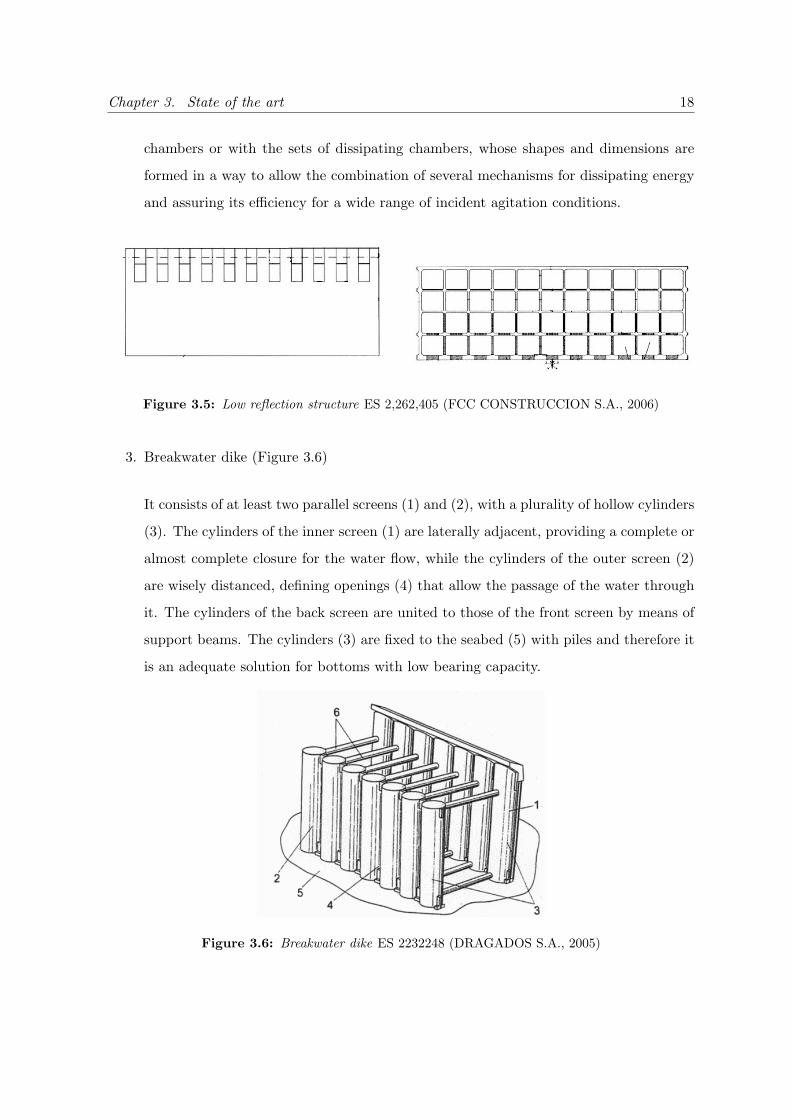
Chapter 3. State of the art 18
chambers or with the sets of dissipating chambers, whose shapes and dimensions are
formed in a way to allow the combination of several mechanisms for dissipating energy
and assuring its efficiency for a wide range of incident agitation conditions.
Figure 3.5: Low reflection structure ES 2,262,405 (FCC CONSTRUCCION S.A., 2006)
3. Breakwater dike (Figure 3.6)
It consists of at least two parallel screens (1) and (2), with a plurality of hollow cylinders
(3). The cylinders of the inner screen (1) are laterally adjacent, providing a complete or
almost complete closure for the water flow, while the cylinders of the outer screen (2)
are wisely distanced, defining openings (4) that allow the passage of the water through
it. The cylinders of the back screen are united to those of the front screen by means of
support beams. The cylinders (3) are fixed to the seabed (5) with piles and therefore it
is an adequate solution for bottoms with low bearing capacity.
Figure 3.6: Breakwater dike ES 2232248 (DRAGADOS S.A., 2005)
Chapter 3. State of the art 19
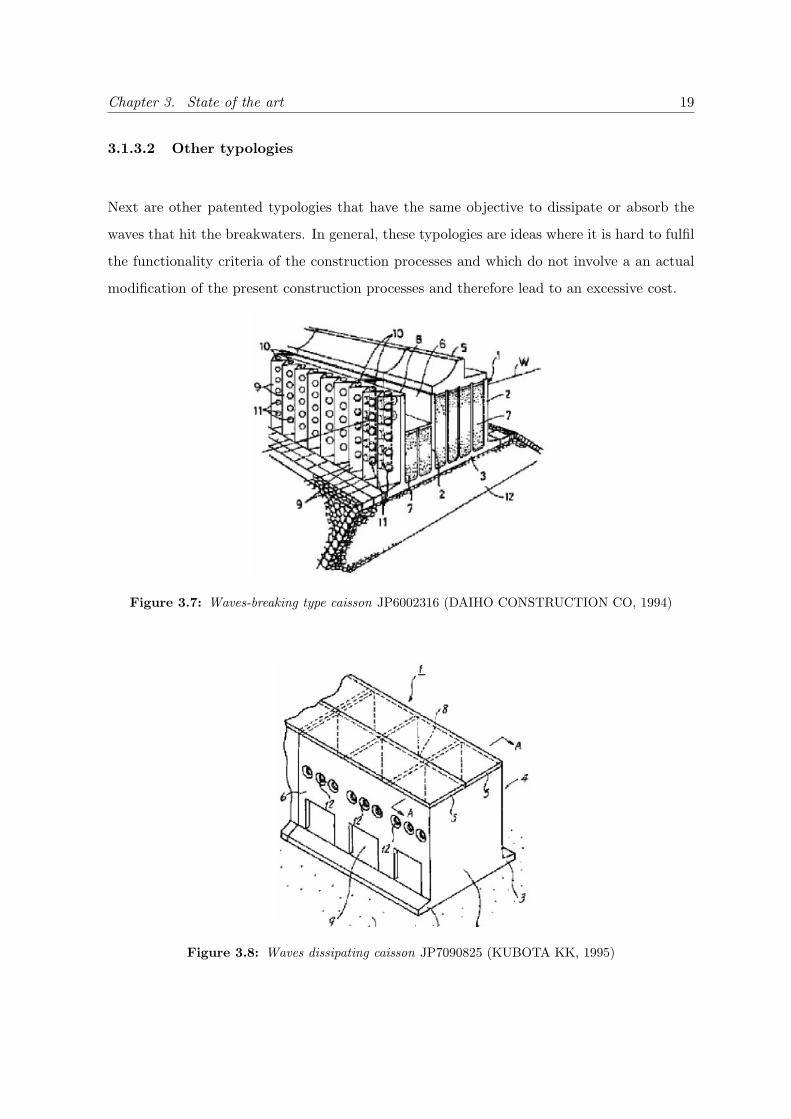
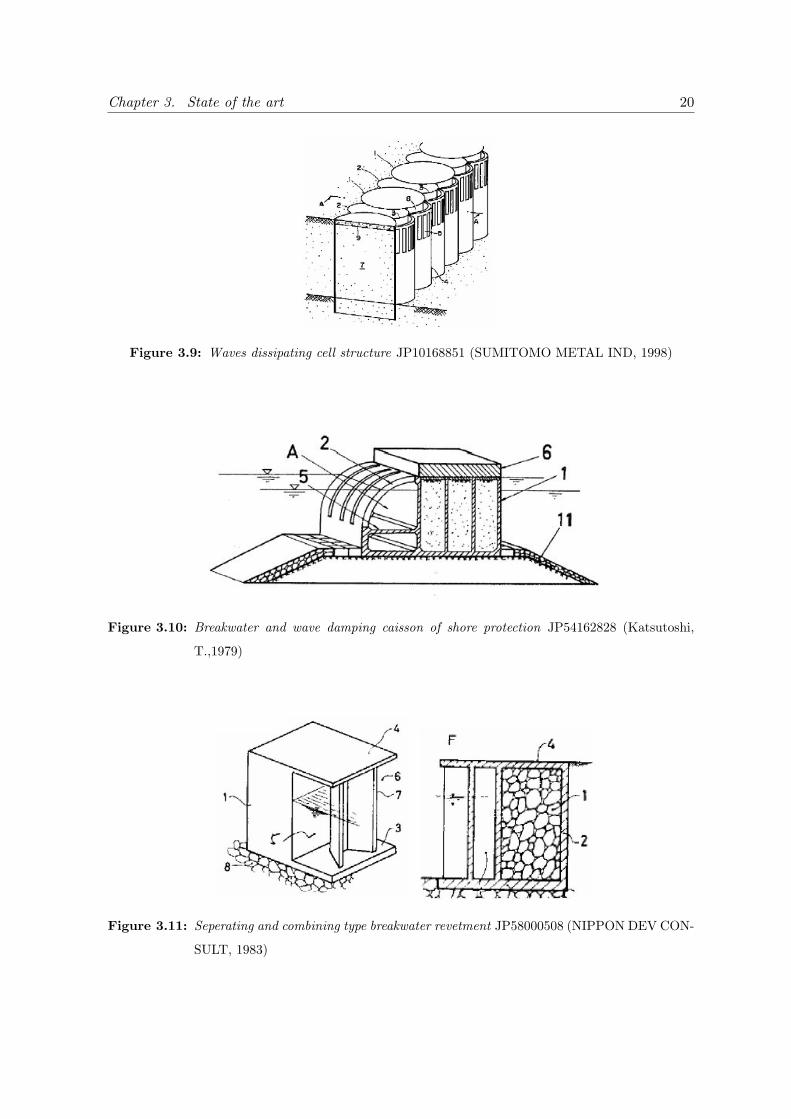
3.1.3.2 Other typologies
Next are other patented typologies that have the same objective to dissipate or absorb the
waves that hit the breakwaters. In general, these typologies are ideas where it is hard to fulfil
the functionality criteria of the construction processes and which do not involve a an actual
modification of the present construction processes and therefore lead to an excessive cost.
Figure 3.7: Waves-breaking type caisson JP6002316 (DAIHO CONSTRUCTION CO, 1994)
Figure 3.8: Waves dissipating caisson JP7090825 (KUBOTA KK, 1995)
Chapter 3. State of the art 20
Figure 3.9: Waves dissipating cell structure JP10168851 (SUMITOMO METAL IND, 1998)
Figure 3.10: Breakwater and wave damping caisson of shore protection JP54162828 (Katsutoshi,
T.,1979)
Figure 3.11: Seperating and combining type breakwater revetment JP58000508 (NIPPON DEV CON-
SULT, 1983)
Chapter 3. State of the art 21
3.2 Prior art
These kind of maritime structures are being built all over the world because of their high
energy absorbing capacity, the stability of the caissons, the reduction of the overtopping,
erosion and forces, and the resulting cost savings that come with it. Also in Spain, where I
was involved in the experiments for a new design, they have many experience with this kind
of work up to now.
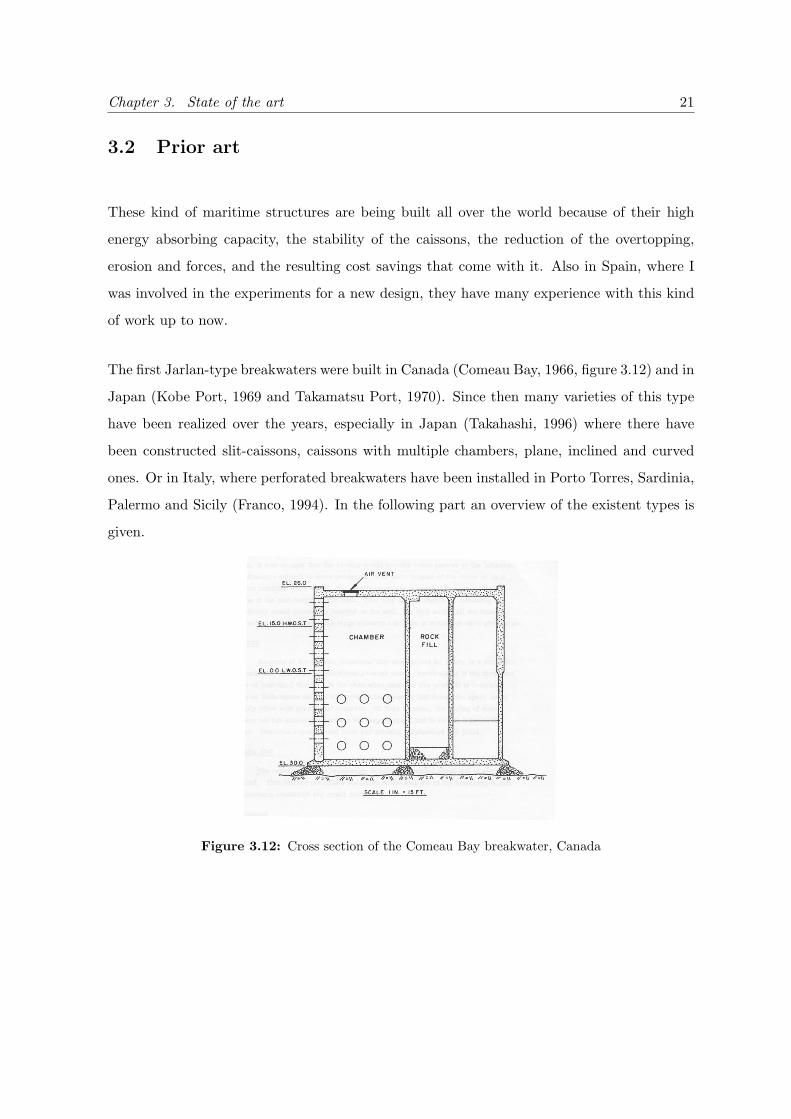
The first Jarlan-type breakwaters were built in Canada (Comeau Bay, 1966, figure 3.12) and in
Japan (Kobe Port, 1969 and Takamatsu Port, 1970). Since then many varieties of this type
have been realized over the years, especially in Japan (Takahashi, 1996) where there have
been constructed slit-caissons, caissons with multiple chambers, plane, inclined and curved
ones. Or in Italy, where perforated breakwaters have been installed in Porto Torres, Sardinia,
Palermo and Sicily (Franco, 1994). In the following part an overview of the existent types is
given.
Figure 3.12: Cross section of the Comeau Bay breakwater, Canada
Chapter 3. State of the art 22
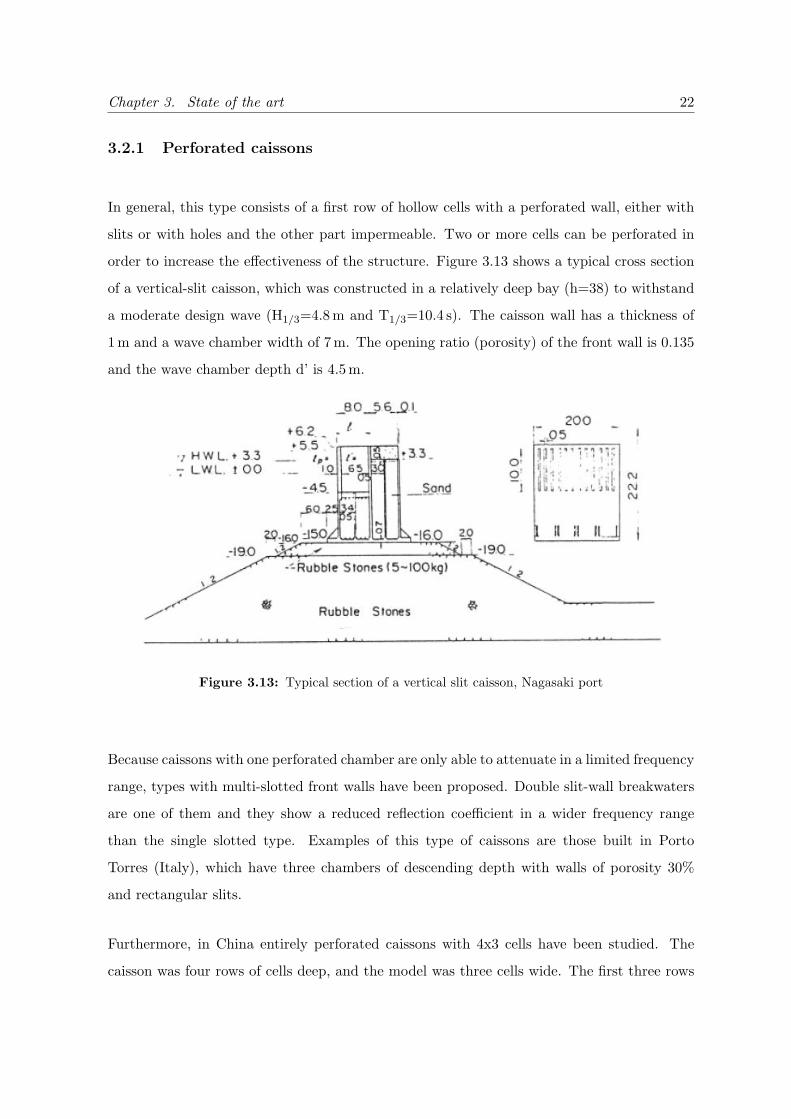
3.2.1 Perforated caissons
In general, this type consists of a first row of hollow cells with a perforated wall, either with
slits or with holes and the other part impermeable. Two or more cells can be perforated in
order to increase the effectiveness of the structure. Figure 3.13 shows a typical cross section
of a vertical-slit caisson, which was constructed in a relatively deep bay (h=38) to withstand
a moderate design wave (H1/3=4.8 m and T1/3=10.4 s). The caisson wall has a thickness of
1 m and a wave chamber width of 7 m. The opening ratio (porosity) of the front wall is 0.135
and the wave chamber depth d’ is 4.5 m.
Figure 3.13: Typical section of a vertical slit caisson, Nagasaki port
Because caissons with one perforated chamber are only able to attenuate in a limited frequency
range, types with multi-slotted front walls have been proposed. Double slit-wall breakwaters
are one of them and they show a reduced reflection coefficient in a wider frequency range
than the single slotted type. Examples of this type of caissons are those built in Porto
Torres (Italy), which have three chambers of descending depth with walls of porosity 30%
and rectangular slits.
Furthermore, in China entirely perforated caissons with 4x3 cells have been studied. The
caisson was four rows of cells deep, and the model was three cells wide. The first three rows
Chapter 3. State of the art 23
were transversely interconnected with rectangular windows and the final chamber was sealed.
Reflections from the perforated caisson were given by Cr between 0.2 and 0.55, increasing
with wave steepness (Jianjy, 1992).
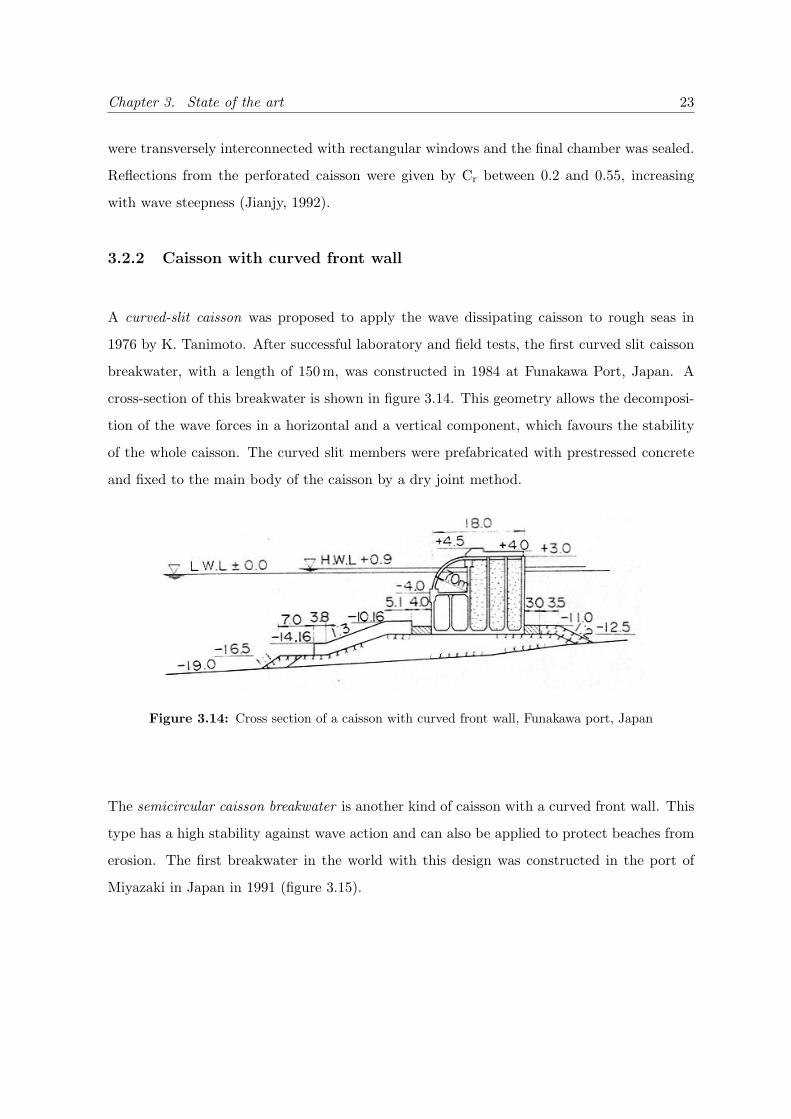
3.2.2 Caisson with curved front wall
A curved-slit caisson was proposed to apply the wave dissipating caisson to rough seas in
1976 by K. Tanimoto. After successful laboratory and field tests, the first curved slit caisson
breakwater, with a length of 150 m, was constructed in 1984 at Funakawa Port, Japan. A
cross-section of this breakwater is shown in figure 3.14. This geometry allows the decomposi-
tion of the wave forces in a horizontal and a vertical component, which favours the stability
of the whole caisson. The curved slit members were prefabricated with prestressed concrete
and fixed to the main body of the caisson by a dry joint method.
Figure 3.14: Cross section of a caisson with curved front wall, Funakawa port, Japan
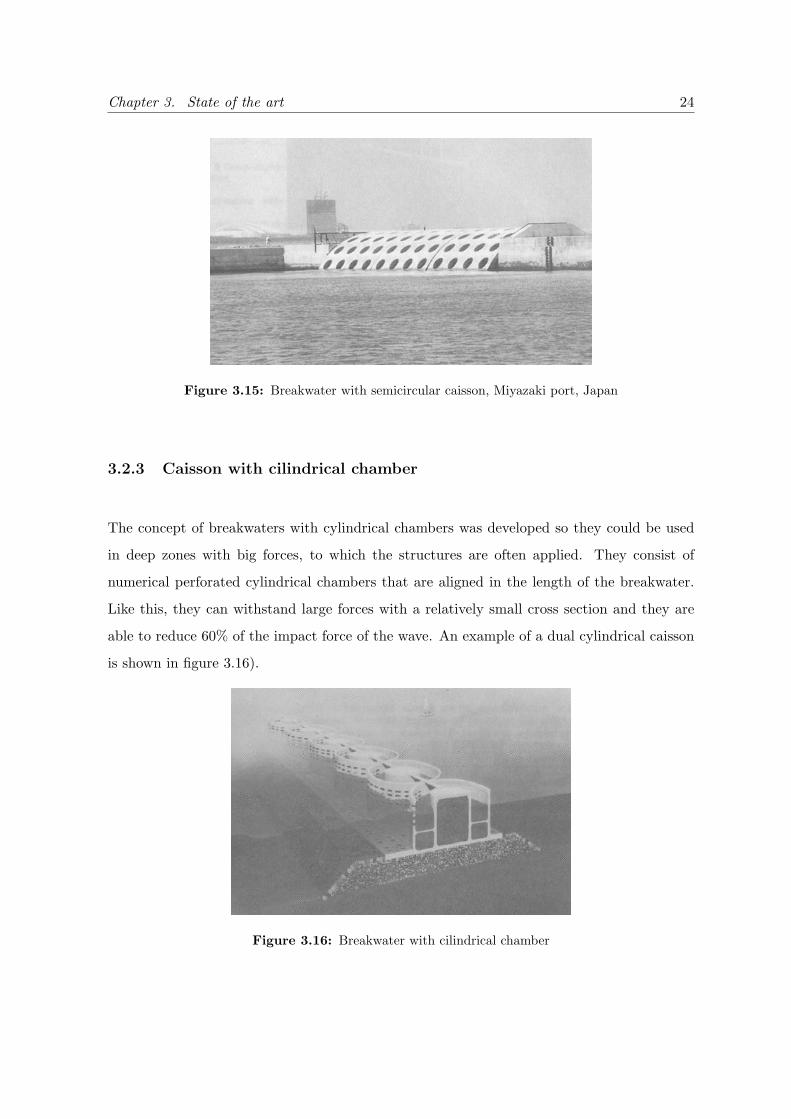
The semicircular caisson breakwater is another kind of caisson with a curved front wall. This
type has a high stability against wave action and can also be applied to protect beaches from
erosion. The first breakwater in the world with this design was constructed in the port of
Miyazaki in Japan in 1991 (figure 3.15).
Chapter 3. State of the art 24
Figure 3.15: Breakwater with semicircular caisson, Miyazaki port, Japan
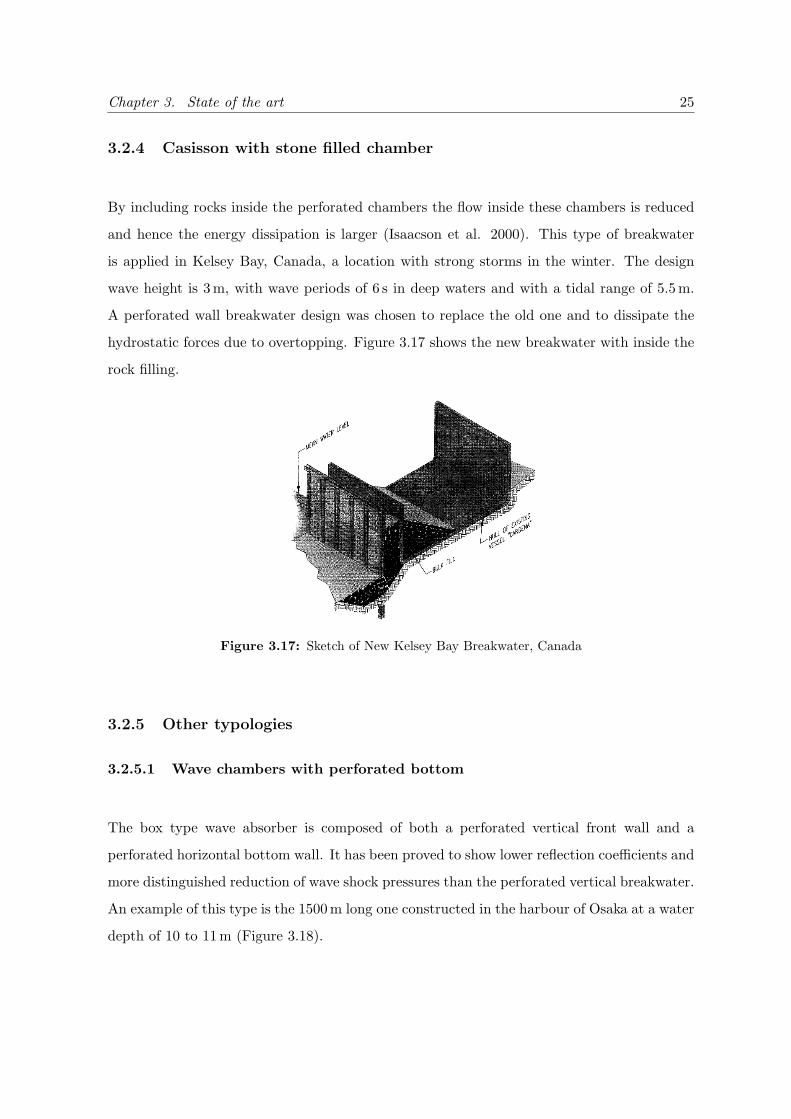
3.2.3 Caisson with cilindrical chamber
The concept of breakwaters with cylindrical chambers was developed so they could be used
in deep zones with big forces, to which the structures are often applied. They consist of
numerical perforated cylindrical chambers that are aligned in the length of the breakwater.
Like this, they can withstand large forces with a relatively small cross section and they are
able to reduce 60% of the impact force of the wave. An example of a dual cylindrical caisson
is shown in figure 3.16).
Figure 3.16: Breakwater with cilindrical chamber
Chapter 3. State of the art 25
3.2.4 Casisson with stone filled chamber
By including rocks inside the perforated chambers the flow inside these chambers is reduced
and hence the energy dissipation is larger (Isaacson et al. 2000). This type of breakwater
is applied in Kelsey Bay, Canada, a location with strong storms in the winter. The design
wave height is 3 m, with wave periods of 6 s in deep waters and with a tidal range of 5.5 m.
A perforated wall breakwater design was chosen to replace the old one and to dissipate the
hydrostatic forces due to overtopping. Figure 3.17 shows the new breakwater with inside the
rock filling.
Figure 3.17: Sketch of New Kelsey Bay Breakwater, Canada
3.2.5 Other typologies
3.2.5.1 Wave chambers with perforated bottom
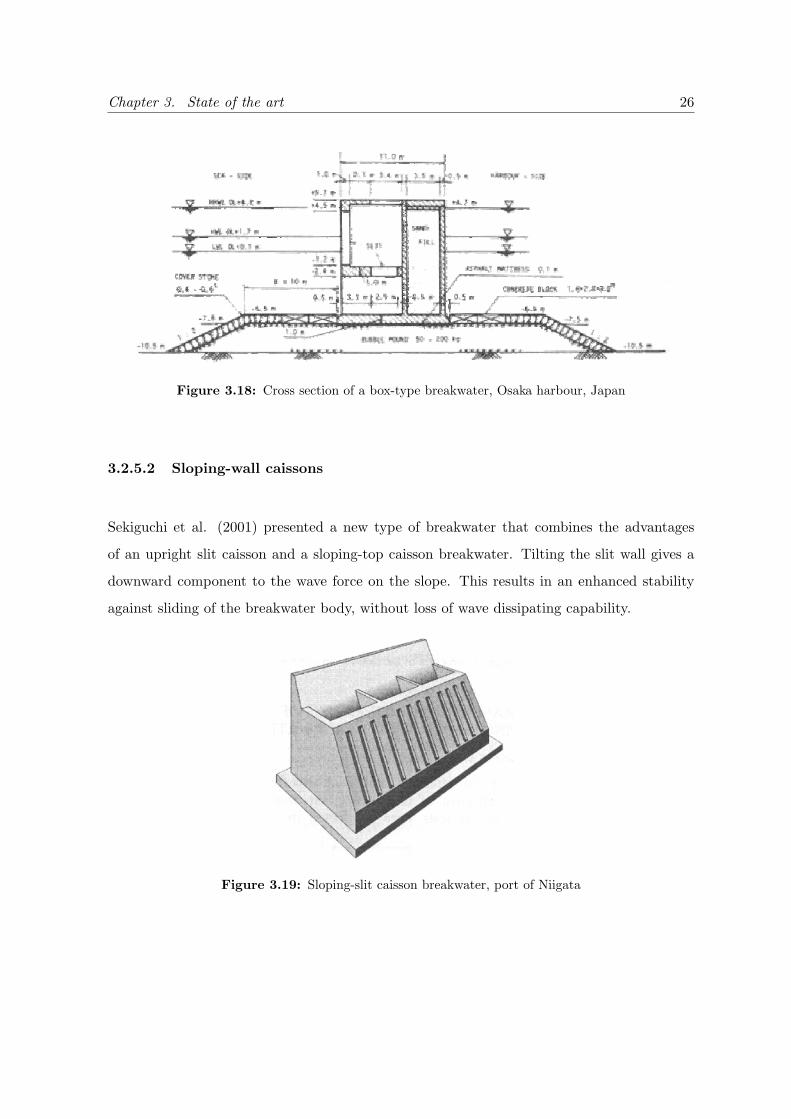
The box type wave absorber is composed of both a perforated vertical front wall and a
perforated horizontal bottom wall. It has been proved to show lower reflection coefficients and
more distinguished reduction of wave shock pressures than the perforated vertical breakwater.
An example of this type is the 1500 m long one constructed in the harbour of Osaka at a water
depth of 10 to 11 m (Figure 3.18).
Chapter 3. State of the art 26
Figure 3.18: Cross section of a box-type breakwater, Osaka harbour, Japan
3.2.5.2 Sloping-wall caissons
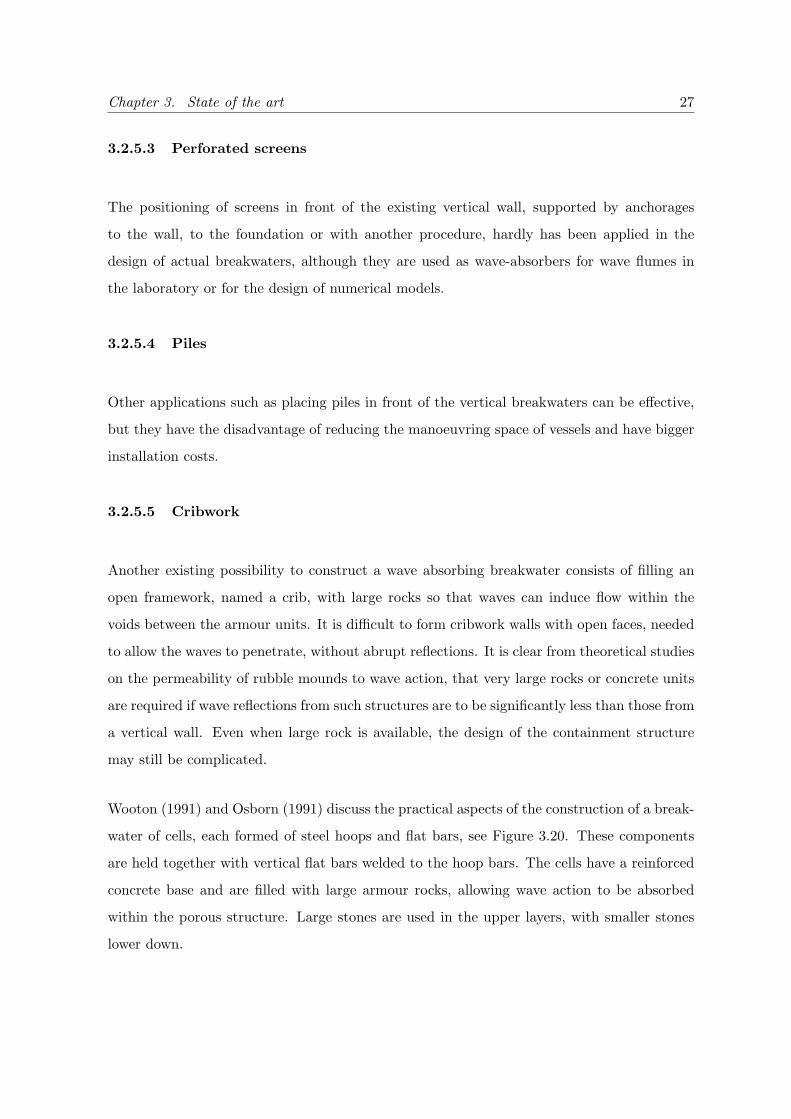
Sekiguchi et al. (2001) presented a new type of breakwater that combines the advantages
of an upright slit caisson and a sloping-top caisson breakwater. Tilting the slit wall gives a
downward component to the wave force on the slope. This results in an enhanced stability
against sliding of the breakwater body, without loss of wave dissipating capability.
Figure 3.19: Sloping-slit caisson breakwater, port of Niigata
Chapter 3. State of the art 27
3.2.5.3 Perforated screens
The positioning of screens in front of the existing vertical wall, supported by anchorages
to the wall, to the foundation or with another procedure, hardly has been applied in the
design of actual breakwaters, although they are used as wave-absorbers for wave flumes in
the laboratory or for the design of numerical models.
3.2.5.4 Piles
Other applications such as placing piles in front of the vertical breakwaters can be effective,
but they have the disadvantage of reducing the manoeuvring space of vessels and have bigger
installation costs.
3.2.5.5 Cribwork
Another existing possibility to construct a wave absorbing breakwater consists of filling an
open framework, named a crib, with large rocks so that waves can induce flow within the
voids between the armour units. It is difficult to form cribwork walls with open faces, needed
to allow the waves to penetrate, without abrupt reflections. It is clear from theoretical studies
on the permeability of rubble mounds to wave action, that very large rocks or concrete units
are required if wave reflections from such structures are to be significantly less than those from
a vertical wall. Even when large rock is available, the design of the containment structure
may still be complicated.
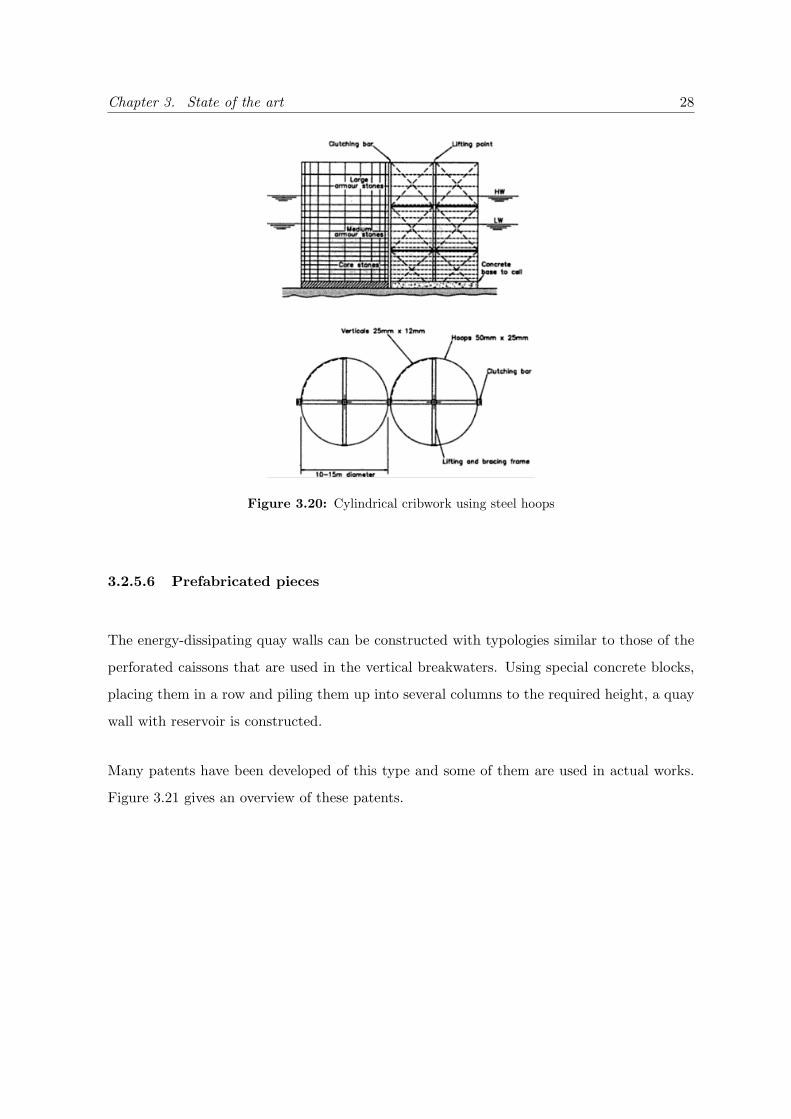
Wooton (1991) and Osborn (1991) discuss the practical aspects of the construction of a break-
water of cells, each formed of steel hoops and flat bars, see Figure 3.20. These components
are held together with vertical flat bars welded to the hoop bars. The cells have a reinforced
concrete base and are filled with large armour rocks, allowing wave action to be absorbed
within the porous structure. Large stones are used in the upper layers, with smaller stones
lower down.
Chapter 3. State of the art 28
Figure 3.20: Cylindrical cribwork using steel hoops
3.2.5.6 Prefabricated pieces
The energy-dissipating quay walls can be constructed with typologies similar to those of the
perforated caissons that are used in the vertical breakwaters. Using special concrete blocks,
placing them in a row and piling them up into several columns to the required height, a quay
wall with reservoir is constructed.
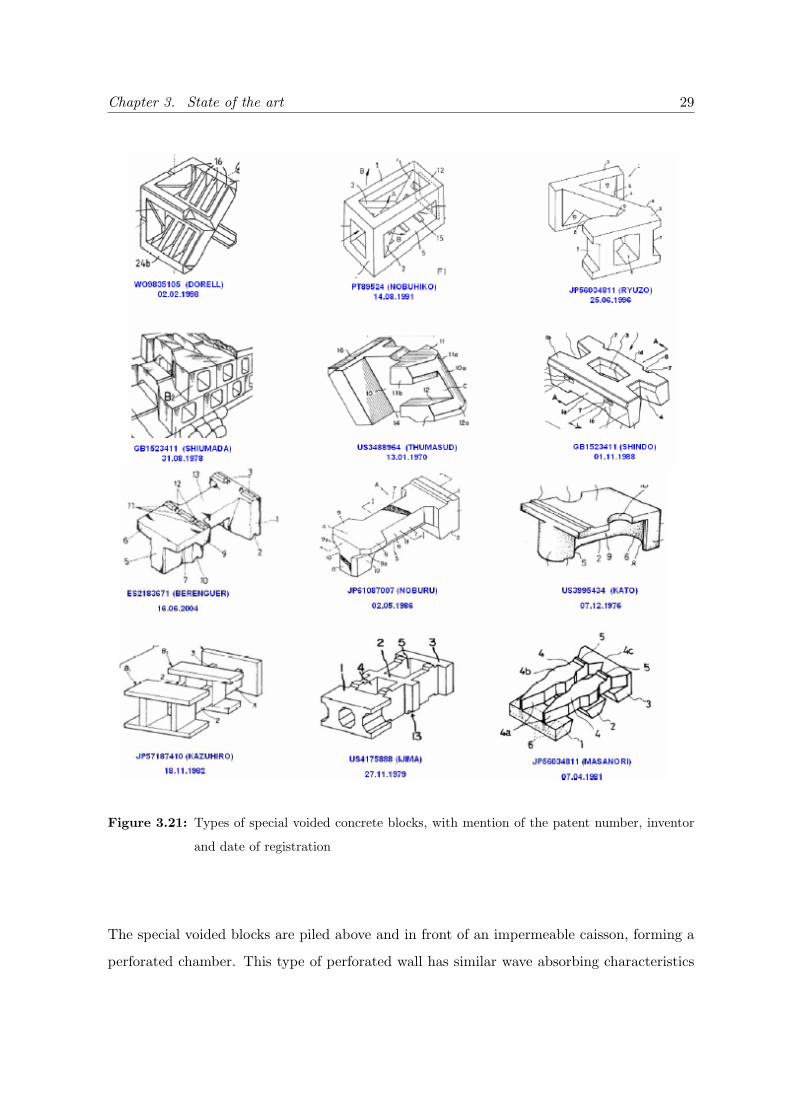
Many patents have been developed of this type and some of them are used in actual works.
Figure 3.21 gives an overview of these patents.
Chapter 3. State of the art 29
Figure 3.21: Types of special voided concrete blocks, with mention of the patent number, inventor
and date of registration
The special voided blocks are piled above and in front of an impermeable caisson, forming a
perforated chamber. This type of perforated wall has similar wave absorbing characteristics
Chapter 3. State of the art 30
as the Jarlan type although the energy dissipating mechanism is different in some aspects.
Essential for the wave absorbing capacity is the design of the interior reservoir. In order to
induce an effective energy dissipation, it is necessary to accelerate the fluid velocity inside
the wall. The reservoir behind the permeable wall plays a role of accelerating the fluid flow
across the wall for normal or even for longer wave periods. Its influence can be explained as
follows: when a wave crest comes, the permeable wall dams up the flow of incoming waves in
front of the wall and the reservoir stores the inflowing water.
The water level in the reservoir rises up gradually with some delay to the rising up of the
outside level. When a trough comes, the situation is reversed. Such a water level difference
along the inside and outside faces of the permeable wall causes the surface slope of the flow
through the permeable wall to be steeper than the one for flow without a reservoir. This is
the reason why the reservoir accelerates the flow across the wall and induces a large amount
of energy loss. Moreover, there exists the most effective reservoir width for a given width of
permeable wall, wave period and water depth to induce the maximum amount of energy loss.
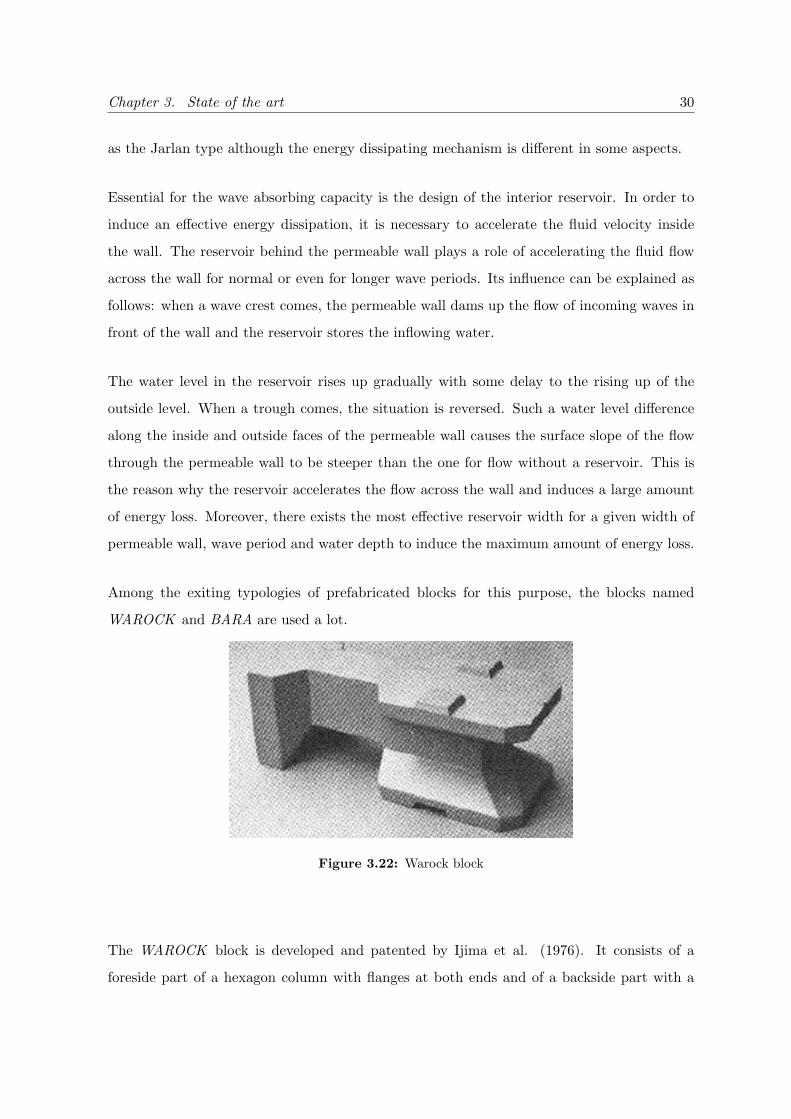
Among the exiting typologies of prefabricated blocks for this purpose, the blocks named
WAROCK and BARA are used a lot.
Figure 3.22: Warock block
The WAROCK block is developed and patented by Ijima et al. (1976). It consists of a
foreside part of a hexagon column with flanges at both ends and of a backside part with a
Chapter 3. State of the art 31
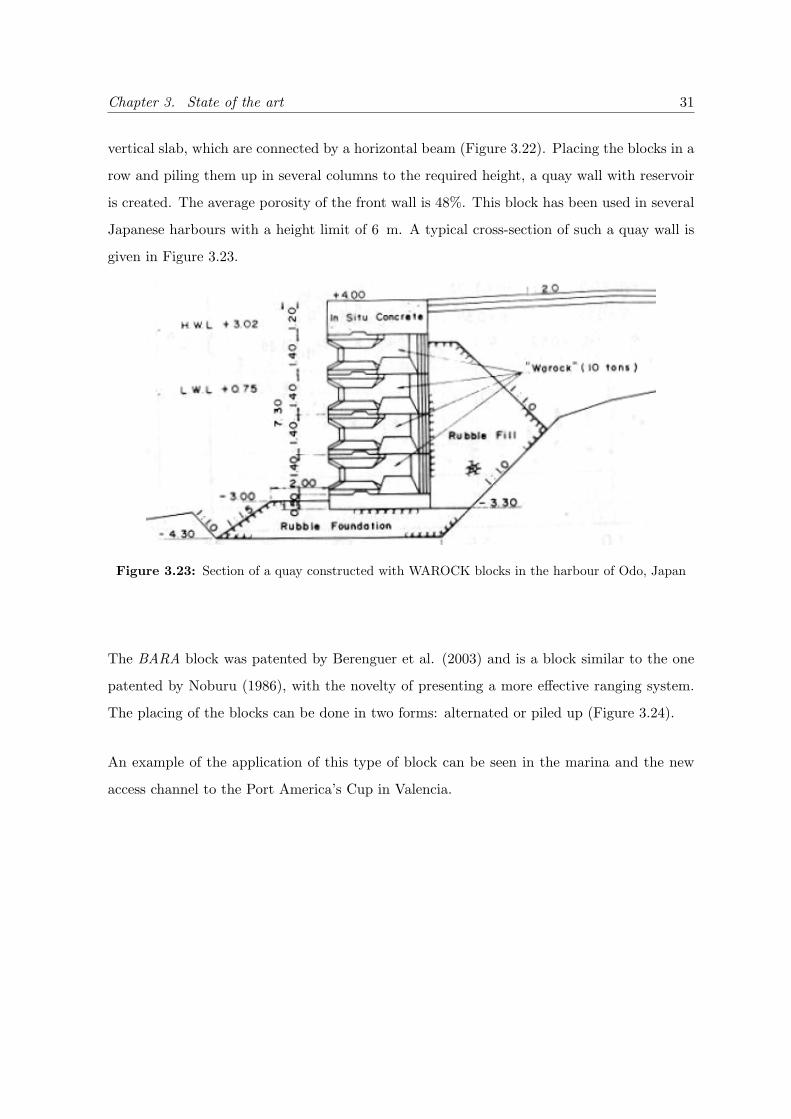
vertical slab, which are connected by a horizontal beam (Figure 3.22). Placing the blocks in a
row and piling them up in several columns to the required height, a quay wall with reservoir
is created. The average porosity of the front wall is 48%. This block has been used in several
Japanese harbours with a height limit of 6 m. A typical cross-section of such a quay wall is
given in Figure 3.23.
Figure 3.23: Section of a quay constructed with WAROCK blocks in the harbour of Odo, Japan
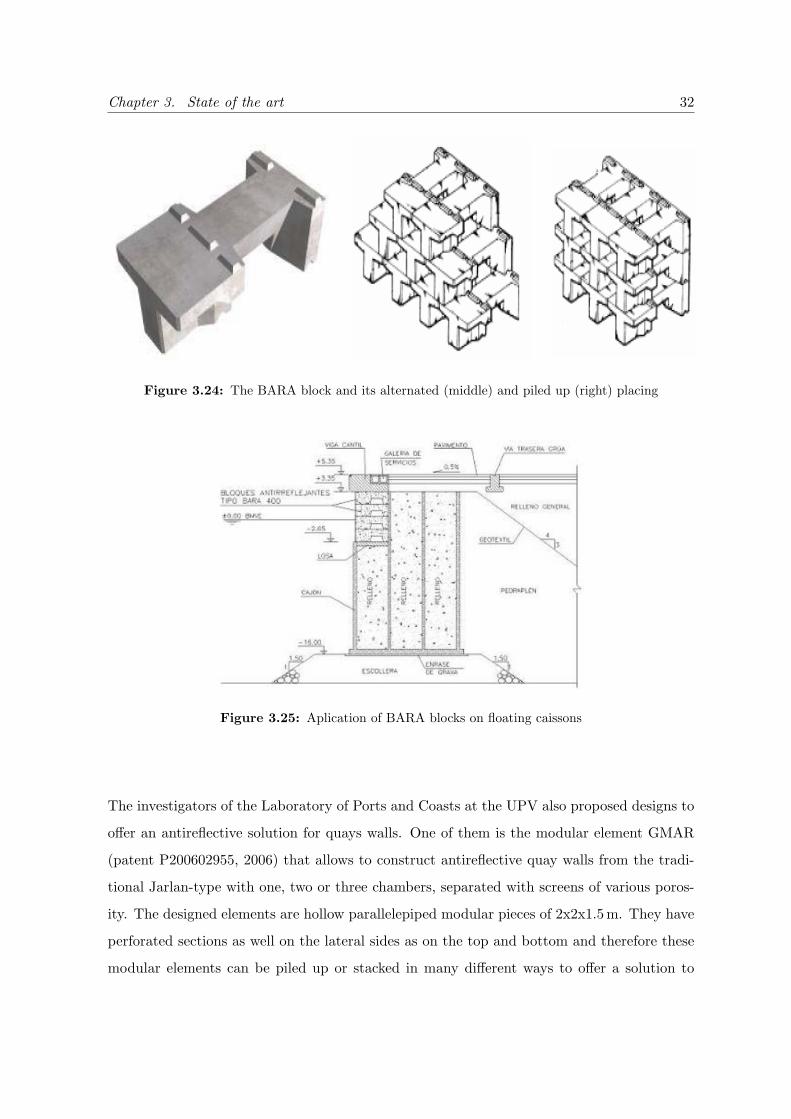
The BARA block was patented by Berenguer et al. (2003) and is a block similar to the one
patented by Noburu (1986), with the novelty of presenting a more effective ranging system.
The placing of the blocks can be done in two forms: alternated or piled up (Figure 3.24).
An example of the application of this type of block can be seen in the marina and the new
access channel to the Port America’s Cup in Valencia.
Chapter 3. State of the art 32
Figure 3.24: The BARA block and its alternated (middle) and piled up (right) placing
Figure 3.25: Aplication of BARA blocks on floating caissons
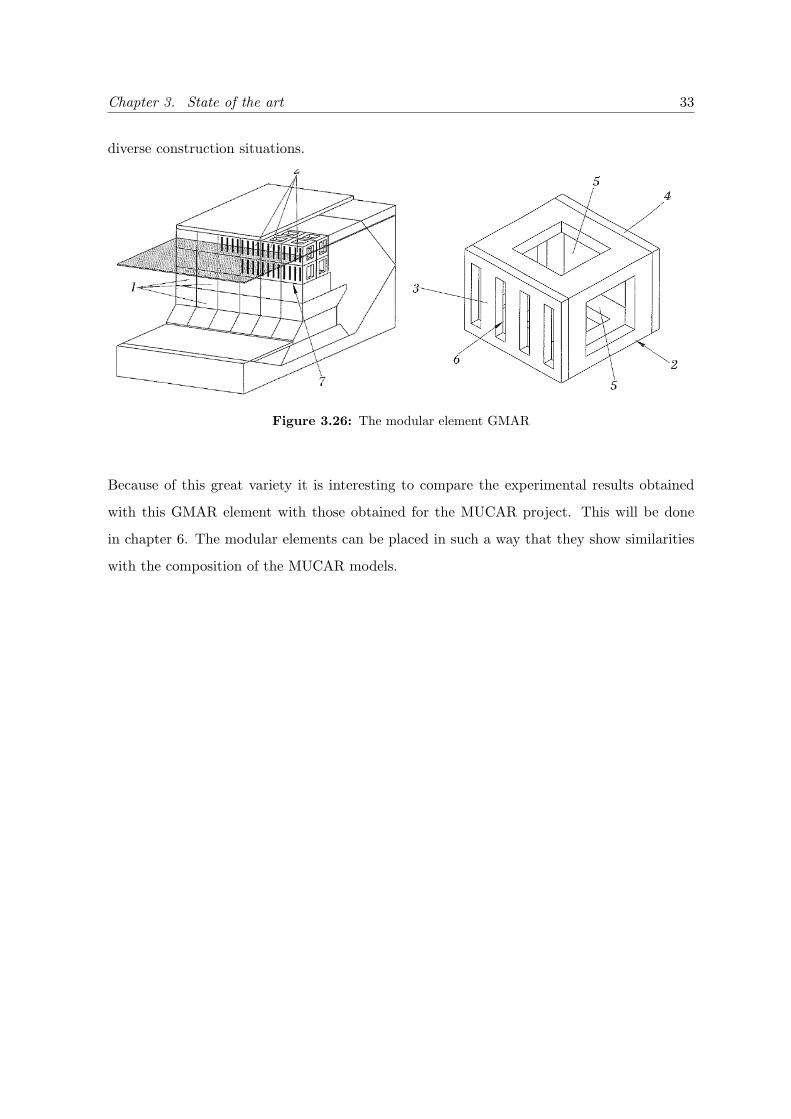
The investigators of the Laboratory of Ports and Coasts at the UPV also proposed designs to
offer an antireflective solution for quays walls. One of them is the modular element GMAR
(patent P200602955, 2006) that allows to construct antireflective quay walls from the tradi-
tional Jarlan-type with one, two or three chambers, separated with screens of various poros-
ity. The designed elements are hollow parallelepiped modular pieces of 2x2x1.5 m. They have
perforated sections as well on the lateral sides as on the top and bottom and therefore these
modular elements can be piled up or stacked in many different ways to offer a solution to
Chapter 3. State of the art 33
diverse construction situations.
Figure 3.26: The modular element GMAR
Because of this great variety it is interesting to compare the experimental results obtained
with this GMAR element with those obtained for the MUCAR project. This will be done
in chapter 6. The modular elements can be placed in such a way that they show similarities
with the composition of the MUCAR models.
Chapter 4
The theoretical model
4.1 Introduction
In the previous chapter we saw that a lot of theoretical models have been developed to explain
the complex hydrodynamic phenomenon of wave absorption. In this chapter we will see a very
simple method that can be used for the optimized hydraulic design of Jarlan-type breakwaters,
namely the model of Fugazza and Natale (1992).
This model will be used for a later comparison with the data from the experiments that are
done with regular waves. However, there are models available in the literature describing the
interaction of irregular waves with perforated-wall caisson breakwaters, see Suh et al. (2001).
Before observing the mentioned model, first we have a look at the parameters involved in the
design of the permeable breakwater.
4.2 Parameters of a perforated breakwater
The models in this project are of the type introduced by Jarlan (1961), see chapter 3 and
Figure C.1. As seen before, the main hydraulic mechanisms that control the reflection char-
acteristics for this structure are the interference of the waves on the front and the back of the
perforated face, and the energy dissipation of the water jets issuing from the wall holes.
34
Chapter 4. The theoretical model 35
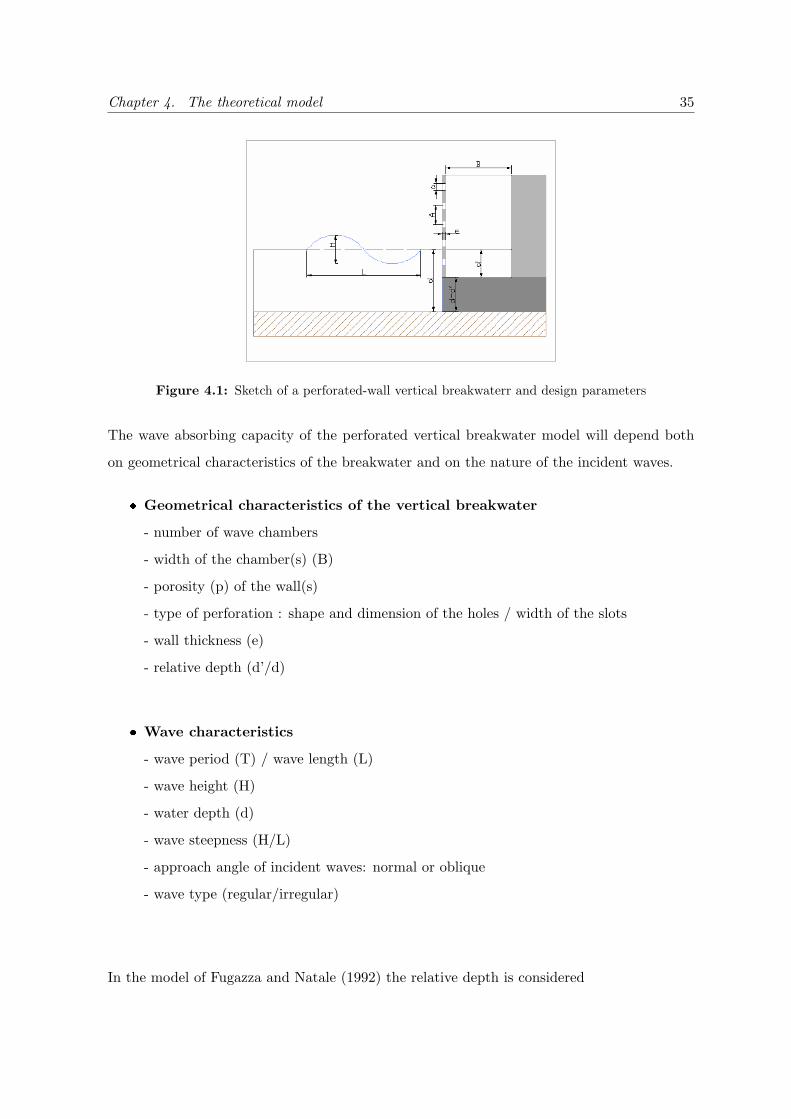
Figure 4.1: Sketch of a perforated-wall vertical breakwaterr and design parameters
The wave absorbing capacity of the perforated vertical breakwater model will depend both
on geometrical characteristics of the breakwater and on the nature of the incident waves.
Geometrical characteristics of the vertical breakwater
- number of wave chambers
- width of the chamber(s) (B)
- porosity (p) of the wall(s)
- type of perforation : shape and dimension of the holes / width of the slots
- wall thickness (e)
- relative depth (d’/d)
Wave characteristics
- wave period (T) / wave length (L)
- wave height (H)
- water depth (d)
- wave steepness (H/L)
- approach angle of incident waves: normal or oblique
- wave type (regular/irregular)
In the model of Fugazza and Natale (1992) the relative depth is considered
Chapter 4. The theoretical model 36
4.3 The model of Fugazza and Natale (1992)
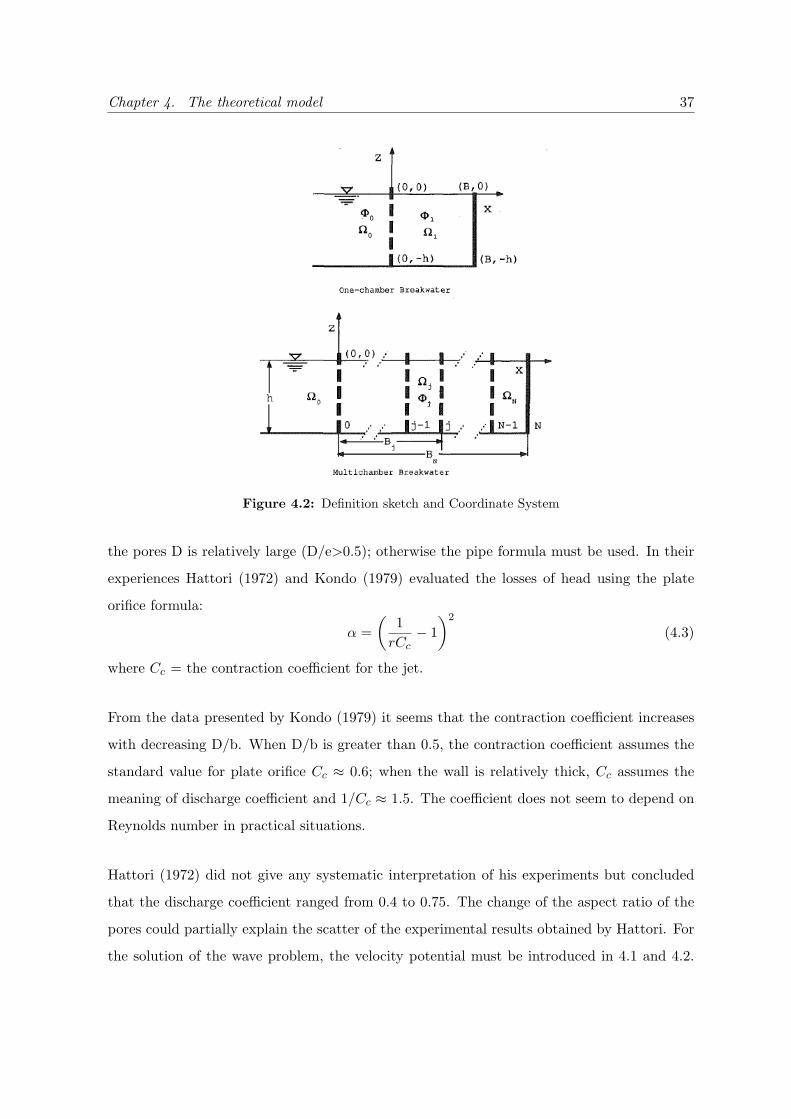
The considered structure is sketched in 4.2, where h is the stillwater depth and B is the length
of the chamber. It is supposed that the stillwater depth is the same inside and outside the
chamber. The incident waves are assumed to be monochromatic, long-crested and of small
amplitude, normally incident on the barrier. The fluid is assumed inviscid and incompressible
and its motion irrotational. The wave number of the incident wave is k=2π/L, where L denotes
the wave length, and the wave height is H.
The solution of the linearized wave problem, as presented in Appendix C, is set in the form
of velocity potential Φ of superposed systems of incident and reflected progressive waves and
of evanescent waves, with (∂xΦ, ∂zΦ) = (u,w) and ∂tΦ = -p/ρ.
The fluid velocity vector is v = (u,w), p = p(z) is the dynamic pressure, and ρ is the density
of the water. The movement of the fluid in the external field Ω0 (open sea) is connected to
the movement in the inner field Ω1 (wave chamber); for incompressible fluid the continuity
equation at the perforated wall is:
u0 = u1 (4.1)
and the dynamic equation is:
p1
ρ− p0
ρ+α
2U |U |+
∫l∂tUdl = 0 (4.2)
where U=ru0 is the mean velocity of the water in the pores; l = the length of the jet flowing
through the pores; and α = the loss coefficient. The porosity of the wall r is defined as r =
Av/(Av +Ap), where Av and Ap are, respectively, the area of the perforated and solid portion
of the wall.
The importance of the local inertia term is feeble so that the length of the jet l may be
assumed to be equal to the thickness of the wall b. Indeed experiments of Urashima et al.
(1986) have showed that the length l changes with the wavelength but its value is always very
small: the results depend very weakly on the value of this length.
The head losses at the wall are computed using the plate orifice formula when the diameter of
Chapter 4. The theoretical model 37
Figure 4.2: Definition sketch and Coordinate System
the pores D is relatively large (D/e>0.5); otherwise the pipe formula must be used. In their
experiences Hattori (1972) and Kondo (1979) evaluated the losses of head using the plate
orifice formula:
α =(
1rCc− 1)2
(4.3)
where Cc = the contraction coefficient for the jet.
From the data presented by Kondo (1979) it seems that the contraction coefficient increases
with decreasing D/b. When D/b is greater than 0.5, the contraction coefficient assumes the
standard value for plate orifice Cc ≈ 0.6; when the wall is relatively thick, Cc assumes the
meaning of discharge coefficient and 1/Cc ≈ 1.5. The coefficient does not seem to depend on
Reynolds number in practical situations.
Hattori (1972) did not give any systematic interpretation of his experiments but concluded
that the discharge coefficient ranged from 0.4 to 0.75. The change of the aspect ratio of the
pores could partially explain the scatter of the experimental results obtained by Hattori. For
the solution of the wave problem, the velocity potential must be introduced in 4.1 and 4.2.
Chapter 4. The theoretical model 38
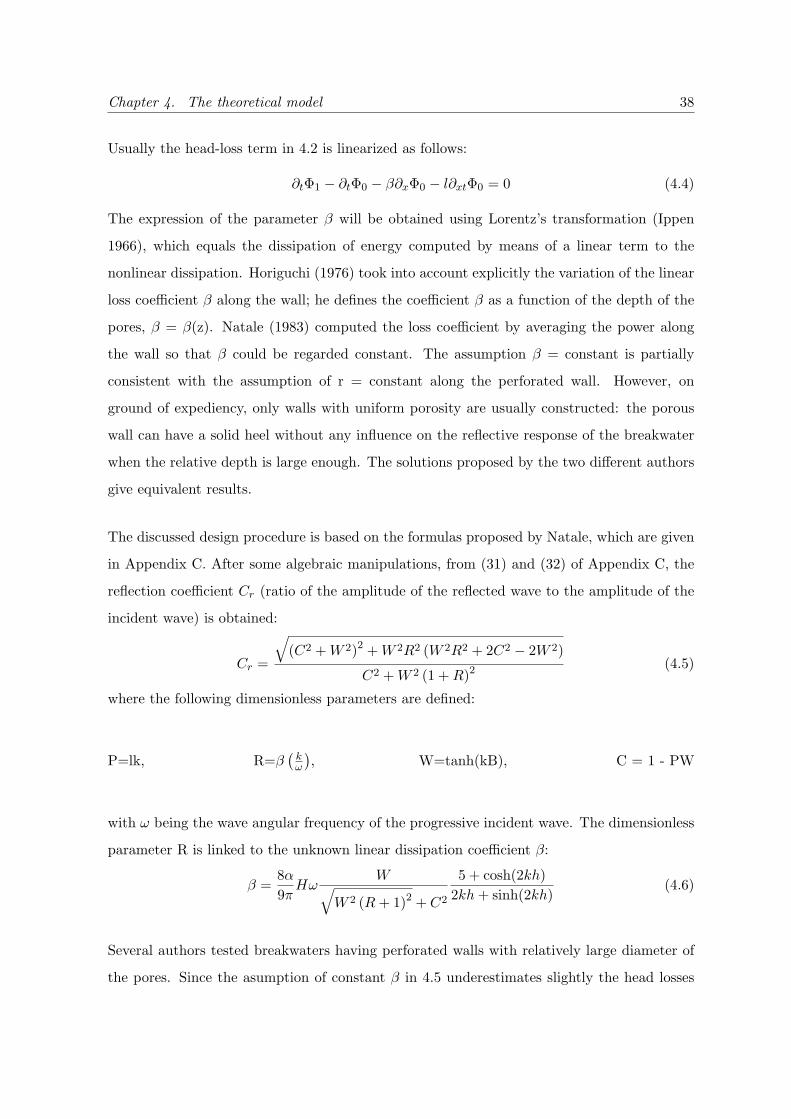
Usually the head-loss term in 4.2 is linearized as follows:
∂tΦ1 − ∂tΦ0 − β∂xΦ0 − l∂xtΦ0 = 0 (4.4)
The expression of the parameter β will be obtained using Lorentz’s transformation (Ippen
1966), which equals the dissipation of energy computed by means of a linear term to the
nonlinear dissipation. Horiguchi (1976) took into account explicitly the variation of the linear
loss coefficient β along the wall; he defines the coefficient β as a function of the depth of the
pores, β = β(z). Natale (1983) computed the loss coefficient by averaging the power along
the wall so that β could be regarded constant. The assumption β = constant is partially
consistent with the assumption of r = constant along the perforated wall. However, on
ground of expediency, only walls with uniform porosity are usually constructed: the porous
wall can have a solid heel without any influence on the reflective response of the breakwater
when the relative depth is large enough. The solutions proposed by the two different authors
give equivalent results.
The discussed design procedure is based on the formulas proposed by Natale, which are given
in Appendix C. After some algebraic manipulations, from (31) and (32) of Appendix C, the
reflection coefficient Cr (ratio of the amplitude of the reflected wave to the amplitude of the
incident wave) is obtained:
Cr =
√(C2 +W 2)2 +W 2R2 (W 2R2 + 2C2 − 2W 2)
C2 +W 2 (1 +R)2(4.5)
where the following dimensionless parameters are defined:
P=lk, R=β(kω
), W=tanh(kB), C = 1 - PW
with ω being the wave angular frequency of the progressive incident wave. The dimensionless
parameter R is linked to the unknown linear dissipation coefficient β:
β =8α9πHω
W√W 2 (R+ 1)2 + C2
5 + cosh(2kh)2kh+ sinh(2kh)
(4.6)
Several authors tested breakwaters having perforated walls with relatively large diameter of
the pores. Since the asumption of constant β in 4.5 underestimates slightly the head losses
Chapter 4. The theoretical model 39
at the sudden enlargement, 4.3 was empirically modified:
α =(
1rCc
)2
− 1 (4.7)
Slight improvement was obtained using Cc = 0.55 instead of Cc = 0.6
Chapter 5
Experiments
5.1 Introduction
In this chapter the experimental setup of the research that is carried out in the Laboratory
of Ports and Coasts is described. Among other equipment, this laboratory disposes of a 2D
wind and wave flume and a 3D basin. The experiments here described were all carried out in
the first one. A description of this wave flume, together with the system used to generate the
waves, the measurement sensors and the control room from were the processing takes place,
is given. Next the preparation and construction of the physical model is commented briefly
and illustrated, followed by a description of the MUCAR experiments and the waves that are
used for them. In a last part the procedure to analyze the data and to become the reflection
coefficient is given.
40
Chapter 5. Experiments 41
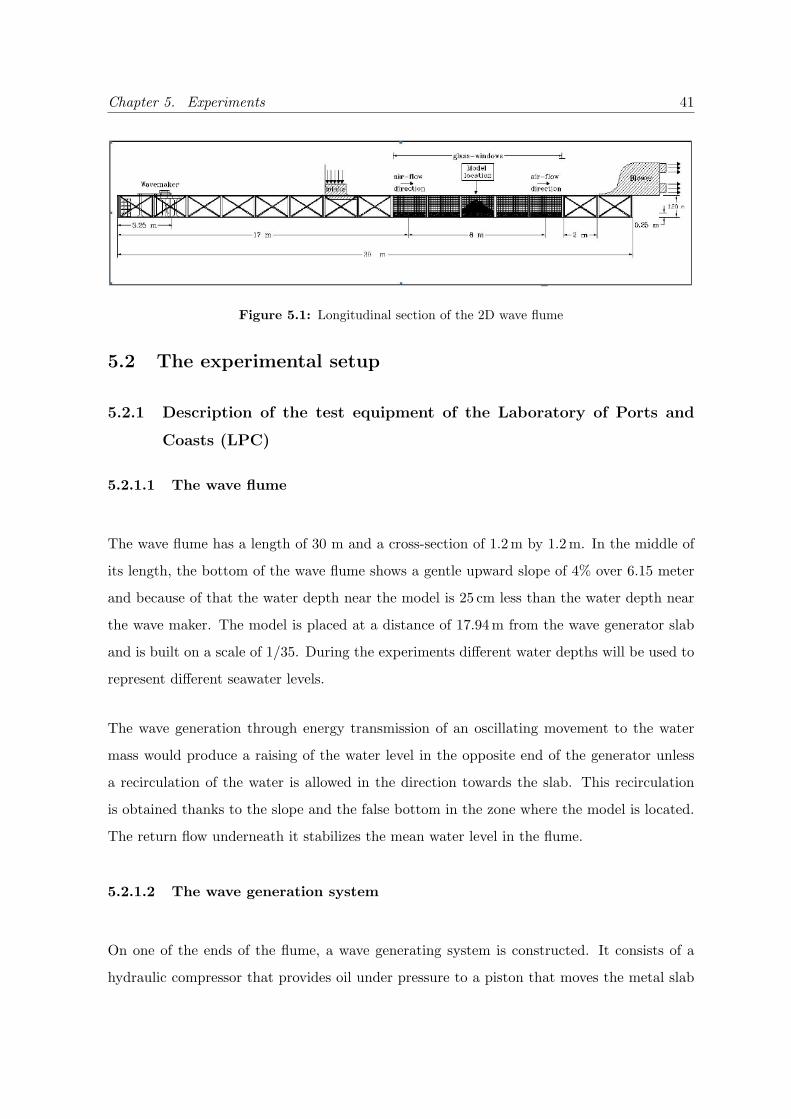
Figure 5.1: Longitudinal section of the 2D wave flume
5.2 The experimental setup
5.2.1 Description of the test equipment of the Laboratory of Ports and
Coasts (LPC)
5.2.1.1 The wave flume
The wave flume has a length of 30 m and a cross-section of 1.2 m by 1.2 m. In the middle of
its length, the bottom of the wave flume shows a gentle upward slope of 4% over 6.15 meter
and because of that the water depth near the model is 25 cm less than the water depth near
the wave maker. The model is placed at a distance of 17.94 m from the wave generator slab
and is built on a scale of 1/35. During the experiments different water depths will be used to
represent different seawater levels.
The wave generation through energy transmission of an oscillating movement to the water
mass would produce a raising of the water level in the opposite end of the generator unless
a recirculation of the water is allowed in the direction towards the slab. This recirculation
is obtained thanks to the slope and the false bottom in the zone where the model is located.
The return flow underneath it stabilizes the mean water level in the flume.
5.2.1.2 The wave generation system
On one of the ends of the flume, a wave generating system is constructed. It consists of a
hydraulic compressor that provides oil under pressure to a piston that moves the metal slab
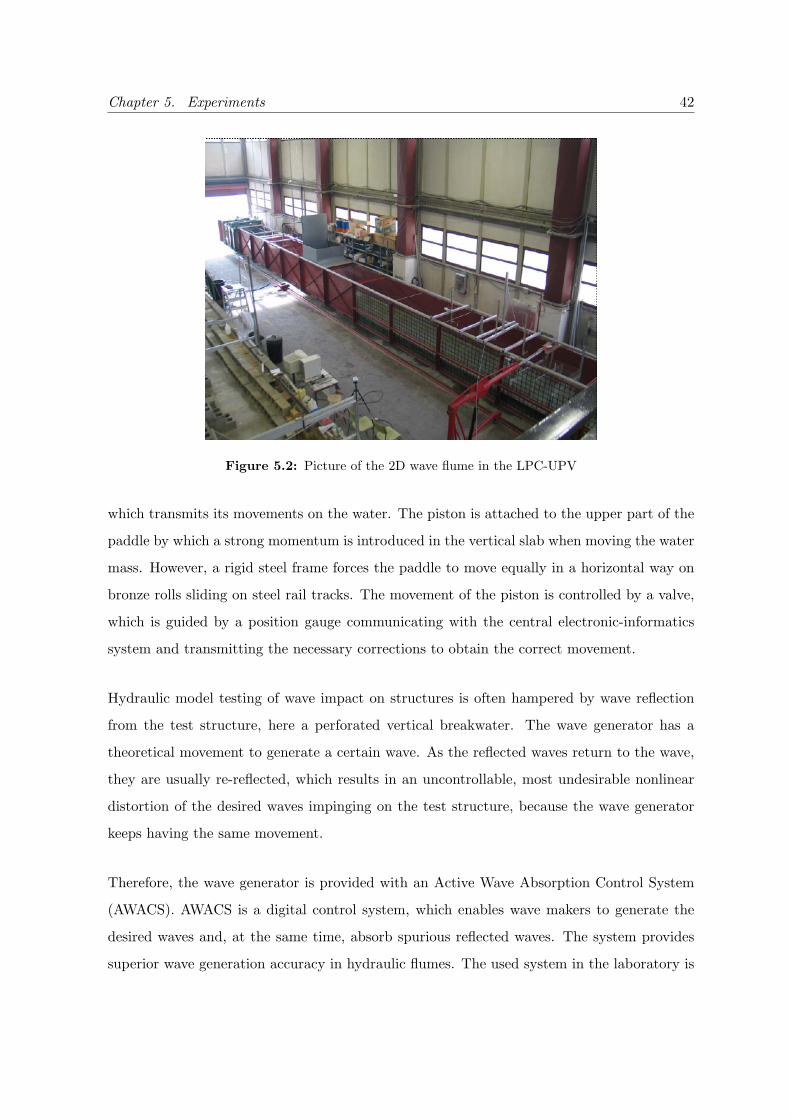
Chapter 5. Experiments 42
Figure 5.2: Picture of the 2D wave flume in the LPC-UPV
which transmits its movements on the water. The piston is attached to the upper part of the
paddle by which a strong momentum is introduced in the vertical slab when moving the water
mass. However, a rigid steel frame forces the paddle to move equally in a horizontal way on
bronze rolls sliding on steel rail tracks. The movement of the piston is controlled by a valve,
which is guided by a position gauge communicating with the central electronic-informatics
system and transmitting the necessary corrections to obtain the correct movement.
Hydraulic model testing of wave impact on structures is often hampered by wave reflection
from the test structure, here a perforated vertical breakwater. The wave generator has a
theoretical movement to generate a certain wave. As the reflected waves return to the wave,
they are usually re-reflected, which results in an uncontrollable, most undesirable nonlinear
distortion of the desired waves impinging on the test structure, because the wave generator
keeps having the same movement.
Therefore, the wave generator is provided with an Active Wave Absorption Control System
(AWACS). AWACS is a digital control system, which enables wave makers to generate the
desired waves and, at the same time, absorb spurious reflected waves. The system provides
superior wave generation accuracy in hydraulic flumes. The used system in the laboratory is
Chapter 5. Experiments 43
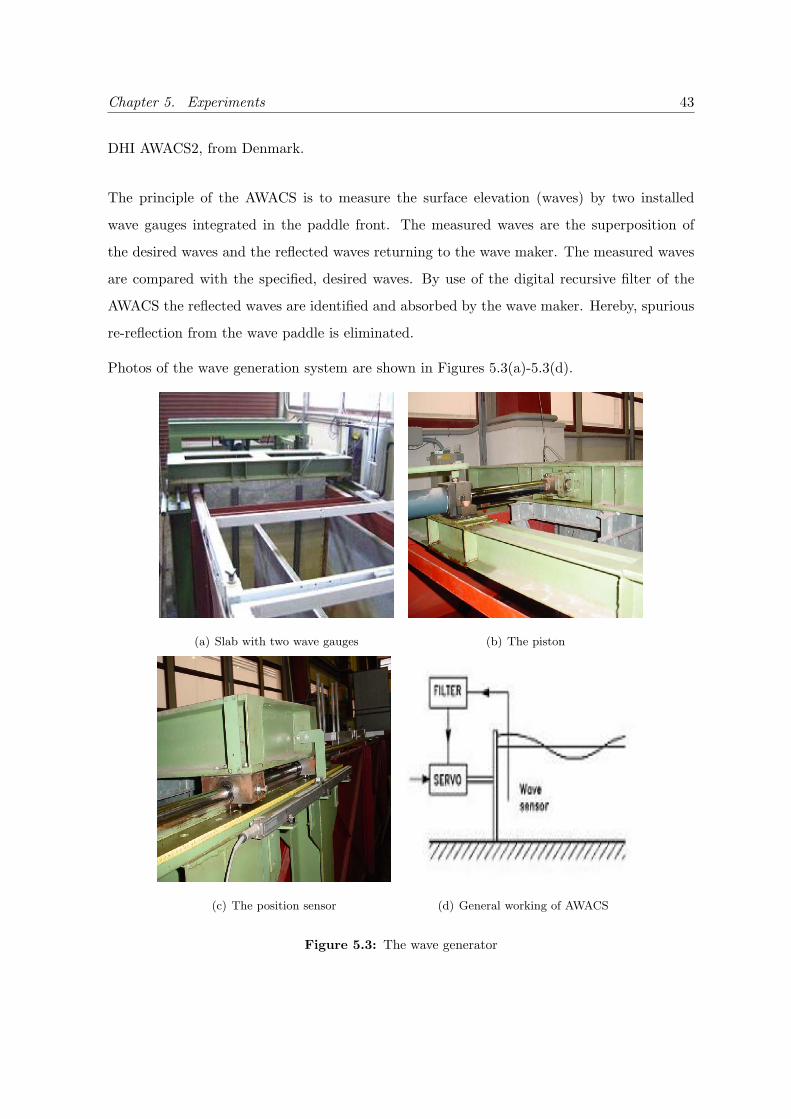
DHI AWACS2, from Denmark.
The principle of the AWACS is to measure the surface elevation (waves) by two installed
wave gauges integrated in the paddle front. The measured waves are the superposition of
the desired waves and the reflected waves returning to the wave maker. The measured waves
are compared with the specified, desired waves. By use of the digital recursive filter of the
AWACS the reflected waves are identified and absorbed by the wave maker. Hereby, spurious
re-reflection from the wave paddle is eliminated.
Photos of the wave generation system are shown in Figures 5.3(a)-5.3(d).
(a) Slab with two wave gauges (b) The piston
(c) The position sensor (d) General working of AWACS
Figure 5.3: The wave generator
Chapter 5. Experiments 44
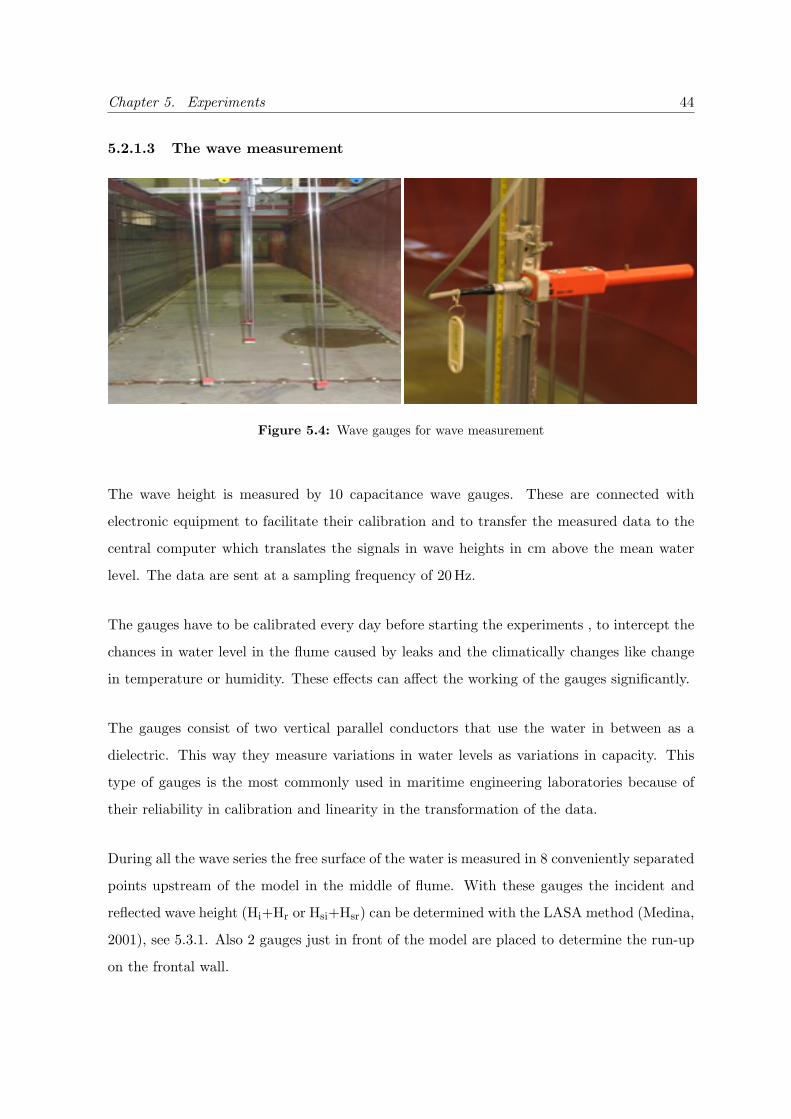
5.2.1.3 The wave measurement
Figure 5.4: Wave gauges for wave measurement
The wave height is measured by 10 capacitance wave gauges. These are connected with
electronic equipment to facilitate their calibration and to transfer the measured data to the
central computer which translates the signals in wave heights in cm above the mean water
level. The data are sent at a sampling frequency of 20 Hz.
The gauges have to be calibrated every day before starting the experiments , to intercept the
chances in water level in the flume caused by leaks and the climatically changes like change
in temperature or humidity. These effects can affect the working of the gauges significantly.
The gauges consist of two vertical parallel conductors that use the water in between as a
dielectric. This way they measure variations in water levels as variations in capacity. This
type of gauges is the most commonly used in maritime engineering laboratories because of
their reliability in calibration and linearity in the transformation of the data.
During all the wave series the free surface of the water is measured in 8 conveniently separated
points upstream of the model in the middle of flume. With these gauges the incident and
reflected wave height (Hi+Hr or Hsi+Hsr) can be determined with the LASA method (Medina,
2001), see 5.3.1. Also 2 gauges just in front of the model are placed to determine the run-up
on the frontal wall.
Chapter 5. Experiments 45
The distance between the sensors is determined according the wave lengths that are going to
be generated. This in a way that it is possible to do the analysis of the incident and reflected
waves. The distance of the sensors from the paddle of the wave generator is given in table 5.1
Distance of the sensors from the paddle of the wave generator(cm)
Paddle S1 S2 S3 S4 S5 S6 S7 S8 S9-S10 Model
0 1222 1362 1487 1567 1575 1585 1605 1645 1792 1794
Table 5.1: Distance of the sensors from the paddle of the wave generator
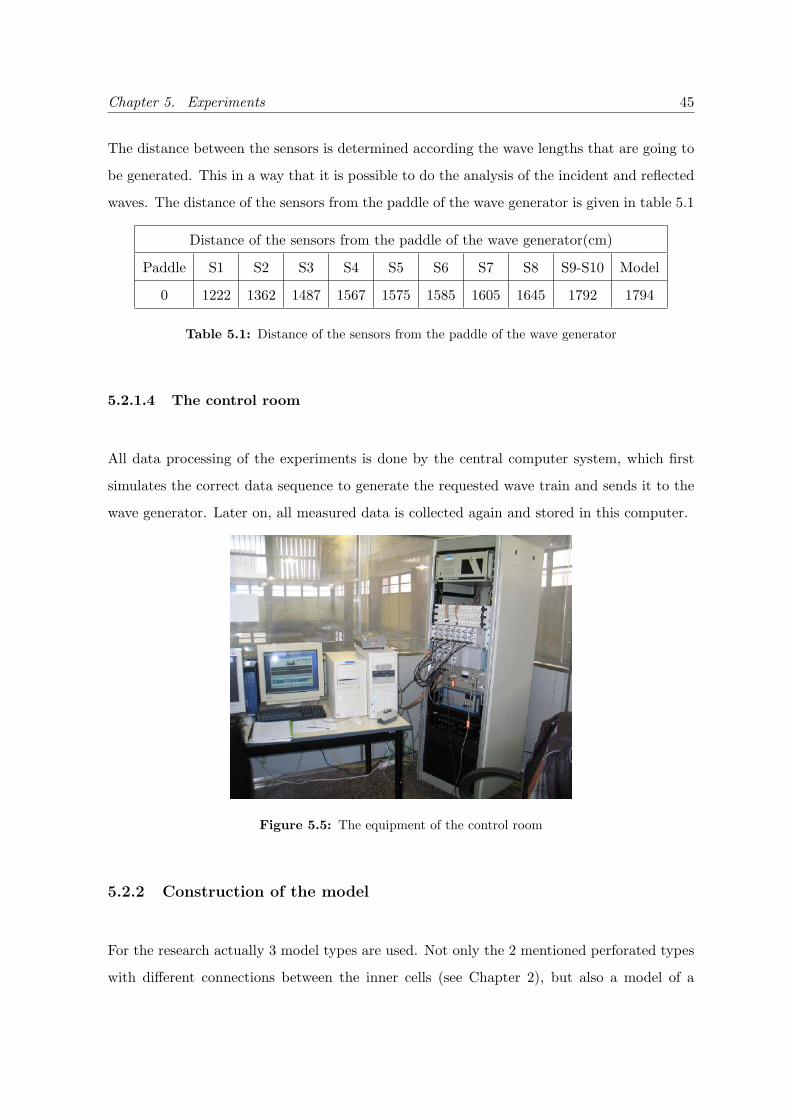
5.2.1.4 The control room
All data processing of the experiments is done by the central computer system, which first
simulates the correct data sequence to generate the requested wave train and sends it to the
wave generator. Later on, all measured data is collected again and stored in this computer.
Figure 5.5: The equipment of the control room
5.2.2 Construction of the model
For the research actually 3 model types are used. Not only the 2 mentioned perforated types
with different connections between the inner cells (see Chapter 2), but also a model of a
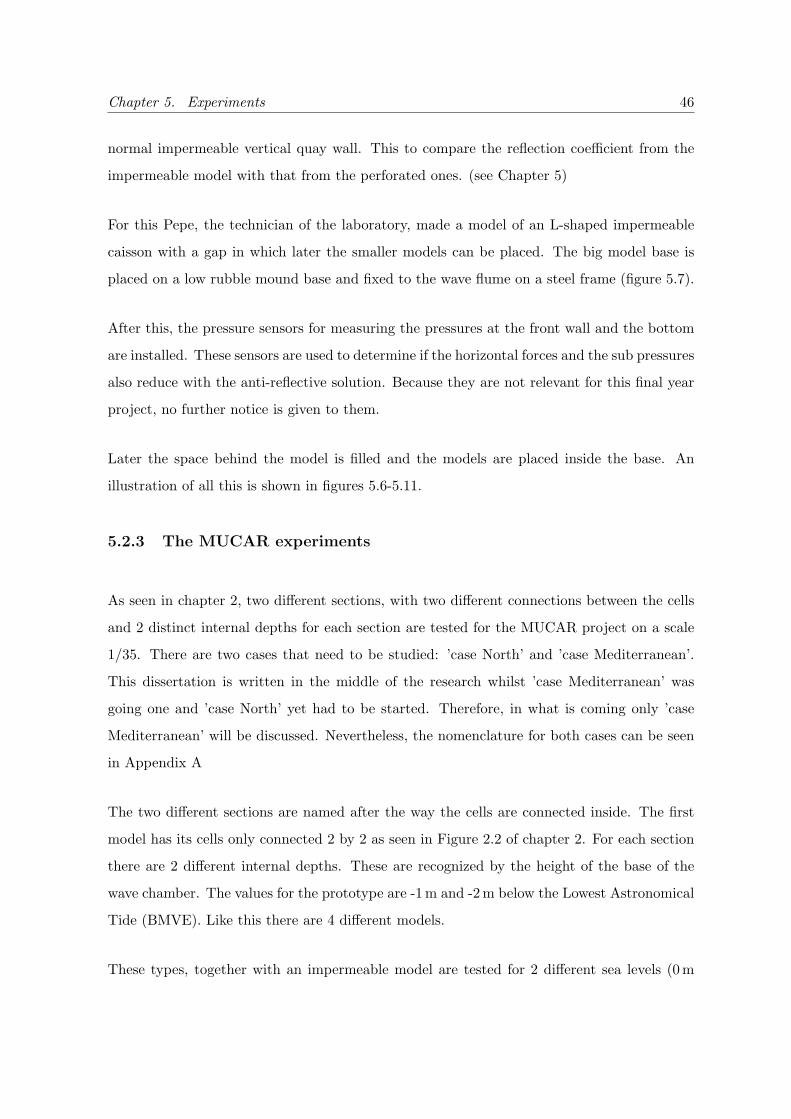
Chapter 5. Experiments 46
normal impermeable vertical quay wall. This to compare the reflection coefficient from the
impermeable model with that from the perforated ones. (see Chapter 5)
For this Pepe, the technician of the laboratory, made a model of an L-shaped impermeable
caisson with a gap in which later the smaller models can be placed. The big model base is
placed on a low rubble mound base and fixed to the wave flume on a steel frame (figure 5.7).
After this, the pressure sensors for measuring the pressures at the front wall and the bottom
are installed. These sensors are used to determine if the horizontal forces and the sub pressures
also reduce with the anti-reflective solution. Because they are not relevant for this final year
project, no further notice is given to them.
Later the space behind the model is filled and the models are placed inside the base. An
illustration of all this is shown in figures 5.6-5.11.
5.2.3 The MUCAR experiments
As seen in chapter 2, two different sections, with two different connections between the cells
and 2 distinct internal depths for each section are tested for the MUCAR project on a scale
1/35. There are two cases that need to be studied: ’case North’ and ’case Mediterranean’.
This dissertation is written in the middle of the research whilst ’case Mediterranean’ was
going one and ’case North’ yet had to be started. Therefore, in what is coming only ’case
Mediterranean’ will be discussed. Nevertheless, the nomenclature for both cases can be seen
in Appendix A
The two different sections are named after the way the cells are connected inside. The first
model has its cells only connected 2 by 2 as seen in Figure 2.2 of chapter 2. For each section
there are 2 different internal depths. These are recognized by the height of the base of the
wave chamber. The values for the prototype are -1 m and -2 m below the Lowest Astronomical
Tide (BMVE). Like this there are 4 different models.
These types, together with an impermeable model are tested for 2 different sea levels (0 m
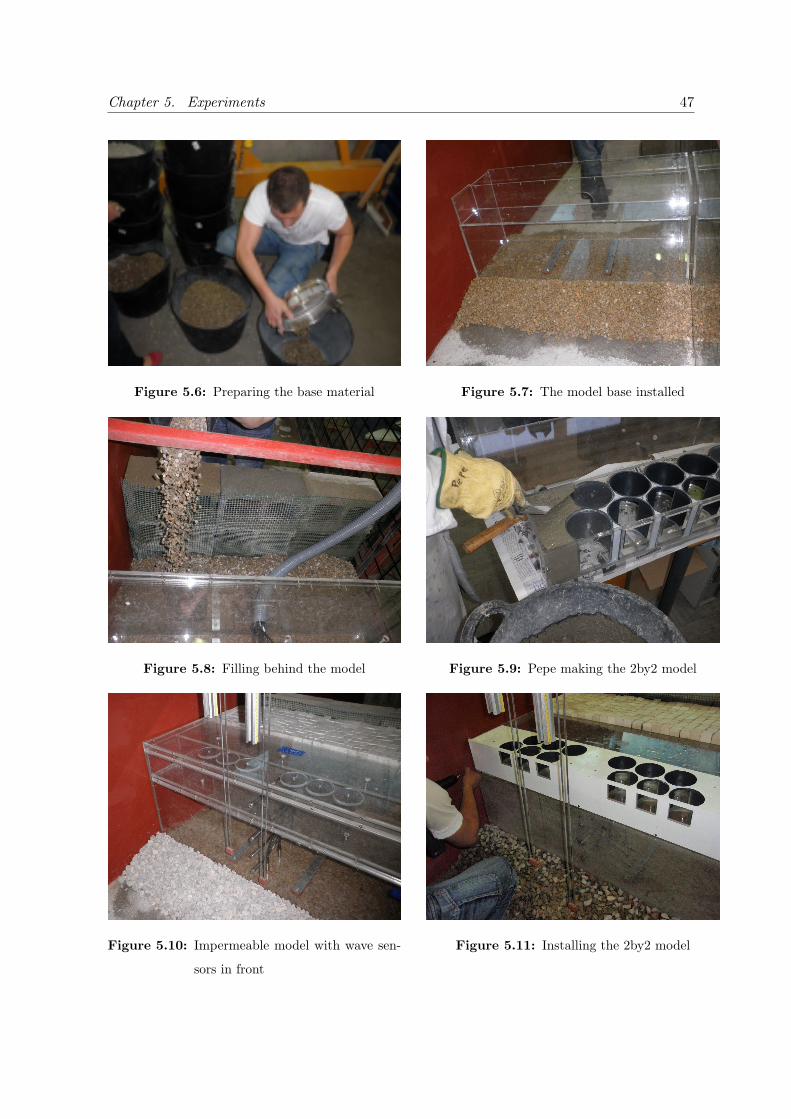
Chapter 5. Experiments 47
Figure 5.6: Preparing the base material Figure 5.7: The model base installed
Figure 5.8: Filling behind the model Figure 5.9: Pepe making the 2by2 model
Figure 5.10: Impermeable model with wave sen-
sors in front
Figure 5.11: Installing the 2by2 model
Chapter 5. Experiments 48
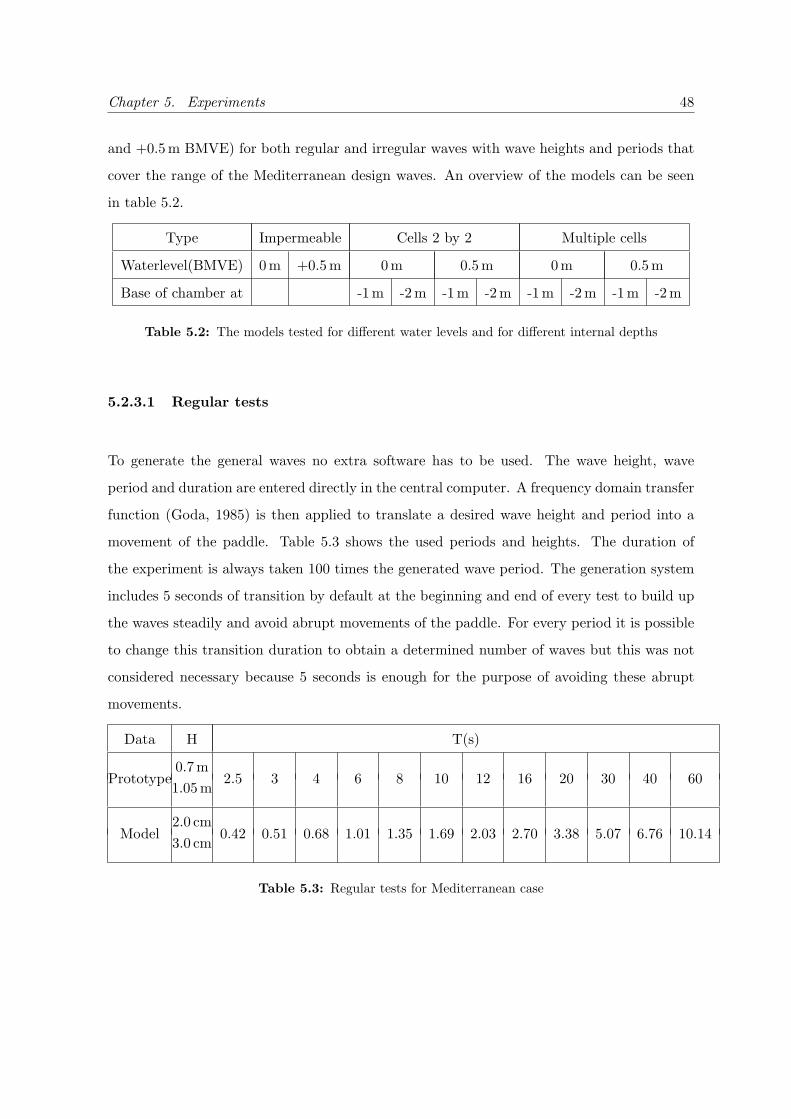
and +0.5 m BMVE) for both regular and irregular waves with wave heights and periods that
cover the range of the Mediterranean design waves. An overview of the models can be seen
in table 5.2.
Type Impermeable Cells 2 by 2 Multiple cells
Waterlevel(BMVE) 0 m +0.5 m 0 m 0.5 m 0 m 0.5 m
Base of chamber at -1 m -2 m -1 m -2 m -1 m -2 m -1 m -2 m
Table 5.2: The models tested for different water levels and for different internal depths
5.2.3.1 Regular tests
To generate the general waves no extra software has to be used. The wave height, wave
period and duration are entered directly in the central computer. A frequency domain transfer
function (Goda, 1985) is then applied to translate a desired wave height and period into a
movement of the paddle. Table 5.3 shows the used periods and heights. The duration of
the experiment is always taken 100 times the generated wave period. The generation system
includes 5 seconds of transition by default at the beginning and end of every test to build up
the waves steadily and avoid abrupt movements of the paddle. For every period it is possible
to change this transition duration to obtain a determined number of waves but this was not
considered necessary because 5 seconds is enough for the purpose of avoiding these abrupt
movements.
Data H T(s)
0.7 mPrototype
1.05 m2.5 3 4 6 8 10 12 16 20 30 40 60
2.0 cmModel
3.0 cm0.42 0.51 0.68 1.01 1.35 1.69 2.03 2.70 3.38 5.07 6.76 10.14
Table 5.3: Regular tests for Mediterranean case
Chapter 5. Experiments 49
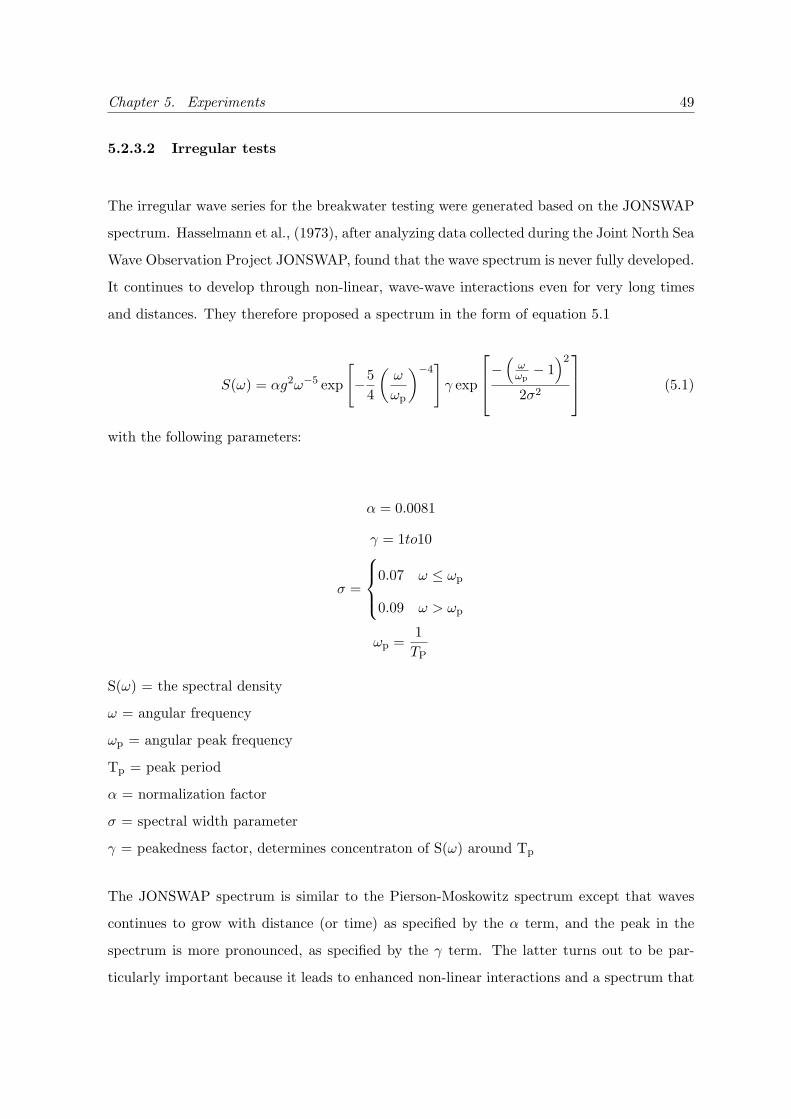
5.2.3.2 Irregular tests
The irregular wave series for the breakwater testing were generated based on the JONSWAP
spectrum. Hasselmann et al., (1973), after analyzing data collected during the Joint North Sea
Wave Observation Project JONSWAP, found that the wave spectrum is never fully developed.
It continues to develop through non-linear, wave-wave interactions even for very long times
and distances. They therefore proposed a spectrum in the form of equation 5.1
S(ω) = αg2ω−5 exp
[−5
4
(ω
ωp
)−4]γ exp
−(ωωp− 1)2
2σ2
(5.1)
with the following parameters:
α = 0.0081
γ = 1to10
σ =
0.07 ω ≤ ωp
0.09 ω > ωp
ωp =1TP
S(ω) = the spectral density
ω = angular frequency
ωp = angular peak frequency
Tp = peak period
α = normalization factor
σ = spectral width parameter
γ = peakedness factor, determines concentraton of S(ω) around Tp
The JONSWAP spectrum is similar to the Pierson-Moskowitz spectrum except that waves
continues to grow with distance (or time) as specified by the α term, and the peak in the
spectrum is more pronounced, as specified by the γ term. The latter turns out to be par-
ticularly important because it leads to enhanced non-linear interactions and a spectrum that
Chapter 5. Experiments 50
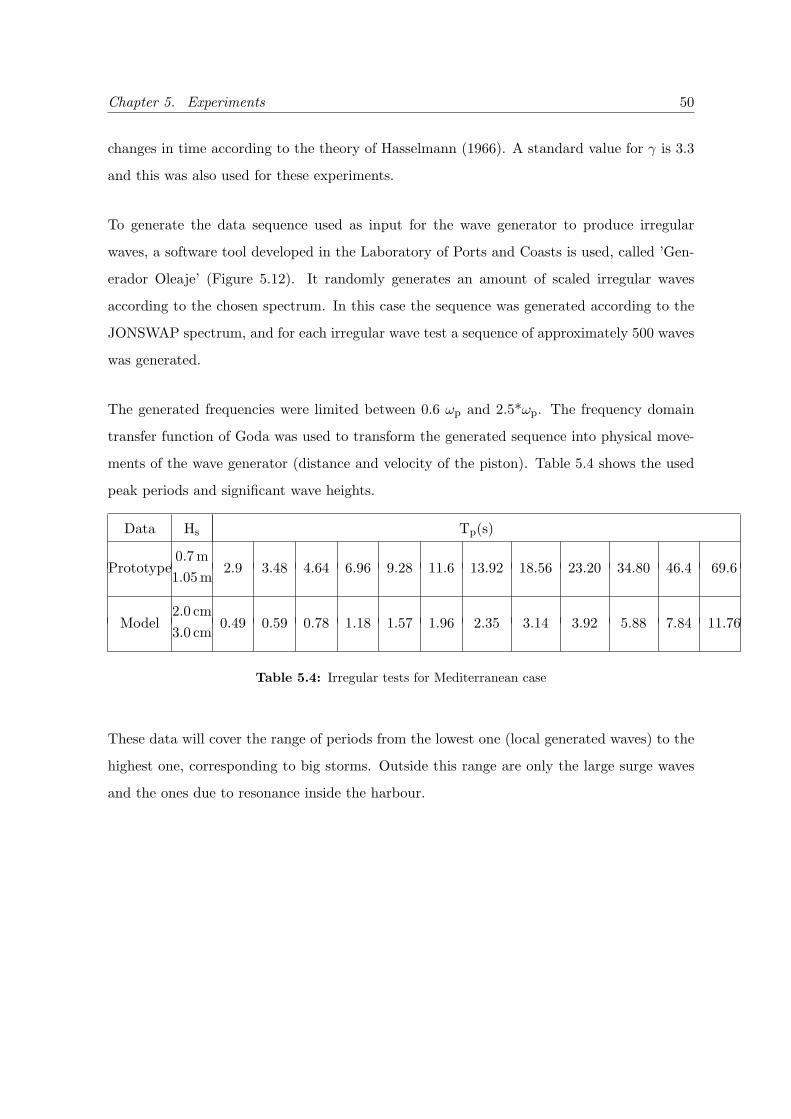
changes in time according to the theory of Hasselmann (1966). A standard value for γ is 3.3
and this was also used for these experiments.
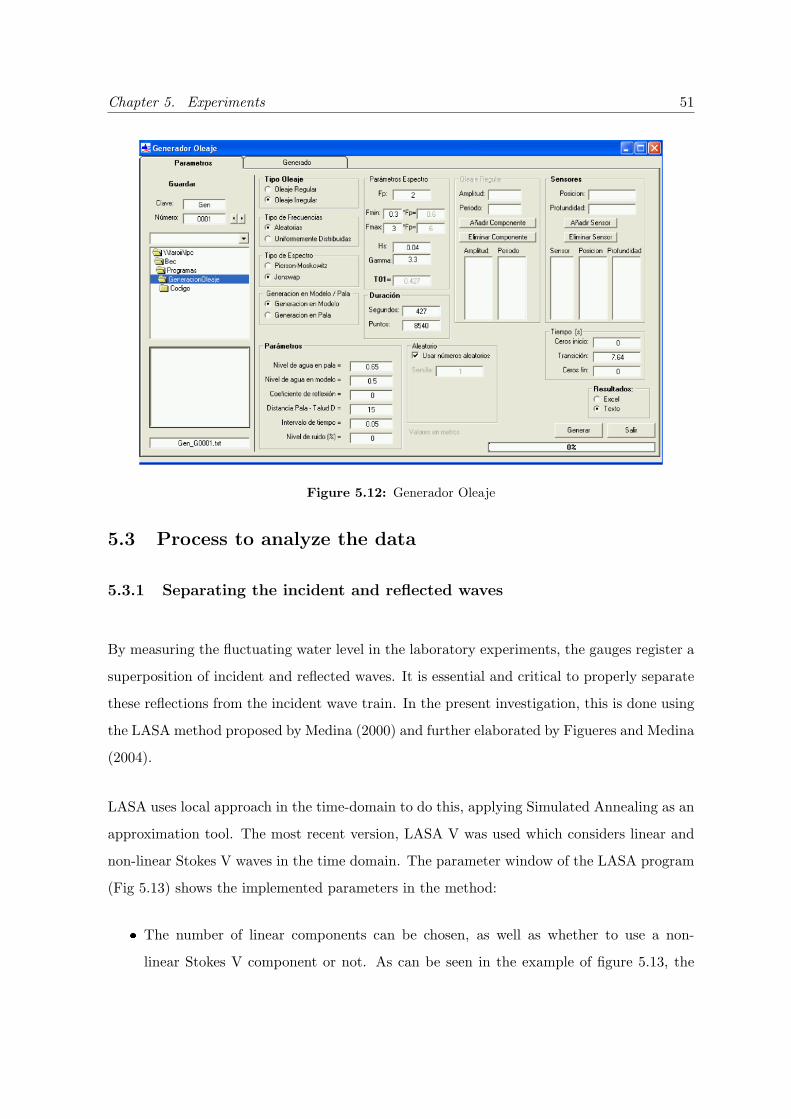
To generate the data sequence used as input for the wave generator to produce irregular
waves, a software tool developed in the Laboratory of Ports and Coasts is used, called ’Gen-
erador Oleaje’ (Figure 5.12). It randomly generates an amount of scaled irregular waves
according to the chosen spectrum. In this case the sequence was generated according to the
JONSWAP spectrum, and for each irregular wave test a sequence of approximately 500 waves
was generated.
The generated frequencies were limited between 0.6 ωp and 2.5*ωp. The frequency domain
transfer function of Goda was used to transform the generated sequence into physical move-
ments of the wave generator (distance and velocity of the piston). Table 5.4 shows the used
peak periods and significant wave heights.
Data Hs Tp(s)
0.7 mPrototype
1.05 m2.9 3.48 4.64 6.96 9.28 11.6 13.92 18.56 23.20 34.80 46.4 69.6
2.0 cmModel
3.0 cm0.49 0.59 0.78 1.18 1.57 1.96 2.35 3.14 3.92 5.88 7.84 11.76
Table 5.4: Irregular tests for Mediterranean case
These data will cover the range of periods from the lowest one (local generated waves) to the
highest one, corresponding to big storms. Outside this range are only the large surge waves
and the ones due to resonance inside the harbour.
Chapter 5. Experiments 51
Figure 5.12: Generador Oleaje
5.3 Process to analyze the data
5.3.1 Separating the incident and reflected waves
By measuring the fluctuating water level in the laboratory experiments, the gauges register a
superposition of incident and reflected waves. It is essential and critical to properly separate
these reflections from the incident wave train. In the present investigation, this is done using
the LASA method proposed by Medina (2000) and further elaborated by Figueres and Medina
(2004).
LASA uses local approach in the time-domain to do this, applying Simulated Annealing as an
approximation tool. The most recent version, LASA V was used which considers linear and
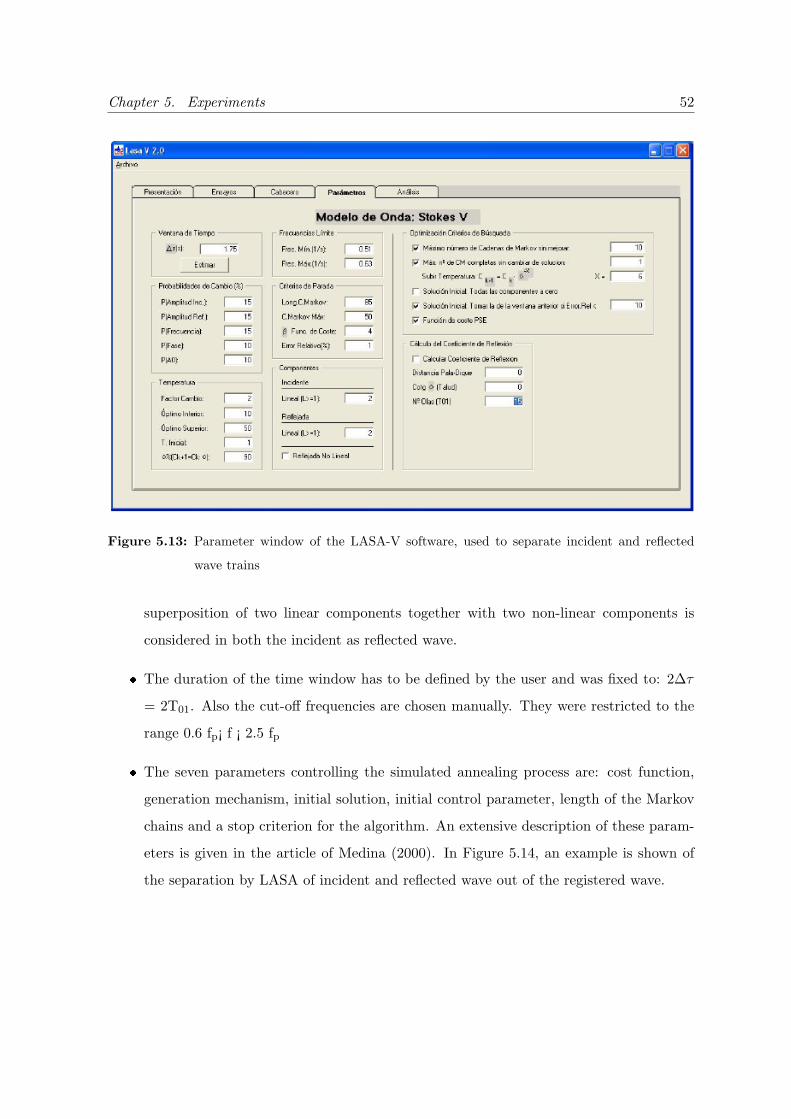
non-linear Stokes V waves in the time domain. The parameter window of the LASA program
(Fig 5.13) shows the implemented parameters in the method:
The number of linear components can be chosen, as well as whether to use a non-
linear Stokes V component or not. As can be seen in the example of figure 5.13, the
Chapter 5. Experiments 52
Figure 5.13: Parameter window of the LASA-V software, used to separate incident and reflected
wave trains
superposition of two linear components together with two non-linear components is
considered in both the incident as reflected wave.
The duration of the time window has to be defined by the user and was fixed to: 2∆τ
= 2T01. Also the cut-off frequencies are chosen manually. They were restricted to the
range 0.6 fp¡ f ¡ 2.5 fp
The seven parameters controlling the simulated annealing process are: cost function,
generation mechanism, initial solution, initial control parameter, length of the Markov
chains and a stop criterion for the algorithm. An extensive description of these param-
eters is given in the article of Medina (2000). In Figure 5.14, an example is shown of
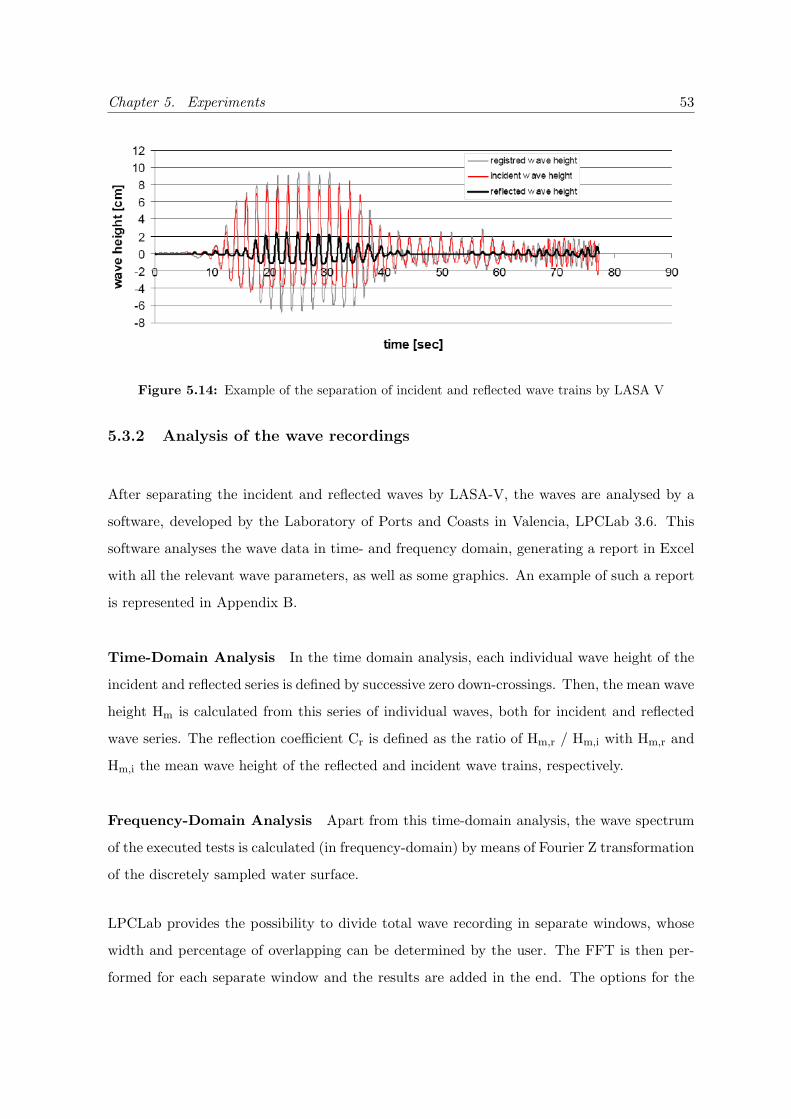
the separation by LASA of incident and reflected wave out of the registered wave.
Chapter 5. Experiments 53
Figure 5.14: Example of the separation of incident and reflected wave trains by LASA V
5.3.2 Analysis of the wave recordings
After separating the incident and reflected waves by LASA-V, the waves are analysed by a
software, developed by the Laboratory of Ports and Coasts in Valencia, LPCLab 3.6. This
software analyses the wave data in time- and frequency domain, generating a report in Excel
with all the relevant wave parameters, as well as some graphics. An example of such a report
is represented in Appendix B.
Time-Domain Analysis In the time domain analysis, each individual wave height of the
incident and reflected series is defined by successive zero down-crossings. Then, the mean wave
height Hm is calculated from this series of individual waves, both for incident and reflected
wave series. The reflection coefficient Cr is defined as the ratio of Hm,r / Hm,i with Hm,r and
Hm,i the mean wave height of the reflected and incident wave trains, respectively.
Frequency-Domain Analysis Apart from this time-domain analysis, the wave spectrum
of the executed tests is calculated (in frequency-domain) by means of Fourier Z transformation
of the discretely sampled water surface.
LPCLab provides the possibility to divide total wave recording in separate windows, whose
width and percentage of overlapping can be determined by the user. The FFT is then per-
formed for each separate window and the results are added in the end. The options for the
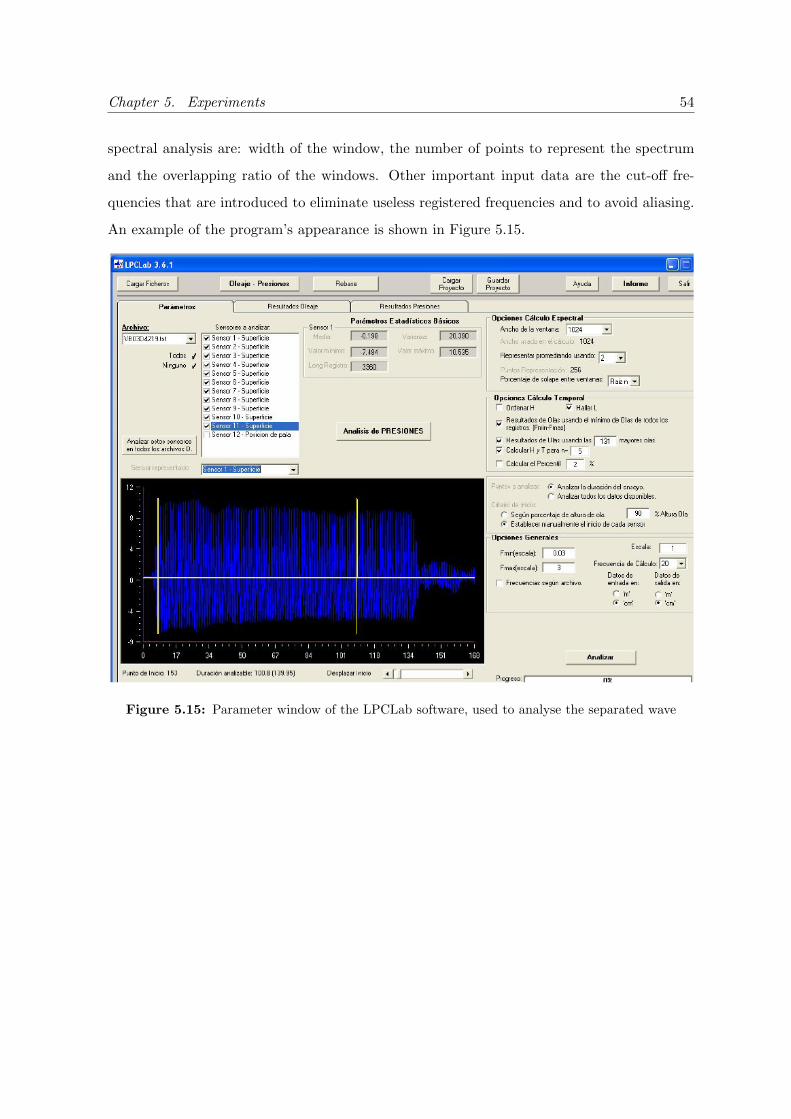
Chapter 5. Experiments 54
spectral analysis are: width of the window, the number of points to represent the spectrum
and the overlapping ratio of the windows. Other important input data are the cut-off fre-
quencies that are introduced to eliminate useless registered frequencies and to avoid aliasing.
An example of the program’s appearance is shown in Figure 5.15.
Figure 5.15: Parameter window of the LPCLab software, used to analyse the separated wave
Chapter 6
Results of the experiments &
comparison with the theory
6.1 Preliminary analysis
The reflection coefficient Cr is the most important result of the analysis of the recorded data
of the experiments (explained in previous chapter). This parameter is an indication for the
wave absorbing capacity of the model.
In the case of regular wave tests, the value of Cr has been calculated in the time domain as
the ratio between the mean wave height of the reflected waves (Hm,r) and the mean wave
height on the incident waves (Hm,i):
Cr =Hm,r
Hm,i(6.1)
In the case of irregular wave tests, the value of Cr is calculated with data from spectral
analysis, and is defined as :
Cr =Hm0,r
Hm0,i(6.2)
where Hm0,r and Hm0,i are the significant wave heights of the reflected and incident wave
trains. The significant wave height is defined in the following way:
Hs = 4√m0 = 4
∫ ∞0
Sη(f)df (6.3)
55
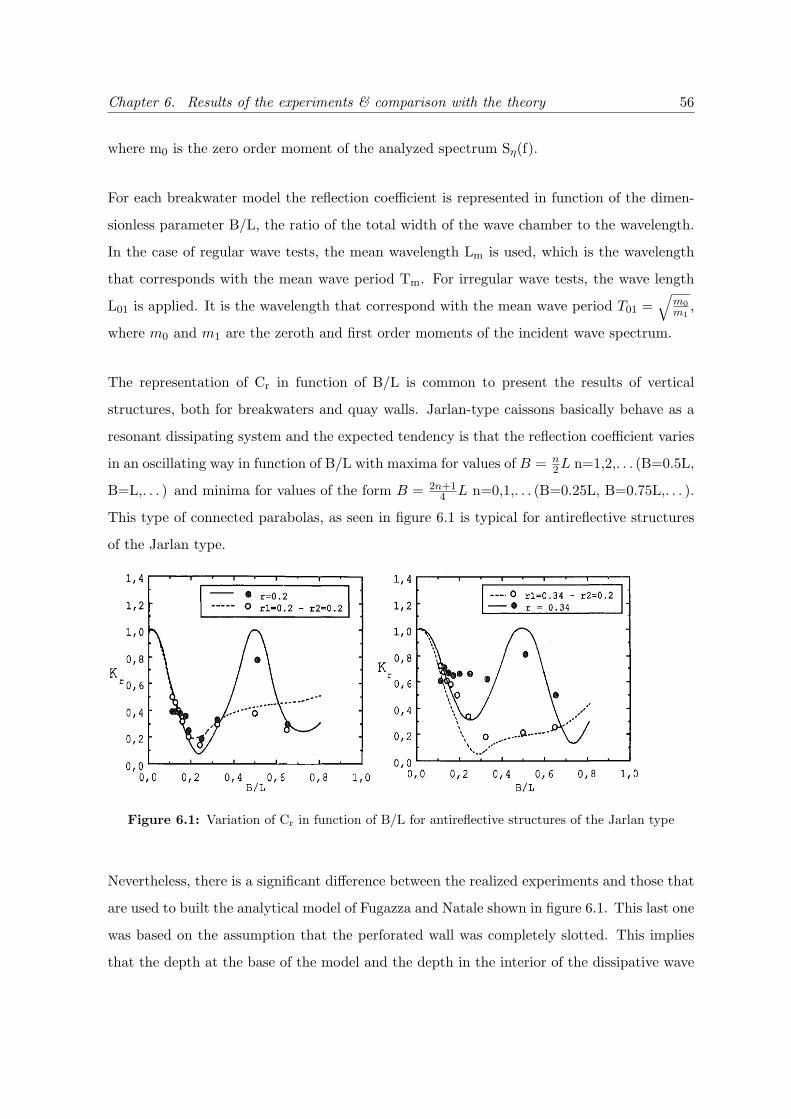
Chapter 6. Results of the experiments & comparison with the theory 56
where m0 is the zero order moment of the analyzed spectrum Sη(f).
For each breakwater model the reflection coefficient is represented in function of the dimen-
sionless parameter B/L, the ratio of the total width of the wave chamber to the wavelength.
In the case of regular wave tests, the mean wavelength Lm is used, which is the wavelength
that corresponds with the mean wave period Tm. For irregular wave tests, the wave length
L01 is applied. It is the wavelength that correspond with the mean wave period T01 =√
m0m1
,
where m0 and m1 are the zeroth and first order moments of the incident wave spectrum.
The representation of Cr in function of B/L is common to present the results of vertical
structures, both for breakwaters and quay walls. Jarlan-type caissons basically behave as a
resonant dissipating system and the expected tendency is that the reflection coefficient varies
in an oscillating way in function of B/L with maxima for values of B = n2L n=1,2,. . . (B=0.5L,
B=L,. . . ) and minima for values of the form B = 2n+14 L n=0,1,. . . (B=0.25L, B=0.75L,. . . ).
This type of connected parabolas, as seen in figure 6.1 is typical for antireflective structures
of the Jarlan type.
Figure 6.1: Variation of Cr in function of B/L for antireflective structures of the Jarlan type
Nevertheless, there is a significant difference between the realized experiments and those that
are used to built the analytical model of Fugazza and Natale shown in figure 6.1. This last one
was based on the assumption that the perforated wall was completely slotted. This implies
that the depth at the base of the model and the depth in the interior of the dissipative wave
Chapter 6. Results of the experiments & comparison with the theory 57
chambers is the same. But this is not the case for our experiments, or in general in practical
engineering. Therefore it is not expected that the results will be the same, still it is likely
that they have a similar form.
As discussed above, the reflection is related to the resonance inside the chamber and this
phenomenon depends on the wavelength. On the other hand, the wavelength depends on the
wave period and the depth. Because in our case the depth outside and inside the chamber is
different, the wavelength inside the chamber is different from the one outside. Therefore it
seems reasonable to examine the reflection coefficient in function of the normalized chamber
width (B/Lc), with Lc the wavelength inside the dissipating chamber, as proposed by Suh et
al. (2005).
After taking into account this preliminary consideration, it is possible to visualize the test
results and to have an idea how they match with the typical antireflective Jarlan kind.
6.2 Analysis of the results
To see the influence of the anti-reflective breakwater, the tests were first executed with the
same types of waves for a normal impermeable breakwater model. First all the results are
shown in function of the wave periods, so a quick comparison between the impermeable
breakwater model and the model where the cells are connected 2 by 2 can be made. As
mentioned it the chapters before, two different sections are made from this model type, with
two different internal depths. Regarding with their internal depth, these sections are named
’small window’ and ’big window’ as will be seen in the figures.
In figure 6.2 all the results are graphically united for the regular and irregular tests in function
of the wave period. As expected, the reflection coefficients are higher for the impermeable
model and they have values between 80% and 100%. In general the dissipation is more
effective for short periods because for these a bigger part of their energy is concentrated in
the upper part of the water column and is therefore likely to be dissipated by any of the
phenomena described in section 3.1.1.
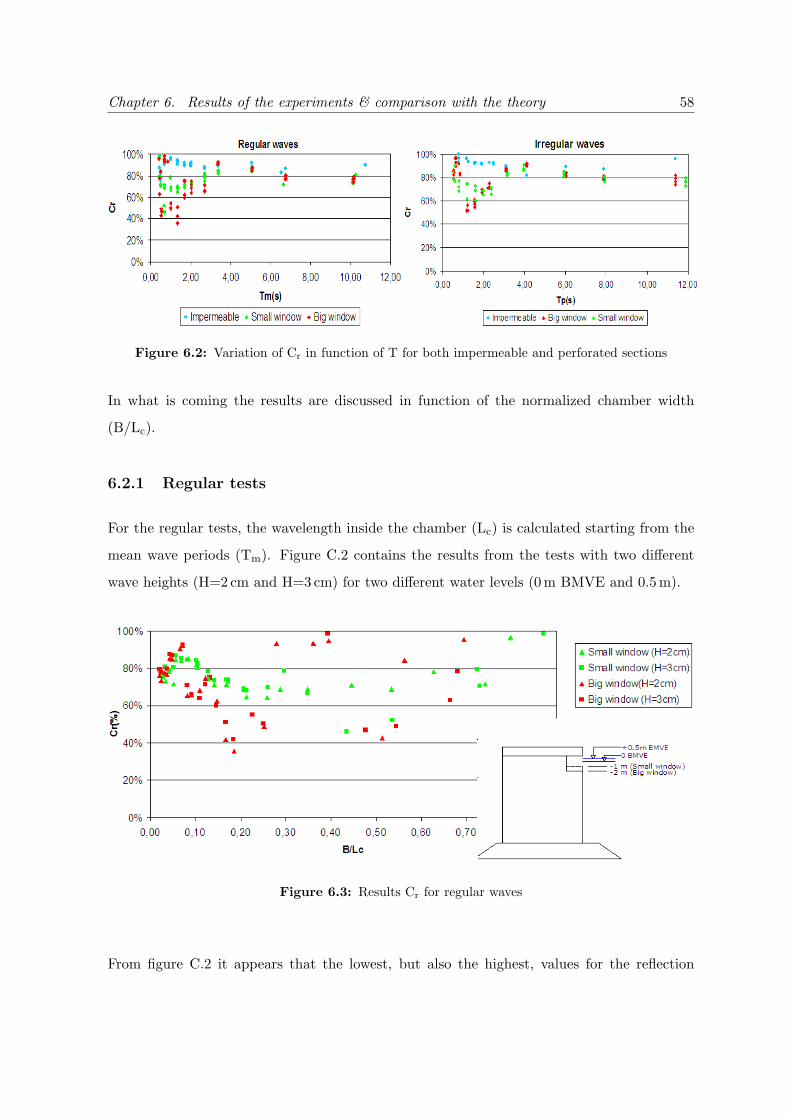
Chapter 6. Results of the experiments & comparison with the theory 58
Figure 6.2: Variation of Cr in function of T for both impermeable and perforated sections
In what is coming the results are discussed in function of the normalized chamber width
(B/Lc).
6.2.1 Regular tests
For the regular tests, the wavelength inside the chamber (Lc) is calculated starting from the
mean wave periods (Tm). Figure C.2 contains the results from the tests with two different
wave heights (H=2 cm and H=3 cm) for two different water levels (0 m BMVE and 0.5 m).
Figure 6.3: Results Cr for regular waves
From figure C.2 it appears that the lowest, but also the highest, values for the reflection
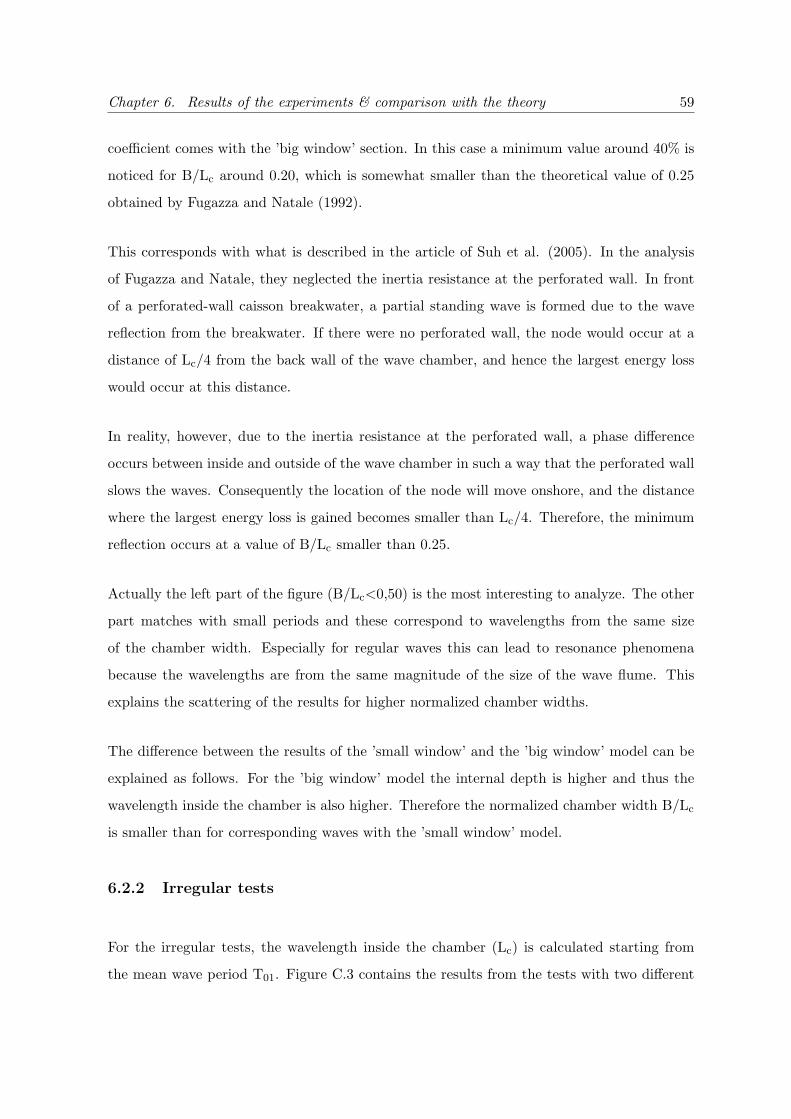
Chapter 6. Results of the experiments & comparison with the theory 59
coefficient comes with the ’big window’ section. In this case a minimum value around 40% is
noticed for B/Lc around 0.20, which is somewhat smaller than the theoretical value of 0.25
obtained by Fugazza and Natale (1992).
This corresponds with what is described in the article of Suh et al. (2005). In the analysis
of Fugazza and Natale, they neglected the inertia resistance at the perforated wall. In front
of a perforated-wall caisson breakwater, a partial standing wave is formed due to the wave
reflection from the breakwater. If there were no perforated wall, the node would occur at a
distance of Lc/4 from the back wall of the wave chamber, and hence the largest energy loss
would occur at this distance.
In reality, however, due to the inertia resistance at the perforated wall, a phase difference
occurs between inside and outside of the wave chamber in such a way that the perforated wall
slows the waves. Consequently the location of the node will move onshore, and the distance
where the largest energy loss is gained becomes smaller than Lc/4. Therefore, the minimum
reflection occurs at a value of B/Lc smaller than 0.25.
Actually the left part of the figure (B/Lc<0,50) is the most interesting to analyze. The other
part matches with small periods and these correspond to wavelengths from the same size
of the chamber width. Especially for regular waves this can lead to resonance phenomena
because the wavelengths are from the same magnitude of the size of the wave flume. This
explains the scattering of the results for higher normalized chamber widths.
The difference between the results of the ’small window’ and the ’big window’ model can be
explained as follows. For the ’big window’ model the internal depth is higher and thus the
wavelength inside the chamber is also higher. Therefore the normalized chamber width B/Lc
is smaller than for corresponding waves with the ’small window’ model.
6.2.2 Irregular tests
For the irregular tests, the wavelength inside the chamber (Lc) is calculated starting from
the mean wave period T01. Figure C.3 contains the results from the tests with two different
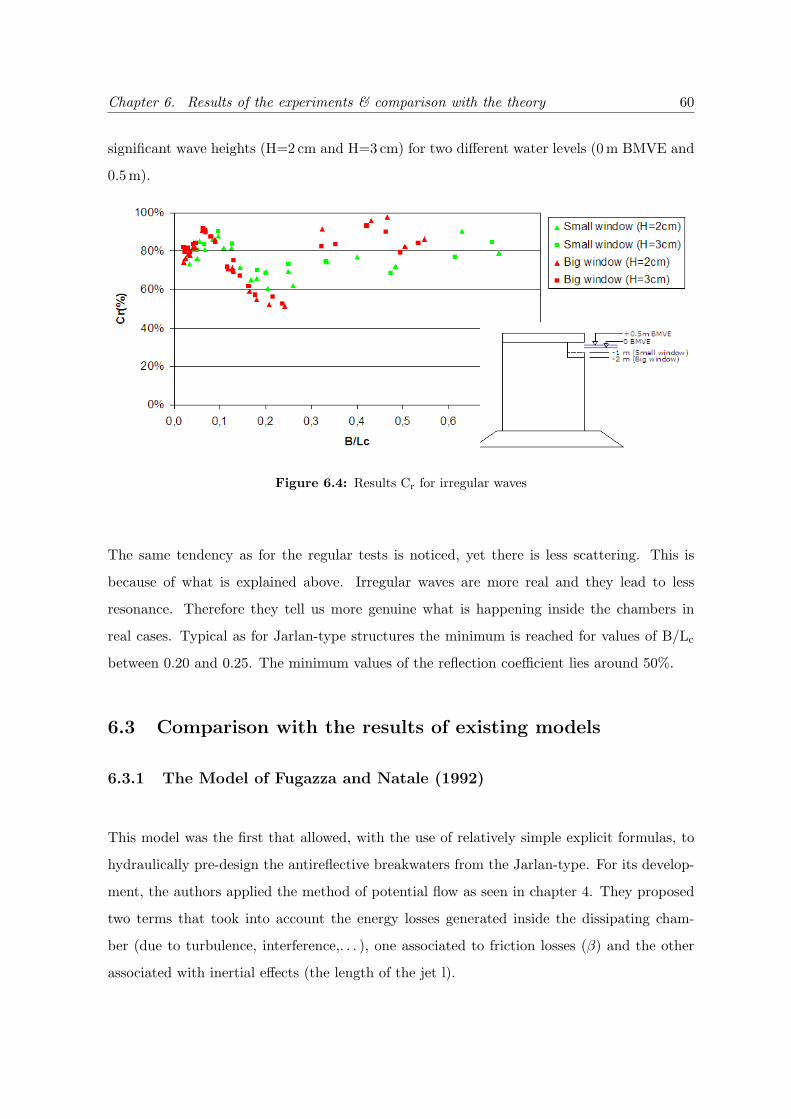
Chapter 6. Results of the experiments & comparison with the theory 60
significant wave heights (H=2 cm and H=3 cm) for two different water levels (0 m BMVE and
0.5 m).
Figure 6.4: Results Cr for irregular waves
The same tendency as for the regular tests is noticed, yet there is less scattering. This is
because of what is explained above. Irregular waves are more real and they lead to less
resonance. Therefore they tell us more genuine what is happening inside the chambers in
real cases. Typical as for Jarlan-type structures the minimum is reached for values of B/Lc
between 0.20 and 0.25. The minimum values of the reflection coefficient lies around 50%.
6.3 Comparison with the results of existing models
6.3.1 The Model of Fugazza and Natale (1992)
This model was the first that allowed, with the use of relatively simple explicit formulas, to
hydraulically pre-design the antireflective breakwaters from the Jarlan-type. For its develop-
ment, the authors applied the method of potential flow as seen in chapter 4. They proposed
two terms that took into account the energy losses generated inside the dissipating cham-
ber (due to turbulence, interference,. . . ), one associated to friction losses (β) and the other
associated with inertial effects (the length of the jet l).
Chapter 6. Results of the experiments & comparison with the theory 61
The linearized dissipation term β depends on the physical characteristics of the model and
on the wave conditions, but also depends on an a priori unknown dimensionless parameter
α. In the article of Fugazza and Natale, the authors proposed an expression for calculating
the parameter α for the case of circular perforations. They also assumed the length of the jet
equal to the thickness of the perforated wall, but later experimental studies have shown that
this is not entirely correct.
From our practical standpoint it is not unreasonable to use the same expression for α as the
one used by Fugazza and Natale in their model (Cc = 0.55) because the shape of the windows
that we have (a relatively large diameter) allows it. It should also be considered that we have
no better alternative. As for the length of the jet, it is assumed to be equal to the thickness
of the perforated wall as proposed by the authors.
Nonetheless, there is a an important limitation for this model. While the model is designed
for a completely perforated screen, with a profundity in the interior of the chambers that
is equal to the profundity of the base of the model, the MUCAR models are only partially
perforated and have an internal depth that is smaller than the outside water level.
The theoretical model was programmed into MATLAB to compare the experimental reflection
coefficients obtained by regular wave tests with the theoretical ones, and this for the two
depths as shown in figures 6.5(a) and 6.5(b). The unknown linear dissipation coefficients
β were obtained by numerical approximation with the multi-dimensional Newton-Raphson
method.
As can be observed, in both cases the results are unsatisfactory. However it is sure that
the mathematical model in which the depth is considered as the depth in the interior of
the chambers, is comparatively better. Nevertheless, it is clear that the model significantly
underestimates the reflection for any value of B/Lc, which indicates that this model is not
satisfactory.
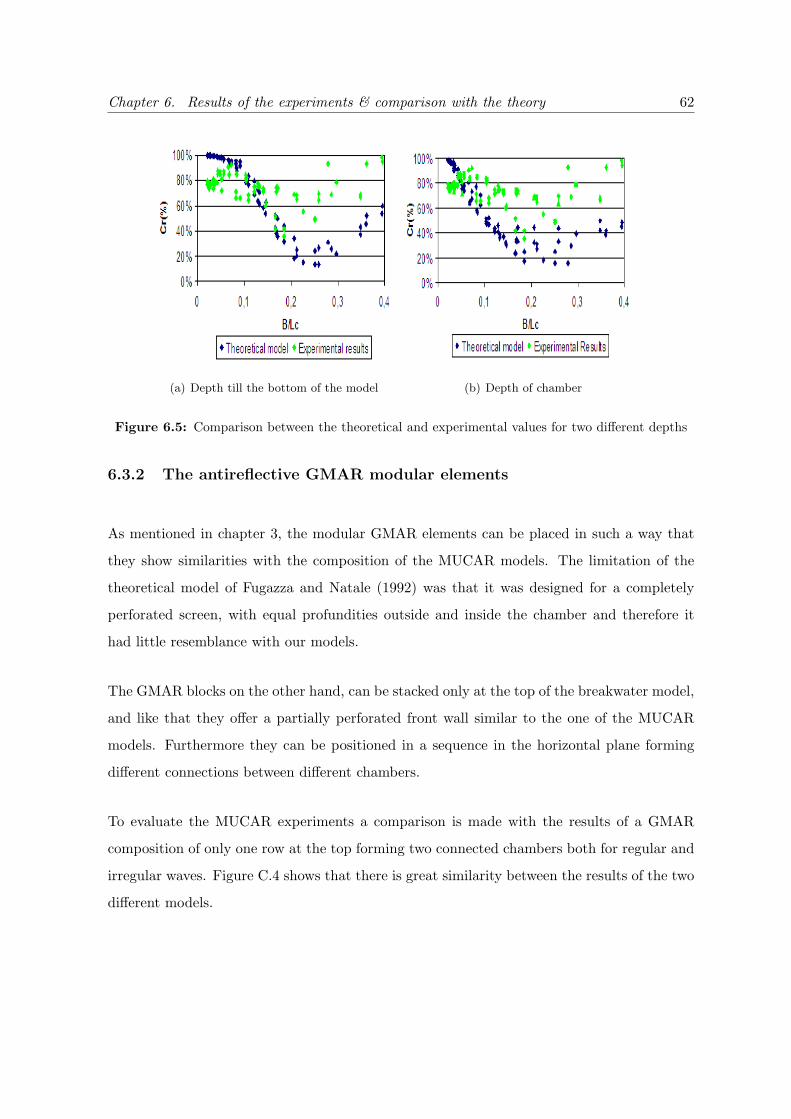
Chapter 6. Results of the experiments & comparison with the theory 62
(a) Depth till the bottom of the model (b) Depth of chamber
Figure 6.5: Comparison between the theoretical and experimental values for two different depths
6.3.2 The antireflective GMAR modular elements
As mentioned in chapter 3, the modular GMAR elements can be placed in such a way that
they show similarities with the composition of the MUCAR models. The limitation of the
theoretical model of Fugazza and Natale (1992) was that it was designed for a completely
perforated screen, with equal profundities outside and inside the chamber and therefore it
had little resemblance with our models.
The GMAR blocks on the other hand, can be stacked only at the top of the breakwater model,
and like that they offer a partially perforated front wall similar to the one of the MUCAR
models. Furthermore they can be positioned in a sequence in the horizontal plane forming
different connections between different chambers.
To evaluate the MUCAR experiments a comparison is made with the results of a GMAR
composition of only one row at the top forming two connected chambers both for regular and
irregular waves. Figure C.4 shows that there is great similarity between the results of the two
different models.
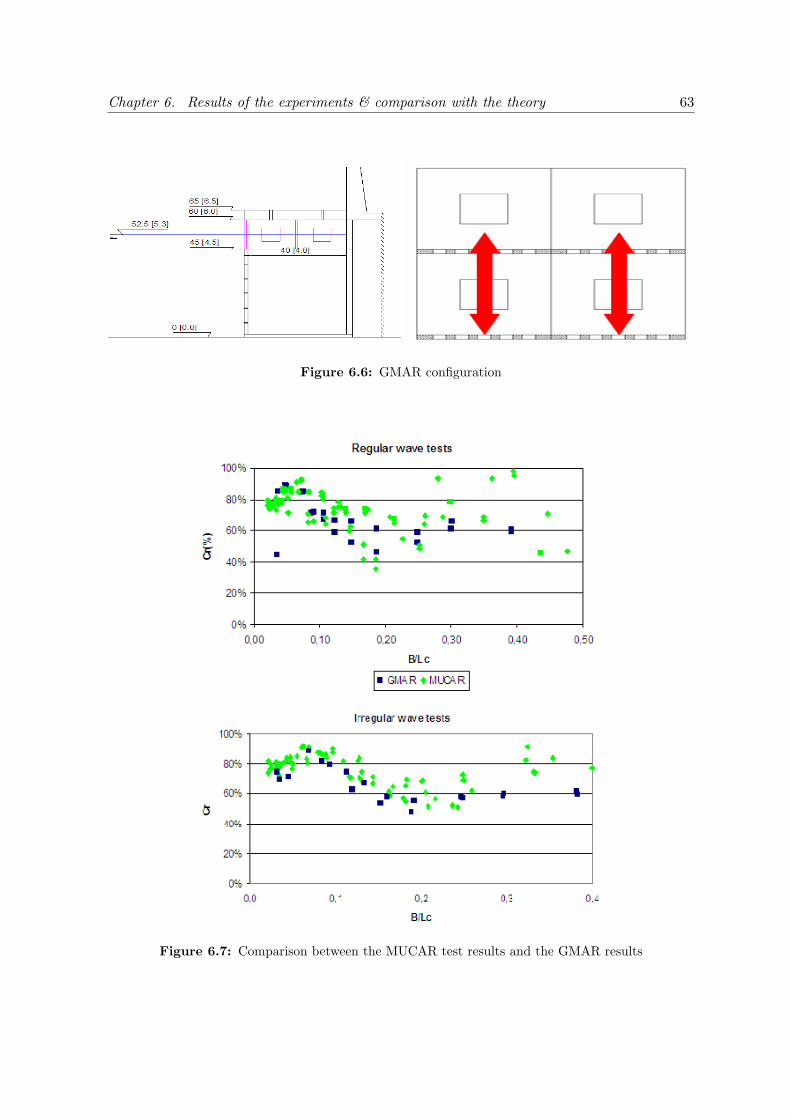
Chapter 6. Results of the experiments & comparison with the theory 63
Figure 6.6: GMAR configuration
Figure 6.7: Comparison between the MUCAR test results and the GMAR results
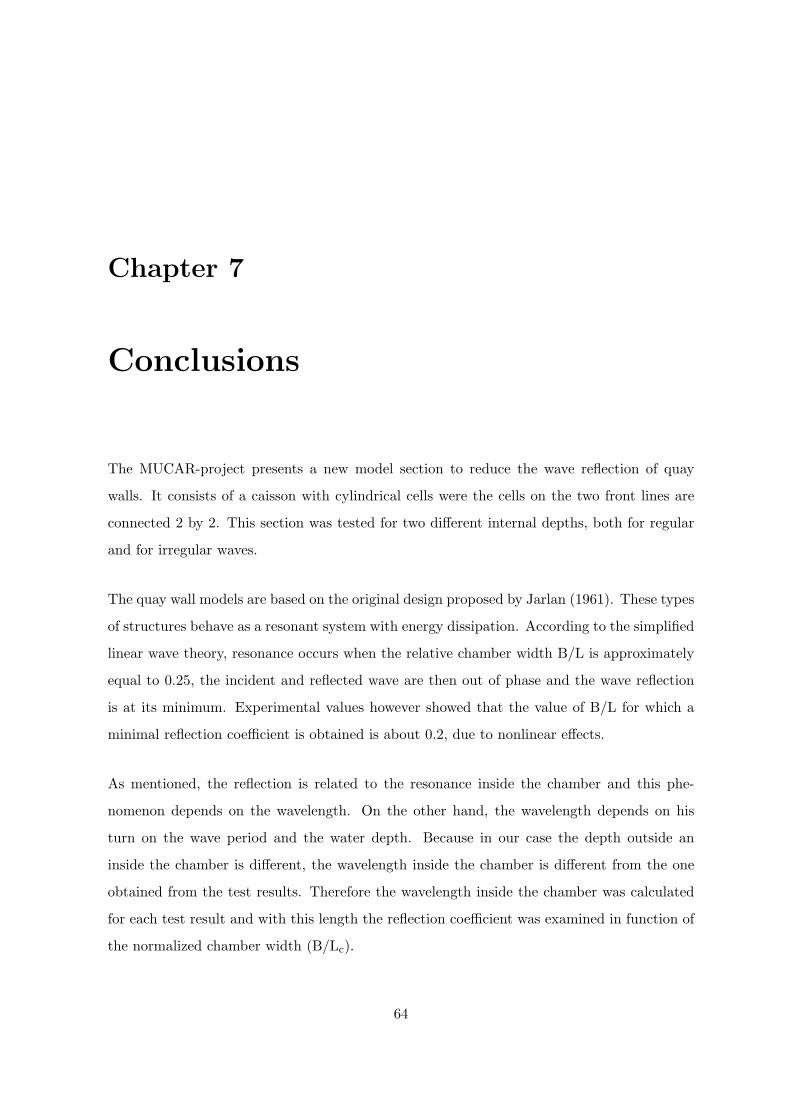
Chapter 7
Conclusions
The MUCAR-project presents a new model section to reduce the wave reflection of quay
walls. It consists of a caisson with cylindrical cells were the cells on the two front lines are
connected 2 by 2. This section was tested for two different internal depths, both for regular
and for irregular waves.
The quay wall models are based on the original design proposed by Jarlan (1961). These types
of structures behave as a resonant system with energy dissipation. According to the simplified
linear wave theory, resonance occurs when the relative chamber width B/L is approximately
equal to 0.25, the incident and reflected wave are then out of phase and the wave reflection
is at its minimum. Experimental values however showed that the value of B/L for which a
minimal reflection coefficient is obtained is about 0.2, due to nonlinear effects.
As mentioned, the reflection is related to the resonance inside the chamber and this phe-
nomenon depends on the wavelength. On the other hand, the wavelength depends on his
turn on the wave period and the water depth. Because in our case the depth outside an
inside the chamber is different, the wavelength inside the chamber is different from the one
obtained from the test results. Therefore the wavelength inside the chamber was calculated
for each test result and with this length the reflection coefficient was examined in function of
the normalized chamber width (B/Lc).
64
Chapter 7. Conclusions 65
The tested model gave for regular waves a minimum reflection coefficient of 40% in the range
B/Lc between 0.20 and 0.25. For the irregular and more realistic waves, the test outcome
was 50% in the same range. For the regular waves with small periods scattering was noted.
This because the wavelengths from these waves have values that make them more likely to
interfere in resonance phenomena.
When researching theoretical models it has to be mentioned that all these have different
assumptions regarding to the geometry. That is way no clear theoretical model can be found to
compare our results with. For example, some of them take into account rectangular chambers,
fully perforated front walls or circular shaped perforations, while our models are only partially
perforated in the upper part of the caisson, have rectangular slots and connected circular
chambers.
Nevertheless test results from the modular element GMAR were compared with the MUCAR
tests and these gave a good similarity. This because they have a lot of similarities in their
geometry. Although the GMAR elements have rectangular chamber shapes, they can be
placed in such a configuration that resembles to the MUCAR models, namely both perforated
in the upper part, with rectangular slots, and two chambers connected.
Appendix A
Nomenclature of the MUCAR
experiments
NAME OF THE EXPERIMENTS
Mxyz TUVW
by which:
M refers to the project MUCAR
”x” refers to the considered case
x=0 → Case totally impermeable Mediterranean
x=1 → Case totally impermeable Atlantic
x=2 → Case Mediterranean
x=3 → Case North
”y” refers to the height of the base of the chamber and to the material at the base of the
same (concrete or geotextile + stones):
y=0 → Impermeable
y=1 → Height of the base of the chamber -1m both for case North and case
Mediterranean. Base of concrete.
66
Appendix A. Nomenclature of the MUCAR experiments 67
y=2 → Height of the base of the chamber -2m for the case Mediterranean. Base
of concrete.
y=3 → Height of the base of the chamber -1m both for case North and case
Mediterranean. Base of geotextile + stones
y=4 → Height of the base of the chamber -2m for the case Mediterranean. Base
of geotextile + stones
”z” refers to the number of connected cells
z=0 → All impermeable
z=1 → Cells connected 2 by 2
z=2 → Multiple cells connected
”T” refers to the type of experiment
T=0 → Regular experiment
T=1 → Irregular experiment
”U” indicates the water levels
U=0 → Water level=0 (BMVE)
U=1 → Water level=+2m (case North) or +0.5m (case Mediterranean)
U=2 → Water level=+3m (case North)
U=3 → Water level=+4m (case North)
U=4 → Water level=+4.5m (case North)
”V” indicates the wave height at the slab of the wave generator (pala) (Values on the scale
of the prototype)
V=1 → Hpaddle =0.7m
V=2 → Hpaddle=1.05m
”W” indicates the wave period (Values on the scale of the prototype)
W=0 → T=2.5s
Appendix A. Nomenclature of the MUCAR experiments 68
W=1 → T=3s
W=2 → T=4s
W=3 → T=6s
W=4 → T=8s
W=5 → T=10s
W=6 → T=12s
W=7 → T=16s
W=8 → T=20s
W=9 → T=30s
W=10 → T=40s
W=11 → T=60s
Appendix B
Example of a test report
An example of a test report generated by the software LPCLab 3.6.
69
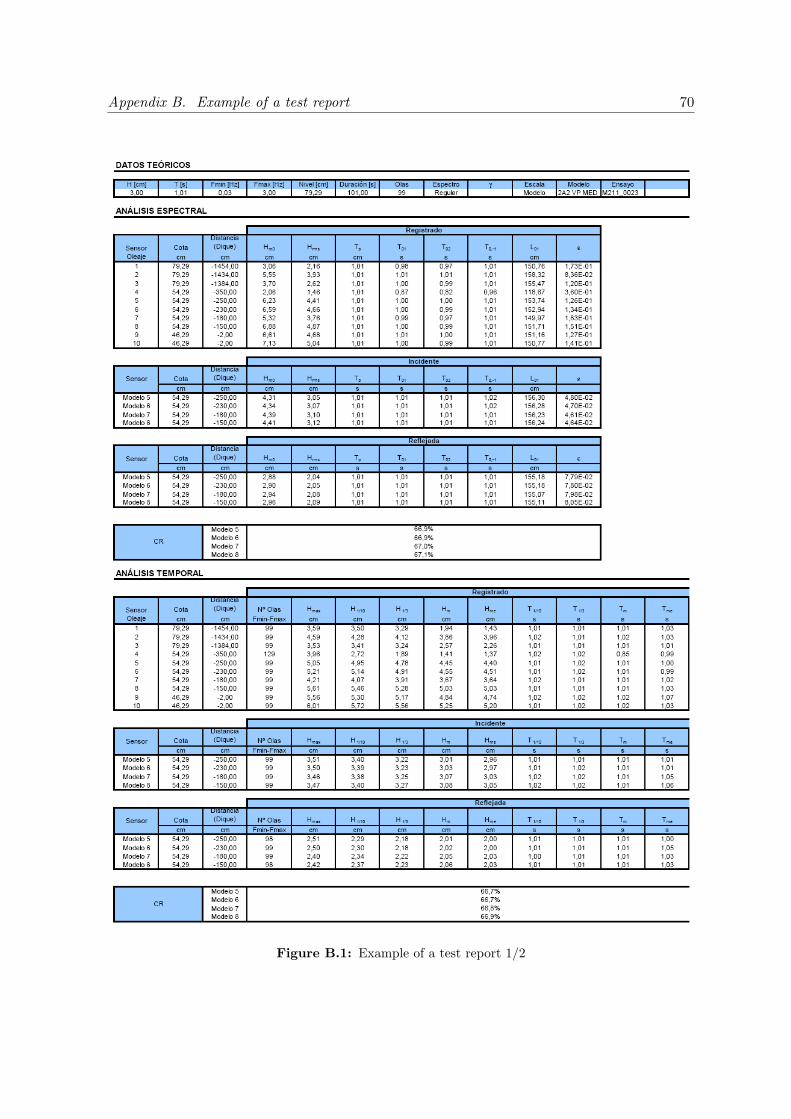
Appendix B. Example of a test report 70
Figure B.1: Example of a test report 1/2
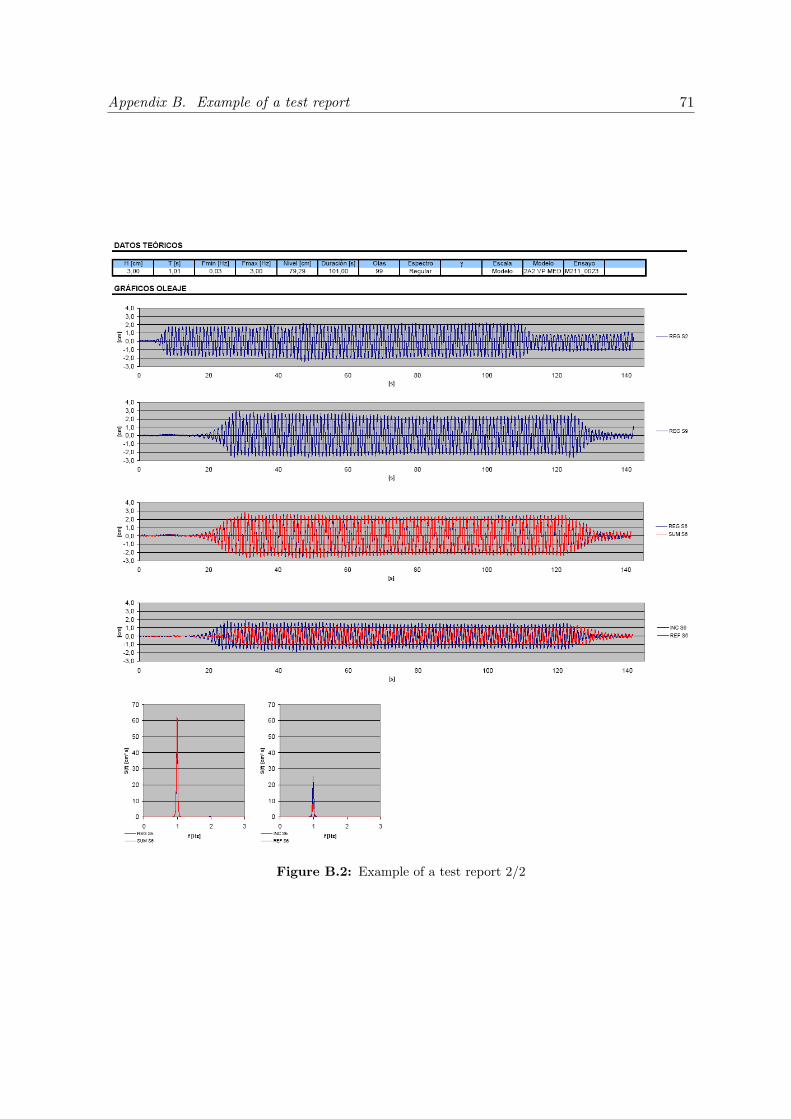
Appendix B. Example of a test report 71
Figure B.2: Example of a test report 2/2
Appendix C
Solution of the Linearized Wave
Problem
In this appendix the solution of the linearized wave problem, as presented in Appendix I of:
Fugazza M. , Natale L. (1992), ”Hydraulic performance of perforated breakwater”, Journal
of Waterway, Port, Coastal, and Ocean Eng., ASCE 118, pp. 1-14’,
can be found. This is used in Chapter 4 to derivate the model of Fugazza and Natale (1992).
72
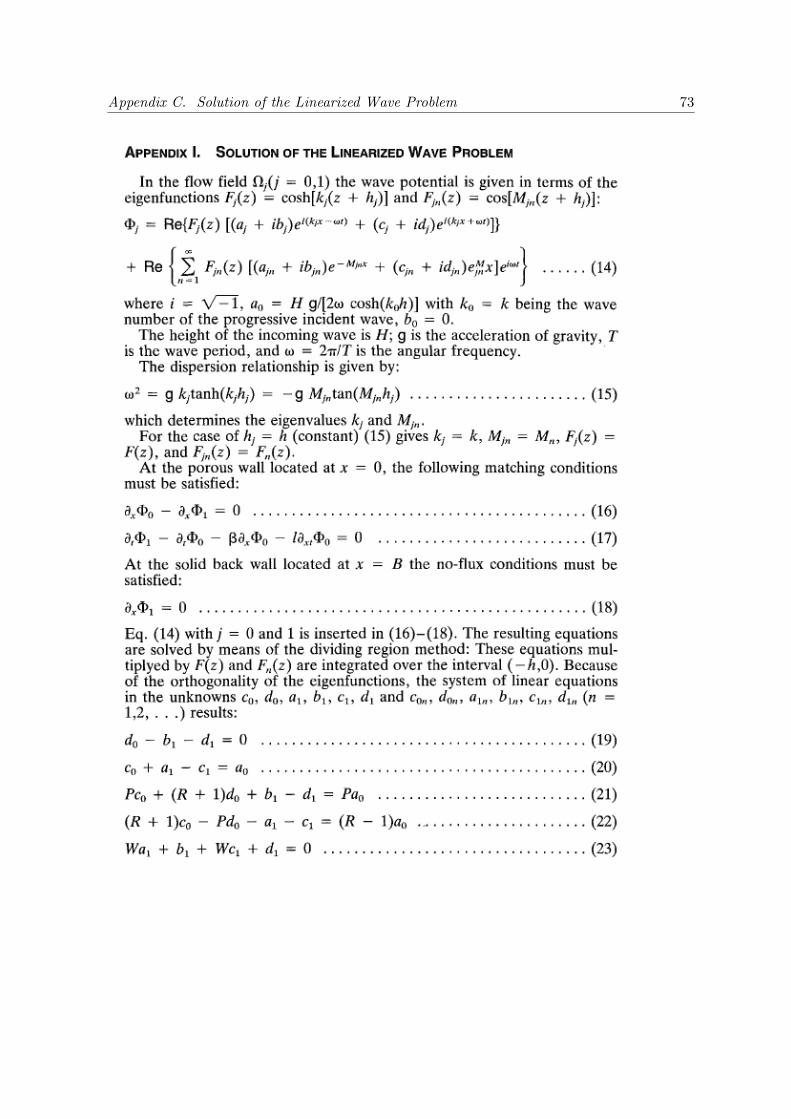
Appendix C. Solution of the Linearized Wave Problem 73
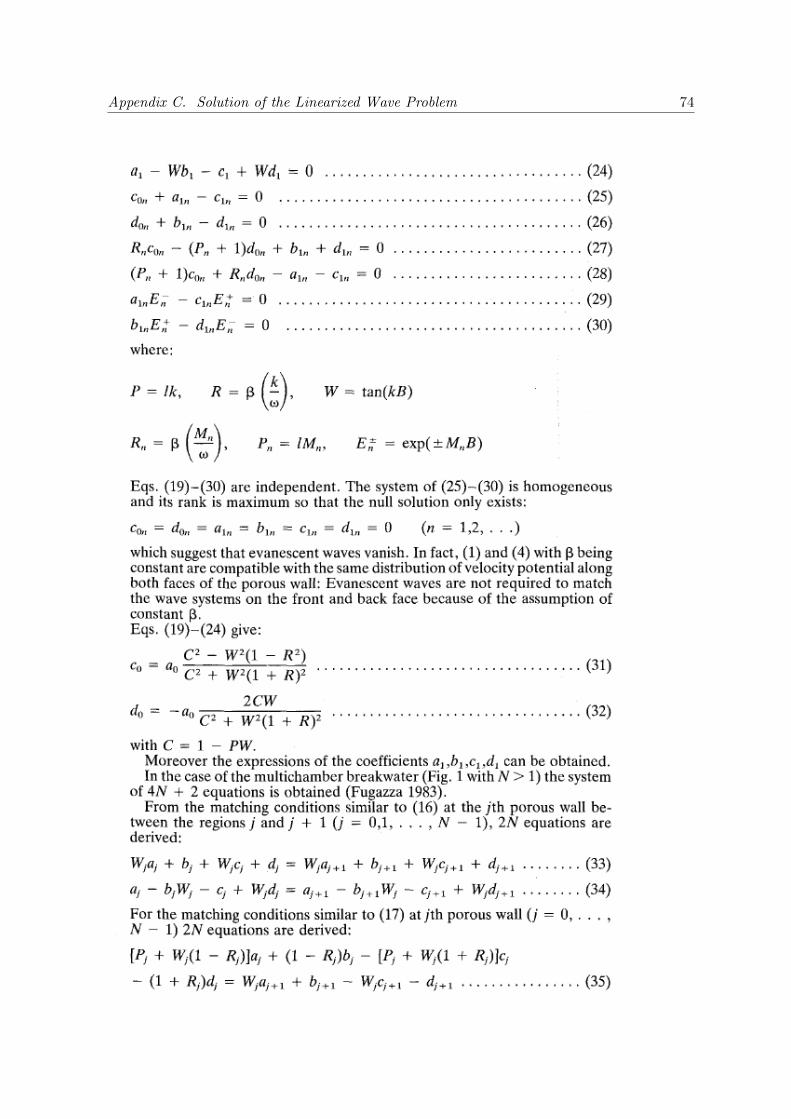
Appendix C. Solution of the Linearized Wave Problem 74
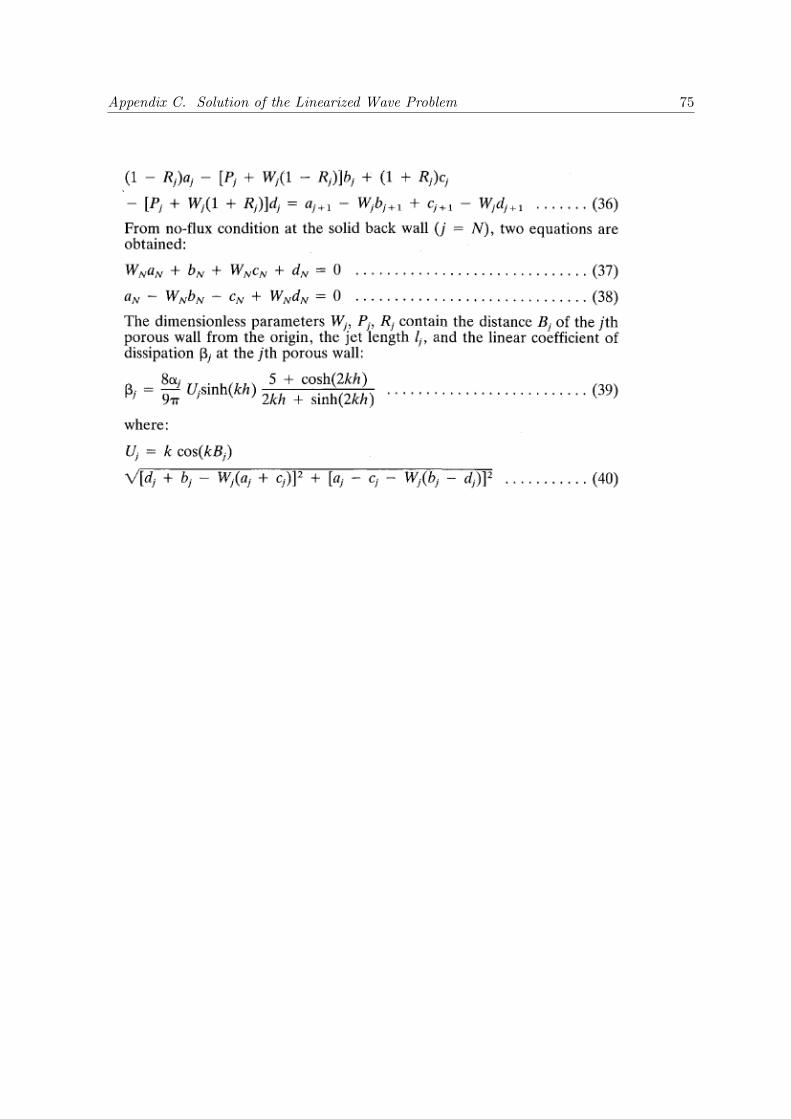
Appendix C. Solution of the Linearized Wave Problem 75
Bibliography
[•] Bergmannn, H. et al. (2000). ”Wave loads on perforated caisson breakwaters”, Proc.
Coastal Engineering, 2, pp. 1622-1635
[•] Dhinakaran, G. et al. (2002). ”Dynamic pressures and forces exerted on impermeable and
seaside perforated semicircular breakwaters due to regular waves” Ocean Engineering, 29,
pp.1981-2004.
[•] Figueres M. & Medina J.(2004). ”Estimation of incident and reflected waves using a fully
nonlinear wave model”. Proc. of the 29th Coastal Engineering Conference, pp. 594603.
[•] Franco, L., 1994. ”‘Vertical breakwaters: the Italian experience”’. Coastal Engineering,
22, 31- 55.
[•] Fugazza M. , Natale L. (1992), ”‘Hydraulic performance of perforated breakwater”’, Jour-
nal of Waterway, Port, Coastal, and Ocean Eng., ASCE 118, pp. 1-14
[•] Garrido, J.M, Figueres, M. y Medina, J.R. (2005). ”‘Estudio de la reflexion del oleaje
en diques verticales antirreflejantes”’, VIII Jornadas de Costas y Puertos, Sitges 2005,
A-104.
[•] Garrido, J.M. & Medina, J.R. (2006). ”‘Study of reflection of perforated vertical break-
waters”’, Proc. ICCE 2006, ASCE, (Vol. 5): 4325-4336.
[•] Garrido, J.M. y Medina, J.R. (2007). ”‘Modelo Neuronal para Estimar la Reflexion del
Oleaje en Diques Verticales Antirreflejantes”’. Libro de ponencias de las IX Jornadas
Espanolas de Costas y Puertos (proxima publicacion), p.203-204.
[•] Greslou, L. (1972) ”‘Chambre anti reflexion A.R.C.”’ (Brevet Sogreah). N.T. 1707.
76
Bibliography 77
[•] Hagiwara K. (1984). Analysis of upright structure for wave dissipation using integral
equation, Proc.19th Coastal Engineering Conference, ASCE, pp. 28102826.
[•] Ippen A.T. (1966), ”Estuary and coastline hydrodynamics”, McGraw-Hill Book Co., New
York, pp.506-507
[•] Jarlan G.E.(1961) , A perforated vertical breakwater , The Dock and Harbour Authority,
Vol.41 n°486, pp. 394-398.
[•] Jarlan G.E. (1965) , The application of acoustic theory to the reflective properties of
coastal engineering structures Quart. Bulletin, National Research Council Canada, pp.
23-64
[•] Jianyi, W. (1992). Experimental study of perforated caisson breakwater, China Ocean
Engineering, 6, pp. 65-78.
[•] Kakuno S. , Tsujimoto G. , Shiozaki Y. (2003). ”A design method for double slit-wall
breakwaters”, Coastal structures 2003, pp. 295-304
[•] ondo H. (1979), ”Analysis of breakwaters having two porous walls”, Int. Proc. Coastal
Stuctures 1979, Vol. 2, pp.962-977
[•] Marks, W and Jarlan G.E. (1968). ”Experimental studies on a fixed perforated breakwa-
ters” Coastal Engineering, 68, pp. 1121-1140.
[•] Medina J.(2000). ”Estimation of incident and reflected waves using simulated annealing”.
Journal of Waterways, Ports, Coastal and Oceanic Engineering, ASCE, 127(4):213221.
[•] Natale L. (1983), ”Reduction of clapotis in front of perforated breakwaters” Giornale del
Genio Civile, Sept. 1983, pp. 246-256 (in Italian)
[•] Suh K.D., Park W.S. (1995). ”Wave reflection from perforated-wall caisson breakwaters”,
Coastal Engineering 26, pp. 177193
[•] Suh K.D, Choi J.C., Kim H.B., Park W.S., Lee K.S. (2001), ”Reflection of irregular
waves from perforated-wall caisson breakwaters” , Coastal Engineering 44, pp. 141-151
[•] Suh, K.D. et al. (2006). ”Wave reflection from partially perforated-wall caisson breakwa-
ter” Ocean Engineering, Volume 33, Issue 2, pp. 264-280
Bibliography 78
[•] Tabet-Aoul, E. and Lambert, E. (2003). ”Tentative new formula for maximum horizontal
wave forces acting on perforated breakwater caisson” J. Wtrwy., Port, Coast., and Oc.
Engrg., Volume 129, Issue 1, pp. 34-40.
[•] Takahashi S. and Hosoyamada S. (1994). ”Hydrodynamic characteristics of sloping-top
caissons” Proc. of Int. Conf. on Hydro-technical Eng. for Port and Harbour Construction,
PHRI, 1994
[•] Takahashi, S., (1996). ”Design of vertical breakwater”, Reference Document, No. 34, Port
and Harbour Research Institute, 85 p.
[•] Takahashi, S. et al. (2002) ”Performance evaluation of perforated-wall caissons by VOF
numerical simulations” Proc. ICCE 2002, ASCE, pp. 1365-1376.
[•] Vanneste, D. (2005). ”Study of reflection behaviour of wave-absorbing vertical breakwaters
and quaywalls” Final year project UPV-LPC, chapter 3, pp.47-56.
[•] Wotton J.H. (1991) , ”Cellular coffer dams as breakwaters and coastal structures” Proc.
Conf. Coastal Structures and Breakwaters, ICE, Thomas Telford, London, November
1991, pp. 235-249
[•] Williams A. N., Mansour A.E., Leeet H. S. (2000) ”Simplified analytical solutions for
wave interaction with absorbing-type caisson breakwaters”. Ocean Engineering, 27 pp.
1231- 1248.
[•] Zhu S. , Chwang A.T. (2001) , ”Investigations on the reflection behaviour of a slotted
seawall” , Coast. Eng. 43, pp. 93-104
List of Figures
2.1 Construction of wave absorbing cells in caissons with circular cells . . . . . . 5
2.2 Cells connected 2 by 2 . . . . . . . . . . . . . . . . . . . . . . . . . . . . . . . 6
3.1 Jarlan-type perforated-wall braeakwater . . . . . . . . . . . . . . . . . . . . . 11
3.2 Relationship between CR and B/L for 2 and 3 chambers with Neural Networks
(NN) . . . . . . . . . . . . . . . . . . . . . . . . . . . . . . . . . . . . . . . . . 15
3.3 Relationship between CR and B/L for 1 chamber with Neural Networks (NN) 16
3.4 Anti-reflective breakwater ES 2,301,402 (UPV, 2008) . . . . . . . . . . . . . . 17
3.5 Low reflection structure ES 2,262,405 (FCC CONSTRUCCION S.A., 2006) . 18
3.6 Breakwater dike ES 2232248 (DRAGADOS S.A., 2005) . . . . . . . . . . . . . 18
3.7 Waves-breaking type caisson JP6002316 (DAIHO CONSTRUCTION CO, 1994) 19
3.8 Waves dissipating caisson JP7090825 (KUBOTA KK, 1995) . . . . . . . . . . 19
3.9 Waves dissipating cell structure JP10168851 (SUMITOMO METAL IND, 1998) 20
3.10 Breakwater and wave damping caisson of shore protection JP54162828 (Kat-
sutoshi, T.,1979) . . . . . . . . . . . . . . . . . . . . . . . . . . . . . . . . . . 20
3.11 Seperating and combining type breakwater revetment JP58000508 (NIPPON
DEV CONSULT, 1983) . . . . . . . . . . . . . . . . . . . . . . . . . . . . . . 20
3.12 Cross section of the Comeau Bay breakwater, Canada . . . . . . . . . . . . . 21
3.13 Typical section of a vertical slit caisson, Nagasaki port . . . . . . . . . . . . . 22
79
List of Figures 80
3.14 Cross section of a caisson with curved front wall, Funakawa port, Japan . . . 23
3.15 Breakwater with semicircular caisson, Miyazaki port, Japan . . . . . . . . . . 24
3.16 Breakwater with cilindrical chamber . . . . . . . . . . . . . . . . . . . . . . . 24
3.17 Sketch of New Kelsey Bay Breakwater, Canada . . . . . . . . . . . . . . . . . 25
3.18 Cross section of a box-type breakwater, Osaka harbour, Japan . . . . . . . . 26
3.19 Sloping-slit caisson breakwater, port of Niigata . . . . . . . . . . . . . . . . . 26
3.20 Cylindrical cribwork using steel hoops . . . . . . . . . . . . . . . . . . . . . . 28
3.21 Types of special voided concrete blocks, with mention of the patent number,
inventor and date of registration . . . . . . . . . . . . . . . . . . . . . . . . . 29
3.22 Warock block . . . . . . . . . . . . . . . . . . . . . . . . . . . . . . . . . . . . 30
3.23 Section of a quay constructed with WAROCK blocks in the harbour of Odo,
Japan . . . . . . . . . . . . . . . . . . . . . . . . . . . . . . . . . . . . . . . . 31
3.24 The BARA block and its alternated (middle) and piled up (right) placing . . 32
3.25 Aplication of BARA blocks on floating caissons . . . . . . . . . . . . . . . . . 32
3.26 The modular element GMAR . . . . . . . . . . . . . . . . . . . . . . . . . . . 33
4.1 Sketch of a perforated-wall vertical breakwaterr and design parameters . . . . 35
4.2 Definition sketch and Coordinate System . . . . . . . . . . . . . . . . . . . . . 37
5.1 Longitudinal section of the 2D wave flume . . . . . . . . . . . . . . . . . . . . 41
5.2 Picture of the 2D wave flume in the LPC-UPV . . . . . . . . . . . . . . . . . 42
5.3 The wave generator and its parts . . . . . . . . . . . . . . . . . . . . . . . . . 43
5.4 Wave gauges for wave measurement . . . . . . . . . . . . . . . . . . . . . . . 44
5.5 The equipment of the control room . . . . . . . . . . . . . . . . . . . . . . . . 45
5.6 Preparing the base material . . . . . . . . . . . . . . . . . . . . . . . . . . . . 47
5.7 The model base installed . . . . . . . . . . . . . . . . . . . . . . . . . . . . . . 47
List of Figures 81
5.8 Filling behind the model . . . . . . . . . . . . . . . . . . . . . . . . . . . . . . 47
5.9 Pepe making the 2by2 model . . . . . . . . . . . . . . . . . . . . . . . . . . . 47
5.10 Impermeable model with wave sensors in front . . . . . . . . . . . . . . . . . 47
5.11 Installing the 2by2 model . . . . . . . . . . . . . . . . . . . . . . . . . . . . . 47
5.12 Generador Oleaje . . . . . . . . . . . . . . . . . . . . . . . . . . . . . . . . . . 51
5.13 Parameter window of the LASA-V software, used to separate incident and
reflected wave trains . . . . . . . . . . . . . . . . . . . . . . . . . . . . . . . . 52
5.14 Example of the separation of incident and reflected wave trains by LASA V . 53
5.15 Parameter window of the LPCLab software, used to analyse the separated wave 54
6.1 Variation of Cr in function of B/L for antireflective structures of the Jarlan type 56
6.2 Variation of Cr in function of T for both impermeable and perforated sections 58
6.3 Results Cr for regular waves . . . . . . . . . . . . . . . . . . . . . . . . . . . . 58
6.4 Results Cr for irregular waves . . . . . . . . . . . . . . . . . . . . . . . . . . . 60
6.5 Comparison Fugazza and Natale . . . . . . . . . . . . . . . . . . . . . . . . . 62
6.6 GMAR configuration . . . . . . . . . . . . . . . . . . . . . . . . . . . . . . . . 63
6.7 Comparison between the MUCAR test results and the GMAR results . . . . 63
B.1 Example of a test report 1/2 . . . . . . . . . . . . . . . . . . . . . . . . . . . 70
B.2 Example of a test report 2/2 . . . . . . . . . . . . . . . . . . . . . . . . . . . 71
C.1 Schets van een verticale geperforeerde-wand golfbreker en de ontwerpparameters 5
C.2 Coefficienten Cr voor onregelmatige golven . . . . . . . . . . . . . . . . . . . . 7
C.3 Coefficienten Cr voor onregelmatige golven . . . . . . . . . . . . . . . . . . . . 8
C.4 Vergelijking tussen de MUCAR proefresultaten en de GMAR resultaten . . . 10
List of Tables
5.1 Distance of the sensors from the paddle of the wave generator . . . . . . . . . 45
5.2 The models tested for different water levels and for different internal depths 48
5.3 Regular tests for Mediterranean case . . . . . . . . . . . . . . . . . . . . . . 48
5.4 Irregular tests for Mediterranean case . . . . . . . . . . . . . . . . . . . . . . 50
82
Ontwerp van een nieuw antireflecterend caisson:
Nederlandstalige samenvatting
Steven Feys
Promotoren: Prof. dr. ir. J. De Rouck, Prof. dr. J.R. Medina
Masterproef ingediend tot het behalen van de academische graad:
Master in de ingenieurswetenschappen: bouwkunde
Academiejaar 2008-2009
School of Civil engineering Faculteit ingenieurswetenschappen
Laboratory of Ports and Coasts Vakgroep Civiele techniek
Head: Prof. dr. J.R. Medina Voorzitter: Prof. dr. ir. J. De Rouck
Voorwoord
Dit document is de Nederlandstalige samenvatting van mijn masterproef met als titel ’Ontwerp
van een nieuw antireflecterend caisson’. Het eigenlijke afstudeerwerk is uitgevoerd in de
context van een Erasmus-programma aan de Spaanse universiteit ’Universidad Politecnica de
Valencia (UPV)’ en is daardoor geschreven in het Engels. Hiervoor werd ik betrokken bij
de onderzoeken in het haven- en kustlaboratorium ’Laboratorio de Puertos y Costas (LPC)’
onder leiding van mijn plaatselijke promotor J.R. Medina.
1 Introductie
Tot enkele jaren geleden waren de meest gebruikte golfbrekers de stortsteengolfbrekers. Deze
hebben als voornaamste doel om de aankomende golven te breken tegen een ruwe helling van
zware rotsen of speciaal gevormde betonnen ’armour-units’ en de golfenergie zo op te vangen
in de holle ruimtes tussen deze elementen. Dit type golfbreker is uitstekend geschikt voor
locaties met geringe diepte, sterke golfslag en heterogene zeebodem.
De laatste decennia is er echter meer en meer vraag naar de uitbreiding van de bestaande
havens alsook naar de verdieping ervan. Daardoor ontstond er een grote groei in de con-
structie van de verticale-wand caissongolfbrekers. Deze bieden een beter alternatief voor de
bescherming op grotere dieptes en kunnen in het algemeen de hydraulische prestaties ver-
beteren en de totale kosten, de constructietijd en het onderhoud verlagen. Ook is het met dit
soort erg eenvoudig om aanlegplaatsen te creeren voor schepen.
Bij deze verticale golfbrekers wordt een groot deel van de inkomende energie van de golven
gereflecteerd door de ondoordringbare wand. Deze hoge reflectie kan enkele belangrijke nade-
len met zich mee brengen. Zo kan de interactie van de inkomende en gereflecteerde golven
leiden tot steile en onstabiele golven die het moeilijker maken voor schepen om aan te meren
en te manoeuvreren in de havens.
Als gevolg daarvan zijn verscheidene verticale-wand golfbrekers en kaaimuren ontwikkeld die
1
minder reflecterende eigenschappen hebben en zo de genoemde nadelen beperken. De eerste
goed gedocumenteerde innovatie is gedaan door Jarlan (1961) die het idee introduceerde van
een energieabsorberende kamer met geperforeerde voorwand en ondoordringbare achterwand.
Het R&D-project MUCAR (Spaanse afkorting voor ”Muelles de Cajones Antirreflejantes”,
wat ”Kaaimuren van Antireflecterende Caissons” betekent) heeft als doel een nieuw caisson
voor kaaimuren te ontwikkelen die de beperkingen van de gewone verticale caissons overwint.
Hiervoor worden er experimenten uitgevoerd in het laboratorium LPC aan de Spaanse uni-
versiteit UPV. Het reflectief gedrag van 2 golfbrekersecties van het Jarlan-type wordt getest
in de golfgoot van het laboratorium voor verschillende golf- en zeecondities.
2 Het MUCAR project
Het MUCAR project heeft als doel de reflectie van de kademuren van commerciele havens
te verminderen en dit voor kades die zijn gebouwd met drijvende caissons. Het is wenselijk
dit te doen zonder ingrijpende gevolgen in zowel de procedure, de duur als de kosten van de
productie van conventionele caissons.
Het verlagen van de reflectie van kaaimuren heeft duidelijke voordelen. Toch schieten de
bestaande oplossingen nog te kort. In principe kunnen de bestaande oplossingen onderverdeeld
worden in 2 categorieen. Enerzijds zijn er de ’theoretische’ oplossingen die zijn gebaseerd op
patenten of specifieke ontwerpen, maar die zijn in de praktijk meestal heel duur en moeilijk
toe te passen. Anderzijds zijn er de ’praktische’ oplossingen die zijn gebaseerd op het snijden
van holtes in reeds bestaande caissons. Dit wordt dan bijvoorbeeld gedaan met gebruik van
snijmachines met diamantdraad.
Het moet echter mogelijk zijn om het vervaardigingproces van het caisson zo aan te passen
zodat er een caisson verkregen wordt die functioneel gelijk is aan de vorige, maar waarbij er
niet moet gesneden worden en waardoor zo de vertragingen, de meerkost en de bijkomende
nadelen die dit snijden met zich meebrengt, geelimineerd worden.
2
Om dit te bekomen hebben 3 partijen zich verenigd in het MUCAR project. Eerst zijn
er de ingenieurs van het bedrijf Iberport Consulting die experts zijn in de berekening en
ontwikkeling van prefab drijvende caissons. Ten tweede zijn er de ingenieurs en technici
van het Spaanse bouwbedrijf Cyes. Dit bedrijf is fabrikant van caissons met cirkelvormige
cellen en zou dan ook de nieuw ontwikkelde caisson op de markt brengen. En ten laatste
zijn er de professoren van de UPV die eerder al uitgebreid onderzoek hebben gedaan naar
antireflecterende structuren?
Bij de 2D experimenten in het LPC worden twee verschillende modellen met twee verschillende
connecties tussen de cellen en 2 verschillende interne dieptes voor elke model getest. De
proeven moeten hoofdzakelijk, vooral voor dit afstudeerwerk, de reflectie van elk bepalen.
De modellen worden onderzocht voor zowel regelmatige als onregelmatige golven en voor 2
verschillende zeecondities.
3 State of the art
De maritieme antireflecterende structuren baseren zich op het principe van energiedissiperende
kamers met geperforeerde wanden. De inkomende golven worden gedeeltelijk gereflecteerd op
de eerste voorwand en dringen deels door 1 of meerdere kamers van het caisson om dan
met een faseverschil gereflecteerd te worden tegen de ondoordringbare achterwand. Deze
teruggekaatste golven interfereren met de eerstgenoemde ter hoogte van de voorwand. Het
energieverlies volgt dan uit de viscositeit van de stroom wanneer deze door de perforaties in
de wanden gaat, en de turbulentie die dit met zich mee brengt, en uit de interferentie tussen
de golven.
In het geval van een enkele kamer hangen deze verliezen voornamelijk af van de golfperiodes
en van de afstand (B) tussen de geperforeerde voorwand en de achterwand. Het maximale
energieverlies treedt op wanneer de snelheid van het water, die opgewekt is door de golven
die tegen de muur aan botsen, haar maximum bereikt ter hoogte van de geperforeerde wand.
Dit gebeurt wanneer de breedte van de kamer ongeveer een kwart van de golflengte (L) in de
kamer bedraagt. Omgekeerd zal het verlies het laagste zijn wanneer deze snelheid minimaal
3
is en bijgevolg is de enkele kamer niet efficient. Daarom bestaan er optimale afmetingen voor
zowel de geperforeerde wand als voor de kamer om tot een minimale reflectie te komen.
Anderzijds is er energieverlies binnenin de kamer te wijten aan andere factoren, zoals de
interactie van de waterstralen die uit de openingen van de geperforeerde wand komen met het
opgeslagen water in de kamer. Bovendien kan het verschil in diepte tussen de binnenkant en
de buitenkant van de kamer worden beschouwd als een extra bron van energiedissipatie. Dit
alles, samen met de vele geometrische veranderlijken en de verschillende zee- en golfcondities,
maakt de studie van het hydraulisch gedrag van dit soort structuren zeer complex.
Uitgaande van het oorspronkelijk idee dat gepresenteerd werd doorn Jarlan (1961, 1965) en
de toepassingen hiervan in Canada (Comeau Bay, 1966) en in Japan (Kobe Port, 1969 en
Takamatsu Port, 1970) zijn er vele varieteiten gerealiseerd door de jaren heen, met name in
Japan.
Bij de meest gebruikte onderscheiden we de geperforeerde-wand caissons voor de constructie
van verticale golfbrekers, de structuren gevormd door een of meerdere schermen met verschil-
lende porositeit en onderlinge afstand, en de geprefabriceerde blokken die gebruikt worden
voor kaaimuren. Typerend is dat de wanden verticale of horizontale groeven hebben ofwel
cirkelvormige of rechthoekige perforaties. De porositeit van de wanden, gedefinieerd als de
verhouding tussen het geperforeerde gebied en de totale oppervlakte van de wand, ligt meestal
tussen de 15 en de 40 %. De kamerbreedte neemt doorgaans waarden aan tussen 1/10 en 1/4
de van de lokale golflengte.
Kortom er is een breed scala van typologieen van maritieme antireflecterende structuren en
het gebruik ervan blijft stijgen. Toch is de kennis over het complexe hydrodynamische gedrag
in relatie met het ontwerp ervan beperkt. Daarom zijn er een hoop empirische, theoretische
en numerieke modellen ontworpen om het complexe hydrodynamische verschijnsel van golf-
absorptie te beschrijven. In het eigenlijke afstudeerwerk staan dan ook de meest interessante
modellen in verband met dit project beschreven.
In de maritieme techniek zijn er talrijke patenten voor antireflecterende verticale golfbrekers en
4
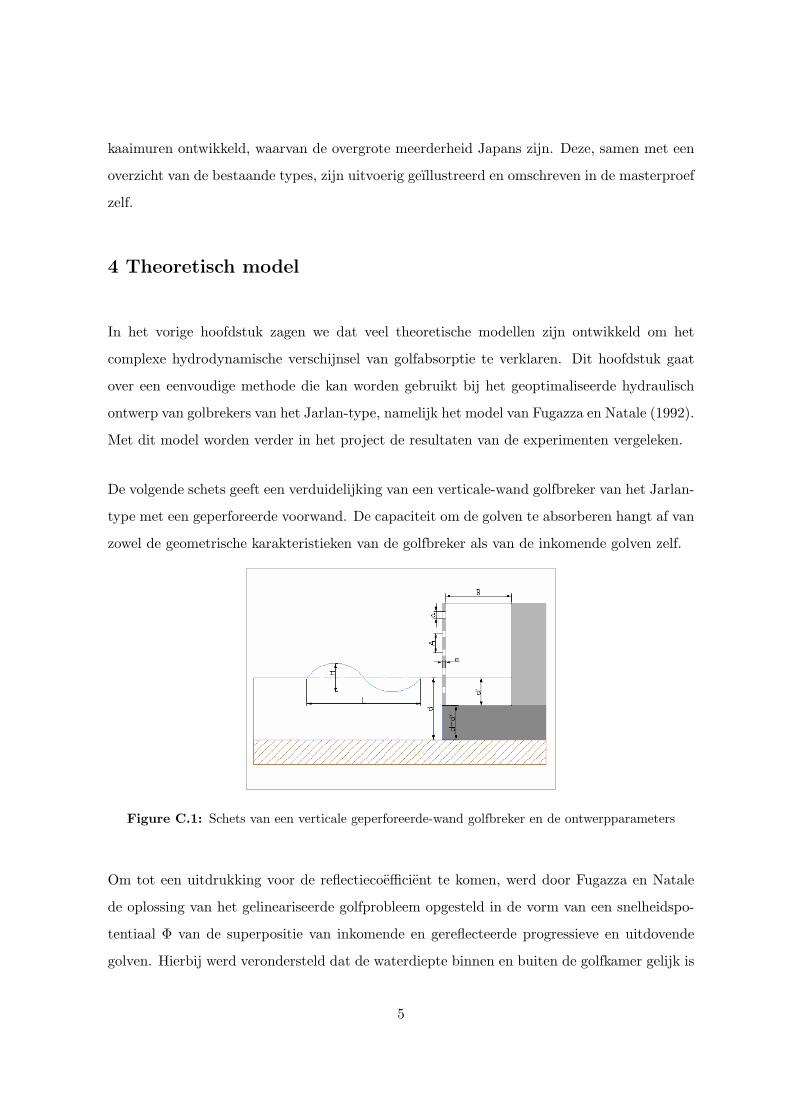
kaaimuren ontwikkeld, waarvan de overgrote meerderheid Japans zijn. Deze, samen met een
overzicht van de bestaande types, zijn uitvoerig geıllustreerd en omschreven in de masterproef
zelf.
4 Theoretisch model
In het vorige hoofdstuk zagen we dat veel theoretische modellen zijn ontwikkeld om het
complexe hydrodynamische verschijnsel van golfabsorptie te verklaren. Dit hoofdstuk gaat
over een eenvoudige methode die kan worden gebruikt bij het geoptimaliseerde hydraulisch
ontwerp van golbrekers van het Jarlan-type, namelijk het model van Fugazza en Natale (1992).
Met dit model worden verder in het project de resultaten van de experimenten vergeleken.
De volgende schets geeft een verduidelijking van een verticale-wand golfbreker van het Jarlan-
type met een geperforeerde voorwand. De capaciteit om de golven te absorberen hangt af van
zowel de geometrische karakteristieken van de golfbreker als van de inkomende golven zelf.
Figure C.1: Schets van een verticale geperforeerde-wand golfbreker en de ontwerpparameters
Om tot een uitdrukking voor de reflectiecoefficient te komen, werd door Fugazza en Natale
de oplossing van het gelineariseerde golfprobleem opgesteld in de vorm van een snelheidspo-
tentiaal Φ van de superpositie van inkomende en gereflecteerde progressieve en uitdovende
golven. Hierbij werd verondersteld dat de waterdiepte binnen en buiten de golfkamer gelijk is
5
en dat de inkomende golven monochromatisch zijn, een kleine amplitude hebben en loodrecht
invallen.
5 Experimenten
Zoals eerder vermeld worden de experimenten uitgevoerd in het laboratorium LPC aan de
UPV. Naast andere apparatuur, beschikt dit laboratorium over een 2D golfgoot van 30 m
lang en een doorsnede van 1,2 m x 1,2 m.
De golfgoot is uitgerust met een generator die zowel regelmatige als onregelmatige golven kan
opwekken. Deze invallende golven reflecteren door interactie met het golfbrekermodel in de
golfgoot en de gereflecteerde golven keren terug naar de golfgenererende zijde. Om deze golven
op te vangen en de zijde als het ware ’open’ te maken en zo het probleem van re-reflectie te
reduceren, is de generator verbonden met het digitale controle systeem AWACS.
De golfhoogte wordt gemeten door 10 golfhoogtemeters. Deze hoogtemeters bestaan uit 2
verticale parallelle geleiders die het water tussen hen als dielectricum gebruiken. Op deze
manier wordt het verschil van waterniveaus gemeten als variatie van capaciteit.
De 2 verschillende geperforeerde modellen van het MUCAR project worden samen met een
ondoordringbaar golfbrekermodel getest voor regelmatige en onregelmatige golven. Dit wordt
gedaan voor verschillende golfhoogtes en -periodes die overeenkomen met het bereik van de
werkelijk voorkomende golven. Voor de onregelmatige golven wordt het JONSWAP spectrum
gebruikt.
Nadien worden de verzamelde data geanalyseerd. Eerst worden de gemeten waterfluctuaties
gescheiden en omgezet naar inkomende en gereflecteerde golftreinen met behulp van de LASA
methode. Daarna worden deze gegevens verwerkt met de software LPCLab 3.6. Deze software
analyseert de gegevens in zowel het tijd- als het frequentiedomein en genereert een Excel-
rapport met al de relevante golfparameters.
6
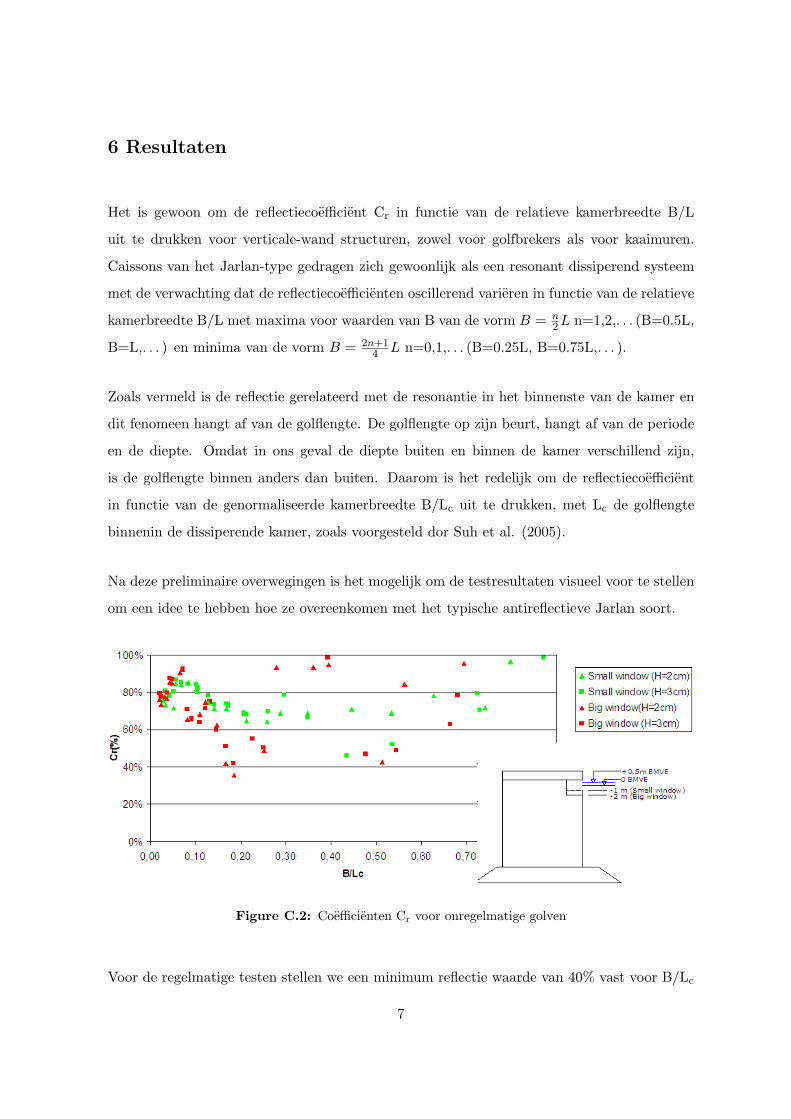
6 Resultaten
Het is gewoon om de reflectiecoefficient Cr in functie van de relatieve kamerbreedte B/L
uit te drukken voor verticale-wand structuren, zowel voor golfbrekers als voor kaaimuren.
Caissons van het Jarlan-type gedragen zich gewoonlijk als een resonant dissiperend systeem
met de verwachting dat de reflectiecoefficienten oscillerend varieren in functie van de relatieve
kamerbreedte B/L met maxima voor waarden van B van de vorm B = n2L n=1,2,. . . (B=0.5L,
B=L,. . . ) en minima van de vorm B = 2n+14 L n=0,1,. . . (B=0.25L, B=0.75L,. . . ).
Zoals vermeld is de reflectie gerelateerd met de resonantie in het binnenste van de kamer en
dit fenomeen hangt af van de golflengte. De golflengte op zijn beurt, hangt af van de periode
en de diepte. Omdat in ons geval de diepte buiten en binnen de kamer verschillend zijn,
is de golflengte binnen anders dan buiten. Daarom is het redelijk om de reflectiecoefficient
in functie van de genormaliseerde kamerbreedte B/Lc uit te drukken, met Lc de golflengte
binnenin de dissiperende kamer, zoals voorgesteld dor Suh et al. (2005).
Na deze preliminaire overwegingen is het mogelijk om de testresultaten visueel voor te stellen
om een idee te hebben hoe ze overeenkomen met het typische antireflectieve Jarlan soort.
Figure C.2: Coefficienten Cr voor onregelmatige golven
Voor de regelmatige testen stellen we een minimum reflectie waarde van 40% vast voor B/Lc
7
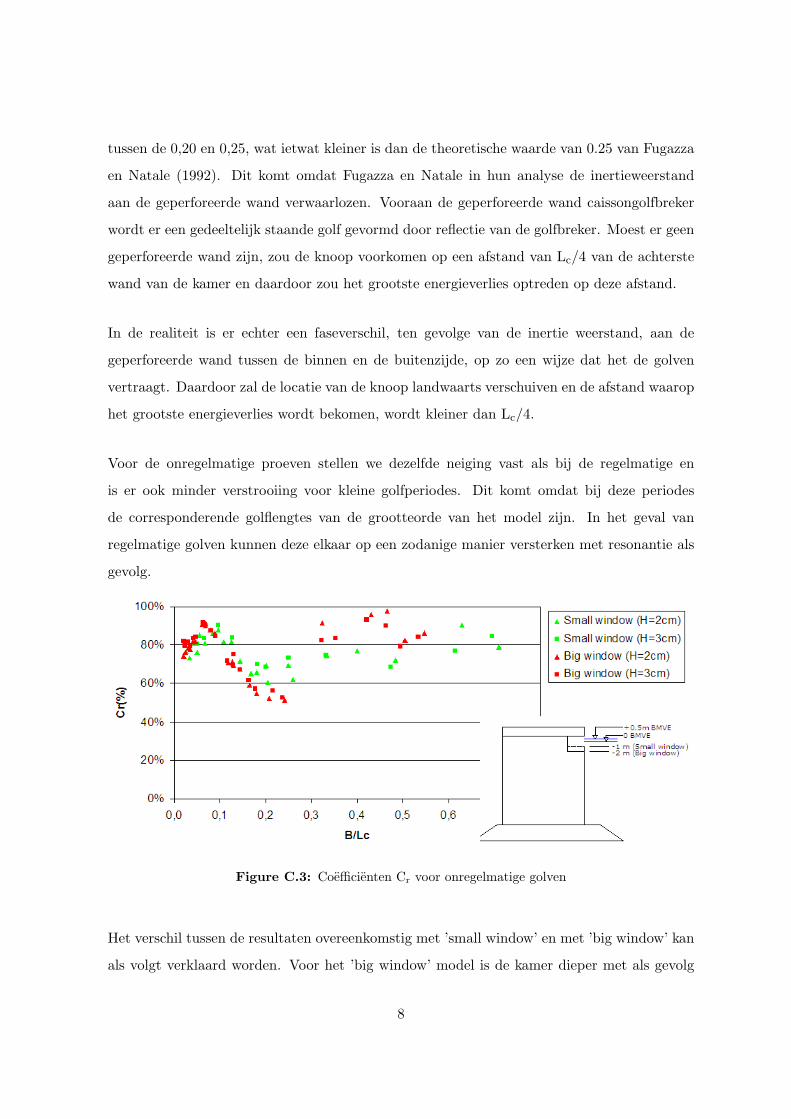
tussen de 0,20 en 0,25, wat ietwat kleiner is dan de theoretische waarde van 0.25 van Fugazza
en Natale (1992). Dit komt omdat Fugazza en Natale in hun analyse de inertieweerstand
aan de geperforeerde wand verwaarlozen. Vooraan de geperforeerde wand caissongolfbreker
wordt er een gedeeltelijk staande golf gevormd door reflectie van de golfbreker. Moest er geen
geperforeerde wand zijn, zou de knoop voorkomen op een afstand van Lc/4 van de achterste
wand van de kamer en daardoor zou het grootste energieverlies optreden op deze afstand.
In de realiteit is er echter een faseverschil, ten gevolge van de inertie weerstand, aan de
geperforeerde wand tussen de binnen en de buitenzijde, op zo een wijze dat het de golven
vertraagt. Daardoor zal de locatie van de knoop landwaarts verschuiven en de afstand waarop
het grootste energieverlies wordt bekomen, wordt kleiner dan Lc/4.
Voor de onregelmatige proeven stellen we dezelfde neiging vast als bij de regelmatige en
is er ook minder verstrooiing voor kleine golfperiodes. Dit komt omdat bij deze periodes
de corresponderende golflengtes van de grootteorde van het model zijn. In het geval van
regelmatige golven kunnen deze elkaar op een zodanige manier versterken met resonantie als
gevolg.
Figure C.3: Coefficienten Cr voor onregelmatige golven
Het verschil tussen de resultaten overeenkomstig met ’small window’ en met ’big window’ kan
als volgt verklaard worden. Voor het ’big window’ model is de kamer dieper met als gevolg
8
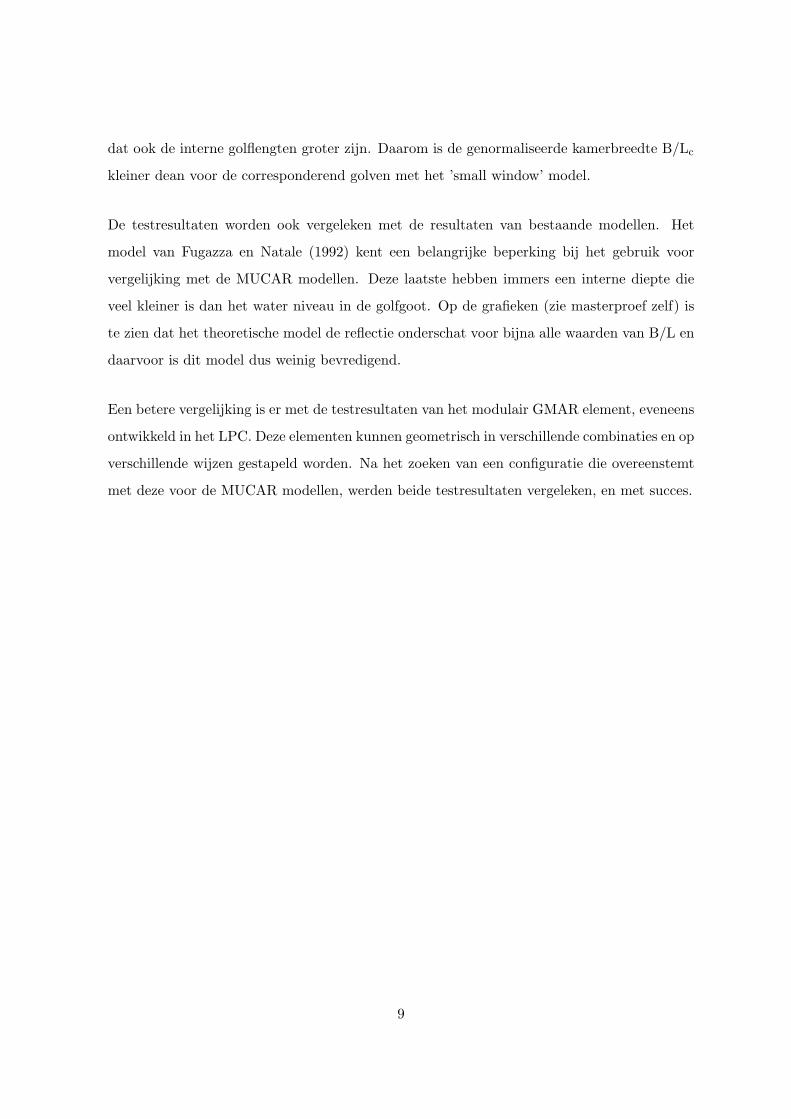
dat ook de interne golflengten groter zijn. Daarom is de genormaliseerde kamerbreedte B/Lc
kleiner dean voor de corresponderend golven met het ’small window’ model.
De testresultaten worden ook vergeleken met de resultaten van bestaande modellen. Het
model van Fugazza en Natale (1992) kent een belangrijke beperking bij het gebruik voor
vergelijking met de MUCAR modellen. Deze laatste hebben immers een interne diepte die
veel kleiner is dan het water niveau in de golfgoot. Op de grafieken (zie masterproef zelf) is
te zien dat het theoretische model de reflectie onderschat voor bijna alle waarden van B/L en
daarvoor is dit model dus weinig bevredigend.
Een betere vergelijking is er met de testresultaten van het modulair GMAR element, eveneens
ontwikkeld in het LPC. Deze elementen kunnen geometrisch in verschillende combinaties en op
verschillende wijzen gestapeld worden. Na het zoeken van een configuratie die overeenstemt
met deze voor de MUCAR modellen, werden beide testresultaten vergeleken, en met succes.
9
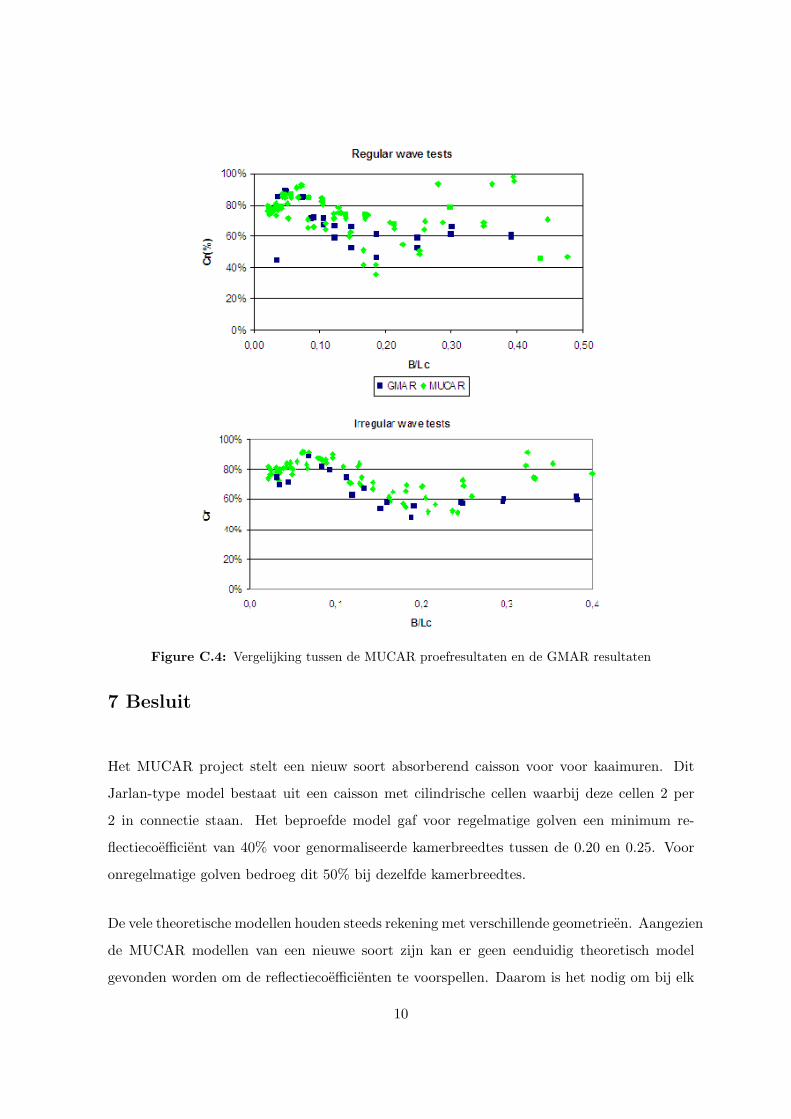
Figure C.4: Vergelijking tussen de MUCAR proefresultaten en de GMAR resultaten
7 Besluit
Het MUCAR project stelt een nieuw soort absorberend caisson voor voor kaaimuren. Dit
Jarlan-type model bestaat uit een caisson met cilindrische cellen waarbij deze cellen 2 per
2 in connectie staan. Het beproefde model gaf voor regelmatige golven een minimum re-
flectiecoefficient van 40% voor genormaliseerde kamerbreedtes tussen de 0.20 en 0.25. Voor
onregelmatige golven bedroeg dit 50% bij dezelfde kamerbreedtes.
De vele theoretische modellen houden steeds rekening met verschillende geometrieen. Aangezien
de MUCAR modellen van een nieuwe soort zijn kan er geen eenduidig theoretisch model
gevonden worden om de reflectiecoefficienten te voorspellen. Daarom is het nodig om bij elk
10
gebruikt model de nodige veronderstellingen te doen. Toch bekomt men met de resultaten
van het modulair element GMAR bevredigende overeenkomsten.
11