Embed Size (px)
Citation preview
The International Desalination Association World Congress on Desalination and Water Reuse 2015/San Diego, CA, USA REF: IDA15WC- Wright_51715
DESIGN OF A VILLAGE-SCALE PV POWERED ELECTRODIALYSIS REVERSAL SYSTEM FOR BRACKISH WATER DESALINATION IN INDIA Authors: Natasha C. Wright, Georgia D. Van de Zande, Amos G. Winter V Presenter: Natasha C. Wright, SM Doctoral Candidate, Mechanical Engineering Department Massachusetts Institute of Technology, Cambridge, MA, 02139, USA [email protected] Abstract This paper reviews the merits of village-scale photovoltaic (PV) powered electrodialysis reversal (EDR) systems for brackish water desalination in rural India and presents the design and analysis of such a system. The requirements for an off-grid village-scale water purification system include daily water output of 6-15m3/day, removal of dissolved salts in addition to biological contaminants, photovoltaic power source, recovery ratio of greater than 85%, and capital cost of less than currently installed on-grid rural reverse osmosis (RO) systems. EDR has the potential to be more cost effective than currently installed village-scale RO systems in off-grid locations due to the lower specific energy consumption of EDR versus RO at high recovery ratios. This leads to lower power system cost and overall capital expense. An updated model for electrodialysis reversal is presented that allows the user to analyze the time rate of change of individual ions present in real brackish groundwater in a combined batch and continuous system. The model is used to design a full-scale prototype of a village-scale PV-EDR system predicted to achieve the required recovery ratio, product water quality, specific energy consumption, and required capital cost. Predicted performance results include desalinating 3600 mg/L brackish groundwater to 350 ppm at a rate of 1.6 m3/hour and a recovery of 92%. The system is built using commercially available components. This paper reviews the scope of the market for village-scale desalination and existing groundwater salinity levels, and presents the design methodology and resulting system parameters for a village-scale PV-EDR field trial.
The International Desalination Association World Congress on Desalination and Water Reuse 2015/San Diego, CA, USA REF: IDA15WC- Wright_51715
Page 2 of 9
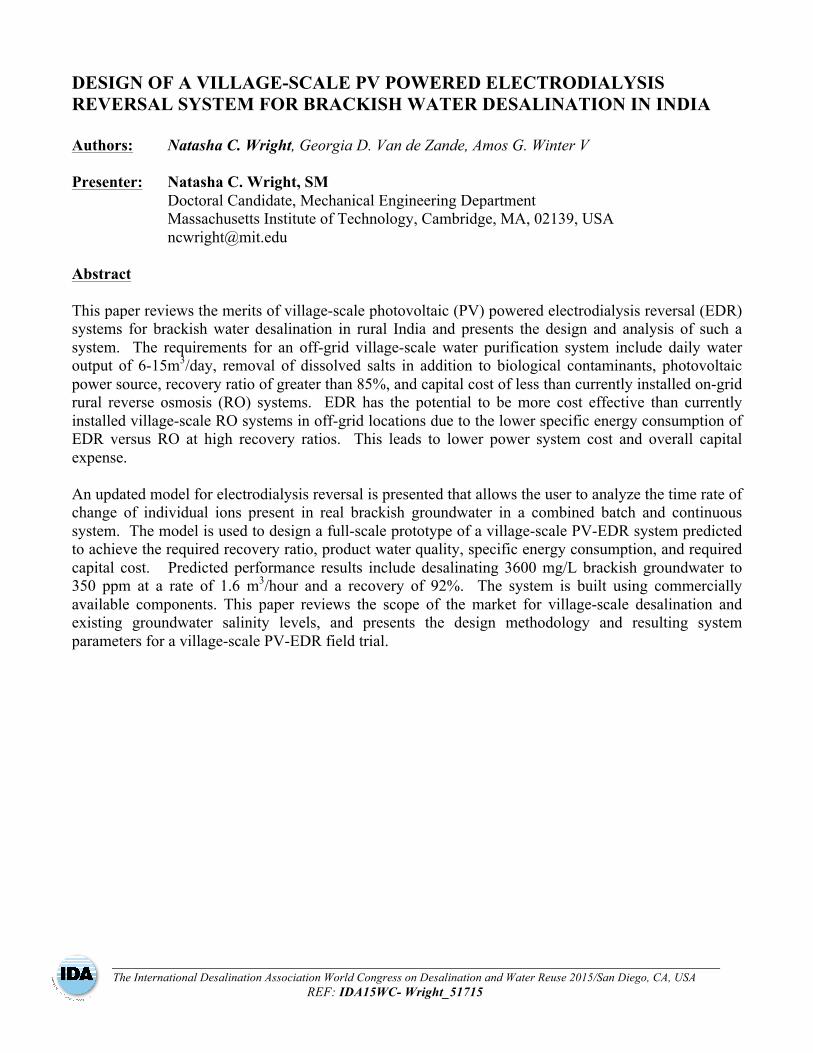
I. INTRODUCTION With 73% of Indian villages using groundwater as their primary drinking water source [1] and 60% of the land in India underlain with brackish groundwater (Figure 1, left) there is a large potential market for village-scale desalination in India. Over half of the rural population in India also lives with intermittent or no access to on-grid power. This, paired with the high solar potential in India (Figure 1, right) suggests that solar-powered desalination may be a viable option for village water purification.
Figure 1: (left) Map of salinity levels in Indian groundwater [2]. Groundwater with a salinity level greater than 480 mg/L underlies 60% of the land area in India. At this level, the aesthetic quality of the water source is compromised. (right) Map of solar irradiation in India [3]. High annual solar irradiance makes the country a prime candidate for PV-powered systems in off-grid locations. Areas with high solar potential often overlie areas of high groundwater salinity and physical water scarcity. Our previous work defined a series of critical design requirements for village-scale water desalination systems for rural India through a combination of literature review and engagement with end users, manufacturers, NGOs, government officials, and industry leaders in India [4]. At present, most village-scale desalination systems use reverse osmosis (RO), however the managing NGOs have found the systems to be cost prohibitive in off-grid locations due to high power requirements resulting in large solar power systems [5]. The work concluded that several benefits of electrodialysis reversal (EDR) over reverse osmosis (RO) make it a strong candidate for rural water desalination. These benefits include: lower specific energy consumption at the salinity levels present leading to lower capital cost for the photovoltaic (PV) power system, greater recovery ratio, and lower sensitivity to chlorine and feed water changes.
In the electrodialysis (ED) process, saline water is pumped through a series of alternating anion and cation ion exchange membranes (AEM, CEM). When an electric potential difference is applied across the stack at the anode and cathode, anions move towards the anode and cations towards the cathode. As an anion is moved towards the anode due to the potential difference at the electrodes, it is blocked when it reaches a CEM and remains in the concentrate compartment. Similarly, cations moving towards the cathode are blocked when they reach the first AEM. In a commercial ED stack, there are many alternating CEM and AEM pairs, resulting in alternating streams of diluted and concentrated saline flow.
< 480480 - 960960 - 1920> 1920
TDS (mg/L)
The International Desalination Association World Congress on Desalination and Water Reuse 2015/San Diego, CA, USA REF: IDA15WC- Wright_51715
Page 3 of 9
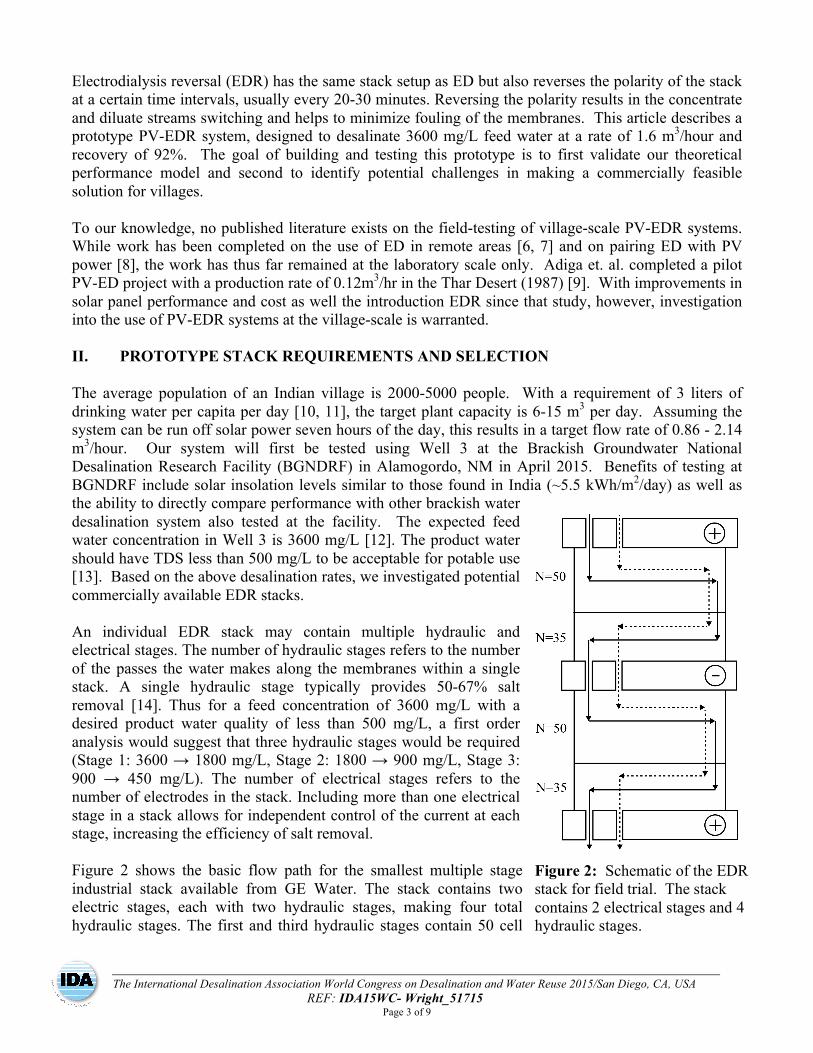
Electrodialysis reversal (EDR) has the same stack setup as ED but also reverses the polarity of the stack at a certain time intervals, usually every 20-30 minutes. Reversing the polarity results in the concentrate and diluate streams switching and helps to minimize fouling of the membranes. This article describes a prototype PV-EDR system, designed to desalinate 3600 mg/L feed water at a rate of 1.6 m3/hour and recovery of 92%. The goal of building and testing this prototype is to first validate our theoretical performance model and second to identify potential challenges in making a commercially feasible solution for villages. To our knowledge, no published literature exists on the field-testing of village-scale PV-EDR systems. While work has been completed on the use of ED in remote areas [6, 7] and on pairing ED with PV power [8], the work has thus far remained at the laboratory scale only. Adiga et. al. completed a pilot PV-ED project with a production rate of 0.12m3/hr in the Thar Desert (1987) [9]. With improvements in solar panel performance and cost as well the introduction EDR since that study, however, investigation into the use of PV-EDR systems at the village-scale is warranted. II. PROTOTYPE STACK REQUIREMENTS AND SELECTION The average population of an Indian village is 2000-5000 people. With a requirement of 3 liters of drinking water per capita per day [10, 11], the target plant capacity is 6-15 m3 per day. Assuming the system can be run off solar power seven hours of the day, this results in a target flow rate of 0.86 - 2.14 m3/hour. Our system will first be tested using Well 3 at the Brackish Groundwater National Desalination Research Facility (BGNDRF) in Alamogordo, NM in April 2015. Benefits of testing at BGNDRF include solar insolation levels similar to those found in India (~5.5 kWh/m2/day) as well as the ability to directly compare performance with other brackish water desalination system also tested at the facility. The expected feed water concentration in Well 3 is 3600 mg/L [12]. The product water should have TDS less than 500 mg/L to be acceptable for potable use [13]. Based on the above desalination rates, we investigated potential commercially available EDR stacks. An individual EDR stack may contain multiple hydraulic and electrical stages. The number of hydraulic stages refers to the number of the passes the water makes along the membranes within a single stack. A single hydraulic stage typically provides 50-67% salt removal [14]. Thus for a feed concentration of 3600 mg/L with a desired product water quality of less than 500 mg/L, a first order analysis would suggest that three hydraulic stages would be required (Stage 1: 3600 → 1800 mg/L, Stage 2: 1800 → 900 mg/L, Stage 3: 900 → 450 mg/L). The number of electrical stages refers to the number of electrodes in the stack. Including more than one electrical stage in a stack allows for independent control of the current at each stage, increasing the efficiency of salt removal. Figure 2 shows the basic flow path for the smallest multiple stage industrial stack available from GE Water. The stack contains two electric stages, each with two hydraulic stages, making four total hydraulic stages. The first and third hydraulic stages contain 50 cell
Figure 2: Schematic of the EDR stack for field trial. The stack contains 2 electrical stages and 4 hydraulic stages.
The International Desalination Association World Congress on Desalination and Water Reuse 2015/San Diego, CA, USA REF: IDA15WC- Wright_51715
Page 4 of 9
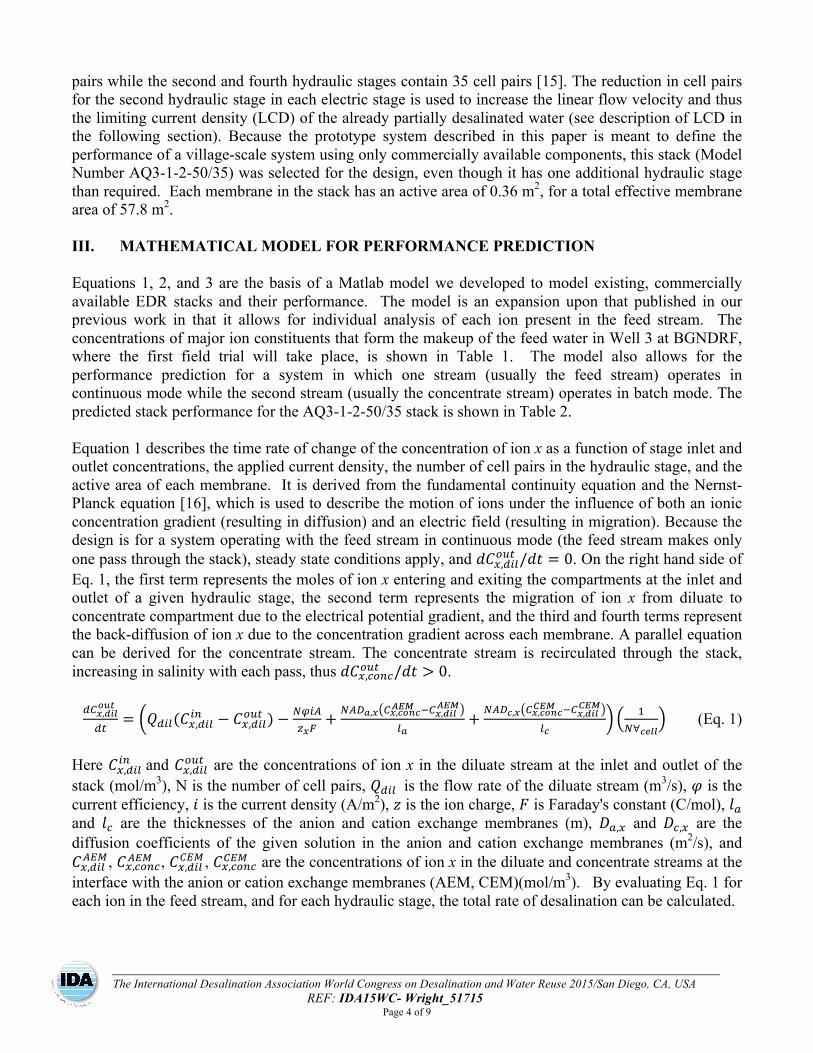
pairs while the second and fourth hydraulic stages contain 35 cell pairs [15]. The reduction in cell pairs for the second hydraulic stage in each electric stage is used to increase the linear flow velocity and thus the limiting current density (LCD) of the already partially desalinated water (see description of LCD in the following section). Because the prototype system described in this paper is meant to define the performance of a village-scale system using only commercially available components, this stack (Model Number AQ3-1-2-50/35) was selected for the design, even though it has one additional hydraulic stage than required. Each membrane in the stack has an active area of 0.36 m2, for a total effective membrane area of 57.8 m2. III. MATHEMATICAL MODEL FOR PERFORMANCE PREDICTION Equations 1, 2, and 3 are the basis of a Matlab model we developed to model existing, commercially available EDR stacks and their performance. The model is an expansion upon that published in our previous work in that it allows for individual analysis of each ion present in the feed stream. The concentrations of major ion constituents that form the makeup of the feed water in Well 3 at BGNDRF, where the first field trial will take place, is shown in Table 1. The model also allows for the performance prediction for a system in which one stream (usually the feed stream) operates in continuous mode while the second stream (usually the concentrate stream) operates in batch mode. The predicted stack performance for the AQ3-1-2-50/35 stack is shown in Table 2. Equation 1 describes the time rate of change of the concentration of ion x as a function of stage inlet and outlet concentrations, the applied current density, the number of cell pairs in the hydraulic stage, and the active area of each membrane. It is derived from the fundamental continuity equation and the Nernst-Planck equation [16], which is used to describe the motion of ions under the influence of both an ionic concentration gradient (resulting in diffusion) and an electric field (resulting in migration). Because the design is for a system operating with the feed stream in continuous mode (the feed stream makes only one pass through the stack), steady state conditions apply, and 𝑑𝐶!,!"#!"# /𝑑𝑡 = 0. On the right hand side of Eq. 1, the first term represents the moles of ion x entering and exiting the compartments at the inlet and outlet of a given hydraulic stage, the second term represents the migration of ion x from diluate to concentrate compartment due to the electrical potential gradient, and the third and fourth terms represent the back-diffusion of ion x due to the concentration gradient across each membrane. A parallel equation can be derived for the concentrate stream. The concentrate stream is recirculated through the stack, increasing in salinity with each pass, thus 𝑑𝐶!,!"#!!"# /𝑑𝑡 > 0. !"!,!"#
!"#
!"= 𝑄!"#(𝐶!,!"#!" − 𝐶!,!"#!"# )− !"#$
!!!+ !"!!,! !!,!"#!!"# !!!,!"#
!"#
!!+
!"!!,! !!,!"#!!"# !!!,!"#!"#
!!
!!∀!"##
(Eq. 1) Here 𝐶!,!"#!" and 𝐶!,!"#!"# are the concentrations of ion x in the diluate stream at the inlet and outlet of the stack (mol/m3), N is the number of cell pairs, 𝑄!"# is the flow rate of the diluate stream (m3/s), 𝜑 is the current efficiency, 𝑖 is the current density (A/m2), 𝑧 is the ion charge, 𝐹 is Faraday's constant (C/mol), 𝑙! and 𝑙! are the thicknesses of the anion and cation exchange membranes (m), 𝐷!,! and 𝐷!,! are the diffusion coefficients of the given solution in the anion and cation exchange membranes (m2/s), and 𝐶!,!"#!"#, 𝐶!,!"#!!"# , 𝐶!,!"#!"#, 𝐶!,!"#!!"# are the concentrations of ion x in the diluate and concentrate streams at the interface with the anion or cation exchange membranes (AEM, CEM)(mol/m3). By evaluating Eq. 1 for each ion in the feed stream, and for each hydraulic stage, the total rate of desalination can be calculated.

The International Desalination Association World Congress on Desalination and Water Reuse 2015/San Diego, CA, USA REF: IDA15WC- Wright_51715
Page 5 of 9
Table 1: Concentration of major constituents in Well 3 at BGNDRF, used as feed water in analytical model of system performance in this work.
The current density in Eq. 1 cannot exceed 70% of the limiting current density (LCD), the current density in which dissociation of water molecules would begin to occur in the boundary layer. The equation for the theoretical LCD and the empirically determined LCD are given in Eq. 2 where a and b in the empirical equation are constants determined by measuring LCD at different linear flow velocities, u [16].
𝑖!"# = !"#!!"#!"#
! !!!!!= 𝑎𝐶!"#!"#𝑢! (Eq. 2)
Here, 𝛿 is the boundary layer thickness (m), 𝑡! and 𝑡! are the transport numbers of the ions in the membrane and in the solution. Because the outlet concentration of the diluate stream is lowest for the final hydraulic stage in any given electrical stage, it is the linear flow velocity and outlet concentration in 35-cell pair stage that governs the limiting current for each of the two electrical stages. The final concentration in the diluate stream for the entire stack is obtained by introducing in the empirical solution for the limiting current density (Eq. 2) into Eq. 1. Alternatively, the required membrane area for any desired feed and product water concentration could also be obtained from the same equation. In order to calculate the power required to desalinate a given quantity of water using electrodialysis, the system is analyzed as an electrical circuit, where power is equal to the product of the current through the stack and the voltage applied at the electrodes. The relationship between the current and voltage is given by Eqn. 3, where 𝑅!"#, 𝑅!"#!, 𝑅!"#, and 𝑅!"# are the area resistances of the diluate stream, concentrate stream, AEM and CEM, respectively (Ωm2 ). 𝑉!"!# and 𝑉!"#$%#&'( are the electrode potential and concentration potential, respectively. 𝑉!"!#$ is the total applied voltage (V).
𝑉!"!#$ = 𝑉!"!# + 𝑁𝑉!"#$%#&'( + 𝑁𝑖(𝑅!"# + 𝑅!"#! + 𝑅!"# + 𝑅!"#) (Eq. 3) Thus the instantaneous power consumption of an ED stack can be calculated if the applied voltage, number of cell pairs, and resistances are known. Membrane resistances and number of cell pairs are found in the electrodialysis stack manufacturer data. The resistance of the diluate and concentrate streams can be calculated by using empirical equations for the specific electrolyte aqueous solutions. In the present model, the Falkenhagen equation is used [17].
Parameter Concentration (mg/L) Potassium (K!) 3.30 Sodium (Na!) 410
Calcium (Ca!!) 440 Magnesium (Mg!!) 220
Chloride (Cl!) 690 Bicarbonate (as CaCO!) 190
Sulfate (SO!!!) 1800 Total Dissolved Solids 3590
The International Desalination Association World Congress on Desalination and Water Reuse 2015/San Diego, CA, USA REF: IDA15WC- Wright_51715
Page 6 of 9
Table 2: Predicted performance of the selected EDR stack.
Hydraulic Stage Number 1 2 3 4 Number of Cell Pairs 50 35 50 35
Concentration of Diluate Entering Stage (mol/m3) 60.8 35.4 17.7 10.8
Concentration of Diluate Exiting Stage (mol/m3) 35.4 17.7 10.8 6.0
Current Density Applied (A/m2) 75.7 75.7 25.6 25.6 Total Stage Resistance (Ωm2) 0.191 0.198 0.400 0.447
Voltage Drop Across Stage (V) 14.5 15.0 10.3 11.5 Power (W) 508.6 528.0 122.2 136.5
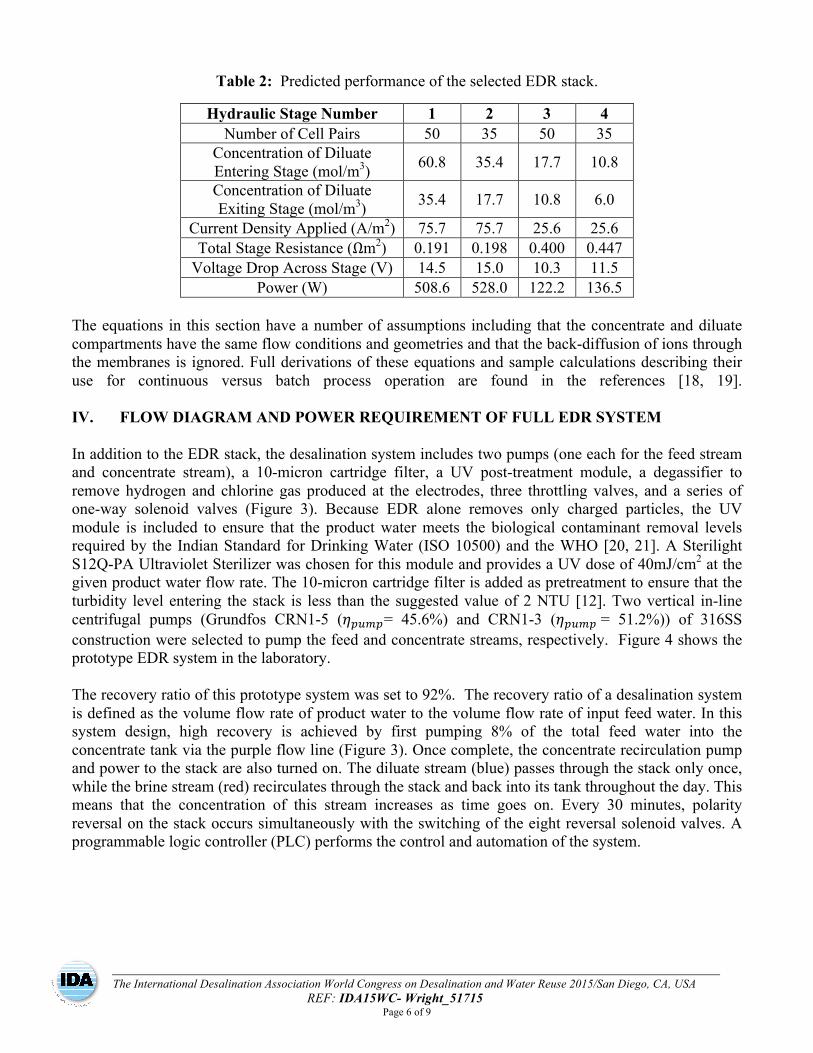
The equations in this section have a number of assumptions including that the concentrate and diluate compartments have the same flow conditions and geometries and that the back-diffusion of ions through the membranes is ignored. Full derivations of these equations and sample calculations describing their use for continuous versus batch process operation are found in the references [18, 19]. IV. FLOW DIAGRAM AND POWER REQUIREMENT OF FULL EDR SYSTEM In addition to the EDR stack, the desalination system includes two pumps (one each for the feed stream and concentrate stream), a 10-micron cartridge filter, a UV post-treatment module, a degassifier to remove hydrogen and chlorine gas produced at the electrodes, three throttling valves, and a series of one-way solenoid valves (Figure 3). Because EDR alone removes only charged particles, the UV module is included to ensure that the product water meets the biological contaminant removal levels required by the Indian Standard for Drinking Water (ISO 10500) and the WHO [20, 21]. A Sterilight S12Q-PA Ultraviolet Sterilizer was chosen for this module and provides a UV dose of 40mJ/cm2 at the given product water flow rate. The 10-micron cartridge filter is added as pretreatment to ensure that the turbidity level entering the stack is less than the suggested value of 2 NTU [12]. Two vertical in-line centrifugal pumps (Grundfos CRN1-5 (𝜂!"#!= 45.6%) and CRN1-3 (𝜂!"#! = 51.2%)) of 316SS construction were selected to pump the feed and concentrate streams, respectively. Figure 4 shows the prototype EDR system in the laboratory. The recovery ratio of this prototype system was set to 92%. The recovery ratio of a desalination system is defined as the volume flow rate of product water to the volume flow rate of input feed water. In this system design, high recovery is achieved by first pumping 8% of the total feed water into the concentrate tank via the purple flow line (Figure 3). Once complete, the concentrate recirculation pump and power to the stack are also turned on. The diluate stream (blue) passes through the stack only once, while the brine stream (red) recirculates through the stack and back into its tank throughout the day. This means that the concentration of this stream increases as time goes on. Every 30 minutes, polarity reversal on the stack occurs simultaneously with the switching of the eight reversal solenoid valves. A programmable logic controller (PLC) performs the control and automation of the system.
The International Desalination Association World Congress on Desalination and Water Reuse 2015/San Diego, CA, USA REF: IDA15WC- Wright_51715
Page 7 of 9
Figure 3: Flow diagram of the EDR system to be tested at BGNDRF where gray tanks are provided on site (TV=throttling valve, SV=one-way solenoid valve, RV=solenoid valve used for reversal, UV=ultraviolet disinfection)
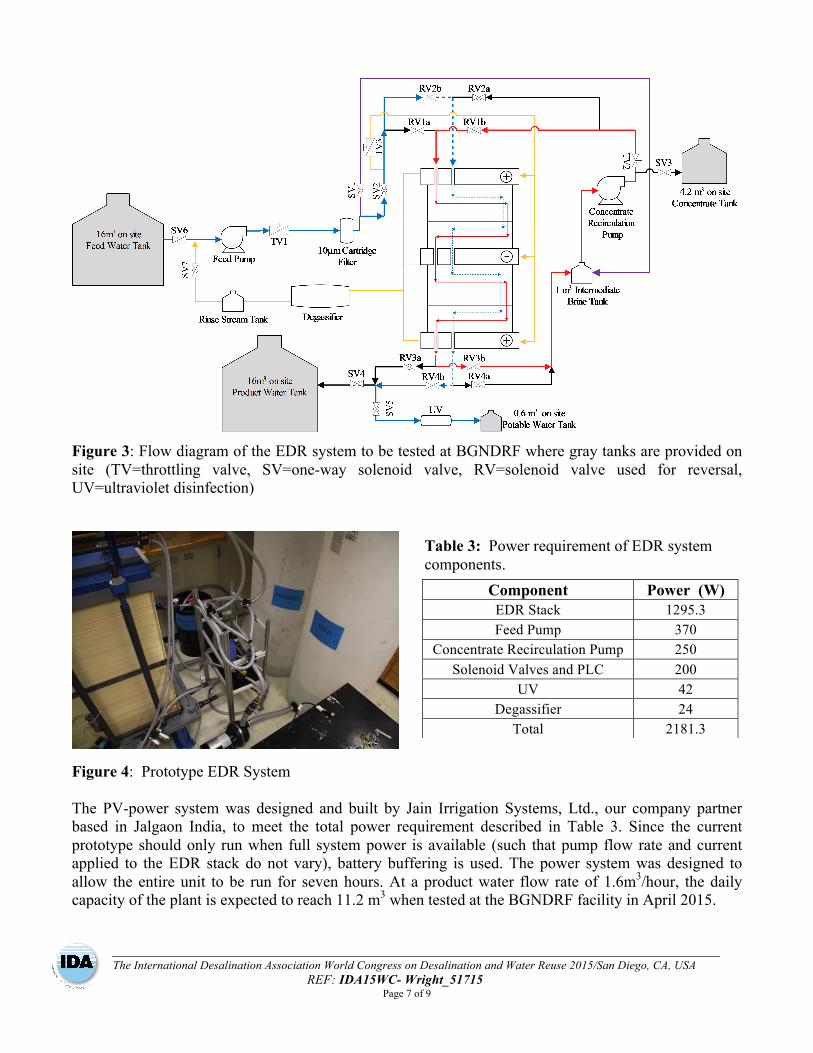
Figure 4: Prototype EDR System The PV-power system was designed and built by Jain Irrigation Systems, Ltd., our company partner based in Jalgaon India, to meet the total power requirement described in Table 3. Since the current prototype should only run when full system power is available (such that pump flow rate and current applied to the EDR stack do not vary), battery buffering is used. The power system was designed to allow the entire unit to be run for seven hours. At a product water flow rate of 1.6m3/hour, the daily capacity of the plant is expected to reach 11.2 m3 when tested at the BGNDRF facility in April 2015.
Component Power (W) EDR Stack 1295.3 Feed Pump 370
Concentrate Recirculation Pump 250 Solenoid Valves and PLC 200
UV 42 Degassifier 24
Total 2181.3
Table 3: Power requirement of EDR system components.
The International Desalination Association World Congress on Desalination and Water Reuse 2015/San Diego, CA, USA REF: IDA15WC- Wright_51715
Page 8 of 9
VI. Future Work The system presented here will be tested at BGNDRF in April 2015. The results of the experiment will allow us to further refine our analytical model for the EDR stack itself. The process of building the first full-scale system will also help us identify the key steps required to make the system commercially feasible. We hypothesize that of the key requirements given in our previous work, capital cost of the off-grid system will be the most difficult target to meet. To address this issue, further research will include optimization of a stack design specific to the requirements of an Indian village (number of electric and hydraulic stages, membrane area, and potential manufacturers). Additionally a feasibility study will be conducted on the design and optimization of a system in which both the pumps and the stack are driven directly from the PV-power system. If feasible, this direct drive system would have the potential to decrease the capital cost of the power system by removing components (inverters and batteries) as well as minimizing energy conversion losses. VII. Conclusions This paper presents the justification for, and design of, a PV-EDR system for village-scale brackish water desalination for potable water production in India. The goal of the pilot plant is to validate the mathematical model and identify key areas of further research towards a commercially viable system. The system is designed to desalinate 3600 mg/L brackish groundwater to 350 mg/L at a rate of 1.6 m3/hour and a recovery of 92%. Demonstrating that the specific energy consumption, recovery ratio, and product water quality of the trial plant aligns with that theoretically calculated would demonstrate that the further development, optimization, and deployment of PV-EDR systems is worth pursuing as a means of providing off-grid desalination in rural villages. The analysis and design presented in this work enables a system to be created that meets the water requirements for a typical Indian village. VIII. REFERENCES [1] Datanet India Pvt. Ltd. Indiastat.com: Revealing India-Statistically: State-wise Distribution of
Villages by Major Source of Drinking Water per 1000 Villages in India. http://www.indiastat.com/table/ villages/6376/ruralfacilities/281388/281420/data.aspx (Accessed 11/14/2013).
[2] Central Ground Water Board, Ground water quality in shallow aquifers of India, Technical report, Government of India, 2010.
[3] National Renewable Energy Laboratory, India Solar Resource — Direct Normal Irradiance, http://www.nrel.gov/international/images/india_dni_annual.jpg (Accessed 5/9/2014).
[4] Wright, N. C., and Amos G. Winter, V., 2014. “Justification for community-scale photovoltaic powered electrodialysis desalination systems for inland rural villages in India”. Desalination, 352 , pp. 82–91.
[5] Kumar, A., 2014. Personal Conversation with Mr. Anand Kumar, Tata ProjectsWater Purification Plant Development Center, Secunderabad, India. January.
[6] Banasiak, L. J. and Scha, A. I., 2009. “Removal of inorganic trace contaminants by electrodialysis in a remote Australian community”. Desalination, 248 , pp. 48–57.
[7] Walha, K., Amar, R. B., Firdaous, L., Quéméneur, F., and Jaouen, P., 2007. “Brackish groundwater treatment by nanofiltration, reverse osmosis and electrodialysis in Tunisia: performance and cost comparison”. Desalination, 207 (1-3), Mar., pp. 95–106.
[8] Ortiz, J., Expósito, E., Gallud, F., Garcia-Garcia, V., Montiel, V., and Aldaz, A., 2006. “Photovoltaic
The International Desalination Association World Congress on Desalination and Water Reuse 2015/San Diego, CA, USA REF: IDA15WC- Wright_51715
Page 9 of 9
electrodialysis system for brackish water desalination: Modeling of global process”. Journal of Membrane Science, 274 (1-2), Apr., pp. 138–149.
[9] Adiga, M. R., Adhikary, S., Narayanan, P., Harkare, W., Gomkale, S., and Govindan, K., 1987. “Performance Analysis of Photovoltaic Electrodialysis Desalination Plant at Tanote in Thar Desert”. Desalination, 67 , pp. 59–66.
[10] Howard, G., and Bartram, J., 2003. Domestic Water Quantity, Service Level and Health. Tech. rep., World Health Organization, Geneva.
[11] Gleick, P. H., 1996. “BasicWater Requirements for Human Activities: Meeting Basic Needs”. Water International, 21 (2), June, pp. 83–92.
[12] Tetra Tech, 2011. Managing water in the west: Analysis of water from four wells at the Brackish Groundwater National Desalination Research Facility. Technical Report: U.S. Department of the Interior Bureau of Reclamation.
[13] Bruvold, W. H., 1970. “Mineral taste and the potability of domestic water”. Water Research, 4 (5), May, pp. 331–340.
[14] American Water Works Association, 1995. Electrodialysis and Electrodialysis Reversal: Manual of Water Supply Practices.
[15] GE Power & Water. GE Aquamite EDR Systems: Fact Sheet. https://www.gewater.com/kcpguest/salesedge/documents/Fact%20Sheets_Cust/Americas/English/FS1360EN.pdf (Accessed 2/27/2015).
[16] H. Strathmann. Assessment of electrodialysis water desalination process costs. In Proceedings of the International Conference on Desalination Costing, Limassol, Cyprus, 2004.
[17] Kortum, G., 1965. Treatise on Electrochemistry . Elsevier Ltd. [18] Ortiz, J., Sotoca, J., Expósito, E., Gallud, F., Garcia-Garcia, V., Montiel, V., and Aldaz, A., 2005.
“Brackish water desalination by electrodialysis: batch recirculation operation modeling”. Journal of Membrane Science, 252 , pp. 65–75.
[19] Lee, H.-J., Sarfert, F., Strathmann, H., and Moon, S.-H., 2002. “Designing of an electrodialysis desalination plant”. Desalination, 142 , pp. 267–286.
[20] World Health Orgaization (WHO), 2011. Guidelines for Drinking-water Quality. Technical Report: World Health Organization, Geneva.
[21] Bureau of Indian Standards, 2012. “Drinking Water Specification (Second Revision)”.


![REVERSE ELECTRODIALYSIS’’’’’’’’’’’’’’’ PROJECT’REPORT · determine! the! feasibility of! using reverse ]electrodialysis to! supplement! a! small! portion!](https://img.pdfslide.net/doc/110x75/5aedd4ea7f8b9aa17b8b7a6e/reverse-electrodialysis-projectreport.jpg)