Embed Size (px)
Citation preview
71
DESIGN OF NOISE PROTECTION OF INDUSTRIAL PLANTS- CASE STUDY OF A PLYWOOD FACTORY
Branko Radičević, Zoran Petrović, Slobodan Todosijević, Zvonko Petrović
University of Kragujevac, Faculty of Mechanical Engineering Kraljevo, Serbia, [email protected] Abstract - The paper presents activities of reduction of noise emitted by plywood factory facilities. Dominant noise sources in the factory, which caused noise levels above limits, were identified. Based on calculation of acoustic fields performed by original software package, a noise map of the endangered area was created, and a noise protection system was designed. The noise protection system consists of two sound barriers, insulation of noise sources and changes of organization of the technology process. Application of the noise protection system led to reduction of specific noise levels for 14 dB. Noise levels at a control site in residential areas during day do not overcome limits anymore.
Keywords: industrial noise, noise maps, acoustic calculations, noise protection, noise barriers
1. INTRODUCTION
By the example of a chip factory we presented the activities needed to be realized in order to successfully protect the residential area located near the factory. This and similar residential zones naturally sprang up after the factories had been built. Furthermore, the residential zones located in, or closely to the industrial area are difficult to classify into some of the legitimate acoustic zones. This leads to the introduction of a new acoustic zone for the residential areas near an industrial zone. Examples of similar solutions are known in some European countries. In this way the subjects of environment noise protection would be allowed to mutually cooperate and provide coordination in carrying out measures and decisions.
Total amount of noise level in residential area near the chip factory was 76 dB (A), which far exceeds the noise indicator values in an environment for the V acoustic zone. There are two causes for the far exceeding. The first is the short distance of the factories, and the second is the frequent city traffic artery between factories and residential blocks.
The noise polluted residential zone stretches parallel to the factory halls on the length of around 170 m. Approximate distance between the house facades and the nearest noise sources is around 35 m. Key problems in searching the most efficient method to protect from noise are: an enormous height of some of the factories (up to 25 m), great number of noise sources, distance of the houses and densely populated area. We measured the noise levels of all sources, and then established the dominant noise sources. By measuring the levels of all noise sources, adopting the dominant sources, establishing the type of noise source and weakening of noise
through the space by building sound walls, a mathematical method has been formed to establish levels of noise and select the most suitable variant of noise protection considering the possibilities of technical realization.
2. SOURCES NOISE
2.1 Types of Noise Sources
Sources of the noise in factory according to its location can be conditionally divided into three groups:
The main noise sources are: • the main compressor station and production power • processing part which includes three subsystems: a
line for sifting raw and dry chips, a line for measuring dust, a line for transport and sifting chip shavings
• chips preparations (a bridge crane, log transporter, mill)
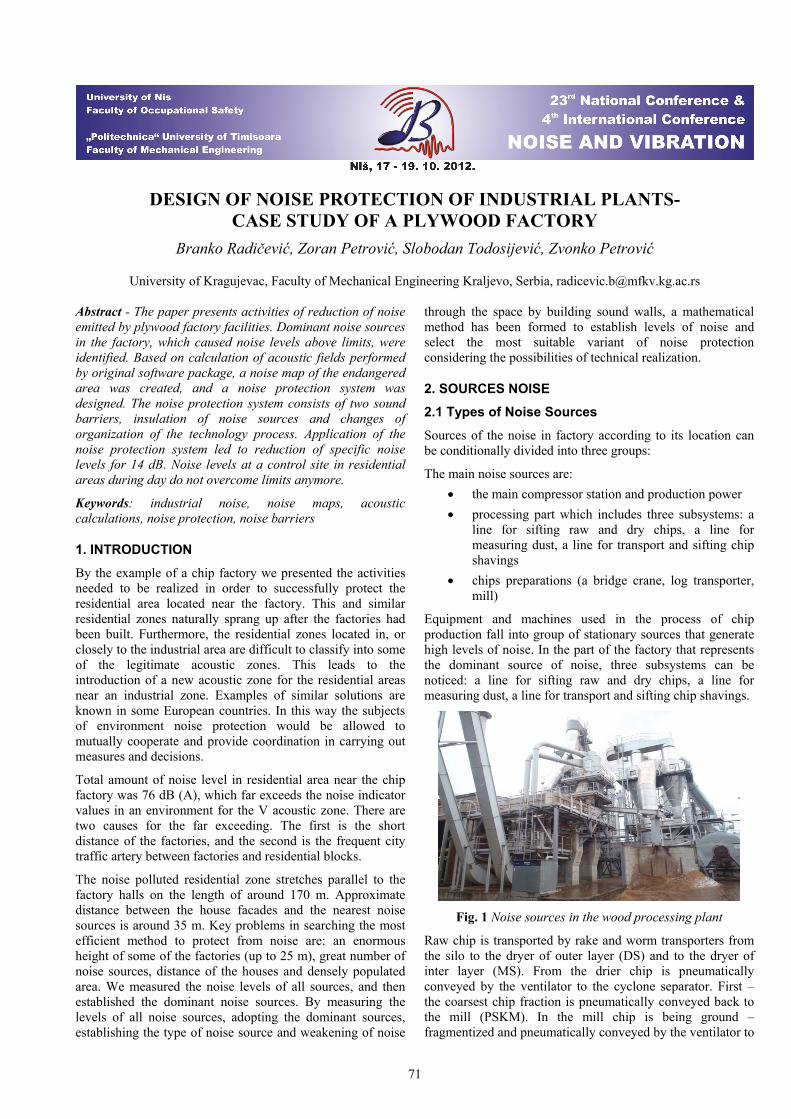
Equipment and machines used in the process of chip production fall into group of stationary sources that generate high levels of noise. In the part of the factory that represents the dominant source of noise, three subsystems can be noticed: a line for sifting raw and dry chips, a line for measuring dust, a line for transport and sifting chip shavings.
Fig. 1 Noise sources in the wood processing plant
Raw chip is transported by rake and worm transporters from the silo to the dryer of outer layer (DS) and to the dryer of inter layer (MS). From the drier chip is pneumatically conveyed by the ventilator to the cyclone separator. First – the coarsest chip fraction is pneumatically conveyed back to the mill (PSKM). In the mill chip is being ground – fragmentized and pneumatically conveyed by the ventilator to
72
the cyclone separator from where, by the halt and systems of worm transporters is directed to the sifting grate – the sieve. The second and the third fraction are pneumatically conveyed to the drier chip silos of outer layer (DS) and inter layer (MS). The fourth chip fraction is the finest one (the dust) pneumatically conveyed by the compressor to the dust silo.
2.2 The Type of Noise
In search for successful model of noise control, evaluation of noise levels and taking adequate measures and methods for reduction of the noise, it is necessary to have the data about the characteristics of noise itself as exact as it is possible. These data are obtained by measuring characteristic noise values in frequency, amplitude, and time range. In order to establish precise noise characteristics, a series of noise measuring have been performed during day and night. Major mechanisms for generating noise in this case can be divided into two groups: mechanical (ventilators, compressors, electro motors, gear transmission, belt transmission, transporters, bearings, and other rotational components), and aerodynamic which are result of pneumatic chip transport. Machine tools of this type generate very high noise levels mainly characterized as tonal, with components ranging from medium to high frequency proportional to rotational speed of mechanical components. Aerodynamic noise is a result of chip motion under the influence of air circulation in pneumatic pipelines which connect silos of great heights (some may even reach 30 m height). Since the shavings in the pneumatic pipelines are moved with high speed through different cross sections and curves, it comes to turbulence, which generates wide belt noise.
2.3 Noise Level The factory works around the clock with no pauses.
Table 1 Dominant noise sources in the factory
No. Mark Noise level [dB(A)]
S1 Rake transporter of inter layer 81 S2 Gear of rake transporter 81 S3 Sifting grate – sieve 81 S4 Dry chip Ventilator of inter layer 100 S5 Dry chip Ventilator of outer layer 97 S6 Vertical worm transporter 89 S7 Horizontal rake transporter 89 S8 Inter layer halts 89 S9 Ventilator for extra chip drying 94 S10 Rake transporter Z-silos 86 S11 Log transporter 83 S12 Crane (engine) 85 S13 Reverse pipeline from the hall 85 S14 Ventilator power 90 kW 87 S15 Ventilator 81 S16 Rake transporter 4 kW 80
The first base source is formed by the means of 29 sources divided in three already mentioned groups. Noise levels of particular sources are measured at very close distance (up to 0.5 m), in order to avoid influence of other sources. It should be pointed out that there are different noise sources in the factory which levels are less than 80 dB. Only noise levels from 80dB to 100dB are taken into consideration.
As a criterion for the choice of dominant sources, noise levels formed by the separate sources are taken, as well as their distance from residential area, the height of the source and their possible shelter from other objects (Table 1).
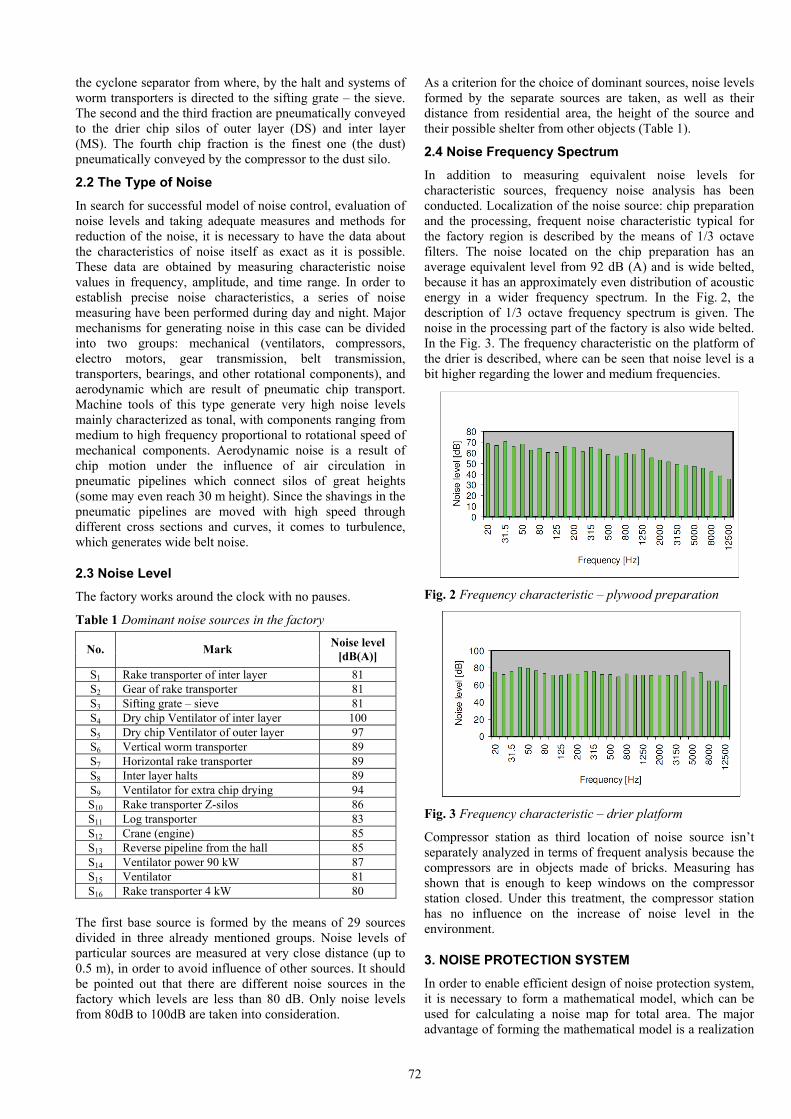
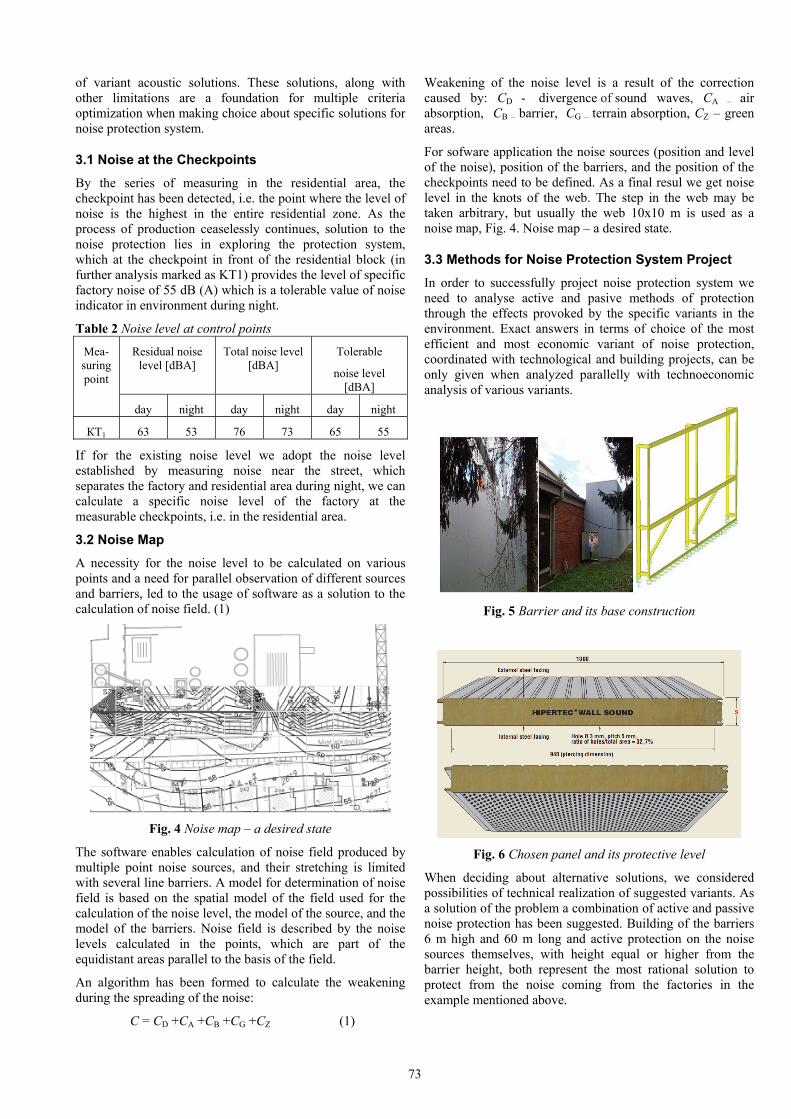
2.4 Noise Frequency Spectrum In addition to measuring equivalent noise levels for characteristic sources, frequency noise analysis has been conducted. Localization of the noise source: chip preparation and the processing, frequent noise characteristic typical for the factory region is described by the means of 1/3 octave filters. The noise located on the chip preparation has an average equivalent level from 92 dB (A) and is wide belted, because it has an approximately even distribution of acoustic energy in a wider frequency spectrum. In the Fig. 2, the description of 1/3 octave frequency spectrum is given. The noise in the processing part of the factory is also wide belted. In the Fig. 3. The frequency characteristic on the platform of the drier is described, where can be seen that noise level is a bit higher regarding the lower and medium frequencies.
Fig. 2 Frequency characteristic – plywood preparation
Fig. 3 Frequency characteristic – drier platform
Compressor station as third location of noise source isn’t separately analyzed in terms of frequent analysis because the compressors are in objects made of bricks. Measuring has shown that is enough to keep windows on the compressor station closed. Under this treatment, the compressor station has no influence on the increase of noise level in the environment.
3. NOISE PROTECTION SYSTEM In order to enable efficient design of noise protection system, it is necessary to form a mathematical model, which can be used for calculating a noise map for total area. The major advantage of forming the mathematical model is a realization
73
of variant acoustic solutions. These solutions, along with other limitations are a foundation for multiple criteria optimization when making choice about specific solutions for noise protection system.
3.1 Noise at the Checkpoints By the series of measuring in the residential area, the checkpoint has been detected, i.e. the point where the level of noise is the highest in the entire residential zone. As the process of production ceaselessly continues, solution to the noise protection lies in exploring the protection system, which at the checkpoint in front of the residential block (in further analysis marked as KT1) provides the level of specific factory noise of 55 dB (A) which is a tolerable value of noise indicator in environment during night.
Table 2 Noise level at control points
Residual noise level [dBA]
Total noise level [dBA]
Tolerable
noise level [dBA]
Mea-suring point
day night day night day night
КТ1 63 53 76 73 65 55
If for the existing noise level we adopt the noise level established by measuring noise near the street, which separates the factory and residential area during night, we can calculate a specific noise level of the factory at the measurable checkpoints, i.e. in the residential area.
3.2 Noise Map A necessity for the noise level to be calculated on various points and a need for parallel observation of different sources and barriers, led to the usage of software as a solution to the calculation of noise field. (1)
Fig. 4 Noise map – a desired state
The software enables calculation of noise field produced by multiple point noise sources, and their stretching is limited with several line barriers. A model for determination of noise field is based on the spatial model of the field used for the calculation of the noise level, the model of the source, and the model of the barriers. Noise field is described by the noise levels calculated in the points, which are part of the equidistant areas parallel to the basis of the field.
An algorithm has been formed to calculate the weakening during the spreading of the noise:
C = CD +CA +CB +CG +CZ (1)
Weakening of the noise level is a result of the correction caused by: CD - divergence of sound waves, CA – air absorption, CB – barrier, CG – terrain absorption, CZ – green areas.
For sofware application the noise sources (position and level of the noise), position of the barriers, and the position of the checkpoints need to be defined. As a final resul we get noise level in the knots of the web. The step in the web may be taken arbitrary, but usually the web 10x10 m is used as a noise map, Fig. 4. Noise map – a desired state.
3.3 Methods for Noise Protection System Project In order to successfully project noise protection system we need to analyse active and pasive methods of protection through the effects provoked by the specific variants in the environment. Exact answers in terms of choice of the most efficient and most economic variant of noise protection, coordinated with technological and building projects, can be only given when analyzed parallelly with technoeconomic analysis of various variants.
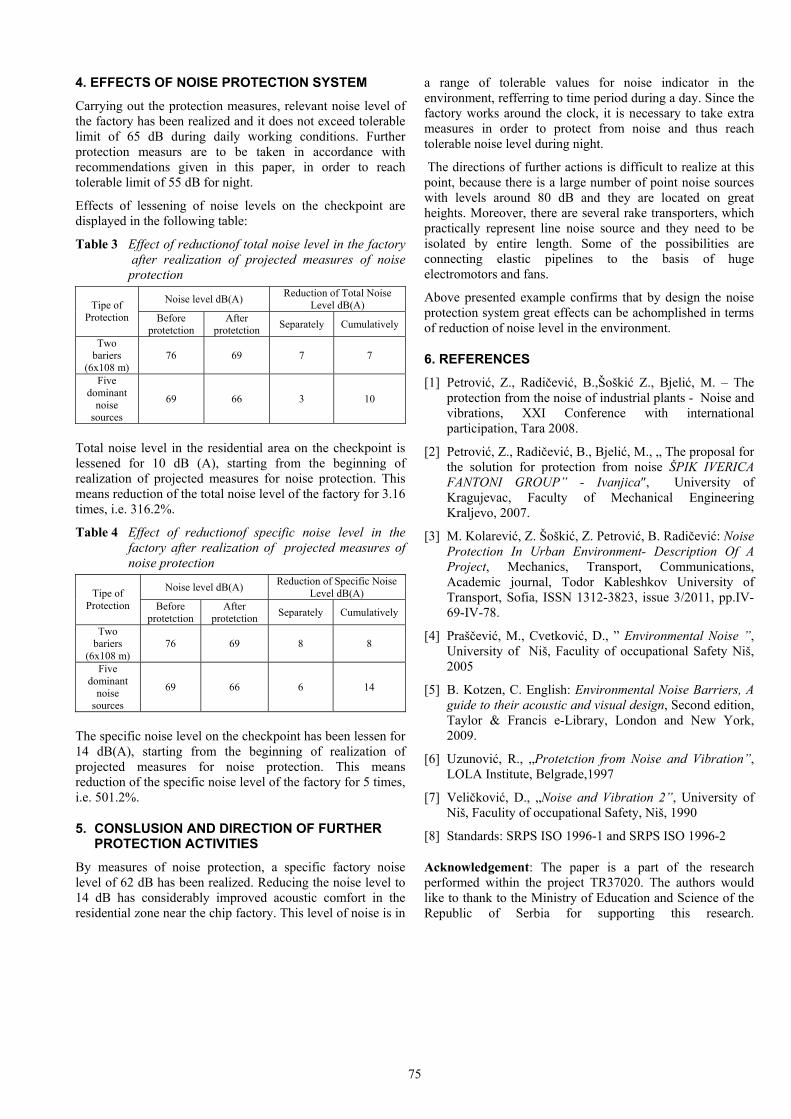
Fig. 5 Barrier and its base construction
Fig. 6 Chosen panel and its protective level
When deciding about alternative solutions, we considered possibilities of technical realization of suggested variants. As a solution of the problem a combination of active and passive noise protection has been suggested. Building of the barriers 6 m high and 60 m long and active protection on the noise sources themselves, with height equal or higher from the barrier height, both represent the most rational solution to protect from the noise coming from the factories in the example mentioned above.

74
Fig. 7 Isolating power of the panel
To build a wall sound we took the panel 80 mm thick (pictures 6, 7), with one perforated surface (32,7%) facing the sources of the noise. Besides its great isolation power, the panel is also fireproof, which is very important here considering the fact that we are talking about chip factory, where the chances for fire are big.
3.4 Protection from Separate Noise Sources
Besides the two barriers, 6 m high and 108 m long, noise protection from separate dominant sources has been carried out. A criterion for establishing priorities in order to realize noise protection from separate sources primarily was acoustical. The protection from the noise sources, which produce the highest level of noise, or sources at the shortest distance to the residential area or sources located on the great height, has been carried out.
Separate sources included by the protection system are:
Vertical worm transporter Ventilator for chip drier with interlayer Inter layer halts Ventilator for chip drier with outlayer Ventilator for extra drying of the chip
Some examples of the noise protection are presented in the figures 8, 9, 10 and 11.
Fig. 8 Ventilator for chip drier with interlayer– after sound
protection
Above mentioned noise sources are protected by a shield, as displayed on the picture which represents vertical worm transporter, or protection is achieved by putting small barriers.
Protection made by shield of absorptive panels (the same panels as those used for the barrier), what can be seen on the
example of vertical worm transporter (pict.9) gives lessening of noise level immediatelly behind the panel for 20 dB. The same goes for the small barriers made of the same panels and set in front of dominant noise sources. (pict.8)
Fig. 9 Vertical worm transporter – before and after sound
protection
Barriers made of ribbed sheet metal give effect of lessening noise levels (immediatelly behind the barrier) for 8 dB. This solution is displayed at the example of inter layer halt of dry chips.
Fig. 10 Inter layer halts – before and after sound protection
Fig. 11 Ventilator for extra drying of the chip – before and
after sound protection
Barriers made of ribbed sheet metal combined with rubber acoustic curtains (immediatelly behind the barrier) give effect of lessening noise levels for 6dB. (fig.11)
75
4. EFFECTS OF NOISE PROTECTION SYSTEM
Carrying out the protection measures, relevant noise level of the factory has been realized and it does not exceed tolerable limit of 65 dB during daily working conditions. Further protection measurs are to be taken in accordance with recommendations given in this paper, in order to reach tolerable limit of 55 dB for night.
Effects of lessening of noise levels on the checkpoint are displayed in the following table:
Table 3 Effect of reductionof total noise level in the factory after realization of projected measures of noise protection
Noise level dB(A) Reduction of Total Noise Level dB(A) Tipe of
Protection Before protetction
After protetction Separately Cumulatively
Two bariers
(6x10⁸ m) 76 69 7 7
Five dominant
noise sources
69 66 3 10
Total noise level in the residential area on the checkpoint is lessened for 10 dB (A), starting from the beginning of realization of projected measures for noise protection. This means reduction of the total noise level of the factory for 3.16 times, i.e. 316.2%.
Table 4 Effect of reductionof specific noise level in the factory after realization of projected measures of noise protection
Noise level dB(A) Reduction of Specific Noise Level dB(A) Tipe of
Protection Before protetction
After protetction Separately Cumulatively
Two bariers
(6x10⁸ m) 76 69 8 8
Five dominant
noise sources
69 66 6 14
The specific noise level on the checkpoint has been lessen for 14 dB(A), starting from the beginning of realization of projected measures for noise protection. This means reduction of the specific noise level of the factory for 5 times, i.e. 501.2%.
5. CONSLUSION AND DIRECTION OF FURTHER PROTECTION ACTIVITIES
By measures of noise protection, a specific factory noise level of 62 dB has been realized. Reducing the noise level to 14 dB has considerably improved acoustic comfort in the residential zone near the chip factory. This level of noise is in
a range of tolerable values for noise indicator in the environment, refferring to time period during a day. Since the factory works around the clock, it is necessary to take extra measures in order to protect from noise and thus reach tolerable noise level during night.
The directions of further actions is difficult to realize at this point, because there is a large number of point noise sources with levels around 80 dB and they are located on great heights. Moreover, there are several rake transporters, which practically represent line noise source and they need to be isolated by entire length. Some of the possibilities are connecting elastic pipelines to the basis of huge electromotors and fans.
Above presented example confirms that by design the noise protection system great effects can be achomplished in terms of reduction of noise level in the environment.
6. REFERENCES
[1] Petrović, Z., Radičević, B.,Šoškić Z., Bjelić, M. – The protection from the noise of industrial plants - Noise and vibrations, XXI Conference with international participation, Tara 2008.
[2] Petrović, Z., Radičević, B., Bjelić, M., „ The proposal for the solution for protection from noise ŠPIK IVERICA FANTONI GROUP” - Ivanjica″, University of Kragujevac, Faculty of Mechanical Engineering Kraljevo, 2007.
[3] M. Kolarević, Z. Šoškić, Z. Petrović, B. Radičević: Noise Protection In Urban Environment- Description Of A Project, Mechanics, Transport, Communications, Academic journal, Todor Kableshkov University of Transport, Sofia, ISSN 1312-3823, issue 3/2011, pp.IV-69-IV-78.
[4] Praščević, M., Cvetković, D., ” Environmental Noise ”, University of Niš, Faculity of occupational Safety Niš, 2005
[5] B. Kotzen, C. English: Environmental Noise Barriers, A guide to their acoustic and visual design, Second edition, Taylor & Francis e-Library, London and New York, 2009.
[6] Uzunović, R., „Protetction from Noise and Vibration”, LOLA Institute, Belgrade,1997
[7] Veličković, D., „Noise and Vibration 2”, University of Niš, Faculity of occupational Safety, Niš, 1990
[8] Standards: SRPS ISO 1996-1 and SRPS ISO 1996-2
Acknowledgement: The paper is a part of the research performed within the project TR37020. The authors would like to thank to the Ministry of Education and Science of the Republic of Serbia for supporting this research.