Embed Size (px)
Citation preview

Designing dietary interventions: a reappraisal of the demographic and socio-economic determinants of dietary choice in the UK
Conference or Workshop Item
Accepted Version
Srinivasan, C. S. (2010) Designing dietary interventions: a reappraisal of the demographic and socio-economic determinants of dietary choice in the UK. In: Annual Conference of the Agricultural Economics Society, 29-31 March 2010, Edinburgh, pp. 1-15. (Unpublished) Available at http://centaur.reading.ac.uk/17724/
It is advisable to refer to the publisher’s version if you intend to cite from the work. See Guidance on citing .
All outputs in CentAUR are protected by Intellectual Property Rights law,

including copyright law. Copyright and IPR is retained by the creators or other copyright holders. Terms and conditions for use of this material are defined in the End User Agreement .
www.reading.ac.uk/centaur
CentAUR
Central Archive at the University of Reading
Reading’s research outputs online
DESIGNING DIETARY INTERVENTIONS:
A REAPPRAISAL OF THE DEMOGRAPHIC AND SOCIO-ECONOMIC
DETERMINANTS OF DIETARY CHOICE IN THE UK
C.S.Srinivasan1
Paper presented at the 84th
Annual Conference of the Agricultural Economics Society,
29-31 March 2010, Edinburgh, UK
1 Department of Agricultural and Food Economics ,University of Reading, UK
Abstract
The facilitation of healthier dietary choices by consumers is one of the key elements of the UK
Government’s food strategy. Designing and targeting dietary interventions requires a clear
understanding of the determinants of dietary choice. Conventional analysis of the determinants of
dietary choice has focused on mean response functions which may mask significant differences in the
dietary behaviour of different segments of the population. In this paper we use a quantile regression
approach to investigate how food consumption behaviour varies amongst UK households in different
segments of the population, especially in the upper and lower quantiles characterised by healthy or
unhealthy consumption patterns. We find that the effect of demographic determinants of dietary
choice on households that exhibit less healthy consumption patterns differs significantly from that on
households that make healthier consumption choices. A more nuanced understanding of the
differences in the behavioural responses of households making less-healthy eating choices provides
useful insights for the design and targeting of measures to promote healthier diets.
Introduction
The Cabinet Office report Food Matters (Cabinet Office: 2008) identifies the promotion of
healthier dietary choices by consumers as a key element in the UK Government‟s food
strategy for the 21st century. This follows from the recognition of the enormous health gains
that would accrue to the UK if diets matched nutritional guidelines on fruit and vegetable
consumption, saturated fat, added sugars and salt intake. The Cabinet Office report estimates
that adherence to nutritional guidelines would reduce the risks related to cancer, heart disease
and other illnesses leading to 70,000 fewer people dying prematurely every year. Improved
dietary choices are also crucial for meeting the challenge of obesity, with a quarter of adults
and 10% of children in the UK already classified as “obese”. In addition to the social impacts,
the economic burden of diet related ill-health is estimated at almost £6 billion a year by way
of additional National Health Service costs alone.
Analysis of data from the Expenditure and Food Survey (DEFRA: 2007) suggests that
average food consumption patterns in the UK involve significant deviations from dietary
guidelines prescribed by the Department of Health and also from the dietary norms suggested
by the World Health Organization (Table-1). The contribution to total energy intake from
total fats (38%) and sugars (14%) is considerably in excess of the norms. The contribution of
Polyunsaturated Fatty Acids (PUFAs) to energy intake (6.4%) and the average cholesterol
consumption are within the acceptable range. However, fruit and vegetable intake falls well
short of the recommended intake of 400 grams per day. Designing effective policy
interventions to promote healthy eating requires identification of households and individuals
within households that make less healthy dietary choices or are at risk of food insecurity and
an understanding of the determinants of their dietary choice.
Determinants of Dietary Choice
The analysis of dietary choice spans a wide range of social science perspectives and the
literature identifies a diverse set of determinants of dietary choice that extend well beyond
physiological or nutritional needs. Other factors influencing food choice include biological,
economic, physical, social and psychological determinants besides attitudes, beliefs and
knowledge about food (EUFIC: 2008)2. Dietary choice is, thus, the result of a complex
interaction between a wide range of determinants. The influence of individual determinants
2 Biological determinants include hunger, appetite and taste, economic determinants include cost, income and
availability, physical determinants include access to food, cooking skills, education and time, and social
determinants include family, culture, peers and meal patterns
1
can also vary significantly across individuals and groups and over time. Different
interventions may have to be designed to modify the dietary choices of different groups of the
population, taking into account the multiplicity of factors influencing their decisions on food
choice. The influence of different sets of determinants of dietary choice identified above has
largely been analysed within the disciplinary framework to which they relate. For instance,
economic studies have focused almost exclusively on socio-economic and demographic
determinants while psychological studies have largely confined themselves to the analysis of
psychological determinants, expecting the impact of socio-economic determinants to be
mediated through their impact on attitudes, norms and beliefs.
Although the literature recognises the role of a complex set of determinants in influencing
dietary choice that go well beyond demographic and socio-economic determinants, these
determinants remain a key area of interest from a practical policy making perspective. This is
because dietary interventions can be readily targeted at broad groups based on demographic
and socio-economic characteristics of households. For instance, if it is known that the poorest
households deviate the most from healthy eating norms, then it is relatively easy to target
interventions at the poorest households. Even if the information available to the policy maker
is that the relationship between low household income and poor dietary choice holds only
when a number of factors (e.g., age, education, attitudes and knowledge) are controlled for,
the policy maker may still opt for targeting interventions based on household income –
simply because of the difficulties in identifying and targeting households that conform to a
complex set of characteristics. It is also much more difficult (and probably a lot more
expensive) to target interventions at households or individuals with certain attitudes, beliefs
and knowledge or other psychological attributes.
In this paper we use a quantile regression approach to investigate the influence of
demographic and socio-economic drivers of dietary choice in UK households in different
segments of the population, especially those characterised by less healthy consumption
patterns. Previous econometric approaches in the literature have relied on multiple linear or
logistic regressions to analyse the impact of these drivers on dietary choice. These approaches
assess the mean response of the outcome variables and constrain the effect of explanatory
variables to be the same along the whole range of (dietary) outcomes. In designing
interventions, we are more interested in the behaviour of households in the upper or lower
tails of dietary outcomes (denoting inadequate or excessive consumption of certain nutrients
or food products). In the context of dietary choice, the heterogeneity of response to
2
explanatory variables in different consumption ranges is a key element of interest. This paper
explores the hypothesis that the impact of demographic and socio-economic explanatory
variables tends to vary along the whole range of dietary outcomes and could be significantly
different from the mean response values in the consumption ranges of interest.
We use a quantile regression approach using household data from the UK‟s Expenditure and
Food Survey to explore the demographic and socio-economic drivers of fat consumption in
UK households –specifically adherence to the dietary guidelines relating to the the share of
energy derived from fat consumption. We have chosen to explore the determinants of fat
consumption because excessive fat consumption has been strongly linked to a range of
chronic diseases, besides being considered a major cause of the increasing incidence of
obesity. The approach can, however, be readily extended to other dietary guidelines (e.g.,
those related to sugar, salt, cholestrerol or fruit and vegetable intake). The methodological
advantage of this approach is that it allows us to understand how the impact of drivers of
dietary choice in non-compliant groups (characterised by less healthy dietary choice) differ
from that in other groups that appear to conform to healthy eating advice. This can provide
insights into the potential effectiveness of dietary interventions targeted at specific
demographic/socio-economic groups. The quantile regression (QR) technique allows the
impact of the selected drivers to vary along the whole range of fat intake (share of energy
derived from fat). The relevance of QR in diet and nutrition analysis arises from the interest
in the tails of the dietary outcome distributions – characterised by inadequate or excessive
consumption of nutrients and foods- and an increasing number of applications are emerging
(e.g,Variyam, Blaylock and Smallwood (2002), Sinha (2005). A recent application examined
the impact of socio-economic determinants on fruit and vegetable intake in the UK
(Boukouvalas, Shankar and Traill: 2009).
Data and Variables
This paper uses data from the UK‟s Expenditure and Food Survey (EFS) for 2005-06 which
now incorporates DEFRA‟s National Food Survey data. DEFRA‟s Food Survey collects
detailed information about food consumption at the household level based on two-week
diaries maintained by household members and the household reference person (HRP). The
Food Survey of 2005-06 surveyed a nationally representative sample of 6785 households and
includes data on food consumed at home as well as food consumed outside the home. The
survey records food consumed in 2225 categories, which makes it possible to analyse
household food consumption at several different levels of disaggregation. The dataset also
3

provides nutrient conversion factors for each food category covering a total of 47 macro and
micro nutrients. It is, therefore, possible to compute the intake of different nutrients at the
household level using the data set.
The dietary norms related to certain foods/nutrients (e.g., fruit and vegetables, cholesterol etc)
are related to the per capita per day consumption of those foods/nutrients. Meaningful
estimation of per capita consumption of these foods/nutrients from household data requires
the calculation of the number of adult equivalents in each household. The weights to be used
for household members in different age-groups in calculating the adult equivalents were
derived from the Estimated Average Requirements (EARs) for Energy of the Department of
Health (1991). The EFS also provides information on the “equivalised3” income of each
household using the OECD scale and the McClement scale (EFS: 2006).The demographic
and socio-economic characteristics of each household in the survey are available from the
EFS. The variables considered in this paper are based on primarily on the earlier literature
and are summarised in Table-2.
The categorical variables listed in Table-2 have a large number of categories in the EFS.
They were redefined and reduced to a smaller number of categories for convenience in
regression analysis and presentation. For these categorical variables a number of dummy
variables were defined for use in regression analysis. The base category defined for each
categorical variable is indicated in Table-2. After deleting the households which did not
maintain food consumption diaries data on 6767 households were used in the analysis.
Least Squares and Quantile Regression Analysis
A multiple linear regression was first estimated to provide a basis for comparison with
quantile regression results. The dependent variable was the share of fat in total energy intake
in the household (expressed in percentage points) [hereinafter referred to as “fatshare”] which
was computed from the data on all the food consumed by the household and the associated
nutrient conversion factors. The explanatory variables were the demographic and socio-
economic variables described in Table-1. For household income, a quadratic term was also
included in the equation to allow its effect to vary with size. All the continuous variables
were centred at the median for convenience in the interpretation of regression coefficients.
3 “Equivalised” income is a measure of income for each household which adjusts for the composition of the
household and economies of scale in expenditure in different categories.
4
In quantile regression, conditional quantiles were estimated for fatshare at six different
quantiles – 0.05, 0.25, 0.50 (median), 0.75, 0.90 and 0.95. The estimation was done using the
„quantreg‟ module in the R statistical software package. Confidence intervals were computed
using the bootstrap procedure described in Koenker (2005) which is incorporated in the
quantreg module.
Results
The UK dietary guidelines for fat consumption suggest that energy derived from fats should
not exceed 30% of total energy intake. Figure-1 shows the distribution of energy derived
from fat (in percentage points) for the survey households. It may be seen that variance in
energy intake from fat is considerable at the household level. A little over 50% of the
households exceed the 30% recommended norm for fat intake. A quarter of the households
derive more than 40% of their total energy from fats. This variance can be observed even
within specific ranges of the socio-economic determinants (e.g., within a specific household
income range). This suggests that the impact of these determinants may vary by intake level,
which is what quantile regression allows us to explore.
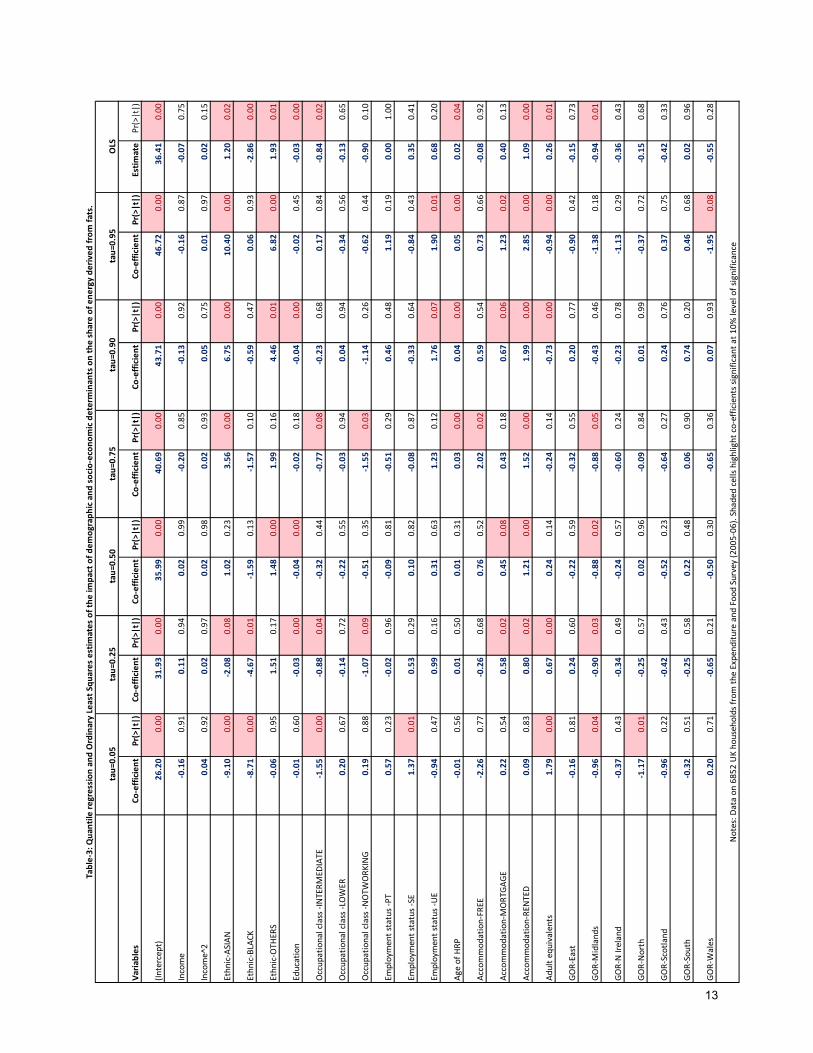
Table-3 presents the results for linear quantile regression with “fatshare” as the dependent
variable and the same set of explanatory variables as used in the multiple linear regression.
The table presents the coefficients and P-values for all the explanatory variables for the
selected set of quantiles from 0.05 to 0.95. The ordinary least squares (OLS) estimates are
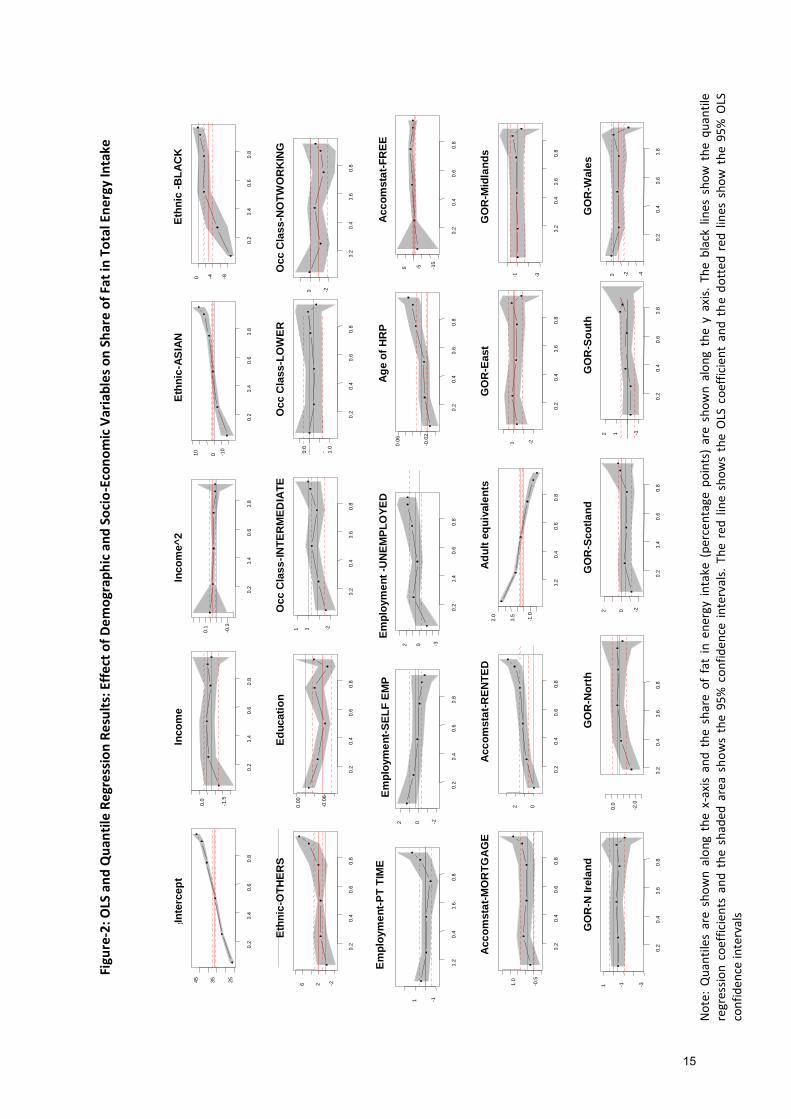
also presented in the last column of the table to facilitate comparisons. Figure-2 presents the
graphs for each explanatory variable showing the coefficients estimated at each of the
selected quantiles. The shaded areas in the graphs show the 95% percent confidence intervals
associated with the co-efficient estimates. The OLS estimates and the associated 95%
confidence intervals, shown as the black line and dotted lines respectively, are superimposed
on the quantile regression graphs.
It may be seen from the graphs in Figure-2, that for most variables, some portion of the QR
estimates lie outside the OLS confidence intervals. Interestingly, these differences are marked
at the lower and upper quantiles, which represent healthy or less healthy eating choices. In
the case of fatshare, it is the upper quantiles that represent less healthy dietary choices, while
the lower quantiles represent healthier dietary choices. The large divergence of the QR
estimates from the OLS estimates, particularly in the extreme quantiles suggests that the
simple conditional mean shift suggested by the OLS model may be a misleading
5
representation of the impact of demographic/socio-economic drivers on dietary choice. The
implications of the QR results for the impacts of these drivers are discussed below.
The coefficients of equivalised household income are insignificant in OLS as well as QR.
This suggests that income has virtually no effect on the share of fat in energy intake. The QR
coefficients at all quantiles lie within the OLS confidence intervals. Moreover, the quadratic
household income term is also insignificant which suggests that the effect of income does not
change as the size of income increases or decreases. It must be noted that these results are not
inconsistent with results from previous studies (e.g. Riccuito, Tarasuk and Yatchew (2006),
Giskes et al (2006)) that find a positive relationship between income and dietary intakes,
particularly in the lower income ranges. Our dependent variable is the share of energy
derived from fat and the OLS and QR coefficients only indicate that this share is not affected
significantly by changes in the level of income. It is the adherence to the dietary guideline
which is insensitive to income, not the level of dietary intakes.
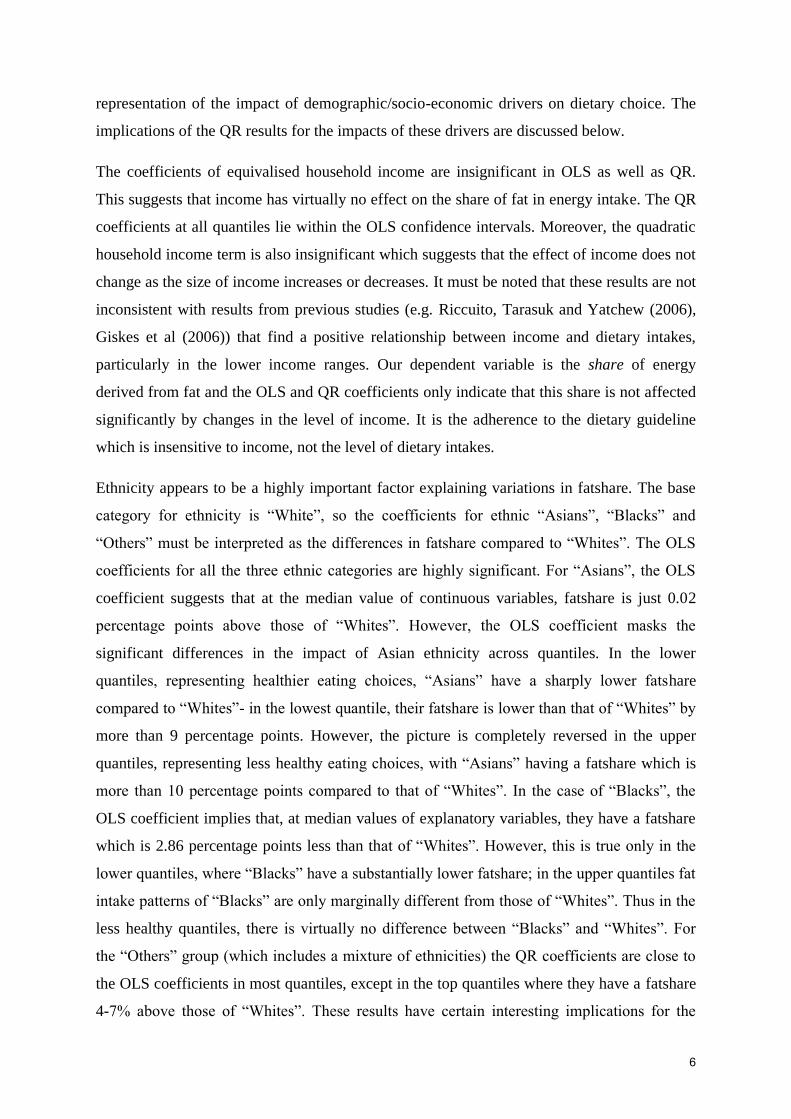
Ethnicity appears to be a highly important factor explaining variations in fatshare. The base
category for ethnicity is “White”, so the coefficients for ethnic “Asians”, “Blacks” and
“Others” must be interpreted as the differences in fatshare compared to “Whites”. The OLS
coefficients for all the three ethnic categories are highly significant. For “Asians”, the OLS
coefficient suggests that at the median value of continuous variables, fatshare is just 0.02
percentage points above those of “Whites”. However, the OLS coefficient masks the
significant differences in the impact of Asian ethnicity across quantiles. In the lower
quantiles, representing healthier eating choices, “Asians” have a sharply lower fatshare
compared to “Whites”- in the lowest quantile, their fatshare is lower than that of “Whites” by
more than 9 percentage points. However, the picture is completely reversed in the upper
quantiles, representing less healthy eating choices, with “Asians” having a fatshare which is
more than 10 percentage points compared to that of “Whites”. In the case of “Blacks”, the
OLS coefficient implies that, at median values of explanatory variables, they have a fatshare
which is 2.86 percentage points less than that of “Whites”. However, this is true only in the
lower quantiles, where “Blacks” have a substantially lower fatshare; in the upper quantiles fat
intake patterns of “Blacks” are only marginally different from those of “Whites”. Thus in the
less healthy quantiles, there is virtually no difference between “Blacks” and “Whites”. For
the “Others” group (which includes a mixture of ethnicities) the QR coefficients are close to
the OLS coefficients in most quantiles, except in the top quantiles where they have a fatshare
4-7% above those of “Whites”. These results have certain interesting implications for the
6
targeting of dietary interventions. The average figures for fatshare for “Asians” (37%) and
“Blacks” (33%) are only marginally different from “Whites” (36%) which may suggest that
the dietary choices of these ethnic groups are not of special concern in dietary interventions
aimed at reducing fatshare. This may not be an appropriate conclusion in the light of the QR
results. While “Asians” and “Blacks” make better dietary choices in the lower (healthy
eating) quantiles, in the upper quantiles (characterised by less healthy eating choices) they
fare substantially worse than “Whites” (as in the case of “Asians”) or are not different from
“Whites” (as in the case of “Blacks”). Any dietary intervention targeting high fatshare groups
should in fact prioritise these ethnic groups for attention.
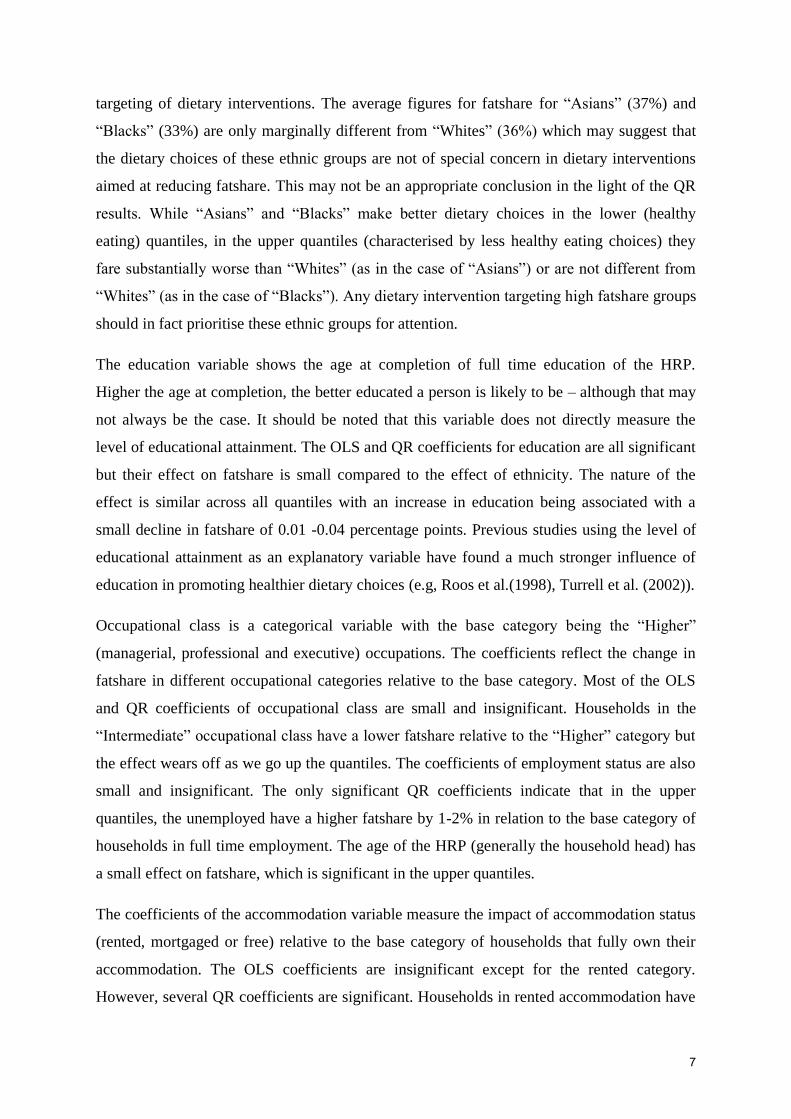
The education variable shows the age at completion of full time education of the HRP.
Higher the age at completion, the better educated a person is likely to be – although that may
not always be the case. It should be noted that this variable does not directly measure the
level of educational attainment. The OLS and QR coefficients for education are all significant
but their effect on fatshare is small compared to the effect of ethnicity. The nature of the
effect is similar across all quantiles with an increase in education being associated with a
small decline in fatshare of 0.01 -0.04 percentage points. Previous studies using the level of
educational attainment as an explanatory variable have found a much stronger influence of
education in promoting healthier dietary choices (e.g, Roos et al.(1998), Turrell et al. (2002)).
Occupational class is a categorical variable with the base category being the “Higher”
(managerial, professional and executive) occupations. The coefficients reflect the change in
fatshare in different occupational categories relative to the base category. Most of the OLS
and QR coefficients of occupational class are small and insignificant. Households in the
“Intermediate” occupational class have a lower fatshare relative to the “Higher” category but
the effect wears off as we go up the quantiles. The coefficients of employment status are also
small and insignificant. The only significant QR coefficients indicate that in the upper
quantiles, the unemployed have a higher fatshare by 1-2% in relation to the base category of
households in full time employment. The age of the HRP (generally the household head) has
a small effect on fatshare, which is significant in the upper quantiles.
The coefficients of the accommodation variable measure the impact of accommodation status
(rented, mortgaged or free) relative to the base category of households that fully own their
accommodation. The OLS coefficients are insignificant except for the rented category.
However, several QR coefficients are significant. Households in rented accommodation have
7
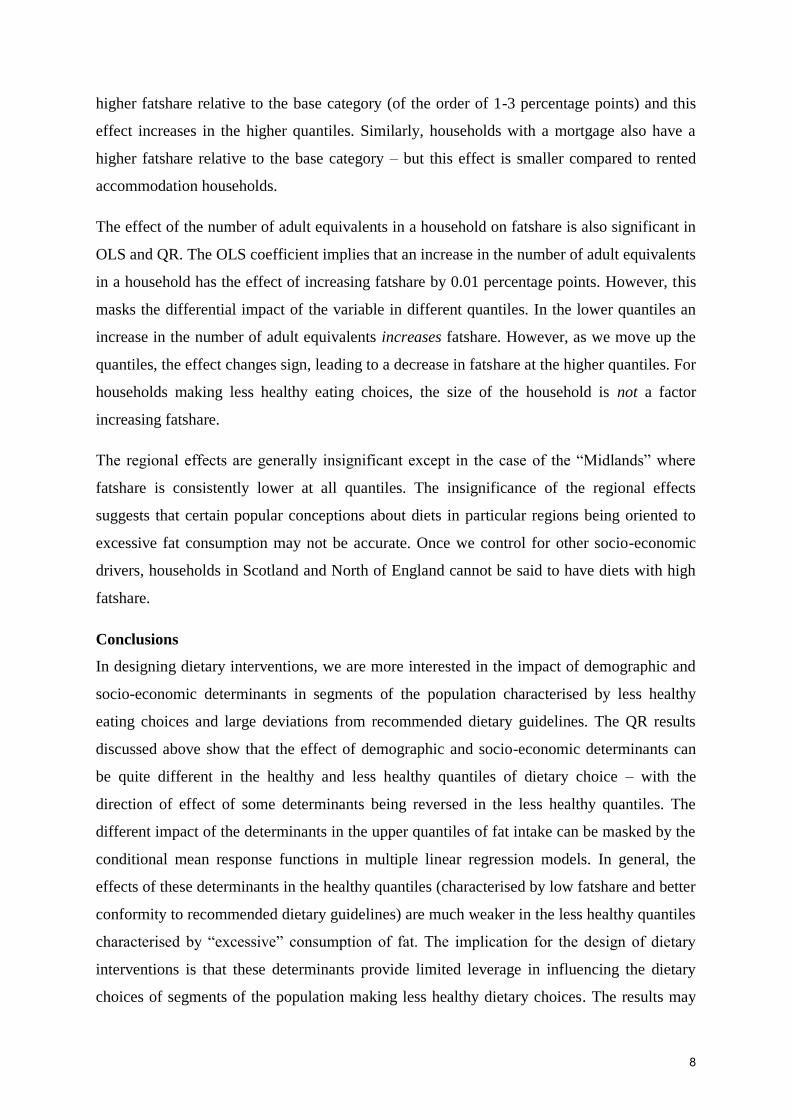
higher fatshare relative to the base category (of the order of 1-3 percentage points) and this
effect increases in the higher quantiles. Similarly, households with a mortgage also have a
higher fatshare relative to the base category – but this effect is smaller compared to rented
accommodation households.
The effect of the number of adult equivalents in a household on fatshare is also significant in
OLS and QR. The OLS coefficient implies that an increase in the number of adult equivalents
in a household has the effect of increasing fatshare by 0.01 percentage points. However, this
masks the differential impact of the variable in different quantiles. In the lower quantiles an
increase in the number of adult equivalents increases fatshare. However, as we move up the
quantiles, the effect changes sign, leading to a decrease in fatshare at the higher quantiles. For
households making less healthy eating choices, the size of the household is not a factor
increasing fatshare.
The regional effects are generally insignificant except in the case of the “Midlands” where
fatshare is consistently lower at all quantiles. The insignificance of the regional effects
suggests that certain popular conceptions about diets in particular regions being oriented to
excessive fat consumption may not be accurate. Once we control for other socio-economic
drivers, households in Scotland and North of England cannot be said to have diets with high
fatshare.
Conclusions
In designing dietary interventions, we are more interested in the impact of demographic and
socio-economic determinants in segments of the population characterised by less healthy
eating choices and large deviations from recommended dietary guidelines. The QR results
discussed above show that the effect of demographic and socio-economic determinants can
be quite different in the healthy and less healthy quantiles of dietary choice – with the
direction of effect of some determinants being reversed in the less healthy quantiles. The
different impact of the determinants in the upper quantiles of fat intake can be masked by the
conditional mean response functions in multiple linear regression models. In general, the
effects of these determinants in the healthy quantiles (characterised by low fatshare and better
conformity to recommended dietary guidelines) are much weaker in the less healthy quantiles
characterised by “excessive” consumption of fat. The implication for the design of dietary
interventions is that these determinants provide limited leverage in influencing the dietary
choices of segments of the population making less healthy dietary choices. The results may
8
also indicate that traits and preference patterns unrelated to socio-economic characteristics
may be responsible for poor dietary choice. This is perhaps reflected in the large impact of
ethnicity relative to other socio-economic determinants. Ethnicity may encapsulate a range of
culturally determined traits and preferences, which are independent of the socio-economic
situation of the household. The results also suggest that some of the popular perceptions of
the drivers of dietary choice (e.g., attribution of better dietary choice to ethnic minorities or
association of excessive fat consumption with certain regional diets or occupational status)
may be inaccurate. This analysis can be extended to other nutrients and associated dietary
guidelines. This can provide useful insights into the potential effectiveness or utility of
targeting dietary interventions based on demographic and socio-economic characteristics of
the population.
References
Boukovoulas,G, Shankar, B and Traill, W.B. (2009). Determinants of Fruit and Vegetable Intake in
England: A Re-examination Based on Quantile Regression. Public Health Nutrition, 12(11), 2183-
2191.
Cabinet Office (2008). Food Matters: Towards a Strategy for the 21st Century. The Strategy Unit,
Cabinet Office. Accessed from
http://www.cabinetoffice.gov.uk/media/cabinetoffice/strategy/assets/food/food_matters1.pdf
DEFRA (2007).Family Food: A Report on the 2007 Expenditure and Food Survey. A National
Statistics Publication by DEFRA, London (TSO).
Department of Health (1991). Dietary Reference Values of Food Energy and Nutrients for the United
Kingdom. Report on Health & Social Subjects 41. Report of the Panel on Dietary Reference Values of
the Committee on Medical Aspects of Food Policy. TSO, UK.
European Food Information Council (2008). The Determinants of Food Choice. Accessed from
http://www.eufic.org/article/en/page/RARCHIVE/expid/review-food-choice/ Giskes, K.,Turrell G, van Lenth, F.J. and Mackenbach J.P. (2006). A Multi-Level Study of Socio-
Economic Inequalities in Food Choice Behaviour and Dietary Intake Among the Dutch Population:
The GLOBE Study. Public Health Nutrition 9, 75-83.
Koenker, R. (2005). Quantile Regression. Cambridge University Press.
Ricciuto, L, Tarasuk, V. and Yatchew A. (2006). Socio-demogrpahic Influences on Food Purchasing
Among Canadian Households. European Journal of Clinical Nutrition, 60, 778-790.
Roos, E, Lahelma, E, Virtanen, M. Prattala, R and Pietinen, P (1998). Gender, Socio-Economic Status
and Family Status as Determinants of Food Behaviour. Social Science and Medicine, 12 (15), 1519-
1529.
Sinha, K. (2005). Household Characteristics and Calorie Intake in Rural India: A Quantile Regression
Approach. Accessed fromhttp://dspace.anu.edu.au/bitstream/1885/43190/1/WP2005_02.pdf
9

Turrell, G., Hewitt, B., Patterson, C.,Oldengburg, B. and Gould, T. (2002). Socio-Economic
Differences in Food Purchasing Behaviour and Suggested Implications for Diet-Related Health
Promotion. Journal of Human Nutrition and Dietetics, 15 (5), 355-364.
Variyam, J.N., Blaylock, J. and Smallwood, D. (2002). Characterizing the Distribution of
Macronutrient Intakes Among US Adults: A Quantile Regression Approach. American Journal of
Agricultural Economics, 82(2), 454-466.
WHO (2003). Diet, Nutrition and the Prevention of Chronic Diseases: Report of a Joint WHO/FAO
Expert Consultation, Geneva, 28 January - 1 February 2002, WHO Technical Report Series: 916.
Geneva: World Health Organization.
10
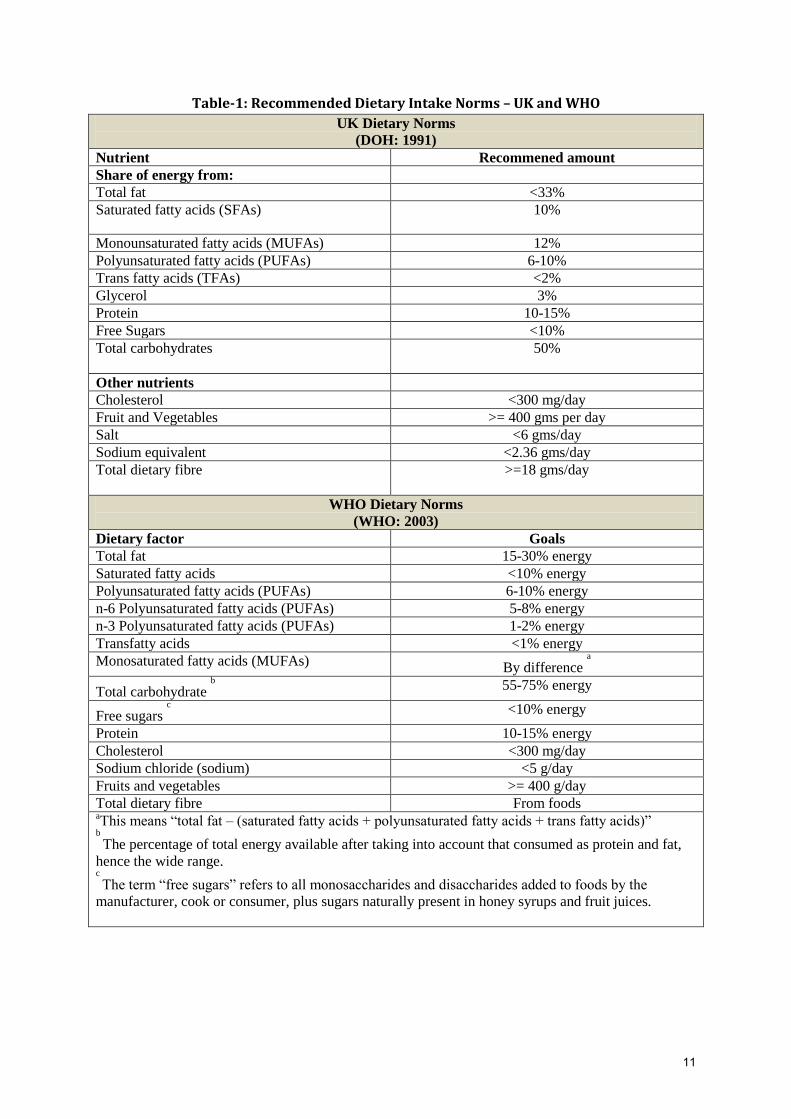
Table-1: Recommended Dietary Intake Norms – UK and WHO
UK Dietary Norms
(DOH: 1991)
Nutrient Recommened amount
Share of energy from:
Total fat <33%
Saturated fatty acids (SFAs) 10%
Monounsaturated fatty acids (MUFAs) 12%
Polyunsaturated fatty acids (PUFAs) 6-10%
Trans fatty acids (TFAs) <2%
Glycerol 3%
Protein 10-15%
Free Sugars <10%
Total carbohydrates 50%
Other nutrients
Cholesterol <300 mg/day
Fruit and Vegetables >= 400 gms per day
Salt <6 gms/day
Sodium equivalent <2.36 gms/day
Total dietary fibre >=18 gms/day
WHO Dietary Norms
(WHO: 2003)
Dietary factor Goals
Total fat 15-30% energy
Saturated fatty acids <10% energy
Polyunsaturated fatty acids (PUFAs) 6-10% energy
n-6 Polyunsaturated fatty acids (PUFAs) 5-8% energy
n-3 Polyunsaturated fatty acids (PUFAs) 1-2% energy
Transfatty acids <1% energy
Monosaturated fatty acids (MUFAs) By difference
a
Total carbohydrate b
55-75% energy
Free sugars c
<10% energy
Protein 10-15% energy
Cholesterol <300 mg/day
Sodium chloride (sodium) <5 g/day
Fruits and vegetables >= 400 g/day
Total dietary fibre From foods aThis means “total fat – (saturated fatty acids + polyunsaturated fatty acids + trans fatty acids)”
b
The percentage of total energy available after taking into account that consumed as protein and fat,
hence the wide range. c
The term “free sugars” refers to all monosaccharides and disaccharides added to foods by the
manufacturer, cook or consumer, plus sugars naturally present in honey syrups and fruit juices.
11

Table 2: Socio-Economic and Demographic Variables
Variable Units Categories
Household income from all
sources
£ „000 per week
Equivalised household
income
£ „000 per week
Age of HRP Years
Education of HRP (age at
completion of full time
education)
Years
Accommodation status of
household
Categorical variable Owned, Mortgaged,
Rented, Free [Base =
Owned]
Mortgage outstanding
(proxy for debt burden of
the household)
£ 000s
Employment status of the
household
Categorical variable Full time, Part time, Self-
Employed and
Unemployed [Base = Full
time]
Occupational status of the
household
Categorical variable Higher, Intermediate,
Lower, Not working [
Base= Higher]
Ethnicity Categorical variable White, Black, Asian,
Others [Base = White]
Government Office Region Categorical variable. North, Midlands, East,
South, London, Scotland,
Wales, Northern Ireland
[Base= London]
12
Var
iab
les
Co
-eff
icie
nt
Pr(
>|t|
)C
o-e
ffic
ien
tP
r(>|
t|)
Co
-eff
icie
nt
Pr(
>|t|
)C
o-e
ffic
ien
tP
r(>|
t|)
Co
-eff
icie
nt
Pr(
>|t|
)C
o-e
ffic
ien
tP
r(>|
t|)
Esti
mat
eP
r(>|
t|)
(In
terc
ept)
26
.20
0.0
03
1.9
30
.00
35
.99
0.0
04
0.6
90
.00
43
.71
0.0
04
6.7
20
.00
36
.41
0.0
0
Inco
me
-0.1
60
.91
0.1
10
.94
0.0
20
.99
-0.2
00
.85
-0.1
30
.92
-0.1
60
.87
-0.0
70
.75
Inco
me^
20
.04
0.9
20
.02
0.9
70
.02
0.9
80
.02
0.9
30
.05
0.7
50
.01
0.9
70
.02
0.1
5
Eth
nic
-ASI
AN
-9.1
00
.00
-2.0
80
.08
1.0
20
.23
3.5
60
.00
6.7
50
.00
10
.40
0.0
01
.20
0.0
2
Eth
nic
-BLA
CK
-8.7
10
.00
-4.6
70
.01
-1.5
90
.13
-1.5
70
.10
-0.5
90
.47
0.0
60
.93
-2.8
60
.00
Eth
nic
-OTH
ERS
-0.0
60
.95
1.5
10
.17
1.4
80
.00
1.9
90
.16
4.4
60
.01
6.8
20
.00
1.9
30
.01
Edu
cati
on
-0.0
10
.60
-0.0
30
.00
-0.0
40
.00
-0.0
20
.18
-0.0
40
.00
-0.0
20
.45
-0.0
30
.00
Occ
up
atio
nal
cla
ss -
INTE
RM
EDIA
TE-1
.55
0.0
0-0
.88
0.0
4-0
.32
0.4
4-0
.77
0.0
8-0
.23
0.6
80
.17
0.8
4-0
.84
0.0
2
Occ
up
atio
nal
cla
ss -
LOW
ER0
.20
0.6
7-0
.14
0.7
2-0
.22
0.5
5-0
.03
0.9
40
.04
0.9
4-0
.34
0.5
6-0
.13
0.6
5
Occ
up
atio
nal
cla
ss -
NO
TWO
RK
ING
0.1
90
.88
-1.0
70
.09
-0.5
10
.35
-1.5
50
.03
-1.1
40
.26
-0.6
20
.44
-0.9
00
.10
Emp
loym
ent
stat
us
-PT
0.5
70
.23
-0.0
20
.96
-0.0
90
.81
-0.5
10
.29
0.4
60
.48
1.1
90
.19
0.0
01
.00
Emp
loym
ent
stat
us
-SE
1.3
70
.01
0.5
30
.29
0.1
00
.82
-0.0
80
.87
-0.3
30
.64
-0.8
40
.43
0.3
50
.41
Emp
loym
ent
stat
us
-UE
-0.9
40
.47
0.9
90
.16
0.3
10
.63
1.2
30
.12
1.7
60
.07
1.9
00
.01
0.6
80
.20
Age
of
HR
P-0
.01
0.5
60
.01
0.5
00
.01
0.3
10
.03
0.0
00
.04
0.0
00
.05
0.0
00
.02
0.0
4
Acc
om
mo
dat
ion
-FR
EE-2
.26
0.7
7-0
.26
0.6
80
.76
0.5
22
.02
0.0
20
.59
0.5
40
.73
0.6
6-0
.08
0.9
2
Acc
om
mo
dat
ion
-MO
RTG
AG
E0
.22
0.5
40
.58
0.0
20
.45
0.0
80
.43
0.1
80
.67
0.0
61
.23
0.0
20
.40
0.1
3
Acc
om
mo
dat
ion
-REN
TED
0.0
90
.83
0.8
00
.02
1.2
10
.00
1.5
20
.00
1.9
90
.00
2.8
50
.00
1.0
90
.00
Ad
ult
eq
uiv
alen
ts
1.7
90
.00
0.6
70
.00
0.2
40
.14
-0.2
40
.14
-0.7
30
.00
-0.9
40
.00
0.2
60
.01
GO
R-E
ast
-0.1
60
.81
0.2
40
.60
-0.2
20
.59
-0.3
20
.55
0.2
00
.77
-0.9
00
.42
-0.1
50
.73
GO
R-M
idla
nd
s-0
.96
0.0
4-0
.90
0.0
3-0
.88
0.0
2-0
.88
0.0
5-0
.43
0.4
6-1
.38
0.1
8-0
.94
0.0
1
GO
R-N
Irel
and
-0.3
70
.43
-0.3
40
.49
-0.2
40
.57
-0.6
00
.24
-0.2
30
.78
-1.1
30
.29
-0.3
60
.43
GO
R-N
ort
h-1
.17
0.0
1-0
.25
0.5
70
.02
0.9
6-0
.09
0.8
40
.01
0.9
9-0
.37
0.7
2-0
.15
0.6
8
GO
R-S
cotl
and
-0.9
60
.22
-0.4
20
.43
-0.5
20
.23
-0.6
40
.27
0.2
40
.76
0.3
70
.75
-0.4
20
.33
GO
R-S
ou
th-0
.32
0.5
1-0
.25
0.5
80
.22
0.4
80
.06
0.9
00
.74
0.2
00
.46
0.6
80
.02
0.9
6
GO
R-W
ales
0.2
00
.71
-0.6
50
.21
-0.5
00
.30
-0.6
50
.36
0.0
70
.93
-1.9
50
.08
-0.5
50
.28
Tab
le-3
: Q
uan
tile
re
gre
ssio
n a
nd
Ord
inar
y Le
ast
Squ
are
s e
stim
ate
s o
f th
e im
pac
t o
f d
em
ogr
aph
ic a
nd
so
cio
-eco
no
mic
de
term
inan
ts o
n t
he
sh
are
of
en
erg
y d
eri
ved
fro
m f
ats.
No
tes:
Dat
a o
n 6
85
2 U
K h
ou
seh
old
s fr
om
th
e Ex
pen
dit
ure
an
d F
oo
d S
urv
ey (
20
05
-06
). S
had
ed c
ells
hig
hlig
ht
co-e
ffic
ien
ts s
ign
ific
ant
at 1
0%
leve
l of
sign
ific
ance
OLS
tau
=0.0
5ta
u=0
.25
tau
=0.5
0ta
u=0
.75
tau
=0.9
0ta
u=0
.95
13
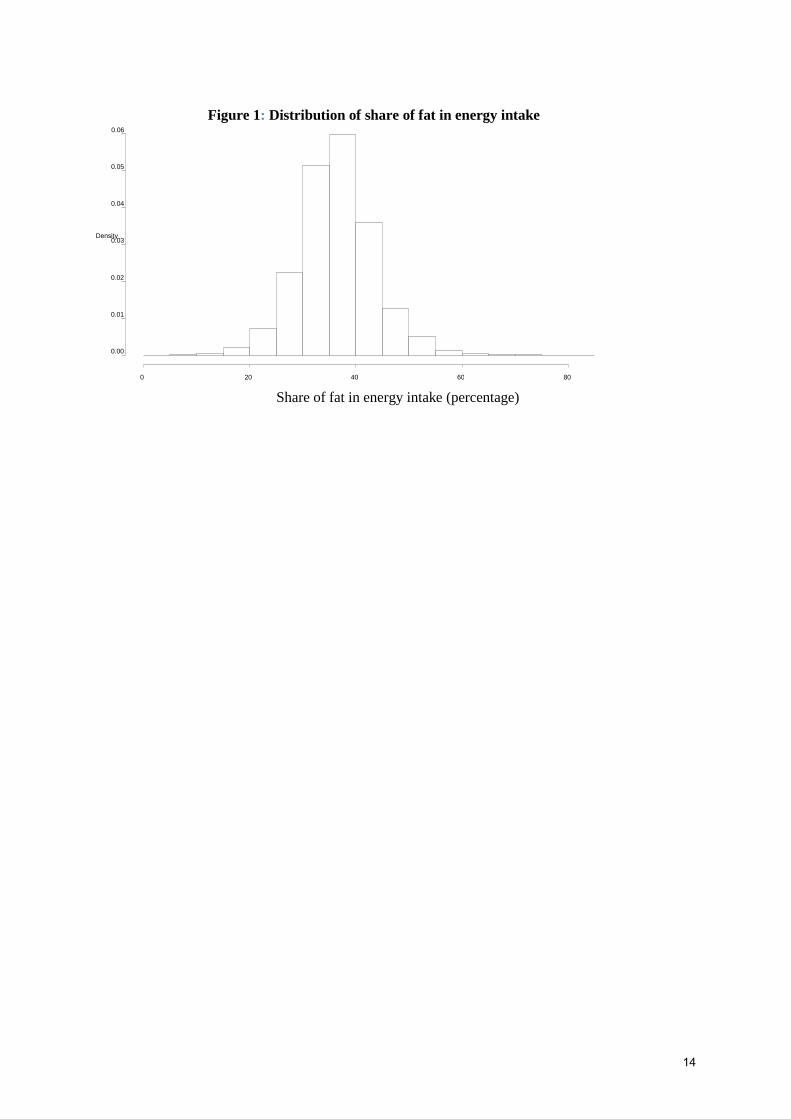
Figure 1: Distribution of share of fat in energy intake
Share of fat in energy intake (percentage)
Density
0 20 40 60 80
0.00
0.01
0.02
0.03
0.04
0.05
0.06
14
No
te:
Qu
anti
les
are
sho
wn
alo
ng
the
x-ax
is a
nd
th
e sh
are
of
fat
in e
ner
gy i
nta
ke (
per
cen
tage
po
ints
) ar
e sh
ow
n a
lon
g th
e y
axi
s. T
he
bla
ck l
ines
sh
ow
th
e q
uan
tile
re
gres
sio
n c
oef
fici
ents
an
d t
he
shad
ed a
rea
sho
ws
the
95%
co
nfi
den
ce i
nte
rval
s. T
he
red
lin
e s
ho
ws
the
OLS
co
effi
cien
t an
d t
he
do
tted
red
lin
es s
ho
w t
he
95%
OLS
co
nfi
den
ce in
terv
als
Figu
re-2
: OLS
an
d Q
uan
tile
Re
gre
ssio
n R
esu
lts:
Eff
ect
of
De
mo
grap
hic
an
d S
oci
o-E
con
om
ic V
aria
ble
s o
n S
har
e o
f Fa
t in
To
tal E
ne
rgy
Inta
ke
0.2
0.4
0.6
0.8
25
35
45
(Inte
rcep
t
0.2
0.4
0.6
0.8
-1.5
0.0
Inco
me
0.2
0.4
0.6
0.8
-0.3
0.1
Inco
me^
2
0.2
0.4
0.6
0.8
-10
0
10
Eth
nic
-AS
IAN
0.2
0.4
0.6
0.8
-8
-4
0
Eth
nic
-B
LA
CK
0.2
0.4
0.6
0.8
-2
2
6
Eth
nic
-OT
HE
RS
0.2
0.4
0.6
0.8
-0.0
6
0.0
0
Ed
ucati
on
0.2
0.4
0.6
0.8
-2
0
1
Occ C
lass
-IN
TE
RM
ED
IAT
E
0.2
0.4
0.6
0.8
- 1.0
0.0
Occ C
lass
-LO
WE
R
0.2
0.4
0.6
0.8
-2
0
Occ C
lass
-NO
TW
OR
KIN
G
0.2
0.4
0.6
0.8
-1
1
Em
plo
ym
en
t-P
T T
IME
0.2
0.4
0.6
0.8
-2
0
2
Em
plo
ym
en
t-S
EL
F E
MP
0.2
0.4
0.6
0.8
-3
0
2 E
mp
loym
en
t -U
NE
MP
LO
YE
D
0.2
0.4
0.6
0.8
-0.0
2
0.0
6
Ag
e o
f H
RP
0.2
0.4
0.6
0.8
-15
-5
5
Acc
om
sta
t-F
RE
E
0.2
0.4
0.6
0.8
-0.5
1.0
Acc
om
sta
t-M
OR
TG
AG
E
0.2
0.4
0.6
0.8
0
2
Acc
om
sta
t-R
EN
TE
D
0.2
0.4
0.6
0.8
-1.0
0.5
2.0
Ad
ult
eq
uiv
ale
nts
0.2
0.4
0.6
0.8
-2
0
GO
R-E
ast
0.2
0.4
0.6
0.8
-3
-1
GO
R-M
idla
nd
s
0.2
0.4
0.6
0.8
-3
-1
1
GO
R-N
Ire
lan
d
0.2
0.4
0.6
0.8
-2.0
0.0
GO
R-N
ort
h
0.2
0.4
0.6
0.8
-2
0
2
GO
R-S
co
tla
nd
0.2
0.4
0.6
0.8
-1
1
2
GO
R-S
ou
th
0.2
0.4
0.6
0.8
-4
-2
0
GO
R-W
ale
s
15