Embed Size (px)
Citation preview
Decision Support Systems for Designing & Managing
Productive, Resilient Landscapes (Work in Progress)
Erick Fernandes1 & Jeffrey Richey2
1. The World Bank, Washington, DC (USA)
2. The University of Washington, Seattle, WA (USA)
Himalayas
Bhutan
India
Guiding Principles
• “If we knew what it was we were doing, it would not be called research, would it?
• Logic will get you from A to B. Imagination will take you everywhere.
• Not everything that can be counted counts and not everything that counts can be counted.
• If the facts don't fit the theory, change the facts.”
Albert Einstein
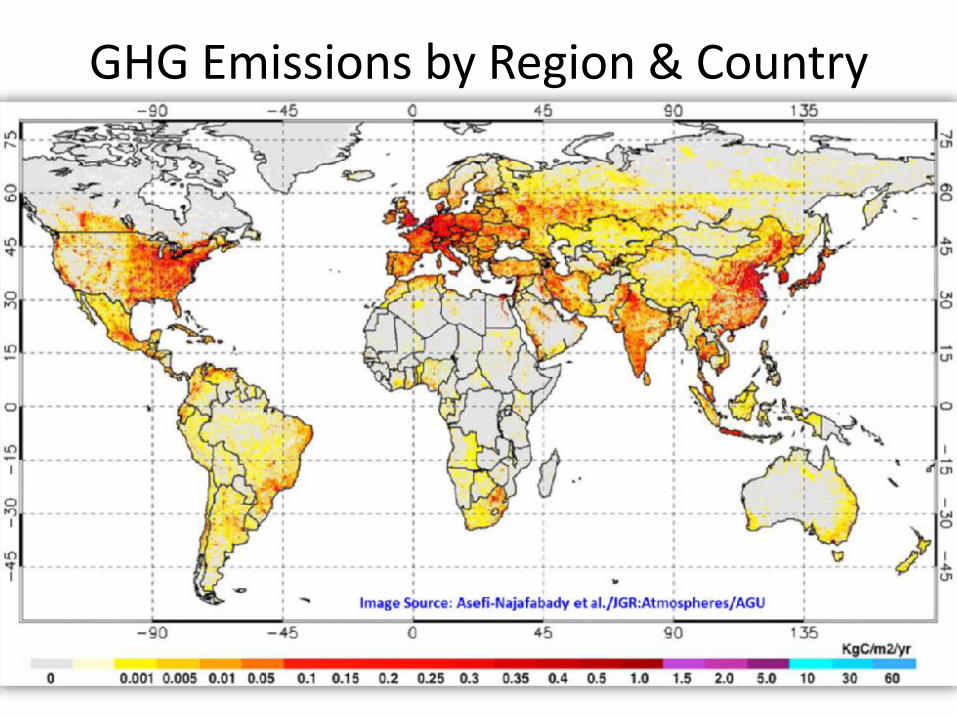
GHG Emissions by Region & Country
1880-89
2000-09
…and the preponderance of evidence says it’s humans—thermometer readings all around the world have risen steadily since the beginning of the Industrial Revolution
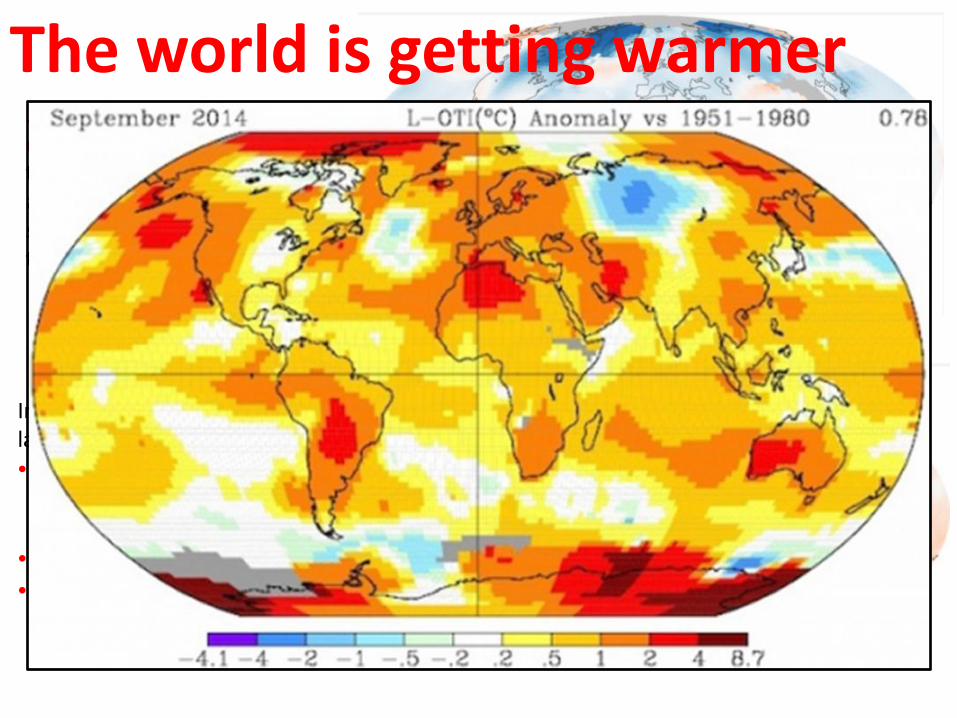
The world is getting warmer
30 year Baseline (1951-1980) = Normal Temp
In the last decade (2000-2009), land temperature changes are
• 2x greater in the United States than ocean temperature changes;
• 2-3x greater in Eurasia; and
• 3-4x greater in the Arctic and the Antarctic Peninsula.
NASA, 2013
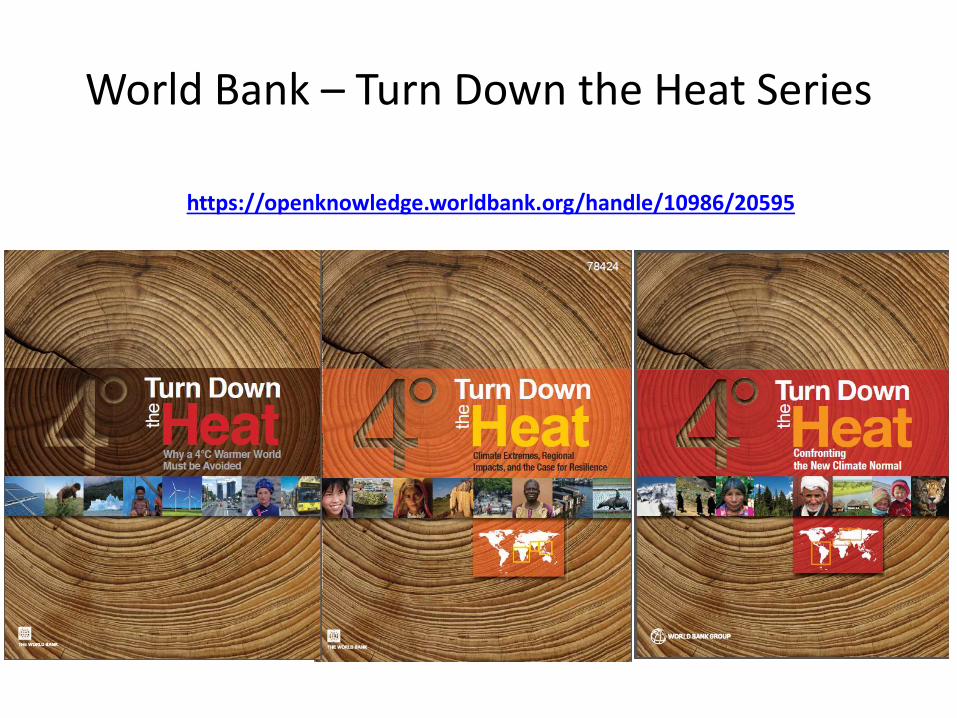
World Bank – Turn Down the Heat Series
https://openknowledge.worldbank.org/handle/10986/20595
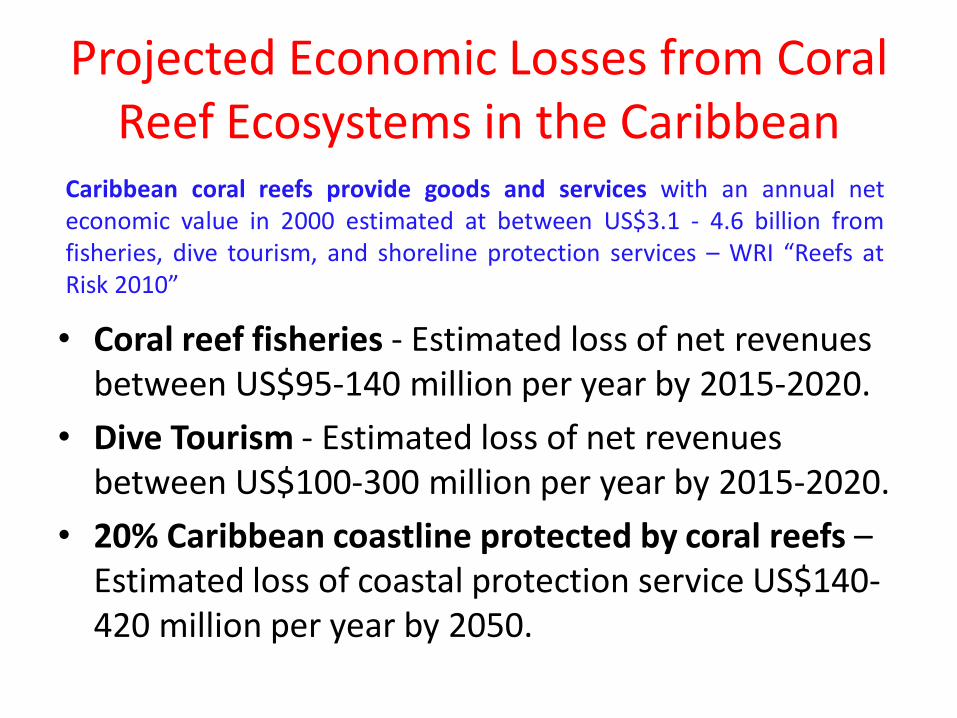
Projected Economic Losses from Coral Reef Ecosystems in the Caribbean
• Coral reef fisheries - Estimated loss of net revenues between US$95-140 million per year by 2015-2020.
• Dive Tourism - Estimated loss of net revenues between US$100-300 million per year by 2015-2020.
• 20% Caribbean coastline protected by coral reefs – Estimated loss of coastal protection service US$140-420 million per year by 2050.
Caribbean coral reefs provide goods and services with an annual net economic value in 2000 estimated at between US$3.1 - 4.6 billion from fisheries, dive tourism, and shoreline protection services – WRI “Reefs at Risk 2010”
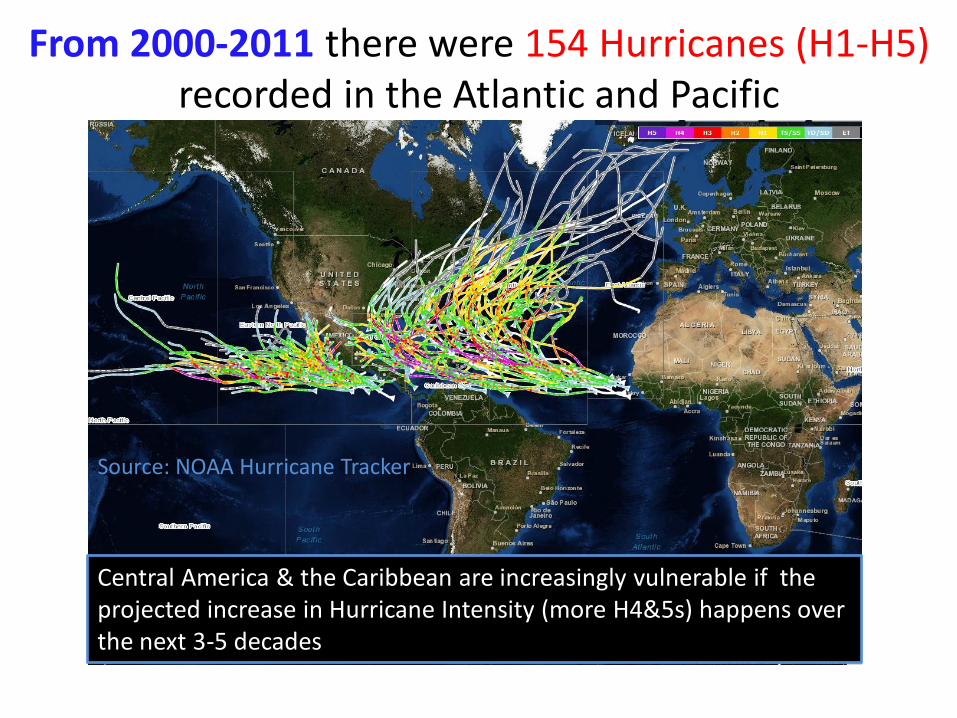
From 2000-2011 there were 154 Hurricanes (H1-H5) recorded in the Atlantic and Pacific
Central America & the Caribbean are increasingly vulnerable if the projected increase in Hurricane Intensity (more H4&5s) happens over the next 3-5 decades
Source: NOAA Hurricane Tracker
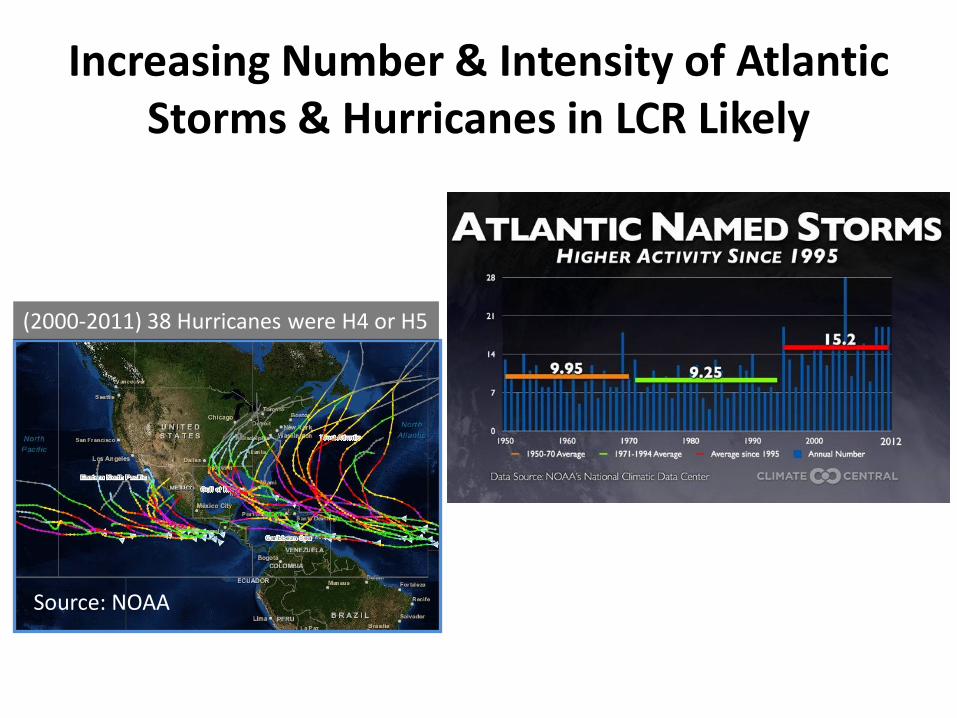
Increasing Number & Intensity of Atlantic Storms & Hurricanes in LCR Likely
(2000-2011) 38 Hurricanes were H4 or H5
Source: NOAA
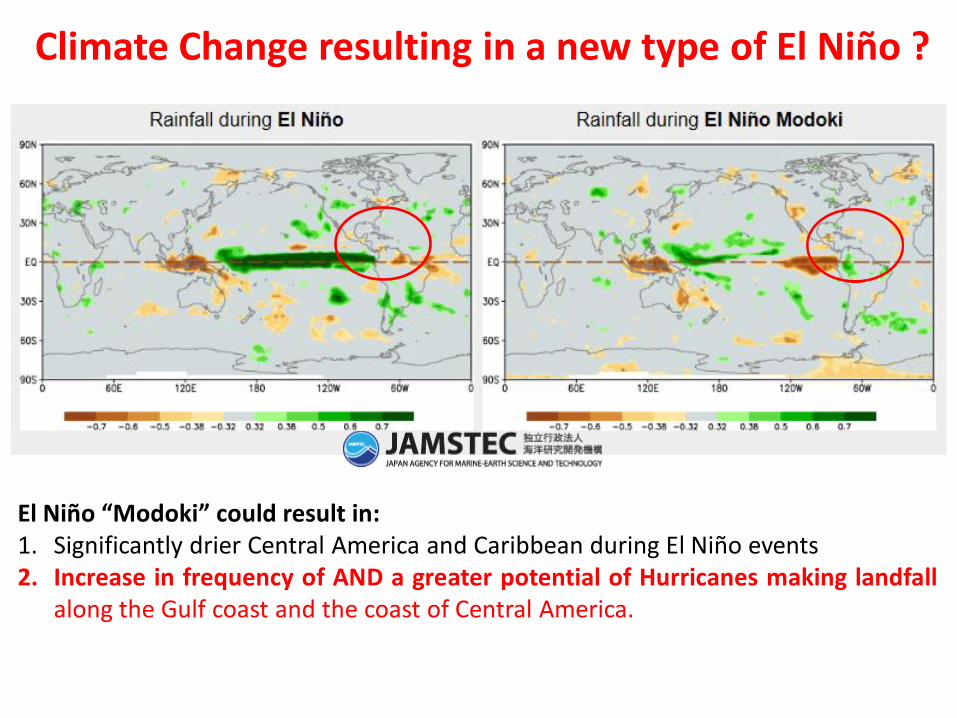
Climate Change resulting in a new type of El Niño ?
El Niño “Modoki” could result in: 1. Significantly drier Central America and Caribbean during El Niño events 2. Increase in frequency of AND a greater potential of Hurricanes making landfall
along the Gulf coast and the coast of Central America.
-40 -30 -20 -10 0
BRA
ARG
MEX
CAC
URY
PER
CHL
ECU
COL
XSM
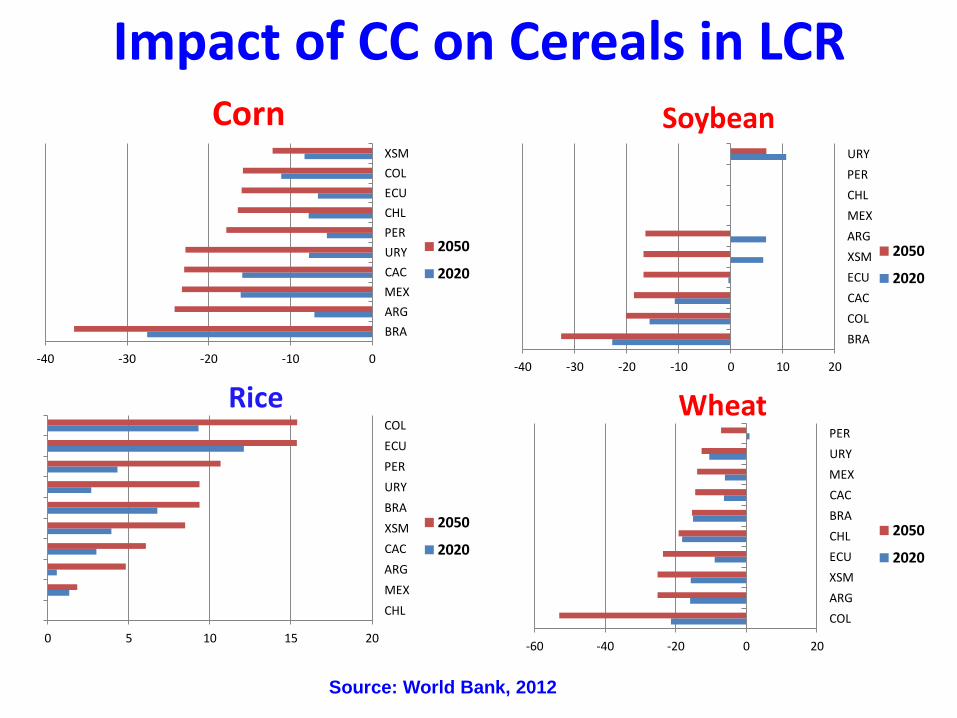
Corn
2050
2020
-40 -30 -20 -10 0 10 20
BRA
COL
CAC
ECU
XSM
ARG
MEX
CHL
PER
URY
Soybean
2050
2020
0 5 10 15 20
CHL
MEX
ARG
CAC
XSM
BRA
URY
PER
ECU
COL
Rice
2050
2020
-60 -40 -20 0 20
COL
ARG
XSM
ECU
CHL
BRA
CAC
MEX
URY
PER
Wheat
2050
2020
Impact of CC on Cereals in LCR
Source: World Bank, 2012
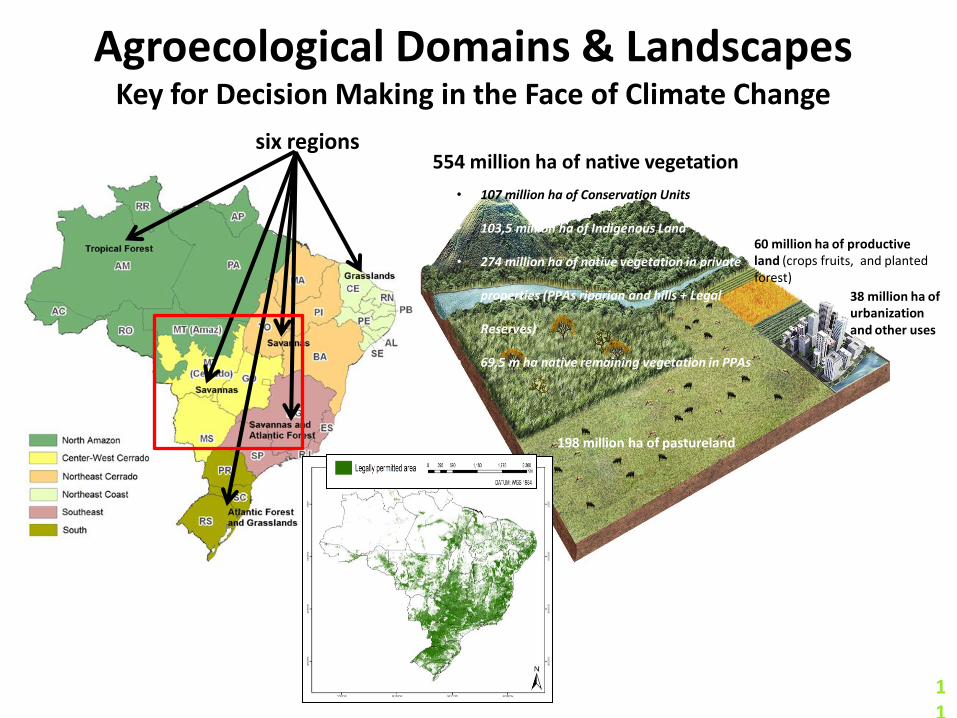
Agroecological Domains & Landscapes Key for Decision Making in the Face of Climate Change
554 million ha of native vegetation
• 107 million ha of Conservation Units
• 103,5 million ha of Indigenous Land
• 274 million ha of native vegetation in private
properties (PPAs riparian and hills + Legal
Reserves)
• 69,5 m ha native remaining vegetation in PPAs
60 million ha of productive land (crops fruits, and planted forest)
38 million ha of urbanization and other uses
198 million ha of pastureland
11
six regions
Study Results (2014)
http://www.profor.info/sites/profor.info/files/docs/web%20brasil_2030_portugues.pdf
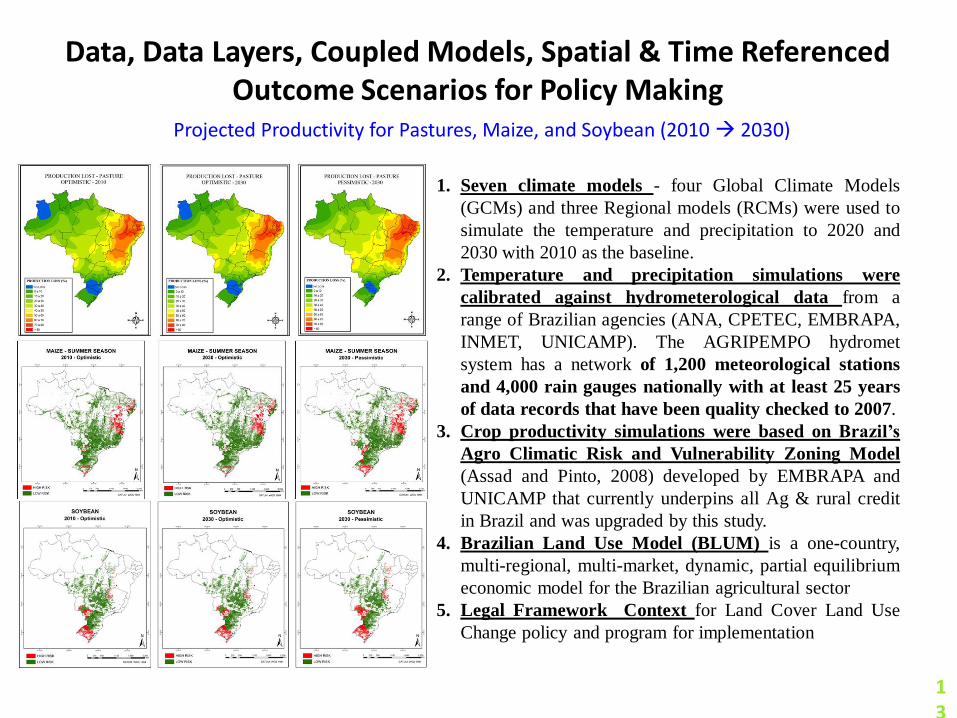
Data, Data Layers, Coupled Models, Spatial & Time Referenced Outcome Scenarios for Policy Making
13
1. Seven climate models - four Global Climate Models
(GCMs) and three Regional models (RCMs) were used to
simulate the temperature and precipitation to 2020 and
2030 with 2010 as the baseline.
2. Temperature and precipitation simulations were
calibrated against hydrometerological data from a
range of Brazilian agencies (ANA, CPETEC, EMBRAPA,
INMET, UNICAMP). The AGRIPEMPO hydromet
system has a network of 1,200 meteorological stations
and 4,000 rain gauges nationally with at least 25 years
of data records that have been quality checked to 2007.
3. Crop productivity simulations were based on Brazil’s
Agro Climatic Risk and Vulnerability Zoning Model
(Assad and Pinto, 2008) developed by EMBRAPA and
UNICAMP that currently underpins all Ag & rural credit
in Brazil and was upgraded by this study.
4. Brazilian Land Use Model (BLUM) is a one-country,
multi-regional, multi-market, dynamic, partial equilibrium
economic model for the Brazilian agricultural sector
5. Legal Framework Context for Land Cover Land Use
Change policy and program for implementation
Projected Productivity for Pastures, Maize, and Soybean (2010 2030)
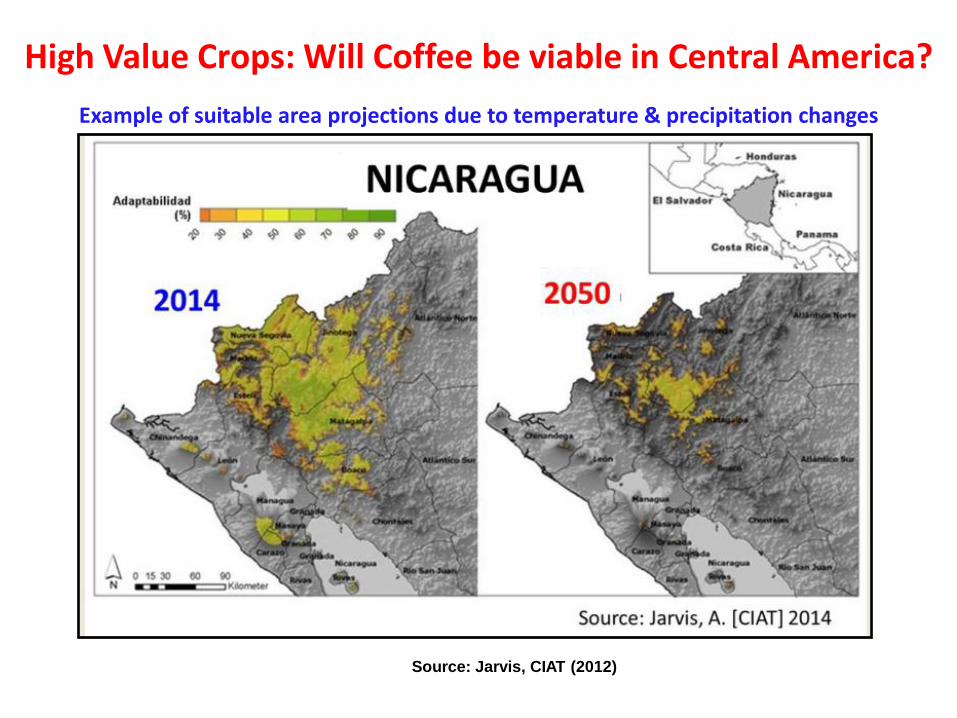
High Value Crops: Will Coffee be viable in Central America?
Source: Jarvis, CIAT (2012)
Example of suitable area projections due to temperature & precipitation changes
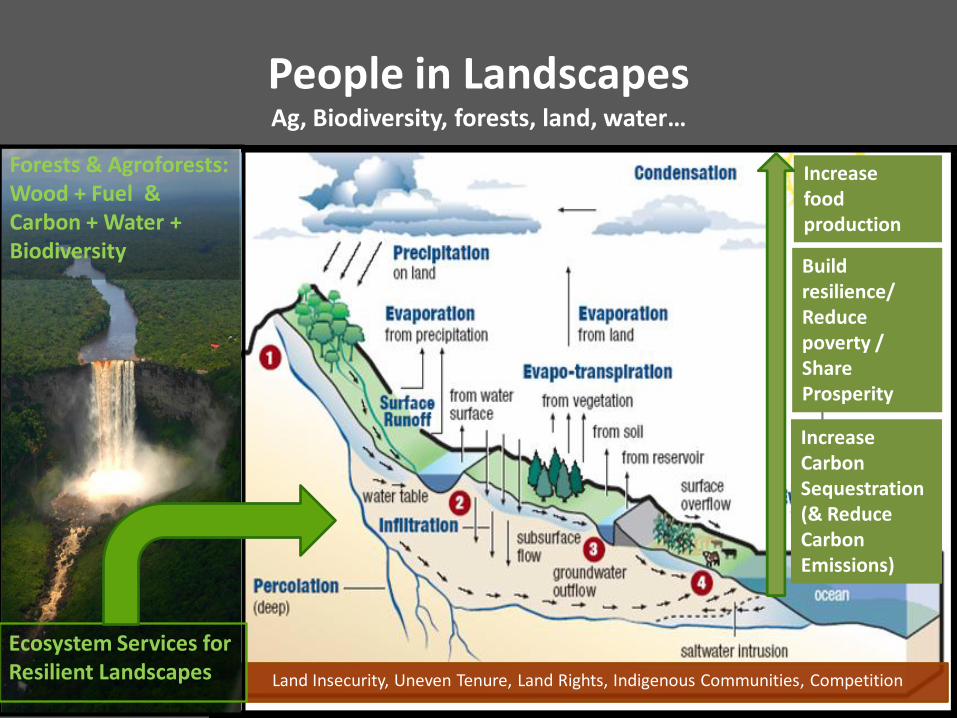
Land Insecurity, Uneven Tenure, Land Rights, Indigenous Communities, Competition
Increase food production
Build resilience/ Reduce poverty / Share Prosperity
Increase Carbon Sequestration (& Reduce Carbon Emissions)
Forests & Agroforests: Wood + Fuel & Carbon + Water + Biodiversity
Ecosystem Services for Resilient Landscapes
People in Landscapes Ag, Biodiversity, forests, land, water…
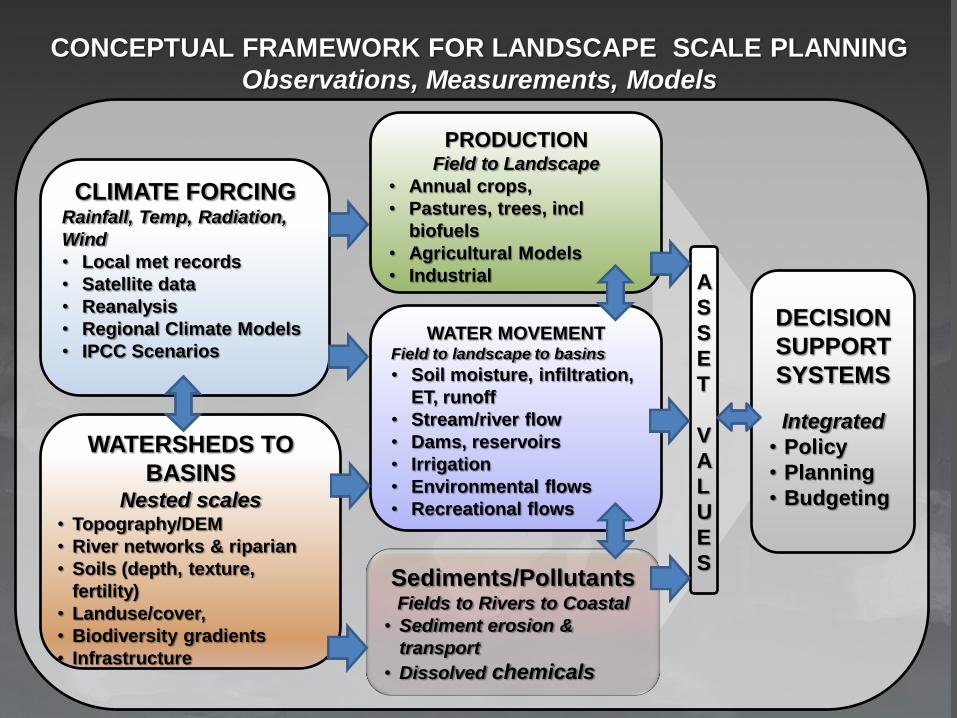
WATERSHEDS TO
BASINS Nested scales
• Topography/DEM
• River networks & riparian
• Soils (depth, texture,
fertility)
• Landuse/cover,
• Biodiversity gradients
• Infrastructure
DECISION
SUPPORT
SYSTEMS
Integrated
• Policy
• Planning
• Budgeting
CONCEPTUAL FRAMEWORK FOR LANDSCAPE SCALE PLANNING
Observations, Measurements, Models
CLIMATE FORCING Rainfall, Temp, Radiation,
Wind
• Local met records
• Satellite data
• Reanalysis
• Regional Climate Models
• IPCC Scenarios
A
S
S
E
T
V
A
L
U
E
S
WATER MOVEMENT Field to landscape to basins
• Soil moisture, infiltration,
ET, runoff
• Stream/river flow
• Dams, reservoirs
• Irrigation
• Environmental flows
• Recreational flows
PRODUCTION Field to Landscape
• Annual crops,
• Pastures, trees, incl
biofuels
• Agricultural Models
• Industrial
Sediments/Pollutants Fields to Rivers to Coastal
• Sediment erosion &
transport
• Dissolved chemicals
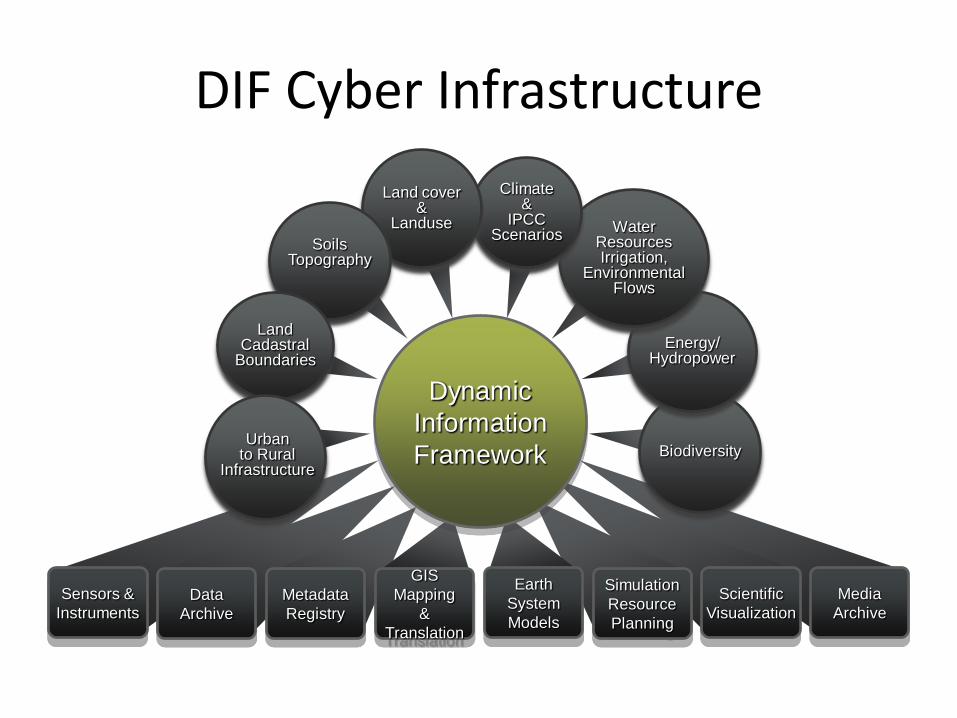
DIF Cyber Infrastructure
Sensors &
Instruments
Earth
System
Models
Data
Archive
Metadata
Registry
GIS
Mapping
&
Translation
Scientific
Visualization
Media
Archive
Simulation
Resource
Planning
Biodiversity
Energy/ Hydropower
Water Resources Irrigation,
Environmental Flows
Climate &
IPCC Scenarios
Land cover &
Landuse
Soils Topography
Land Cadastral
Boundaries
2000
2020
2060
2080
Dynamic
Information
Framework Urban
to Rural Infrastructure
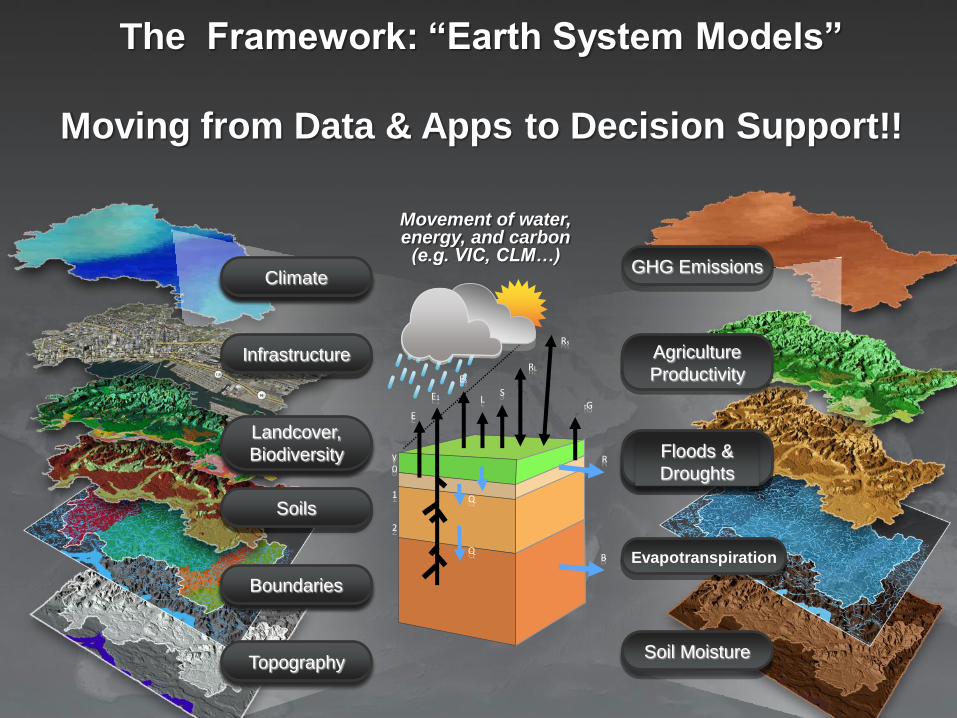
The Framework: “Earth System Models”
Moving from Data & Apps to Decision Support!!
Climate
Landcover,
Biodiversity
Soils
Boundaries
Topography
Infrastructure
GHG Emissions
Agriculture
Productivity
Floods &
Droughts
Evapotranspiration
Soil Moisture
E
y 0 1 2
Rs
RL
S L
Es
E1
Q
Q
tG
R
B
Movement of water, energy, and carbon (e.g. VIC, CLM…)
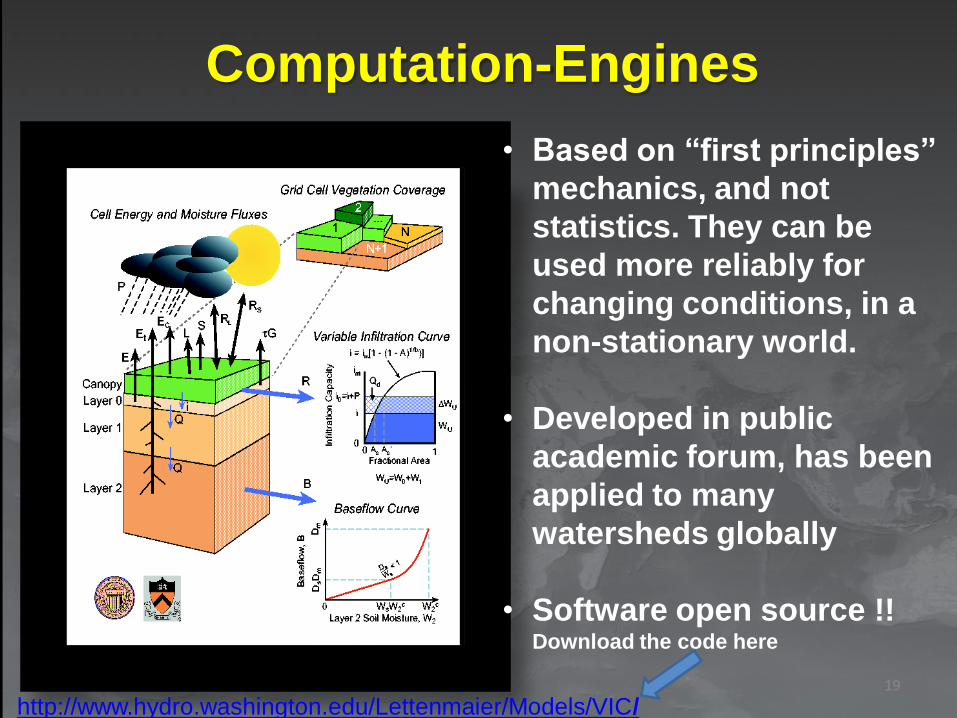
Figure 2 VIC model schematicFigure 2 VIC model schematic
Computation-Engines
• Based on “first principles”
mechanics, and not
statistics. They can be
used more reliably for
changing conditions, in a
non-stationary world.
• Developed in public
academic forum, has been
applied to many
watersheds globally
• Software open source !! Download the code here
19
http://www.hydro.washington.edu/Lettenmaier/Models/VIC/
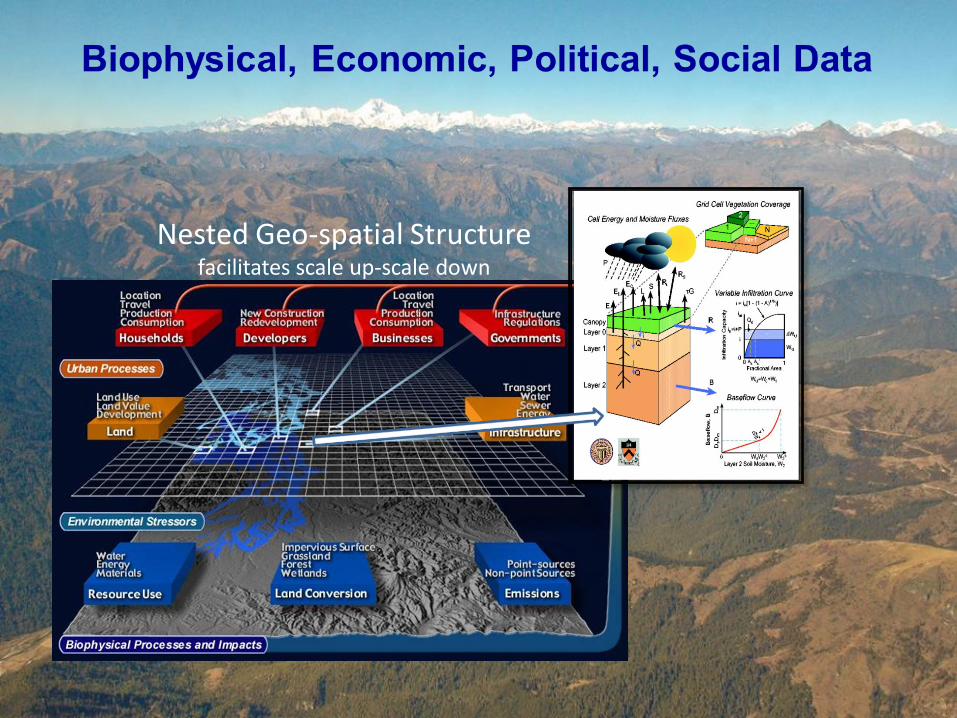
Nested Geo-spatial Structure facilitates scale up-scale down
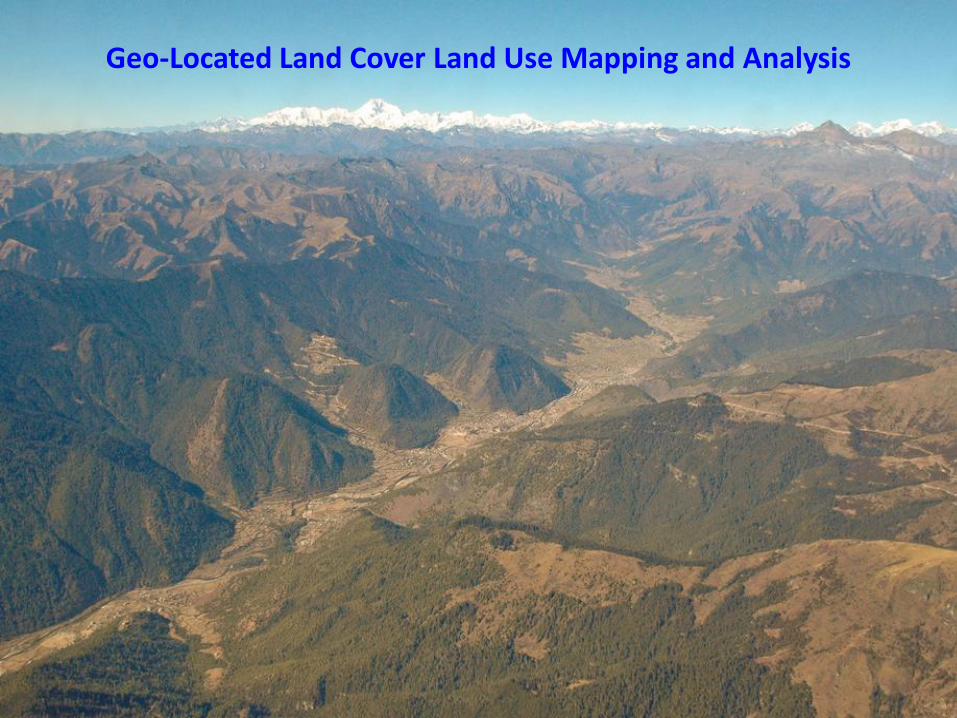
Geo-Located Land Cover Land Use Mapping and Analysis
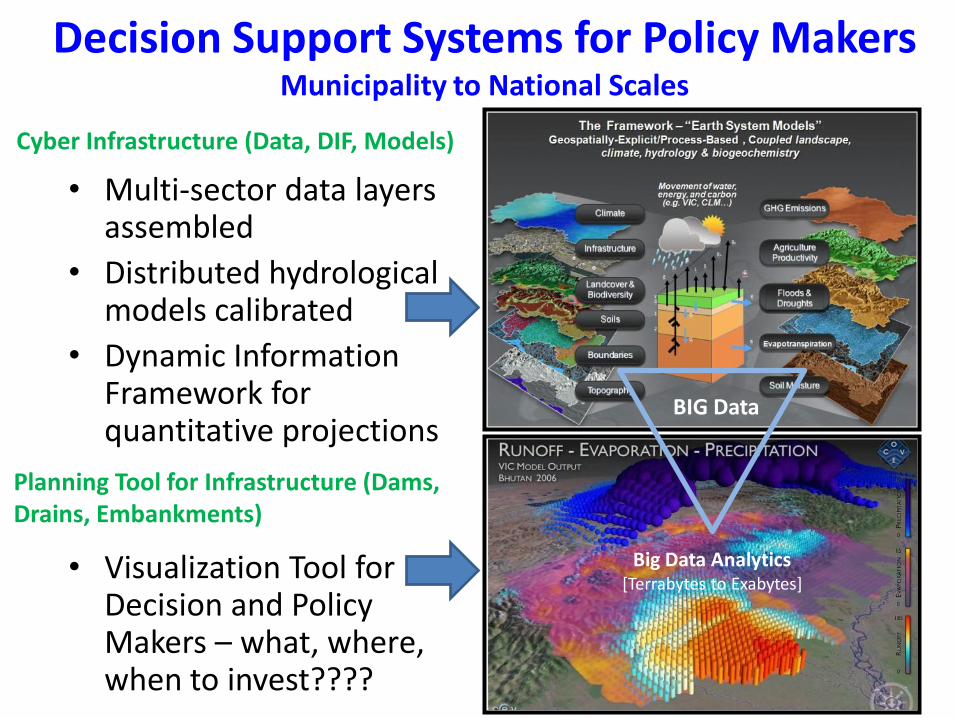
Decision Support Systems for Policy Makers Municipality to National Scales
• Multi-sector data layers assembled
• Distributed hydrological models calibrated
• Dynamic Information Framework for quantitative projections
• Visualization Tool for Decision and Policy Makers – what, where, when to invest????
Cyber Infrastructure (Data, DIF, Models)
Planning Tool for Infrastructure (Dams, Drains, Embankments)
BIG Data
Big Data Analytics [Terrabytes to Exabytes]
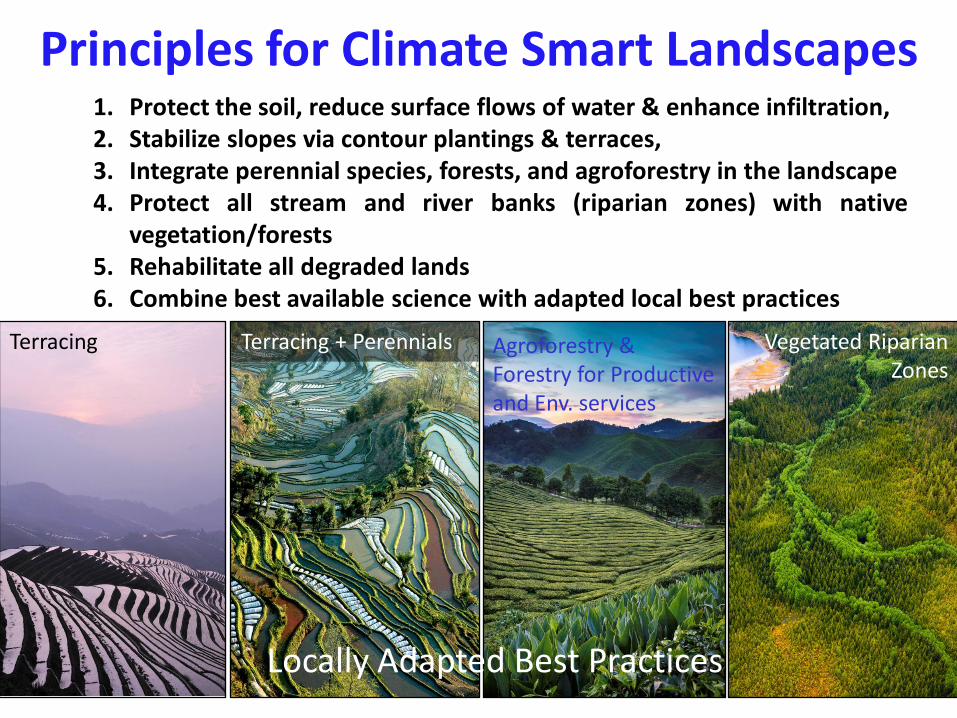
Principles for Climate Smart Landscapes 1. Protect the soil, reduce surface flows of water & enhance infiltration, 2. Stabilize slopes via contour plantings & terraces, 3. Integrate perennial species, forests, and agroforestry in the landscape 4. Protect all stream and river banks (riparian zones) with native
vegetation/forests 5. Rehabilitate all degraded lands 6. Combine best available science with adapted local best practices
Terracing Terracing + Perennials Agroforestry & Forestry for Productive and Env. services
Vegetated Riparian Zones
Locally Adapted Best Practices
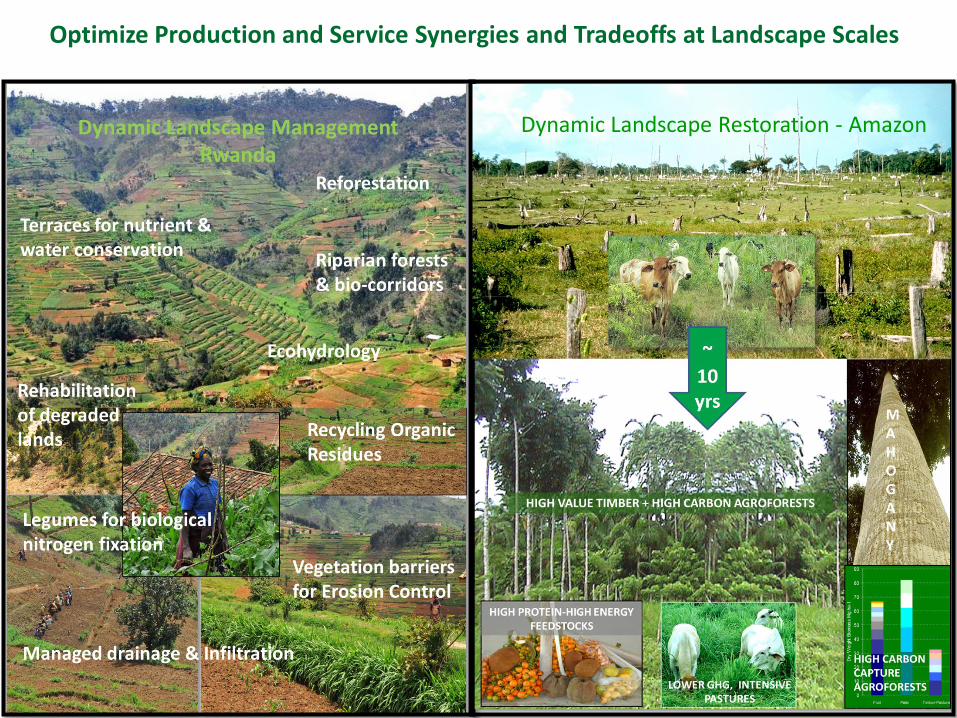
Dynamic Landscape Restoration - Amazon
Optimize Production and Service Synergies and Tradeoffs at Landscape Scales
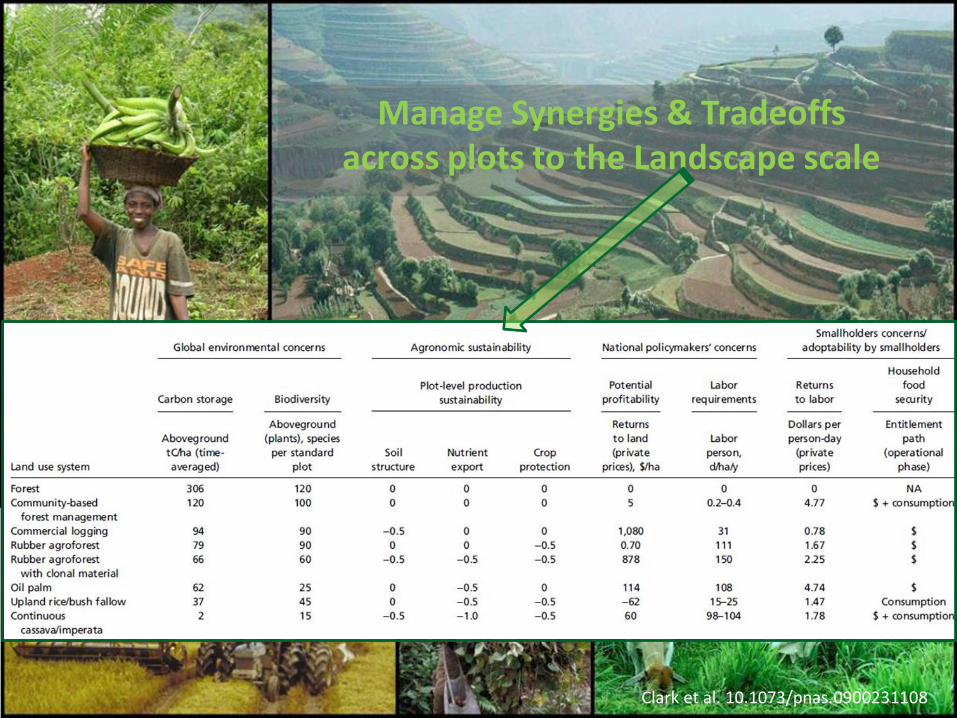
Manage Synergies & Tradeoffs across plots to the Landscape scale
Clark et al. 10.1073/pnas.0900231108
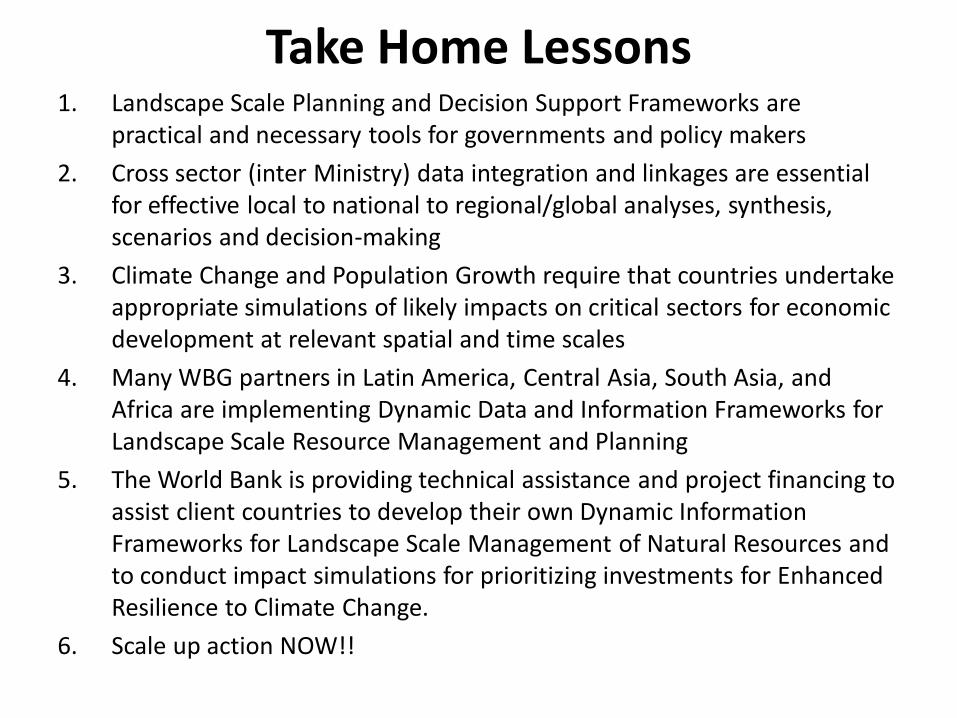
Take Home Lessons 1. Landscape Scale Planning and Decision Support Frameworks are
practical and necessary tools for governments and policy makers
2. Cross sector (inter Ministry) data integration and linkages are essential for effective local to national to regional/global analyses, synthesis, scenarios and decision-making
3. Climate Change and Population Growth require that countries undertake appropriate simulations of likely impacts on critical sectors for economic development at relevant spatial and time scales
4. Many WBG partners in Latin America, Central Asia, South Asia, and Africa are implementing Dynamic Data and Information Frameworks for Landscape Scale Resource Management and Planning
5. The World Bank is providing technical assistance and project financing to assist client countries to develop their own Dynamic Information Frameworks for Landscape Scale Management of Natural Resources and to conduct impact simulations for prioritizing investments for Enhanced Resilience to Climate Change.
6. Scale up action NOW!!