Embed Size (px)
Citation preview
1
Designing WhatDesigning What--if Analysis:if Analysis:Towards a MethodologyTowards a Methodology
DOLAP 06DOLAP 06
Matteo Golfarelli, Stefano Matteo Golfarelli, Stefano RizziRizzi, Andrea , Andrea ProliProliDEIS DEIS –– University of BolognaUniversity of Bologna
Agenda:Agenda:1. Introduction1. Introduction
2. What2. What--if enabled toolsif enabled tools3. Some lessons learnt3. Some lessons learnt
4. Methodological sketch4. Methodological sketch5. The case study5. The case study
6. Conclusions and open issues6. Conclusions and open issues
2
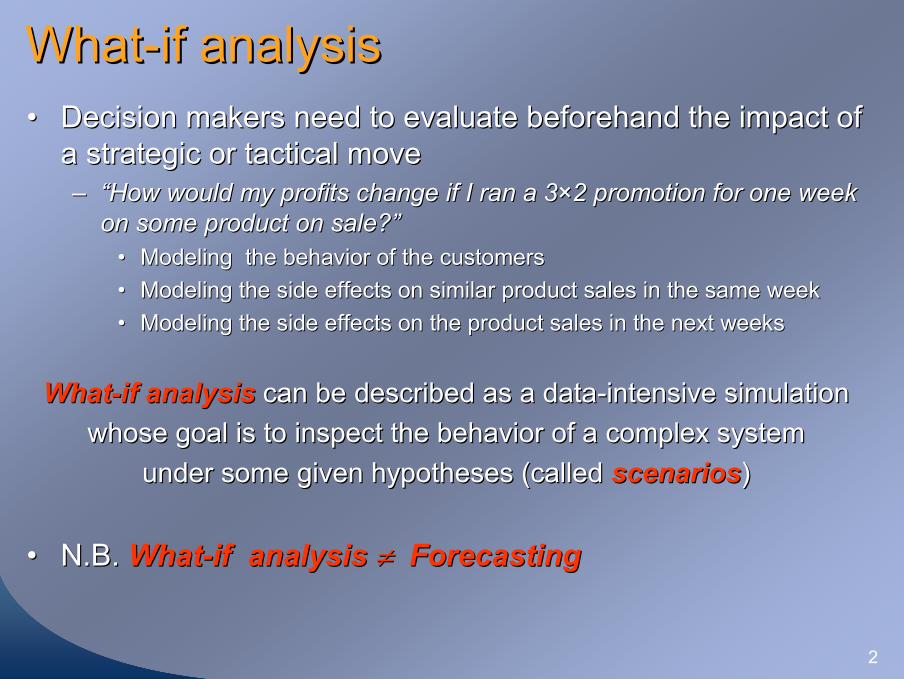
WhatWhat--ifif analysisanalysis•• Decision makers need to evaluate beforehand the impact of Decision makers need to evaluate beforehand the impact of
a strategic or tactical movea strategic or tactical move–– ““How would my profits change if I ran a 3How would my profits change if I ran a 3××2 promotion for one week 2 promotion for one week
on some product on sale?on some product on sale?””•• Modeling the behavior of the customersModeling the behavior of the customers•• Modeling the side effects on similar product sales in the same wModeling the side effects on similar product sales in the same weekeek•• Modeling the side effects on the product sales in the next weeksModeling the side effects on the product sales in the next weeks
WhatWhat--if analysisif analysis can be described as a datacan be described as a data--intensive simulation intensive simulation whose goal is to inspect the behavior of a complex system whose goal is to inspect the behavior of a complex system
under some given hypotheses (called under some given hypotheses (called scenariosscenarios))
•• N.B. N.B. WhatWhat--if analysisif analysis ≠≠ ForecastingForecasting
3
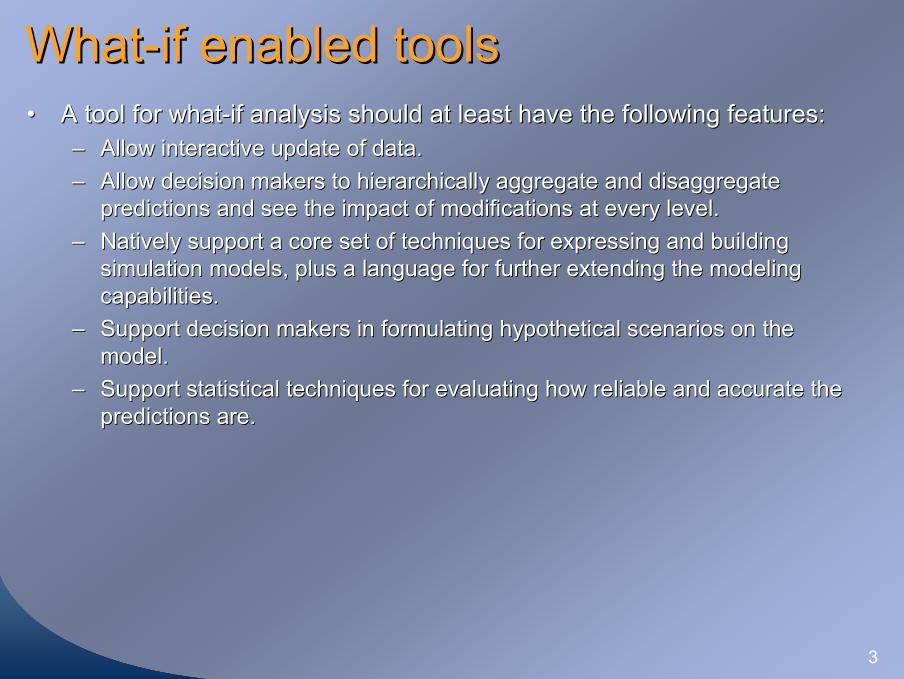
WhatWhat--if enabled toolsif enabled tools•• A tool for whatA tool for what--if analysis should at least have the following features:if analysis should at least have the following features:
–– Allow interactive update of data.Allow interactive update of data.–– Allow decision makers to hierarchically aggregate and disaggregaAllow decision makers to hierarchically aggregate and disaggregate te
predictions and see the impact of modifications at every level.predictions and see the impact of modifications at every level.–– Natively support a core set of techniques for expressing and buiNatively support a core set of techniques for expressing and building lding
simulation models, plus a language for further extending the modsimulation models, plus a language for further extending the modeling eling capabilities.capabilities.
–– Support decision makers in formulating hypothetical scenarios onSupport decision makers in formulating hypothetical scenarios on the the model.model.
–– Support statistical techniques for evaluating how reliable and aSupport statistical techniques for evaluating how reliable and accurate the ccurate the predictions are.predictions are.
4
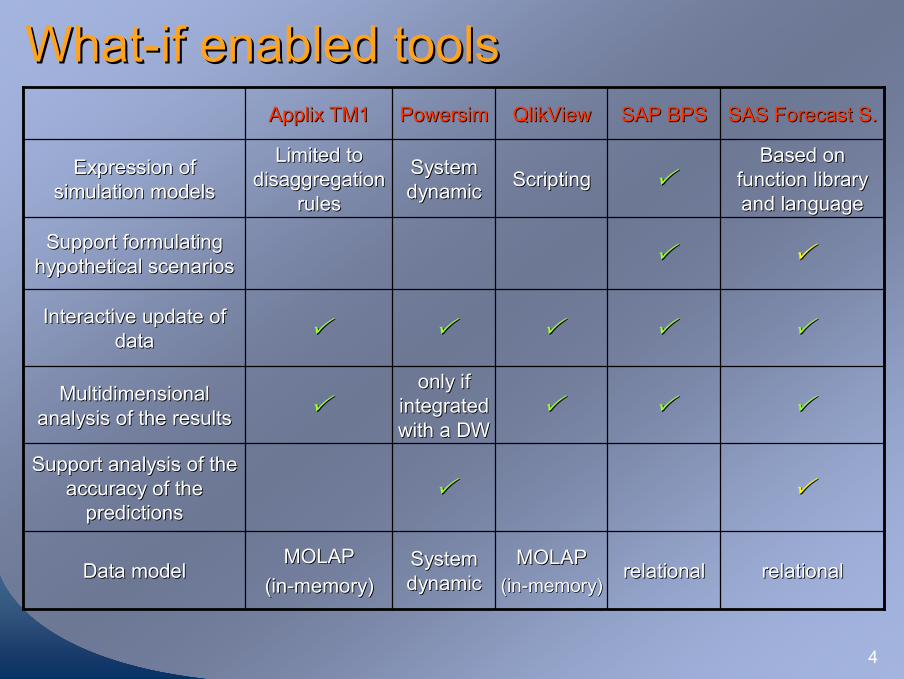
WhatWhat--if enabled toolsif enabled tools
relationalrelationalrelationalrelationalMOLAPMOLAP((inin--memorymemory))
System System dynamicdynamic
MOLAPMOLAP((inin--memorymemory))
Data modelData model
Support analysis of the Support analysis of the accuracy of the accuracy of the
predictionspredictions
onlyonly ififintegratedintegratedwithwith a DWa DW
MultidimensionalMultidimensionalanalysisanalysis of the of the resultsresults
Interactive update of Interactive update of datadata
Support formulating Support formulating hypothetical scenarioshypothetical scenarios
BasedBased on on functionfunction librarylibraryand and languagelanguage
ScriptingScriptingSystem System dynamicdynamic
LimitedLimited totodisaggregationdisaggregation
rulesrules
Expression of Expression of simulation modelssimulation models
SAS SAS ForecastForecast S. S. SAP BPSSAP BPSQlikViewQlikViewPowersimPowersimApplixApplix TM1TM1
5
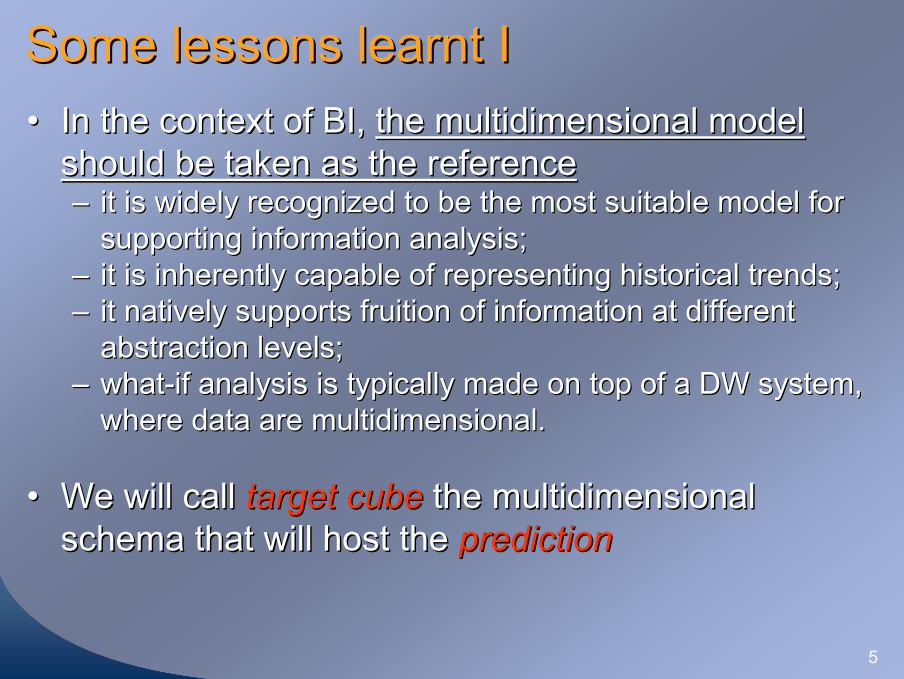
Some lessons learnt ISome lessons learnt I•• In the context of BI, In the context of BI, the multidimensional model the multidimensional model
should be taken as the referenceshould be taken as the reference–– it is widely recognized to be the most suitable model for it is widely recognized to be the most suitable model for
supporting information analysis; supporting information analysis; –– it is inherently capable of representing historical trends; it is inherently capable of representing historical trends; –– it natively supports fruition of information at different it natively supports fruition of information at different
abstraction levels; abstraction levels; –– whatwhat--if analysis is typically made on top of a DW system, if analysis is typically made on top of a DW system,
where data are multidimensional.where data are multidimensional.
•• We will call We will call target cubetarget cube the multidimensional the multidimensional schema that will host the schema that will host the predictionprediction
6
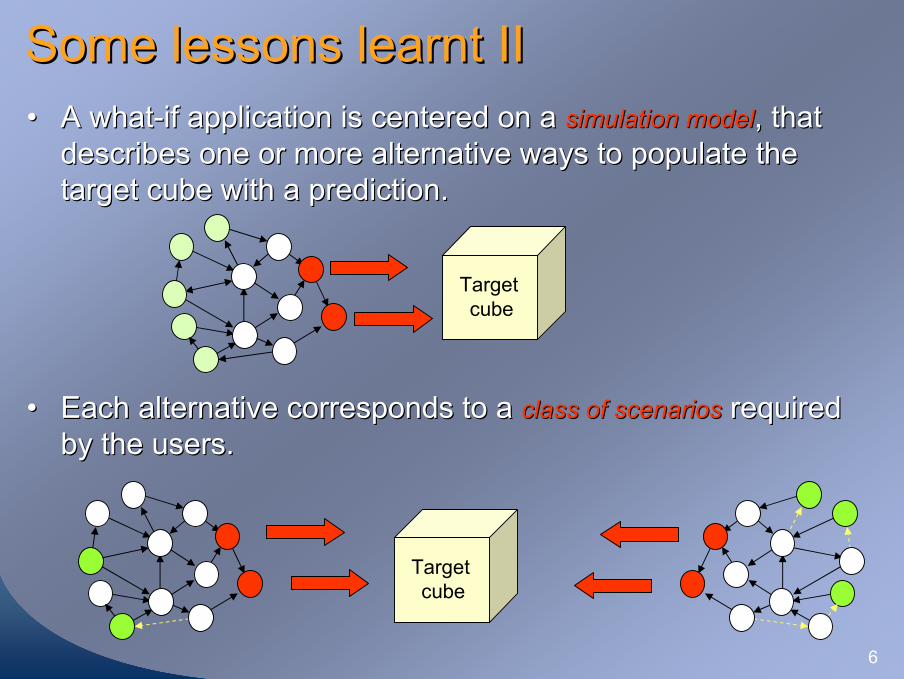
Some lessons learnt IISome lessons learnt II•• A whatA what--if application is centered on a if application is centered on a simulation modelsimulation model, that , that
describes one or more alternative ways to populate the describes one or more alternative ways to populate the target cube with a prediction. target cube with a prediction.
•• Each alternative corresponds to a Each alternative corresponds to a class of scenariosclass of scenarios required required by the users. by the users.
Target cube
Target cube
7
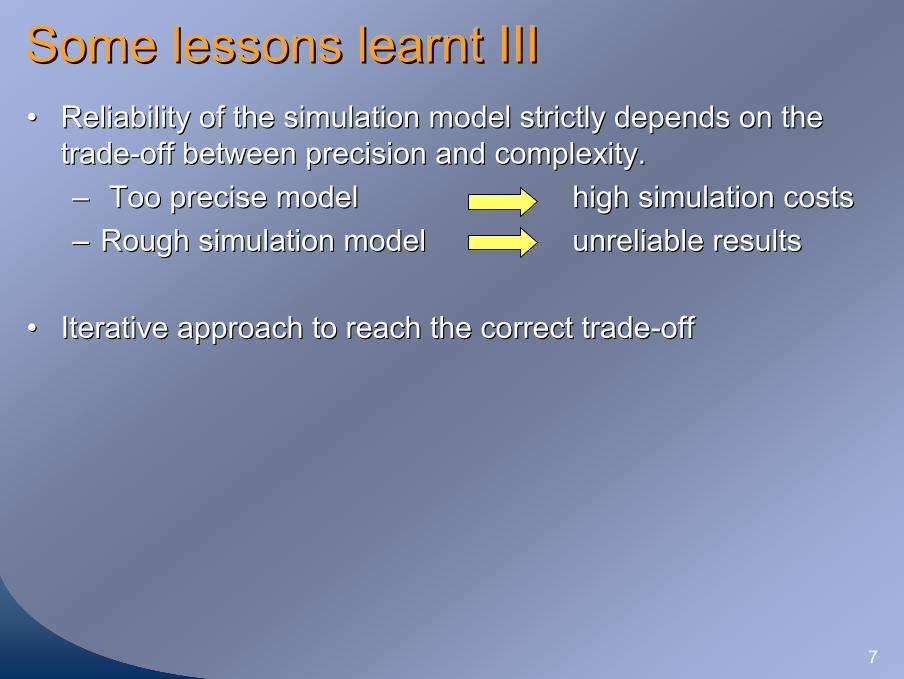
Some lessons learnt IIISome lessons learnt III•• Reliability of the simulation model strictly depends on the Reliability of the simulation model strictly depends on the
tradetrade--off between precision and complexity.off between precision and complexity.–– Too precise model Too precise model high simulation costshigh simulation costs–– Rough simulation model Rough simulation model unreliable resultsunreliable results
•• Iterative approach to reach the correct tradeIterative approach to reach the correct trade--offoff
8
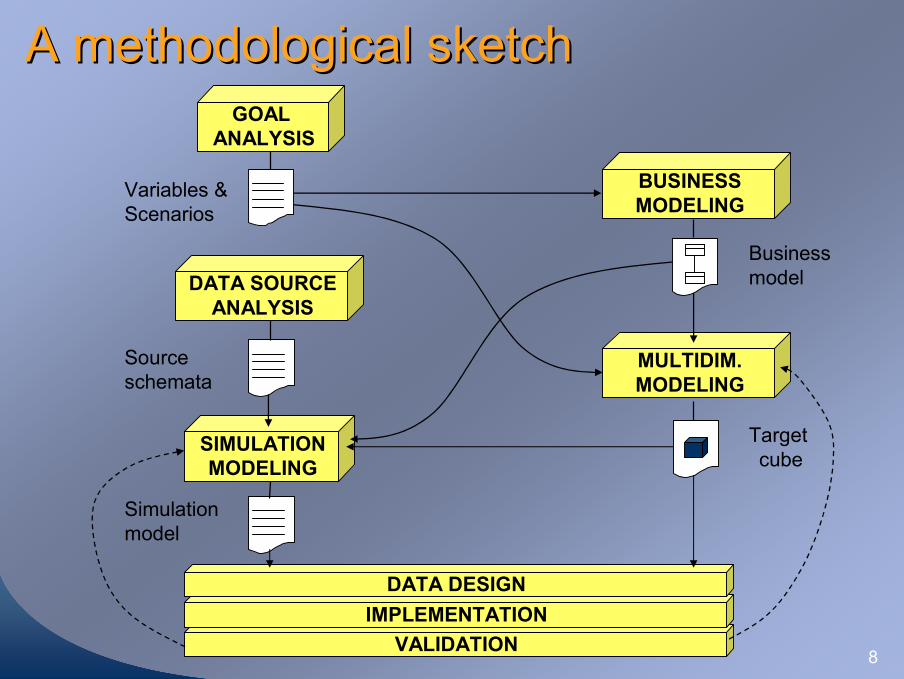
A methodological sketchA methodological sketch
DATA SOURCEANALYSIS
SIMULATIONMODELING
VALIDATIONIMPLEMENTATION
DATA DESIGN
MULTIDIM.MODELING
BUSINESSMODELING
GOAL ANALYSIS
Variables &Scenarios
Sourceschemata
Businessmodel
Target cube
Simulationmodel
9
A methodological sketchA methodological sketch
DATA SOURCEANALYSIS
SIMULATIONMODELING
VALIDATIONIMPLEMENTATION
DATA DESIGN
MULTIDIM.MODELING
BUSINESSMODELING
GOAL ANALYSIS
Variables &Scenarios
Sourceschemata
Businessmodel
Target cube
Simulationmodel
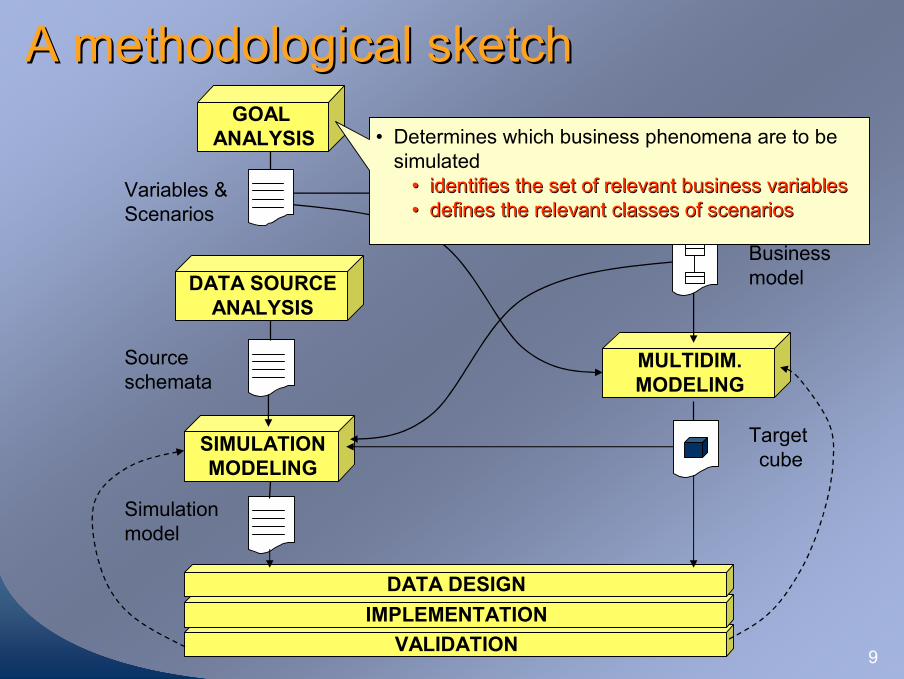
• Determines which business phenomena are to be simulated
•• identifies the set of relevant business variablesidentifies the set of relevant business variables•• defines the relevant classes of scenariosdefines the relevant classes of scenarios
10
A methodological sketchA methodological sketch
DATA SOURCEANALYSIS
SIMULATIONMODELING
VALIDATIONIMPLEMENTATION
DATA DESIGN
MULTIDIM.MODELING
BUSINESSMODELING
GOAL ANALYSIS
Variables &Scenarios
Sourceschemata
Businessmodel
Target cube
Simulationmodel
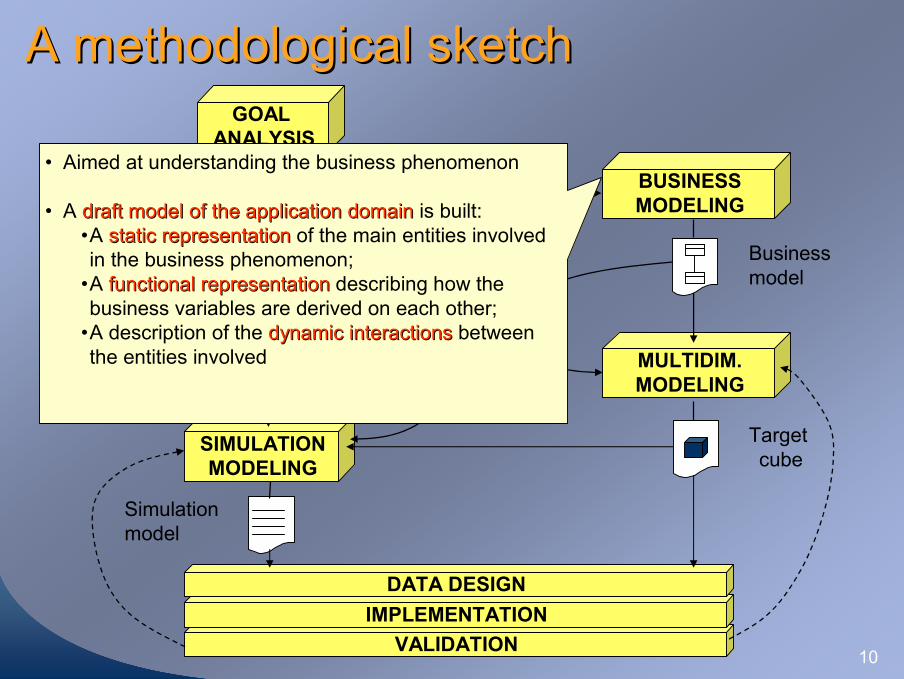
• Aimed at understanding the business phenomenon
• A draft model of the application domaindraft model of the application domain is built: •A static representationstatic representation of the main entities involved in the business phenomenon;
•A functional representationfunctional representation describing how the business variables are derived on each other;
•A description of the dynamic interactionsdynamic interactions between the entities involved
11
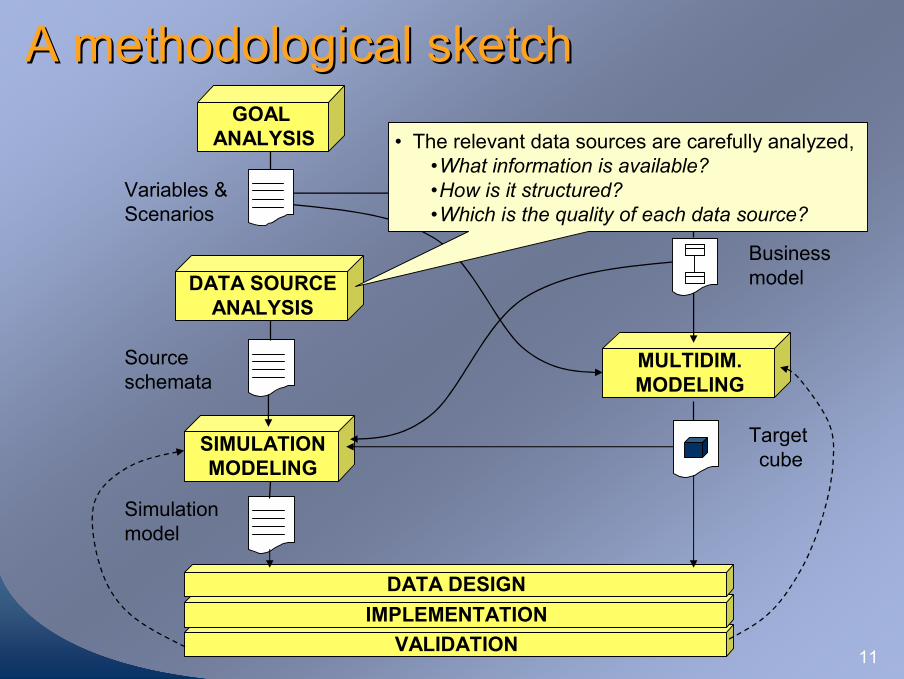
A methodological sketchA methodological sketch
DATA SOURCEANALYSIS
SIMULATIONMODELING
VALIDATIONIMPLEMENTATION
DATA DESIGN
MULTIDIM.MODELING
BUSINESSMODELING
GOAL ANALYSIS
Variables &Scenarios
Sourceschemata
Businessmodel
Target cube
Simulationmodel
• The relevant data sources are carefully analyzed,•What information is available?•How is it structured?•Which is the quality of each data source?
12
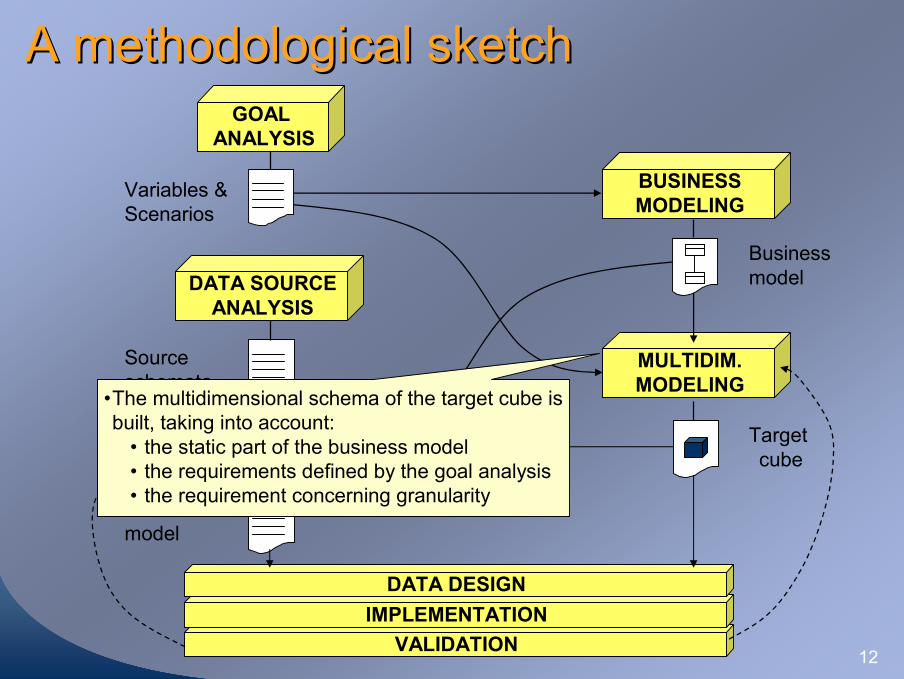
A methodological sketchA methodological sketch
DATA SOURCEANALYSIS
SIMULATIONMODELING
VALIDATIONIMPLEMENTATION
DATA DESIGN
MULTIDIM.MODELING
BUSINESSMODELING
GOAL ANALYSIS
Variables &Scenarios
Sourceschemata
Businessmodel
Target cube
Simulationmodel
•The multidimensional schema of the target cube is built, taking into account:
• the static part of the business model • the requirements defined by the goal analysis• the requirement concerning granularity
13
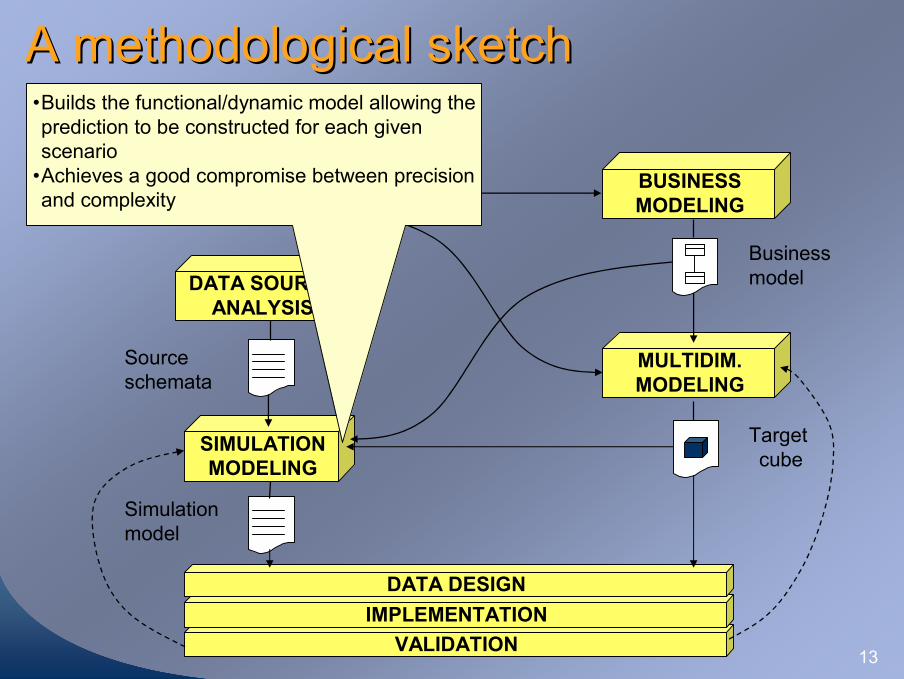
A methodological sketchA methodological sketch
DATA SOURCEANALYSIS
SIMULATIONMODELING
VALIDATIONIMPLEMENTATION
DATA DESIGN
MULTIDIM.MODELING
BUSINESSMODELING
GOAL ANALYSIS
Variables &Scenarios
Sourceschemata
Businessmodel
Target cube
Simulationmodel
•Builds the functional/dynamic model allowing the prediction to be constructed for each given scenario
•Achieves a good compromise between precision and complexity
14
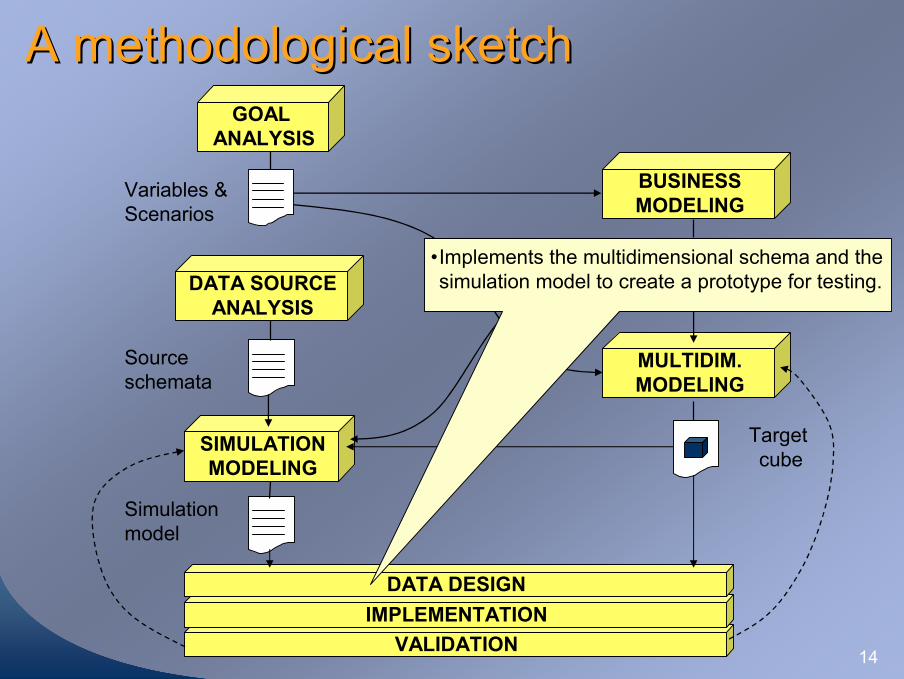
A methodological sketchA methodological sketch
DATA SOURCEANALYSIS
SIMULATIONMODELING
VALIDATIONIMPLEMENTATION
DATA DESIGN
MULTIDIM.MODELING
BUSINESSMODELING
GOAL ANALYSIS
Variables &Scenarios
Sourceschemata
Businessmodel
Target cube
Simulationmodel
•Implements the multidimensional schema and the simulation model to create a prototype for testing.
15
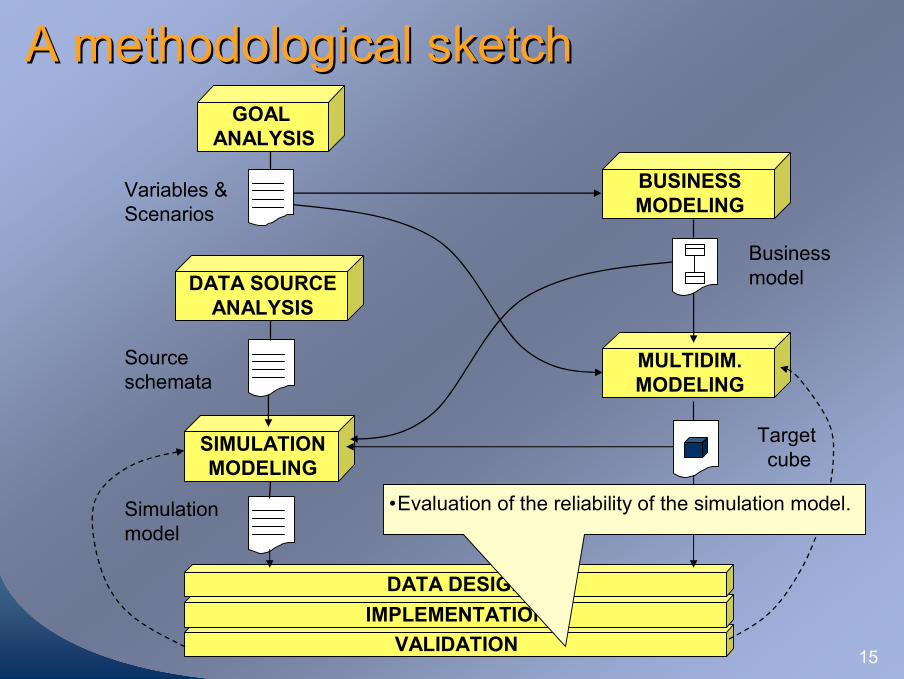
A methodological sketchA methodological sketch
DATA SOURCEANALYSIS
SIMULATIONMODELING
VALIDATIONIMPLEMENTATION
DATA DESIGN
MULTIDIM.MODELING
BUSINESSMODELING
GOAL ANALYSIS
Variables &Scenarios
Sourceschemata
Businessmodel
Target cube
Simulationmodel
•Evaluation of the reliability of the simulation model.
16
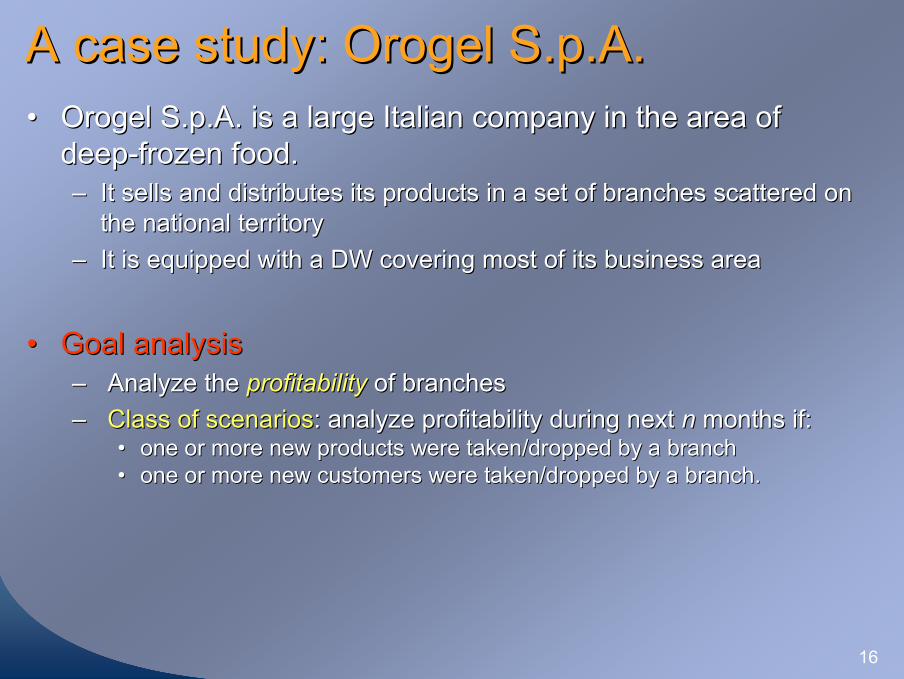
A case study: A case study: OrogelOrogel S.p.AS.p.A..•• OrogelOrogel S.p.AS.p.A. is a large Italian company in the area of . is a large Italian company in the area of
deepdeep--frozen food. frozen food. –– It sells and distributes its products in a set of branches scattIt sells and distributes its products in a set of branches scattered on ered on
the national territorythe national territory–– It is equipped with a DW covering most of its business areaIt is equipped with a DW covering most of its business area
•• Goal analysisGoal analysis–– Analyze the Analyze the profitabilityprofitability of branchesof branches–– Class of scenariosClass of scenarios: analyze profitability during next : analyze profitability during next nn months if:months if:
•• one or more new products were taken/dropped by a branchone or more new products were taken/dropped by a branch•• one or more new customers were taken/dropped by a branch.one or more new customers were taken/dropped by a branch.
17
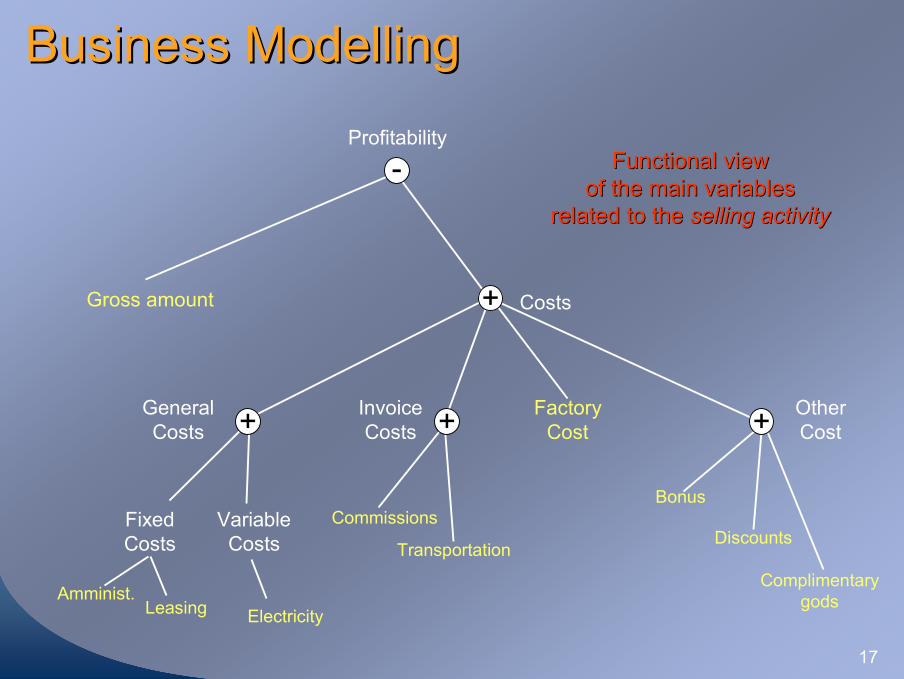
Business Business ModellingModelling
Functional view Functional view of the main variables of the main variables
related to the related to the selling activityselling activity
Gross amount Costs
GeneralCosts
InvoiceCosts
FactoryCost
OtherCost
FixedCosts
VariableCosts
Commissions
Transportation
Bonus
Discounts
ComplimentarygodsAmminist.
Leasing Electricity
-
+
+
+ +
Profitability
18
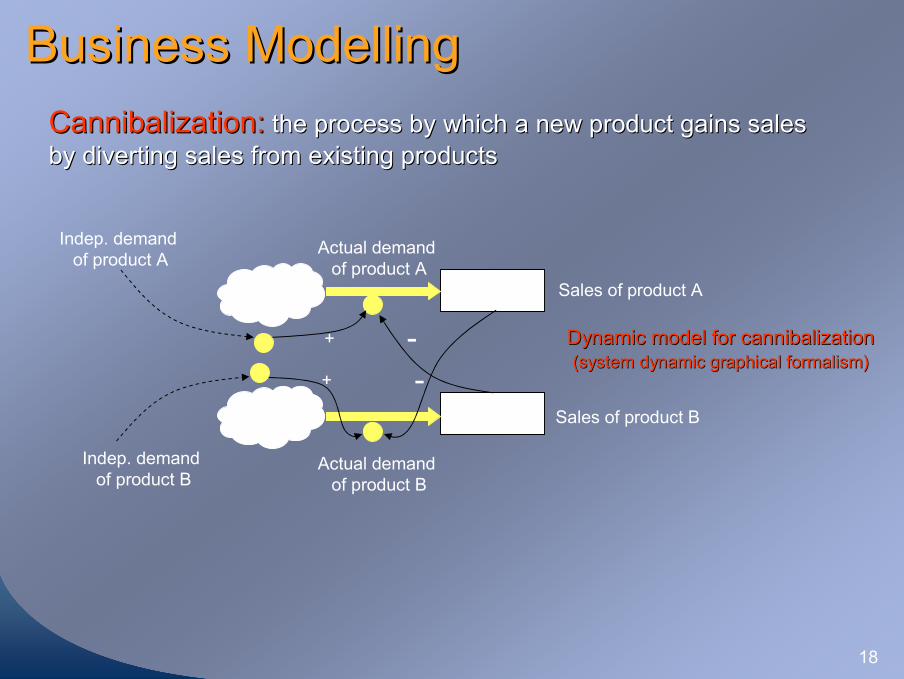
Business Business ModellingModelling
Dynamic model for cannibalizationDynamic model for cannibalization(system dynamic graphical formalism)(system dynamic graphical formalism)
Cannibalization:Cannibalization: the process by which a new product gains sales the process by which a new product gains sales by diverting sales from existing productsby diverting sales from existing products
Sales of product B
Sales of product A
+
+ --
Indep. demandof product A
Indep. demandof product B
Actual demandof product B
Actual demandof product A
19
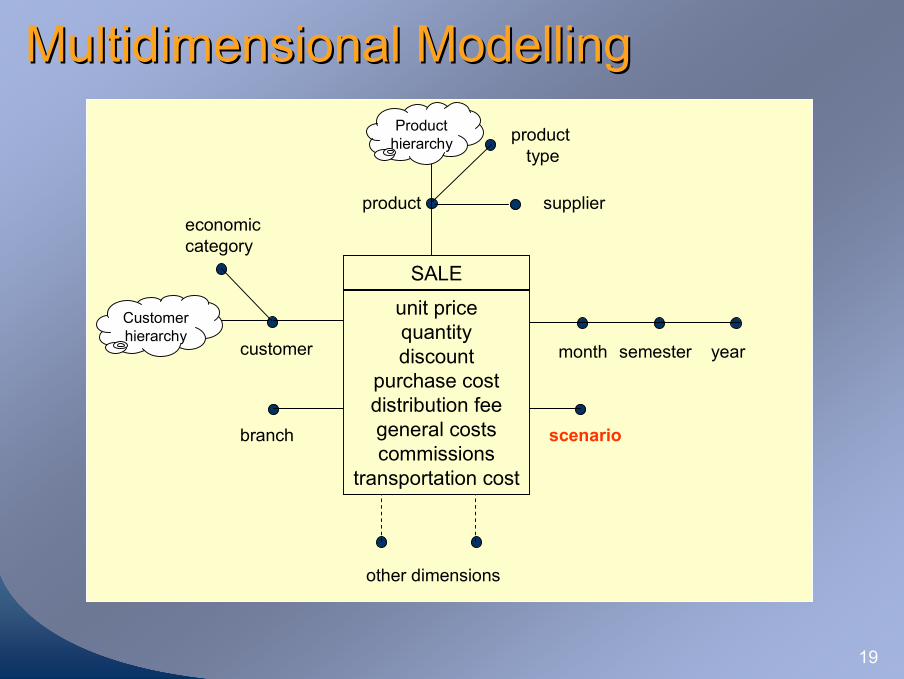
Multidimensional Multidimensional ModellingModelling
SALE
unit pricequantitydiscount
purchase costdistribution feegeneral costscommissions
transportation cost
semester yearmonth
scenariobranch
customer
economic category
product supplier
product type
other dimensions
Customerhierarchy
Producthierarchy
20
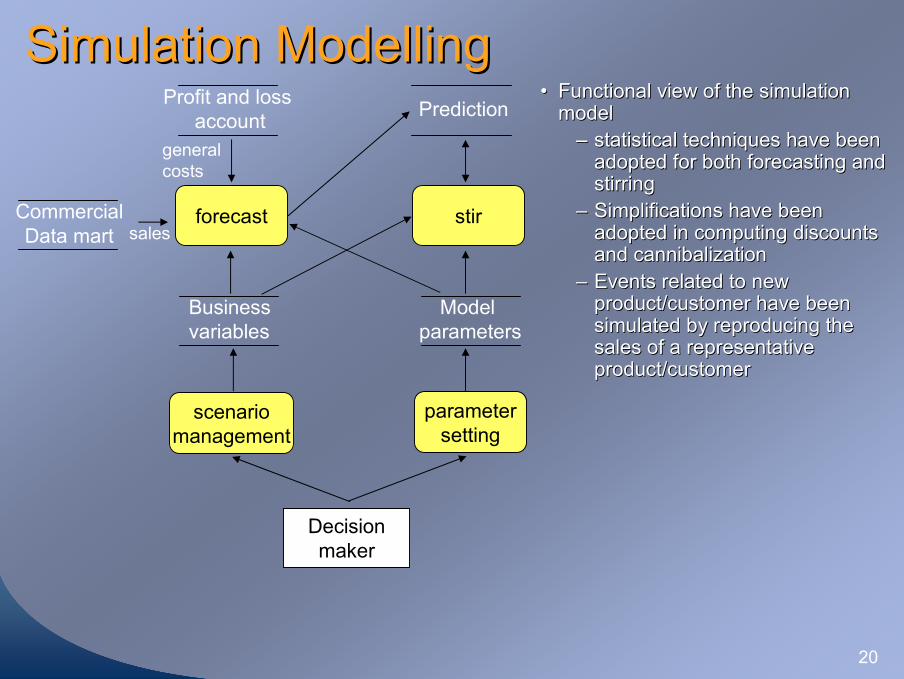
Simulation Simulation ModellingModelling•• Functional view of the simulation Functional view of the simulation
modelmodel–– statistical techniques have been statistical techniques have been
adopted for both forecasting and adopted for both forecasting and stirring stirring
–– Simplifications have been Simplifications have been adopted in computing discounts adopted in computing discounts and cannibalizationand cannibalization
–– Events related to new Events related to new product/customer have been product/customer have been simulated by reproducing the simulated by reproducing the sales of a representative sales of a representative product/customerproduct/customer
forecast
parametersetting
stir
scenariomanagement
Businessvariables
Model parameters
CommercialData mart
Profit and lossaccount Prediction
Decisionmaker
sales
generalcosts
21
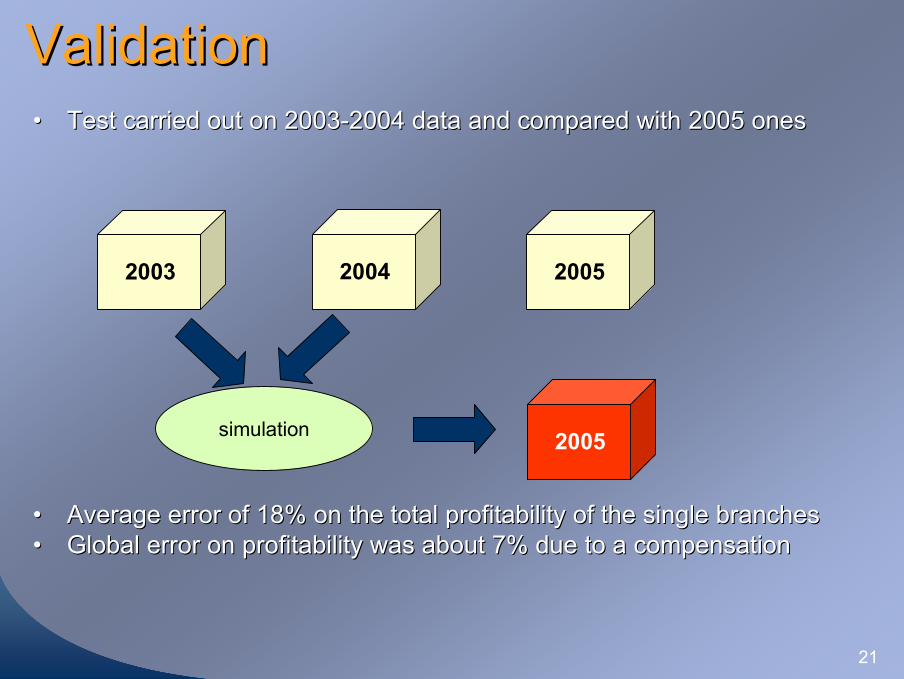
•• Test carried out on 2003Test carried out on 2003--2004 data and compared with 2005 ones2004 data and compared with 2005 ones
•• Average error of 18% on the total profitability of the single brAverage error of 18% on the total profitability of the single branchesanches•• Global error on profitability was about 7% due to a compensationGlobal error on profitability was about 7% due to a compensation
ValidationValidation
2003 2004 2005
2005simulation
22
•• The spread of whatThe spread of what--if analysis projects is surprisingly lowif analysis projects is surprisingly low•• Several factors contribute to this situation:Several factors contribute to this situation:
–– Immature technology:Immature technology:•• The new generation of analytic tools are now compensating the The new generation of analytic tools are now compensating the
technological gaptechnological gap
–– Complexity of designComplexity of design•• Complexity can be overcome by relying on preComplexity can be overcome by relying on pre--configured models (e.g., configured models (e.g.,
SAPSAP--BPS is based on the business models captured by its ERP)BPS is based on the business models captured by its ERP)
–– Lack of a design methodology: Lack of a design methodology: •• Development of a wellDevelopment of a well--structured design methodologystructured design methodology
Conclusions and Conclusions and ……
23
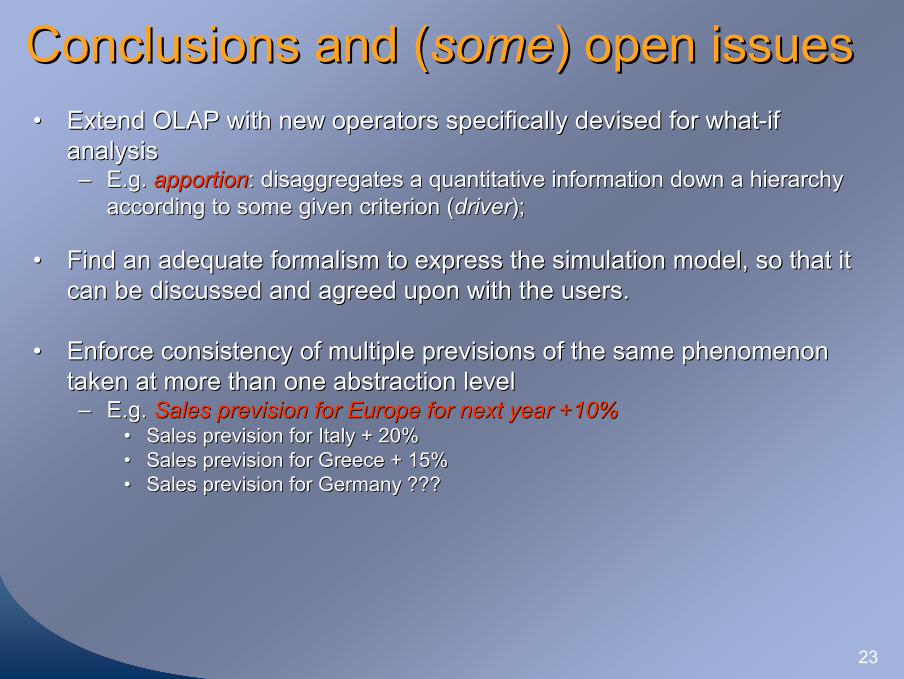
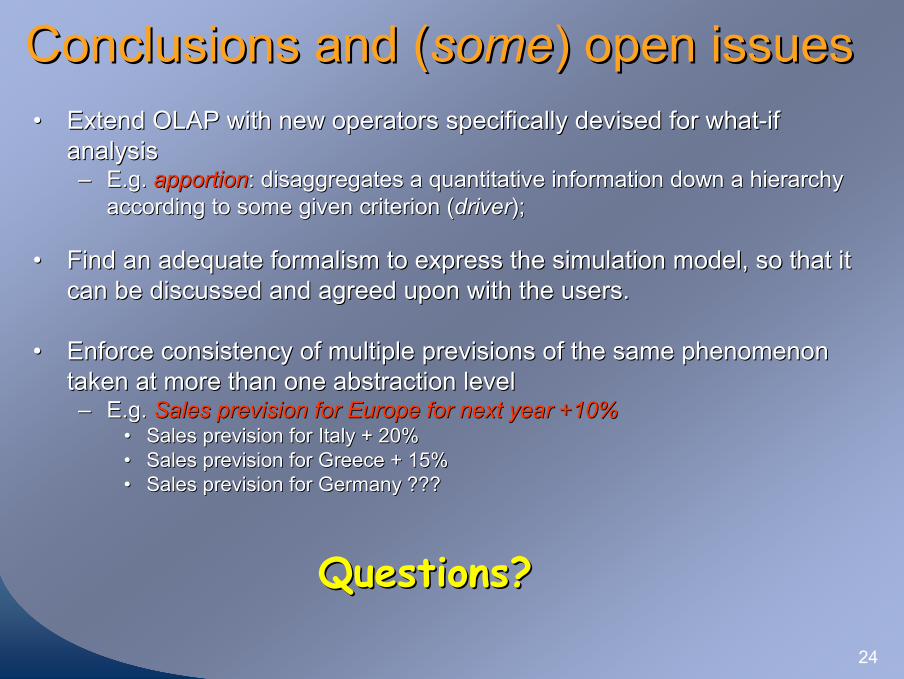
Conclusions and (Conclusions and (somesome) open issues) open issues•• Extend OLAP with new operators specifically devised for whatExtend OLAP with new operators specifically devised for what--if if
analysis analysis –– E.g. E.g. apportionapportion: disaggregates a quantitative information down a hierarchy : disaggregates a quantitative information down a hierarchy
according to some given criterion (according to some given criterion (driverdriver); );
•• Find an adequate formalism to express the simulation model, so tFind an adequate formalism to express the simulation model, so that it hat it can be discussed and agreed upon with the users. can be discussed and agreed upon with the users.
•• Enforce consistency of multiple previsions of the same phenomenoEnforce consistency of multiple previsions of the same phenomenon n taken at more than one abstraction leveltaken at more than one abstraction level–– E.g. E.g. Sales prevision for Europe for next year +10%Sales prevision for Europe for next year +10%
•• Sales prevision for Italy + 20%Sales prevision for Italy + 20%•• Sales prevision for Greece + 15%Sales prevision for Greece + 15%•• Sales prevision for Germany ???Sales prevision for Germany ???
24
Conclusions and (Conclusions and (somesome) open issues) open issues•• Extend OLAP with new operators specifically devised for whatExtend OLAP with new operators specifically devised for what--if if
analysis analysis –– E.g. E.g. apportionapportion: disaggregates a quantitative information down a hierarchy : disaggregates a quantitative information down a hierarchy
according to some given criterion (according to some given criterion (driverdriver); );
•• Find an adequate formalism to express the simulation model, so tFind an adequate formalism to express the simulation model, so that it hat it can be discussed and agreed upon with the users. can be discussed and agreed upon with the users.
•• Enforce consistency of multiple previsions of the same phenomenoEnforce consistency of multiple previsions of the same phenomenon n taken at more than one abstraction leveltaken at more than one abstraction level–– E.g. E.g. Sales prevision for Europe for next year +10%Sales prevision for Europe for next year +10%
•• Sales prevision for Italy + 20%Sales prevision for Italy + 20%•• Sales prevision for Greece + 15%Sales prevision for Greece + 15%•• Sales prevision for Germany ???Sales prevision for Germany ???
QuestionsQuestions??