Embed Size (px)
Citation preview

Research Department + 7 (495) 785‐53‐36 www.bcs.ru
Timur Salikhov, CFA+7 (495) 785 5336 (4631)
Desk Note
Wednesday, October 9, 2013
Russian Oil & Gas
Trade ideas for all types of investors
Share price upside summary
* Since the trough in June Source: FactSet, BCS
The discount reflects sliding returns and high regulatory risks
Source: FactSet, BCS
Returns are sliding and regulatory risks remain high, but trade ideas still exist. In this report, we highlight our preferred dividend and positive catalyst plays, warn of the riskiest and misperceived stocks and offer short‐ and long‐term pair trade advice.
Long‐term (upstream with greenfields) – Gazprom Neft, Lukoil and Rosneft
Catalysts – Novatek (Yamal LNG), Lukoil (W. Qurna‐2) and Gazprom (dividends)
Dividends – Bashneft (8‐12%), Gazprom (rising to 9%) and Lukoil (>15% pa growth)
Stocks to avoid – Transneft (pref), Alliance Oil and Tatneft
Gazprom Neft, Lukoil and Rosneft – safest LT exposure. Industry regulatory risks remain high as the government seeks additional sources of tax revenues to prevent budget deficit growth. The recent oil tax reshuffle alone will result in over $2.5bn pa of additional payments. Tax hikes in the future are highly likely, especially in the profitable refining and gas sectors. Upstream companies with significant greenfield exposure are the safest play on the sector: Gazprom Neft, Lukoil and Rosneft.
Novatek, Lukoil and Gazprom – momentum plays. Global energy investors have kept Novatek on their radar, anticipating it to de‐risk on the back of liberalization of LNG exports, new partners for Yamal and FID. Lukoil offers the best exposure to oil price stabilization, while the launch of West Qurna‐2 in November should crystalize over 10% of the company’s value. Gazprom is yet to price in the 35% dividend payout requirement, most of the bad news is behind it, and a continued rise in gas sales to Europe and a gas pricing agreement with China could further improve sentiment towards the stock.
Bashneft, Gazprom and Lukoil – dividend yielders. Russian O&G companies have nearly trebled dividend payments since 2008. Bashneft’s and SurgutNG pref’s double‐digit dividend yields are among the highest globally. Lukoil’s past and future dividend growth (20% pa) is far ahead of its peers. Gazprom minorities are the primary beneficiaries of the dividend payout increase, unlike holders of Transneft prefs, who have no guarantee that the benefits of a larger dividend pool will all go to common shareholders.
Bashneft upgraded to Buy. Due to underperformance following the recent rally (3% vs sector’s 29%) and a generous year‐end dividend (8% common, 12% preferred) we have upgraded Bashneft to Buy. The investment story is clean – Bashneft is growing production (4% CAGR 2013‐16e) unlike most of its peers, its CapEx cycle is fairly light,and therefore the 10% FCF yield is above the sector average of 6%. A potential London IPO next year would improve liquidity, attract new investors and finance resource base growth and asset acquisitions.
Lukoil, Gazprom Neft and Novatek – still top picks; Bashneft – upgraded to Buy Company Rating Current Target price Upside Dividend P/E EV/EBITDA price New Old yield ‘13 ‘14e ‘15e ‘14e ‘15e
Lukoil BUY $64.00 $75.00 $75.00 17% 5.1% 4.5x 4.9x 2.5x 2.6x
Gazprom Neft BUY $22.32 $25.00 $25.00 12% 5.7% 4.3x 5.0x 3.0x 3.3x
Bashneft BUY Rb1,887.60 Rb2,100.00 Rb2,100.00 11% 8.0% 6.5x 6.8x 4.9x 5.1x
Novatek BUY $135.00 $145.00 $145.00 7% 2.1% 13.8x 12.5x 10.5x 9.3x
Rosneft HOLD $8.08 $8.30 $8.30 3% 3.2% 6.6x 7.2x 4.9x 4.8x
Surgutneftegas (pref) HOLD Rb23.50 Rb24.00 Rb23.50 2% 9.2% 5.7x 6.0x 0.7x 0.7x
Gazprom HOLD $9.08 $9.00 $8.50 ‐1% 4.7% 3.4x 3.7x 3.0x 3.0x
Surgutneftegas SELL $8.61 $8.50 $8.30 ‐1% 2.1% 5.7x 6.0x 0.7x 0.7x
Tatneft SELL $38.99 $40.00 $39.00 3% 4.0% 6.4x 6.6x 4.6x 4.7x
Transneft (pref) SELL Rb83,786.00 Rb75,000.00 Rb75,000.00 ‐10% 0.8% 3.0x 2.8x 3.0x 2.9x
Alliance Oil SELL SEK 52.95 SEK 41.00 SEK 41.00 ‐23% ‐ 4.0x 3.1x 4.4x 3.9x
As of 7 October 2013 Source: FactSet, BCS
‐23%
‐10%
‐1%
‐1%
2%
3%
3%
7%
11%
12%
17%
‐30% ‐10% 10% 30% 50%
‐30% ‐10% 10% 30% 50%
AOIL
TRNFP
SGGD
OGZD
SNGSP
ATAD
ROSN
NVTK
BANE
GAZ
LKOD
Past performance* Upside
0
2
4
6
8
10
12
Oct‐08 Jan‐10 Apr‐11 Jul‐12 Oct‐13
P/E
Russian oils Global majors
40% discount

Russian Oil & Gas
2
Investment case
Looking for trade ideas after the strong rally: We remain cautious on the sector’s returns, highlight strong regulatory risks and therefore see limited upside in share prices (4%, on average) despite attractive valuations on a global scale (40% discount). For this reason, we focus on trade ideas for different investor types with different investment horizons. We highlight our preferred dividend and catalyst plays, warn of the riskiest and misperceived stocks and offer short‐ and long‐term pair trade advice.
Top ‘3s’ Dividend plays
Stock Yield ‘13 Reason Comments Bashneft 8‐12% Robust yield just days away Sustainably high dividend yield backed by FCF, despite heavy CapEx
cycle (10%, on average, during 2013‐16)
Gazprom 5% Switch to 35% IFRS payout The stock is primarily driven by consensus dividend expectations, which are currently reflecting a 25% IFRS payout
Lukoil 5% Beating consensus expectations Management beat its 15% pa dividend growth guidance in 2010‐12, but the Street remains conservative with respect to future growth
Catalyst plays
Stock Catalyst Comments Novatek Liberalization of LNG exports Allows export of LNG directly to customers
New partner(s) for Yamal LNG Partners’ commitment will further de‐risk the project
FID on Yamal LNG Adds credibility to the project in the eyes of investors
Domestic gas sales increase High chance to beat FY13 target as Gazprom is directing more volumes toEurope
Lukoil Test launch of West Qurna‐2 De‐risking consensus 2014 FCF forecasts
Oil price stabilization Least sensitive to the oil price decline
3Q13 US GAAP results Upside risk to consensus 2013 FCF forecasts
Gazprom Strong momentum in Europe Rising volumes and spot prices are driving earnings
Deal with China Guaranteed profitable gas supplies (save for a costly pipeline)
Dividend talks Consensus’ DPS expectations are major share price drivers
Long‐term trades1
Trade Reason Risks Long Lukoil / Short Rosneft
Shareholder returns mismatch and commitment to shareholder value
‐ Lukoil abandons the 15% pa dividend growth target ‐ Rosneft: value‐accretive resource base growth and asset acquisition
Long Novatek / Short Gazprom
Novatek management’s track‐record vs Gazprom’s lack of CapEx discipline
‐ Novatek: execution issues with Yamal LNG and decelerating growth
‐ Gazprom fights to preserve its domestic market share, optimizes costs and executes strict control over CapEx
Long Gazprom / Short Transneft (pref)
Playing the state companies’ dividend policy change (switch to 35% IFRS)
‐ Gazprom pushes back the dividend policy change and hikes CapEx
‐ Transneft guides for similar dividends for both classes of shares
Short‐term trades2
Trade Reason Risks Long Lukoil / Short Rosneft
A play on oil price stabilization and Lukoil’s West Qurna‐2 launch
‐ Lukoil: West Qurna‐2 launch delay, issues with cost recovery
‐ Rosneft: value‐accretive asset acquisition / resource base expansion
Long Gazprom Neft / Short SurgutNG
Valuation mismatch (4.3x P/E vs 5.7x) and a play on changes in greenfield regulation
‐ Gazprom Neft delays the development of greenfields, receives oil assets from Gazprom and reimburses the latter for historical costs
‐ SurgutNG: focus switch towards growth and resource base expansion
Long Alliance Oil (pref) / Short Alliance Oil
Guaranteed income vs execution risk and elevated valuation
‐ Uplift in refining margins sooner than expected; output growth above expectations at a reasonable cost
Stocks to avoid
Stock Reason Comments Transneft (pref) No guarantee to benefit from the switch to
a 35% dividend payout Increase in total dividend pool could all go to common shares, as charter does not stipulate that the dividend paid on preferred shares (10% RAS net income) must equal that paid on commons
Alliance Oil Expensive valuation does not justify fundamentals
Refinery upgrade delay, risk of consensus forecast downgrade, high M&A and execution risk
Tatneft Falling EPS; low shareholder returns; expensive
The second stage of Taneco will prevent value‐accretive use of FCF and will cap shareholder returns and growth
1. 1‐2 years, 2. 3‐6monthsSource: BCS
Russian Oil & Gas
3
Valuation
Trading at a discount, for good cause: Russian Oil & Gas stocks lagged their global peers as the latter re‐rated in the past year. As a result, the discount has widened to 40% from the five‐year average of 32%. Despite relatively attractive valuation, Russian stocks are unlikely to catch up with their global peers any time soon, given rapidly rising CapEx, sliding returns and – most critically – high regulatory risks, which are global energy investors’ major concern about investing in Russia, as we found out during our recent two‐week marketing trip in Europe.
Discount reflects high regulatory risks, sliding investment returns Most stocks trade close to 52W highs post recent oil price rally
Source: FactSet
Russian oil & gas companies are trading at a substantial discount to global peers
Company name Trading Share MCap, EV, P/E EV/EBITDA currency price $mn $mn ‘13e ‘14e ‘15e ‘13e ‘14e ‘15e
Russian Oil & Gas Gazprom USD 9.08 104,182 149,278 3.1 3.4 3.7 2.8 3.0 3.0Rosneft USD 8.08 85,632 145,890 6.6 6.6 7.2 5.2 4.9 4.8Lukoil USD 64.00 48,311 55,077 4.6 4.5 4.9 3.0 2.5 2.6Novatek USD 135.00 40,948 44,500 15.5 13.8 12.5 11.5 10.5 9.3Surgutneftegas USD 8.61 30,760 5,622 4.6 5.7 6.0 0.7 0.7 0.7Gazprom Neft USD 22.32 21,061 27,129 4.3 4.3 5.0 3.1 3.0 3.3Tatneft USD 38.99 13,775 16,128 6.5 6.4 6.6 4.6 4.6 4.7Bashneft RUB 1,887.60 11,045 14,839 6.4 6.5 6.8 4.9 4.9 5.1Alliance Oil SEK 52.95 1,414 3,804 6.7 4.0 3.1 5.5 4.4 3.9Russian Oil & Gas weighted average 6.0 6.0 6.2 4.6 4.4 4.3Russian Oil weighted average 5.6 5.7 6.2 4.5 4.2 4.2
Super Majors ExxonMobil USD 85.90 378,100 398,386 11.3 11.0 11.0 5.0 4.8 4.7Chevron USD 117.87 227,728 226,719 9.8 9.8 9.7 4.2 4.0 3.9Royal Dutch Shell GBp 21.09 215,867 237,652 9.2 8.5 8.4 4.0 3.9 3.8BP GBp 4.39 133,543 149,902 9.2 8.1 7.7 3.8 3.7 3.6Total EUR 42.99 132,344 161,276 8.6 8.1 7.7 3.7 3.4 3.3Super Majors weighted average 10.0 9.5 9.4 4.3 4.1 4.0
Integrateds Eni EUR 17.14 84,272 108,437 12.3 9.9 9.0 3.3 2.9 2.7ConocoPhillips USD 70.88 86,687 104,848 11.5 11.3 11.1 4.6 4.4 4.3Statoil NOK 134.50 71,652 84,540 10.1 8.4 8.4 2.2 2.1 2.0BG Group GBp 11.69 63,986 75,534 15.5 13.7 10.9 7.2 6.3 5.1Repsol EUR 18.23 32,215 58,723 11.0 10.5 10.2 6.0 6.0 5.7Marathon Oil USD 34.72 24,640 30,890 12.2 11.2 12.0 3.1 3.0 3.2Galp EUR 12.40 13,955 20,396 N/M N/M N/M 12.8 10.7 8.8Murphy Oil USD 61.84 11,557 13,517 9.9 9.6 11.0 3.6 3.2 3.4Integrateds weighted average 12.1 11.3 10.8 4.8 4.4 4.1
EM Oils PetroChina HKD 8.55 201,798 287,568 9.6 9.0 8.3 4.7 4.4 4.1CNOOC HKD 15.84 91,201 95,905 8.8 8.5 8.2 4.3 4.0 3.7Petrobras USD 15.67 58,312 137,648 4.8 4.4 3.6 4.4 4.0 3.5ONGC INR 265.95 36,791 37,340 8.6 7.0 6.9 3.9 3.3 3.3Reliance Industries INR 843.85 44,064 49,195 12.0 10.6 9.3 8.7 7.5 6.3Sasol ZAc 485.99 32,574 33,268 11.3 10.5 11.0 6.1 5.7 5.8Sinopec USD 79.97 20,403 76,536 1.8 1.6 1.6 2.6 2.3 2.1Indian Oil Corp INR 212.05 8,325 22,304 9.3 7.3 6.4 8.4 7.3 6.6EM Oils weighted average 8.8 8.1 7.6 4.8 4.3 4.0
As of 7 October 2013 Source: FactSet, BCS
0
2
4
6
8
10
12
Oct‐08 Oct‐09 Oct‐10 Oct‐11 Oct‐12 Oct‐13
P/E Russian oils Global majors
40% discount
0
2
4
6
8
10
12
14
Novatek
Bashne
ft
Tatneft
SurgutNG
Rosneft
Lukoil
Gazprom
Neft
Alliance
Oil
Gazprom
Tran
sneft
(pref)
P/E 52‐week high
52‐week low
Current

Russian Oil & Gas
4
Key changes
Upgrading Bashneft to Buy due to the following reasons:
o The stock’s underperformance following the oil price rally (3% vs sector’s 29%);
o generous dividends in the coming months (8% yield for common, 12% for preferred);
o the company’s clean investment story (group structure optimization, rising production and solid FCF).
Raising TPs by 2‐6% reflecting the upward shift in the Brent forward curve. The positive effect was partially offset by the freeze on 2014 gas tariffs and the crude oil tax reshuffle.
Revising estimates
We revised our financial forecasts to reflect 2Q13 financial results, the oil price increase and the government’s decision to freeze gas tariffs next year and reshuffle crude oil taxes (increase MET and reduce export duty).
Oil price increase: We mark to market the Brent forward curve to reflect the shift in
consensus oil price expectations (2013: $109 from $104; 2014: $105 from $99). We
adjust 2014 refining crack spreads accordingly.
o Key beneficiaries: i) Surgutneftegas and Tatneft, due to the largest upstream exposure; ii) Rosneft, due to high leverage.
Gas tariff freeze: Downside to our numbers is insignificant (4% for Novatek, 3% for
Gazprom), because we originally expected a maximum 5% pa increase in the tariff
vs the government’s target of 15% pa growth.
o The action is in line with our view that the gas sector’s high investment returns are associated with significant regulatory risks, be it the top line (tariff) or the bottom line (taxes).
o Novatek is more sensitive to changes in domestic gas tariffs than Gazprom, due to a higher share of domestic sales and Gazprom’s low margins on domestic gas sales.
Crude oil tax reshuffle:
o Government: c$2.5bn pa of additional tax revenues by 2015‐16.
o Key beneficiaries: i) Novatek – unaffected by the oil MET hike; benefits from lower export duties on crude/condensate and products, ii) Tatneft and Surgutneftegas – significant share of depleted fields absorbs a quarter of the MET increase; benefits of lower crude export duty offset higher cost of third‐party crude purchases.
o Key losers: Bashneft and Alliance Oil – higher cost of third‐party crude offsets lower product export duties.
Recently proposed oil & gas tax changes 2013 2014 2015 2016
Oil MET base rate (Rb/mcm)
Old 470 470 470 470
New 470 493 530 559
Change ‐ 5% 13% 19%
Oil export duty
Old 60% 60% 60% 60%
New 60% 59% 57% 55%
Change ‐ ‐1pp ‐3pp ‐5pp
Gas tariff growth
Old 15% 15% 15% N/A
New 15% 0% 5%* 5%*
Change ‐ ‐15pp ‐10pp N/A
* BCS real inflation rate expectationSource: Ministry of Finance, Federal Tariff Service, BCS

Russian Oil & Gas
5
Summary of macro and regulatory changes on financial forecasts
EBITDA
2014 Oil price increase
Gas tariff freeze
Oil tax maneuver Total
EBITDA 2015
Oil price increase
Gas tariff freeze
Oil tax maneuver Total
EBITDA 2016
Gas tariff freeze
Oil tax maneuver Total
Surgutneftegas 8,040 4.3% ‐0.2% ‐0.2% 3.9% 8,273 1.5% ‐0.4% 1.0% 2.1% 8,782 ‐0.4% 3.7% 3.3%
Tatneft 3,506 4.2% 0.0% ‐1.6% 2.6% 3,010 1.6% ‐0.1% ‐2.9% ‐1.4% 3,541 ‐0.1% ‐1.9% ‐2.0%
Rosneft 27,680 4.1% ‐0.2% ‐1.6% 2.3% 24,528 1.7% ‐0.4% ‐2.8% ‐1.5% 28,398 ‐0.5% ‐1.5% ‐2.0%
Lukoil 23,387 2.0% 0.0% ‐1.0% 1.0% 22,231 0.9% ‐0.1% ‐1.5% ‐0.7% 22,359 ‐0.1% ‐0.9% ‐1.0%
Gazprom Neft 8,831 2.4% ‐0.2% ‐1.4% 0.8% 8,039 1.3% ‐0.4% ‐2.8% ‐1.9% 8,776 ‐0.4% ‐1.1% ‐1.5%
Novatek 4,531 2.1% ‐1.7% 0.4% 0.8% 4,286 0.8% ‐3.8% 1.4% ‐1.5% 4,465 ‐3.8% 2.8% ‐1.0%
Alliance Oil 840 1.3% ‐0.1% ‐0.6% 0.6% 945 0.9% ‐0.2% ‐0.5% 0.2% 845 ‐0.2% ‐1.3% ‐1.5%
Bashneft 3,061 1.2% 0.0% ‐1.0% 0.2% 2,818 1.1% 0.0% ‐1.5% ‐0.4% 2,781 0.0% ‐0.5% ‐0.5%
Gazprom 52,156 0.8% ‐1.3% ‐0.1% ‐0.6% 49,521 0.3% ‐2.9% 0.0% ‐2.5% 50,157 ‐2.9% 0.5% ‐2.3%
Source: BCS
Our new financial forecasts reflect the upward shift in the oil price expectations and the proposed changes in taxation
Revenue EBITDA Net income
$mn 2013e 2014e 2015e 2013e 2014e 2015e 2013e 2014e 2015eGazprom Old 149,970 149,655 149,932 52,028 49,564 48,637 30,603 29,229 27,426 New 154,655 152,410 150,232 56,001 52,156 49,521 32,952 31,187 27,828 Difference 3% 2% 0% 8% 5% 2% 8% 7% 1%
Rosneft Old 139,233 150,737 144,668 26,503 30,994 26,214 10,328 13,235 8,772 New 140,815 148,616 144,668 26,964 27,680 24,528 10,988 10,290 6,949 Difference 1% ‐1% 0% 2% ‐11% ‐6% 6% ‐22% ‐21%
Lukoil Old 143,007 146,221 138,178 19,353 24,623 21,966 10,259 9,726 8,627 New 140,947 143,055 139,885 18,698 23,387 22,231 9,870 8,873 8,663 Difference ‐1% ‐2% 1% ‐3% ‐5% 1% ‐4% ‐9% 0%
Novatek Old 9,896 10,891 11,727 4,132 4,223 4,224 2,864 3,095 3,087 New 9,612 11,091 11,782 4,042 4,531 4,286 2,834 3,380 3,222 Difference ‐3% 2% 0% ‐2% 7% 1% ‐1% 9% 4%
Surgutneftegas Old 39,294 38,591 36,412 7,972 8,774 7,476 7,878 6,852 5,572 New 40,597 38,900 36,589 8,034 8,040 7,002 8,169 6,262 5,143 Difference 3% 1% 0% 1% ‐8% ‐6% 4% ‐9% ‐8%
Gazprom neft Old 44,005 43,683 42,430 8,786 9,810 8,133 4,877 5,581 4,324 New 44,565 43,628 42,686 8,583 8,831 8,039 4,736 4,818 4,219 Difference 1% 0% 1% ‐2% ‐10% ‐1% ‐3% ‐14% ‐2%
Tatneft Old 13,724 13,642 12,813 3,666 3,715 3,182 2,200 2,340 1,925 New 13,914 13,965 13,382 3,555 3,506 3,010 2,148 2,146 1,721 Difference 1% 2% 4% ‐3% ‐6% ‐5% ‐2% ‐8% ‐11%
Bashneft Old 16,297 16,159 15,659 3,103 3,271 2,942 1,794 1,955 1,759 New 17,120 16,574 16,160 3,030 3,061 2,818 1,753 1,716 1,639 Difference 5% 3% 3% ‐2% ‐6% ‐4% ‐2% ‐12% ‐7%
Alliance Oil Old 3,424 3,797 3,615 588 998 922 146 475 428 New 3,627 3,716 3,749 671 840 945 182 321 410 Difference 6% ‐2% 4% 14% ‐16% 2% 25% ‐32% ‐4%
Transneft Old 23,644 24,046 24,675 10,965 11,256 11,754 5,152 5,651 6,071 New 23,886 23,741 24,280 11,177 10,896 11,387 5,526 5,477 5,880 Difference 1% ‐1% ‐2% 2% ‐3% ‐3% 7% ‐3% ‐3%
Source: BCS

Russian Oil & Gas
6
BCS vs consensus estimates
Our financial forecasts are generally below consensus due to more conservative oil price assumptions* Revenue EBITDA Net income
$mn 2013e 2014e 2015e 2013e 2014e 2015e 2013e 2014e 2015eGazprom Consensus 155,362 154,804 157,085 53,333 50,299 49,098 33,272 30,478 28,091 BCS 154,655 152,410 150,232 56,001 52,156 49,521 32,952 31,187 27,828 Difference 0% ‐2% ‐4% 5% 4% 1% ‐1% 2% ‐1%
Rosneft Consensus 143,681 151,389 150,696 28,070 29,988 30,320 12,908 12,957 11,907 BCS 140,815 148,616 144,668 26,964 27,680 24,528 10,988 10,290 6,949 Difference ‐2% ‐2% ‐4% ‐4% ‐8% ‐19% ‐15% ‐21% ‐42%
Lukoil Consensus 134,836 134,972 133,683 18,660 21,737 21,004 10,526 10,809 9,817 BCS 140,947 143,055 139,885 18,698 23,387 22,231 9,870 8,873 8,663 Difference 5% 6% 5% 0% 8% 6% ‐6% ‐18% ‐12%
Novatek Consensus 9,240 10,851 11,839 3,868 4,258 4,787 2,646 2,969 3,276 BCS 9,612 11,091 11,782 4,042 4,531 4,286 2,834 3,380 3,222 Difference 4% 2% 0% 4% 6% ‐10% 7% 14% ‐2%
Surgutneftegas Consensus 31,836 30,703 31,020 8,589 8,098 7,587 6,634 5,359 5,117 BCS 40,597 38,900 36,589 8,034 8,040 7,002 8,169 6,262 5,143 Difference 28% 27% 18% ‐6% ‐1% ‐8% 23% 17% 1%
Gazprom neft Consensus 45,802 45,450 45,179 8,749 8,906 8,284 4,940 4,911 4,234 BCS 44,565 43,628 42,686 8,583 8,831 8,039 4,736 4,818 4,219 Difference ‐3% ‐4% ‐6% ‐2% ‐1% ‐3% ‐4% ‐2% 0%
Tatneft Consensus 18,207 17,481 17,741 3,519 3,530 3,431 2,133 2,155 2,091 BCS 13,914 13,965 13,382 3,555 3,506 3,010 2,148 2,146 1,721 Difference ‐24% ‐20% ‐25% 1% ‐1% ‐12% 1% 0% ‐18%
Bashneft Consensus 17,022 16,764 16,479 3,042 3,035 2,925 1,728 1,700 1,631 BCS 17,120 16,574 16,160 3,030 3,061 2,818 1,753 1,716 1,639 Difference 1% ‐1% ‐2% 0% 1% ‐4% 1% 1% 0%
Alliance Oil Consensus 3,630 3,859 3,905 693 872 988 212 356 452 BCS 3,627 3,716 3,749 671 840 945 182 321 410 Difference 0% ‐4% ‐4% ‐3% ‐4% ‐4% ‐14% ‐10% ‐9%
Transneft Consensus 22,740 23,058 23,423 11,333 11,577 11,510 5,642 5,848 5,737 BCS 23,886 23,741 24,280 11,177 10,896 11,387 5,526 5,477 5,880 Difference 5% 3% 4% ‐1% ‐6% ‐1% ‐2% ‐6% 2%
* $108/bbl in 2013, $103/bbl in 2014, and $97/bbl in 2015Source: FactSet, BCS

Russian Oil & Gas
7
Recommendation summary1
Buy
Lukoil (TP $75/GDR) – Highest shareholder returns in the sector
Robust dividend growth (15% pa) translates into highest returns among peers
Diversified asset growth portfolio (Uzbek gas, Iraqi PSA, tax‐exempt Caspian fields) implying gradual production and earnings increase
Consensus has yet to re‐assess the FCF outlook taking into account CapEx optimization and West Qurna‐2 immediate cost recovery
West Siberian production starting to show positive signs; contribution of Imilor is underestimated
Attractive valuation – 4.5x P/E '14 – does not reflect robust shareholder returns
Novatek (TP $145/GDR) – Robust growth and catalysts
Strong execution track‐record, value‐accretive expansion projects and vast resource base have justified Novatek's valuation premium…
… which we expect to persist going forward, given Novatek's robust growth prospects and investment returns
Anticipated growth is significantly above the sector average, accelerating in the second half of the decade once Gydan fields and Yamal LNG come on‐stream
The stock is especially attractive in the short term, given numerous up‐coming catalysts de‐risking Novatek's flagship Yamal LNG project (19% of our fair value)
Industry regulatory risks – including slower domestic tariff growth and gas and condensate MET hike – are already in the price
Gazprom Neft (TP $25/GDR) – Robust growth, highest shareholder returns
Highest shareholder returns over the next two years (3% pa EPS growth and 6% dividend yield)
Robust FCF generation in the long‐term (c$16bn during 2017‐21, three quarters of the current market cap)
Valuation implies a 27% discount to peers vs 13% during 2010‐12
Large portfolio of greenfield projects (1.1mmboe/d hydrocarbon production) is not in the price, while additional tax breaks imply further potential upside
Catalysts include additional greenfield tax breaks, transfer of oil licenses from Gazprom and potential liquidity improvement, however, outcomes are twofold and timing is uncertain
Bashneft (TP Rb2,100/share) – Attractive dividend play
Robust FCF generation despite refinery upgrade CapEx: we estimate FCF yield to average 11% during 2013‐16e (vs sector average of 5%)
The highest dividend yield during 2009‐11 thanks to the company's flexible dividend policy (distribute generated FCF)
High interim dividend (Rb150/share; 8% yield on common, 12% yield on preferred) to be paid by year‐end
A potential London IPO next year would improve liquidity, expand the investor base and finance resource base growth and asset acquisitions
Valuation premium but justified – reflects strong execution track record and solid shareholder returns (6.5x P/E '14 vs sector's 5.7x)
1 For risks to BCS theses and valuation methodology, please refer to pages 24‐26
Russian Oil & Gas
8
Hold
Rosneft (TP $8.30/GDR) – Shareholder returns captive to high CapEx
Solid financial position and immense FCF generation capabilities
TNK‐BP merger synergies have yet to be monetized, reflected in stock valuation
Primary beneficiary of the greenfield tax reform proposals…
… due to largest portfolio of greenfield projects, potentially translating into robust returns in the long term
However, large CapEx requirements in coming decade…
… restrain near‐term shareholder returns to the 3% dividend yield, one of the lowest among peers
Gazprom (TP $9/GDR) – World’s cheapest energy name, for good cause
World's cheapest energy name (2014e P/E of 3.4x) reflects poor ROI
Stock value is worth Gazprom's future dividend stream
Dividend yield, currently 5%, will be among highest of peers, once management approves the 35% IFRS dividend payout (9% vs 5%)
However, vast number of expansion projects will absorb most FCF…
… and earnings growth will contribute little to valuation
Surgutneftegas pref (TP Rb24/share) – Falling FCF to underscore prefs’ relative attractiveness
The highest, most stable and defensive dividend among sector peers;
Preferreds' dividend favored over commons' on higher (9% vs 2%), more stable payout…
… potentially leading to a narrower preferred‐common spread (15% today, down from 49% three years ago)

Russian Oil & Gas
9
Sell
Surgutneftegas (TP $8.50/GDR) – Falling FCF to underscore prefs’ relative attractiveness
Common share dividend payout pressured by negative FCF during 2014‐16…
… due to limited upside from crude production and rising CapEx
Preferreds' dividend favored over commons' on higher (9% vs 2%), more stable payout…
… potentially leading to a narrower preferred‐common spread (15% today, down from 49% three years ago)
Conservative use of $32bn 'war chest' not value‐accretive to shareholders; M&A/greenfield development could generate 3‐fold the return
Tatneft (TP $40/GDR) – Premium unjustified
Robust upstream FCF ($16/bbl vs Rosneft's $14/bbl, Lukoil's $15/bbl)…
… is not translating into attractive shareholder returns:
o 30% RAS payout implies one of lowest dividend yields (4%), zero EPS growth;
o Uninspiring investment returns on Taneco refinery – Taneco upgrade/ expansion is estimated to cost c30% more than average, and bitumen reserves development, whose scale/profitability is uncertain;
Valuation premium to peers is unsustainable, in our view, taking into account some other companies' superior shareholder returns
Alliance Oil (TP SEK 41/share) – Risk‐reward skewed to the downside
Risk of consensus earnings downgrade – consensus too bullish…
… BCS 2013‐15e EPS forecast is 15% below consensus; BCS 2012‐15e EPS CAGR estimate of 1% compares to consensus' 4%
Delay in the refinery’s commercial start and connection to ESPO until 2H14 is equivalent to c$150mn of foregone EBITDA
Robust FCF once upgraded refinery is operational and connection to ESPO could fully deleverage the balance sheet by 2018…
… but search for further production growth will require significant investment, thus putting pressure on near‐term shareholder returns
Current valuation (4.4x EV/EBITDA '14e) is inflated by speculation over a potential takeover by Rosneft (25 July, Vedomosti) and is not fundamentally justified
Transneft pref (TP Rb75,000/share) – Risk‐reward not worth the gamble
Robust FCF – $10bn during 2013‐15 – is encouraging hope in higher dividends
Preferred share price aggressive, assumes 2013e IFRS payout of 20% (vs 3% in 2012)
Risk‐reward unattractive:
o potential downside (82%) (no change in dividend policy)
o exceeds upside (53%) (35% IFRS payout)
No guarantee holders of preferred shares will benefit from IFRS‐based payout, since the charter does not stipulate that the dividend paid on preferred shares (10% RAS net income) be at the level paid on commons

Russian Oil & Gas
10
Stock picking in a challenging sector
Pressure on the budget leads to sector instability. In our sector initiation report, Russian Oil & Gas: Greenfields – key to profitability and stability (1 August), we concluded that Russian federal budget revenues, half of which come from the oil & gas sector, face significant downside risks in coming years and that the government will likely look for ways to compensate for any shortfall. The government’s actions in the past month proved our point:
Next year’s freeze in gas tariffs should save consumers over $2bn pa;
The crude oil tax reshuffle has hit refining‐heavy companies and should generate
over $2.5bn pa of extra revenues for the government.
According to our analysis, the government will still be at least c$10bn short of current tax inflows by the end of the decade. A tax increase is the most efficient tool to address this problem. Given numerous projects which, assuming a stable macro environment, will generate substantial returns (in excess of 30% IRR), especially in the refining and gas sectors, additional tax hikes in the coming years are highly likely.
Upstream companies with multiple greenfields are investors’ best long‐term play. Such regulatory risks, i.e., risks of unexpected tax hikes, tariff growth deceleration and so on, are the primary factors that prevent global energy investors from investing long term in the Russian oil & gas sector, as we found out during our two‐week roadshow in September among global equity fund managers (refer to the feedback from the meetings Russian Oil & Gas: What YOU think of the sector, 25 September). Indeed, last year’s gas MET saga is still fresh in the minds of the many investors who lost millions of dollars on the stocks’ volatility.
We do not expect regulatory risks to be any lower going forward. On the contrary, the more acute the issue with budget revenues becomes, the higher the taxation risks are going to be. Having analyzed the returns of each oil & gas subsector and every major project, we have concluded that investors’ safest long‐term bet are companies with large exposure to upstream (already heavily taxed) and with the largest amount of greenfields (minimum investment returns guaranteed). These companies are Gazprom Neft, Lukoil and Rosneft.
Dividends – a bird in hand is worth two in the bush. Monetization of the value of upstream greenfields, for which the new tax regulation guarantees a minimum return rate, is, in most cases, too far off. On a shorter horizon, investors are better off with opportunistic dividend plays, we think. These are Bashneft, Gazprom and Lukoil.
Bashneft: the new dividend king. Unlike peers undergoing a major CapEx cycle and investing in future growth, Bashneft is already enjoying rising output, lower OpEx and CapEx and, therefore, will continue churning healthy FCF. The company has moderate leverage and hence could distribute most of its FCF as dividends as per its dividend policy. We estimate that investors could receive a third of its market cap in the next three years by investing in preferred shares. This makes Bashneft the highest dividend paying oil & gas stock in Russia.
Gazprom: the 35% IFRS payout creates an attractive bull case. State‐owned companies are to pay 35% of IFRS net income as dividends starting from 2016, based on the government’s recent resolution. If confirmed by Gazprom, this would have major valuation implications, since consensus dividend expectations are the major driver for the company’s shares. Based on a dividend discount model, adoption of a higher dividend payout would translate into an additional $3/GDR of value, or a third of the current share price.
Lukoil: highly committed to dividend growth. In pursuing market cap growth, management has chosen the most efficient tool to achieve its goals. Lukoil has posted the highest dividend growth in the last three years (20% CAGR) and plans to maintain such pace going forward. Unlike its peers, Lukoil has passed the bottom of the CapEx cycle and starting from next year should see the fruit of past investments. Its FCF profile adds significant credibility to management’s ambitious dividend growth target (15% pa).
Investors’ safest long‐term play is oil companies with high exposure to upstream and greenfields
Source: BCS
Gazprom minorities are primary beneficiaries of the 35% dividend payout requirement
Source: FactSet, BCS
Greenfield exposure
Upstream exposure
Gazprom Neft
Rosneft
BashneftLukoil
Tatneft
Alliance Oil
SurgutNG
6.7%
3.5%
0.8%
Gazprom Rosneft Transneft (pref)
35% IFRS
25% IFRS
9.3%
4.9%

Russian Oil & Gas
11
Bashneft – the major with unparalleled dividends O&G companies nearly trebled dividend payments since 2008
Source: Company data, FactSet, BCS
Three momentum plays, or stocks to avoid on short side of a pair trade in near term:
Novatek: news flow de‐risking Yamal LNG. The project is awaiting new partner(s), pre‐sale of LNG volumes and FID. Yamal LNG is long‐term, complicated and capital‐intensive; however, in the short term, the Novatek stock offers an attractive play on catalysts, which in the past have proved to drive the share price. Moreover, Novatek is very likely to beat its FY13 output guidance as Gazprom’s continuously rising gas exports have created a window of opportunity for independent gas producers on the domestic market.
Lukoil: oil price stabilization and West Qurna‐2 launch. The stock was the worst performer during the late oil price rally despite in‐line performance in previous years. This underperformance and the company’s low sensitivity to oil price changes make the stock one of the most defensive instruments for withstanding oil price stabilization. Moreover, successful delivery of West Qurna‐2 in November should lift most investors’ concerns, de‐risk c$3bn of next year’s FCF and add credibility to the continued increase in dividends.
Gazprom: dividend discussions, robust gas sales and the pending agreement with China. In the short term, Gazprom is the best exposure to the dividend payout increase imposed by the government. Moreover, the company will continue enjoying rising gas exports to Europe. This has limited valuation implications, but it should improve sentiment towards the stock. Finally, the long‐awaited agreement to supply profitable gas volumes to China is just around the corner.
Maximizing returns and hedging risks with pair trades. Although there is not much upside across the sector, the range between the highest upside and downside is still significant to generate returns on the long‐short trades, we believe.
Short‐term pair trades: Playing the momentum themes and catalysts
Lukoil vs Rosneft
o Anticipating the oil price stabilization. The oil price seems to have traded ahead of fundamentals: the excess supply of oil from the non‐OPEC members is significant and the fears of the Syrian crisis escalating to the nearby countries are easing. Falling crude price traditionally accompanied by a similar move in oil companies’ shares will draw investor interest to more defensive names. Rosneft’s high leverage has made the company one of the most sensitive to oil price changes and, therefore, ill‐suited to hide in from the declining oil price.
o Lukoil: The launch of the long‐awaited West Qurna‐2 in November should de‐risk up to 10% of the company’s value. As we have discussed in Lukoil: Approaching the turning point (10 September), the Iraqi operations will contribute up to $3bn of FCF next year in the form of the historical cost recovery, which the market does not have in its forecasts yet.
o Rosneft: Value implications from the corporate activity are overblown. The company has pulled many rabbits out of its hat in the last year, but the contribution to the shareholder value has been neutral, we estimate. Given
30%
22%20%
18%17% 16%
11%
8%7%
5%
2%
0%
5%
10%
15%
20%
25%
30%Bashneft
(pref)
SurgutNG
(pref)
Bashneft
Gazprom
Lukoil
Gazprom
Neft
Tatneft
Rosneft
Novatek
SurgutNG
Transneft
(pref)
2015e 2014e 2013e
5.4
7.0 7.66.3 6.7
9.6
16.4
13.9
15.8
19.1
16.6
0
5
10
15
20
2005 2006 2007 2008 2009 2010 2011 2012 2013e 2014e 2015e
$bn TNK‐BP Russian O&G (ex‐TNK‐BP)
Pick defensive stocks as the oil price stabilizes*
* Sensitivity to the $10/bbl oil price decline
Source: FactSet, BCS
‐8%
‐4%
‐5%
‐5%
‐2%
‐3%
‐2%
2%
3%
‐12%
‐9%
‐7%
‐5%
‐4%
‐4%
‐2%
2%
5%
‐15% ‐10% ‐5% 0% 5%
Gazprom
Rosneft
Tatneft
SurgutNG
Lukoil
Novatek
GazpromNeft
Bashneft
Alliance Oil
Net income EBITDA

Russian Oil & Gas
12
Rosneft’s scale, any future acquisitions or resource base expansion, new contracts with customers or strategic alliances will have little value implications and should not trigger re‐rating of shares.
Gazprom Neft vs Surgutneftegas
o Valuation does not match shareholder returns. Gazprom Neft is trading at a 25% discount to Surgutneftegas despite the superior dividend yield (6% vs 2%) and growth (‐6% EPS CAGR 2013‐15 vs ‐21%).
o Exposure to ruble is not a differentiating factor. Both companies are equally better off from weaker ruble. Although Surgutneftegas’ bottom line enjoys the FX gain contribution, it does not translate into additional FCF and the dividend uplift is insignificant given the common shares’ modest yield.
o Exposure to the greenfield tax regulation (to come into effect in January) is the key profitability driver, in our view. Among Russian oil producers, Gazprom Neft has one of the largest portfolios of greenfield projects that is still not appreciated by the investor community. The value of tax savings under the proposed greenfield legislation is worth $3/GDR for Gazprom Neft, or 14% of its current value, we estimate. Surgutneftegas, in turn, has the smallest amount of greenfields.
Alliance Oil (pref) vs Alliance Oil
o Guaranteed income vs corporate risk. Even though preferred shares may have limited share price appreciation potential, the instrument generates a stable 10% annualized return paid quarterly. Common shares, which have traded up in the last two months on the unconfirmed speculation over the takeover by Rosneft (Vedomosti, 25 July), are susceptible to all company‐specific risks of which, in Alliance Oil’s case, there are many (refinery launch delay, M&A).
Long‐term pair trades: It is all about returns
Lukoil vs Rosneft
o Higher shareholder returns. Lukoil shareholders will benefit in the short term from the company’s exposure to profitable greenfields (Caspian fields, Uzbekistan ramp‐up, West Qurna‐2 launch, the start of Imilor, etc). Lukoil’s production growth until 2015 is 4% pa, on average, vs Rosneft’s 1%, and the cumulative dividend is almost twice higher.
o Lukoil: Aligned interests. Lukoil’s management is committed to market value growth and has wisely chosen the most effective instrument to achieve its goal – the dividend. Purchase of shares by management also contributes to the positive sentiment. Whatever management’s motivation, the key point is that minorities’ interests are closely aligned with those of management.
o Rosneft: Scale comes at a price. Rosneft carries the primary responsibility for the Russian oil industry. The company has the largest portfolio of greenfields, but will require billions of dollars to finance the development. To ensure continuous oil production, Rosneft may accelerate the development of its projects and look for ways to expand the resource base. Thus, the company may find itself in a permanent CapEx cycle with shareholder interest taking the backseat.
Novatek vs Gazprom
o Investment return differential. Gazprom’s ROE averaged 17% during 2010‐12 vs Novatek’s 30%. Going forward, the difference may widen further as Gazprom proceeds with the capital‐intensive Eastern Gas Program, South Stream and Nord Stream expansion, all of which are NPV‐negative or value‐neutral at best, we estimate. Novatek’s approach to investing is more disciplined with the projects’ IRR above 30%.
o Gazprom: Subject to higher tax risk. Searching for alternative tax revenue sources, the government may, as it has already proved so several times, hike taxes on the most profitable sectors and companies. Gazprom is generating robust profitability on export sales of gas and liquids and is enjoying solid

Russian Oil & Gas
13
balance sheet (0.5x net debt / EBITDA). While the government is attempting to make the tax mechanism more transparent, additional ad hoc taxation is possible if necessary, and Gazprom will remain its primary target, we believe.
o Novatek: Attractive risk‐reward. Most of the risks that dominated sentiment around Novatek in the last year seem to have materialized and been priced in (slowed gas tariff growth, higher taxes and Rosneft’s emergence as a gas giant). The company’s bull case includes steeper ramp‐up of profitable liquids sales (condensate and refined products), domestic customer base expansion via acquisition of regional gas marketers, infrastructure and existing producing assets and taking advantage of Gazprom’s expiring agreements.
Gazprom vs Transneft (pref)
o Exposure to the dividend payout increase. Both companies are subject to the government’s request to increase the dividend payout to 35% IFRS from 2016. Gazprom’s potential yield could nearly double to 9%. Implications for Transneft (pref) holders are not straightforward: unless management guarantees (though is not required to) a similar dividend for both classes of shares, the risk of the dividend uplift being absorbed solely by the common shares is high.
o Gazprom: a dividend play. As we have already discussed, Gazprom is one of the best exposures to the dividend increase. Not just its dividend would be the highest among Russian O&G companies, but also its share price highly correlated with consensus dividend expectations could see significant re‐rating (by 30%, we estimate).
o Transneft (pref): Dividend increase is not carved in stone. The company stated on numerous occasions that it has no intention of benefiting its minority shareholders, i.e., holders of preferred shares, via higher dividends. The company has no legal obligation to guarantee a similar dividend for both classes of shares and therefore could award the entire dividend increase to the government, i.e., the holder of all common shares. Such scenario is even more likely in light of the growing budget deficit, a problem which will become more acute after 2015 as O&G tax revenues start declining, on our estimates.
Misperceived high‐risk stocks. Finally, there are three investment stories that we advise to avoid due to absence of clarity on future development and, therefore, high associated risks.
Transneft (pref): Dividends, the shares’ sole driver, are at risk. The charter outlines the 10% RAS dividend payout on preferred shares and does not require dividends for two classes of shares to be equal. Once the company adopts the IFRS payout, management will have full discretion to allocate the dividend increase among the commons and preferreds. In the absence of any incentive to benefit holders of preferred shares, management may award the dividend increase to the government, the sole owner of the common shares.
Alliance Oil: Valuation ignores execution risks. Alliance Oil is yet to disappoint with the delayed launch of the refinery and the subsequent consensus’ forecast downgrade. The current asset portfolio does not ensure sustainable production, nor does it benefit the company in the ongoing sector transformation (tax burden shift from upstream to downstream). This raises M&A and execution risks, which the company has not scored well on in the past.
Tatneft: Lowest shareholder returns. The company could have been the FCF generation benchmark among Russian O&G companies, were it not for its costly Taneco refinery. The robust FCF witnessed over the past year is at its dawn as management proceeds with the Taneco expansion and upgrade. On our estimates, the refinery’s break‐even costs (including investments made in the past) are $22/bbl vs the average Russian refining margin of $9/bbl ($14/bbl after the upgrade).
Russian Oil & Gas
14
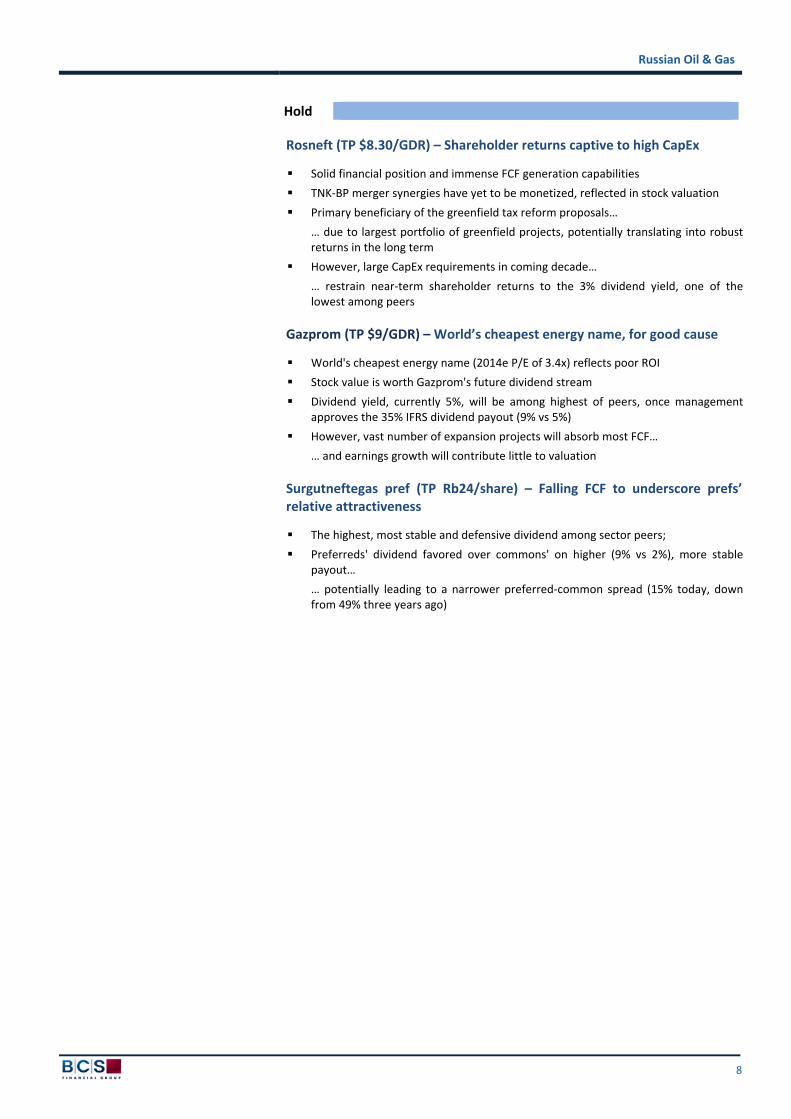
Lukoil – Financial and Operational Summary
Source: Company data, FactSet, BCS
Key price assumptions 2010 2011 2012 2013e 2014e 2015e Market statistics
Crude oil ($/bbl) Share Price ($) 64.00
Brent 80 111 112 108 103 97 Market Cap ($mn) 48,311
Urals 77 109 110 107 102 97 EV ($mn) 55,077
Domestic (Samara) 36 49 50 49 48 47
Crack spreads ($/bbl) Income Statement ($mn) 2010 2011 2012 2013e 2014e 2015e
Gasoline 16 17 23 21 20 21 Revenue 104,956 133,650 139,171 140,947 143,055 139,885
Diesel 12 17 19 18 16 16 Opex -7,969 -9,055 -9,359 -10,030 -9,820 -9,944
Jet fuel 15 22 23 22 21 21 Purchased oil -43,579 -59,694 -64,148 -65,751 -64,628 -61,785
Fuel oil -21 -30 -26 -32 -30 -26 Taxes other than income tax -8,978 -12,918 -13,666 -14,017 -14,050 -14,296
Gas, domestic Excise and export duties -18,878 -22,217 -22,836 -22,074 -20,573 -20,418
$/mcm 82 98 99 110 116 118 Other operating costs -9,865 -12,138 -10,260 -10,377 -10,597 -11,209
$/mcf 2.3 2.8 2.8 3.1 3.3 3.3 EBITDA 15,687 17,628 18,902 18,698 23,387 22,231
Depreciation 4,154 4,473 4,832 5,966 12,043 11,265
Macro assumptions 2010 2011 2012 2013e 2014e 2015e Operating income 11,533 13,155 14,070 12,732 11,344 10,967
USD/RUB 30.36 29.39 31.04 31.81 32.60 32.90 Finance expenses -538 -483 -281 -223 -371 -302
CPI 8.2% 6.0% 6.0% 6.1% 5.0% 5.0% Other expense/income 475 447 -66 418 519 556
Pre-tax income 11,470 13,119 13,723 12,928 11,493 11,221
Production 2010 2011 2012 2013e 2014e 2015e Income taxes -2,351 -3,293 -2,798 -3,080 -2,643 -2,581
Crude oil Minority interest/other -113 531 79 23 23 23
annual output (mmt) 96 91 90 91 93 97 Net income 9,006 10,357 11,004 9,870 8,873 8,663
daily output (kbd) 1,920 1,821 1,790 1,813 1,858 1,934 Fully diluted EPS ($) 10.94 12.96 14.09 12.64 11.36 11.09
Refined products
annual output (mmt) 64 63 64 62 62 62 Balance sheet ($mn) 2010 2011 2012 2013e 2014e 2015e
daily output (kbd) 1,272 1,253 1,272 1,243 1,244 1,244 Cash 2,368 2,753 2,914 3,167 3,167 3,167
light product yield 69% 69% 73% 73% 73% 76% Inventories 6,231 7,533 8,098 8,082 8,064 8,133
Gas (bcm) 18.6 18.6 19.9 20.5 20.8 24.2 Accounts receivable 8,219 8,921 8,667 9,243 9,013 9,126
Other current assets 3,799 4,322 4,594 3,799 3,799 3,799
Reserves (SEC) Total current assets 20,617 23,529 24,273 24,291 24,042 24,225
1P 2P 1P+2P 3P 1P+2P+3P Fixed assets 54,629 56,803 66,883 79,164 83,335 88,927
Oil (bn bbl) 13.4 5.9 19.3 3.7 23.0 Other non-current assets 8,771 10,860 7,805 7,895 7,895 7,895
Gas (bcm) 665 304 969 101 1,070 Total non-current assets 63,400 67,663 74,688 87,059 91,230 96,822
Total (bn boe) 17.3 7.7 25.0 4.3 29.3 Total assets 84,017 91,192 98,961 111,350 115,273 121,048
EV/Reserves ($/boe) 3.2 2.2 1.9 Short-term debt 2,125 1,792 658 1,751 0 1,012
Reserve life (years) 22 32 37 Accounts payable 5,607 5,995 7,263 8,168 7,691 7,757
Other current liabilities 3,043 3,321 4,532 5,326 5,326 5,326
Financial ratios 2010 2011 2012 2013e 2014e 2015e Total current liabilities 10,775 11,108 12,453 15,245 13,017 14,095
Valuation Long-term debt 9,069 7,300 5,963 8,774 8,532 7,344
P/E (x) 5.4 4.7 4.4 4.9 5.4 5.6 Other non-current liabilities 4,976 5,146 7,338 7,851 7,828 7,805
PEG (x) 18.9 31.1 70.3 NM NM NM Total non-current liabilities 14,045 12,446 13,301 16,625 16,360 15,149
P/B (x) 0.8 0.8 0.7 0.6 0.6 0.5 Total shareholders' equity 59,197 67,638 73,207 79,480 85,896 91,803
EV/EBITDA (x) 3.5 3.1 2.9 2.9 2.4 2.5 Total liabilities and equity 84,017 91,192 98,961 111,350 115,273 121,048
EV/DACF (x) 3.6 3.1 3.2 3.4 2.5 2.7
Dividend yield (%) 3.0% 4.0% 4.5% 5.1% 5.7% 6.5% Cash flow statement ($mn) 2010 2011 2012 2013e 2014e 2015e
FCF Yield (%) 14.6% 15.4% 16.1% 4.7% 9.3% 6.1% Net income 9,006 10,357 11,004 9,870 8,873 8,663
Profitability Depreciation 4,154 4,473 4,832 5,966 12,043 11,265
EBITDA Margin (%) 15% 13% 14% 13% 16% 16% Changes in working capital -826 -1,529 2,474 440 -229 -117
EBIT Margin (%) 11% 10% 10% 9% 8% 8% Other 1,207 2,213 687 62 0 0
Net Margin (%) 9% 8% 8% 7% 6% 6% Operating cash flow 13,541 15,514 18,997 16,338 20,687 19,811
Leverage Capex -6,468 -8,093 -11,235 -14,091 -16,215 -16,857
Gross Debt/Equity (x) 0.2 0.1 0.1 0.1 0.1 0.1 Acquisitions -813 -2,655 -1,060 -2,435 0 0
Net Debt/Equity (x) 0.1 0.1 0.0 0.1 0.1 0.1 Other -15 -25 -921 -849 0 0
Gross Debt/EBITDA (x) 0.7 0.5 0.4 0.6 0.4 0.4 Investing cash flow -7,296 -10,773 -13,216 -17,375 -16,215 -16,857
Net Debt/EBITDA (x) 0.6 0.4 0.2 0.4 0.2 0.2 Change in debt 35 -2,004 -1,266 3,902 -1,993 -175
Net Interest Cover (x) 21.4 27.2 50.1 57.2 30.6 36.3 Dividends -1,556 -1,830 -2,913 -2,532 -2,456 -2,756
Returns Other -4,625 -2,189 -1,501 -21 -23 -23
ROE (%) 16% 16% 16% 13% 11% 10% Financing cash flow -6,146 -6,023 -5,680 1,349 -4,473 -2,954
ROACE (%) 14% 14% 15% 12% 10% 9% Effect of Forex -5 -93 60 -59 0 0
ROA (%) 11% 12% 12% 9% 8% 7% Increase (decrease) in cash flow 94 -1,375 161 253 0 0

Russian Oil & Gas
15
Gazprom Neft – Financial and Operational Summary
Source: Company data, FactSet, BCS
Key price assumptions 2010 2011 2012 2013e 2014e 2015e Market statistics
Crude oil ($/bbl) Share Price ($) 22.32
Brent 80 111 112 108 103 97 Market Cap ($mn) 21,061
Urals 77 109 110 107 102 97 EV ($mn) 25,815
Domestic (Samara) 36 49 50 49 48 47
Crack spreads ($/bbl) Income Statement ($mn) 2010 2011 2012 2013e 2014e 2015e
Gasoline 16 17 23 21 20 21 Revenue 32,772 44,172 48,818 44,565 43,628 42,686
Diesel 12 17 19 18 16 16 Opex -2,111 -2,464 -3,974 -4,623 -4,823 -4,844
Jet fuel 15 22 23 22 21 21 Purchased oil -7,459 -10,817 -13,869 -9,552 -8,604 -8,519
Fuel oil -21 -30 -26 -32 -30 -26 Taxes other than income tax -5,240 -8,038 -8,090 -9,580 -9,365 -8,931
Gas, domestic Excise and export duties -6,631 -8,092 -9,240 -7,009 -6,761 -6,968
$/mcm 82 98 99 110 116 118 Other operating costs -5,054 -5,819 -5,415 -5,217 -5,244 -5,385
$/mcf 2.3 2.8 2.8 3.1 3.3 3.3 EBITDA 6,277 8,942 8,230 8,583 8,831 8,039
Depreciation 1,619 1,963 1,883 2,364 2,355 2,350
Macro assumptions 2010 2011 2012 2013e 2014e 2015e Operating income 4,658 6,979 6,347 6,219 6,476 5,688
USD/RUB 30.36 29.39 31.04 31.81 32.60 32.90 Finance expenses -288 -263 -257 -200 -199 -194
CPI 8.2% 6.0% 6.0% 6.1% 5.0% 5.0% Other expense/income -93 115 942 45 27 27
Pre-tax income 4,277 6,831 7,031 6,064 6,305 5,521
Production 2010 2011 2012 2013e 2014e 2015e Income taxes -844 -1,244 -1,155 -1,118 -1,268 -1,111
Crude oil Minority interest/other -285 -235 -253 -210 -219 -191
annual output (mmt) 50 50 51 50 53 53 Net income 3,148 5,352 5,623 4,736 4,818 4,219
daily output (kbd) 1,003 1,009 1,017 1,001 1,051 1,062 Fully diluted EPS ($) 3.34 5.67 5.96 5.02 5.11 4.47
Refined products
annual output (mmt) 38 41 44 44 43 43 Balance sheet ($mn) 2010 2011 2012 2013e 2014e 2015e
daily output (kbd) 754 824 884 871 865 863 Cash 1,146 914 2,488 3,002 3,567 3,533
light product yield 64% 61% 62% 63% 63% 63% Inventories 1,862 2,343 2,890 2,537 2,307 2,355
Gas (bcm) 4.0 8.7 11.3 14.3 15.1 16.8 Accounts receivable 2,566 3,562 2,180 2,175 2,180 2,160
Other current assets 1,519 2,252 4,344 4,269 4,269 4,269
Reserves (PRMS) Total current assets 7,093 9,071 11,902 11,983 12,323 12,317
1P 2P 1P+2P 3P 1P+2P+3P Fixed assets 15,914 19,313 21,914 27,201 30,716 33,460
Total (bn boe) 8.3 5.9 14.2 5.3 19.5 Other non-current assets 9,057 8,299 8,744 6,336 6,381 6,424
EV/Reserves ($/bbl) 3.1 1.8 1.3 Total non-current assets 24,971 27,612 30,657 33,537 37,097 39,883
Reserve life (years) 19 32 44 Total assets 32,064 36,683 42,560 45,520 49,421 52,200
Short-term debt 1,694 1,277 2,167 2,356 2,632 2,168
Financial ratios 2010 2011 2012 2013e 2014e 2015e Accounts payable 2,730 3,075 2,942 4,308 4,058 4,110
Valuation Other current liabilities 427 65 1,249 1,002 1,002 1,002
P/E (x) 6.7 3.9 3.7 4.4 4.4 5.0 Total current liabilities 4,851 4,417 6,358 7,666 7,692 7,280
PEG (x) 149.3 5.6 73.8 NM 251.2 NM Long-term debt 4,942 5,420 5,448 6,379 6,379 6,379
P/B (x) 1.2 1.0 0.8 0.8 0.7 0.6 Other non-current liabilities 3,584 3,334 3,423 4,168 4,387 4,580
EV/EBITDA (x) 4.1 2.9 3.1 3.0 2.9 3.2 Total non-current liabilities 8,526 8,754 8,871 10,547 10,766 10,959
EV/DACF (x) 4.7 3.0 3.2 3.4 3.2 3.0 Total shareholders' equity 18,687 23,512 27,330 27,307 30,963 33,996
Dividend yield (%) 3.3% 5.6% 6.7% 5.7% 5.8% 5.1% Total liabilities and equity 32,064 36,683 42,560 45,520 49,421 52,235
FCF Yield (%) 11.3% 6.2% 8.4% 8.2% 5.1% 8.7%
Profitability Cash flow statement ($mn) 2010 2011 2012 2013e 2014e 2015e
EBITDA Margin (%) 19% 20% 17% 19% 20% 19% Net income 3,433 5,587 5,877 4,946 5,037 4,410
EBIT Margin (%) 14% 16% 13% 14% 15% 13% Depreciation 1,619 1,963 1,883 2,364 2,355 2,350
Net Margin (%) 10% 12% 12% 11% 11% 10% Changes in working capital 247 -2,359 -296 203 -25 25
Leverage Other 93 810 -76 180 614 1,577
Gross Debt/Equity (x) 0.4 0.3 0.3 0.3 0.3 0.3 Operating cash flow 5,392 6,001 7,388 7,693 7,981 8,362
Net Debt/Equity (x) 0.3 0.2 0.2 0.2 0.1 0.1 Capex -3,292 -4,029 -5,019 -5,702 -7,094 -6,714
Gross Debt/EBITDA (x) 1.1 0.7 0.9 1.0 1.0 1.1 Acquisitions -1,536 -1,156 -146 -10 0 0
Net Debt/EBITDA (x) 0.9 0.6 0.6 0.5 0.5 0.5 Other -24 -289 -203 -411 0 0
Net Interest Cover (x) 16.2 26.5 24.7 31.1 32.6 29.3 Investing cash flow -4,852 -5,474 -5,368 -6,122 -7,094 -6,714
Returns Change in debt 419 273 819 940 276 -464
ROE (%) 18% 25% 22% 17% 17% 13% Dividends -728 -1,025 0 -1,442 -1,196 -1,217
ROACE (%) 16% 21% 17% 16% 15% 12% Other 0 0 -1,206 -94 0 0
ROA (%) 10% 16% 14% 11% 10% 8% Financing cash flow -309 -752 -387 -596 -921 -1,681
Effect of Forex 47 -7 -60 104 0 0
Increase (decrease) in cash flow 278 -232 1,574 1,079 -34 -33

Russian Oil & Gas
16
Bashneft – Financial and Operational Summary
Source: Company data, FactSet, BCS
Key price assumptions 2010 2011 2012 2013e 2014e 2015e Market statistics
Crude oil ($/bbl) Share Price (ords) ($/share) 58.53
Brent 80 111 112 108 103 97 Share Price (prefs) ($/share) 40.43
Urals 77 109 110 107 102 97 Market Cap ($mn) 11,045
Domestic (Samara) 36 49 50 49 48 47 EV ($mn) 14,802
Crack spreads ($/bbl)
Gasoline 16 17 23 21 20 21 Income Statement ($mn) 2010 2011 2012 2013e 2014e 2015e
Diesel 12 17 19 18 16 16 Revenue 13,341 16,549 17,155 17,120 16,574 16,160
Jet fuel 15 22 23 22 21 21 Opex -2,665 -1,684 -1,728 -1,750 -1,702 -1,697
Fuel oil -21 -30 -26 -32 -30 -26 Purchased oil -2,882 -3,994 -4,022 -3,781 -3,588 -3,525
Taxes other than income tax -1,421 -2,052 -2,149 -2,204 -2,131 -2,073
Macro assumptions 2010 2011 2012 2013e 2014e 2015e Excise and export duties -2,753 -4,231 -4,649 -4,917 -4,663 -4,593
USD/RUB 30.36 29.39 31.04 31.81 32.60 32.90 Other operating costs -1,116 -1,396 -1,427 -1,437 -1,428 -1,453
CPI 8.2% 6.0% 6.0% 6.1% 5.0% 5.0% EBITDA 2,504 3,192 3,179 3,030 3,061 2,818
Depreciation 711 616 592 593 633 670
Production 2010 2011 2012 2013e 2014e 2015e Operating income 1,793 2,576 2,587 2,437 2,429 2,148
Crude oil Finance expenses -290 -434 -228 -175 -298 -220
annual output (mmt) 14.1 15.1 15.4 15.6 15.7 15.7 Other expense/income 34 62 -8 -24 32 137
daily output (kbd) 283 302 309 311 314 314 Pre-tax income 1,537 2,204 2,351 2,239 2,162 2,065
Refined products Income taxes -468 -513 -529 -474 -432 -413
annual output (mmt) 19.4 19.2 18.9 19.2 19.0 19.0 Minority interest/dividends -116 5 -144 -12 -14 -13
daily output (kbd) 389 384 378 384 380 380 Net income 953 1,696 1,678 1,753 1,716 1,639
light product yield 64% 64% 64% 64% 65% 67% Fully diluted EPS ($) 4.65 8.28 7.77 7.71 7.55 7.21
Reserves (PRMS) Balance sheet ($mn) 2010 2011 2012 2013e 2014e 2015e
1P 2P 1P+2P 3P 1P+2P+3P Cash 1,067 881 658 40 248 216
Oil (bn bbl) 2.0 0.5 2.5 0.7 3.2 Inventories 625 748 780 825 739 749
EV/Reserves ($/bbl) 7.4 5.8 4.6 Accounts receivable 1,208 1,395 1,666 1,599 1,571 1,571
Reserve life (years) 18 22 28 Other current assets 852 1,245 876 800 800 800
Total current assets 3,752 4,269 3,981 3,265 3,359 3,336
Financial ratios 2010 2011 2012 2013e 2014e 2015e Fixed assets 9,552 7,882 9,073 9,253 9,817 10,362
Valuation Other non-current assets 1,687 1,422 2,120 2,478 2,936 3,277
P/E (x) 11.6 6.5 6.6 6.3 6.4 6.7 Total non-current assets 11,239 9,304 11,192 11,731 12,753 13,639
PEG (x) 9.1 8.4 NM 140.9 NM NM Total assets 14,991 13,573 15,173 14,996 16,111 16,975
P/B (x) 2.1 2.0 1.6 1.4 1.3 1.1 Short-term debt 795 420 1,048 455 455 455
EV/EBITDA (x) 5.9 4.6 4.7 4.9 4.8 5.3 Accounts payable 1,071 1,242 1,308 1,538 1,239 1,255
EV/DACF (x) 7.0 5.5 6.8 7.1 6.5 6.5 Other current liabilities 650 632 487 227 227 227
Dividend yield (ords) (%) 13.3% 5.8% 1.4% 8.0% 6.0% 6.2% Total current liabilities 2,516 2,294 2,842 2,220 1,921 1,937
Dividend yield (prefs) (%) 19.2% 8.3% 2.0% 11.6% 8.8% 9.0% Long-term debt 3,118 2,965 2,560 3,281 2,981 2,981
FCF Yield (%) 13.0% 14.9% 12.8% 11.3% 10.2% 8.8% Other non-current liabilities 4,082 2,704 1,817 1,705 1,719 1,732
Profitability Total non-current liabilities 7,200 5,669 4,377 4,986 4,700 4,713
EBITDA Margin (%) 19% 19% 19% 18% 18% 17% Total shareholders' equity 5,275 5,610 7,954 7,790 9,490 10,324
EBIT Margin (%) 13% 16% 15% 14% 15% 13% Total liabilities and equity 14,991 13,573 15,173 14,996 16,111 16,975
Net Margin (%) 7% 10% 10% 10% 10% 10%
Leverage Cash flow statement ($mn) 2010 2011 2012 2013e 2014e 2015e
Gross Debt/Equity (x) 0.7 0.6 0.5 0.5 0.4 0.3 Net income 953 1,696 1,678 1,753 1,716 1,639
Net Debt/Equity (x) 0.4 0.3 0.3 0.4 0.3 0.3 Depreciation 711 655 592 593 633 670
Gross Debt/EBITDA (x) 1.6 1.1 1.1 1.2 1.1 1.2 Changes in working capital -531 -264 -101 -427 -184 6
Net Debt/EBITDA (x) 0.9 0.4 0.7 1.0 0.9 0.9 Other 267 141 135 96 -21 -126
Returns Operating cash flow 1,400 2,228 2,304 2,015 2,144 2,189
ROE (%) 18% 31% 25% 22% 20% 17% Capex -492 -851 -992 -1,192 -1,197 -1,215
ROACE (%) 19% 27% 23% 18% 17% 13% Acquisitions -939 - -282 -29 - -
ROA (%) 7% 12% 12% 12% 11% 10% Other -564 -157 12 -99 - -
Investing cash flow -1,995 -1,008 -1,262 -1,319 -1,197 -1,215
Change in debt 2,145 -401 52 365 -300 -
Dividends -1,314 -950 -591 -1,229 -15 -805
Other -343 -32 -731 -464 -423 -202
Financing cash flow 488 -1,383 -1,270 -1,329 -738 -1,007
Effect of Forex 8 -23 5 15 - -
Increase (decrease) in cash flow -99 -186 -223 -618 209 -33

Russian Oil & Gas
17
Novatek – Financial and Operational Summary
Source: Company data, FactSet, BCS
Key price assumptions 2010 2011 2012 2013e 2014e 2015e Market statistics
Crude oil ($/bbl) Share Price ($) 135.00
Brent 80 111 112 108 103 97 Market Cap ($mn) 40,948
Urals 77 109 110 107 102 97 EV ($mn) 44,888
Domestic (Samara) 36 49 50 49 48 47
Gas, domestic Income Statement ($mn) 2010 2011 2012 2013e 2014e 2015e
$/mcm 82 98 99 110 116 118 Revenue 3,911 5,999 6,801 9,612 11,091 11,782
$/mcf 2.3 2.8 2.8 3.1 3.3 3.3 Transportation -1,225 -1,639 -1,960 -3,317 -3,357 -3,624
Taxes other than income tax -332 -597 -543 -686 -1,088 -1,281
Macro assumptions 2010 2011 2012 2013e 2014e 2015e Other operating costs -482 -771 -1,189 -1,567 -2,115 -2,590
USD/RUB 30.36 29.39 31.04 31.81 32.60 32.90 EBITDA 1,872 2,992 3,109 4,042 4,531 4,286
CPI 8.2% 6.0% 6.0% 6.1% 5.0% 5.0% Depreciation 218 316 360 405 475 579
Operating income 1,655 2,676 2,749 3,637 4,056 3,707
Production 2010 2011 2012 2013e 2014e 2015e Finance expenses 5 42 -48 -98 -53 -19
Gas (bcm) Other expense/income 23 -266 77 -21 174 270
Yurkharovskoye 24.4 32.0 34.1 36.4 36.8 36.8 Pre-tax income 1,683 2,452 2,778 3,518 4,178 3,958
Other fields 12.8 15.5 16.5 15.5 15.5 15.5 Income taxes -356 -535 -540 -685 -797 -735
Subtotal 37.3 47.5 50.5 52.0 52.3 52.3 Minority interest/other 8 12 1 1 - -
Sibneftegas 5.4 5.3 5.4 5.5 5.5 Net income 1,335 1,929 2,238 2,834 3,380 3,222
Nortgas 2.3 3.0 4.0 Fully diluted EPS ($) 4.40 6.35 7.37 9.33 11.13 10.61
Severenergia 0.6 1.2 1.9 3.5
Total 37.3 52.9 56.5 60.9 62.7 65.2 Balance sheet ($mn) 2010 2011 2012 2013e 2014e 2015e
Cash 333 740 603 212 212 212
Liquids (mmboe) 29.6 33.6 34.6 44.3 47.5 51.7 Inventories 61 52 101 166 190 215
Accounts receivable 282 519 537 904 916 1,009
Reserves (PRMS) Other current assets 286 500 665 516 516 516
1P 2P 1P+2P 3P 1P+2P+3P Total current assets 962 1,811 1,907 1,798 1,834 1,951
Gas (bcm) 2,195 911 3,106 698 3,804 Fixed assets 5,519 4,632 5,306 5,830 7,049 8,709
Liquids (mmbbl) 1,242 801 2,043 1,193 3,236 Other non-current assets 2,801 5,466 7,948 8,052 8,052 8,052
Oil and Gas (bn boe) 15.6 6.8 22.4 5.8 28.1 Total non-current assets 8,320 10,098 13,254 13,883 15,102 16,761
EV/Reserves ($/boe) 2.9 2.0 1.6 Total assets 9,282 11,909 15,161 15,680 16,936 18,712
Reserve life (years) 35 51 64 Short-term debt 819 630 1,135 0 33 73
Accounts payable 927 774 521 588 673 760
Financial ratios 2010 2011 2012 2013e 2014e 2015e Other current liabilities 124 152 148 144 164 186
Valuation Total current liabilities 1,870 1,557 1,805 732 870 1,019
P/E (x) 30.7 21.2 18.3 14.4 12.1 12.7 Long-term debt 1,532 2,335 3,202 3,346 2,141 1,504
PEG (x) 49.0 47.7 114.4 54.2 62.8 NM Other non-current liabilities 1,092 532 660 681 681 681
P/B (x) 9.6 6.7 4.8 4.0 3.4 2.8 Total non-current liabilities 2,624 2,867 3,861 4,028 2,823 2,185
EV/EBITDA (x) 24.0 15.0 14.4 11.1 9.9 10.5 Total shareholders' equity 4,789 7,486 9,495 10,921 13,243 15,508
EV/DACF (x) 27.0 17.1 16.6 12.5 11.4 11.6 Total liabilities and equity 9,282 11,909 15,161 15,680 16,936 18,712
Dividend yield (%) 1.0% 1.5% 1.6% 2.1% 2.5% 2.4%
FCF Yield (%) 1.7% 3.6% 2.8% 3.4% 5.1% 3.2% Cash flow statement ($mn) 2010 2011 2012 2013e 2014e 2015e
Profitability Net income 1,335 1,929 2,238 2,834 3,380 3,222
EBITDA Margin (%) 48% 50% 46% 42% 41% 36% Depreciation 218 316 360 405 475 579
EBIT Margin (%) 42% 45% 40% 38% 37% 31% Changes in working capital -139 -155 -165 -390 69 -9
Net Margin (%) 34% 32% 33% 29% 30% 27% Other 63 356 10 236 - -
Leverage Operating cash flow 1,478 2,446 2,443 3,085 3,924 3,793
Gross Debt/Equity (x) 0.5 0.4 0.5 0.3 0.2 0.1 Capex -772 -981 -1,291 -1,548 -1,694 -2,239
Net Debt/Equity (x) 0.4 0.3 0.4 0.3 0.1 0.1 Other -1,511 -722 -1,475 284 - -
Gross Debt/EBITDA (x) 1.3 1.0 1.4 0.8 0.5 0.4 Investing cash flow -2,283 -1,702 -2,766 -1,832 -1,694 -2,239
Net Debt/EBITDA (x) 1.1 0.7 1.2 0.8 0.4 0.3 Change in debt 1,100 637 1,312 -900 -1,172 -597
Net Interest Cover (x) NM NM 56.7 37.3 76.7 191.1 Dividends -325 -516 -635 -704 -1,058 -957
Returns Other -8 -460 500 113 - -
ROE (%) 31% 31% 26% 28% 28% 22% Financing cash flow 766 -339 177 -1,716 -2,230 -1,554
ROACE (%) 21% 25% 19% 21% 22% 18% Effect of Forex -3 2 -63 71 - -
ROA (%) 17% 18% 17% 18% 21% 18% Increase (decrease) in cash flow -42 407 -210 -391 0 0

Russian Oil & Gas
18
Rosneft – Financial and Operational Summary
Source: Company data, FactSet, BCS
Key price assumptions 2010 2011 2012 2013e 2014e 2015e Market statistics
Crude oil ($/bbl) Share Price ($) 8.08
Brent 80 111 112 108 103 97 Market Cap ($mn) 85,632
Urals 77 109 110 107 102 97 EV ($mn) 145,890
Domestic (Samara) 36 49 50 49 48 47
Crack spreads ($/bbl) Income Statement ($mn) 2010 2011 2012 2013e 2014e 2015e
Gasoline 16 17 23 21 20 21 Revenue 63,208 92,465 99,161 140,815 148,616 144,668
Diesel 12 17 19 18 16 16 Opex -4,743 -6,430 -7,088 -12,240 -14,125 -14,512
Jet fuel 15 22 23 22 21 21 Purchased oil -2,372 -10,138 -11,952 -11,068 -9,986 -9,547
Fuel oil -21 -30 -26 -32 -30 -26 Taxes other than income tax -10,903 -16,942 -20,779 -32,230 -35,062 -35,415
Gas, domestic Excise and export duties -16,765 -26,875 -29,027 -42,270 -44,159 -42,567
$/mcm 82 98 99 110 116 118 Other operating costs -9,124 -9,560 -10,696 -16,043 -17,605 -18,100
$/mcf 2.3 2.8 2.8 3.1 3.3 3.3 EBITDA 19,302 22,521 19,620 26,964 27,680 24,528
Depreciation 6,653 7,246 7,313 10,654 11,712 12,528
Macro assumptions 2010 2011 2012 2013e 2014e 2015e Operating income 12,648 15,275 12,307 16,311 15,969 11,999
USD/RUB 30.36 29.39 31.04 31.81 32.60 32.90 Finance expenses -33 34 290 -1,901 -2,546 -2,711
CPI 8.2% 6.0% 6.0% 6.1% 5.0% 5.0% Other expense/income -791 -1,531 1,482 -948 -561 -602
Pre-tax income 11,825 13,778 14,078 13,462 12,862 8,686
Production 2010 2011 2012 2013e 2014e 2015e Income taxes -1,910 -2,926 -3,061 -2,474 -2,572 -1,737
Crude oil Minority interest/other -264 -102 -32 0 0 0
annual output (mmt) 114 119 122 191 213 214 Net income 9,651 10,750 10,986 10,988 10,290 6,949
daily output (kbd) 2,276 2,375 2,439 3,812 4,254 4,276 Fully diluted EPS ($) 1.01 1.12 1.17 1.11 0.97 0.66
Refined products
annual output (mmt) 48 48 48 72 81 81 Balance sheet ($mn) 2010 2011 2012 2013e 2014e 2015e
daily output (kbd) 958 962 967 1,432 1,610 1,610 Cash 4,134 5,156 9,788 10,578 10,578 10,578
light product yield 57% 58% 58% 55% 55% 65% Inventories 2,116 3,914 4,387 5,866 5,642 5,754
Gas (bcm) 12.3 12.8 16.4 34.8 40.3 47.6 Accounts receivable 5,045 6,740 7,758 10,962 10,436 10,426
Other current assets 11,360 9,504 8,839 13,116 13,116 13,116
Reserves (PRMS) Total current assets 22,654 25,314 30,771 40,522 39,772 39,874
1P 2P 1P+2P 3P 1P+2P+3P Fixed assets 66,758 69,294 86,356 150,043 161,842 170,491
Oil (bn bbl) 18.3 9.8 28.2 8.9 37.1 Other non-current assets 8,723 10,281 13,291 25,100 25,100 25,100
Gas (bcm) 992 372 1,363 262 1,625 Total non-current assets 75,481 79,575 99,646 175,143 186,942 195,591
Total (bn boe) 24.2 12.0 36.2 10.4 46.6 Total assets 98,135 104,888 130,418 215,665 226,714 235,464
EV/Reserves ($/boe) 6.0 4.0 3.1 Short-term debt 5,436 4,721 4,681 18,357 22,350 26,482
Reserve life (years) 13 20 26 Accounts payable 3,678 5,622 6,973 12,742 12,255 12,497
Other current liabilities 2,344 2,516 3,241 5,503 5,503 5,503
Financial ratios 2010 2011 2012 2013e 2014e 2015e Total current liabilities 11,457 12,859 14,895 36,602 40,109 44,482
Valuation Long-term debt 17,869 18,512 27,400 57,415 57,415 57,415
P/E (x) 8.9 8.0 7.8 7.8 8.3 12.3 Other non-current liabilities 11,555 10,312 13,389 36,595 36,595 36,595
PEG (x) 18.4 NM NM NM NM NM Total non-current liabilities 29,424 28,823 40,788 94,011 94,011 94,011
P/B (x) 1.7 1.4 1.2 1.1 1.0 0.9 Total shareholders' equity 57,254 63,206 74,735 85,052 92,594 96,971
EV/EBITDA (x) 7.6 6.5 7.4 5.4 5.3 5.9 Total liabilities and equity 98,135 104,888 130,418 215,665 226,714 235,464
EV/DACF (x) 9.0 6.8 7.4 5.7 6.1 6.7
Dividend yield (%) 1.1% 3.0% 3.2% 3.2% 3.0% 2.0% Cash flow statement ($mn) 2010 2011 2012 2013e 2014e 2015e
FCF Yield (%) 8.8% 9.5% 5.8% 11.2% 1.4% 1.3% Net income 9,914 10,852 11,018 10,988 10,290 6,949
Profitability Depreciation 6,653 7,246 7,313 10,654 11,712 12,528
EBITDA Margin (%) 31% 24% 20% 19% 19% 17% Changes in working capital -494 -2,654 966 6,833 264 140
EBIT Margin (%) 20% 17% 12% 12% 11% 8% Other -329 3,300 1,675 2,322 - -
Net Margin (%) 15% 12% 11% 8% 7% 5% Operating cash flow 15,744 18,745 20,973 30,797 22,265 19,618
Leverage Capex -8,696 -13,302 -15,013 -20,977 -23,511 -21,177
Gross Debt/Equity (x) 0.4 0.4 0.4 0.9 0.9 0.9 Acquisitions -3,162 987 -193 -4,041 - -
Net Debt/Equity (x) 0.2 0.2 0.3 0.7 0.7 0.7 Other -626 -1,157 838 3 - -
Gross Debt/EBITDA (x) 1.2 1.0 1.6 2.8 2.9 3.4 Investing cash flow -12,484 -13,472 -14,368 -25,016 -23,511 -21,177
Net Debt/EBITDA (x) 0.6 0.6 1.0 2.2 2.3 2.8 Change in debt 296 306 7,893 37,936 3,993 4,132
Net Interest Cover (x) 384.0 NM NM 8.6 6.3 4.4 Dividends -725 -919 -2,287 -2,403 -2,747 -2,572
Returns Other -696 -3,707 -7,288 -40,943 - -
ROE (%) 19% 18% 16% 14% 12% 7% Financing cash flow -1,124 -4,319 -1,682 -5,410 1,246 1,559
ROACE (%) 15% 16% 10% 9% 8% 6% Effect of Forex 0 68 -290 418 - -
ROA (%) 11% 11% 9% 6% 5% 3% Increase (decrease) in cash flow 2,137 1,022 4,632 790 0 0

Russian Oil & Gas
19
Gazprom – Financial and Operational Summary
Source: Company data, FactSet, BCS
Key price assumptions 2010 2011 2012 2013e 2014e 2015e Market statistics
Gas ($/mcm) Share Price ($) 9.08
Domestic 76 90 93 100 106 108 Market Cap ($mn) 104,182
Europe 302 383 385 377 362 343 EV ($mn) 144,472
FSU 232 290 305 304 291 280
Crude oil ($/bbl) Income Statement ($mn) 2010 2011 2012 2013e 2014e 2015e
Brent 80 111 112 108 103 97 Revenue 118,912 157,494 153,761 154,655 152,410 150,232
Urals 77 109 110 107 102 97 Transportation -9,021 -9,539 -10,318 -11,465 -12,309 -12,746
Domestic (Samara) 36 49 50 49 48 47 Taxes other than income tax -9,617 -14,244 -18,672 -20,436 -22,835 -23,848
Other operating costs -55,226 -68,137 -72,413 -66,753 -65,112 -64,117
Macro assumptions 2010 2011 2012 2013e 2014e 2015e EBITDA 45,047 65,574 52,358 56,001 52,156 49,521
USD/RUB 30.36 29.39 31.04 31.81 32.60 32.90 Depreciation 8,243 9,365 10,767 13,827 15,352 16,881
CPI 8.2% 6.0% 6.0% 6.1% 5.0% 5.0% Operating income 36,804 56,209 41,591 42,175 36,804 32,640
Finance expenses -595 -441 -348 -47 -58 -156
Production 2010 2011 2012 2013e 2014e 2015e Other expense/income 5,960 1,203 7,572 23 2,997 2,979
Natural gas (bcm) 509 510 481 481 488 499 Pre-tax income 42,168 56,971 48,815 42,150 39,743 35,463
Liquids (mmboe) 43 46 48 47 50 50 Income taxes -8,222 -9,473 -8,933 -5,429 -7,949 -7,093
Minority interest/other -1,878 -3,142 -1,702 -3,770 -607 -542
Gas deliveries 2010 2011 2012 2013e 2014e 2015e Net income 32,068 44,356 38,180 32,952 31,187 27,828
Domestic (bcm) 277 281 265 255 249 252 Fully diluted EPS ($) 2.79 3.87 3.33 2.87 2.72 2.43
FSU (bcm) 70 82 66 58 61 62
Non-FSU (bcm) 148 157 151 160 162 165 Balance sheet ($mn) 2010 2011 2012 2013e 2014e 2015e
Cash 14,347 15,572 13,734 18,431 18,431 18,431
Domestic market share 67% 70% 67% 65% 63% 63% Inventories 10,602 12,658 15,043 12,663 12,844 12,837
European market share 23% 27% 25% 28% 28% 29% Accounts receivable 24,669 24,352 30,775 27,453 28,058 27,913
Other current assets 11,115 17,001 19,300 18,719 18,719 18,719
Reserves (PRMS) Total current assets 60,733 69,583 78,851 77,266 78,051 77,899
1P 2P 1P+2P Fixed assets 178,578 208,677 255,938 279,378 308,917 336,927
Gas (bcm) 19,100 4,300 23,400 Other non-current assets 61,312 60,313 60,266 51,653 51,653 51,653
Liquids (mmbbl) 10,599 5,310 15,909 Total non-current assets 239,889 268,989 316,204 331,031 360,570 388,580
Oil and Gas (bn boe) 135.5 33.4 168.9 Total assets 300,623 338,572 395,055 408,296 438,621 466,479
EV/Reserves ($/boe) 1.1 0.9 Short-term debt 6,212 11,395 10,698 11,026 14,120 21,420
Reserve life (years) 44 55 Accounts payable 26,697 29,270 38,072 26,493 26,871 26,856
Other current liabilities 7 - - - - -
Financial ratios 2010 2011 2012 2013e 2014e 2015e Total current liabilities 32,916 40,665 48,770 37,519 40,992 48,276
Valuation Long-term debt 36,598 36,442 38,560 40,188 40,188 40,188
P/E (x) 3.2 2.3 2.7 3.2 3.3 3.7 Other non-current liabilities 18,357 20,411 22,892 29,233 29,233 29,233
PEG (x) 11.1 6.1 NM NM NM NM Total non-current liabilities 54,955 56,853 61,452 69,421 69,421 69,421
P/B (x) 0.5 0.5 0.4 0.4 0.3 0.3 Minority interest 9,329 9,238 10,127 9,970 10,577 11,119
EV/EBITDA (x) 3.2 2.2 2.8 2.6 2.8 2.9 Total shareholders' equity 203,423 231,816 274,706 291,387 317,632 337,663
EV/DACF (x) 3.6 2.5 3.2 2.9 3.1 3.2 Total liabilities and equity 300,623 338,572 395,055 408,296 438,621 466,479
Dividend yield (%) 2.8% 6.9% 4.5% 4.7% 7.5% 6.7%
FCF Yield (%) 11.4% 0.8% 1.1% 4.0% -0.5% -1.7% Cash flow statement ($mn) 2010 2011 2012 2013e 2014e 2015e
Profitability Net income 32,068 44,356 38,180 32,952 31,187 27,828
EBITDA Margin (%) 38% 42% 34% 36% 34% 33% Depreciation 8,243 9,365 10,767 13,827 15,352 16,881
EBIT Margin (%) 31% 36% 27% 27% 24% 22% Changes in working capital 8,356 -1,099 1,054 1,537 -407 137
Net Margin (%) 27% 28% 25% 21% 20% 19% Other -375 2,634 -3,411 3,562 607 542
Leverage Operating cash flow 48,293 55,256 46,590 51,877 46,739 45,389
Gross Debt/Equity (x) 0.2 0.2 0.2 0.2 0.2 0.2 Capex -36,393 -54,404 -45,418 -45,499 -44,891 -44,891
Net Debt/Equity (x) 0.1 0.1 0.1 0.1 0.1 0.1 Other 1,784 208 4,473 761.51 - -
Gross Debt/EBITDA (x) 1.0 0.7 0.9 0.9 1.0 1.2 Investing cash flow -34,609 -54,196 -40,945 -44,738 -44,891 -44,891
Net Debt/EBITDA (x) 0.6 0.5 0.7 0.6 0.7 0.9 Change in debt -7,013 10,435 -1,935 4,037 3,095 7,299
Net Interest Cover (x) 61.8 127.5 119.7 895.5 639.5 209.1 Dividends -1,808 -3,211 -6,158 -4,722 -4,943 -7,797
Returns Other 1,844 -6,382 49 -1,476 - -
ROE (%) 17% 20% 15% 12% 10% 8% Financing cash flow -6,977 841 -8,044 -2,162 -1,848 -497
ROACE (%) 13% 19% 12% 11% 9% 7% Effect of Forex -619 -677 561 -280 - -
ROA (%) 11% 14% 10% 8% 7% 6% Increase (decrease) in cash flow 6,088 1,224 -1,838 4,697 (0) 0

Russian Oil & Gas
20
Surgutneftegas – Financial and Operational Summary
Source: Company data, FactSet, BCS
Key price assumptions 2010 2011 2012 2013e 2014e 2015e Market statistics
Crude oil ($/bbl) Share Price (ordinary) ($) 8.61
Brent 80 111 112 108 103 97 Share Price (preferred) ($) 0.73
Urals 77 109 110 107 102 97 Market Cap ($mn) 30,760
Domestic (Samara) 36 49 50 49 48 47 EV ($mn) 4,677
Crack spreads ($/bbl)
Gasoline 16 17 23 21 20 21 Income Statement ($mn) 2011 2012 2013e 2014e 2015e
Diesel 12 17 19 18 16 16 Revenue 41,148 42,118 40,597 38,900 36,589
Jet fuel 15 22 23 22 21 21 Opex -8,532 -9,381 -8,601 -8,593 -8,539
Fuel oil -21 -30 -26 -32 -30 -26 Taxes other than income tax -8,458 -8,959 -8,790 -8,516 -8,111
Gas, domestic Excise and export duties -14,096 -14,748 -15,097 -13,675 -12,858
$/mcm 82 98 99 110 116 118 Other operating costs -32 -78 -75 -77 -80
$/mcf 2.3 2.8 2.8 3.1 3.3 3.3 EBITDA 10,030 8,953 8,034 8,040 7,002
Depreciation -1,372 -1,525 -1,760 -2,021 -2,342
Macro assumptions 2010 2011 2012 2013e 2014e 2015e Operating income 8,658 7,428 6,274 6,019 4,659
USD/RUB 30.36 29.39 31.04 31.81 32.60 32.90 Finance expenses 985 1,420 1,539 1,529 1,497
CPI 8.2% 6.0% 6.0% 6.1% 5.0% 5.0% Other expense/income 2,051 -1,641 2,208 279 272
Pre-tax income 11,695 7,206 10,021 7,827 6,429
Production 2010 2011 2012 2013e 2014e 2015e Income taxes -2,340 -1,403 -1,851 -1,565 -1,286
Crude oil Net income 9,355 5,803 8,169 6,262 5,143
annual output (mmt) 59 61 61 61 61 60 Fully diluted EPS ($) 2.62 1.62 2.29 1.75 1.44
daily output (kbd) 1,187 1,216 1,225 1,222 1,221 1,200
Refined products Balance sheet ($mn) 2011 2012 2013e 2014e 2015e
annual output (mmt) 20 20 20 19 20 20 Cash and investments 12,416 12,085 7,471 7,055 6,176
daily output (kbd) 406 406 395 378 392 392 Inventories 1,388 1,720 1,705 1,639 1,618
light product yield 41% 40% 41% 45% 56% 56% Accounts receivable 2,557 2,610 2,516 2,393 2,287
Gas (bcm) 13.9 13.2 12.4 12.3 12.3 12.1 Other current assets 1,384 1,556 1,147 1,147 1,147
Total current assets 17,744 17,971 12,839 12,235 11,228
Reserves (PRMS) Fixed assets 25,162 30,132 33,136 38,786 44,024
1P Other non-current assets 15,984 19,690 24,221 24,221 24,221
Oil (bn bbl) 6.7 Total non-current assets 41,146 49,823 57,357 63,007 68,244
Gas (bcm) 334 Total assets 58,891 67,794 70,197 75,241 79,473
Total (bn boe) 8.8 Short-term debt - - - - -
EV/Reserves ($/bbl) 0.5 Accounts payable 1,061 1,201 1,191 1,145 1,130
Reserve life (years) 17 Other current liabilities 2,124 2,011 2,096 2,096 2,096
Total current liabilities 3,185 3,212 3,287 3,240 3,226
Financial ratios 2010 2011 2012 2013e 2014e 2015e Long-term debt - - - - -
Valuation Other non-current liabilities 3,805 5,227 5,431 5,431 5,431
P/E (x) 3.3 5.3 3.8 4.9 6.0 Total non-current liabilities 3,805 5,227 5,431 5,431 5,431
PEG (x) NM 9.2 NM NM Total shareholders' equity 51,901 59,355 61,479 66,570 70,816
P/B (x) 0.6 0.6 0.5 0.5 0.4 Total liabilities and equity 58,891 67,794 70,197 75,241 79,473
EV/EBITDA (x) 0.5 0.5 0.6 0.6 0.7
EV/DACF (x) 0.6 0.7 0.7 0.7 0.7 Cash flow statement ($mn) 2011 2012 2013e 2014e 2015e
Dividend yield (ordinary) (%) 1.9% 2.4% 1.9% 2.1% 1.6% 1.3% Net income 9,355 5,803 8,169 6,262 5,143
Dividend yield (preferred) (%) 5.3% 10.0% 6.5% 9.2% 7.1% 5.8% Depreciation 1,372 1,525 1,760 2,021 2,342
FCF Yield (%) 10.4% 11.3% -3.4% -2.2% -4.5% Changes in working capital -692 -38 -895 143 112
Profitability Other -1,873 729 -2,097 - (0.00)
EBITDA Margin (%) 24% 21% 20% 21% 19% Operating cash flow 8,161 8,019 6,937 8,425 7,598
EBIT Margin (%) 21% 18% 15% 15% 13% Capex -4,285 -4,501 -6,917 -7,670 -7,580
Net Margin (%) 23% 14% 20% 16% 14% Other -2,997 -1,734 -799 - -
Returns Investing cash flow -7,282 -6,234 -7,716 -7,670 -7,580
ROE (%) 18% 10% 14% 10% 7% Change in debt - - - - -
ROACE (%) 27% 22% 17% 14% 9% Dividends -924 -1,217 -943 -1,171 -897
ROA (%) 16% 9% 12% 9% 7% Other -173 235 33 - -
Financing cash flow -1,096 -981 -910 -1,171 -897
Effect of Forex 13 -53 13 - -
Increase (decrease) in cash flow -204 751 -1,676 -415 -879

Russian Oil & Gas
21
Tatneft – Financial and Operational Summary
Source: Company data, FactSet, BCS
Key price assumptions 2010 2011 2012 2013e 2014e 2015e Market statistics
Crude oil ($/bbl) Share Price (ords) ($/GDR) 38.99
Brent 80 111 112 108 103 97 Share Price (prefs) ($/share) 3.51
Urals 77 109 110 107 102 97 Market Cap ($mn) 13,775
Domestic (Samara) 36 49 50 49 48 47 EV ($mn) 15,740
Crack spreads ($/bbl)
Gasoline 16 17 23 21 20 21 Income Statement ($mn) 2010 2011 2012 2013e 2014e 2015e
Diesel 12 17 19 18 16 16 Revenue 10,697 14,196 14,299 13,914 13,965 13,382
Jet fuel 15 22 23 22 21 21 Opex -2,211 -2,683 -2,786 -2,686 -2,876 -2,900
Fuel oil -21 -30 -26 -32 -30 -26 Purchased oil -1,831 -2,513 -1,735 -1,610 -1,509 -1,461
Gas, domestic Taxes other than income tax -2,398 -3,424 -3,424 -3,543 -3,515 -3,456
$/mcm 82 98 99 110 116 118 Other operating costs -1,730 -2,085 -2,503 -2,520 -2,559 -2,555
EBITDA 2,528 3,491 3,850 3,555 3,506 3,010
Macro assumptions 2010 2011 2012 2013e 2014e 2015e Depreciation 411 406 572 604 660 723
USD/RUB 30.36 29.39 31.04 31.81 32.60 32.90 Operating income 2,117 3,084 3,279 2,951 2,845 2,287
CPI 8.2% 6.0% 6.0% 6.1% 5.0% 5.0% Finance expenses 108 58 -100 -46 13 37
Other expense/income -90 -213 107 -9 -6 -6
Production 2010 2011 2012 2013e 2014e 2015e Pre-tax income 2,135 2,930 3,286 2,896 2,852 2,318
Crude oil Income taxes -458 -749 -754 -614 -570 -464
annual output (mmt) 26 26 26 26 26 26 Minority interest/dividends -132 -87 -160 -135 -135 -133
daily output (kbd) 522 524 525 526 526 516 Net income 1,545 2,094 2,372 2,148 2,146 1,721
Refined products Fully diluted EPS ($) 4.38 5.94 6.73 6.09 6.09 4.88
annual output (mmt) 0.5 2.3 7.2 7.3 7.1 7.1
daily output (kbd) 10 45 143 145 142 142 Balance sheet ($mn) 2010 2011 2012 2013e 2014e 2015e
light product yield 35% 30% 30% 36% 54% 54% Cash 263 529 428 1,024 1,507 1,922
Gas (bcm) 0.8 0.9 0.9 0.9 0.9 0.9 Inventories 493 784 936 1,034 941 953
Accounts receivable 2,272 2,350 1,753 1,724 1,668 1,631
Reserves (PRMS) Other current assets 1,287 1,169 1,477 1,276 1,541 1,522
1P 2P 1P+2P 3P 1P+2P+3P Total current assets 4,315 4,833 4,594 5,057 5,657 6,028
Oil (bn bbl) 6.2 2.2 8.4 0.2 8.6 Fixed assets 12,817 13,380 14,695 14,896 16,370 17,796
Gas (bcm) 35 13 47 0 48 Other non-current assets 1,329 1,287 1,354 1,212 1,212 1,212
Total (bn boe) 6.4 2.3 8.7 0.2 8.9 Total non-current assets 14,147 14,667 16,049 16,108 17,582 19,008
EV/Reserves ($/boe) 2.5 1.8 1.8 Total assets 18,461 19,500 20,643 21,165 23,239 25,036
Reserve life (years) 32 44 45 Short-term debt 1,118 1,265 1,051 1,251 1,251 1,251
Accounts payable 1,513 1,750 1,455 2,177 2,052 2,070
Financial ratios 2010 2011 2012 2013e 2014e 2015e Other current liabilities 1 - - - - -
Valuation Total current liabilities 2,631 3,015 2,506 3,428 3,303 3,321
P/E (x) 8.9 6.6 5.8 6.4 6.4 8.0 Long-term debt 2,442 1,919 1,244 885 1,385 1,777
PEG (x) NM 18.5 43.8 NM NM NM Other non-current liabilities 2,367 2,479 2,819 2,781 2,917 3,050
P/B (x) 1.3 1.2 1.1 1.0 0.9 0.8 Total non-current liabilities 4,809 4,398 4,063 3,666 4,302 4,827
EV/EBITDA (x) 6.2 4.5 4.1 4.4 4.5 5.2 Total shareholders' equity 11,021 12,087 14,075 14,071 15,634 16,888
EV/DACF (x) 8.0 6.1 4.6 5.4 5.3 6.2 Total liabilities and equity 18,461 19,500 20,643 21,165 23,239 25,036
Dividend yield (ords) (%) 2.5% 3.8% 4.4% 4.0% 4.0% 3.2%
Dividend yield (prefs) (%) 4.7% 6.9% 7.9% 7.3% 7.3% 5.9% Cash flow statement ($mn) 2010 2011 2012 2013e 2014e 2015e
FCF Yield (%) NM 6.5% 12.1% 6.7% 5.9% 3.1% Net income 1,545 2,094 2,372 2,148 2,146 1,721
Profitability Depreciation 411 406 572 604 660 723
EBITDA Margin (%) 24% 25% 27% 26% 25% 22% Changes in working capital -153 173 -330 509 -242 63
EBIT Margin (%) 20% 22% 23% 21% 20% 17% Other 38 70 306 69 135 133
Net Margin (%) 14% 15% 17% 15% 15% 13% Operating cash flow 1,840 2,744 2,920 3,330 2,701 2,640
Leverage Capex -2,543 -1,674 -1,578 -1,899 -2,134 -2,149
Gross Debt/Equity (x) 0.3 0.3 0.2 0.2 0.2 0.2 Acquisitions -3 24 -12 11 - -
Net Debt/Equity (x) 0.3 0.2 0.1 0.1 0.1 0.1 Other 400 38 28 -87 - -
Gross Debt/EBITDA (x) 1.4 0.9 0.6 0.6 0.8 1.0 Investing cash flow -2,145 -1,612 -1,563 -1,975 -2,134 -2,149
Net Debt/EBITDA (x) 1.3 0.8 0.5 0.3 0.3 0.4 Change in debt 654 -428 -940 -109 500 392
Returns Dividends -492 -388 -518 -607 -583 -468
ROE (%) 15% 18% 18% 15% 14% 11% Other -18 -50 0 -44 - -
ROACE (%) 12% 16% 16% 15% 14% 11% Financing cash flow 143 -865 -1,458 -760 -83 -76
ROA (%) 9% 11% 12% 10% 10% 7% Increase (decrease) in cash flow -162 266 -101 595 483 415

Russian Oil & Gas
22
Alliance Oil – Financial and Operational Summary
Source: Company data, FactSet, BCS
Key price assumptions 2010 2011 2012 2013e 2014e 2015e Market statistics
Crude oil ($/bbl) Share Price (common) (SEK/share) 52.95
Brent 80 111 112 108 103 97 Share Price (preferred) (SEK/share) 300.00 A
Urals 77 109 110 107 102 97 Market Cap ($mn) 1,414
Domestic (Samara) 36 49 50 49 48 47 EV ($mn) 3,734
Crack spreads ($/bbl)
Gasoline 16 17 23 21 20 21 Income Statement ($mn) 2010 2011 2012 2013e 2014e 2015e
Diesel 12 17 19 18 16 16 Revenue 2,196 3,083 3,445 3,627 3,716 3,749
Jet fuel 15 22 23 22 21 21 Opex -135 -193 -197 -235 -232 -237
Fuel oil -21 -30 -26 -32 -30 -26 Purchased oil -656 -929 -1,141 -1,241 -1,333 -1,254
Gas, domestic Taxes other than income tax -251 -360 -385 -329 -272 -274
$/mcm 82 98 99 110 116 118 Other operating costs -714 -913 -935 -1,151 -1,038 -1,040
$/mcf 2.3 2.8 2.8 3.1 3.3 3.3 EBITDA 440 687 787 671 840 945
Depreciation 132 174 192 240 255 262
Macro assumptions 2010 2011 2012 2013e 2014e 2015e Operating income 307 513 595 431 585 682
USD/RUB 30.36 29.39 31.04 31.81 32.60 32.90 Finance expenses -22 -47 -80 -112 -118 -106
CPI 8.2% 6.0% 6.0% 6.1% 5.0% 5.0% Other expense/income 4 -34 29 -8 8 7
Pre-tax income 290 433 544 311 476 583
Production 2010 2011 2012 2013e 2014e 2015e Income taxes -63 -104 -124 -77 -95 -117
Crude oil Minority interest/dividends -4 - -18 -52 -60 -56
annual output (mn tonnes) 2.2 2.4 2.7 2.7 2.7 2.9 Net income 222 328 403 182 321 410
daily output (kbd) 44 49 54 54 54 58 Fully diluted EPS ($) 1.30 1.91 2.35 1.06 1.87 2.39
Gas
annual output (mmcm) 611 837 837 Balance sheet ($mn) 2010 2011 2012 2013e 2014e 2015e
daily output (kboed) 11 15 15 Cash 178 188 412 398 398 398
Refined products Inventories 141 145 228 223 204 198
annual output (mn tonnes) 3.1 3.5 3.7 4.1 4.5 4.5 Accounts receivable 215 240 278 366 369 365
daily output (kbd) 62 70 75 83 91 91 Other current assets 195 330 360 290 290 290
light product yield 60% 58% 53% 50% 57% 63% Total current assets 730 902 1,277 1,278 1,261 1,251
Fixed assets 2,528 3,224 4,475 4,717 4,950 5,026
Reserves (PRMS) Other non-current assets 89 99 240 238 238 238
1P 2P 1P+2P 3P 1P+2P+3P Total non-current assets 2,618 3,323 4,715 4,955 5,188 5,264
Oil (bn bbl) 0.3 0.4 0.7 0.5 1.2 Total assets 3,347 4,225 5,992 6,233 6,450 6,515
EV/Reserves ($/bbl) 11.3 5.1 3.1 Short-term debt 127 107 402 610 517 162
Reserve life (years) 14 31 51 Accounts payable 309 393 509 439 401 389
Other current liabilities - - 6 9 9 9
Financial ratios 2010 2011 2012 2013e 2014e 2015e Total current liabilities 436 500 917 1,058 927 560
Valuation Long-term debt 912 1,514 1,669 1,775 1,775 1,775
P/E (x) 6.4 4.3 3.5 7.8 4.4 3.4 Other non-current liabilities 194 217 373 338 338 338
PEG (x) NM 9.0 15.5 NM 5.8 12.4 Total non-current liabilities 1,106 1,731 2,042 2,113 2,113 2,113
P/B (x) 0.8 0.7 0.6 0.5 0.4 0.4 Total shareholders' equity 1,805 1,993 3,033 3,062 3,409 3,842
EV/EBITDA (x) 8.5 5.4 4.7 5.6 4.4 4.0 Total liabilities and equity 3,347 4,225 5,992 6,233 6,450 6,515
EV/DACF (x) 9.4 6.0 4.2 6.2 5.1 4.6
FCF Yield (%) NM NM NM NM 15.1% 33.1% Cash flow statement ($mn) 2010 2011 2012 2013e 2014e 2015e
Profitability Profit before tax 307 433 544 311 476 583
EBITDA Margin (%) 20% 22% 23% 18% 23% 25% Depreciation 132 174 192 240 255 262
EBIT Margin (%) 14% 17% 17% 12% 16% 18% Changes in working capital -176 -118 -245 -74 -21 -2
Net Margin (%) 10% 11% 12% 5% 9% 11% Other -60 -26 78 -34 -95 -117
Leverage Operating cash flow 204 463 570 443 615 727
Gross Debt/Equity (x) 0.6 0.8 0.7 0.8 0.7 0.5 Capex -605 -1,020 -729 -761 -488 -338
Net Debt/Equity (x) 0.5 0.7 0.5 0.6 0.6 0.4 Acquisitions - -1 - - - -
Gross Debt/EBITDA (x) 2.4 2.4 2.6 3.6 2.7 2.1 Other -105 -50 -234 -6 - -
Net Debt/EBITDA (x) 2.0 2.1 2.1 3.0 2.3 1.6 Investing cash flow -709 -1,071 -963 -768 -488 -338
Returns Change in debt 306 632 291 362 -93 -355
ROE (%) 12% 17% 16% 6% 10% 11% Dividends 0 - - -28 -34 -34
ROACE (%) 11% 13% 12% 7% 9% 10% Other - -2 317 4 - -
ROA (%) 7% 9% 8% 3% 5% 6% Financing cash flow 306 631 608 337 -127 -389
FX effects -15 -13 9 -26 - -
Increase (decrease) in cash flow -214 10 224 -14 0 0

Russian Oil & Gas
23
Transneft – Financial and Operational Summary
Source: Company data, FactSet, BCS
Market statistics Income Statement ($mn) 2010 2011 2012 2013e 2014e 2015e
Share Price (Rb/share) 83,786 Revenue 14,741 22,802 23,594 23,886 23,741 24,280
Opex -5,651 -6,536 -6,428 -5,929 -6,258 -6,543
Macro assumptions 2010 2011 2012 2013e 2014e 2015e Cost of oil sold -252 -2,843 -2,905 -2,865 -2,850 -2,828
USD/RUB 30.36 29.39 31.04 31.81 32.60 32.90 Export custom duties -2,276 -2,433 -2,339 -2,172 -1,970
CPI 8.2% 6.0% 6.0% 6.1% 5.0% 5.0% Other operating costs -969 -1,242 -1,391 -1,577 -1,564 -1,552
Tariff growth 11.8% 22.5% 1.5% 7.0% 0.0% 5.0% EBITDA 7,869 9,906 10,438 11,177 10,896 11,387
Depreciation 2,371 2,680 2,712 3,230 3,409 3,584
Production (mt) 2010 2011 2012 2013e 2014e 2015e Operating income 5,498 7,227 7,725 7,947 7,487 7,803
Crude oil Finance expenses -465 -414 -633 -713 -588 -411
Domestic 226 233 242 242 242 242 Other expense/income 155 1,200 467 -119 -53 -42
Exports/transit 240 238 239 239 241 241 Pre-tax income 5,188 8,013 7,559 7,115 6,847 7,350
Total 466 472 480 481 483 483 Income taxes -1,074 -1,507 -1,619 -1,434 -1,369 -1,470
% of Russian output 92% 92% 93% 92% 92% 92% Minority interest/dividends -207 -106 -125 -155 0 0
Pipeline length ('000 km) 50 51 54 54 54 54 Net income 3,907 6,399 5,815 5,526 5,477 5,880
Refined products Fully diluted EPS ($) 550 901 819 778 771 828
Domestic 9 9 9 10 10 10
Exports/transit 22 21 19 21 21 21 Balance sheet ($mn) 2010 2011 2012 2013e 2014e 2015e
Total 30 29 27 31 31 31 Cash 9,239 4,521 2,767 3,456 3,456 3,456
% of Russian output 16% 16% 14% 16% 16% 16% Inventories 562 699 839 960 861 878
Accounts receivable 863 1,127 1,303 1,340 1,306 1,343
Financial ratios 2010 2011 2012 2013e 2014e 2015e Other current assets 2,848 7,409 10,204 10,669 10,669 10,669
Valuation Total current assets 13,513 13,756 15,113 16,424 16,292 16,345
P/E (x) 4.6 2.8 3.1 3.3 3.3 3.1 Fixed assets 39,526 41,729 47,602 47,652 50,404 52,479
PEG (x) NM 4.4 NM NM NM 41.8 Other non-current assets 720 2,230 2,658 2,785 2,785 2,785
P/B (x) 0.8 0.7 0.5 0.5 0.4 0.4 Total non-current assets 40,246 43,959 50,260 50,437 53,188 55,264
EV/EBITDA (x) 4.4 3.5 3.3 3.1 3.2 3.1 Total assets 53,759 57,715 65,372 66,861 69,480 71,610
Dividend yield (prefs) (%) 0.4% 0.9% 0.8% 0.8% 0.8% 0.9% Short-term debt 347 1,658 836 1,687 0 0
FCF Yield (%) NM NM 3.5% 20.0% 16.3% 20.4% Accounts payable 3,189 3,864 4,139 4,007 4,249 4,334
Profitability Other current liabilities 83 84 5 18 18 18
EBITDA Margin (%) 53% 43% 44% 47% 46% 47% Total current liabilities 3,618 5,606 4,980 5,713 4,267 4,352
EBIT Margin (%) 37% 32% 33% 33% 32% 32% Long-term debt 18,655 17,143 17,811 16,181 15,065 11,529
Net Margin (%) 27% 28% 25% 23% 23% 24% Other non-current liabilities 6,336 5,166 5,398 5,151 5,151 5,151
Leverage Total non-current liabilities 24,992 22,309 23,210 21,333 20,217 16,680
Gross Debt/Equity (x) 0.8 0.6 0.5 0.4 0.3 0.2 Total shareholders' equity 25,149 29,801 37,183 39,816 45,144 50,877
Net Debt/Equity (x) 0.4 0.5 0.4 0.4 0.3 0.2 Total liabilities and equity 53,759 57,715 65,372 66,861 69,628 71,909
Gross Debt/EBITDA (x) 2.4 1.9 1.8 1.6 1.4 1.0
Net Debt/EBITDA (x) 1.2 1.4 1.5 1.3 1.1 0.7 Cash flow statement ($mn) 2010 2011 2012 2013e 2014e 2015e
Returns Net income 3,907 6,399 5,815 5,526 5,477 5,880
ROE (%) 17% 23% 17% 14% 13% 12% Depreciation 2,371 2,680 2,712 3,230 3,409 3,584
ROACE (%) 13% 15% 13% 12% 11% 11% Changes in working capital 658 274 -41 -290 374 32
ROA (%) 8% 11% 9% 8% 8% 8% Other -523 -3,515 -1,510 1,749 -148 -151
Operating cash flow 6,412 5,838 6,978 10,215 9,113 9,344
Capex -7,415 -7,128 -6,346 -6,610 -6,160 -5,660
Other 144 -3,498 -1,897 -2,026 - -
Investing cash flow -7,271 -10,626 -8,243 -8,636 -6,160 -5,660
Change in debt 1,038 -7 -393 -580 -2,803 -3,537
Dividends -47 -40 -89 -157 -149 -148
Other -172 -10 99 -270 - -
Financing cash flow 819 -57 -383 -1,007 -2,952 -3,684
Effect of Forex -101 126 -105 117 - -
Increase (decrease) in cash flow -141 -4,719 -1,754 689 0 0

Russian Oil & Gas
24
Risks to BCS theses
Buy
Lukoil (TP $75/GDR) Production decline in West Siberia accelerates;
CapEx to stabilize production rises above expectations, thus putting pressure on investment returns;
Lower than guided dividend growth due to insufficient FCF and refusal to borrow;
Execution problems (further ramp‐up of Uzbek gas production and Korchagina oil output) and/or project launch delay (Iraqi West Qurna‐2, Caspian Filanovskogo) implying lower than expected production, earnings and FCF growth.
Gazprom Neft (TP $25/GDR) Overpayment for oil license transfers from Gazprom (Prirazlomnoye license
transfer is pending; Gazprom spent over $4bn on the development and may require compensation for historical costs);
CapEx over‐run (refinery upgrade, greenfield development, brownfield production decline, Lakhta Center in St. Petersburg);
Continued production decline in West Siberia despite application of production enhancement technologies and rising CapEx.
Novatek (TP $145/GDR) Upward adjustments to the gas and condensate MET formula base rates;
Decline in refined product margins;
Yamal LNG: execution risk / CapEx over‐run / withdrawal of government support.
Bashneft (TP Rb2,100/share)
Unsustainable production flow rates at legacy fields;
Refinery upgrade CapEx over‐run;
Expensive M&A.
Hold
Rosneft (TP $8.30/GDR)
Positive risks Monetization of $12bn worth of operational synergies from the merger with
TNK‐BP;
Share purchase by senior management signaling confidence and commitment
Successful offshore field exploration results;
Value‐accretive asset / license / company acquisitions.
Negative risks Lack of CapEx discipline;
Greenfield project CapEx over‐run / launch delay.
Russian Oil & Gas
25
Gazprom (TP $9/GDR)
Positive risks Stated compliance with the 35% IFRS dividend payout requirement, a step that
the market may take as a signal of improving corporate governance;
Provision of clearer medium‐term CapEx guidance and adherence to the new investment program;
Clear targets for investment returns on numerous capital‐intensive projects, signaling the importance of efficiency and shareholder value creation.
Negative risks
Adherence to the current dividend policy (25% RAS payout) due to significant CapEx requirements;
Provision of a price discount to Ukraine and acquisition of an ownership stake in Ukrainian GTS;
Additional gas price discounts to European customers.
Sell
Alliance Oil (TP SEK 41/share) Earlier than expected (2H14) launch of upgraded refinery and connection to
ESPO;
Successful exploration in Timan Pechora (West‐Osoveisky block);
Guidance for earlier start of additional gas blocks (South Khadyryakhinsky, Kargasoksky);
Value‐accretive M&A.
Surgutneftegas (TP $8.50/GDR) Value‐accretive M&A;
West Siberian production rate stabilization;
Cash pile ensuring stability in a deteriorating market environment.
Tatneft (TP $40/GDR) Better control and efficiency over the investment program;
Bitumen project achieves a significantly larger scale and profitability;
Dividend payout rises above 30% RAS.
Transneft pref (TP Rb75,000/share) Adoption of IFRS‐based payout and introduction of a provision that dividends
on preferred shares cannot be less than that on common shares;
RAS profit increase (e.g., through the requirement that subsidiaries pay a certain dividend to their parent company, Kommersant, 25 April);
Management adopting a significant increase in dividends.

Russian Oil & Gas
26
Valuation methodology
Buy
Lukoil (TP $75/GDR): Base case price target is derived from a ten‐year DCF model, assuming a WACC of 10.2% and a zero real terminal growth rate.
Gazprom Neft (TP $25/GDR): Base case price target is derived from a ten‐year DCF model, assuming a WACC of 10.1% and a real terminal growth rate of ‐1%.
Novatek (TP $145/GDR): Base case price target is derived from a ten‐year DCF model, assuming a WACC of 10.2% and a real terminal growth rate of 0%.
Bashneft (TP Rb2,100/share): Base case price target is derived from a ten‐year DCF model, assuming a WACC of 10.7% and a real terminal growth rate of ‐1%.
Hold
Rosneft (TP $8.30/GDR): Base case price target is derived from a ten‐year DCF model, assuming a WACC of 9.2% and a real terminal growth rate of 1%.
Surgutneftegas pref (TP Rb24/share): Base case price target is calculated as a 15% discount to common share price target, a ratio reflecting a higher and more stable dividend.
Gazprom (TP $9/GDR): Base case price target is derived from a ten‐year DDM model, assuming a cost of equity of 12.6% and a zero real terminal growth rate.
Sell
Alliance Oil (TP SEK 41/share): Base case price target is derived from a ten‐year DCF model, assuming a WACC of 10.5% and a real terminal growth rate of ‐2%.
Surgutneftegas (TP $8.50/GDR): Base case price target is derived from a ten‐year DCF model, assuming a WACC of 12.6% and a real terminal growth rate of ‐2%.
Tatneft (TP $40/GDR): Base case price target is derived from a ten‐year DCF model, assuming a WACC of 10.4% and a real terminal growth rate of ‐2%.
Transneft pref (TP Rb75,000/share): target price is set on blended bear‐case, base‐case and bull‐case valuations (25%, 50% and 25% weightings, respectively), all derived from ten‐year DDM models, assuming a cost of equity of 12.6% and a zero real terminal growth rate. Bear case assumes no change in dividend policy. Bull case assumes transition to 35% IFRS payout from 2015 and an equal DPS for preferred and common shares. Base case assumes a gradual transition to 35% IFRS payout by 2017.

Research Department +7 (495) 785 5336
Head of Equity Research
Head of Fixed Income Research
Head of Production
Kirill Chuyko (ext. 4733) [email protected]
Leonid Ignatyev (ext. 4679) [email protected]
Mark S Bradford (ext. 4681) [email protected]
Equity Research
Fixed Income Research
Equity Strategy Kirill Chuyko (ext. 4733) [email protected]
Oil & Gas Timur Salikhov, CFA (ext. 4631) [email protected]
Electric Utilities / Telecoms Igor Goncharov (ext. 4622) [email protected]
Consumer / Retail Anna Kochkina (ext. 4660) [email protected]
Industrials / Transportation Igor Kraevskiy (ext. 7564) [email protected]
Financial Services Olga Naydenova (ext. 4734) [email protected]
Metals & Mining Kirill Chuyko (ext. 4733) [email protected]
Oleg Petropavlovskiy (ext. 4680) [email protected]
Media Mitch Mitchell (ext.7213) [email protected]
Market Analysis Mark S Bradford (ext. 4681) [email protected]
Leonid Ignatyev (ext. 4679) [email protected]
Dmitry Dorofeev (ext. 7166) [email protected]
Maria Radchenko (ext. 4678) [email protected]
Yulia Safarbakova (ext. 7507) [email protected]
Artem Usmanov (ext. 7429) [email protected]
Head of Russian Product Olga Sibiricheva (ext. 4618) [email protected]
Editing/Translation Mitch Mitchell (ext. 7213) [email protected]
Nikolay Porokhov (ext. 7511) [email protected]
Elena Kosovskaya (ext. 7467) [email protected]
Vladlen Garazha (ext. 7301) [email protected]
Technical Specialist Svetlana Fedorovykh (ext. 7334) [email protected]
Institutional Sales & Trading (Moscow) +7 (495) 785 5336 (ext. 4702)
Institutional Sales & Trading (London) +44 (207) 065 2022
Private Client Service +7 (495) 785 7475 (ext. 2123)
This research report is prepared by the Research Department of BrokerCreditService Ltd (hereinafter referred to as the Company) for information purposes only. Neither the information nor any opinion is intended to be, or should be construed as an offer, a recommendation or an invitation to make an offer, to buy or sell any financial instrument. This research constitutes neither investment advice nor tax advice and it does not take into account the specific investment objectives, risk appetite and financial situation of anyone who may receive this report. Investors should seek their own advice regarding the appropriateness of investing in any financial instrument or investment strategy discussed or recommended in this report.
Investors should note that any income derived from investments in financial instruments may fluctuate and that the price or value of securities and investments may rise or fall. Accordingly, investors may lose their investment or receive back less than originally invested. Past performance is not a guide to future performance. Foreign currency exchange rates may adversely affect the value, price or income of any security or related investment mentioned in this report. In addition, there may be currency risk if investing in securities such as ADRs or GDRs. Investing in the Russian economy and Russian securities involves a high degree of risk and requires appropriate knowledge and experience.
The information and opinions have been obtained from public sources that are believed to be reliable, but no representation or warranty is made by the Company with regard to accuracy. The opinions contained herein reflect the current judgments of research analysts and are subject to change without prior notice. All of the above considered, this report should not be viewed as the only source of information, and the Company, nor its affiliates or employees accept any responsibility or liability whatsoever for any direct or indirect damage arising out of or in any way connected with the use of information contained herein, nor for its authenticity.
Investors should note that the Company and/or its affiliates may have or have had positions or derivative positions in the securities or other instruments referred to herein or make or have made a market or otherwise act or have acted as principal in transactions in any of these securities or instruments or may provide or have provided investment banking or consulting services to or serve or have served as a director or a supervisory board member of a company being reported on herein.
The Company operates in the Russian Federation. This report can be used by investors on the territory of the Russian Federation subject to Russian law. The use of the report outside the Russian Federation is subject to the laws of the respective country. For distribution within the UK, this research report is intended only for eligible counterparties or professional clients (as defined in the FSA Rules) and should not be communicated to retail clients.
This report may not be distributed, copied, reproduced or changed without prior written consent from the Company. Further information may be obtained from the Company upon request.
© 2013 BrokerCreditService Ltd. All rights protected and reserved.