Embed Size (px)
Citation preview
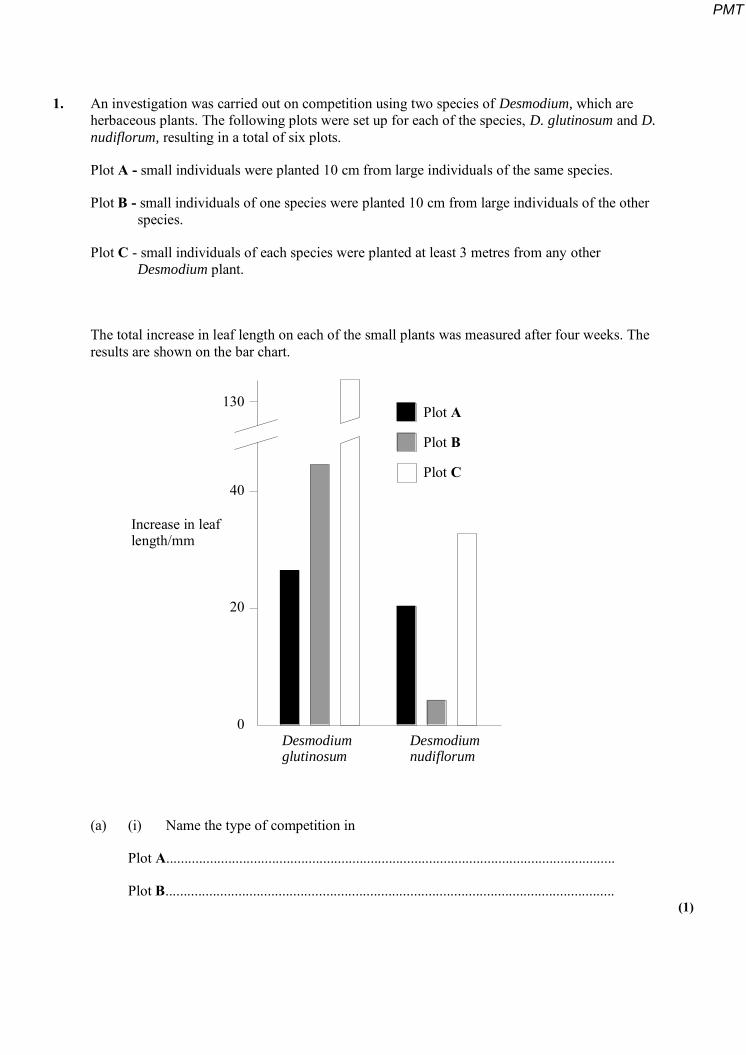
1. An investigation was carried out on competition using two species of Desmodium, which are herbaceous plants. The following plots were set up for each of the species, D. glutinosum and D.
nudiflorum, resulting in a total of six plots.
Plot A - small individuals were planted 10 cm from large individuals of the same species.
Plot B - small individuals of one species were planted 10 cm from large individuals of the other species.
Plot C - small individuals of each species were planted at least 3 metres from any other Desmodium plant.
The total increase in leaf length on each of the small plants was measured after four weeks. The results are shown on the bar chart.
130
40
20
0Desmodiumglutinosum
Desmodiumnudiflorum
Increase in leaflength/mm
Plot
Plot
Plot
A
B
C
(a) (i) Name the type of competition in
Plot A...........................................................................................................................
Plot B........................................................................................................................... (1)
PMT

(ii) Explain how plot C was used as a control.
...........................................................................................................................
........................................................................................................................... (1)
(b) Use the bar chart to explain how competition affects the growth of these two species.
............................................................................................................................. ........
.......................................................................................................................... ...........
............................................................................................................................. ........
.....................................................................................................................................
............................................................................................................................. ........
.....................................................................................................................................
............................................................................................................................. ........
..................................................................................................................................... (3)
(Total 5 marks)
2. The effect of grazing by sheep on the growth and reproduction of heather was investigated. Two areas of moorland were cleared of plants and re-planted with heather seeds. One area was surrounded by a sheep-proof fence, the other was left unfenced. The table shows various measurements of the heather plants taken from these two areas.
Measurement Date Fenced area Unfenced area
Total number of heather seedlings per square metre
Sept 1980 April 1981
110 95
132 73
Percentage cover of heather plants
Aug 1992 Aug1993
26.7 42.3
6.2 21.5
Mean number of flower-heads per 0.1 m2 quadrat
Oct 1993 263 50
Mean number of seeds per flower-head
Nov 1993 36.7 25.8
PMT

(a) Describe how the percentage cover of heather plants on an area of moorland may be measured.
............................................................................................................................. ........
.....................................................................................................................................
............................................................................................................................. ........
.....................................................................................................................................
............................................................................................................................. ........
..................................................................................................................................... (3)
(b) Use information in the table to
(i) describe the effect of grazing by sheep on the establishment and initial growth of heather;
...........................................................................................................................
...........................................................................................................................
...........................................................................................................................
........................................................................................................................... (2)
(ii) calculate the percentage reduction in total seed production resulting from grazing by sheep. Show your working.
Answer.............................% (2)
(Total 7 marks)
PMT

3. (a) Explain what is meant by an ecological niche.
............................................................................................................................. ........
.......................................................................................................................... ...........
............................................................................................................................. ........ (2)
(b) Two species of beetle may be found in stored grain. The diagram shows the range of moisture content and temperature that each species can tolerate.
24
22
20
18
16
14
12
108 10 12 14 16 18 20 22 24
Temperature/ºC
Moisturecontent ofgrain/%
Species A
Species B
The temperature in different parts of a large grain store ranged from 14 °C to 20 °C. The moisture content of the grain was constant at 16%. Beetles of both species were introduced into the store. What would you expect to happen if
(i) species A were a more successful competitor than species B;
...........................................................................................................................
...........................................................................................................................
...........................................................................................................................
PMT
(ii) species B were a more successful competitor than species A?
...........................................................................................................................
...........................................................................................................................
........................................................................................................................... (3)
(Total 5 marks)
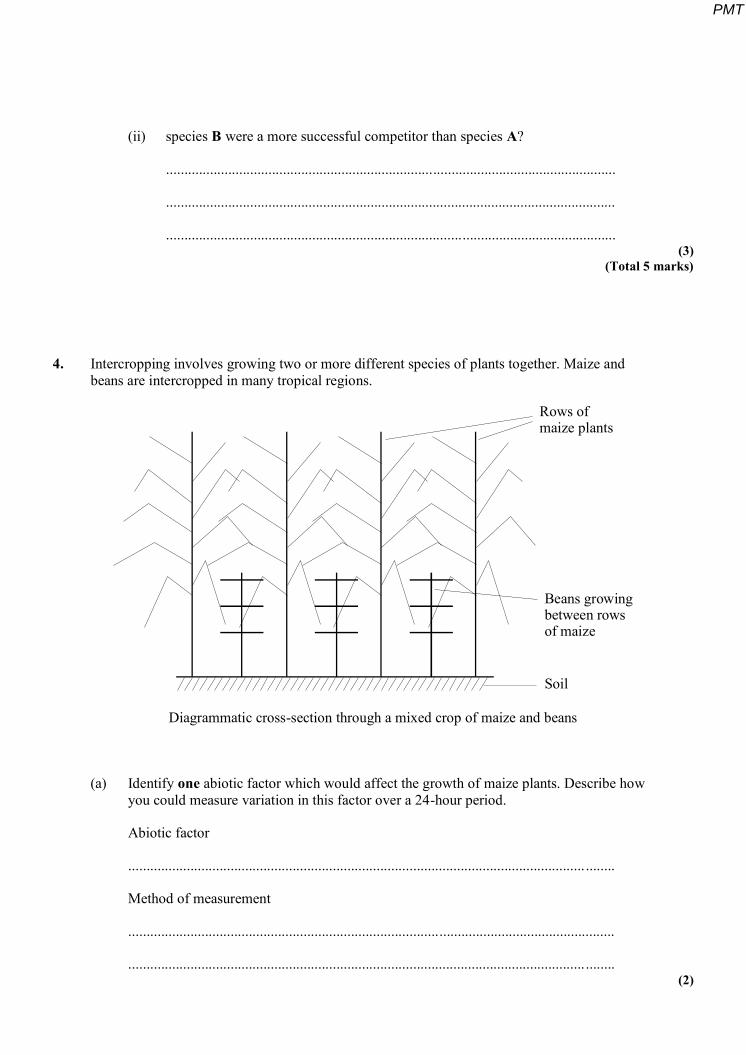
4. Intercropping involves growing two or more different species of plants together. Maize and beans are intercropped in many tropical regions.
Rows ofmaize plants
Beans growingbetween rowsof maize
Soil
Diagrammatic cross-section through a mixed crop of maize and beans
(a) Identify one abiotic factor which would affect the growth of maize plants. Describe how you could measure variation in this factor over a 24-hour period.
Abiotic factor
............................................................................................................................. ........
Method of measurement
.....................................................................................................................................
............................................................................................................................. ........ (2)
PMT
(b) Describe two ways in which maize plants affect the abiotic environment of the bean plants.
1. .......................................................................................................................... .......
.....................................................................................................................................
2. .......................................................................................................................... .......
..................................................................................................................................... (2)
(c) The maximum yield which could be gained from a plot in which maize and beans are intercropped would be higher than that which could be gained if either maize or beans were grown alone. Explain why.
............................................................................................................................. ........
.....................................................................................................................................
............................................................................................................................. ........
..................................................................................................................................... (2)
(Total 6 marks)
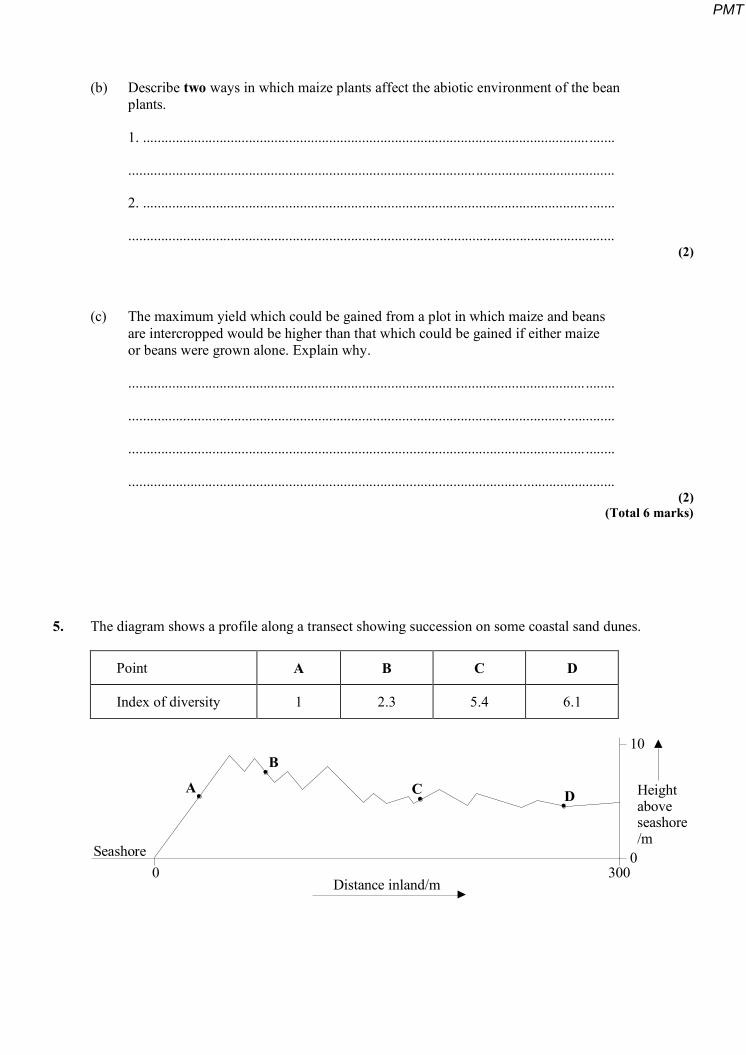
5. The diagram shows a profile along a transect showing succession on some coastal sand dunes.
Point A B C D
Index of diversity 1 2.3 5.4 6.1
Seashore0 300
0
Heightaboveseashore/m
10
A
B
C D
Distance inland/m
PMT
(a) What data must be collected in order to be able to calculate an index of diversity of plants at one of the points along the transect?
.....................................................................................................................................
............................................................................................................................. ........
..................................................................................................................................... (2)
(b) Suggest an explanation for the trend in diversity along the transect.
.....................................................................................................................................
............................................................................................................................. ........
.....................................................................................................................................
............................................................................................................................. ........
.....................................................................................................................................
............................................................................................................................. ........ (3)
(Total 5 marks)
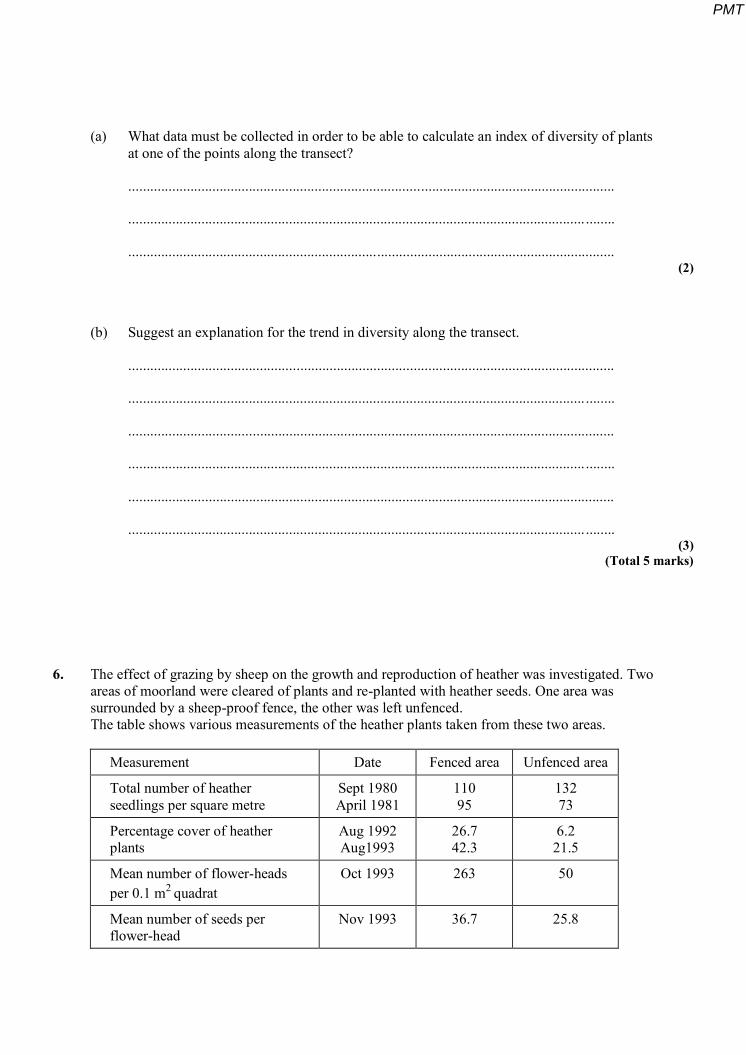
6. The effect of grazing by sheep on the growth and reproduction of heather was investigated. Two areas of moorland were cleared of plants and re-planted with heather seeds. One area was surrounded by a sheep-proof fence, the other was left unfenced. The table shows various measurements of the heather plants taken from these two areas.
Measurement Date Fenced area Unfenced area
Total number of heather seedlings per square metre
Sept 1980 April 1981
110 95
132 73
Percentage cover of heather plants
Aug 1992 Aug1993
26.7 42.3
6.2 21.5
Mean number of flower-heads per 0.1 m2 quadrat
Oct 1993 263 50
Mean number of seeds per flower-head
Nov 1993 36.7 25.8
PMT
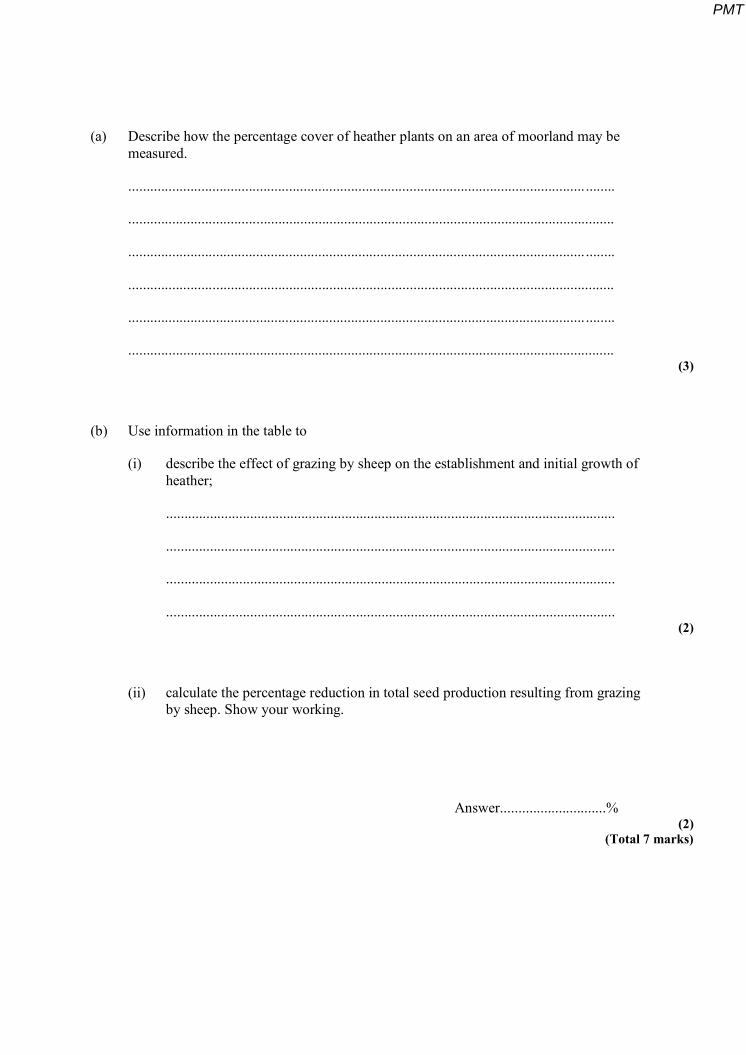
(a) Describe how the percentage cover of heather plants on an area of moorland may be measured.
............................................................................................................................. ........
.....................................................................................................................................
............................................................................................................................. ........
.....................................................................................................................................
............................................................................................................................. ........
..................................................................................................................................... (3)
(b) Use information in the table to
(i) describe the effect of grazing by sheep on the establishment and initial growth of heather;
...........................................................................................................................
...........................................................................................................................
...........................................................................................................................
........................................................................................................................... (2)
(ii) calculate the percentage reduction in total seed production resulting from grazing by sheep. Show your working.
Answer.............................% (2)
(Total 7 marks)
PMT
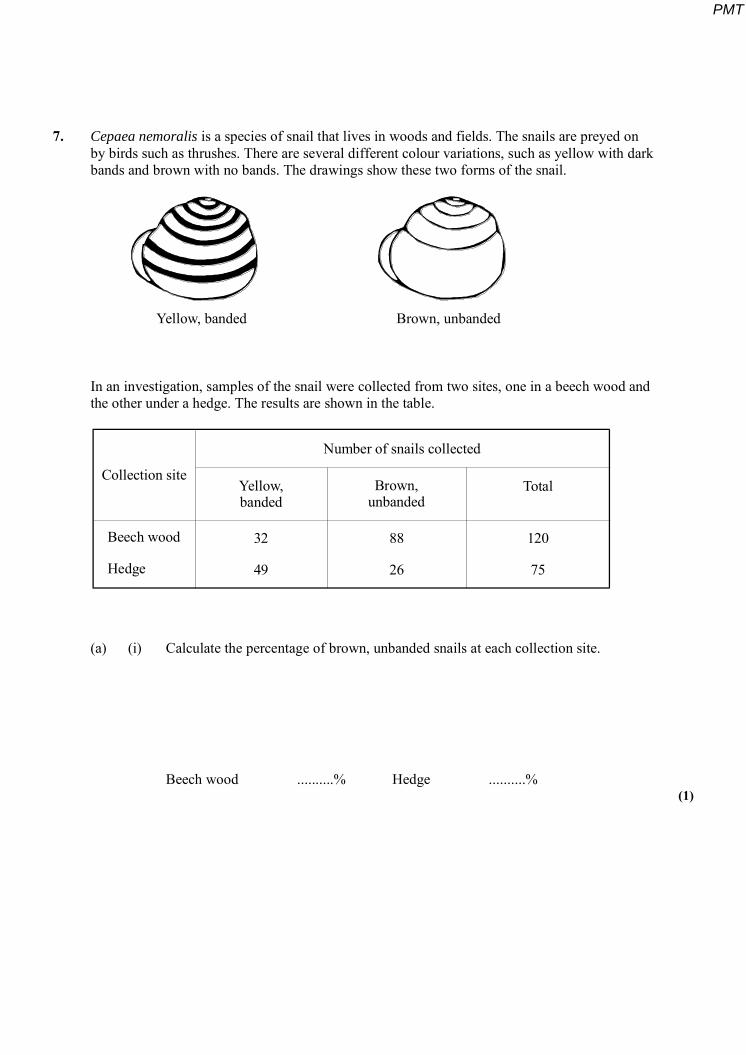
7. Cepaea nemoralis is a species of snail that lives in woods and fields. The snails are preyed on by birds such as thrushes. There are several different colour variations, such as yellow with dark bands and brown with no bands. The drawings show these two forms of the snail.
Yellow, banded Brown, unbanded
In an investigation, samples of the snail were collected from two sites, one in a beech wood and the other under a hedge. The results are shown in the table.
Collection site
Number of snails collected
Yellow,banded
Brown,unbanded
Total
Beech wood
Hedge
32
49
88
26
120
75
(a) (i) Calculate the percentage of brown, unbanded snails at each collection site.
Beech wood ..........% Hedge ..........% (1)
PMT

(ii) A chi-squared test was carried out on the results. Explain the purpose of this test.
..........................................................................................................................
..........................................................................................................................
..........................................................................................................................
.......................................................................................................................... (2)
(b) Give one assumption that needs to be made about the method used to collect the snails.
.....................................................................................................................................
............................................................................................................................. ........ (1)
(c) Suggest a hypothesis to explain the different proportions of brown, unbanded snails found at the two sites.
............................................................................................................................. ........
..................................................................................................................................... (1)
PMT

(d) Describe how the carbohydrates in the dead leaves in the beech wood would be recycled by the activity of detritivores and microorganisms.
............................................................................................................................. ........
.....................................................................................................................................
............................................................................................................................. ........
.....................................................................................................................................
............................................................................................................................. ........
.....................................................................................................................................
............................................................................................................................. ........
.....................................................................................................................................
............................................................................................................................. ........
..................................................................................................................................... (7)
(Total 12 marks)
8. (a) Explain how a frame quadrat is used to find percentage cover of a species of plant in a habitat.
............................................................................................................................. .......
........................................................................................................................... .........
............................................................................................................................. .......
....................................................................................................................................
............................................................................................................................. .......
.................................................................................................................................... (3)
PMT

The distribution of one species of plant in an overgrown garden was investigated. The diagram shows a frame quadrat in one position.
1m
1m Low hedge
(b) (i) Estimate the percentage cover of the plant in this quadrat.
............................................................................................................................
............................................................................................................................ (1)
(ii) Suggest two ways the hedge may create a favourable environment for this species of plant.
1.........................................................................................................................
...........................................................................................................................
2..........................................................................................................................
............................................................................................................................ (2)
PMT
(c) The garden had a large population of ground beetles. Describe an investigation to find out if the size of the population in the garden is significantly different from the size of the population of these beetles in surrounding woodland.
....................................................................................................................................
............................................................................................................................. .......
....................................................................................................................................
............................................................................................................................. .......
....................................................................................................................................
............................................................................................................................. .......
............................................................................................................................. ....... (6)
(Total 12 marks)
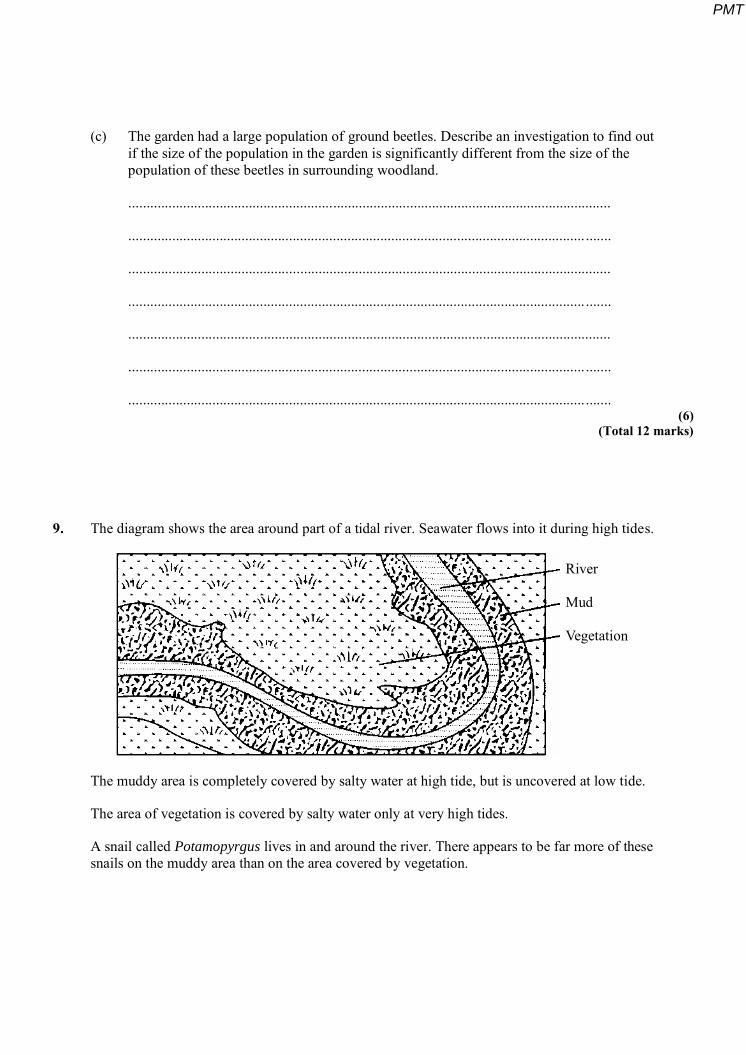
9. The diagram shows the area around part of a tidal river. Seawater flows into it during high tides.
River
Mud
Vegetation
The muddy area is completely covered by salty water at high tide, but is uncovered at low tide.
The area of vegetation is covered by salty water only at very high tides.
A snail called Potamopyrgus lives in and around the river. There appears to be far more of these snails on the muddy area than on the area covered by vegetation.
PMT

(a) Describe the techniques you would use to obtain reliable data in order to compare the sizes of the populations of the snail in the muddy area and in the area covered by vegetation.
....................................................................................................................................
............................................................................................................................. .......
....................................................................................................................................
............................................................................................................................. .......
............................................................................................................................. .......
........................................................................................................................... .........
............................................................................................................................. .......
.................................................................................................................................... (3)
(b) Describe how you would measure the pH of a sample of the mud.
............................................................................................................................. .......
....................................................................................................................................
............................................................................................................................. .......
.................................................................................................................................... (2)
S (c) The snails burrow into the mud when the tide is out.
Suggest two advantages to the snails of this behaviour.
1 ..................................................................................................................................
............................................................................................................................. ........
2 ..................................................................................................................................
............................................................................................................................. ........ (2)
PMT
S (d) The water in the muddy area is permanently salty. Very few species of plants can grow there.
Explain why the salty conditions prevent the growth of many species of plants.
............................................................................................................................. ........
.......................................................................................................................... ...........
............................................................................................................................. ........
..................................................................................................................................... (2)
(Total 9 marks)
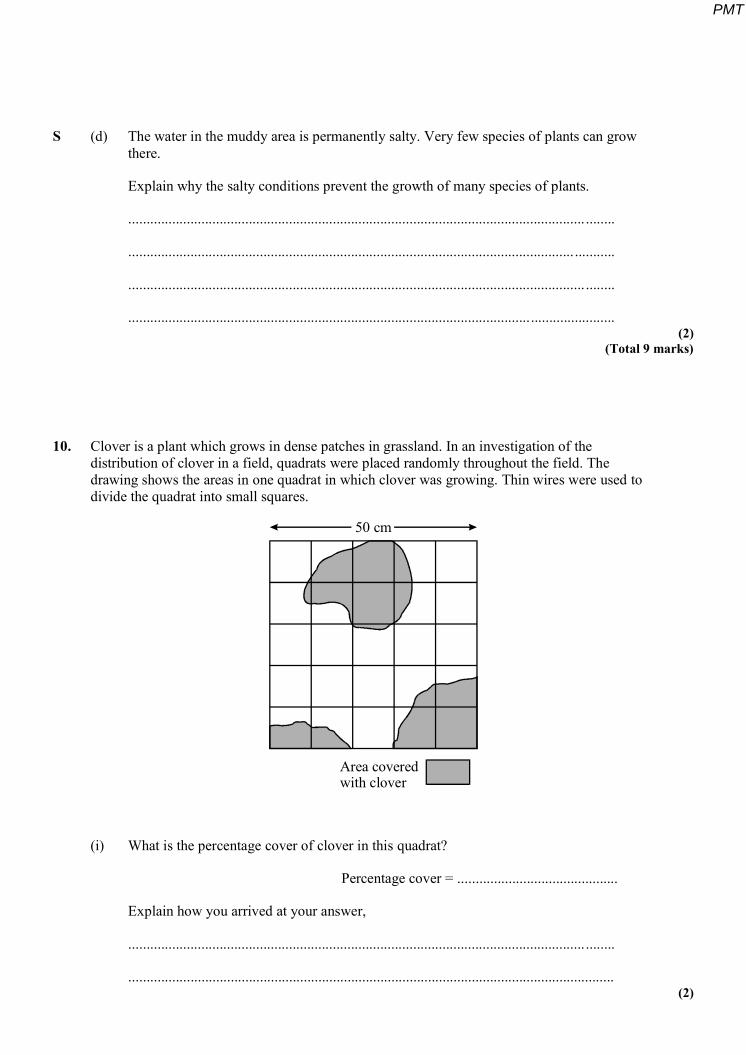
10. Clover is a plant which grows in dense patches in grassland. In an investigation of the distribution of clover in a field, quadrats were placed randomly throughout the field. The drawing shows the areas in one quadrat in which clover was growing. Thin wires were used to divide the quadrat into small squares.
Area coveredwith clover
50 cm
(i) What is the percentage cover of clover in this quadrat?
Percentage cover = ............................................
Explain how you arrived at your answer,
............................................................................................................................. ........
..................................................................................................................................... (2)
PMT
(ii) Describe one way in which you could place the quadrats randomly in a field.
.....................................................................................................................................
............................................................................................................................. ........
.....................................................................................................................................
............................................................................................................................. ........ (2)
(Total 4 marks)
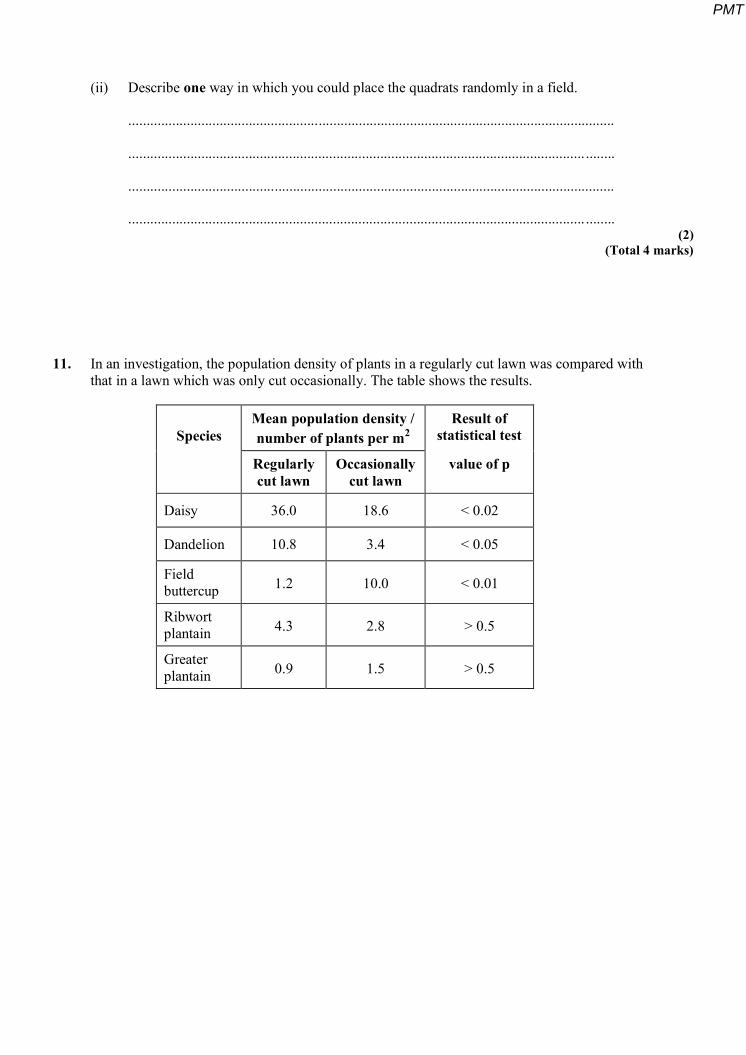
11. In an investigation, the population density of plants in a regularly cut lawn was compared with that in a lawn which was only cut occasionally. The table shows the results.
Species Mean population density / number of plants per m2
Result of statistical test
Regularly cut lawn
Occasionally cut lawn
value of p
Daisy 36.0 18.6 < 0.02
Dandelion 10.8 3.4 < 0.05
Field buttercup 1.2 10.0 < 0.01
Ribwort plantain 4.3 2.8 > 0.5
Greater plantain 0.9 1.5 > 0.5
PMT

(a) Describe a practical technique which you could use to find the mean population density of daisies on a lawn.
............................................................................................................................. ........
.....................................................................................................................................
............................................................................................................................. ........
.............................................................................................................................. .......
........................................................................................................................... ..........
............................................................................................................................. ........ (3)
(b) Give the null hypothesis for the statistical test on the population density of daisies.
............................................................................................................................. ........
.......................................................................................................................... ........... (1)
(c) What conclusions can be drawn from the results of this investigation?
............................................................................................................................. ........
.....................................................................................................................................
............................................................................................................................. ........
.....................................................................................................................................
............................................................................................................................. ........
................................................................................................................................... .. (3)
(Total 7 marks)
PMT
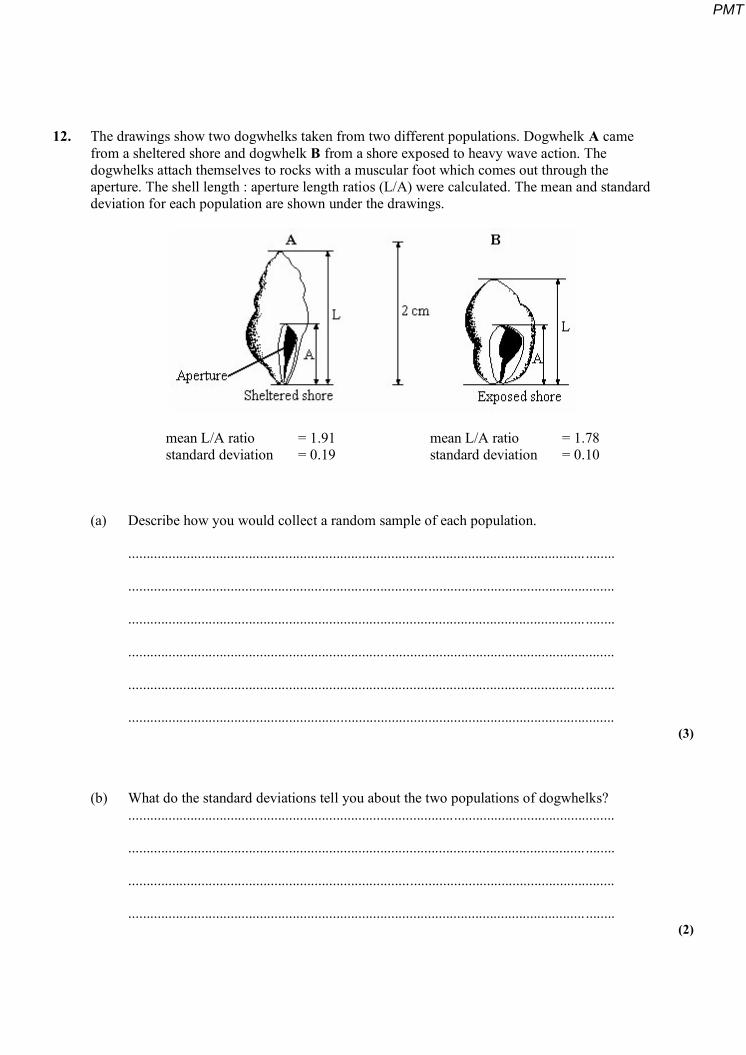
12. The drawings show two dogwhelks taken from two different populations. Dogwhelk A came from a sheltered shore and dogwhelk B from a shore exposed to heavy wave action. The dogwhelks attach themselves to rocks with a muscular foot which comes out through the aperture. The shell length : aperture length ratios (L/A) were calculated. The mean and standard deviation for each population are shown under the drawings.
mean L/A ratio = 1.91 mean L/A ratio = 1.78 standard deviation = 0.19 standard deviation = 0.10
(a) Describe how you would collect a random sample of each population.
............................................................................................................................. ........
.....................................................................................................................................
............................................................................................................................. ........
.....................................................................................................................................
............................................................................................................................. ........
..................................................................................................................................... (3)
(b) What do the standard deviations tell you about the two populations of dogwhelks? .....................................................................................................................................
............................................................................................................................. ........
.....................................................................................................................................
............................................................................................................................. ........ (2)
PMT
(c) Suggest how the effect of wave action on the two populations of dogwhelks could result in differences between
(i) the mean L/A ratios; .........................................................................................
......................................................................................................................….
......................................................................................................................….
......................................................................................................................….
(ii) the standard deviations. .........................................................................….......
......................................................................................................................….
......................................................................................................................….
......................................................................................................................…. (4)
(Total 9 marks)
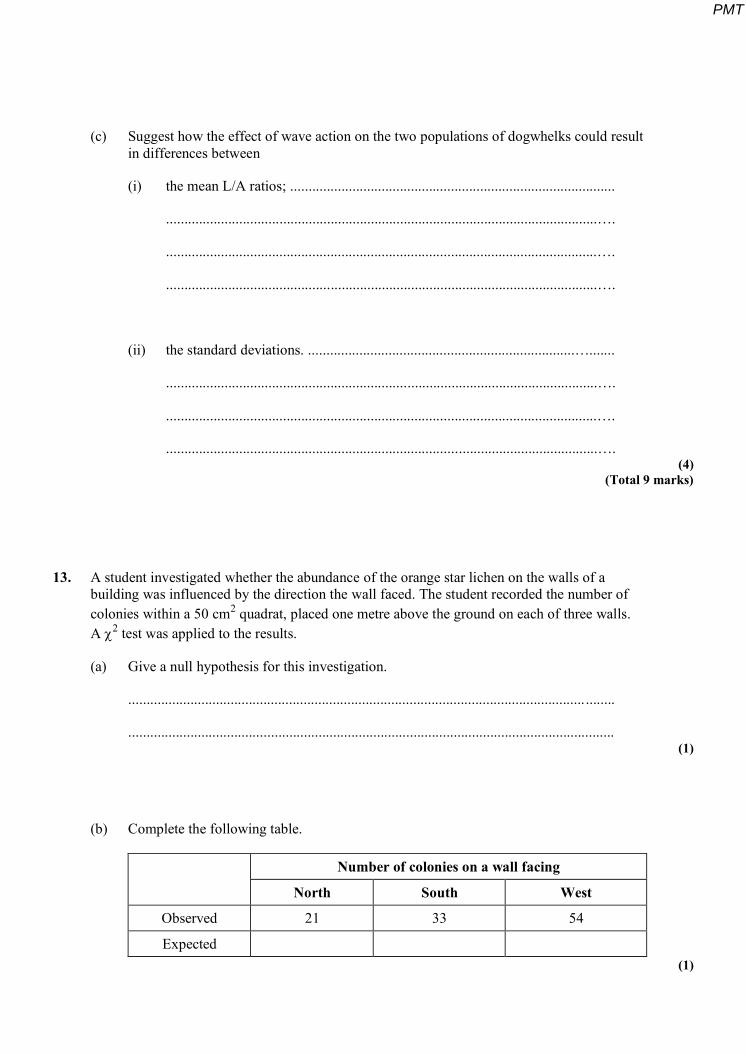
13. A student investigated whether the abundance of the orange star lichen on the walls of a building was influenced by the direction the wall faced. The student recorded the number of colonies within a 50 cm2 quadrat, placed one metre above the ground on each of three walls. A 2 test was applied to the results.
(a) Give a null hypothesis for this investigation.
............................................................................................................................. ........
..................................................................................................................................... (1)
(b) Complete the following table.
Number of colonies on a wall facing
North South West
Observed 21 33 54
Expected (1)
PMT
(c) How many degrees of freedom were in this 2 test?
............................................................................................................................. ........ (1)
(d) A 2 value of 15.5 was calculated from these results. This 2 value has a probability of less than 0.001. Explain what this means when applied to this investigation.
............................................................................................................................. ........
.....................................................................................................................................
............................................................................................................................. ........
................................................................................................................................... ..
............................................................................................................................. ........
............................................................................................................................. ........ (3)
S (e) Algae are green protoctists. Lichens consist of a fungus and an alga living together in a relationship where both organisms benefit. Suggest how the relationship between the alga and the fungus allows the lichen to survive on an inorganic surface such as a wall.
.....................................................................................................................................
............................................................................................................................. ........
.....................................................................................................................................
............................................................................................................................. ........ (2)
(Total 8 marks)
PMT
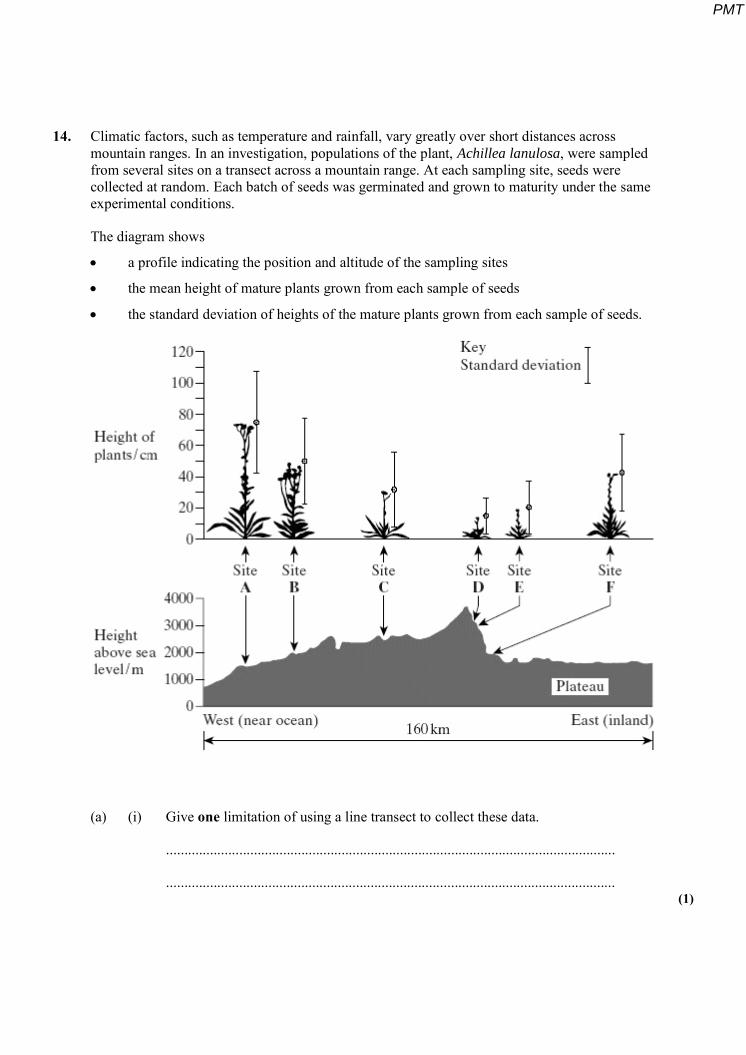
14. Climatic factors, such as temperature and rainfall, vary greatly over short distances across mountain ranges. In an investigation, populations of the plant, Achillea lanulosa, were sampled from several sites on a transect across a mountain range. At each sampling site, seeds were collected at random. Each batch of seeds was germinated and grown to maturity under the same experimental conditions.
The diagram shows
a profile indicating the position and altitude of the sampling sites
the mean height of mature plants grown from each sample of seeds
the standard deviation of heights of the mature plants grown from each sample of seeds.
(a) (i) Give one limitation of using a line transect to collect these data.
...........................................................................................................................
........................................................................................................................... (1)
PMT
(ii) Suggest how plants should be chosen at each sampling site to avoid bias and to be representative.
...........................................................................................................................
...........................................................................................................................
...........................................................................................................................
........................................................................................................................... (2)
(b) (i) What information does the bar representing standard deviation give about the plants in a sample?
...........................................................................................................................
........................................................................................................................... (1)
(ii) Describe what the results show about the variation of the height of the plants in relation to altitude.
...........................................................................................................................
...........................................................................................................................
...........................................................................................................................
........................................................................................................................... (2)
S (iii) There was a significant difference between the mean heights of the plants grown from seeds taken from sites A and D. Describe the evidence from the information given which shows that this is likely to be due to genetic differences between the two populations.
...........................................................................................................................
........................................................................................................................... (1)
(Total 7 marks)
PMT
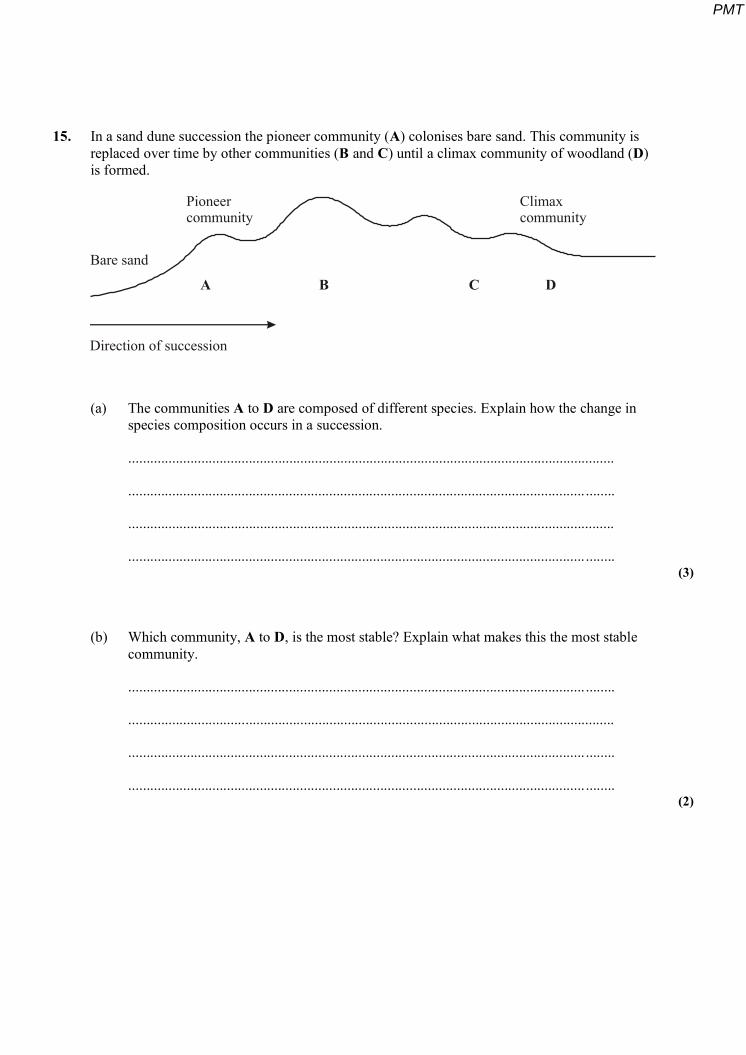
15. In a sand dune succession the pioneer community (A) colonises bare sand. This community is replaced over time by other communities (B and C) until a climax community of woodland (D) is formed.
A B C D
Direction of succession
Bare sand
Pioneercommunity
Climaxcommunity
(a) The communities A to D are composed of different species. Explain how the change in species composition occurs in a succession.
.....................................................................................................................................
............................................................................................................................. ........
.....................................................................................................................................
............................................................................................................................. ........ (3)
(b) Which community, A to D, is the most stable? Explain what makes this the most stable community.
............................................................................................................................. ........
.....................................................................................................................................
............................................................................................................................. ........
............................................................................................................................. ........ (2)
PMT
S (c) Many species in the pioneer community are xerophytes. Suggest and explain how having sunken stomata is an advantage to these plants.
............................................................................................................................. ........
.....................................................................................................................................
............................................................................................................................. ........
.....................................................................................................................................
............................................................................................................................. ........
..................................................................................................................................... (3)
(d) Explain why it would be more appropriate to use a transect rather than random quadrats when investigating this succession.
.....................................................................................................................................
............................................................................................................................. ........ (1)
(Total 9 marks)
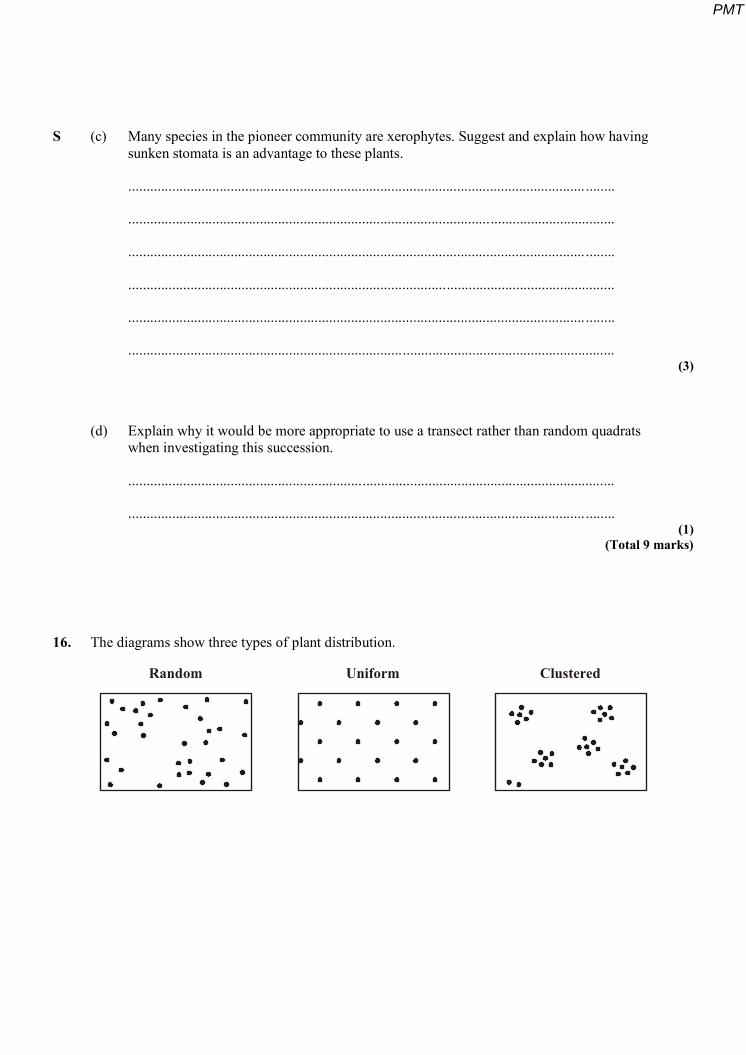
16. The diagrams show three types of plant distribution.
Random Uniform Clustered
PMT

(a) Describe how you would use quadrats to determine whether a particular plant species has a clustered or a random distribution.
............................................................................................................................. ........
.......................................................................................................................... ...........
............................................................................................................................. ........
.....................................................................................................................................
............................................................................................................................. ........ (3)
S (b) Explain why vegetative propagation in plants often results in a clustered distribution.
............................................................................................................................. ........
............................................................................................................................. ........ (1)
(c) Some plants in a dry, hot desert have a uniform distribution and are widely spaced. Suggest how this type of distribution is an advantage to the plants.
............................................................................................................................. ........
.....................................................................................................................................
............................................................................................................................. ........
..................................................................................................................................... (2)
(Total 6 marks)
PMT
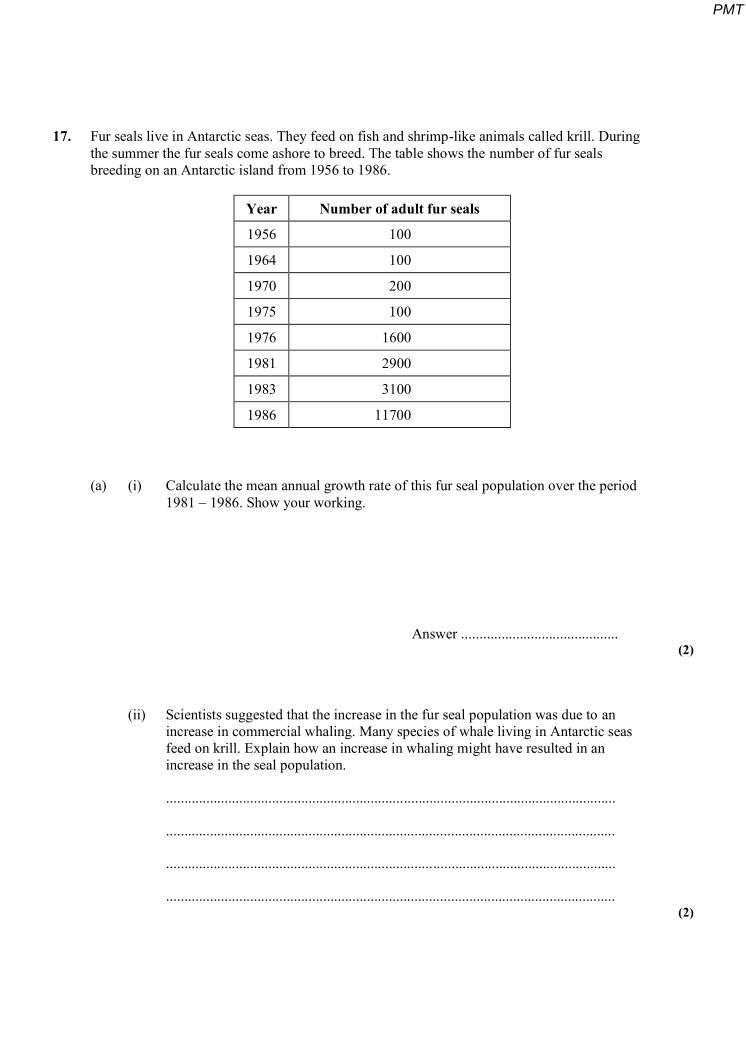
17. Fur seals live in Antarctic seas. They feed on fish and shrimp-like animals called krill. During the summer the fur seals come ashore to breed. The table shows the number of fur seals breeding on an Antarctic island from 1956 to 1986.
Year Number of adult fur seals
1956 100
1964 100
1970 200
1975 100
1976 1600
1981 2900
1983 3100
1986 11700
(a) (i) Calculate the mean annual growth rate of this fur seal population over the period 1981 – 1986. Show your working.
Answer ........................................... (2)
(ii) Scientists suggested that the increase in the fur seal population was due to an increase in commercial whaling. Many species of whale living in Antarctic seas feed on krill. Explain how an increase in whaling might have resulted in an increase in the seal population.
...........................................................................................................................
...........................................................................................................................
...........................................................................................................................
........................................................................................................................... (2)
PMT
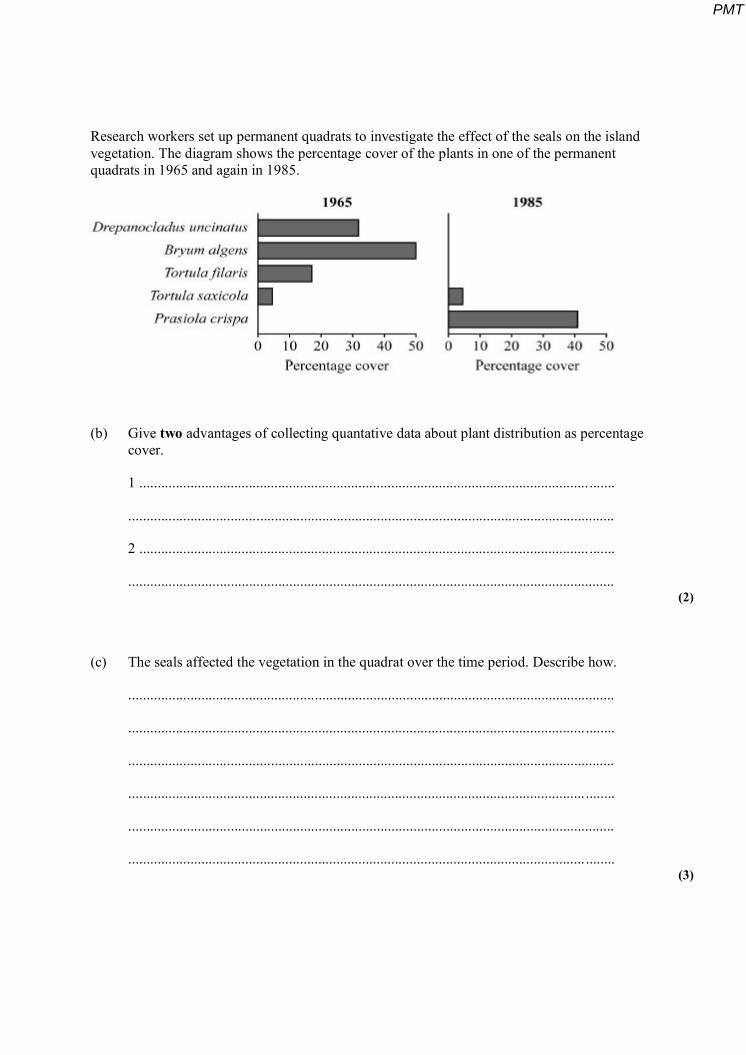
Research workers set up permanent quadrats to investigate the effect of the seals on the island vegetation. The diagram shows the percentage cover of the plants in one of the permanent quadrats in 1965 and again in 1985.
(b) Give two advantages of collecting quantative data about plant distribution as percentage cover.
1 ........................................................................................................................... .......
.....................................................................................................................................
2 ........................................................................................................................... .......
..................................................................................................................................... (2)
(c) The seals affected the vegetation in the quadrat over the time period. Describe how.
.....................................................................................................................................
............................................................................................................................. ........
.....................................................................................................................................
............................................................................................................................. ........
.....................................................................................................................................
............................................................................................................................. ........ (3)
PMT
(d) Prasiola crispa colonises soil with a high concentration of nitrogen-containing ions. Explain the increase in P. crispa in this quadrat.
.....................................................................................................................................
............................................................................................................................. ........
.....................................................................................................................................
............................................................................................................................. ........ (2)
(Total 11 marks)
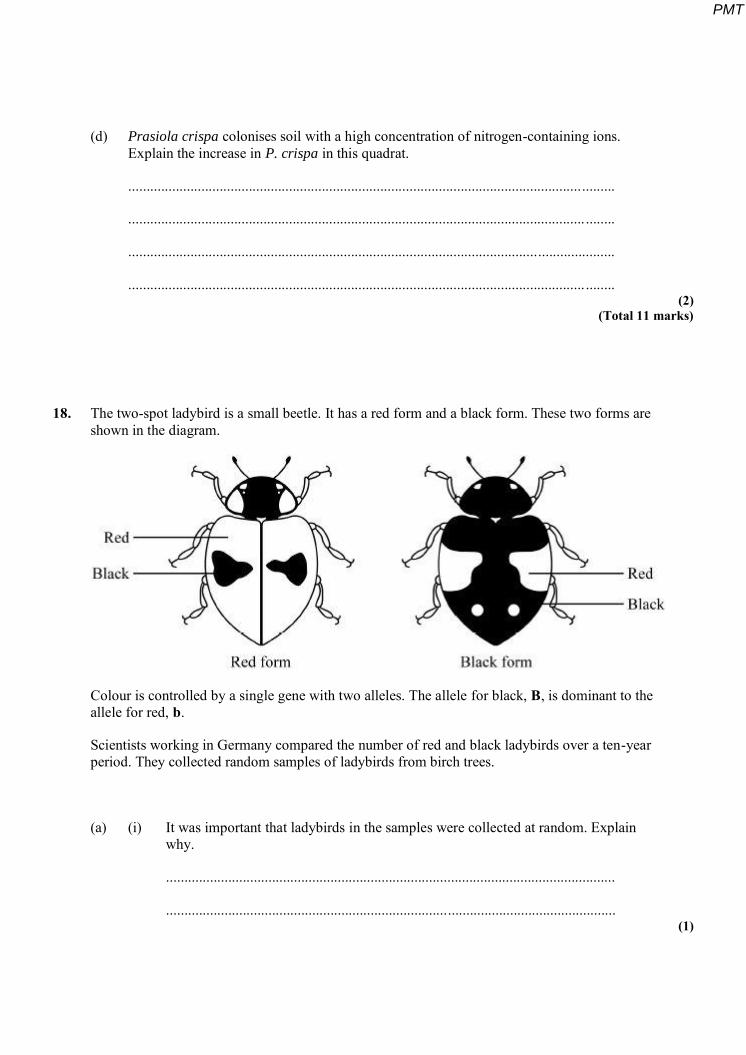
18. The two-spot ladybird is a small beetle. It has a red form and a black form. These two forms are shown in the diagram.
Colour is controlled by a single gene with two alleles. The allele for black, B, is dominant to the allele for red, b.
Scientists working in Germany compared the number of red and black ladybirds over a ten-year period. They collected random samples of ladybirds from birch trees.
(a) (i) It was important that ladybirds in the samples were collected at random. Explain why.
...........................................................................................................................
........................................................................................................................... (1)
PMT
(ii) Suggest one method by which the scientists could collect a random sample of ladybirds from the trees.
...........................................................................................................................
........................................................................................................................... (1)
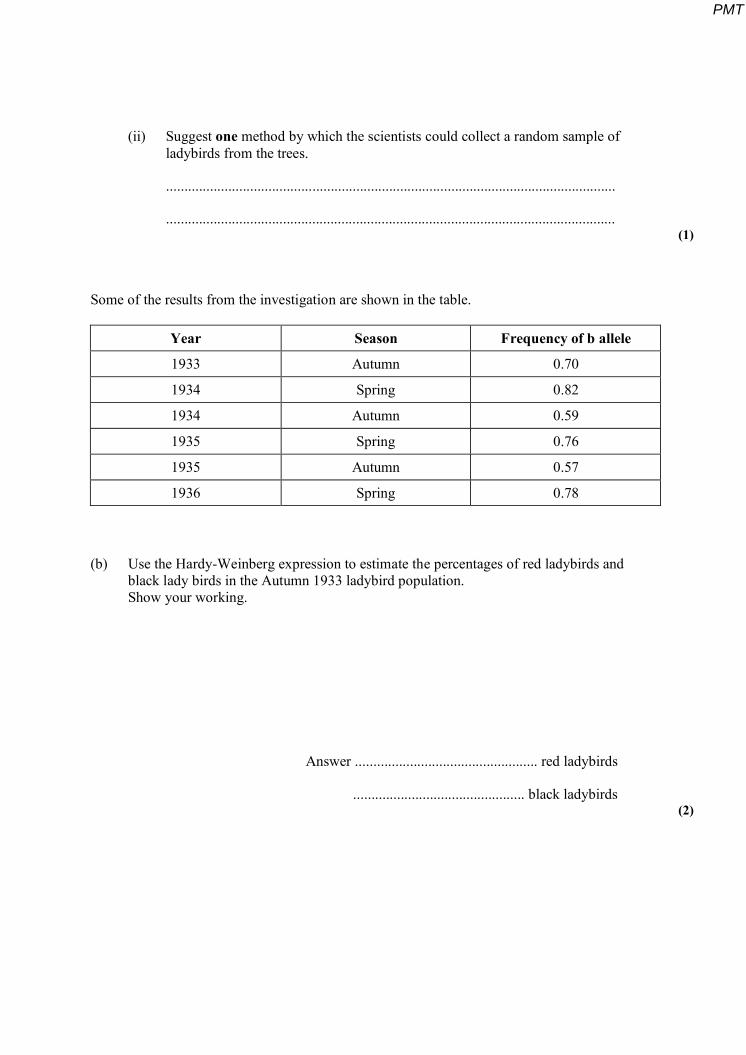
Some of the results from the investigation are shown in the table.
Year Season Frequency of b allele
1933 Autumn 0.70
1934 Spring 0.82
1934 Autumn 0.59
1935 Spring 0.76
1935 Autumn 0.57
1936 Spring 0.78
(b) Use the Hardy-Weinberg expression to estimate the percentages of red ladybirds and black lady birds in the Autumn 1933 ladybird population. Show your working.
Answer .................................................. red ladybirds
............................................... black ladybirds (2)
PMT

(c) (i) The evidence from the table shows that the black ladybirds were at a disadvantage and survived less well over winter. Explain this evidence.
...........................................................................................................................
...........................................................................................................................
...........................................................................................................................
........................................................................................................................... (2)
(ii) The scientists found that black ladybirds heated up more quickly and became active at lower temperatures than red ladybirds. How might this explain the poorer survival of black ladybirds over winter?
...........................................................................................................................
...........................................................................................................................
...........................................................................................................................
........................................................................................................................... (2)
(Total 8 marks)
PMT
19. Roundabouts are common at road junctions in towns and cities. Ecologists investigated the species of plants and animals found on roundabouts in a small town.
(a) Ground beetles are large black insects. The mark-release-recapture method can be used to estimate the ground beetle population on a roundabout. Describe how.
............................................................................................................................. ........
.....................................................................................................................................
............................................................................................................................. ........
.....................................................................................................................................
............................................................................................................................. ........
.....................................................................................................................................
............................................................................................................................. ........
.....................................................................................................................................
............................................................................................................................. ........
..................................................................................................................................... (5)
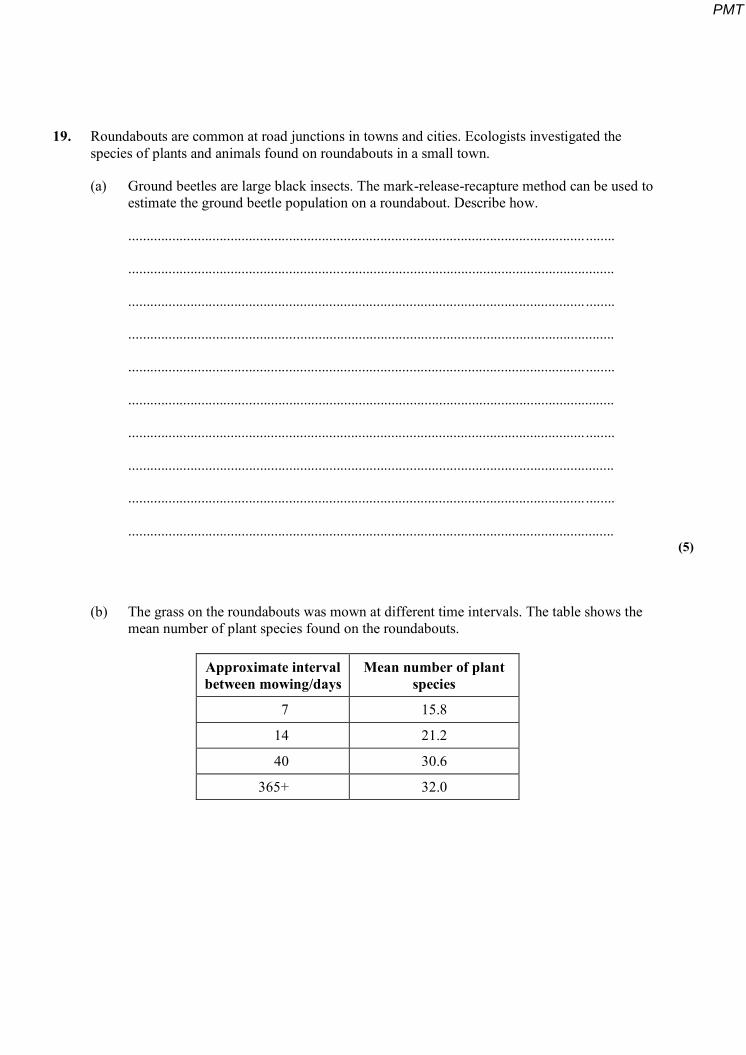
(b) The grass on the roundabouts was mown at different time intervals. The table shows the mean number of plant species found on the roundabouts.
Approximate interval between mowing/days
Mean number of plant species
7 15.8
14 21.2
40 30.6
365+ 32.0
PMT

Mowing was also found to affect the number of insect species found on a roundabout. Use your knowledge of succession to explain how.
............................................................................................................................. ........
............................................................................................................................. ........
.......................................................................................................................... ...........
............................................................................................................................. ........
.....................................................................................................................................
............................................................................................................................. ........
.....................................................................................................................................
............................................................................................................................. ........
.....................................................................................................................................
............................................................................................................................. ........ (5)
(c) The carbon dioxide concentration was monitored at ground level in the centre of a small roundabout. The measurements were made on a summer day. Describe and explain how you would expect the concentration of carbon dioxide to fluctuate over the period of 24 hours.
.....................................................................................................................................
............................................................................................................................. ........
.....................................................................................................................................
............................................................................................................................. ........
.....................................................................................................................................
............................................................................................................................. ........
.....................................................................................................................................
............................................................................................................................. ........
.....................................................................................................................................
............................................................................................................................. ........ (5)
(Total 15 marks)
PMT
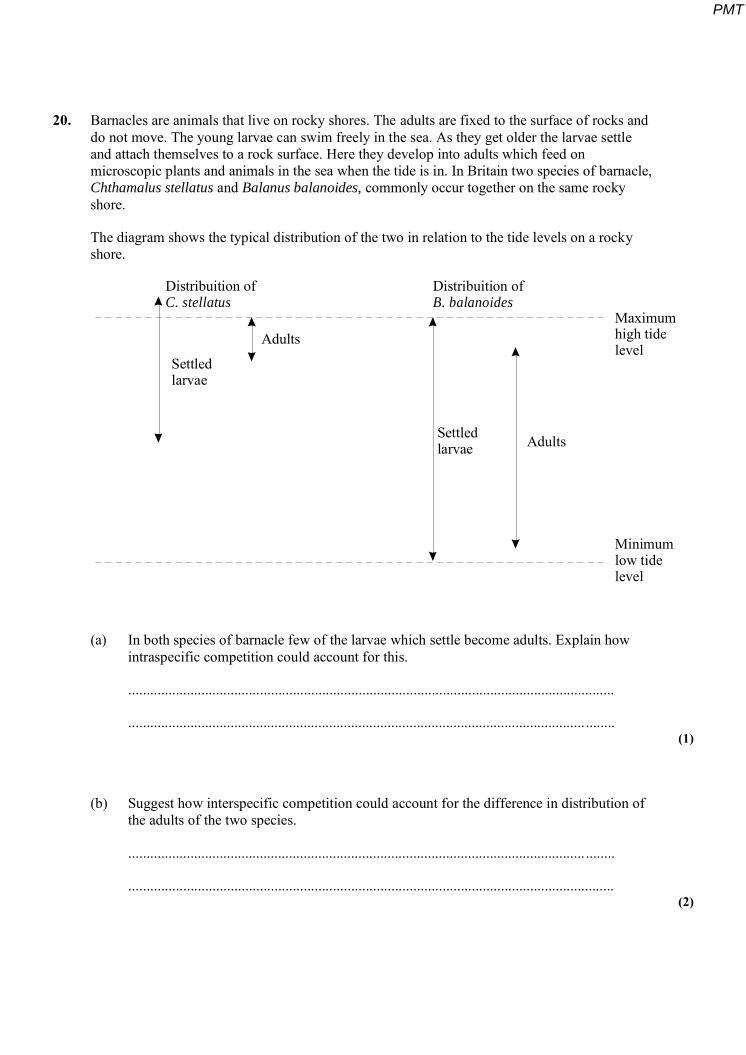
20. Barnacles are animals that live on rocky shores. The adults are fixed to the surface of rocks and do not move. The young larvae can swim freely in the sea. As they get older the larvae settle and attach themselves to a rock surface. Here they develop into adults which feed on microscopic plants and animals in the sea when the tide is in. In Britain two species of barnacle, Chthamalus stellatus and Balanus balanoides, commonly occur together on the same rocky shore.
The diagram shows the typical distribution of the two in relation to the tide levels on a rocky shore.
Distribuition ofC. stellatus
Distribuition ofB. balanoides
Adults
Adults
Settledlarvae
Settledlarvae
Maximumhigh tidelevel
Minimumlow tidelevel
(a) In both species of barnacle few of the larvae which settle become adults. Explain how intraspecific competition could account for this.
.....................................................................................................................................
............................................................................................................................. ........ (1)
(b) Suggest how interspecific competition could account for the difference in distribution of the adults of the two species.
............................................................................................................................. ........
..................................................................................................................................... (2)
PMT
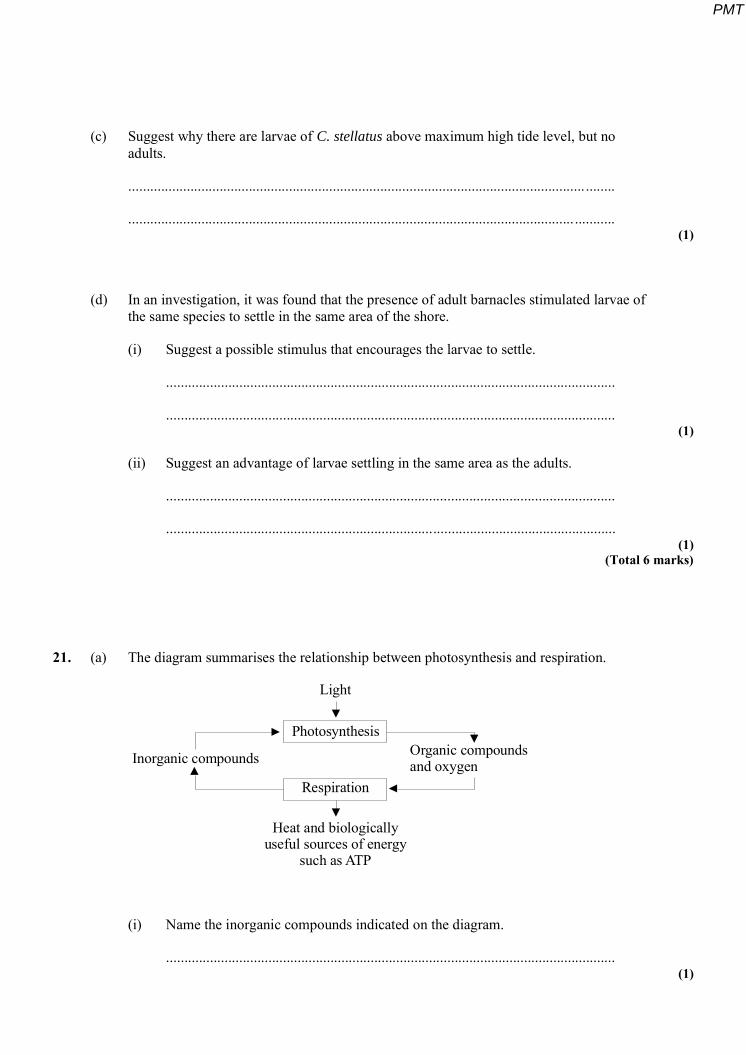
(c) Suggest why there are larvae of C. stellatus above maximum high tide level, but no adults.
............................................................................................................................. ........
.......................................................................................................................... ........... (1)
(d) In an investigation, it was found that the presence of adult barnacles stimulated larvae of the same species to settle in the same area of the shore.
(i) Suggest a possible stimulus that encourages the larvae to settle.
...........................................................................................................................
........................................................................................................................... (1)
(ii) Suggest an advantage of larvae settling in the same area as the adults.
...........................................................................................................................
........................................................................................................................... (1)
(Total 6 marks)
21. (a) The diagram summarises the relationship between photosynthesis and respiration.
Photosynthesis
Respiration
Inorganic compounds Organic compoundsand oxygen
Light
Heat and biologicallyuseful sources of energy
such as ATP
(i) Name the inorganic compounds indicated on the diagram.
........................................................................................................................... (1)
PMT
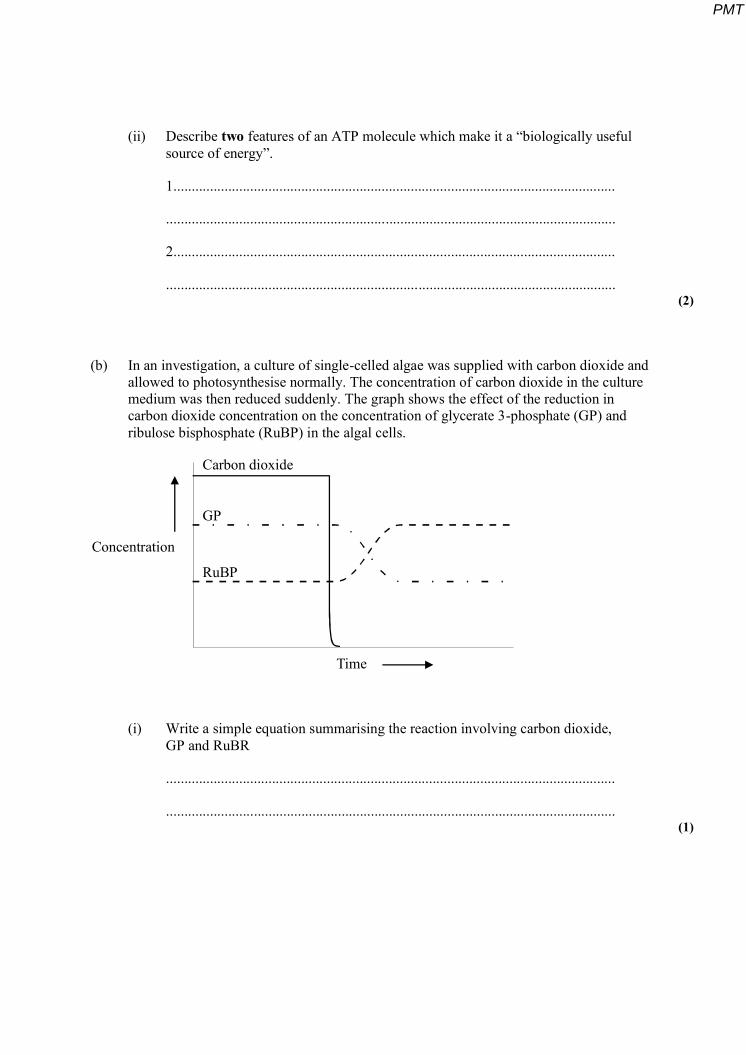
(ii) Describe two features of an ATP molecule which make it a “biologically useful source of energy”.
1.........................................................................................................................
...........................................................................................................................
2.........................................................................................................................
........................................................................................................................... (2)
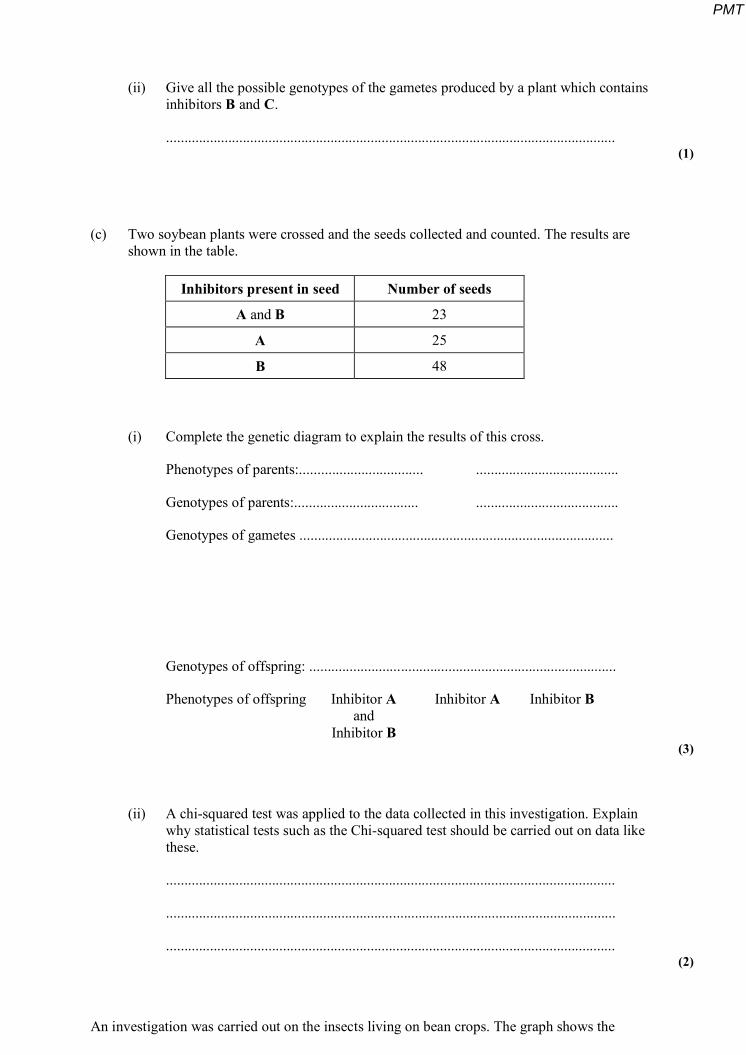
(b) In an investigation, a culture of single-celled algae was supplied with carbon dioxide and allowed to photosynthesise normally. The concentration of carbon dioxide in the culture medium was then reduced suddenly. The graph shows the effect of the reduction in carbon dioxide concentration on the concentration of glycerate 3-phosphate (GP) and ribulose bisphosphate (RuBP) in the algal cells.
Carbon dioxide
GP
RuBP
Time
Concentration
(i) Write a simple equation summarising the reaction involving carbon dioxide, GP and RuBR
...........................................................................................................................
........................................................................................................................... (1)
PMT
(ii) Explain the changes which occurred in the concentration of RuBP immediately after the concentration of carbon dioxide was reduced.
...........................................................................................................................
...........................................................................................................................
...........................................................................................................................
........................................................................................................................... (2)
(Total 6 marks)
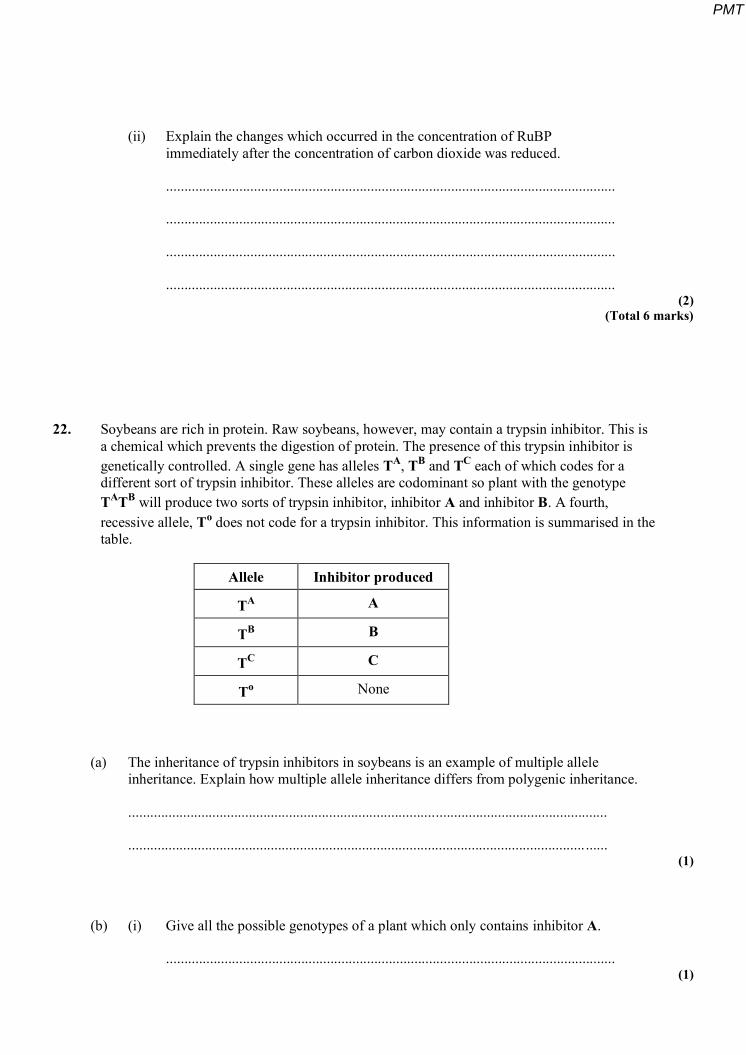
22. Soybeans are rich in protein. Raw soybeans, however, may contain a trypsin inhibitor. This is a chemical which prevents the digestion of protein. The presence of this trypsin inhibitor is genetically controlled. A single gene has alleles TA, TB and TC each of which codes for a different sort of trypsin inhibitor. These alleles are codominant so plant with the genotype TATB will produce two sorts of trypsin inhibitor, inhibitor A and inhibitor B. A fourth, recessive allele, To does not code for a trypsin inhibitor. This information is summarised in the table.
Allele Inhibitor produced
TA A
TB B
TC C
To None
(a) The inheritance of trypsin inhibitors in soybeans is an example of multiple allele inheritance. Explain how multiple allele inheritance differs from polygenic inheritance.
...................................................................................................................................
............................................................................................................................. ...... (1)
(b) (i) Give all the possible genotypes of a plant which only contains inhibitor A.
........................................................................................................................... (1)
PMT
(ii) Give all the possible genotypes of the gametes produced by a plant which contains inhibitors B and C.
........................................................................................................................... (1)
(c) Two soybean plants were crossed and the seeds collected and counted. The results are shown in the table.
Inhibitors present in seed Number of seeds
A and B 23
A 25
B 48
(i) Complete the genetic diagram to explain the results of this cross.
Phenotypes of parents:.................................. .......................................
Genotypes of parents:.................................. .......................................
Genotypes of gametes ......................................................................................
Genotypes of offspring: ....................................................................................
Phenotypes of offspring Inhibitor A Inhibitor A Inhibitor B and Inhibitor B
(3)
(ii) A chi-squared test was applied to the data collected in this investigation. Explain why statistical tests such as the Chi-squared test should be carried out on data like these.
...........................................................................................................................
...........................................................................................................................
........................................................................................................................... (2)
An investigation was carried out on the insects living on bean crops. The graph shows the
PMT
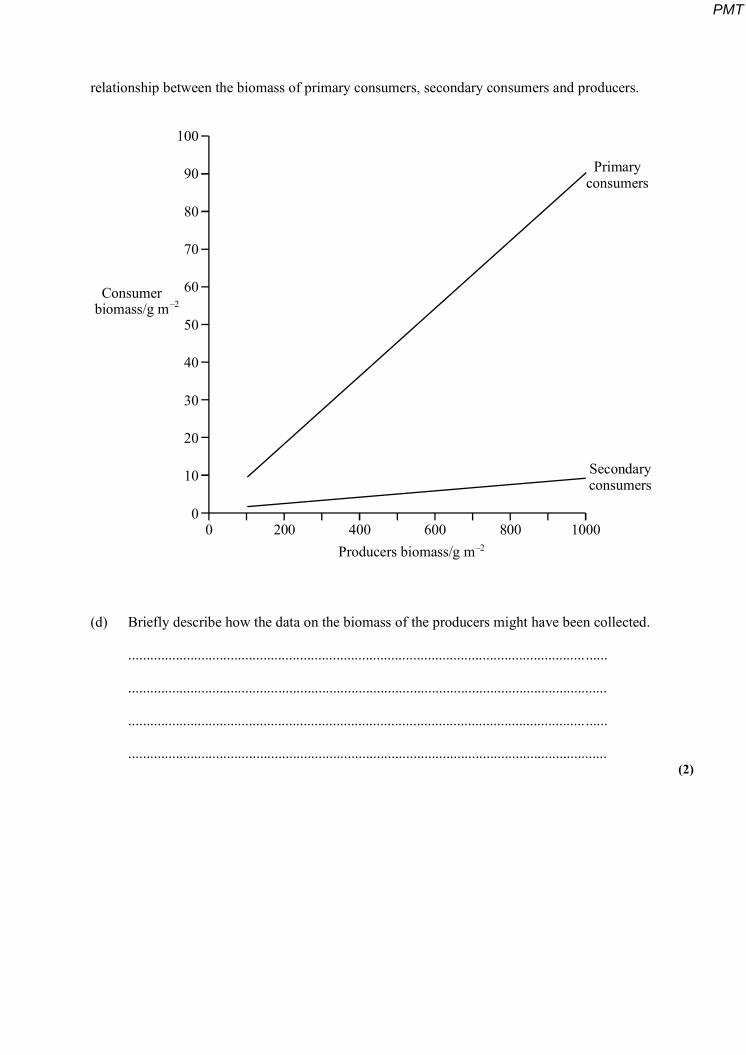
relationship between the biomass of primary consumers, secondary consumers and producers.
100
90
80
70
60
50
40
30
20
10
00 200 400 600 800 1000
Consumerbiomass/g m–2
–2
Primaryconsumers
Secondaryconsumers
Producers biomass/g m
(d) Briefly describe how the data on the biomass of the producers might have been collected.
............................................................................................................................. ......
...................................................................................................................................
............................................................................................................................. ......
................................................................................................................................... (2)
PMT
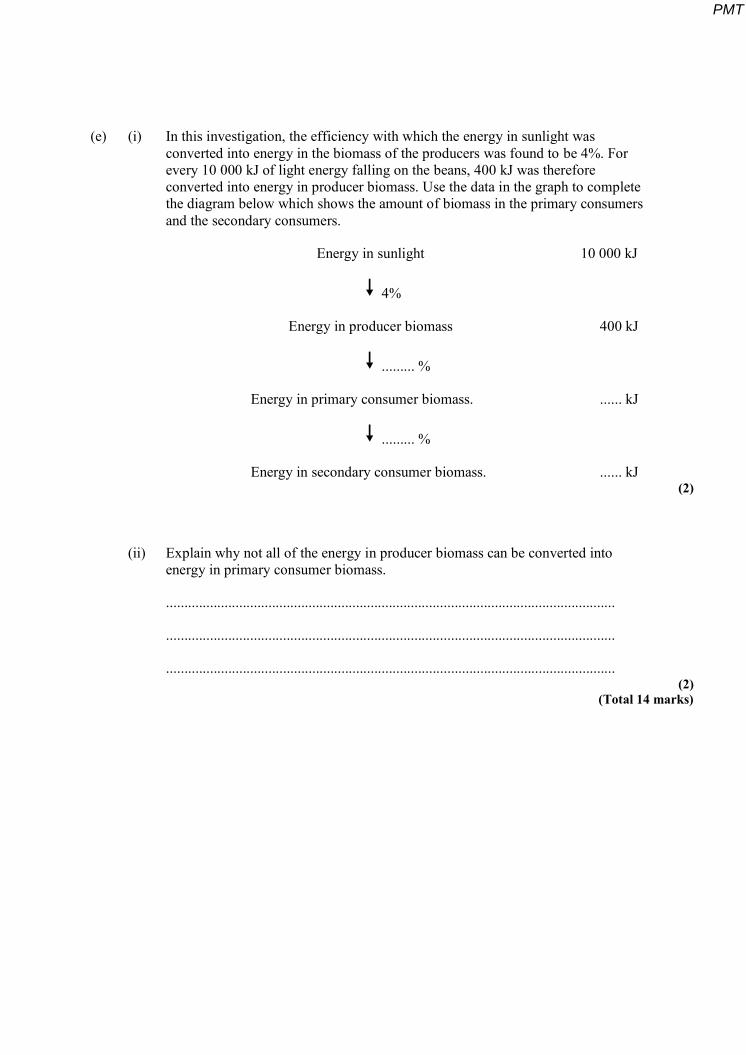
(e) (i) In this investigation, the efficiency with which the energy in sunlight was converted into energy in the biomass of the producers was found to be 4%. For every 10 000 kJ of light energy falling on the beans, 400 kJ was therefore converted into energy in producer biomass. Use the data in the graph to complete the diagram below which shows the amount of biomass in the primary consumers and the secondary consumers.
Energy in sunlight 10 000 kJ
4%
Energy in producer biomass 400 kJ
......... %
Energy in primary consumer biomass. ...... kJ
......... %
Energy in secondary consumer biomass. ...... kJ (2)
(ii) Explain why not all of the energy in producer biomass can be converted into energy in primary consumer biomass.
...........................................................................................................................
...........................................................................................................................
........................................................................................................................... (2)
(Total 14 marks)
PMT
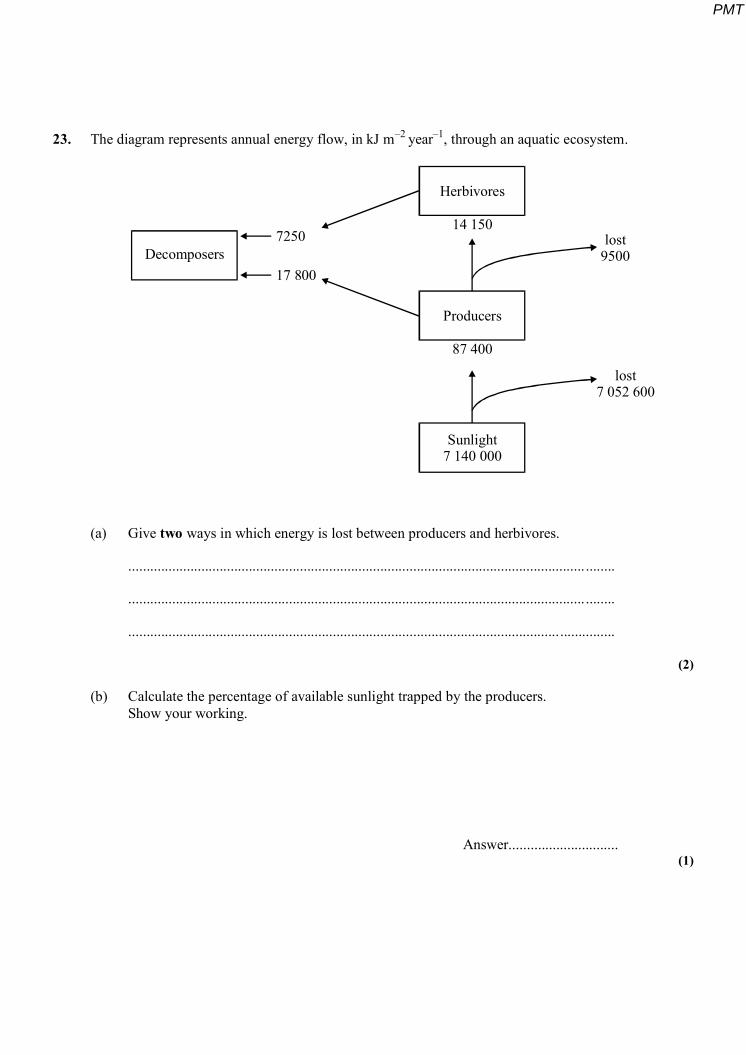
23. The diagram represents annual energy flow, in kJ m–2 year–1, through an aquatic ecosystem.
Decomposers
Herbivores
Producers
Sunlight7 140 000
14 150
87 400
7250
17 800
lost9500
lost7 052 600
(a) Give two ways in which energy is lost between producers and herbivores.
............................................................................................................................. ........
............................................................................................................................. ........
.....................................................................................................................................
(2)
(b) Calculate the percentage of available sunlight trapped by the producers. Show your working.
Answer.............................. (1)
PMT
(c) What is the importance of decomposers to the producers?
............................................................................................................................. ........
.......................................................................................................................... ........... (1)
(Total 4 marks)
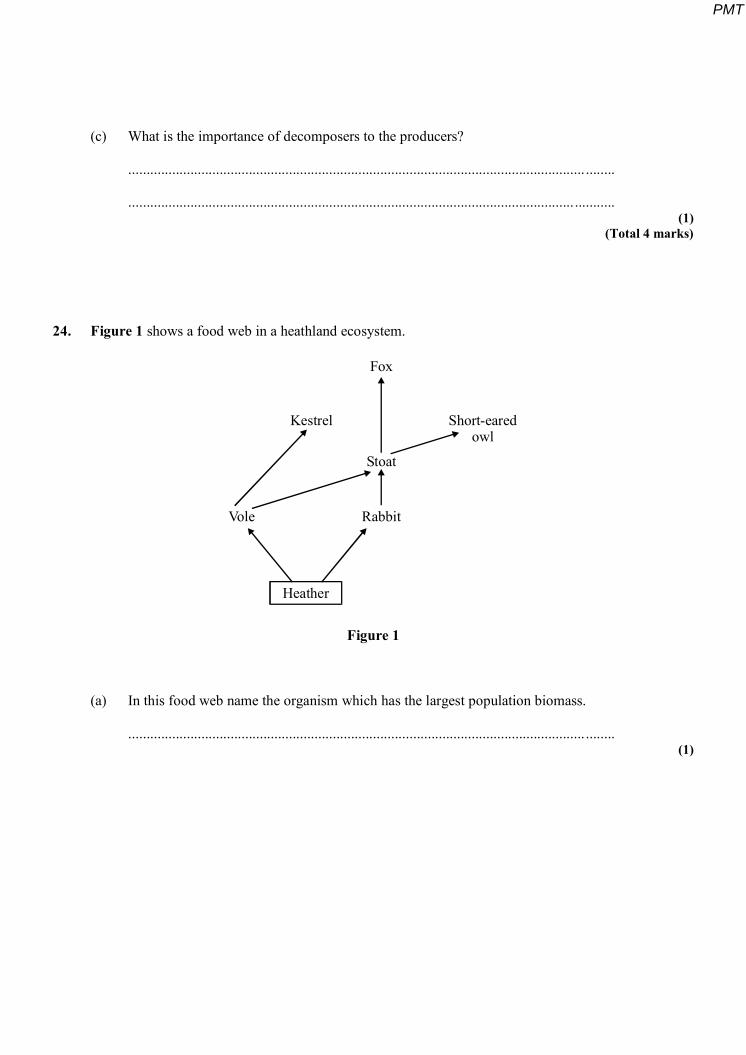
24. Figure 1 shows a food web in a heathland ecosystem.
Heather
Fox
Kestrel
Stoat
RabbitVole
Short-earedowl
Figure 1
(a) In this food web name the organism which has the largest population biomass.
............................................................................................................................. ........ (1)
PMT
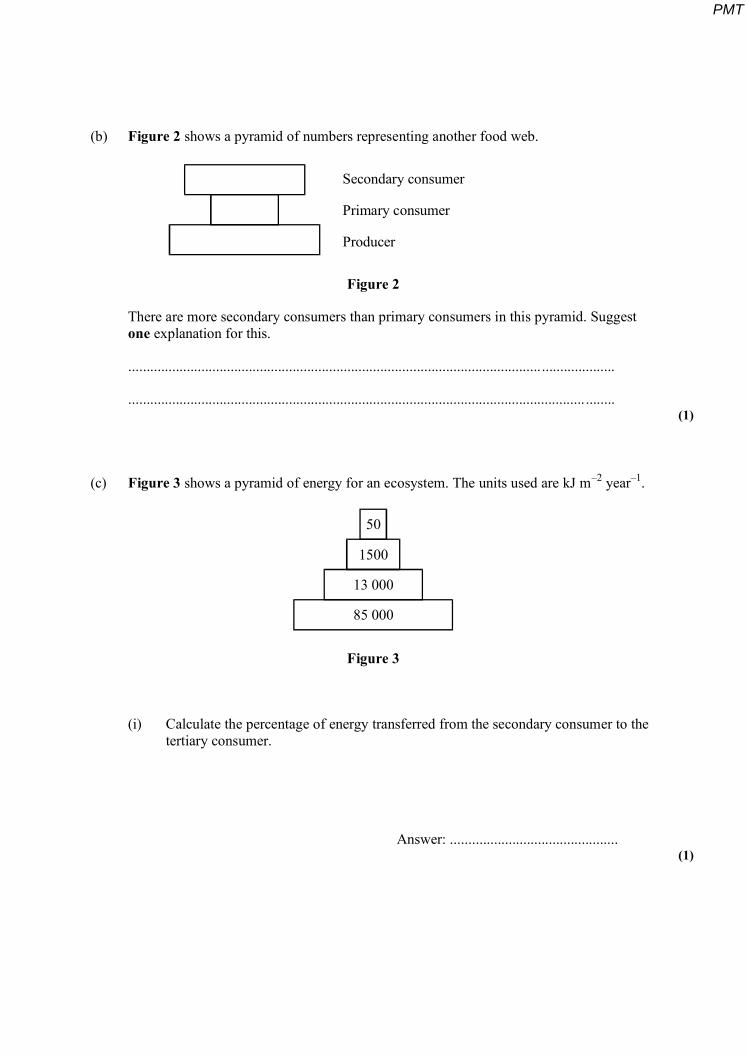
(b) Figure 2 shows a pyramid of numbers representing another food web.
Secondary consumer
Primary consumer
Producer
Figure 2
There are more secondary consumers than primary consumers in this pyramid. Suggest one explanation for this.
.....................................................................................................................................
............................................................................................................................. ........ (1)
(c) Figure 3 shows a pyramid of energy for an ecosystem. The units used are kJ m–2 year–1.
50
1500
13 000
85 000
Figure 3
(i) Calculate the percentage of energy transferred from the secondary consumer to the tertiary consumer.
Answer: .............................................. (1)
PMT
(ii) Give two reasons why the percentage of energy transferred between consumers is generally low.
1.........................................................................................................................
...........................................................................................................................
2.........................................................................................................................
........................................................................................................................... (2)
(Total 5 marks)
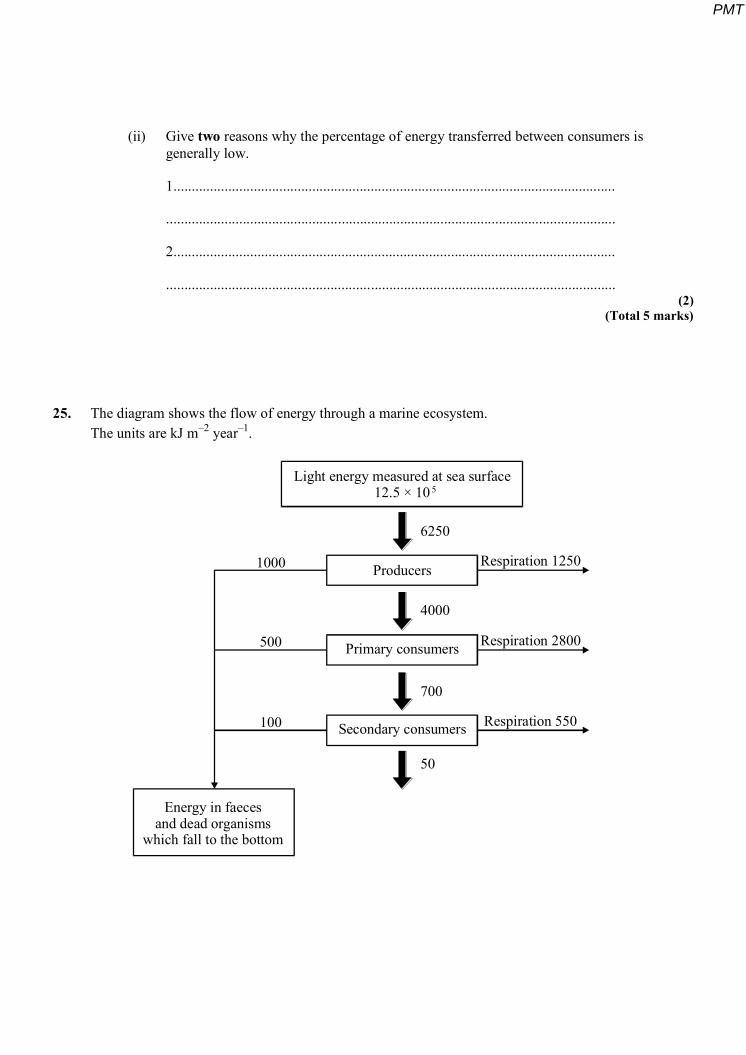
25. The diagram shows the flow of energy through a marine ecosystem. The units are kJ m–2 year–1.
6250
1000
500
100
4000
700
50
Producers
Primary consumers
Secondary consumers
Respiration 1250
Respiration 2800
Respiration 550
Light energy measured at sea surface12.5 × 10 5
Energy in faecesand dead organisms
which fall to the bottom
PMT
(a) (i) Calculate the percentage of the light energy at the sea surface which is converted into chemical energy in the producers. Show your working.
(2)
(ii) The percentage of the light energy at the sea surface which is converted into chemical energy in the producers is very small. Give two reasons for this.
(2)
(b) Use the information in the diagram to explain why marine ecosystems such as this rarely have more than five trophic levels.
(2)
(c) What happens to the energy in faeces and dead organisms which fall to the bottom of the sea?
(2)
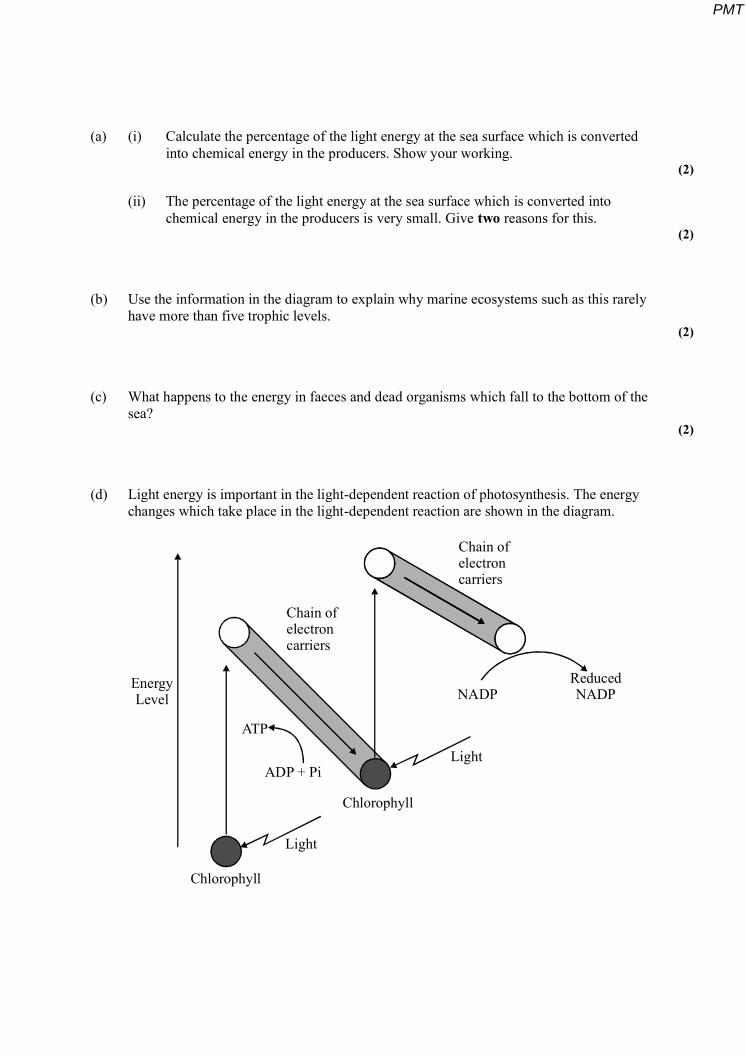
(d) Light energy is important in the light-dependent reaction of photosynthesis. The energy changes which take place in the light-dependent reaction are shown in the diagram.
EnergyLevel
ATP
ADP + Pi
Light
Light
Chlorophyll
Chlorophyll
NADPReducedNADP
Chain ofelectroncarriers
Chain ofelectroncarriers
PMT
(i) Describe what happens to the chlorophyll when it is struck by light. (2)
(ii) The weedkiller DCMU blocks the flow of electrons along the chains of electron carriers. Describe and explain the effect this will have on the production of triose phosphate in the light-independent reaction.
(3)
(e) Living organisms release energy from organic molecules such as glucose during respiration. Much of this energy is used to produce ATP. Explain why ATP is better than glucose as an immediate energy source for cell metabolism.
(2)
(f) The production of ATP is said to be coupled to the transport of electrons along the carrier chain. Normally, electrons are only passed along the carrier chain if ADP is being converted to ATP at the same time. When the amount of ADP in a cell is low, electrons do not flow from reduced coenzyme to oxygen.
(i) Suggest how the rate of respiration is linked to the needs of the cell. (3)
(ii) DNP is a substance which allows electron transport to take place without the production of ATP. When DNP is given to rats, their body temperatures rise. Explain why.
(2) (Total 20 marks)
PMT
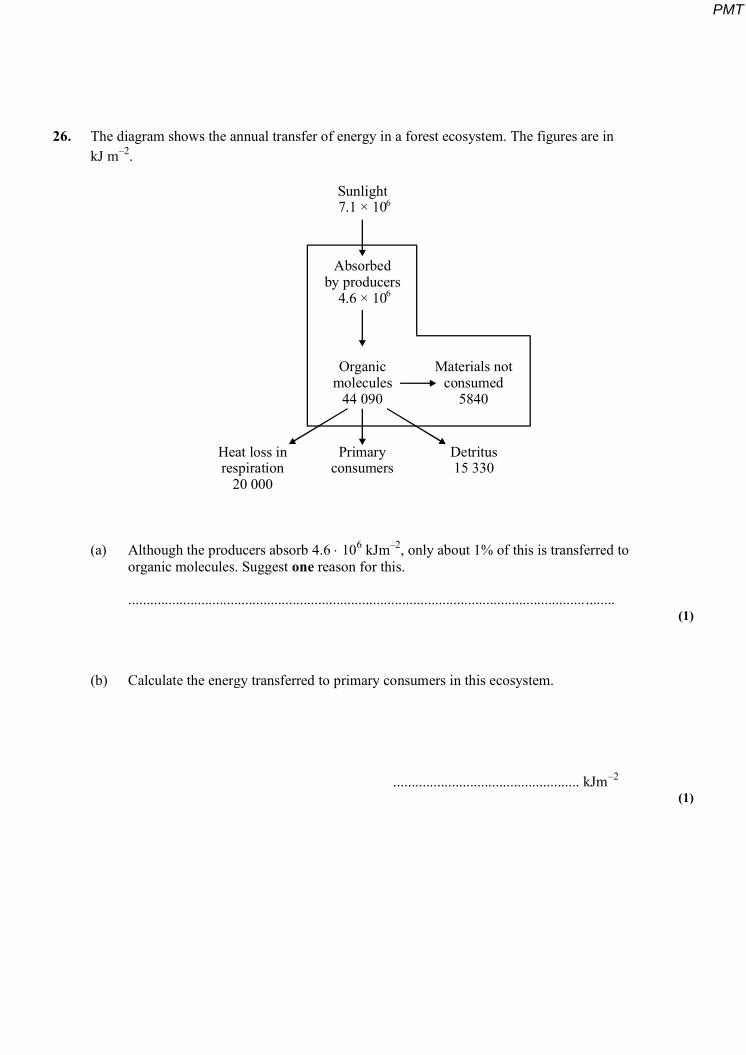
26. The diagram shows the annual transfer of energy in a forest ecosystem. The figures are in kJ m–2.
Absorbedby producers
4.6 × 10
Organicmolecules
44 090
Heat loss inrespiration
20 000
Primaryconsumers
Detritus15 330
Sunlight7.1 × 10
Materials notconsumed
5840
6
6
(a) Although the producers absorb 4.6 106 kJm–2, only about 1% of this is transferred to organic molecules. Suggest one reason for this.
............................................................................................................................. ........ (1)
(b) Calculate the energy transferred to primary consumers in this ecosystem.
................................................... kJm–2 (1)
PMT
(c) Nitrogen compounds in the detritus are broken down by bacteria to ammonium ions
)NH( 4 . Describe how ammonium ions are converted into a form that can be readily
absorbed by the producers.
............................................................................................................................. ........
.......................................................................................................................... ...........
............................................................................................................................. ........
.....................................................................................................................................
............................................................................................................................. ........
..................................................................................................................................... (3)
(Total 5 marks)
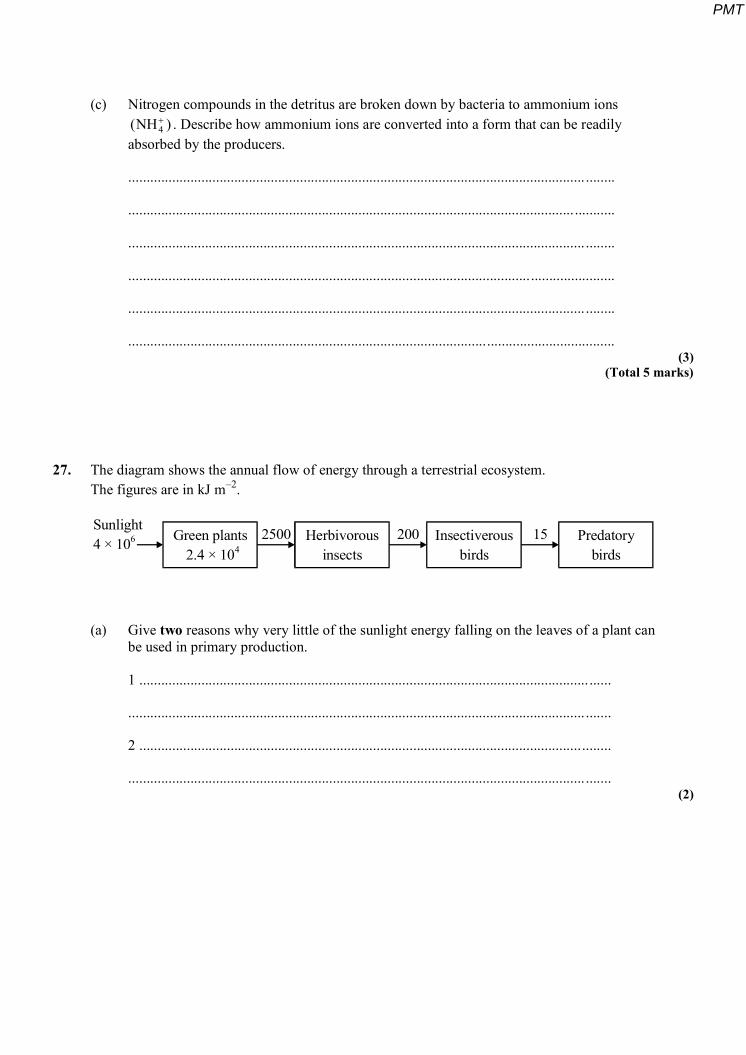
27. The diagram shows the annual flow of energy through a terrestrial ecosystem. The figures are in kJ m–2.
Sunlight4 × 10 Green plants
2.4 × 10Herbivorous
insectsInsectiverous
birdsPredatory
birds2500 200 156
4
(a) Give two reasons why very little of the sunlight energy falling on the leaves of a plant can be used in primary production.
1 ........................................................................................................................... ......
............................................................................................................................. .......
2 .................................................................................................................................
............................................................................................................................. ....... (2)
PMT
(b) Explain why a food chain rarely contains more than four trophic levels.
....................................................................................................................................
............................................................................................................................. .......
....................................................................................................................................
............................................................................................................................. .......
....................................................................................................................................
............................................................................................................................. ....... (3)
(Total 5 marks)
28. (a) ATP is sometimes described as an immediate source of energy. Explain why.
............................................................................................................................. ........
............................................................................................................................. ........ (1)
(b) Plants produce ATP in the light-dependent reaction of photosynthesis. Explain why plants cannot use this as their only source of ATP.
............................................................................................................................. ........
.....................................................................................................................................
............................................................................................................................. ........
..................................................................................................................................... (2)
PMT
(c) Red blood cells do not contain mitochondria but they use ATP. By what process do red blood cells produce ATP? Suggest a reason for your answer.
Process ..............................................................................................................................
Reason ...................................................................................................................... ........
...........................................................................................................................................
............................................................................................................................. .............. (2)
(Total 5 marks)
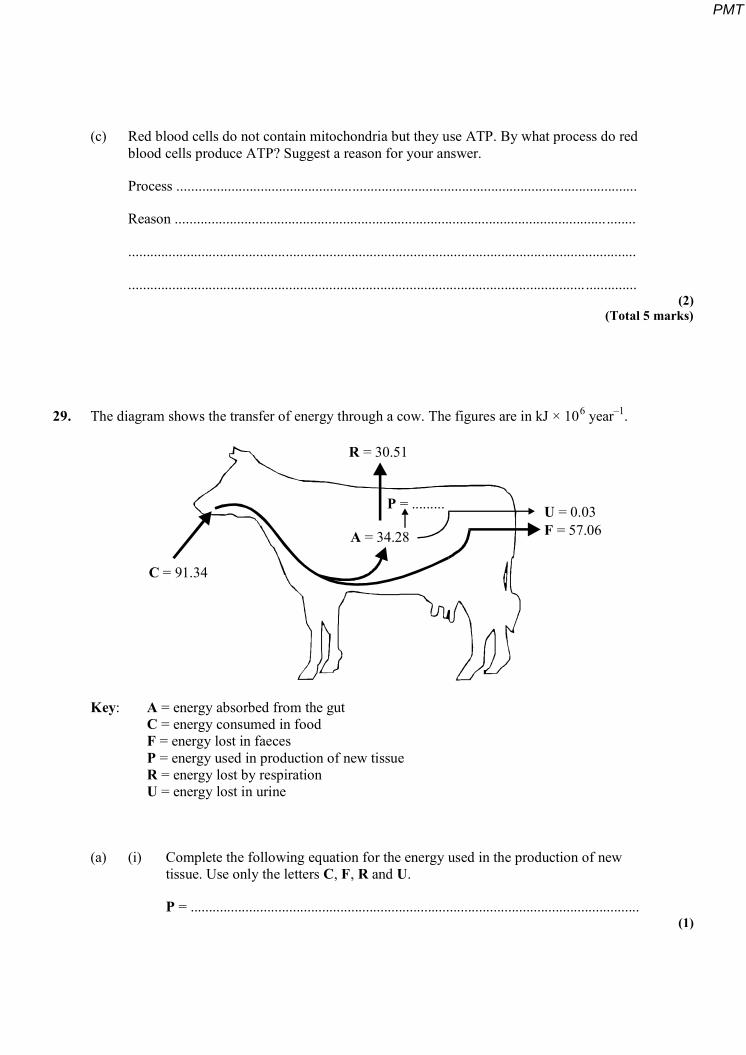
29. The diagram shows the transfer of energy through a cow. The figures are in kJ × 106 year–1.
C = 91.34
R = 30.51
A = 34.28
P = ......... U = 0.03F = 57.06
Key: A = energy absorbed from the gut C = energy consumed in food F = energy lost in faeces P = energy used in production of new tissue R = energy lost by respiration U = energy lost in urine
(a) (i) Complete the following equation for the energy used in the production of new tissue. Use only the letters C, F, R and U.
P = ........................................................................................................................... (1)
PMT

(ii) Calculate the value of P.
P = ................................... kJ × 106 year–1 (1)
(b) It has been estimated that an area of 8100 m2 of grassland is needed to keep one cow. The productivity of grass is 21 135 kJ m–2 year–1. What percentage of the energy in the grass is used in the production of new tissue in one cow? Show your working.
Answer ....................................... % (2)
(c) Keeping cattle indoors, in barns, leads to a higher efficiency of energy transfer. Explain why.
............................................................................................................................. ...........
........................................................................................................................................ (1)
(Total 5 marks)
PMT
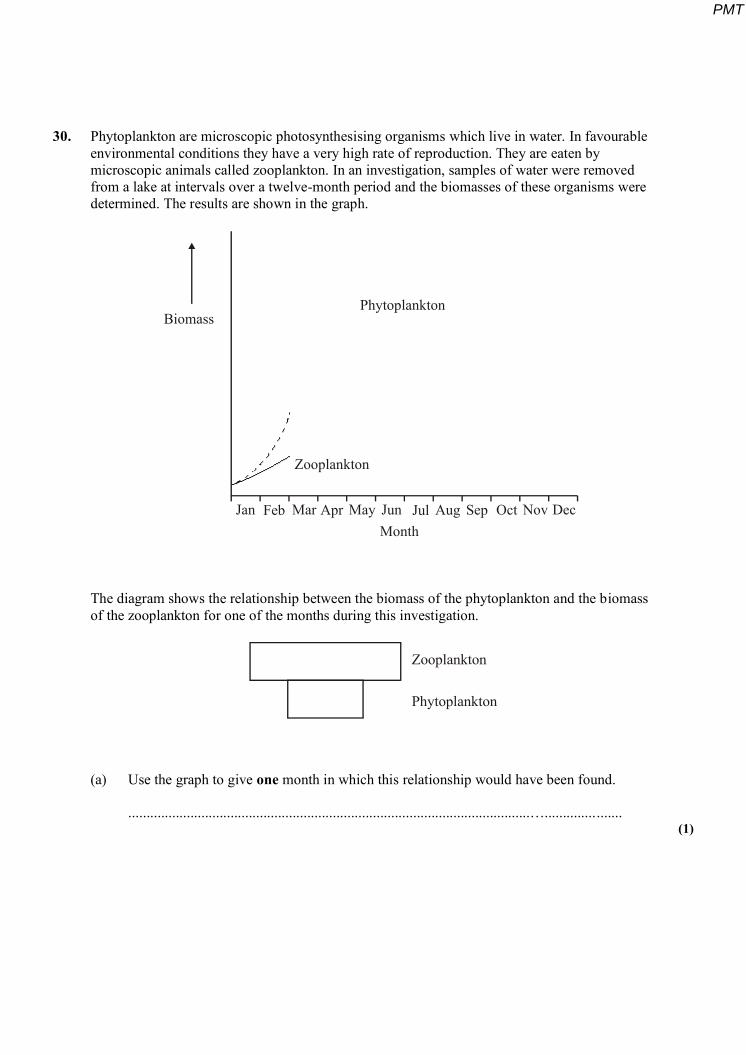
30. Phytoplankton are microscopic photosynthesising organisms which live in water. In favourable environmental conditions they have a very high rate of reproduction. They are eaten by microscopic animals called zooplankton. In an investigation, samples of water were removed from a lake at intervals over a twelve-month period and the biomasses of these organisms were determined. The results are shown in the graph.
Biomass
Zooplankton
Phytoplankton
Jan Feb Mar Apr May Jun Jul Aug Sep Oct Nov DecMonth
The diagram shows the relationship between the biomass of the phytoplankton and the biomass of the zooplankton for one of the months during this investigation.
Zooplankton
Phytoplankton
(a) Use the graph to give one month in which this relationship would have been found.
..............................................................................................................…..................... (1)
PMT
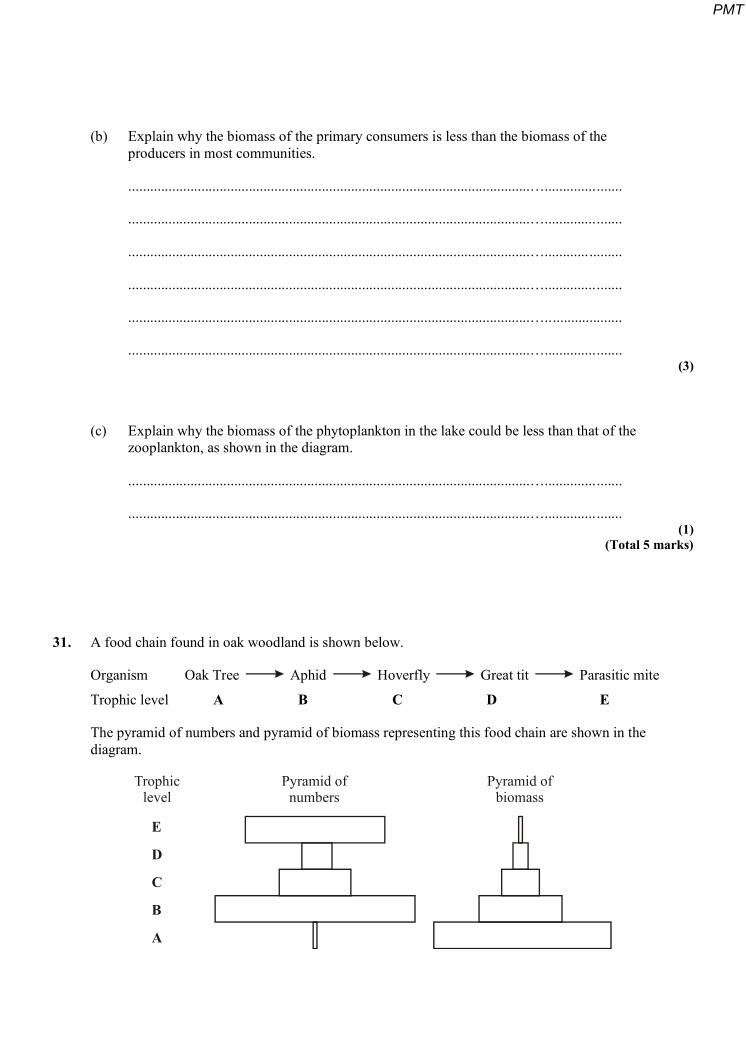
(b) Explain why the biomass of the primary consumers is less than the biomass of the producers in most communities.
..............................................................................................................….....................
..............................................................................................................….....................
..............................................................................................................…............ .........
..............................................................................................................….....................
..............................................................................................................….....................
..............................................................................................................…..................... (3)
(c) Explain why the biomass of the phytoplankton in the lake could be less than that of the zooplankton, as shown in the diagram.
..............................................................................................................….....................
..............................................................................................................…..................... (1)
(Total 5 marks)
31. A food chain found in oak woodland is shown below.
Organism Oak Tree Aphid Hoverfly Great tit Parasitic mite
Trophic level A B C D E
The pyramid of numbers and pyramid of biomass representing this food chain are shown in the diagram.
E
D
C
B
A
Trophiclevel
Pyramid ofnumbers
Pyramid ofbiomass
PMT

(a) Not all the light energy entering the leaves of the oak tree is used in photosynthesis. Give one reason for this.
.....................................................................................................................................
............................................................................................................................. ........ (1)
(b) Give two ways in which energy is lost between trophic levels A and B.
1 .................................................................................................................................
............................................................................................................................. .......
2 ........................................................................................................................... ......
............................................................................................................................. ....... (2)
(c) Explain the difference between the shapes of the two pyramids at trophic levels D and E.
.....................................................................................................................................
............................................................................................................................. ........
.....................................................................................................................................
............................................................................................................................. ........ (2)
(Total 5 marks)
32. Detritivorous insects feed on the dead remains of plants. Some students estimated the numbers of detritivorous insects at two different sites in an ecosystem. They also obtained data about the net primary production of the sites to see if this influenced the numbers of insects present. Net primary production is a measure of plant biomass formed per year. The results are shown in the table.
Site Number of insects
per m2 Net primary production /
g m–2 y–1
A 316 1440
B 90 550
PMT

(a) Explain how the students could use the mark-release-recapture technique to estimate the numbers of insects.
............................................................................................................................. ........
.....................................................................................................................................
............................................................................................................................. ........
............................................................................................................................. ........
.....................................................................................................................................
............................................................................................................................. ........
.....................................................................................................................................
............................................................................................................................. ........ (4)
(b) The students used the chi-squared (χ2) test to test the hypothesis that there was no significant difference between the numbers of insects per square metre at sites A and B. The value they obtained was 125.8. They checked this value in χ2 tables.
(i) How many degrees of freedom should they check against?
........................................................................................................................... (1)
(ii) What level of probability is normally used to judge whether a difference is statistically significant?
........................................................................................................................... (1)
PMT

(iii) The value of χ2 for the 0.001 level of probability for this number of degrees of freedom is 10.8. What does the value obtained by the students suggest about the difference in numbers of the insects per square metre between the two sites? Explain your answer.
...........................................................................................................................
...........................................................................................................................
...........................................................................................................................
........................................................................................................................... (2)
(c) (i) Explain why the net primary production of an area does not represent the total amount of plant biomass formed per year by photosynthesis.
...........................................................................................................................
...........................................................................................................................
...........................................................................................................................
........................................................................................................................... (2)
(ii) Suggest how the difference in net primary production of sites A and B might explain the difference in the number of insects between the sites.
...........................................................................................................................
........................................................................................................................... (1)
PMT

(iii) Explain the role of bacteria in making carbon in dead plant remains available to plants.
...........................................................................................................................
...........................................................................................................................
...........................................................................................................................
...........................................................................................................................
...........................................................................................................................
...........................................................................................................................
...........................................................................................................................
........................................................................................................................... (4)
(Total 15 marks)
33. Tigers inhabit forests where they feed mainly on large prey animals. Over the past fifty years, there has been extensive deforestation in many areas where tigers are found.
The graph shows the relationship between the prey biomass of an area and the tiger population that the area can support.
0 300 600 900 1200
30
20
10
0
Number oftigers per100 km2
Prey biomass / tonnes per 1000 km2
PMT
(i) What is meant by the ecological term population?
.....................................................................................................................................
............................................................................................................................. ........ (1)
(ii) Use the graph to explain how deforestation might cause a reduction in the number of tigers in an area.
............................................................................................................................. ........
.....................................................................................................................................
............................................................................................................................. ........
.....................................................................................................................................
............................................................................................................................. ........
............................................................................................................................. ........ (3)
(Total 4 marks)
34. In the activated sludge method of sewage treatment, organic matter in untreated sewage supplies nutrients to bacteria in the treatment tank. These bacteria include decomposers and nitrifying bacteria. The bacteria are eaten by ciliated protoctistans, which are, in turn, eaten by carnivorous protoctistans.
(a) (i) Sketch and label a pyramid of energy for the organisms found in the treatment tank.
(1)
PMT
(ii) Explain what causes this pyramid of energy to be this shape.
...........................................................................................................................
...........................................................................................................................
...........................................................................................................................
........................................................................................................................... (2)
(b) (i) Explain the roles of the decomposers and the nitrifying bacteria in converting nitrogen in organic compounds in the sewage into a soluble, inorganic form.
...........................................................................................................................
...........................................................................................................................
...........................................................................................................................
...........................................................................................................................
...........................................................................................................................
........................................................................................................................... (3)
(ii) Nitrifying bacteria are one kind of bacteria that are important in the nitrogen cycle; nitrogen-fixing bacteria are another kind. Describe the part played by nitrogen-fixing bacteria in the nitrogen cycle.
...........................................................................................................................
...........................................................................................................................
...........................................................................................................................
........................................................................................................................... (2)
PMT
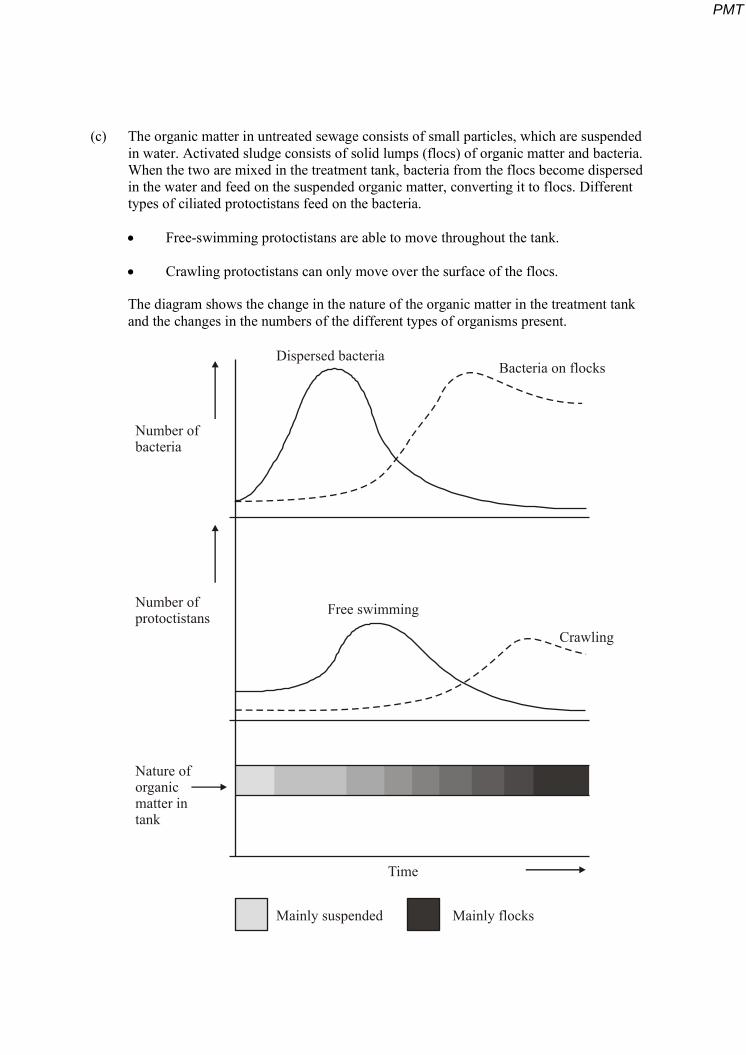
(c) The organic matter in untreated sewage consists of small particles, which are suspended in water. Activated sludge consists of solid lumps (flocs) of organic matter and bacteria. When the two are mixed in the treatment tank, bacteria from the flocs become dispersed in the water and feed on the suspended organic matter, converting it to flocs. Different types of ciliated protoctistans feed on the bacteria.
Free-swimming protoctistans are able to move throughout the tank.
Crawling protoctistans can only move over the surface of the flocs.
The diagram shows the change in the nature of the organic matter in the treatment tank and the changes in the numbers of the different types of organisms present.
Number ofbacteria
Number ofprotoctistans Free swimming
Crawling
Dispersed bacteriaBacteria on flocks
Nature oforganicmatter intank
Time
Mainly suspended Mainly flocks
PMT

(i) Explain the changes in the numbers of dispersed bacteria and the numbers of free-swimming protoctistans.
...........................................................................................................................
...........................................................................................................................
...........................................................................................................................
...........................................................................................................................
...........................................................................................................................
........................................................................................................................... (3)
(ii) Explain how the changes that occur in the treatment tank illustrate the process of succession.
...........................................................................................................................
...........................................................................................................................
...........................................................................................................................
...........................................................................................................................
...........................................................................................................................
...........................................................................................................................
...........................................................................................................................
........................................................................................................................... (4)
(Total 15 marks)
PMT
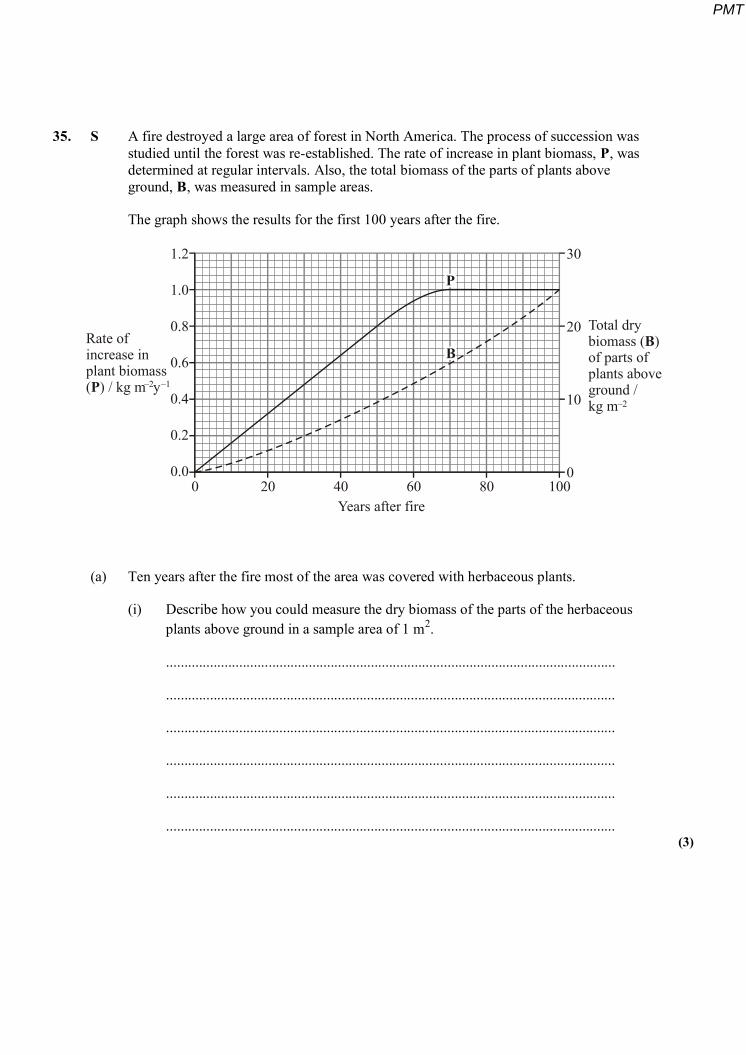
35. S A fire destroyed a large area of forest in North America. The process of succession was studied until the forest was re-established. The rate of increase in plant biomass, P, was determined at regular intervals. Also, the total biomass of the parts of plants above ground, B, was measured in sample areas.
The graph shows the results for the first 100 years after the fire.
Rate ofincrease inplant biomass( ) / kg m yP
Total drybiomass ( )of parts ofplants aboveground /kg m
B
1.2
1.0
0.8
0.6
0.4
0.2
0.00 20 40 60 80 100
Years after fire
30
20
10
0
P
B
–2
–2
–1
(a) Ten years after the fire most of the area was covered with herbaceous plants.
(i) Describe how you could measure the dry biomass of the parts of the herbaceous plants above ground in a sample area of 1 m2.
...........................................................................................................................
...........................................................................................................................
...........................................................................................................................
...........................................................................................................................
...........................................................................................................................
........................................................................................................................... (3)
PMT

(ii) How could the researchers make sure that they obtained reliable data for the total biomass (B)?
...........................................................................................................................
...........................................................................................................................
...........................................................................................................................
........................................................................................................................... (2)
(iii) Suggest two limitations involved in measuring the rate of increase in plant biomass (P) which would affect the accuracy of the data.
1 ........................................................................................................................
...........................................................................................................................
2 ........................................................................................................................
........................................................................................................................... (2)
(b) The ratio of P to B after 10 years was 1 : 10.
(i) Calculate the ratio of P to B after 100 years.
Ratio ............................................... (1)
PMT

(ii) Explain the change in the ratio between 10 years and 100 years.
...........................................................................................................................
...........................................................................................................................
...........................................................................................................................
........................................................................................................................... (2)
(Total 10 marks)
36. (a) The diagram shows part of a food web in a marine ecosystem.
Phytoplankton Barnacle larva
Sand eel
Herring Cormorant
70% of diet
21% diet
Draw and label a pyramid of numbers for the food chain.
Phytoplankton Barnacle larva Herring - Cormorant.
(1)
(b) Explain, in terms of energy, why food chains with the fewest steps are most efficient.
.....................................................................................................................................
............................................................................................................................. ........
.....................................................................................................................................
............................................................................................................................. ........ (2)
PMT
(c) If the barnacle population were to decrease as a result of pollution. explain how the herring population may be affected.
............................................................................................................................. ........
.....................................................................................................................................
............................................................................................................................. ........
..................................................................................................................................... (2)
(Total 5 marks)
37. Read the following passage.
Reef-building corals are small marine animals that form immense colonies. Each animal (called a polyp) has a small sac-like body surrounded by a ring of tentacles. The beating action of these tentacles sets up a current which brings in a continuous supply of the tiny planktonic organisms which form their food.
5 The Gulf of Aqaba at the top of the Red Sea is home to the world‟s northernmost coral reefs. It is also becoming an increasingly popular tourist spot and an upsurge of tourism in this area could cause permanent damage to this ecosystem.
Development is often accompanied by pollution. With no rivers entering it and a relatively narrow connection with the rest of the Red Sea, the Gulf is so clear that it has 10 been called a “blue desert”. These are the conditions in which corals thrive. Pollution that enriches the water can lead to an increase in the amount of seaweed attached to the surface of the reef and to the amounts of planktonic algae suspended in the water.
Corals need sunlight because they also depend for their survival on tiny green algae that live in their tissues. These algae provide the coral polyps with additional carbon and 15 benefit in turn from nitrates and phosphates produced as waste by the corals.
(a) Explain why the waters of the Gulf of Aqaba have been called a “blue desert” (lines 9 - 10).
.....................................................................................................................................
............................................................................................................................. ........
............................................................................................................................. ........ (2)
PMT

(b) (i) What name is given to the relationship between the coral polyps and the algae living in their tissues?
........................................................................................................................... (1)
(ii) Explain how the coral polyps gain carbon from the algae living in their tissues (line 14).
...........................................................................................................................
...........................................................................................................................
...........................................................................................................................
...........................................................................................................................
........................................................................................................................... (3)
(c) Explain the link between pollution, planktonic algae and a decrease in corals.
.....................................................................................................................................
............................................................................................................................. ........
.....................................................................................................................................
............................................................................................................................. ........
............................................................................................................................. ........
.......................................................................................................................... ...........
............................................................................................................................. ........
.....................................................................................................................................
............................................................................................................................. ........
.....................................................................................................................................
............................................................................................................................. ........
..................................................................................................................................... (6)
(Total 12 marks)
PMT
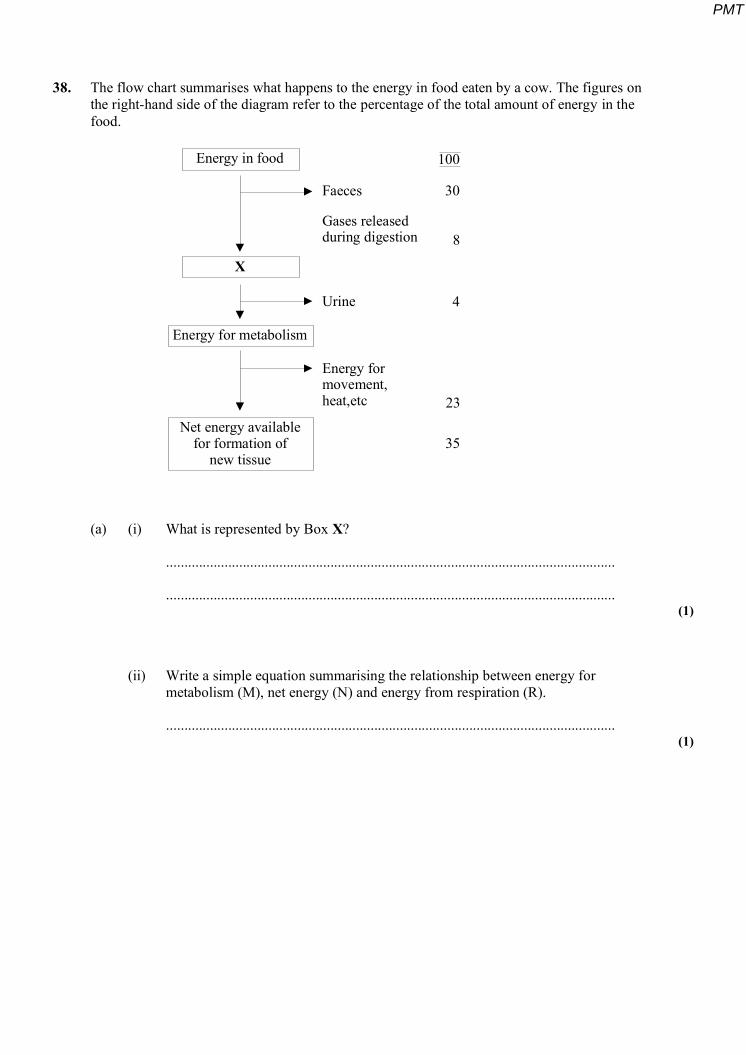
38. The flow chart summarises what happens to the energy in food eaten by a cow. The figures on the right-hand side of the diagram refer to the percentage of the total amount of energy in the food.
Energy in food
X
Energy for metabolism
Net energy availablefor formation of
new tissue
Faeces
Gases releasedduring digestion
Urine
Energy formovement,heat,etc
30
8
4
23
35
100
(a) (i) What is represented by Box X?
...........................................................................................................................
........................................................................................................................... (1)
(ii) Write a simple equation summarising the relationship between energy for metabolism (M), net energy (N) and energy from respiration (R).
........................................................................................................................... (1)
PMT
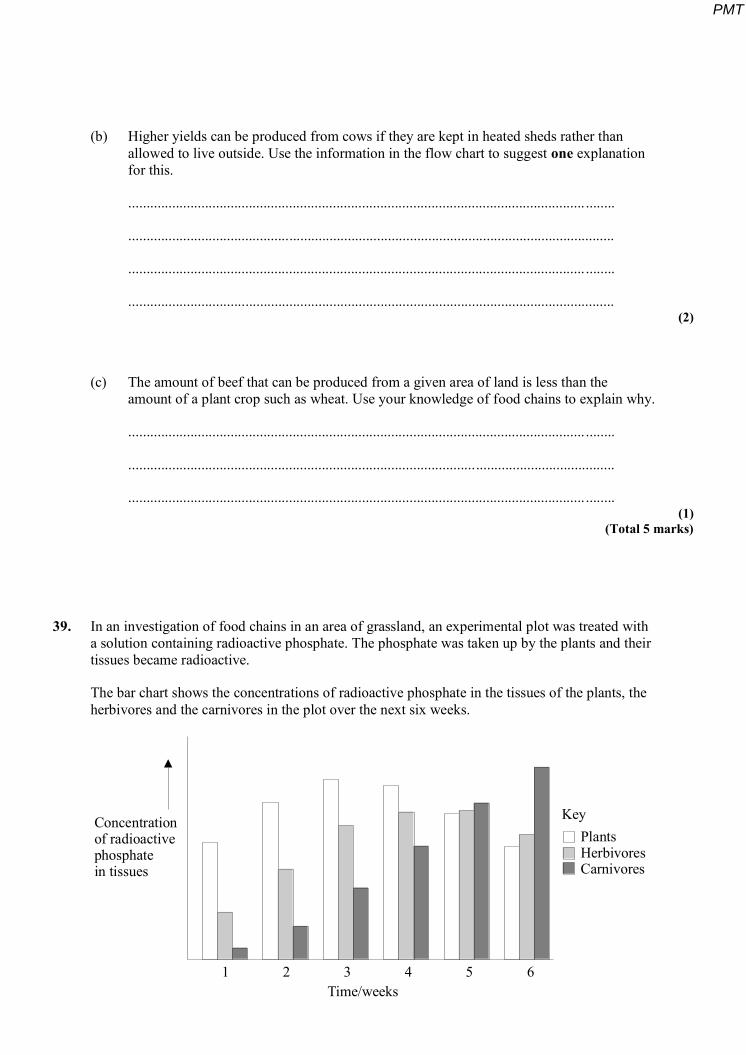
(b) Higher yields can be produced from cows if they are kept in heated sheds rather than allowed to live outside. Use the information in the flow chart to suggest one explanation for this.
............................................................................................................................. ........
.....................................................................................................................................
............................................................................................................................. ........
..................................................................................................................................... (2)
(c) The amount of beef that can be produced from a given area of land is less than the amount of a plant crop such as wheat. Use your knowledge of food chains to explain why.
............................................................................................................................. ........
.....................................................................................................................................
............................................................................................................................. ........ (1)
(Total 5 marks)
39. In an investigation of food chains in an area of grassland, an experimental plot was treated with a solution containing radioactive phosphate. The phosphate was taken up by the plants and their tissues became radioactive.
The bar chart shows the concentrations of radioactive phosphate in the tissues of the plants, the herbivores and the carnivores in the plot over the next six weeks.
Concentrationof radioactivephosphatein tissues
1 2 3 4 5 6Time/weeks
KeyPlantsHerbivoresCarnivores
PMT
(a) The radioactive phosphate was absorbed by the plant and incorporated into organic compounds. Name two phosphorus-containing organic compounds and describe their importance in plants.
........................................................................................................................... ..........
............................................................................................................................. ........
.....................................................................................................................................
............................................................................................................................. ........
.....................................................................................................................................
............................................................................................................................. ........
.....................................................................................................................................
............................................................................................................................. ........ (4)
(b) (i) Describe and explain the changes in the concentrations of radioactive phosphate in the tissues of the plants and the herbivores over the six–week period.
..........................................................................................................................
..........................................................................................................................
..........................................................................................................................
.......................................................................................................................... (4)
(ii) Suggest one way in which microorganisms are involved in recycling phosphorus contained in the tissues of dead carnivores.
..........................................................................................................................
..........................................................................................................................
.......................................................................................................................... (1)
PMT
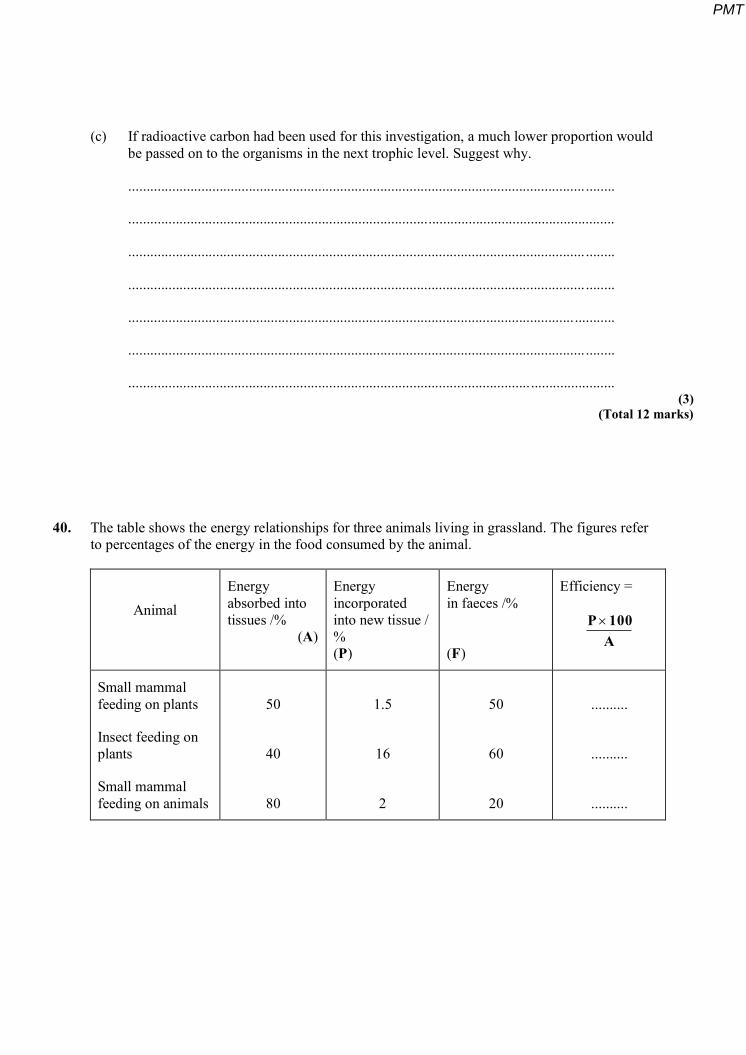
(c) If radioactive carbon had been used for this investigation, a much lower proportion would be passed on to the organisms in the next trophic level. Suggest why.
............................................................................................................................. ........
.....................................................................................................................................
............................................................................................................................. ........
............................................................................................................................. ........
.......................................................................................................................... ...........
............................................................................................................................. ........
..................................................................................................................................... (3)
(Total 12 marks)
40. The table shows the energy relationships for three animals living in grassland. The figures refer to percentages of the energy in the food consumed by the animal.
Animal Energy absorbed into tissues /% (A)
Energy incorporated into new tissue / % (P)
Energy in faeces /% (F)
Efficiency =
A100P
Small mammal feeding on plants
Insect feeding on plants
Small mammal feeding on animals
50
40
80
1.5
16
2
50
60
20
..........
..........
..........
PMT
(a) (i) Complete the table to show the efficiency. (1)
(ii) Explain what happens to the energy that is absorbed into tissue but not used in the growth of new tissue.
............................................................................................................................
............................................................................................................................
............................................................................................................................
............................................................................................................................ (2)
(iii) Suggest one reason why the percentage of energy in faeces is much higher in mammals that feed on plants than in those that feed on animals.
............................................................................................................................
............................................................................................................................ (1)
(b) Explain why efficiency is lower in
(i) the small mammal that feeds on plants than the insect that feeds on plants;
............................................................................................................................
............................................................................................................................
............................................................................................................................
............................................................................................................................ (2)
(ii) the small mammal that feeds on animals than the small mammal that feeds on plants.
............................................................................................................................
............................................................................................................................ (1)
(Total 7 marks)
PMT

41. The diagrams show a pyramid of biomass and a pyramid of energy for the same aquatic habitat.
Pyramid of biomass
Pyramid of energy
Decomposers40 gm
Decomposers926
–2
–2
–2
–2
–2
Fourth trophic level 1.5 gm
Fourth trophic level 0.4
Third trophic level 11 gm
Third trophic level 11
Second trophic level 37 gm
Second trophic level 142
First trophic level 807 gm
First trophic level 8662
(a) Suggest suitable units for the measurement of energy flow in the pyramid of energy.
..................................................................................................................................... (1)
(b) Calculate the percentage of biomass transferred from the first trophic level to the fourth trophic level. Show your working.
Percentage ........................................... (2)
PMT

S (c) (i) Most of the organisms in the first trophic level are single-celled protoctists. How do these organisms obtain their energy?
..........................................................................................................................
.......................................................................................................................... (1)
(ii) All of the energy in these protoctists is eventually transferred to the environment. Explain how.
..........................................................................................................................
..........................................................................................................................
..........................................................................................................................
..........................................................................................................................
..........................................................................................................................
.......................................................................................................................... (3)
(Total 7 marks)
42. Shrubs and small trees cover large areas of northern Canada. In winter there is deep snow for several months. Few species of mammal are adapted to survive in these conditions. The commonest primary consumer is the snowshoe hare, which feeds on the young leaves and shoots of the shrubs and small trees. When a shrub is damaged by grazing it produces toxins in the leaves and shoots. These toxins make the leaves and shoots too unpleasant for the hares to eat. Several mammalian predators feed on the hares.
PMT
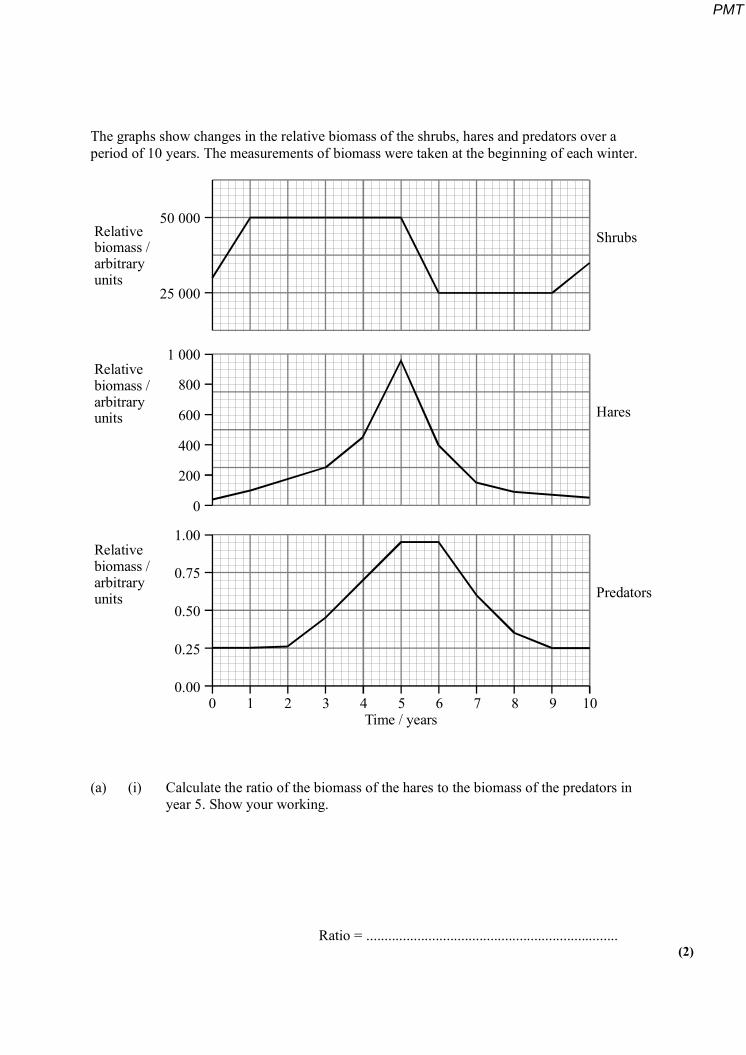
The graphs show changes in the relative biomass of the shrubs, hares and predators over a period of 10 years. The measurements of biomass were taken at the beginning of each winter.
50 000
25 000
Relativebiomass /arbitraryunits
Shrubs
1 000
800
600
400
200
0
Relativebiomass /arbitraryunits Hares
1.00
0.75
0.50
0.25
0.00
Relativebiomass /arbitraryunits Predators
0 1 2 3 4 5 6 7 8 9 10Time / years
(a) (i) Calculate the ratio of the biomass of the hares to the biomass of the predators in year 5. Show your working.
Ratio = ..................................................................... (2)
PMT

(ii) Use your knowledge of energy transfer to explain the difference in biomass between the hares and their predators.
..........................................................................................................................
..........................................................................................................................
..........................................................................................................................
.......................................................................................................................... (2)
(b) (i) Describe how the pattern of change in biomass over the ten years for the predators differs from the pattern for the hares.
..........................................................................................................................
..........................................................................................................................
..........................................................................................................................
.......................................................................................................................... (2)
(ii) Use the information in the passage and the graphs to explain the changes in the biomass of the hares over the ten years.
..........................................................................................................................
..........................................................................................................................
..........................................................................................................................
..........................................................................................................................
..........................................................................................................................
..........................................................................................................................
..........................................................................................................................
.......................................................................................................................... (3)
(Total 9 marks)
PMT

43. Potato plants originate from the Andes mountains in South America. They are adapted for survival in a cool climate. The potatoes we eat are food storage organs, called tubers, and are produced on underground stems.
The graph shows the rates of photosynthesis and respiration for one variety of potato plant.
Rate
0 5 10 15 20 25 30Temperature / ºC
Photosynthesis
Respiration
(a) Between which temperatures is there a net gain in energy by the potato plant?
..................................................................................................................................... (1)
S (b) When this variety was grown in a hot climate, with a mean daytime temperature of 23.5 °C, it failed to produce tubers.
Use information in the graph to explain why no tubers were produced.
............................................................................................................................. ........
.....................................................................................................................................
............................................................................................................................. ........
..................................................................................................................................... (2)
PMT
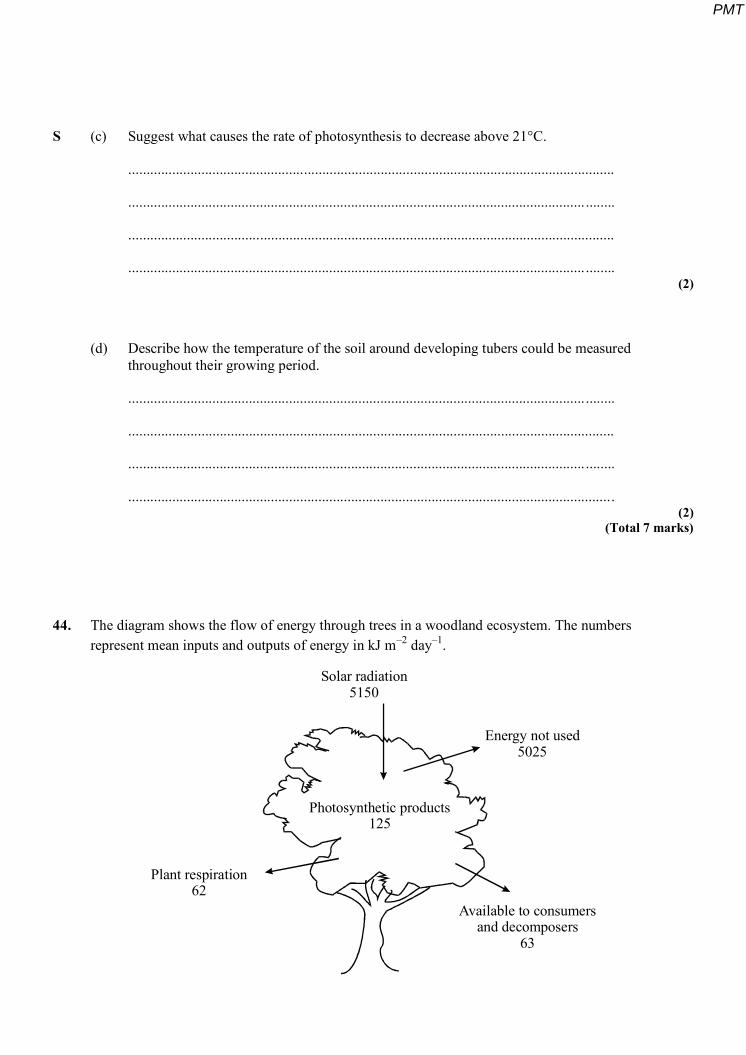
S (c) Suggest what causes the rate of photosynthesis to decrease above 21°C.
.....................................................................................................................................
............................................................................................................................. ........
.....................................................................................................................................
............................................................................................................................. ........ (2)
(d) Describe how the temperature of the soil around developing tubers could be measured throughout their growing period.
............................................................................................................................. ........
.....................................................................................................................................
............................................................................................................................. ........
..................................................................................................................................... (2)
(Total 7 marks)
44. The diagram shows the flow of energy through trees in a woodland ecosystem. The numbers represent mean inputs and outputs of energy in kJ m–2 day–1.
Plant respiration62
Available to consumersand decomposers
63
Energy not used5025
Photosynthetic products125
Solar radiation5150
PMT

(a) Use information in the diagram to
(i) give the amount of energy incorporated into tree biomass;
.......................................................................................................................... (1)
(ii) calculate the percentage of solar energy that is fixed by photosynthesis.
Answer ............................. % (2)
(b) Not all the solar radiation reaching the leaves of the tree is used in photosynthesis. Give two explanations for this.
1 ..................................................................................................................................
............................................................................................................................. ........
2 ..................................................................................................................................
............................................................................................................................. ........ (2)
PMT
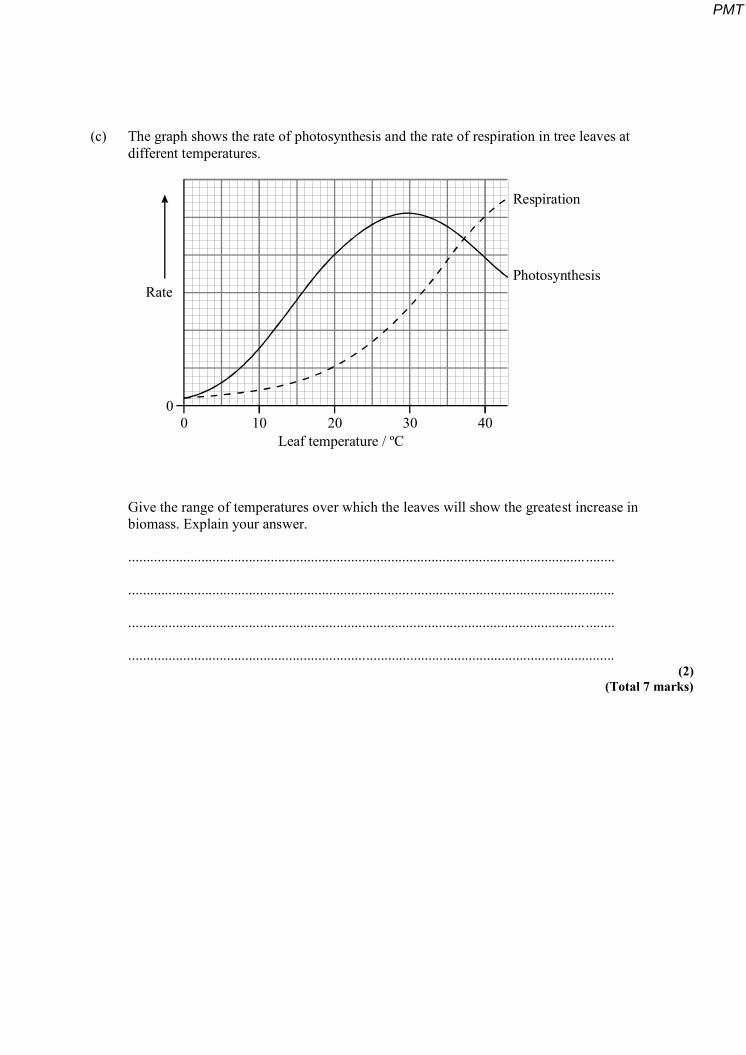
(c) The graph shows the rate of photosynthesis and the rate of respiration in tree leaves at different temperatures.
0
Rate
0 10 20 30 40Leaf temperature / ºC
Respiration
Photosynthesis
Give the range of temperatures over which the leaves will show the greatest increase in biomass. Explain your answer.
............................................................................................................................. ........
.....................................................................................................................................
............................................................................................................................. ........
..................................................................................................................................... (2)
(Total 7 marks)
PMT
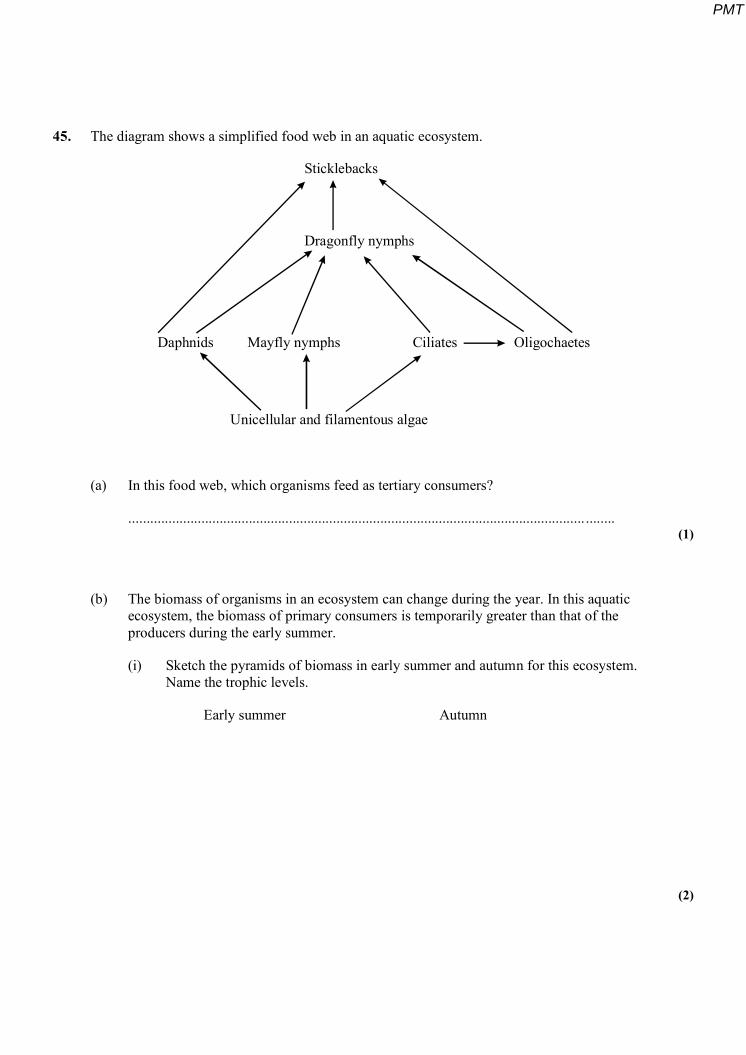
45. The diagram shows a simplified food web in an aquatic ecosystem.
Sticklebacks
Dragonfly nymphs
Daphnids Mayfly nymphs Ciliates Oligochaetes
Unicellular and filamentous algae
(a) In this food web, which organisms feed as tertiary consumers?
............................................................................................................................. ........ (1)
(b) The biomass of organisms in an ecosystem can change during the year. In this aquatic ecosystem, the biomass of primary consumers is temporarily greater than that of the producers during the early summer.
(i) Sketch the pyramids of biomass in early summer and autumn for this ecosystem. Name the trophic levels.
Early summer Autumn
(2)
PMT

(ii) Suggest suitable units to represent biomass in these pyramids.
.......................................................................................................................... (1)
(c) Explain why food chains rarely have more than five trophic levels.
.....................................................................................................................................
............................................................................................................................. ........
.....................................................................................................................................
............................................................................................................................. ........ (2)
(Total 6 marks)
46. (a) The diagram compares the transfer of energy through a herbivore and through a carnivore of similar size. The width of each arrow is proportional to the energy value.
Energy releasedin respiration Energy released
in respiration
Energy storedin tissues Energy stored
in tissues
Energy lostin faeces
Energy lostin faeces
Herbivore Carnivore
Totalenergyintake
Totalenergyintake
(i) Use the diagram to calculate the percentage of energy lost in faeces by each animal. Show your working.
Herbivore Carnivore
............................................ % ............................................ % (2)
PMT

(ii) Suggest an explanation for the percentage of energy lost in faeces for the herbivore being larger than that for the carnivore.
...........................................................................................................................
...........................................................................................................................
...........................................................................................................................
........................................................................................................................... (2)
S (b) Explain why small mammals have a higher rate of respiration than larger mammals.
.....................................................................................................................................
............................................................................................................................. ........
.....................................................................................................................................
............................................................................................................................. ........ (2)
(Total 6 marks)
PMT
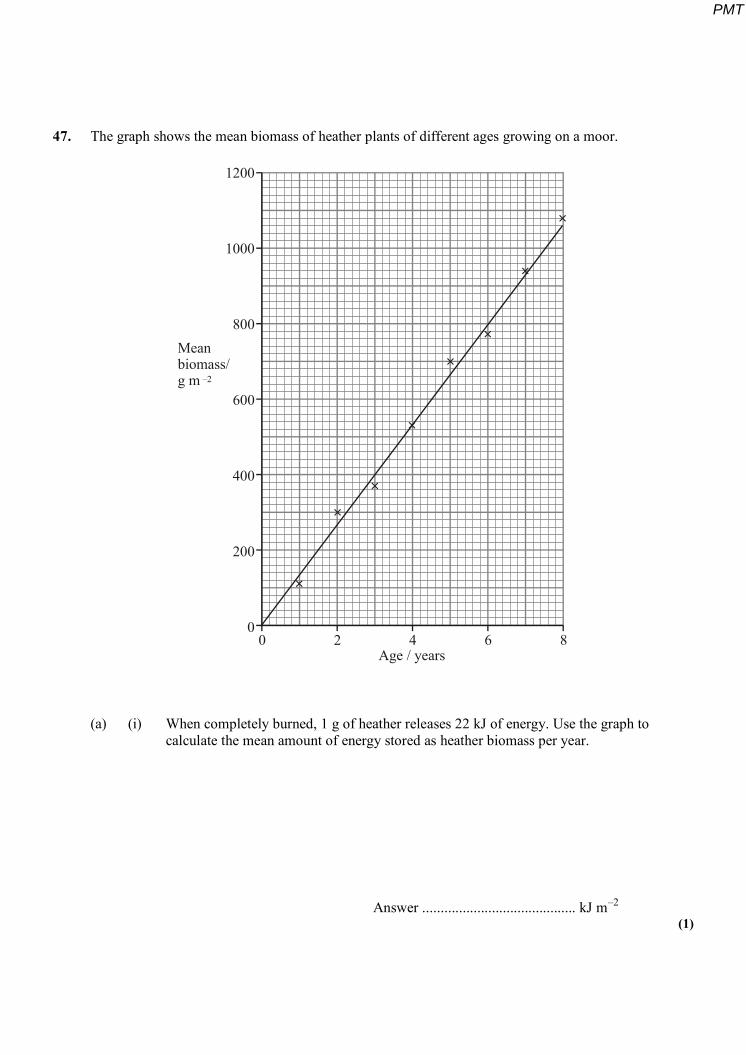
47. The graph shows the mean biomass of heather plants of different ages growing on a moor.
1200
1000
800
600
400
200
00 2 4 6 8
Age / years
Meanbiomass/g m –2
×
××
×
×
×
×
×
(a) (i) When completely burned, 1 g of heather releases 22 kJ of energy. Use the graph to calculate the mean amount of energy stored as heather biomass per year.
Answer .......................................... kJ m–2 (1)
PMT

(ii) The total amount of light energy falling on the leaves of heather plants per year is 3 150 000 kJ m–2. The chlorophyll in the leaves of the heather absorbs only 45 % of this energy.
Calculate the percentage of the total amount of energy absorbed by the chlorophyll per year which is stored as heather biomass. Show your working.
Answer ................................................. % (2)
(iii) Only a small percentage of the light energy absorbed by the chlorophyll is stored as biomass. Suggest two explanations for this.
1 ................................................................................................................…….
..................................................................................................…......................
2 ................................................................................................................…….
......................................................................................................................….. (2)
(b) Explain why only a small percentage of the energy in the heather biomass is transferred to the biomass in the next trophic level.
............................................................................................................................. ...….
.....................................................................................................................................
............................................................................................................................. ...….
............................................….....................................................................................
............................................................................................................................. ........
............................................................................................................................. ........ (3)
(Total 8 marks)
PMT

48. The diagram shows the flow of energy through a marine ecosystem.
Producers
Primary consumers
Secondary consumers
Energy in faecesand dead organismsfalling to the bottom
of the sea
Light energy
(a) Give one reason why not all the light energy falling on the producers is used in photosynthesis.
......................................................................................................................................
............................................................................................................................. ......... (1)
PMT

(b) Describe what happens to the energy in faeces and dead organisms which fall to the bottom of the sea.
............................................................................................................................. .........
......................................................................................................................................
............................................................................................................................. .........
......................................................................................................................................
............................................................................................................................. .........
...................................................................................................................................... (3)
S (c) The producers in this ecosystem are seaweeds, which have a large surface area to volume ratio. Give two advantages to seaweeds of having a large surface area to volume ratio.
1 ...................................................................................................................................
............................................................................................................................. .........
2 ...................................................................................................................................
...................................................................................................................................... (2)
S (d) Some species of seaweed are submerged in water for most of the time. Explain how being under water might affect the rate of photosynthesis.
......................................................................................................................................
............................................................................................................................. .........
............................................................................................................................. .........
......................................................................................................................................
............................................................................................................................. .........
...................................................................................................................................... (3)
(Total 9 marks)
PMT
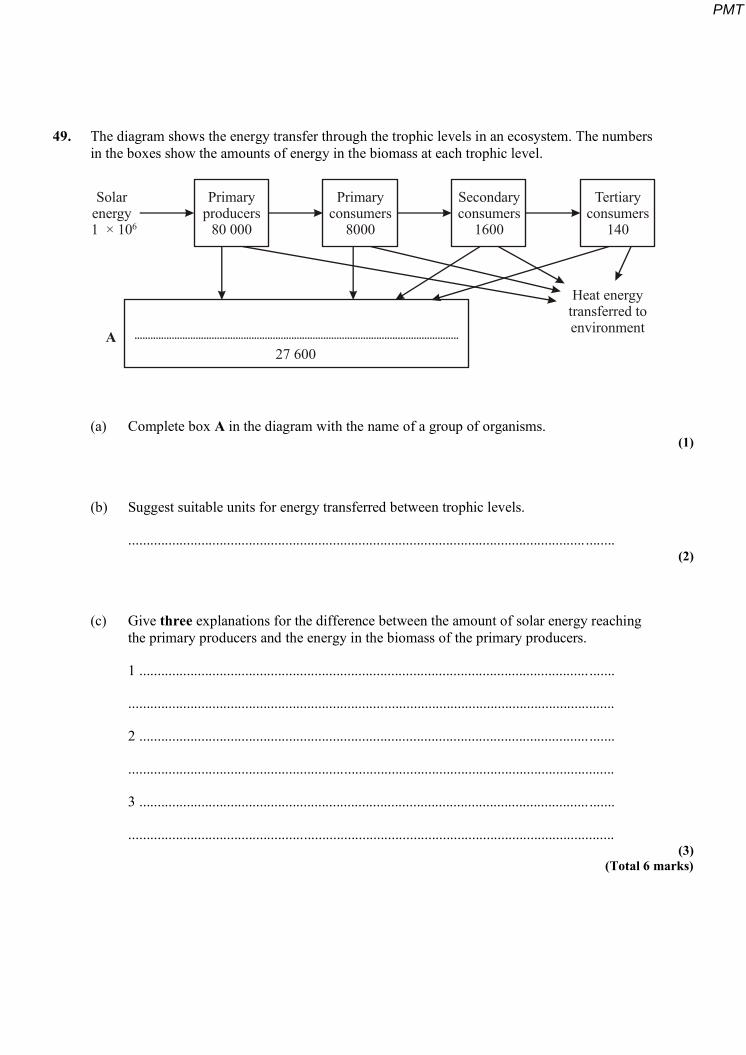
49. The diagram shows the energy transfer through the trophic levels in an ecosystem. The numbers in the boxes show the amounts of energy in the biomass at each trophic level.
Primaryproducers
80 000
Primaryconsumers
8000
Secondaryconsumers
1600
Tertiaryconsumers
140
A
Heat energytransferred toenvironment
Solarenergy1 × 10 6
27 600
(a) Complete box A in the diagram with the name of a group of organisms. (1)
(b) Suggest suitable units for energy transferred between trophic levels.
............................................................................................................................. ........ (2)
(c) Give three explanations for the difference between the amount of solar energy reaching the primary producers and the energy in the biomass of the primary producers.
1 ........................................................................................................................... .......
.....................................................................................................................................
2 ........................................................................................................................... .......
.....................................................................................................................................
3 ........................................................................................................................... .......
..................................................................................................................................... (3)
(Total 6 marks)
PMT
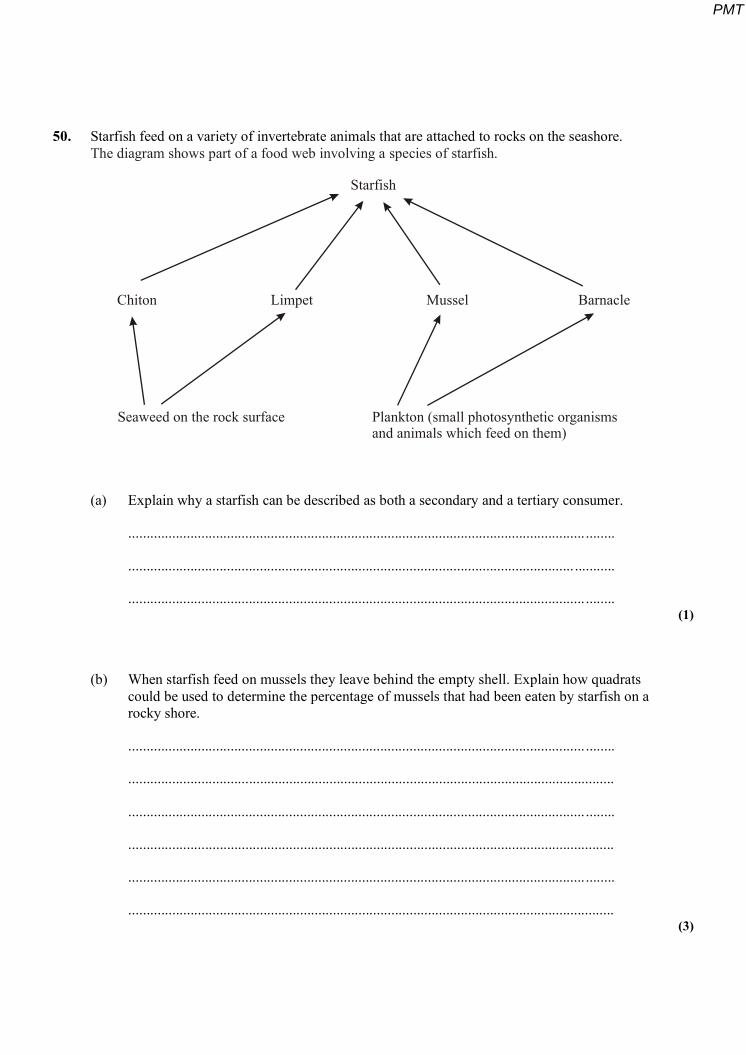
50. Starfish feed on a variety of invertebrate animals that are attached to rocks on the seashore. The diagram shows part of a food web involving a species of starfish.
Starfish
Chiton Limpet Mussel Barnacle
Seaweed on the rock surface Plankton (small photosynthetic organismsand animals which feed on them)
(a) Explain why a starfish can be described as both a secondary and a tertiary consumer.
............................................................................................................................. ........
.......................................................................................................................... ...........
............................................................................................................................. ........ (1)
(b) When starfish feed on mussels they leave behind the empty shell. Explain how quadrats could be used to determine the percentage of mussels that had been eaten by starfish on a rocky shore.
............................................................................................................................. ........
.....................................................................................................................................
............................................................................................................................. ........
.....................................................................................................................................
............................................................................................................................. ........
..................................................................................................................................... (3)
PMT
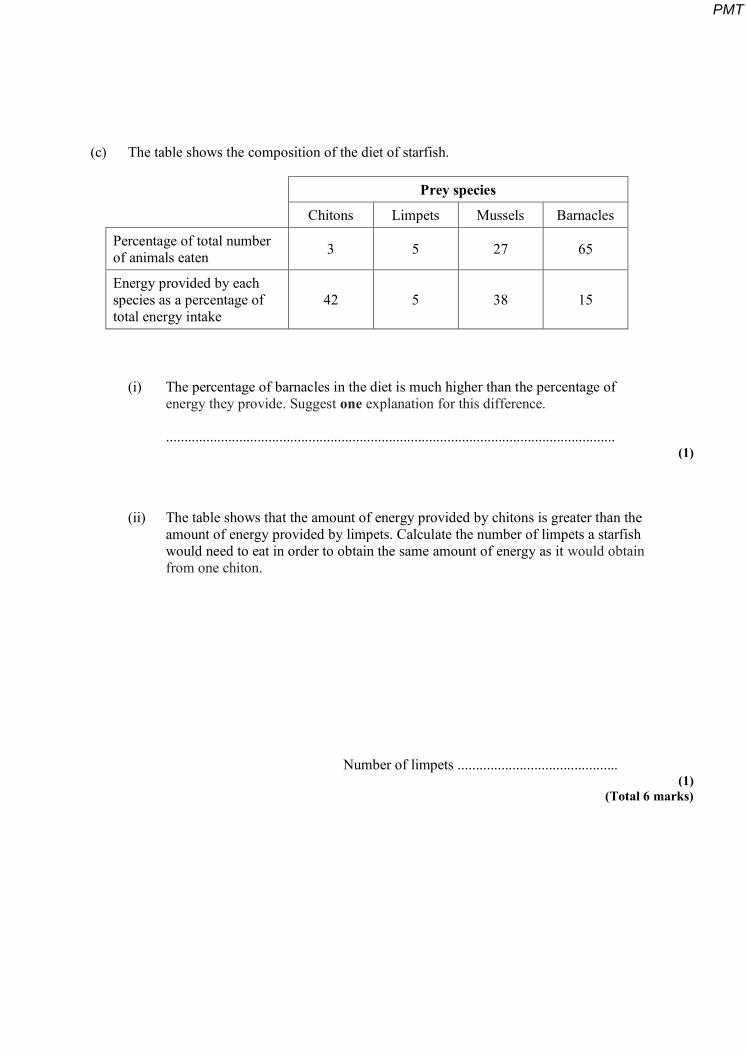
(c) The table shows the composition of the diet of starfish.
Prey species
Chitons Limpets Mussels Barnacles
Percentage of total number of animals eaten 3 5 27 65
Energy provided by each species as a percentage of total energy intake
42 5 38 15
(i) The percentage of barnacles in the diet is much higher than the percentage of energy they provide. Suggest one explanation for this difference.
........................................................................................................................... (1)
(ii) The table shows that the amount of energy provided by chitons is greater than the amount of energy provided by limpets. Calculate the number of limpets a starfish would need to eat in order to obtain the same amount of energy as it would obtain from one chiton.
Number of limpets ............................................ (1)
(Total 6 marks)
PMT
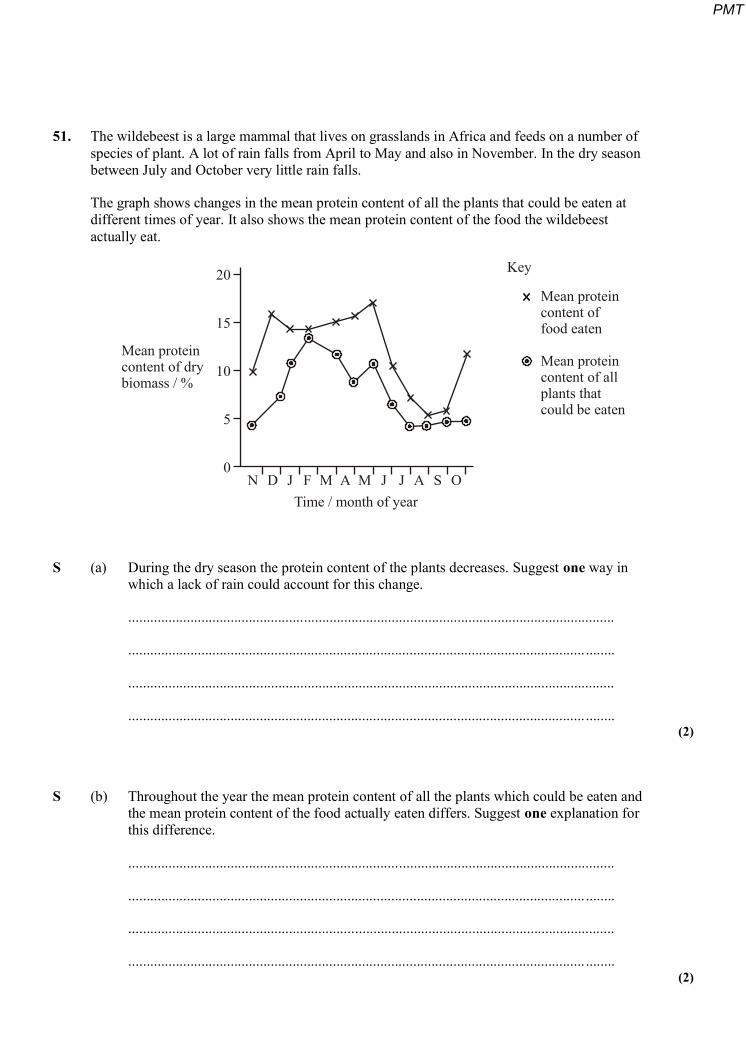
51. The wildebeest is a large mammal that lives on grasslands in Africa and feeds on a number of species of plant. A lot of rain falls from April to May and also in November. In the dry season between July and October very little rain falls.
The graph shows changes in the mean protein content of all the plants that could be eaten at different times of year. It also shows the mean protein content of the food the wildebeest actually eat.
20
15
10
5
0
Mean proteincontent of drybiomass / %
N D J F M A M J J A S OTime / month of year
Key
Mean proteincontent offood eaten
Mean proteincontent of allplants thatcould be eaten
S (a) During the dry season the protein content of the plants decreases. Suggest one way in which a lack of rain could account for this change.
.....................................................................................................................................
............................................................................................................................. ........
.....................................................................................................................................
............................................................................................................................. ........ (2)
S (b) Throughout the year the mean protein content of all the plants which could be eaten and the mean protein content of the food actually eaten differs. Suggest one explanation for this difference.
.....................................................................................................................................
............................................................................................................................. ........
.....................................................................................................................................
............................................................................................................................. ........ (2)
PMT

S (c) When wildebeest eat food containing less than 6% protein, they start to lose protein from their body tissues. Suggest and explain how a deficiency of one named protein makes the wildebeest more susceptible to being caught by predators.
.....................................................................................................................................
............................................................................................................................. ........
.....................................................................................................................................
............................................................................................................................. ........ (2)
(Total 6 marks)
52. S Write an essay on the topic below.
The transfer of substances containing carbon between organisms and between organisms and the environment
In the answer to this question you should select and use relevant principles and concepts
from different parts of the specification.
Your essay will be marked not only for its scientific accuracy, but also for the selection of
relevant material.
Write your essay in continuous prose.
The maximum number of marks that can be awarded is:
Scientific content 16
Breadth of knowledge 3
Relevance 3
Quality of Written Communication 3 (Total 25 marks)
53. In the process of succession, land on a newly formed volcanic island will be gradually colonised. Over time, changes in the composition of the plant and animal communities will occur until eventually no further change takes place.
(a) What term is used to describe the final stable community at the end of a succession?
............................................................................................................................. ........ (1)
PMT

(b) Explain why one community is gradually replaced by another during succession.
.....................................................................................................................................
............................................................................................................................. ........
.....................................................................................................................................
............................................................................................................................. ........ (2)
(c) Describe how each of the following farming practices influences the process of succession.
(i) regular grazing by sheep
...........................................................................................................................
...........................................................................................................................
...........................................................................................................................
...........................................................................................................................
(ii) ploughing fields each year
...........................................................................................................................
...........................................................................................................................
...........................................................................................................................
........................................................................................................................... (3)
(Total 6 marks)
PMT
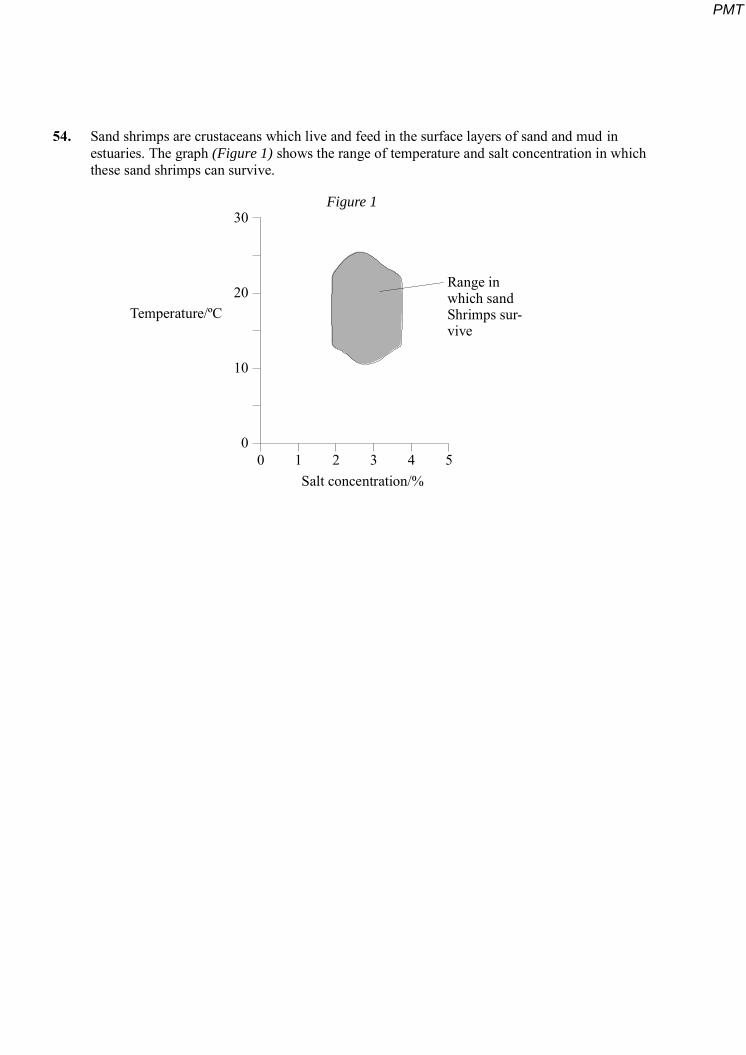
54. Sand shrimps are crustaceans which live and feed in the surface layers of sand and mud in estuaries. The graph (Figure 1) shows the range of temperature and salt concentration in which these sand shrimps can survive.
30
20
10
00 1 2 3 4 5
Salt concentration/%
Temperature/ºC
Range inwhich sandShrimps sur-vive
Figure 1
PMT
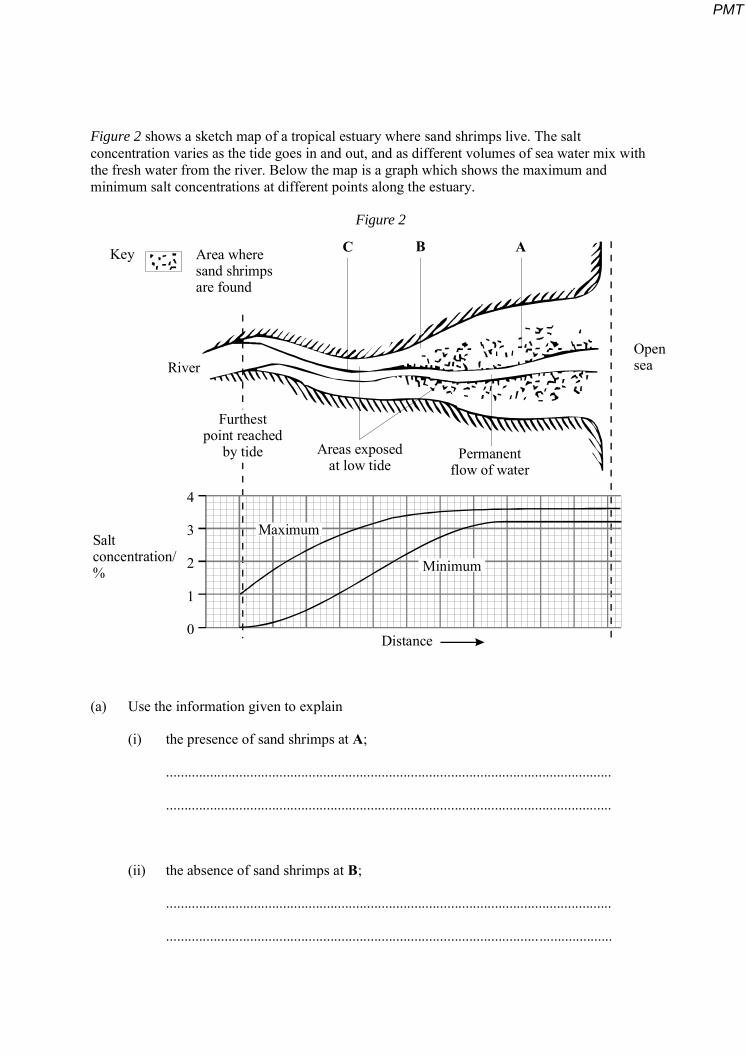
Figure 2 shows a sketch map of a tropical estuary where sand shrimps live. The salt concentration varies as the tide goes in and out, and as different volumes of sea water mix with the fresh water from the river. Below the map is a graph which shows the maximum and minimum salt concentrations at different points along the estuary.
Key Area wheresand shrimpsare found
River
Areas exposedat low tide
Permanentflow of water
C B A
Opensea
Furthestpoint reached
by tide
4
3
2
1
0
Saltconcentration/%
Distance
Figure 2
Maximum
Minimum
(a) Use the information given to explain
(i) the presence of sand shrimps at A;
..........................................................................................................................
..........................................................................................................................
(ii) the absence of sand shrimps at B;
..........................................................................................................................
..........................................................................................................................
PMT

(iii) the absence of sand shrimps at C.
..........................................................................................................................
.......................................................................................................................... (3)
(b) (i) Another species of crustacean, Y, can tolerate only salt concentrations below 1.5% and temperatures below 20 °C. Mark on the map, with a Y, one place where species Y might live.
(1)
(ii) Suggest how having different ranges of tolerance enables both species of crustacean to survive in the same estuary.
..........................................................................................................................
.......................................................................................................................... (1)
(c) Suggest two abiotic factors, other than salt concentration and temperature, that you would expect to show significant variation at point A on the map.
1. .......................................................................................................................... .......
2. ................................................................................................................................. (2)
(d) The annual biomass production per square metre is much higher in the estuary than on the land around the estuary. The mean length of the food chains in the estuary is also greater. Suggest an explanation for the estuary having longer food chains.
............................................................................................................................. ........
.....................................................................................................................................
............................................................................................................................. ........
..................................................................................................................................... (2)
(Total 9 marks)
PMT
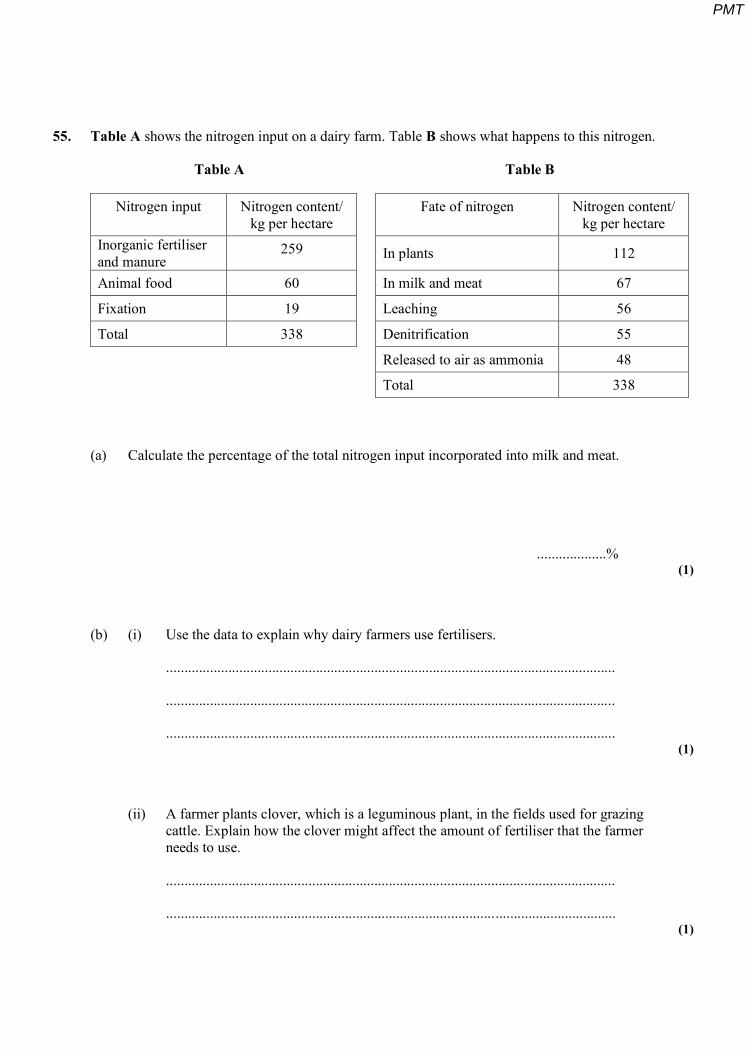
55. Table A shows the nitrogen input on a dairy farm. Table B shows what happens to this nitrogen.
Table A Table B
Nitrogen input Nitrogen content/ kg per hectare
Fate of nitrogen Nitrogen content/ kg per hectare
Inorganic fertiliser and manure
259 In plants 112
Animal food 60 In milk and meat 67
Fixation 19 Leaching 56
Total 338 Denitrification 55
Released to air as ammonia 48
Total 338
(a) Calculate the percentage of the total nitrogen input incorporated into milk and meat.
...................% (1)
(b) (i) Use the data to explain why dairy farmers use fertilisers.
...........................................................................................................................
...........................................................................................................................
........................................................................................................................... (1)
(ii) A farmer plants clover, which is a leguminous plant, in the fields used for grazing cattle. Explain how the clover might affect the amount of fertiliser that the farmer needs to use.
...........................................................................................................................
........................................................................................................................... (1)
PMT

(ii) Explain how environmental damage may arise from leaching of fertiliser.
...........................................................................................................................
...........................................................................................................................
...........................................................................................................................
...........................................................................................................................
...........................................................................................................................
...........................................................................................................................
........................................................................................................................... (4)
(Total 7 marks)
56. The diagram shows a vertical section through an area of tropical rainforest in Malaysia.
Point A
Point B
50 m
40
30
20
10
0
PMT
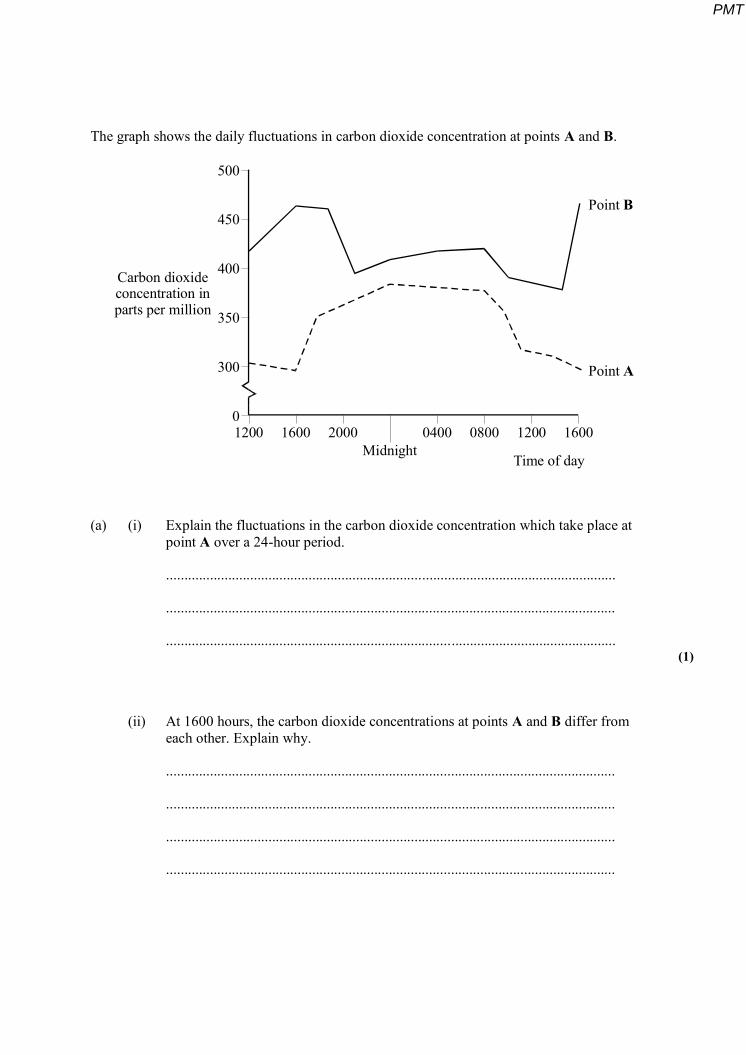
The graph shows the daily fluctuations in carbon dioxide concentration at points A and B.
Carbon dioxideconcentration inparts per million
500
450
400
350
300
01200 1600 2000
Midnight0400 0800 1200 1600
Time of day
Point B
Point A
(a) (i) Explain the fluctuations in the carbon dioxide concentration which take place at point A over a 24-hour period.
...........................................................................................................................
...........................................................................................................................
........................................................................................................................... (1)
(ii) At 1600 hours, the carbon dioxide concentrations at points A and B differ from each other. Explain why.
...........................................................................................................................
...........................................................................................................................
...........................................................................................................................
...........................................................................................................................
PMT
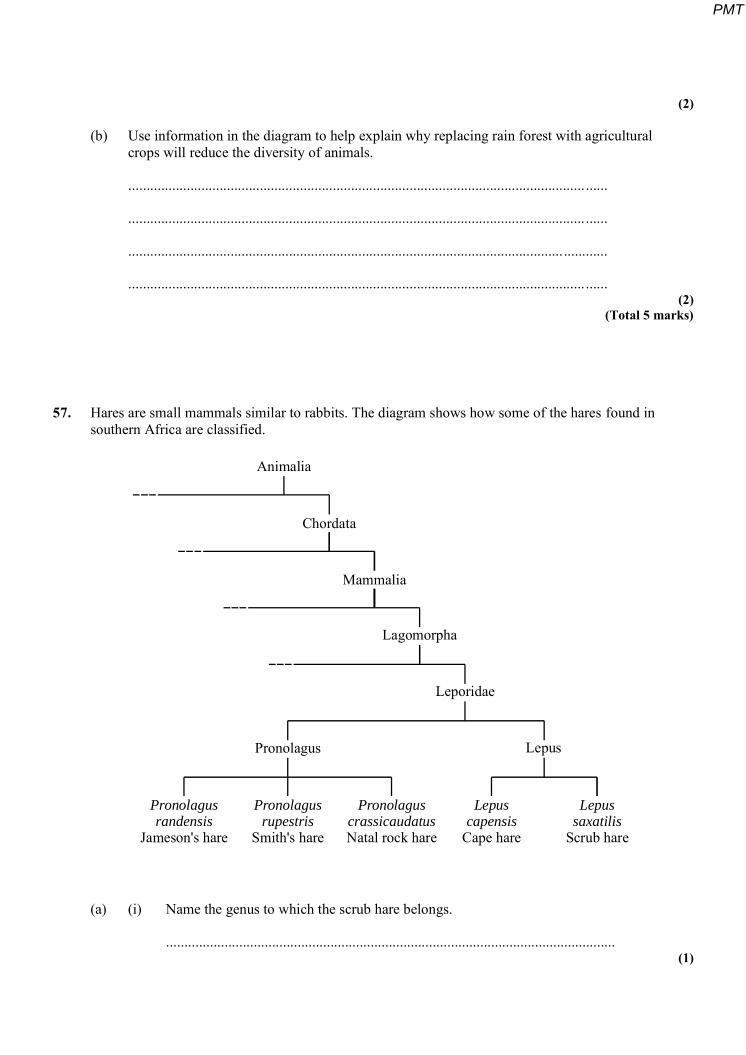
(2)
(b) Use information in the diagram to help explain why replacing rain forest with agricultural crops will reduce the diversity of animals.
............................................................................................................................. ......
............................................................................................................................. ......
....................................................................................................................... ............
............................................................................................................................. ...... (2)
(Total 5 marks)
57. Hares are small mammals similar to rabbits. The diagram shows how some of the hares found in southern Africa are classified.
Animalia
Chordata
Mammalia
Lagomorpha
Leporidae
Pronolagus Lepus
Pronolagusrandensis
Jameson's hare
Pronolagusrupestris
Smith's hare
PronolaguscrassicaudatusNatal rock hare
Lepuscapensis
Cape hare
Lepussaxatilis
Scrub hare
(a) (i) Name the genus to which the scrub hare belongs.
........................................................................................................................... (1)
PMT
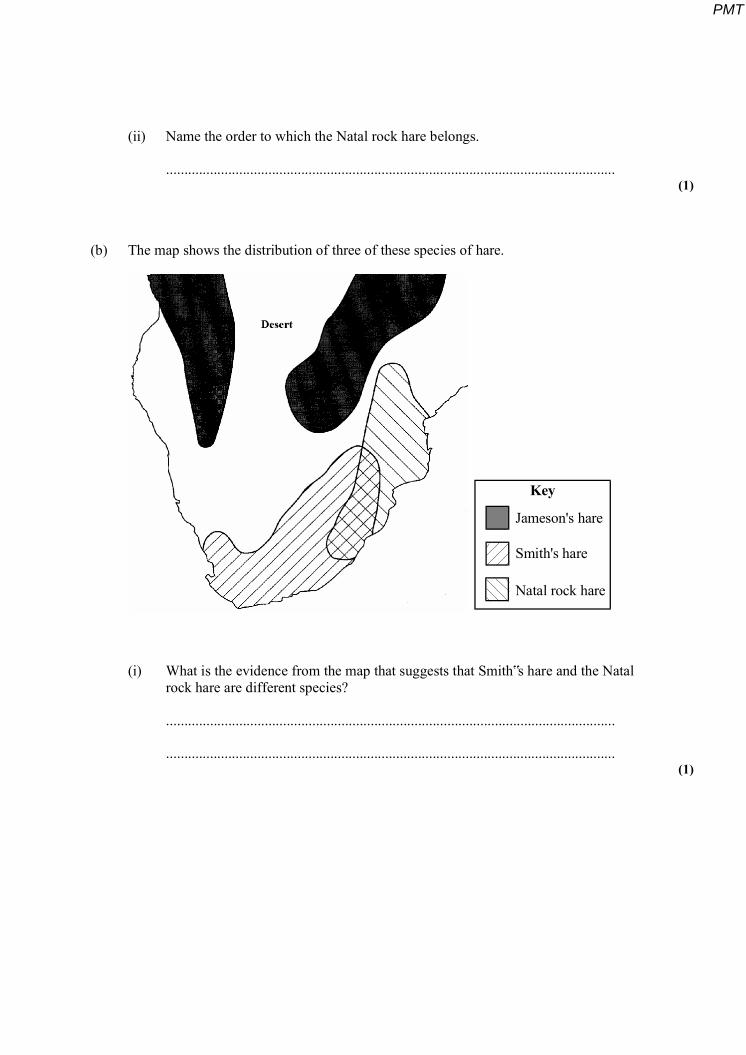
(ii) Name the order to which the Natal rock hare belongs.
........................................................................................................................... (1)
(b) The map shows the distribution of three of these species of hare.
Key
Jameson's hare
Smith's hare
Natal rock hare
(i) What is the evidence from the map that suggests that Smith‟s hare and the Natal rock hare are different species?
...........................................................................................................................
........................................................................................................................... (1)
PMT

(ii) Suggest what has caused the gene pools of the two populations of Jameson‟s hare to differ.
...........................................................................................................................
...........................................................................................................................
...........................................................................................................................
........................................................................................................................... (2)
(Total 5 marks)
58. Moose are large herbivorous animals.
(a) In a study of one population of moose, 72 animals were trapped and marked with ear tags. They were then released. One month later, fieldworkers examined 120 moose and found that 14 of these had ear tags.
Use these figures to calculate the size of the moose population. Show your working.
Answer:............................ (2)
PMT
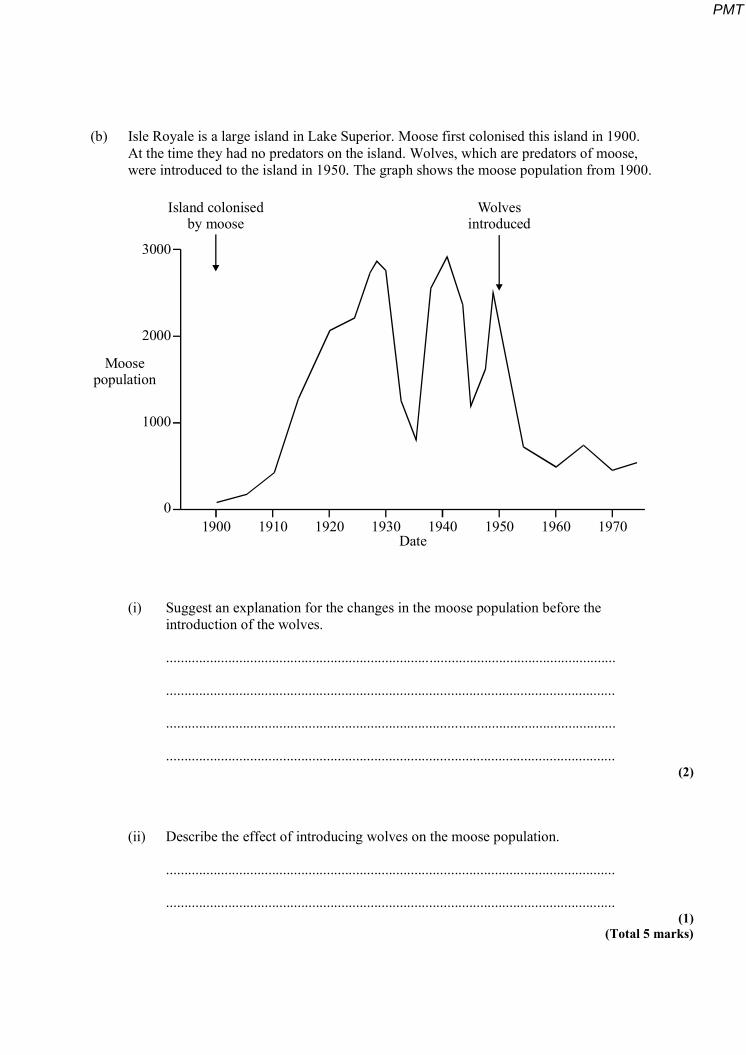
(b) Isle Royale is a large island in Lake Superior. Moose first colonised this island in 1900. At the time they had no predators on the island. Wolves, which are predators of moose, were introduced to the island in 1950. The graph shows the moose population from 1900.
Island colonisedby moose
Wolvesintroduced
3000
2000
1000
01900 1910 1920 1930 1940 1950 1960 1970
Date
Moosepopulation
(i) Suggest an explanation for the changes in the moose population before the introduction of the wolves.
...........................................................................................................................
...........................................................................................................................
...........................................................................................................................
........................................................................................................................... (2)
(ii) Describe the effect of introducing wolves on the moose population.
...........................................................................................................................
........................................................................................................................... (1)
(Total 5 marks)
PMT
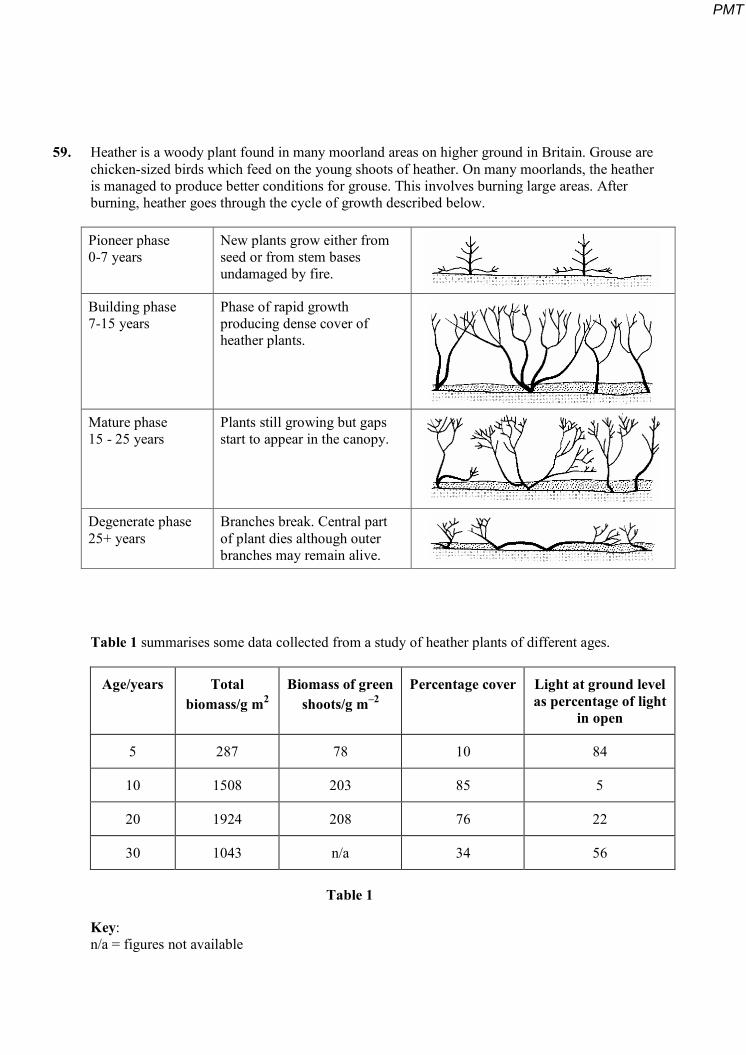
59. Heather is a woody plant found in many moorland areas on higher ground in Britain. Grouse are chicken-sized birds which feed on the young shoots of heather. On many moorlands, the heather is managed to produce better conditions for grouse. This involves burning large areas. After burning, heather goes through the cycle of growth described below.
Pioneer phase 0-7 years
New plants grow either from seed or from stem bases undamaged by fire.
Building phase 7-15 years
Phase of rapid growth producing dense cover of heather plants.
Mature phase 15 - 25 years
Plants still growing but gaps start to appear in the canopy.
Degenerate phase 25+ years
Branches break. Central part of plant dies although outer branches may remain alive.
Table 1 summarises some data collected from a study of heather plants of different ages.
Age/years Total biomass/g m2
Biomass of green shoots/g m–2
Percentage cover Light at ground level as percentage of light
in open
5 287 78 10 84
10 1508 203 85 5
20 1924 208 76 22
30 1043 n/a 34 56
Table 1
Key: n/a = figures not available
PMT

(a) To determine the total biomass, quadrats were used to collect the heather samples. Describe the procedure you would have used to place these quadrats.
............................................................................................................................. ........
.....................................................................................................................................
............................................................................................................................. ........
.....................................................................................................................................
............................................................................................................................. ........ (3)
(b) Describe how and explain why the diversity of plant species would be likely to change during the cycle of growth of the heather.
............................................................................................................................. ........
.....................................................................................................................................
............................................................................................................................. ........
.............................................................................................................................. .......
........................................................................................................................... .......... (3)
(c) (i) Calculate the mean rate of increase in the biomass of green shoots between 10 and 20 years. Show your working.
Answer: ............................................ (2)
PMT
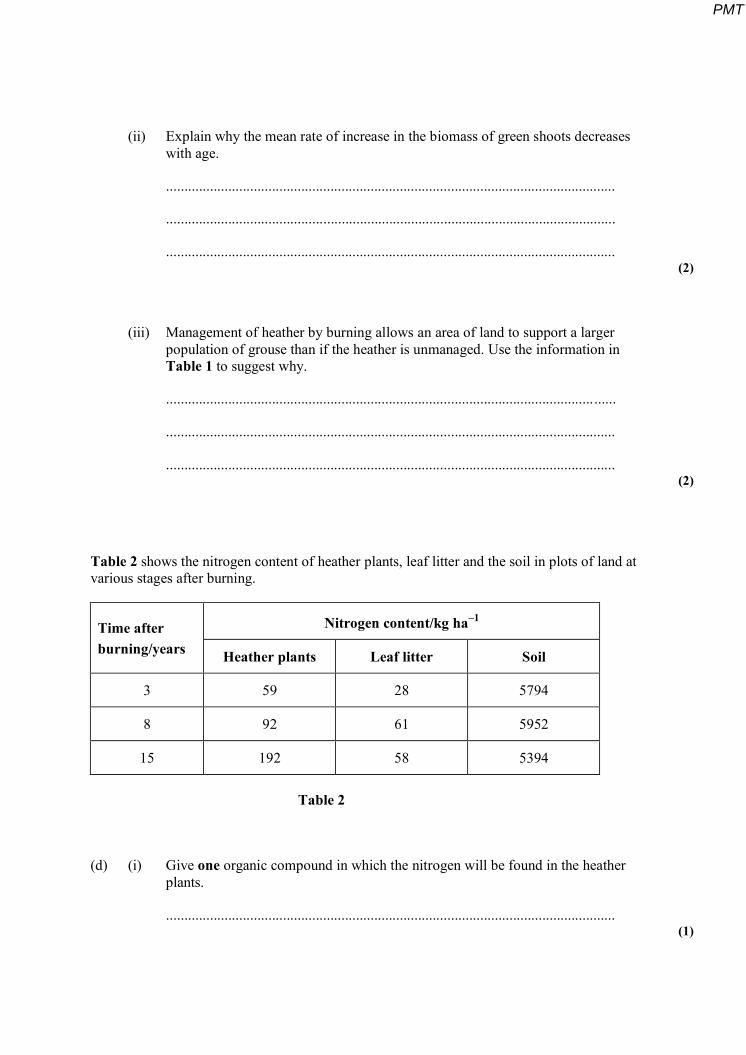
(ii) Explain why the mean rate of increase in the biomass of green shoots decreases with age.
...........................................................................................................................
...........................................................................................................................
........................................................................................................................... (2)
(iii) Management of heather by burning allows an area of land to support a larger population of grouse than if the heather is unmanaged. Use the information in Table 1 to suggest why.
...........................................................................................................................
...........................................................................................................................
........................................................................................................................... (2)
Table 2 shows the nitrogen content of heather plants, leaf litter and the soil in plots of land at various stages after burning.
Time after Nitrogen content/kg ha–1
burning/years Heather plants Leaf litter Soil
3 59 28 5794
8 92 61 5952
15 192 58 5394
Table 2
(d) (i) Give one organic compound in which the nitrogen will be found in the heather plants.
........................................................................................................................... (1)
PMT

(ii) Give one ion in which the nitrogen will be found in the soil.
........................................................................................................................... (1)
(e) Explain how bacteria make nitrogen present in the leaf litter available to the heather plants.
............................................................................................................................. ........
.....................................................................................................................................
............................................................................................................................. ........
.....................................................................................................................................
............................................................................................................................. ........
.....................................................................................................................................
............................................................................................................................. ........ (4)
(f) It has been suggested that if heather moorland is to be managed by burning, this should take place before the heather is 15 years old. Use the information in Table 2 to suggest why.
.....................................................................................................................................
............................................................................................................................. ........
.....................................................................................................................................
............................................................................................................................. ........ (2)
(Total 20 marks)
PMT
60. The sand shrimp, Crangon septemspinosa, is a member of the community found in a sea-shore ecosystem.
(a) Give the meaning of:
(i) community; .......................................................................................................
...........................................................................................................................
(ii) ecosystem. ........................................................................................................
........................................................................................................................... (2)
(b) The contours on the graph represent 0%, 50% and 100% survival for C. septemspinosa in aerated water over a range of temperatures and salinities (salt content of sea water).
30
25
20
15
10
50 5 10 15 20 25 30 35 40 45
100% survival
0%survival
50% survival
Temperature/ °C
Percentage salinity
(i) What are the upper and lower limits of temperature for 100% survival of C. septemspinosa?
........................................................................................................................... (1)
PMT

(ii) Other than the factors shown in the graph, name one biotic and one abiotic factor, which might also limit the survival of C. septemspinosa.
Biotic factor ......................................................................................................
Abiotic factor .................................................................................................... (2)
(Total 5 marks)
61. The community present in a roadside ecosystem was investigated.
(a) Explain what is meant by:
(i) community; ......................................................................................................
..........................................................................................................................
(ii) ecosystem. ........................................................................................................
.......................................................................................................................... (2)
(b) The diagram shows a section through a road which has a sloping bank and hedge on each side.
HedgeHedge
South-facingbank
North-facingbank
Road
PMT
The following plant species were found growing on 10-metre lengths of the north-facing and south-facing road banks.
Plant species
White deadnettleLesser celandineDandelionRagwortCow parsleyThistleGroundsel
2318
810
75
15
0840
101
10
Index of diversity 5.94
South-facingroad bank
North-facingroad bank
Number of plants
(i) Suggest and explain how one abiotic factor might have caused differences in plant growth on the two road banks.
..........................................................................................................................
..........................................................................................................................
..........................................................................................................................
.......................................................................................................................... (2)
(ii) Explain why the south-facing road bank is likely to show greater ecological stability than the north-facing road bank.
..........................................................................................................................
..........................................................................................................................
..........................................................................................................................
.......................................................................................................................... (3)
PMT
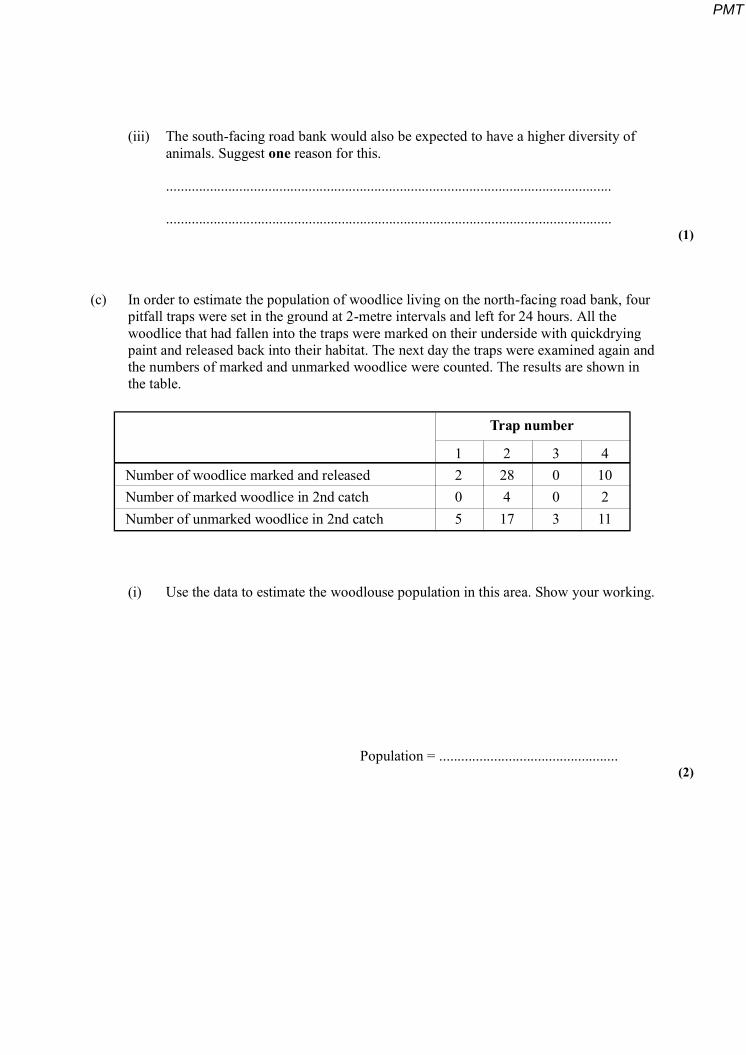
(iii) The south-facing road bank would also be expected to have a higher diversity of animals. Suggest one reason for this.
..........................................................................................................................
.......................................................................................................................... (1)
(c) In order to estimate the population of woodlice living on the north-facing road bank, four pitfall traps were set in the ground at 2-metre intervals and left for 24 hours. All the woodlice that had fallen into the traps were marked on their underside with quickdrying paint and released back into their habitat. The next day the traps were examined again and the numbers of marked and unmarked woodlice were counted. The results are shown in the table.
Number of woodlice marked and releasedNumber of marked woodlice in 2nd catchNumber of unmarked woodlice in 2nd catch
1205
228417
3003
410211
Trap number
(i) Use the data to estimate the woodlouse population in this area. Show your working.
Population = ................................................. (2)
PMT

(ii) Suggest two reasons why it is not possible to make a reliable estimate of the woodhouse population size from these data.
1 .......................................................................................................................
..........................................................................................................................
2 .......................................................................................................................
.......................................................................................................................... (2)
(Total 12 marks)
62. Limpets are animals which live on rocky sea shores. When the tide is out, a limpet is firmly attached to the rock by a muscular „foot‟. Taller limpets are more likely to be dislodged by wave action. Variation in the size of limpets was investigated on two shores, A and B. The height and width of each limpet was measured as shown in the diagram.
Height, H
Width, W
Foot
Shell
The results of the investigation are given in the table.
Mean
Sample size
Standarddeviation
HW
Shore A Shore B
0.33 0.47
0.08 0.12
28 33
PMT

(a) (i) On which shore did the limpets have a greater variation in values of W
H ?
Give evidence from the table for your answer.
.......................................................................................................................... (1)
(ii) Which shore had limpets that were better adapted to withstand wave action? Use evidence from the table to explain your answer.
..........................................................................................................................
..........................................................................................................................
..........................................................................................................................
.......................................................................................................................... (3)
(b) (i) In investigations like this, why is it necessary to collect data from a large number of specimens which are selected at random?
..........................................................................................................................
..........................................................................................................................
.......................................................................................................................... (2)
(ii) Describe how you would select limpets at random.
..........................................................................................................................
..........................................................................................................................
.......................................................................................................................... (3)
PMT
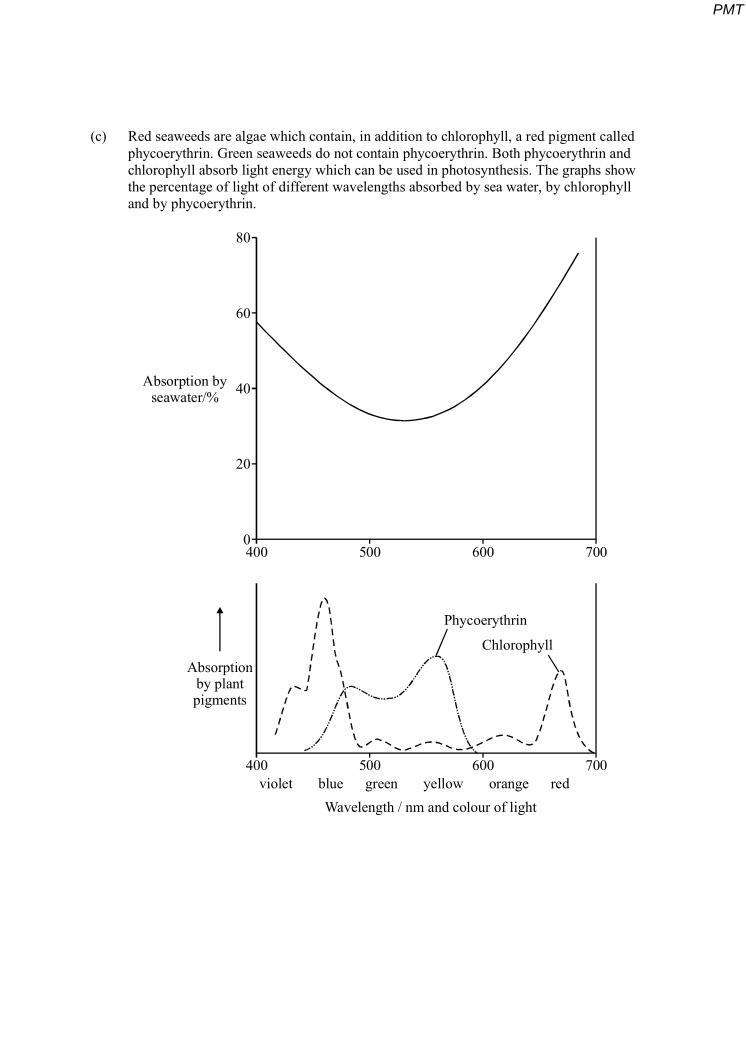
(c) Red seaweeds are algae which contain, in addition to chlorophyll, a red pigment called phycoerythrin. Green seaweeds do not contain phycoerythrin. Both phycoerythrin and chlorophyll absorb light energy which can be used in photosynthesis. The graphs show the percentage of light of different wavelengths absorbed by sea water, by chlorophyll and by phycoerythrin.
80
60
40
20
0400
400
500
500
600
600
700
700
Absorption byseawater/%
violet blue green yellow orange red
Phycoerythrin
Chlorophyll
Wavelength / nm and colour of light
Absorptionby plantpigments
PMT

Use information from the graphs to explain why red seaweeds are usually found in deeper water (further down the shore) than green seaweeds.
............................................................................................................................. .......
........................................................................................................................... .........
............................................................................................................................. .......
....................................................................................................................................
............................................................................................................................. .......
....................................................................................................................................
............................................................................................................................. .......
....................................................................................................................................
............................................................................................................................. .......
....................................................................................................................................
............................................................................................................................. ....... (6)
(Total 15 marks)
PMT
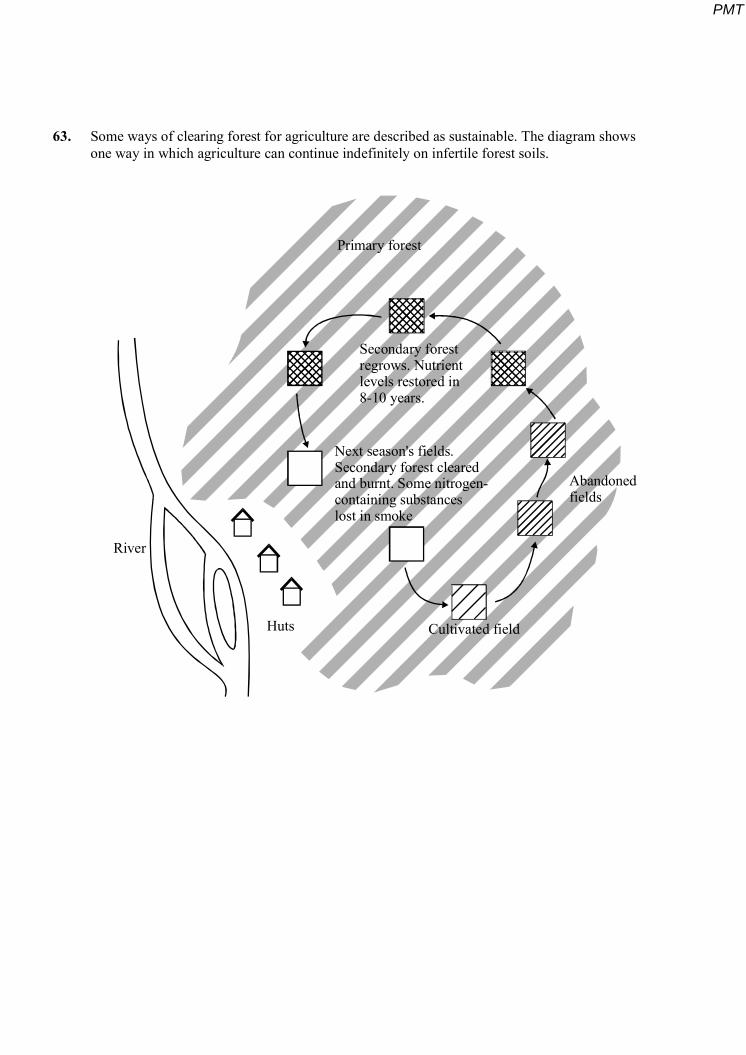
63. Some ways of clearing forest for agriculture are described as sustainable. The diagram shows one way in which agriculture can continue indefinitely on infertile forest soils.
Primary forest
River
Cultivated fieldHuts
Next season's fields.Secondary forest clearedand burnt. Some nitrogen-containing substanceslost in smoke
Abandonedfields
Secondary forestregrows. Nutrientlevels restored in8-10 years.
PMT
(a) One way to catch flying insects is to trap them on a sticky surface.
(i) Describe how you could use sticky traps to compare the diversity of flying insects in the primary forest and in a cultivated field.
..............................................................................................................................
............................................................................................................................. .
..............................................................................................................................
............................................................................................................................. .
..............................................................................................................................
............................................................................................................................. .
..............................................................................................................................
............................................................................................................................. . (4)
(ii) Describe and explain how the diversity of insects in the primary forest would differ from the diversity of insects in the cultivated field.
..............................................................................................................................
............................................................................................................................. .
..............................................................................................................................
............................................................................................................................. .
..............................................................................................................................
............................................................................................................................. .
..............................................................................................................................
............................................................................................................................. . (4)
PMT

(b) Use your knowledge of nitrogen cycling to explain
(i) why crops can be grown in the cleared field for only two or three years;
............................................................................................................................. .
..............................................................................................................................
............................................................................................................................. .
.............................................................................................................................. (2)
(ii) how the concentration of nitrates in the soil is restored 8 - 10 years after cultivation is abandoned.
............................................................................................................................. .
............................................................................................................................. .
............................................................................................................................. .
..............................................................................................................................
............................................................................................................................. .
..............................................................................................................................
............................................................................................................................. .
..............................................................................................................................
............................................................................................................................. .
.............................................................................................................................. (5)
(Total 15 marks)
PMT

64. Mayflies are insects which lay their eggs in streams and rivers. The nymphs which hatch from the eggs live in the water for several years.
Mayfly nymphs were collected by disturbing the gravel of a stream bed. A net placed immediately downstream caught any animals which were washed out of the gravel. Eight samples were collected from shallow, fast-flowing parts of the stream and eight from deeper, slow-flowing parts. Nymphs from two different families of mayfly were found. The results are given in the table.
Family Caenidae Family Baetidae
Shallow water Deep water Shallow water Deep water
Mean number of nymphs 2.38 12.88 24.50 6.00
Standard deviation 1.51 7.92 6.72 1.51
(a) Describe how you would have collected the samples in order to ensure they were representative of the habitats being investigated and could be compared with each other.
..............................................................................................................….....................
..............................................................................................................…............ .........
..............................................................................................................….....................
..............................................................................................................….....................
..............................................................................................................….....................
..............................................................................................................…..................... (3)
(b) Which one of the four samples showed the greatest variation within the sample? Give evidence from the table for your answer.
..............................................................................................................….....................
..............................................................................................................…..................... (1)
PMT
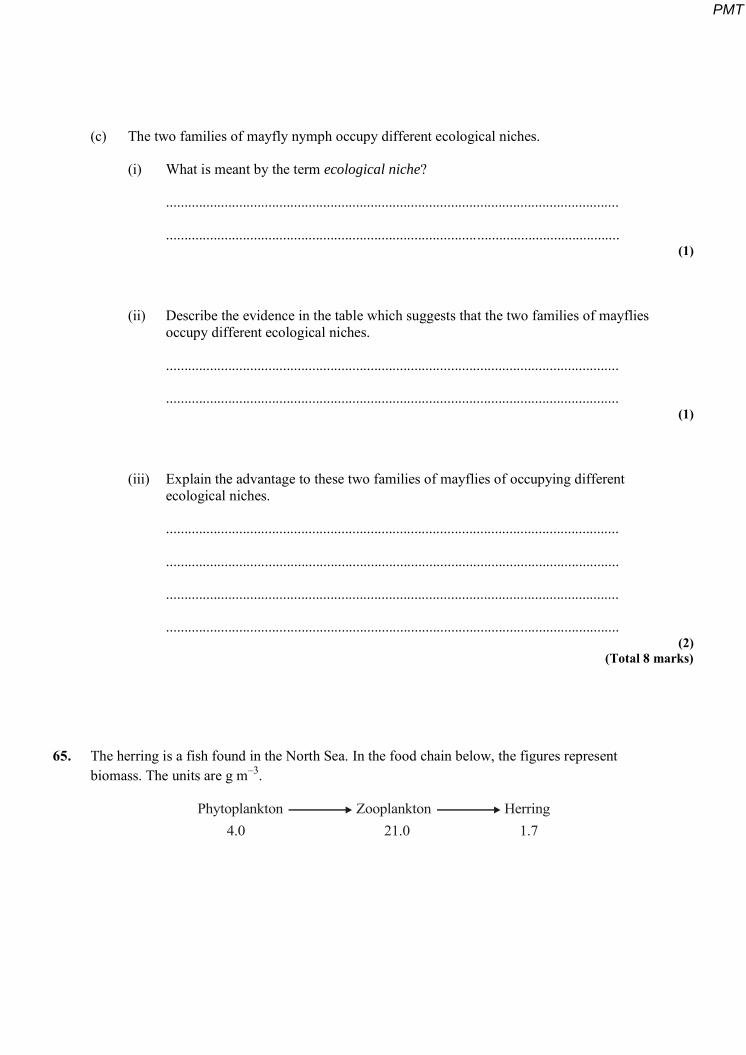
(c) The two families of mayfly nymph occupy different ecological niches.
(i) What is meant by the term ecological niche?
............................................................................................................................
............................................................................................................................ (1)
(ii) Describe the evidence in the table which suggests that the two families of mayflies occupy different ecological niches.
............................................................................................................................
............................................................................................................................ (1)
(iii) Explain the advantage to these two families of mayflies of occupying different ecological niches.
............................................................................................................................
............................................................................................................................
............................................................................................................................
............................................................................................................................ (2)
(Total 8 marks)
65. The herring is a fish found in the North Sea. In the food chain below, the figures represent biomass. The units are g m–3.
Phytoplankton Zooplankton Herring 4.0 21.0 1.7
PMT

(a) Sketch and label a pyramid of biomass to represent this food chain.
(1)
(b) In this food chain, the phytoplankton reproduce very rapidly. Suggest why this rapid rate of reproduction is essential to sustain the food chain.
............………..............................................................................................................
............………..............................................................................................................
............………..............................................................................................................
............……….............................................................................................................. (2)
(Total 3 marks)
66. (a) Explain how large-scale deforestation for agriculture would lead to a decrease in the diversity of organisms in the area.
............………..............................................................................................................
............………..............................................................................................................
............………..............................................................................................................
............……….............................................................................................................. (2)
PMT

(b) Explain how large-scale deforestation could
(i) increase the concentration of carbon dioxide in the atmosphere in the area;
...........................................................................................................................
...........................................................................................................................
...........................................................................................................................
...........................................................................................................................
(ii) decrease the concentration of carbon dioxide in the atmosphere in the area.
...........................................................................................................................
...........................................................................................................................
...........................................................................................................................
........................................................................................................................... (3)
(Total 5 marks)
67. (a) Explain the meaning of these ecological terms.
Population .…..............................................................................................................
............………..............................................................................................................
Community ............………..........................................................................................
............……….............................................................................................................. (2)
PMT

(b) Some students used the mark-release-recapture technique to estimate the size of a population of woodlice. They collected 77 woodlice and marked them before releasing them back into the same area. Later they collected 96 woodlice, 11 of which were marked.
(i) Give two conditions necessary for results from mark-release-recapture investigations to be valid.
1 ........................................................................................................................
...........................................................................................................................
2 ........................................................................................................................
........................................................................................................................... (2)
(ii) Calculate the number of woodlice in the area under investigation. Show your working.
Answer ...................................................... (2)
PMT

(c) Explain how you would use a quadrat to estimate the number of dandelion plants in a field measuring 100 m by 150 m.
............………..............................................................................................................
............………..............................................................................................................
............………..............................................................................................................
............………..............................................................................................................
............………..............................................................................................................
............……….............................................................................................................. (3)
PMT
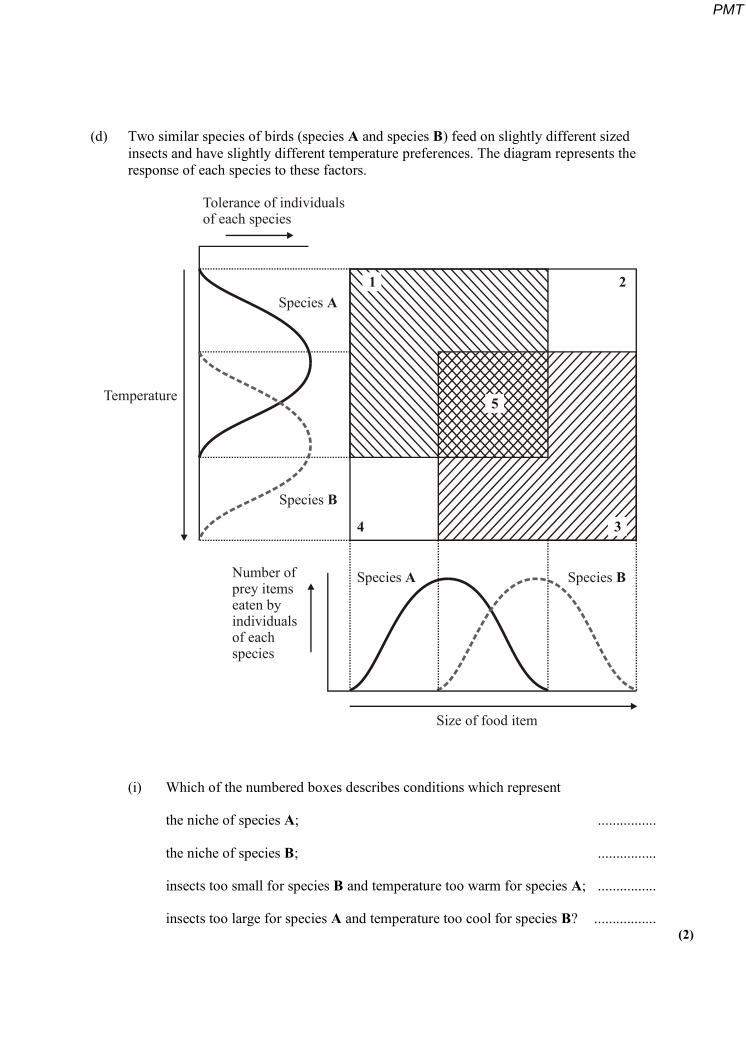
(d) Two similar species of birds (species A and species B) feed on slightly different sized insects and have slightly different temperature preferences. The diagram represents the response of each species to these factors.
Species B
Species B
Species A
Species A
Temperature
Tolerance of individualsof each species
Number ofprey itemseaten byindividualsof eachspecies
Size of food item
1 2
34
5
(i) Which of the numbered boxes describes conditions which represent
the niche of species A; ................
the niche of species B; ................
insects too small for species B and temperature too warm for species A; ................
insects too large for species A and temperature too cool for species B? ................. (2)
PMT
(ii) These two species are thought to have evolved as a result of sympatric speciation. Suggest how this might have occurred.
...........................................................................................................................
...........................................................................................................................
...........................................................................................................................
...........................................................................................................................
...........................................................................................................................
...........................................................................................................................
........................................................................................................................... (4)
(Total 15 marks)
68. Detritivorous insects feed on the dead remains of plants. Some students estimated the numbers of detritivorous insects at two different sites in an ecosystem. They also obtained data about the net primary production of the sites to see if this influenced the numbers of insects present. Net primary production is a measure of plant biomass formed per year. The results are shown in the table.
Site Number of insects
per m2 Net primary production /
g m–2 y–1
A 316 1440
B 90 550
PMT

(a) Explain how the students could use the mark-release-recapture technique to estimate the numbers of insects.
............................................................................................................................. ........
.....................................................................................................................................
............................................................................................................................. ........
............................................................................................................................... ......
.....................................................................................................................................
............................................................................................................................. ........
............................................................................................................................. ........
.......................................................................................................................... ........... (4)
(b) The students used the chi-squared (χ2) test to test the hypothesis that there was no significant difference between the numbers of insects per square metre at sites A and B. The value they obtained was 125.8. They checked this value in χ2 tables.
(i) How many degrees of freedom should they check against?
........................................................................................................................... (1)
(ii) What level of probability is normally used to judge whether a difference is statistically significant?
........................................................................................................................... (1)
PMT
(iii) The value of χ2 for the 0.001 level of probability for this number of degrees of freedom is 10.8. What does the value obtained by the students suggest about the difference in numbers of the insects per square metre between the two sites? Explain your answer.
...........................................................................................................................
...........................................................................................................................
...........................................................................................................................
........................................................................................................................... (2)
(c) (i) Explain why the net primary production of an area does not represent the total amount of plant biomass formed per year by photosynthesis.
...........................................................................................................................
...........................................................................................................................
...........................................................................................................................
........................................................................................................................... (2)
(ii) Suggest how the difference in net primary production of sites A and B might explain the difference in the number of insects between the sites.
...........................................................................................................................
........................................................................................................................... (1)
PMT
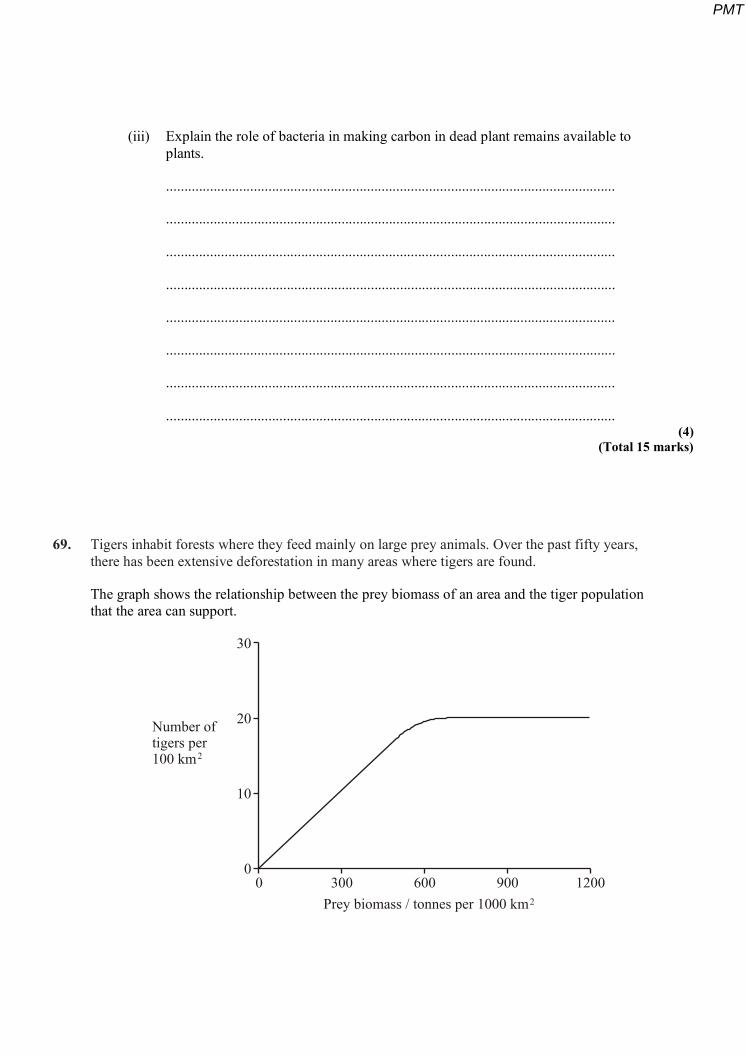
(iii) Explain the role of bacteria in making carbon in dead plant remains available to plants.
...........................................................................................................................
...........................................................................................................................
...........................................................................................................................
...........................................................................................................................
...........................................................................................................................
...........................................................................................................................
...........................................................................................................................
........................................................................................................................... (4)
(Total 15 marks)
69. Tigers inhabit forests where they feed mainly on large prey animals. Over the past fifty years, there has been extensive deforestation in many areas where tigers are found.
The graph shows the relationship between the prey biomass of an area and the tiger population that the area can support.
0 300 600 900 1200
30
20
10
0
Number oftigers per100 km2
Prey biomass / tonnes per 1000 km2
PMT

(i) What is meant by the ecological term population?
............................................................................................................................. ........
............................................................................................................................. ........ (1)
(ii) Use the graph to explain how deforestation might cause a reduction in the number of tigers in an area.
.....................................................................................................................................
............................................................................................................................. ........
............................................................................................................................. ........
.....................................................................................................................................
............................................................................................................................. ........
..................................................................................................................................... (3)
(Total 4 marks)
70. Biologists studied the process of succession in an area of wasteland over a period of ten years. They calculated the index of diversity of the area every year. After three years, the index of diversity was 1.6. After ten years, it had risen to 4.3.
(a) What information concerning the organisms present in the area is suggested by the increase in the index of diversity?
.....................................................................................................................................
............................................................................................................................. ........
............................................................................................................................. ........
.......................................................................................................................... ........... (2)
PMT
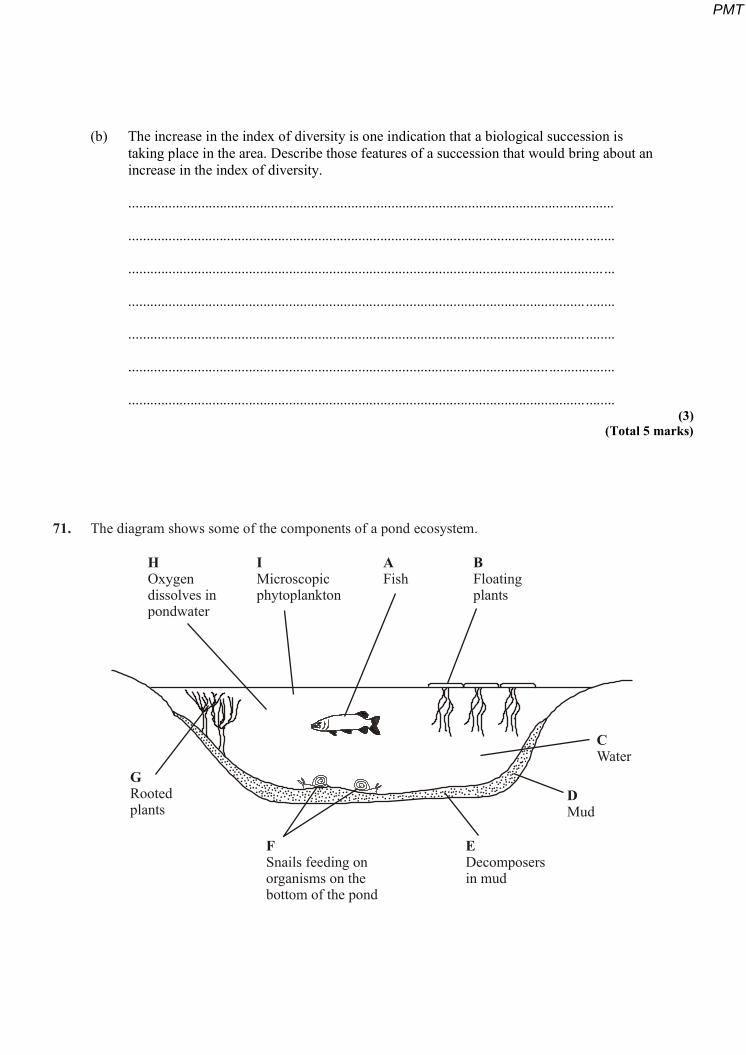
(b) The increase in the index of diversity is one indication that a biological succession is taking place in the area. Describe those features of a succession that would bring about an increase in the index of diversity.
.....................................................................................................................................
............................................................................................................................. ........
.................................................................................................................................. ...
............................................................................................................................. ........
............................................................................................................................. ........
.....................................................................................................................................
............................................................................................................................. ........ (3)
(Total 5 marks)
71. The diagram shows some of the components of a pond ecosystem.
HOxygendissolves inpondwater
IMicroscopicphytoplankton
AFish
BFloatingplants
GRootedplants
FSnails feeding onorganisms on thebottom of the pond
EDecomposersin mud
DMud
CWater
PMT

(a) (i) What is an ecosystem?
...........................................................................................................................
........................................................................................................................... (1)
(ii) List the letters that represent those components that are part of the pond community.
........................................................................................................................... (1)
(b) New Zealand pygmy weed has been introduced into many garden ponds and has spread to some natural ponds. Here, it competes with naturally occurring plants. Suggest how the introduction of pygmy weed may lead to a reduction in the diversity of the community in a natural pond.
.....................................................................................................................................
............................................................................................................................. ........
.....................................................................................................................................
............................................................................................................................. ........
.....................................................................................................................................
............................................................................................................................. ........ (3)
(Total 5 marks)
PMT

72. In the activated sludge method of sewage treatment, organic matter in untreated sewage supplies nutrients to bacteria in the treatment tank. These bacteria include decomposers and nitrifying bacteria. The bacteria are eaten by ciliated protoctistans, which are, in turn, eaten by carnivorous protoctistans.
(a) (i) Sketch and label a pyramid of energy for the organisms found in the treatment tank.
(1)
(ii) Explain what causes this pyramid of energy to be this shape.
...........................................................................................................................
...........................................................................................................................
...........................................................................................................................
........................................................................................................................... (2)
(b) (i) Explain the roles of the decomposers and the nitrifying bacteria in converting nitrogen in organic compounds in the sewage into a soluble, inorganic form.
...........................................................................................................................
...........................................................................................................................
...........................................................................................................................
...........................................................................................................................
...........................................................................................................................
........................................................................................................................... (3)
PMT

(ii) Nitrifying bacteria are one kind of bacteria that are important in the nitrogen cycle; nitrogen-fixing bacteria are another kind. Describe the part played by nitrogen-fixing bacteria in the nitrogen cycle.
...........................................................................................................................
...........................................................................................................................
...........................................................................................................................
........................................................................................................................... (2)
PMT

(c) The organic matter in untreated sewage consists of small particles, which are suspended in water. Activated sludge consists of solid lumps (flocs) of organic matter and bacteria. When the two are mixed in the treatment tank, bacteria from the flocs become dispersed in the water and feed on the suspended organic matter, converting it to flocs. Different types of ciliated protoctistans feed on the bacteria.
Free-swimming protoctistans are able to move throughout the tank.
Crawling protoctistans can only move over the surface of the flocs.
The diagram shows the change in the nature of the organic matter in the treatment tank and the changes in the numbers of the different types of organisms present.
Number ofbacteria
Number ofprotoctistans Free swimming
Crawling
Dispersed bacteriaBacteria on flocks
Nature oforganicmatter intank
Time
Mainly suspended Mainly flocks
PMT

(i) Explain the changes in the numbers of dispersed bacteria and the numbers of free-swimming protoctistans.
...........................................................................................................................
...........................................................................................................................
...........................................................................................................................
...........................................................................................................................
...........................................................................................................................
........................................................................................................................... (3)
(ii) Explain how the changes that occur in the treatment tank illustrate the process of succession.
...........................................................................................................................
...........................................................................................................................
...........................................................................................................................
...........................................................................................................................
...........................................................................................................................
...........................................................................................................................
...........................................................................................................................
........................................................................................................................... (4)
(Total 15 marks)
PMT
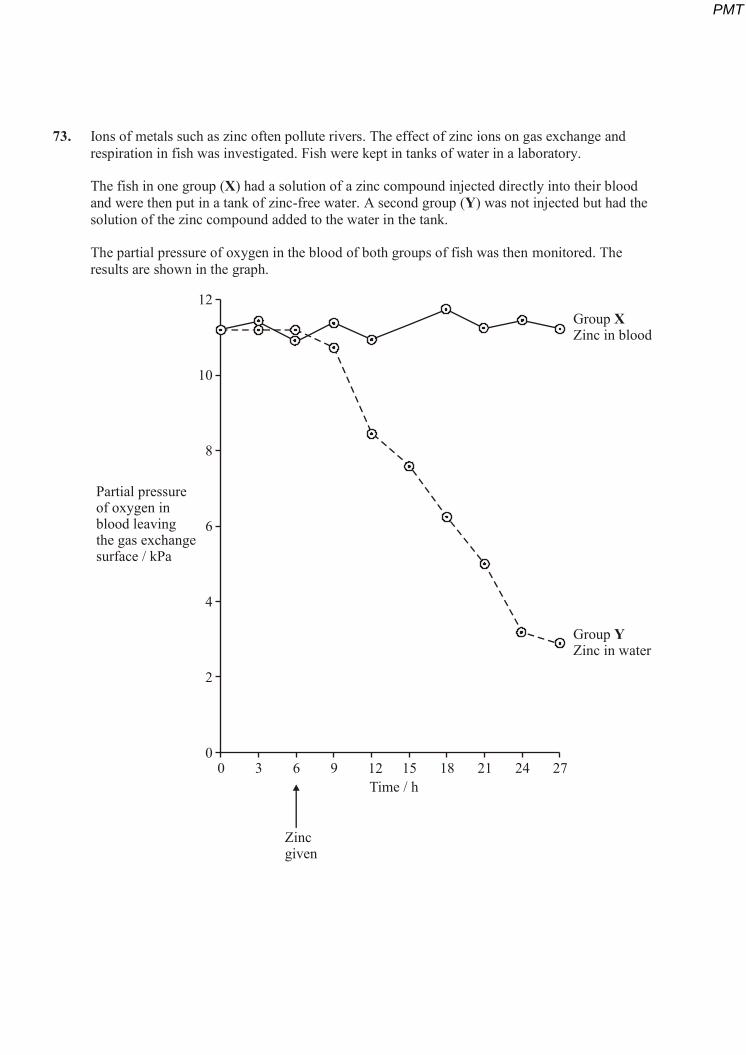
73. Ions of metals such as zinc often pollute rivers. The effect of zinc ions on gas exchange and respiration in fish was investigated. Fish were kept in tanks of water in a laboratory.
The fish in one group (X) had a solution of a zinc compound injected directly into their blood and were then put in a tank of zinc-free water. A second group (Y) was not injected but had the solution of the zinc compound added to the water in the tank.
The partial pressure of oxygen in the blood of both groups of fish was then monitored. The results are shown in the graph.
0 3 6 9 12 15 18 21 24 27
12
10
8
6
4
2
0
Partial pressureof oxygen inblood leavingthe gas exchangesurface / kPa
Group Zinc in blood
X
Group Zinc in water
Y
Zincgiven
Time / h
PMT
(a) During this investigation, the water temperature in the tanks was kept constant. Explain why changes in the water temperature might lead to the results of the investigation being unreliable.
............................................................................................................................. ........
..................................................................................................................................... (1)
(b) The results from the two groups were compared using a statistical test.
(i) Suggest a null hypothesis that could be tested.
........................................................................................................................... (1)
(ii) Explain why it is important to use a statistical test in analysing the results of this investigation.
...........................................................................................................................
...........................................................................................................................
...........................................................................................................................
........................................................................................................................... (2)
(c) Two suggestions were made to explain the results shown in the graph.
A Zinc ions reduce the rate at which oxygen is taken up from the water and passes into the blood.
B Zinc ions reduce the ability of haemoglobin to transport oxygen.
Which of these suggestions is the more likely? Explain the evidence from the graph that supports your answer.
............................................................................................................................. ........
.....................................................................................................................................
............................................................................................................................. ........
..................................................................................................................................... (2)
PMT
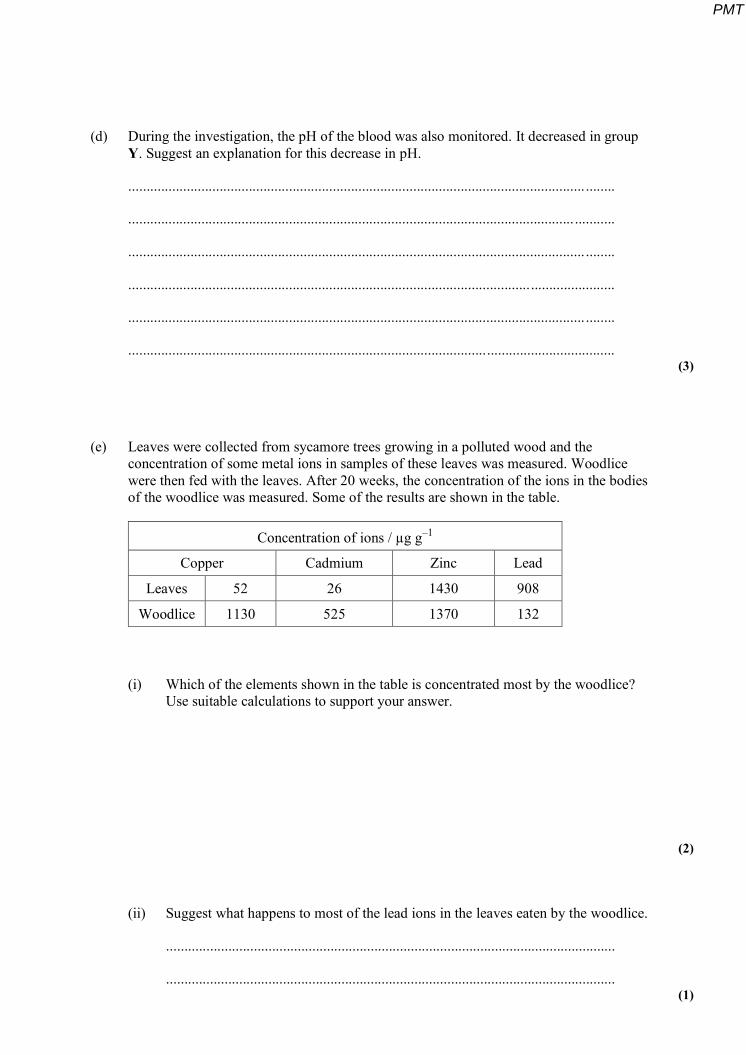
(d) During the investigation, the pH of the blood was also monitored. It decreased in group Y. Suggest an explanation for this decrease in pH.
............................................................................................................................. ........
.......................................................................................................................... ...........
............................................................................................................................. ........
.....................................................................................................................................
............................................................................................................................. ........
..................................................................................................................................... (3)
(e) Leaves were collected from sycamore trees growing in a polluted wood and the concentration of some metal ions in samples of these leaves was measured. Woodlice were then fed with the leaves. After 20 weeks, the concentration of the ions in the bodies of the woodlice was measured. Some of the results are shown in the table.
Concentration of ions / µg g–1
Copper Cadmium Zinc Lead
Leaves 52 26 1430 908
Woodlice 1130 525 1370 132
(i) Which of the elements shown in the table is concentrated most by the woodlice? Use suitable calculations to support your answer.
(2)
(ii) Suggest what happens to most of the lead ions in the leaves eaten by the woodlice.
...........................................................................................................................
........................................................................................................................... (1)
PMT
(iii) Explain the difference in the copper ion concentration between the leaves and the woodlice.
...........................................................................................................................
...........................................................................................................................
...........................................................................................................................
........................................................................................................................... (2)
(f) Yorkshire fog is a species of grass. Two varieties of Yorkshire fog were studied. One variety was tolerant to arsenic, while the other variety was not. In a series of investigations, it was found that
Arsenic-tolerant plants grow in soil which contains a high concentration of arsenic.
Arsenic-tolerant plants growing in soil containing high concentrations of arsenic and phosphorus-containing compounds have very low concentrations of arsenic in their cells. They also have low concentrations of phosphates in their cells. Arsenic and phosphorus are chemically similar.
Plants that are not tolerant to arsenic grow poorly on soil which has a high concentration of both arsenic and phosphorus-containing compounds.
Tolerance to arsenic in Yorkshire fog is caused by a single gene with the allele, a, for tolerance recessive to the allele, A, for non-tolerance.
(i) What caused the allele for tolerance to first arise?
...........................................................................................................................
........................................................................................................................... (1)
(ii) Give two functions of phosphates in plant cells.
1 ........................................................................................................................
...........................................................................................................................
2 ........................................................................................................................
........................................................................................................................... (2)
PMT
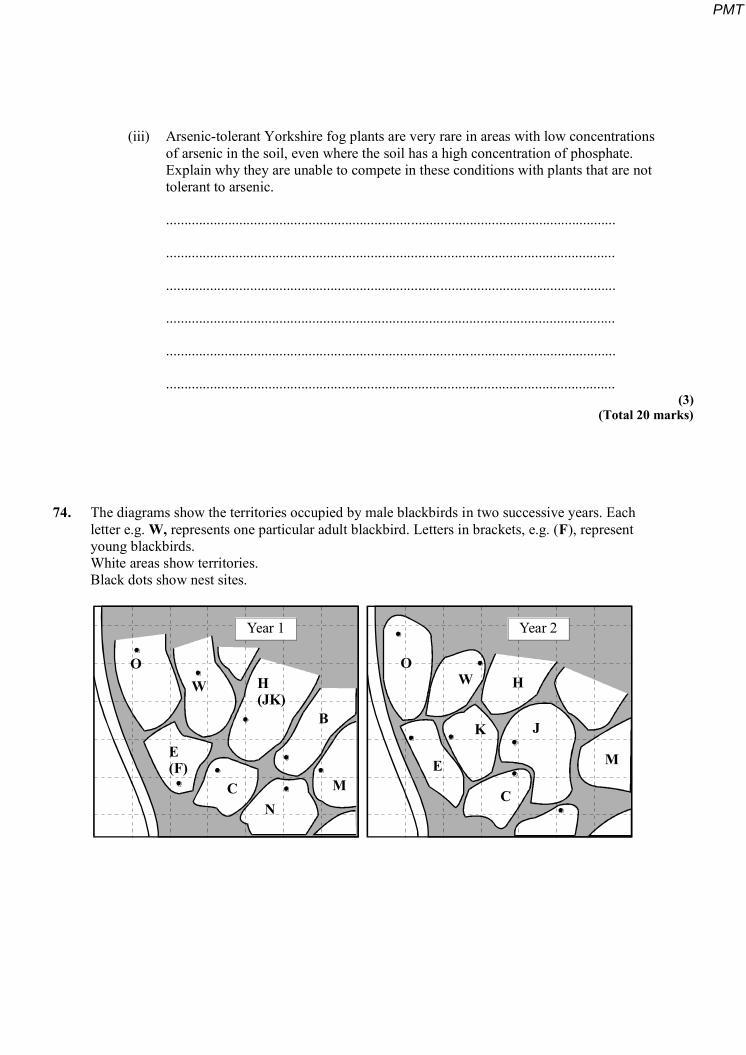
(iii) Arsenic-tolerant Yorkshire fog plants are very rare in areas with low concentrations of arsenic in the soil, even where the soil has a high concentration of phosphate. Explain why they are unable to compete in these conditions with plants that are not tolerant to arsenic.
...........................................................................................................................
...........................................................................................................................
...........................................................................................................................
...........................................................................................................................
...........................................................................................................................
........................................................................................................................... (3)
(Total 20 marks)
74. The diagrams show the territories occupied by male blackbirds in two successive years. Each letter e.g. W, represents one particular adult blackbird. Letters in brackets, e.g. (F), represent young blackbirds. White areas show territories. Black dots show nest sites.
Year 1 Year 2
OW H
(JK)B
E(F)
CN
M
OW H
JK
E
C
M
PMT

(a) The boundaries of the territories occupied by blackbirds E and H have changed over the two years. Suggest why this happened.
............................................................................................................................. ........
.......................................................................................................................... ...........
............................................................................................................................. ........
.....................................................................................................................................
............................................................................................................................. ........
.....................................................................................................................................
............................................................................................................................. ........
..................................................................................................................................... (4)
(b) Explain one advantage to a blackbird of establishing a territory.
............................................................................................................................. ........
............................................................................................................................. ........
.....................................................................................................................................
............................................................................................................................. ........ (2)
(Total 6 marks)
PMT
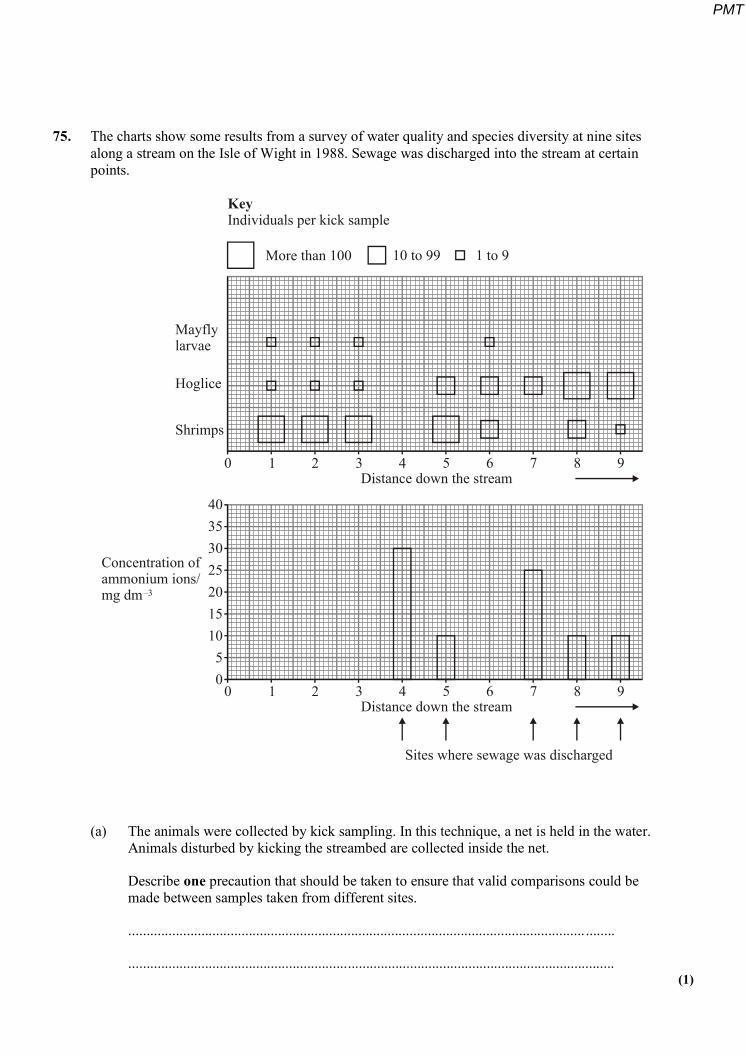
75. The charts show some results from a survey of water quality and species diversity at nine sites along a stream on the Isle of Wight in 1988. Sewage was discharged into the stream at certain points.
0
0
1
1
2
2
3
3
4
4
5
5
6
6
7
7
8
8
9
9
Distance down the stream
Distance down the stream
KeyIndividuals per kick sample
More than 100 10 to 99 1 to 9
Mayflylarvae
Hoglice
Shrimps
40353025201510
50
Concentration ofammonium ions/mg dm–3
Sites where sewage was discharged
(a) The animals were collected by kick sampling. In this technique, a net is held in the water. Animals disturbed by kicking the streambed are collected inside the net.
Describe one precaution that should be taken to ensure that valid comparisons could be made between samples taken from different sites.
............................................................................................................................. ........
..................................................................................................................................... (1)
PMT

(b) List the species in order of their tolerance to pollution by sewage.
Most tolerant ...................................................................
Medium tolerance ...................................................................
Least tolerant ................................................................... (1)
S (c) Explain why the concentration of ammonium ions was high in the samples of water taken from the sites where sewage was discharged into the stream.
.....................................................................................................................................
............................................................................................................................. ........
.....................................................................................................................................
............................................................................................................................. ........ (2)
S (d) In 1989 all houses in the area were connected to drains and so sewage no longer entered the stream. Following this, the oxygen concentration in the stream increased. Explain why.
............................................................................................................................. ........
.....................................................................................................................................
............................................................................................................................. ........
.................................................................................................................................. ...
............................................................................................................................. ........
............................................................................................................................. ........ (3)
(Total 7 marks)
PMT
76. Over most of the last 2000 years, agricultural practices in Britain have resulted in an increase in the number of species compared to the original climax forest. Modern intensive agriculture, however, is leading to a reduction in the number of invertebrate species such as insects.
(a) Explain how each of the following activities associated with modern farming might reduce the number of species of invertebrate animal.
(i) the use of herbicides
..........................................................................................................................
..........................................................................................................................
..........................................................................................................................
..........................................................................................................................
(ii) using large areas for the growth of single crops
..........................................................................................................................
..........................................................................................................................
..........................................................................................................................
.......................................................................................................................... (4)
PMT
(b) Intensive agricultural production in the European Community resulted in a surplus of some crops. One solution to this has been to pay farmers to „set-aside‟ some of their land by neither planting crops nor grazing animals on it. Describe what will happen to an area of land which is set aside and not returned to agriculture.
............................................................................................................................. ........
.....................................................................................................................................
............................................................................................................................. ........
.....................................................................................................................................
............................................................................................................................. ........
.....................................................................................................................................
............................................................................................................................. ........
..................................................................................................................................... (4)
(Total 8 marks)
77. (a) Give the ecological term that best describes each of the following.
(i) all the living organisms in a particular habitat
....................................................................
(ii) the particular set of conditions in a habitat to which a species is adapted
....................................................................
(iii) two species using the same resource in the same habitat
....................................................................
(iv) movement of a species between two habitats to make use of their resources at different times
.................................................................... (4)
PMT
(b) Explain what is meant by succession in a habitat.
............................................................................................................................. ........
.....................................................................................................................................
............................................................................................................................. ........
..................................................................................................................................... (2)
(Total 6 marks)
78. In an investigation of growth in nettles, nettle seeds were planted in soil taken from two woods where no nettles were growing. Before the seeds were planted, various mineral nutrients were added to samples of the soils from each wood. When the nettle plants had grown, their mean dry mass was measured. The results are shown in the table.
Source of soil
Mean dry mass of nettle plants/mg
NoNutrients
addedPhosphate
addedNitrateadded
Phosphateand nitrate
added
All essentialnutrients exceptphosphate added
Wood A
Wood B
6
1
92
248
5
1
125
281
5
1
(a) Which mineral nutrient was a limiting factor in the soils taken from the two woods?
.....................................................................................................................................
Explain the evidence from the table for your answer.
............................................................................................................................. ........
.....................................................................................................................................
............................................................................................................................. ........
..................................................................................................................................... (2)
PMT
(b) Phosphate can be a serious pollutant of rivers and lakes.
(i) Give two major sources of phosphates that may pollute rivers and lakes.
1..........................................................................................................................
2.......................................................................................................................... (2)
(ii) Explain how fish in a lake may be killed as a result of pollution by phosphates
..........................................................................................................................
..........................................................................................................................
..........................................................................................................................
..........................................................................................................................
..........................................................................................................................
..........................................................................................................................
..........................................................................................................................
.......................................................................................................................... (3)
(Total 7 marks)
79. (a) Explain two ways in which the expanding human population is placing increasing demands on natural communities.
....................................................................................................................................
............................................................................................................................. .......
............................................................................................................................. .......
........................................................................................................................... ......... (2)
PMT
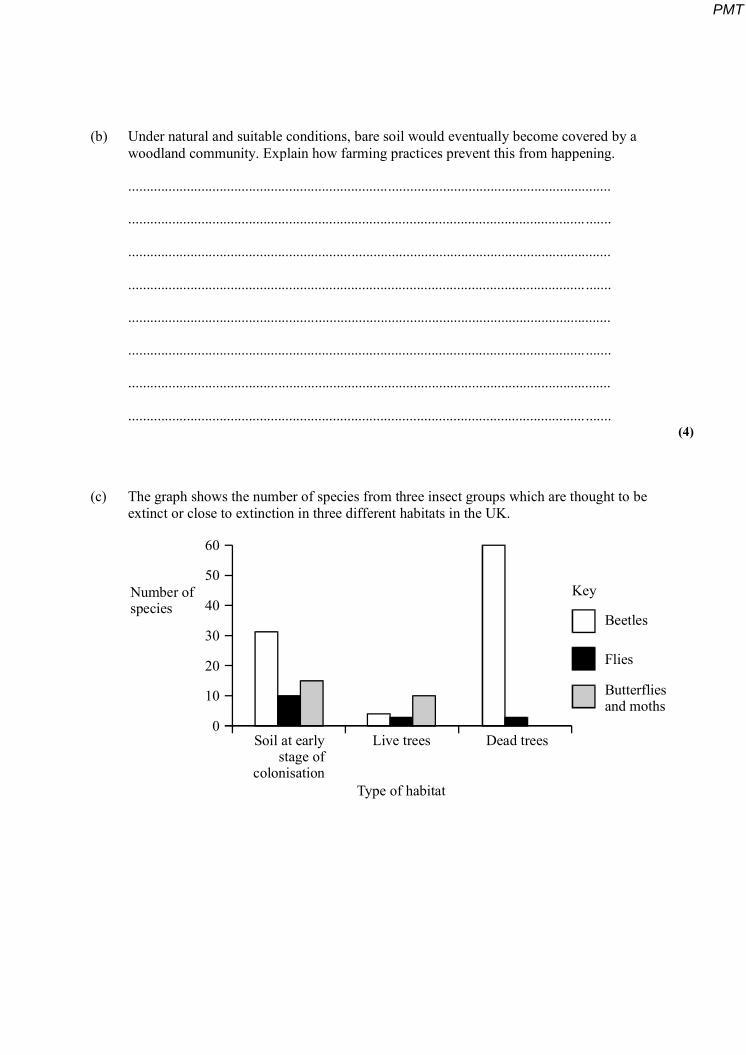
(b) Under natural and suitable conditions, bare soil would eventually become covered by a woodland community. Explain how farming practices prevent this from happening.
....................................................................................................................................
............................................................................................................................. .......
....................................................................................................................................
............................................................................................................................. .......
....................................................................................................................................
............................................................................................................................. .......
....................................................................................................................................
............................................................................................................................. ....... (4)
(c) The graph shows the number of species from three insect groups which are thought to be extinct or close to extinction in three different habitats in the UK.
60
50
40
30
20
10
0
Number ofspecies
Soil at earlystage of
colonisation
Live trees Dead trees
Type of habitat
Beetles
Flies
Butterfliesand moths
Key
PMT

(i) Farming often produces temporary areas of bare soil on which colonisation may start, but these data show that many species of insect associated with the type of community that develops in this habitat are endangered. Suggest why.
............................................................................................................................
............................................................................................................................
............................................................................................................................
............................................................................................................................
............................................................................................................................
............................................................................................................................
............................................................................................................................
............................................................................................................................ (3)
(ii) Suggest explanations for the differences between the data for live trees and dead trees.
............................................................................................................................
............................................................................................................................
............................................................................................................................
............................................................................................................................
............................................................................................................................
............................................................................................................................
............................................................................................................................
............................................................................................................................ (3)
(Total 12 marks)
PMT

80. A lichen is a combination of a fungus and an alga which form a close relationship. The fungus forms a mass that surrounds the algal cells.
Algae cells
Fungus
The fungus makes mineral ions available to the alga and receives carbohydrate from the alga. Lichens are often the first colonisers of bare rock and are common on tree bark. Their growth rate is very slow. There are three main types of lichen: shrubby lichens, leafy lichens and encrusting lichens.
(a) Suggest how the relationship allows the fungus and the alga to survive in environments where neither can survive alone.
....................................................................................................................................
............................................................................................................................. .......
....................................................................................................................................
............................................................................................................................. .......
.................................................................................................................................... (2)
PMT

(b) During colonisation of dry stone walls, lichens are replaced by a succession of other plants. Explain how changes in the plant community occur over time in this succession.
............................................................................................................................. .......
....................................................................................................................................
............................................................................................................................. .......
....................................................................................................................................
............................................................................................................................. .......
....................................................................................................................................
............................................................................................................................. .......
....................................................................................................................................
............................................................................................................................. .......
.............................................................................................................................. ...... (4)
(Total 6 marks)
81. (a) Many species of flowering plants are adapted to grow on walls.
Suggest two adaptations that enable flowering plants to grow on walls.
1 ........................................................................................................................... .......
.....................................................................................................................................
2 ........................................................................................................................... .......
..................................................................................................................................... (2)
(b) Ivy-leaved toadflax is a flowering plant that grows mainly on south-facing walls.
(i) Suggest one hypothesis to explain why ivy leaved toadflax lives on south-facing rather than north-facing walls.
..........................................................................................................................
.......................................................................................................................... (1)
PMT
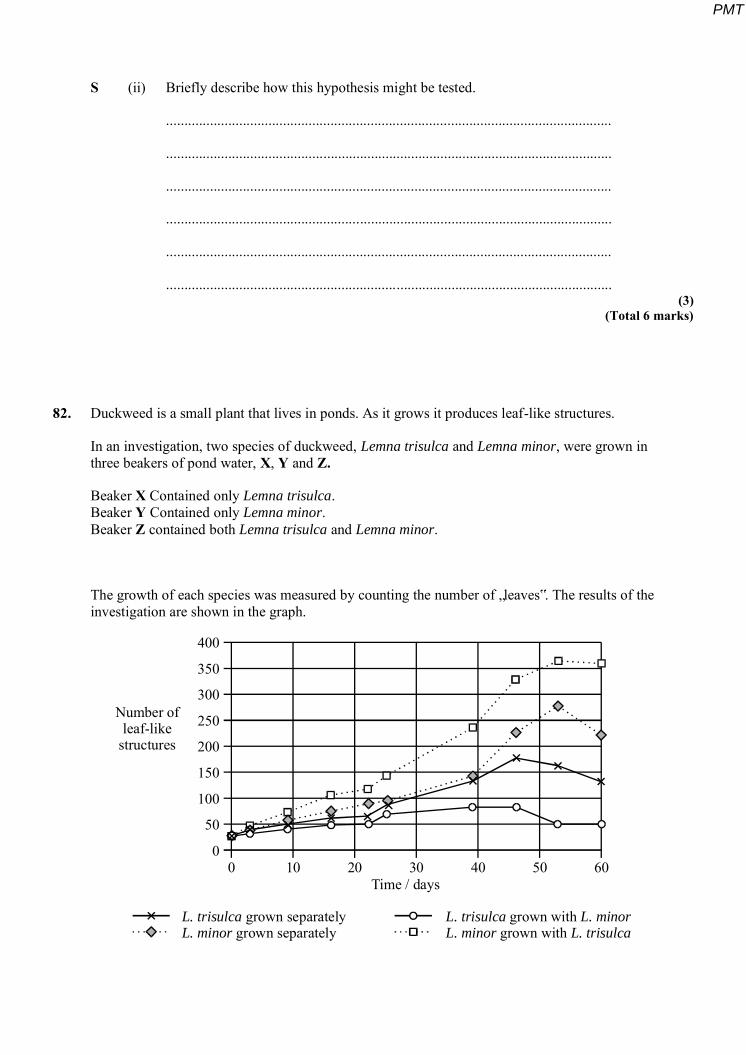
S (ii) Briefly describe how this hypothesis might be tested.
..........................................................................................................................
..........................................................................................................................
..........................................................................................................................
..........................................................................................................................
..........................................................................................................................
.......................................................................................................................... (3)
(Total 6 marks)
82. Duckweed is a small plant that lives in ponds. As it grows it produces leaf-like structures.
In an investigation, two species of duckweed, Lemna trisulca and Lemna minor, were grown in three beakers of pond water, X, Y and Z.
Beaker X Contained only Lemna trisulca. Beaker Y Contained only Lemna minor. Beaker Z contained both Lemna trisulca and Lemna minor.
The growth of each species was measured by counting the number of „leaves‟. The results of the investigation are shown in the graph.
400
350
300
250
200
150
100
50
00 10 20 30 40 50 60
Time / days
Number ofleaf-like
structures
L. trisulcaL. minor
grown separately grown separately
L. trisulca L. minorL. minor L. trisulca
grown with grown with
PMT

S (a) Give three abiotic factors that should be controlled in order to gain reliable data in this investigation.
1 ........................................................................................................................... ......
2 .................................................................................................................................
3 ........................................................................................................................... ...... (3)
(b) Describe the effects of interspecific competition on the growth of the two species.
............................................................................................................................. ......
...................................................................................................................................
............................................................................................................................. ......
................................................................................................................................... (2)
S (c) Lemna minor grows on the surface of the pond water. Lemna trisulca grows under the surface.
Suggest one hypothesis to explain the results for Lemna minor.
............................................................................................................................. ......
.......................................................................................................................... .........
............................................................................................................................. ......
................................................................................................................................... (2)
(Total 7 marks)
PMT

83. The diagrams show stages in a succession from a lake to an oak wood.
Stream
Lake
1 Aquatic plants 2 Reeds with 3 Sledges underground stems
4 Tussock-building 5 Alder trees 6 Oak trees
(a) (i) What is the name used to describe the final stage in a succession such as this?
.......................................................................................................................... (1)
PMT

(ii) The aquatic plants and the reeds both contribute to the formation of soil. Suggest how the aquatic plants and reeds contribute to raising the soil level.
..........................................................................................................................
..........................................................................................................................
..........................................................................................................................
.......................................................................................................................... (2)
S (iii) The sedges are rooted in waterlogged soil. Their stems contain a spongy tissue through which air can reach the roots. Explain how this is important for the absorption of mineral ions by the sedges.
..........................................................................................................................
..........................................................................................................................
..........................................................................................................................
..........................................................................................................................
..........................................................................................................................
.......................................................................................................................... (3)
(b) Explain why the ecosystem is likely to have more species in the later stages than in the earlier stages of succession.
...................................................................................................................................
............................................................................................................................. ......
...................................................................................................................................
............................................................................................................................. ...... (2)
(Total 8 marks)
PMT
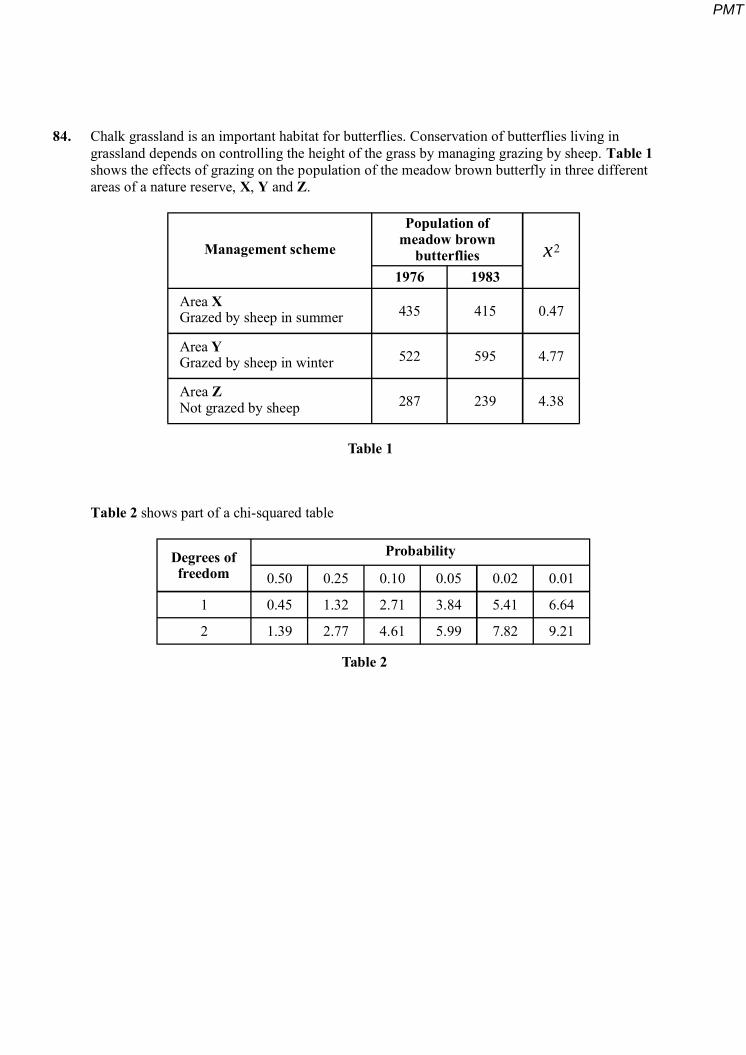
84. Chalk grassland is an important habitat for butterflies. Conservation of butterflies living in grassland depends on controlling the height of the grass by managing grazing by sheep. Table 1 shows the effects of grazing on the population of the meadow brown butterfly in three different areas of a nature reserve, X, Y and Z.
Management scheme
Population ofmeadow brown
butterflies1976 1983
AreaGrazed by sheep in summer
X
AreaGrazed by sheep in winter
Y
AreaNot grazed by sheep
Z
435
522
287
415
595
239
0.47
4.77
4.38
x2
Table 1
Table 2 shows part of a chi-squared table
ProbabilityDegrees offreedom
1
2
0.50
0.45
1.39
0.25
1.32
2.77
0.10
2.71
4.61
0.05
3.84
5.99
0.02
5.41
7.82
0.01
6.64
9.21
Table 2
PMT

(a) Are there any significant differences in the population sizes in areas X,Y and Z between 1976 and 1983? Explain your answer.
...................................................................................................................................
............................................................................................................................. ......
............................................................................................................................. ......
...................................................................................................................................
............................................................................................................................. ......
...................................................................................................................................
............................................................................................................................. ......
................................................................................................................................... (3)
(b) Which type of grazing would you recommend in order to conserve the meadow brown butterfly? Explain your answer.
...................................................................................................................................
............................................................................................................................. ......
................................................................................................................................... (1)
PMT
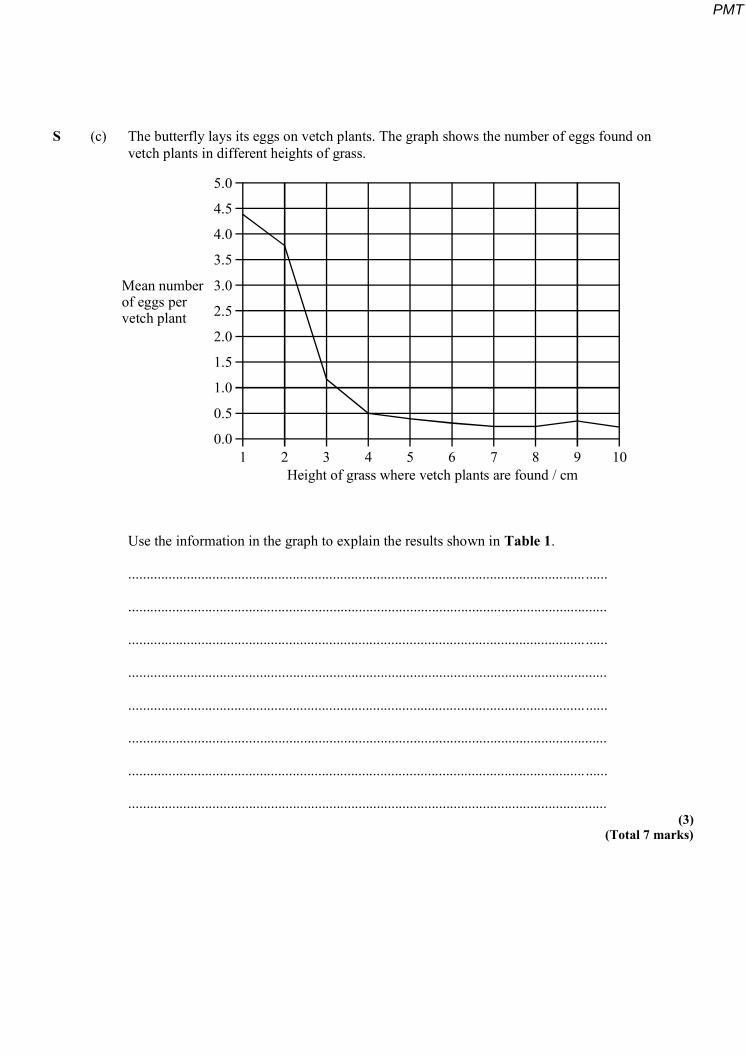
S (c) The butterfly lays its eggs on vetch plants. The graph shows the number of eggs found on vetch plants in different heights of grass.
5.0
4.5
4.0
3.5
3.0
2.5
2.0
1.5
1.0
0.5
0.01 2 3 4 5 6 7 8 9 10
Height of grass where vetch plants are found / cm
Mean numberof eggs pervetch plant
Use the information in the graph to explain the results shown in Table 1.
............................................................................................................................. ......
...................................................................................................................................
............................................................................................................................. ......
...................................................................................................................................
............................................................................................................................. ......
...................................................................................................................................
............................................................................................................................. ......
................................................................................................................................... (3)
(Total 7 marks)
PMT

85. Small clearings in woods may occur when large trees die or are blown down. This allows herbaceous plants to grow for a few years. One plant species that commonly colonises woodland clearings is the foxglove.
(a) Name and describe the ecological process which will result in the disappearance of foxgloves from a clearing after a few years.
.....................................................................................................................................
............................................................................................................................. ........
............................................................................................................................. ........
.......................................................................................................................... ...........
............................................................................................................................. ........
..................................................................................................................................... (3)
S (b) The foxglove is a biennial plant, which means that it lives for two years. In the first year it produces leaves but no flowers. In the second year it flowers and each plant releases about 300 000 very small seeds.
(i) Suggest how being a biennial enables a foxglove plant to produce very large numbers of seeds.
..........................................................................................................................
..........................................................................................................................
..........................................................................................................................
.......................................................................................................................... (2)
(ii) Suggest how producing large numbers of very small seeds adapts the foxglove for colonising woodland clearings.
..........................................................................................................................
..........................................................................................................................
..........................................................................................................................
.......................................................................................................................... (2)
PMT
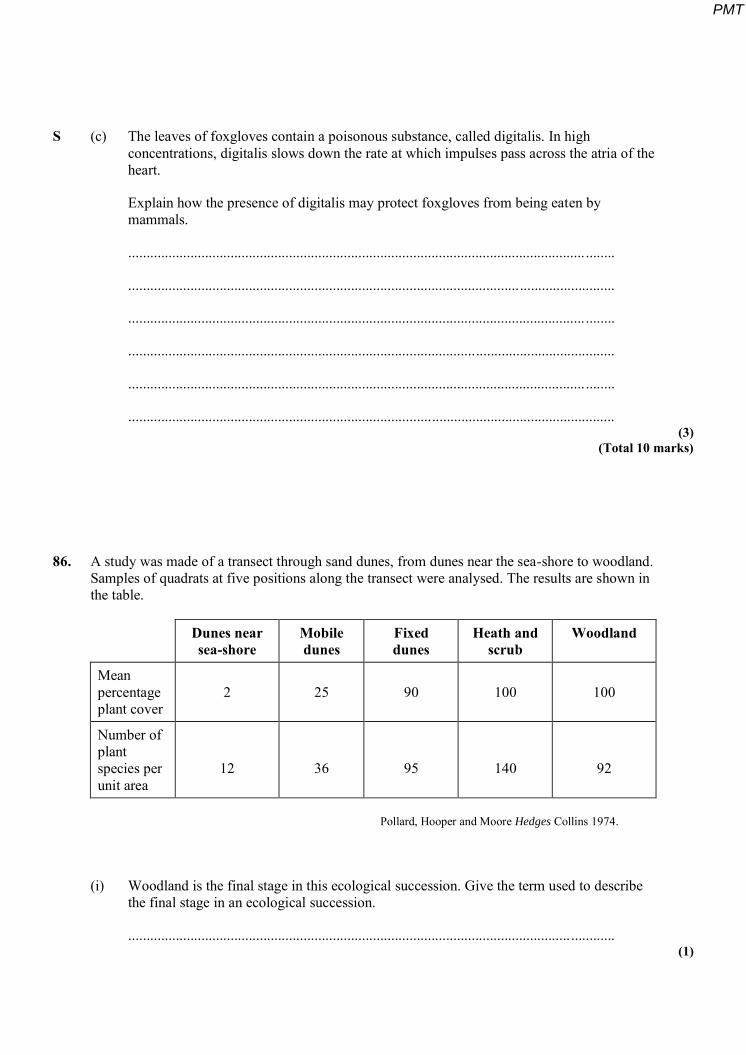
S (c) The leaves of foxgloves contain a poisonous substance, called digitalis. In high concentrations, digitalis slows down the rate at which impulses pass across the atria of the heart.
Explain how the presence of digitalis may protect foxgloves from being eaten by mammals.
............................................................................................................................. ........
.....................................................................................................................................
............................................................................................................................. ........
.....................................................................................................................................
............................................................................................................................. ........
..................................................................................................................................... (3)
(Total 10 marks)
86. A study was made of a transect through sand dunes, from dunes near the sea-shore to woodland. Samples of quadrats at five positions along the transect were analysed. The results are shown in the table.
Dunes near sea-shore
Mobile dunes
Fixed dunes
Heath and scrub
Woodland
Mean percentage plant cover
2
25
90
100
100
Number of plant species per unit area
12
36
95
140
92
Pollard, Hooper and Moore Hedges Collins 1974.
(i) Woodland is the final stage in this ecological succession. Give the term used to describe the final stage in an ecological succession.
......................................................................................................................... ............ (1)
PMT
(ii) The number of plant species per unit area in the woodland is less than that in the heath and scrub. Suggest an explanation for this.
.....................................................................................................................................
............................................................................................................................. ........
.....................................................................................................................................
............................................................................................................................. ........ (2)
(Total 3 marks)
87. Read the following passage.
The red squirrel is not as common in Britain as it was a century ago. The grey squirrel, introduced from North America, is now extremely common. One suggestion for the relative success of the grey squirrel is that it is able to out- compete the smaller red squirrel in areas where they both occur.
Detailed studies have shown that the two species have lived together in some areas for up to 16 years whereas in other areas the red squirrels had disappeared before the grey squirrels arrived.
Red squirrels do better in coniferous woodland where, being lighter and more agile, they are able to exploit the abundant cones in the canopy of the trees. The cones provide the red squirrels with seeds as a source of food throughout the year. Grey squirrels feed mainly on fruits and seeds such as acorns found on the ground in broad-leaved woodland.
Grey squirrels can digest acorns more efficiently than can red squirrels. Red squirrels do eat acorns but lose mass when given a diet consisting only of acorns.
PMT

(a) Give two pieces of evidence from the passage which suggest that the reduction in red squirrel numbers is not simply due to competition with grey squirrels.
1 ..................................................................................................................................
............................................................................................................................. ........
2 ........................................................................................................................... .......
........................................................................................................................... .......... (2)
S (b) Suggest two explanations for red squirrels being unable to survive on a diet of acorns.
1 ........................................................................................................................... .......
............................................................................................................................. ........
2 ........................................................................................................................ ..........
............................................................................................................................. ........ (2)
(c) Surveys have shown that, following a prolonged winter, red squirrels tend to disappear from broad-leaved woodland where both species have previously lived together. Suggest why the red squirrels disappear.
............................................................................................................................. ........
.....................................................................................................................................
............................................................................................................................. ........
.................................................................................................................................. ... (2)
(Total 6 marks)
PMT
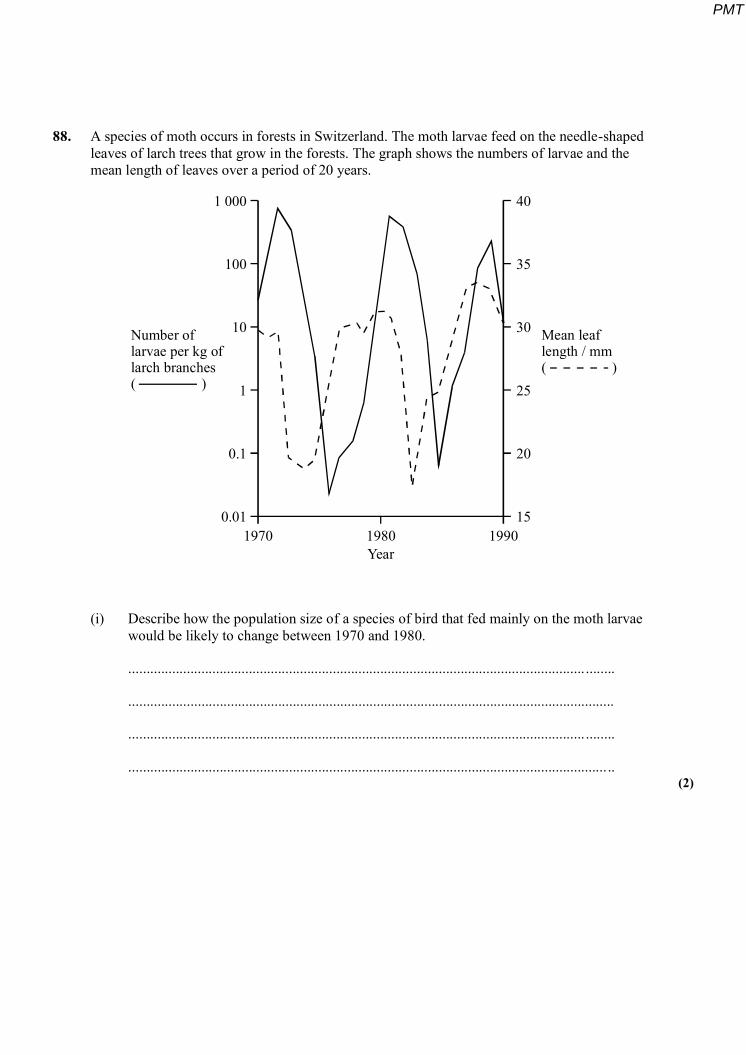
88. A species of moth occurs in forests in Switzerland. The moth larvae feed on the needle-shaped leaves of larch trees that grow in the forests. The graph shows the numbers of larvae and the mean length of leaves over a period of 20 years.
1 000
100
10
1
0.1
0.011970 1980 1990
Year
40
35
30
25
20
15
Mean leaflength / mm( )
Number oflarvae per kg oflarch branches( )
(i) Describe how the population size of a species of bird that fed mainly on the moth larvae would be likely to change between 1970 and 1980.
............................................................................................................................. ........
.....................................................................................................................................
............................................................................................................................. ........
................................................................................................................................... .. (2)
PMT
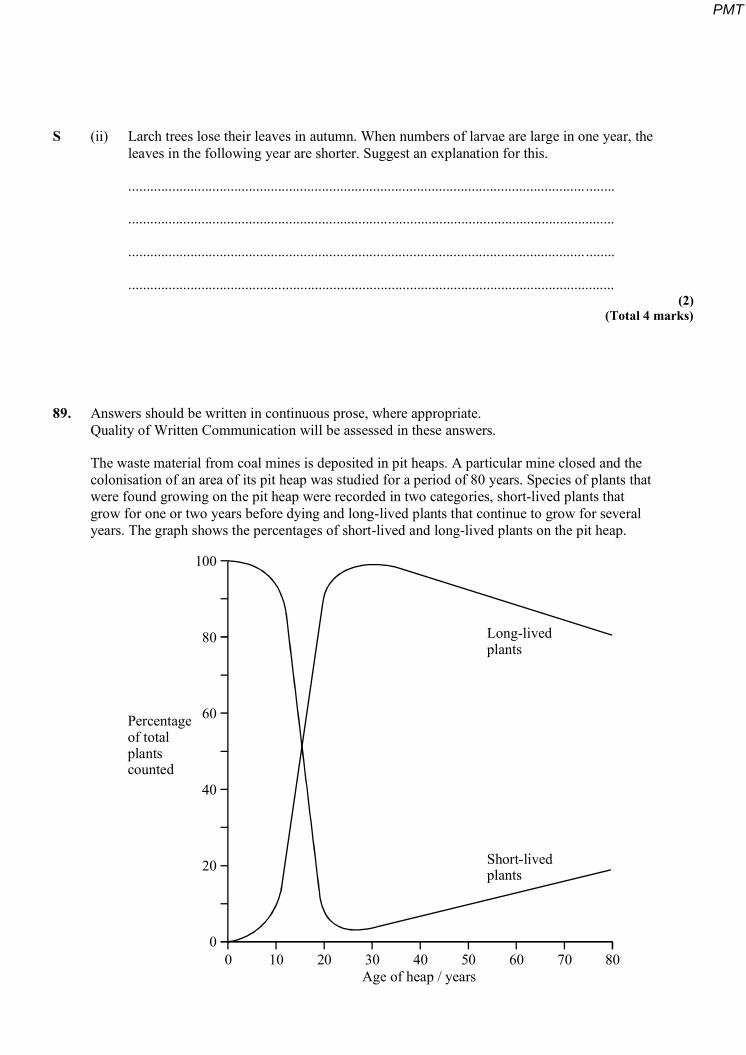
S (ii) Larch trees lose their leaves in autumn. When numbers of larvae are large in one year, the leaves in the following year are shorter. Suggest an explanation for this.
............................................................................................................................. ........
.....................................................................................................................................
............................................................................................................................. ........
..................................................................................................................................... (2)
(Total 4 marks)
89. Answers should be written in continuous prose, where appropriate. Quality of Written Communication will be assessed in these answers.
The waste material from coal mines is deposited in pit heaps. A particular mine closed and the colonisation of an area of its pit heap was studied for a period of 80 years. Species of plants that were found growing on the pit heap were recorded in two categories, short-lived plants that grow for one or two years before dying and long-lived plants that continue to grow for several years. The graph shows the percentages of short-lived and long-lived plants on the pit heap.
Long-livedplants
Short-livedplants
100
80
60
40
20
00 10 20 30 40 50 60 70 80
Age of heap / years
Percentageof totalplantscounted
PMT

(a) Using your knowledge of succession, suggest explanations for the changes in the percentages of short-lived and long-lived plants
(i) over the first 20 years;
...........................................................................................................................
...........................................................................................................................
...........................................................................................................................
...........................................................................................................................
...........................................................................................................................
...........................................................................................................................
...........................................................................................................................
...........................................................................................................................
(ii) between 30 and 80 years.
...........................................................................................................................
...........................................................................................................................
...........................................................................................................................
...........................................................................................................................
...........................................................................................................................
...........................................................................................................................
...........................................................................................................................
........................................................................................................................... (6)
PMT
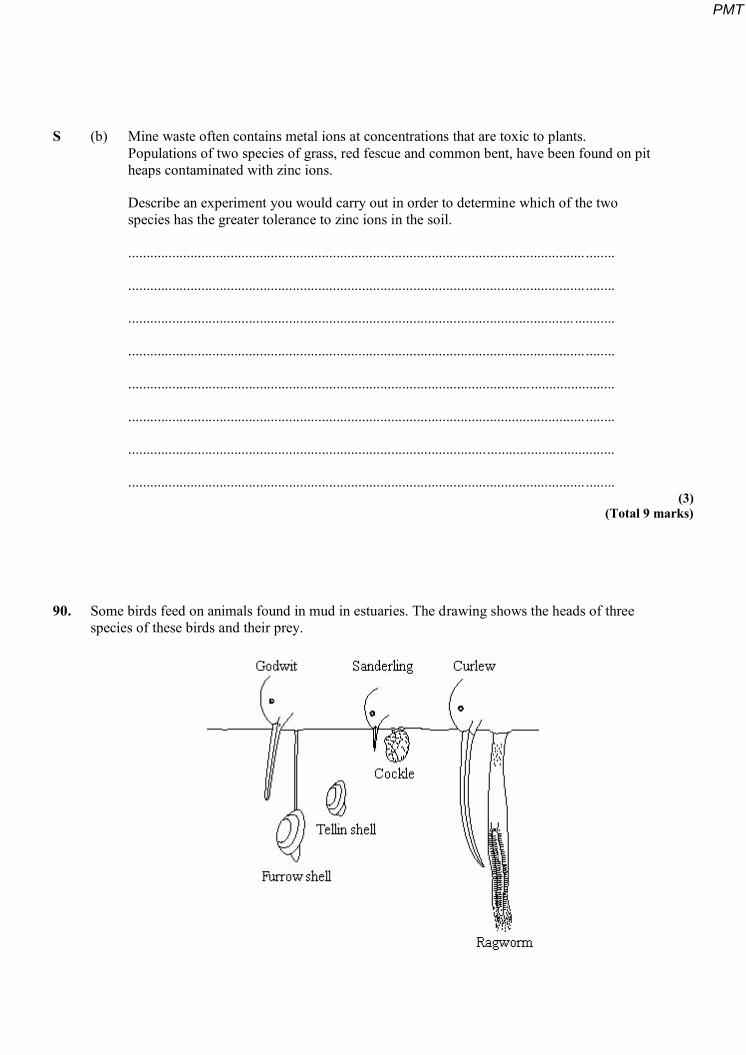
S (b) Mine waste often contains metal ions at concentrations that are toxic to plants. Populations of two species of grass, red fescue and common bent, have been found on pit heaps contaminated with zinc ions.
Describe an experiment you would carry out in order to determine which of the two species has the greater tolerance to zinc ions in the soil.
............................................................................................................................. ........
............................................................................................................................. ........
.......................................................................................................................... ...........
............................................................................................................................. ........
.....................................................................................................................................
............................................................................................................................. ........
.....................................................................................................................................
............................................................................................................................. ........ (3)
(Total 9 marks)
90. Some birds feed on animals found in mud in estuaries. The drawing shows the heads of three species of these birds and their prey.
PMT

(a) Use the information in the drawing to explain how interspecific competition between the birds is reduced.
................................................................................................................................….
............................................................................................................................. ........
.......................................................................................................................... ...........
............................................................................................................................. ........
..................................................................................................................................... (2)
(b) Explain how competition might have played a part in the evolution of the long curved beak of the curlew.
.....................................................................................................................................
............................................................................................................................. ........
.....................................................................................................................................
............................................................................................................................. ........
.....................................................................................................................................
............................................................................................................................. ........
.....................................................................................................................................
............................................................................................................................. ........ (4)
(c) Mud higher up the shore receives fresh water draining from the land. Ragworms are able to survive in this mud because they can tolerate the absorption of water into their tissues. Explain what causes a ragworm to absorb water when higher up the shore.
.....................................................................................................................................
............................................................................................................................. ........
.....................................................................................................................................
............................................................................................................................. ........ (2)
(Total 8 marks)
PMT

91. Glaciers are masses of moving ice. When glaciers shrink, the thick covering of ice gradually disappears to leave behind bare land. Land exposed by a shrinking glacier in Alaska became covered by dense forest in 150 years.
(a) Explain how succession resulted in the formation of the forest.
............................................................................................................................. ........
.....................................................................................................................................
............................................................................................................................. ........
.....................................................................................................................................
............................................................................................................................. ........
.....................................................................................................................................
............................................................................................................................. ........
..................................................................................................................................... (4)
(b) In areas of poor drainage the soil is waterlogged. In these areas the climax community is bog dominated by the moss, Sphagnum. Explain why bog is described as the climax community.
............................................................................................................................. ........
..................................................................................................................................... (1)
(c) Waterlogged soils lack oxygen. Suggest why trees are unable to survive in waterlogged soils.
............................................................................................................................. ........
.......................................................................................................................... ...........
............................................................................................................................. ........
..................................................................................................................................... (2)
PMT

(d) The water and soil in Sphagnum bogs are usually acidic. Suggest why Sphagnum is not fully decomposed after it dies.
.....................................................................................................................................
............................................................................................................................. ........
.....................................................................................................................................
............................................................................................................................. ........
.....................................................................................................................................
............................................................................................................................. ........
..................................................................................................................................... (3)
(Total 10 marks)
92. In autumn when there is no crop, farm land may be used to grow mustard. The mustard absorbs nitrates which otherwise can leach out of the soil at this time of the year. The mustard is ploughed back into the soil just before sowing of the main crop in the spring.
(a) Nitrogen compounds in the mustard plants are made available for the main crop after ploughing in spring. Describe the role of microorganisms in this process.
.....................................................................................................................................
............................................................................................................................. ........
.....................................................................................................................................
............................................................................................................................. ........
.....................................................................................................................................
............................................................................................................................. ........
.....................................................................................................................................
............................................................................................................................. ........
..................................................................................................................................... (5)
PMT

(b) Explain why it is important for the farmer to reduce the leaching of nitrates.
.....................................................................................................................................
............................................................................................................................. ........
.....................................................................................................................................
............................................................................................................................. ........ (2)
S (c) Plants absorb a number of other nutrients from the soil including phosphates. Describe why phosphates are needed by a growing plant.
........................................................................................................................... ..........
............................................................................................................................. ........
.....................................................................................................................................
............................................................................................................................. ........
.....................................................................................................................................
............................................................................................................................. ........
..................................................................................................................................... (4)
(Total 11 marks)
93. Dogwhelks are small, carnivorous snails which live on rocky seashores. They cling to, and move over, the surface of the rocks and feed on animals such as mussels.
S (a) Mussels are permanently attached to rocks. They feed on small photosynthetic organisms which they filter from the water.
(i) Suggest why dogwhelks lose more energy by respiration than do mussels.
...........................................................................................................................
........................................................................................................................... (1)
PMT

(ii) A greater proportion of the energy in food eaten is lost in the faeces of mussels compared with the faeces of dogwhelks. Suggest why.
...........................................................................................................................
...........................................................................................................................
...........................................................................................................................
........................................................................................................................... (2)
(b) Boats used to be painted with a paint that contains the poisonous substance tributyl tin (TBT). TBT is absorbed into the bodies of animals and cannot be broken down. Explain why there is a higher concentration of TBT in the tissues of dogwhelks than in the mussels on which they feed.
.....................................................................................................................................
............................................................................................................................. ........
.....................................................................................................................................
............................................................................................................................. ........ (2)
(Total 5 marks)
PMT

94. (a) The diagram shows a number of stages in an ecological succession in a lake.
Stage 1Microscopic plantsand animals
Stage 2Layers of mud and organicmatter settles on the bottom.Submerged plants appear.
Stage 3Plants growing on surface andedges of pond. Submergedplants die out.
Stage 4Build up of mud andorganic matter formsa marsh.
Stage 5Community of land plants
PMT

Explain how the diagrams illustrate the features of an ecological succession.
.....................................................................................................................................
............................................................................................................................. ........
.....................................................................................................................................
............................................................................................................................. ........
.....................................................................................................................................
............................................................................................................................. ........
............................................................................................................................. ........
.....................................................................................................................................
............................................................................................................................. ........
.....................................................................................................................................
............................................................................................................................. ........
............................................................................................................................. ........ (6)
(b) Several small rivers flow into this lake. These rivers flow through forested areas. Explain how deforestation might affect the process of succession in the lake.
............................................................................................................................. ........
.....................................................................................................................................
............................................................................................................................. ........
..................................................................................................................................... (2)
PMT

S (c) Stage 5 illustrates the final stage of succession which is known as the climax community. During this stage the number of different species in the habitat and the size of each population remain fairly constant. Explain what limits the size of populations in a climax community.
............................................................................................................................. ........
.....................................................................................................................................
............................................................................................................................. ........
............................................................................................................................. ........
.....................................................................................................................................
............................................................................................................................. ........
.....................................................................................................................................
............................................................................................................................. ........
............................................................................................................................. ........
.......................................................................................................................... ...........
............................................................................................................................. ........
..................................................................................................................................... (5)
(Total 13 marks)
95. (a) Explain why heavy metal ions may accumulate in food webs.
............................................................................................................................. ........
.....................................................................................................................................
............................................................................................................................. ........
............................................................................................................................. ........ (2)
PMT

(b) A hormone has been shown to switch on a gene in fish, leading to the increased production of an enzyme. Experiments were carried out to investigate the effects of heavy metal ions on the production of this enzyme, with and without the hormone. The table shows the results.
Amount of enzyme produced / percentage of maximum
Heavy metal ion present Without hormone With hormone
None 16 100
Cadmium 15 55
Zinc 17 94
Copper 16 100
Explain how the results suggest that cadmium affects the action of the hormone.
.....................................................................................................................................
............................................................................................................................. ........
............................................................................................................................. ........
....................................................................................................................... .............. (2)
(Total 4 marks)
PMT
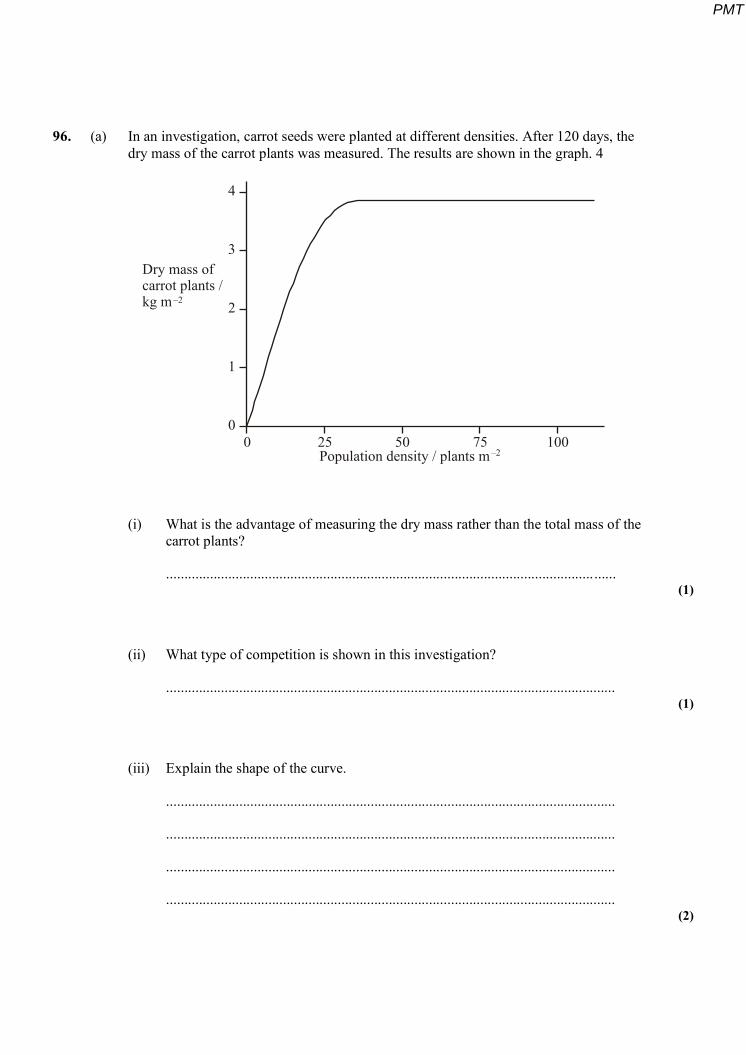
96. (a) In an investigation, carrot seeds were planted at different densities. After 120 days, the dry mass of the carrot plants was measured. The results are shown in the graph. 4
4
3
2
1
00 25 50 75 100
Population density / plants m–2
Dry mass ofcarrot plants /kg m –2
(i) What is the advantage of measuring the dry mass rather than the total mass of the carrot plants?
........................................................................................................................... (1)
(ii) What type of competition is shown in this investigation?
........................................................................................................................... (1)
(iii) Explain the shape of the curve.
...........................................................................................................................
...........................................................................................................................
...........................................................................................................................
........................................................................................................................... (2)
PMT

S (b) Commercial growers want all the carrots to be the same size when harvested. Suggest two ways in which they can try to ensure this.
1 ...................................................................................................................................
............................................................................................................................. .........
2 ...................................................................................................................................
............................................................................................................................. ......... (2)
(Total 6 marks)
97. In a sand dune succession the pioneer community (A) colonises bare sand. This community is replaced over time by other communities (B and C) until a climax community of woodland (D) is formed.
A B C D
Direction of succession
Bare sand
Pioneercommunity
Climaxcommunity
(a) The communities A to D are composed of different species. Explain how the change in species composition occurs in a succession.
............................................................................................................................. ........
.....................................................................................................................................
............................................................................................................................. ........
..................................................................................................................................... (3)
PMT

(b) Which community, A to D, is the most stable? Explain what makes this the most stable community.
.....................................................................................................................................
............................................................................................................................. ........
.....................................................................................................................................
............................................................................................................................. ........ (2)
S (c) Many species in the pioneer community are xerophytes. Suggest and explain how having sunken stomata is an advantage to these plants.
........................................................................................................................... ..........
............................................................................................................................. ........
.....................................................................................................................................
............................................................................................................................. ........
.....................................................................................................................................
............................................................................................................................. ........ (3)
(d) Explain why it would be more appropriate to use a transect rather than random quadrats when investigating this succession.
............................................................................................................................. ........
..................................................................................................................................... (1)
(Total 9 marks)
PMT
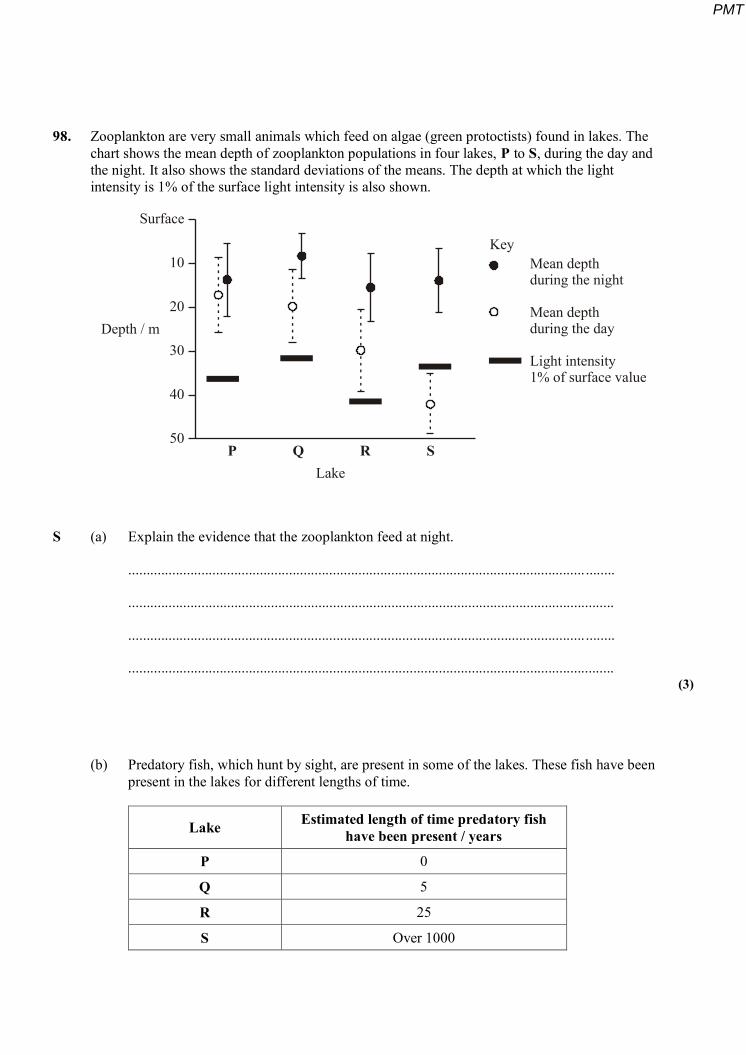
98. Zooplankton are very small animals which feed on algae (green protoctists) found in lakes. The chart shows the mean depth of zooplankton populations in four lakes, P to S, during the day and the night. It also shows the standard deviations of the means. The depth at which the light intensity is 1% of the surface light intensity is also shown.
Surface
10
20
30
40
50
Depth / m
P Q R SLake
KeyMean depthduring the night
Mean depthduring the day
Light intensity1% of surface value
S (a) Explain the evidence that the zooplankton feed at night.
............................................................................................................................. ........
.....................................................................................................................................
............................................................................................................................. ........
..................................................................................................................................... (3)
(b) Predatory fish, which hunt by sight, are present in some of the lakes. These fish have been present in the lakes for different lengths of time.
Lake Estimated length of time predatory fish have been present / years
P 0
Q 5
R 25
S Over 1000
PMT

(i) Describe the relationship between the depth of the zooplankton during the day and the length of time predators have been present in the lake.
...........................................................................................................................
........................................................................................................................... (1)
S (ii) Suggest how the differences in behaviour of the zooplankton populations in the four lakes might have evolved.
...........................................................................................................................
...........................................................................................................................
...........................................................................................................................
...........................................................................................................................
...........................................................................................................................
........................................................................................................................... (3)
(Total 7 marks)
PMT
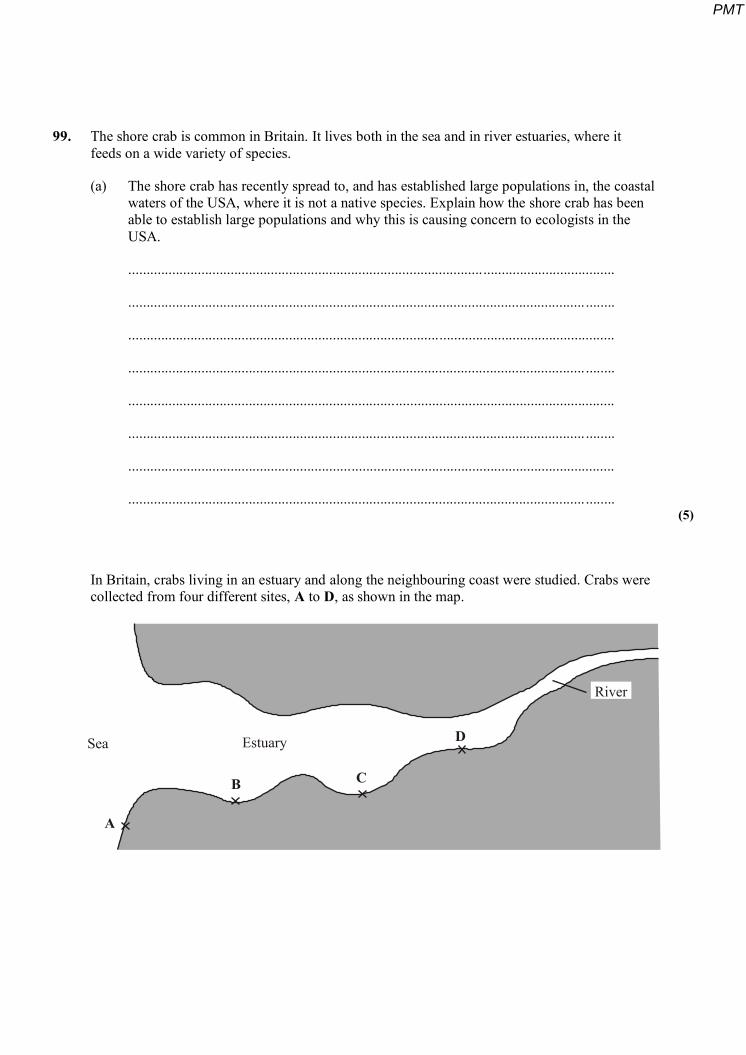
99. The shore crab is common in Britain. It lives both in the sea and in river estuaries, where it feeds on a wide variety of species.
(a) The shore crab has recently spread to, and has established large populations in, the coastal waters of the USA, where it is not a native species. Explain how the shore crab has been able to establish large populations and why this is causing concern to ecologists in the USA.
.....................................................................................................................................
............................................................................................................................. ........
.....................................................................................................................................
............................................................................................................................. ........
.....................................................................................................................................
............................................................................................................................. ........
.....................................................................................................................................
............................................................................................................................. ........ (5)
In Britain, crabs living in an estuary and along the neighbouring coast were studied. Crabs were collected from four different sites, A to D, as shown in the map.
Sea Estuary
A
B C
D
River
PMT
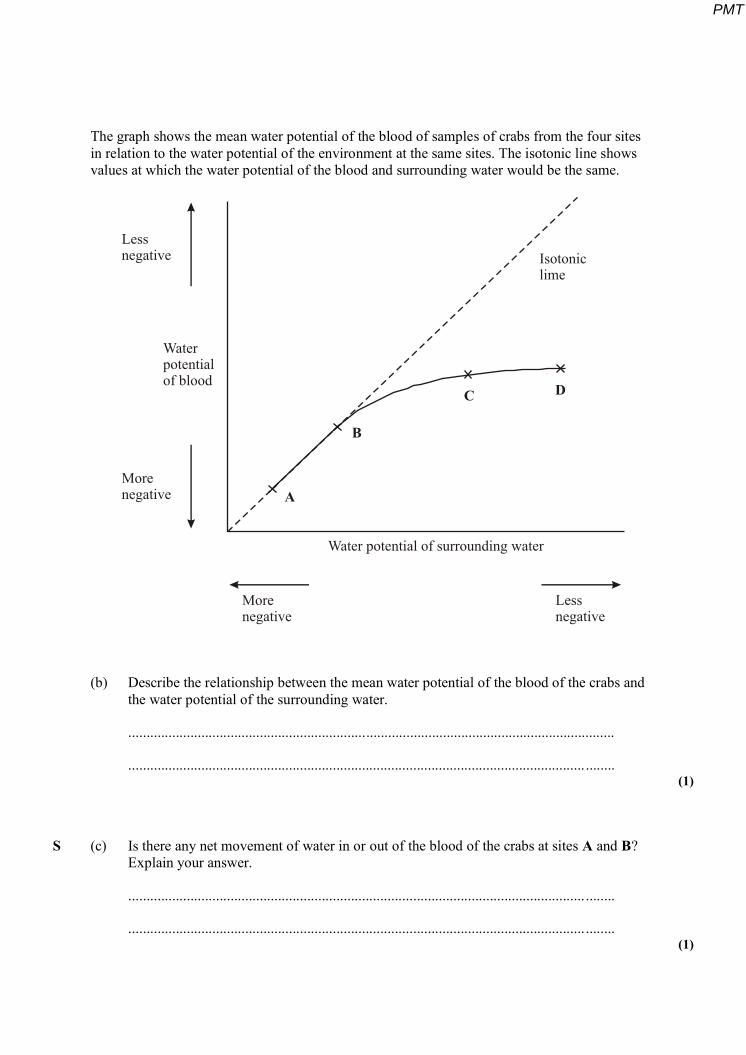
The graph shows the mean water potential of the blood of samples of crabs from the four sites in relation to the water potential of the environment at the same sites. The isotonic line shows values at which the water potential of the blood and surrounding water would be the same.
Lessnegative
Morenegative
Waterpotentialof blood
Isotoniclime
A
B
C D
Water potential of surrounding water
Morenegative
Lessnegative
(b) Describe the relationship between the mean water potential of the blood of the crabs and the water potential of the surrounding water.
.....................................................................................................................................
............................................................................................................................. ........ (1)
S (c) Is there any net movement of water in or out of the blood of the crabs at sites A and B? Explain your answer.
............................................................................................................................. ........
............................................................................................................................. ........ (1)
PMT

S (d) Crabs living at sites C and D actively transport salts into their blood through their gills.
(i) Explain how this enables crabs to survive at these sites.
...........................................................................................................................
...........................................................................................................................
........................................................................................................................... (2)
(ii) Crabs are unable to control their body temperature. In winter, when the water temperature falls, crab populations at sites C and D migrate towards the sea. Suggest the advantage of this behaviour.
...........................................................................................................................
...........................................................................................................................
...........................................................................................................................
........................................................................................................................... (3)
(Total 12 marks)
100. Great tits are small birds. The graph shows the relationship between the number of breeding pairs in the population and the mean number of eggs per nest in different years in a wood.
11
10
9
8
7
Mean numberof eggs pernest
0 10 20 30 40 50 60 70 80 90Number of breeding pairs
PMT

(a) Explain the relationship shown by the graph.
.....................................................................................................................................
............................................................................................................................. ........
............................................................................................................................. ........
.......................................................................................................................... ........... (2)
S (b) Female great tits usually lay between 3 and 14 eggs in a nest.
(i) In the same year, the birds do not all lay the same number of eggs. Explain how one factor, other than the number of breeding pairs, could influence the number of eggs laid by a great tit.
...........................................................................................................................
........................................................................................................................... (1)
(ii) Natural selection influences the number of eggs laid. Explain why great tits that lay fewer than 3 eggs per nest or more than 14 eggs per nest are at a selective disadvantage.
...........................................................................................................................
...........................................................................................................................
...........................................................................................................................
...........................................................................................................................
...........................................................................................................................
........................................................................................................................... (3)
(Total 6 marks)
PMT
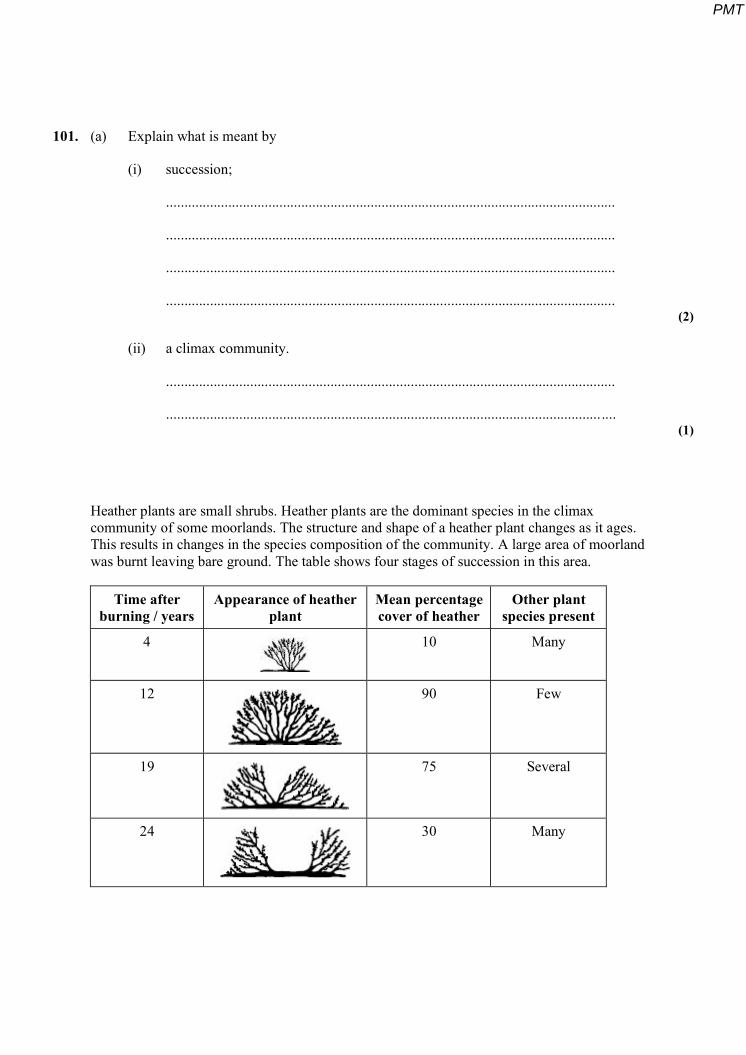
101. (a) Explain what is meant by
(i) succession;
...........................................................................................................................
...........................................................................................................................
...........................................................................................................................
........................................................................................................................... (2)
(ii) a climax community.
...........................................................................................................................
........................................................................................................................... (1)
Heather plants are small shrubs. Heather plants are the dominant species in the climax community of some moorlands. The structure and shape of a heather plant changes as it ages. This results in changes in the species composition of the community. A large area of moorland was burnt leaving bare ground. The table shows four stages of succession in this area.
Time after burning / years
Appearance of heather plant
Mean percentage cover of heather
Other plant species present
4
10 Many
12
90 Few
19
75 Several
24
30 Many
PMT

(b) Explain why the number of other plant species decreases between 4 and 12 years after burning.
............................................................................................................................. ........
.....................................................................................................................................
............................................................................................................................. ........
..................................................................................................................................... (2)
S (c) The rate at which a heather plant produced new biomass was measured in g per kg of heather plant per year. This rate decreased as the plant aged. Use the information in the table to explain why.
.....................................................................................................................................
............................................................................................................................. ........
.....................................................................................................................................
............................................................................................................................. ........
.....................................................................................................................................
............................................................................................................................. ........ (3)
(Total 8 marks)
PMT
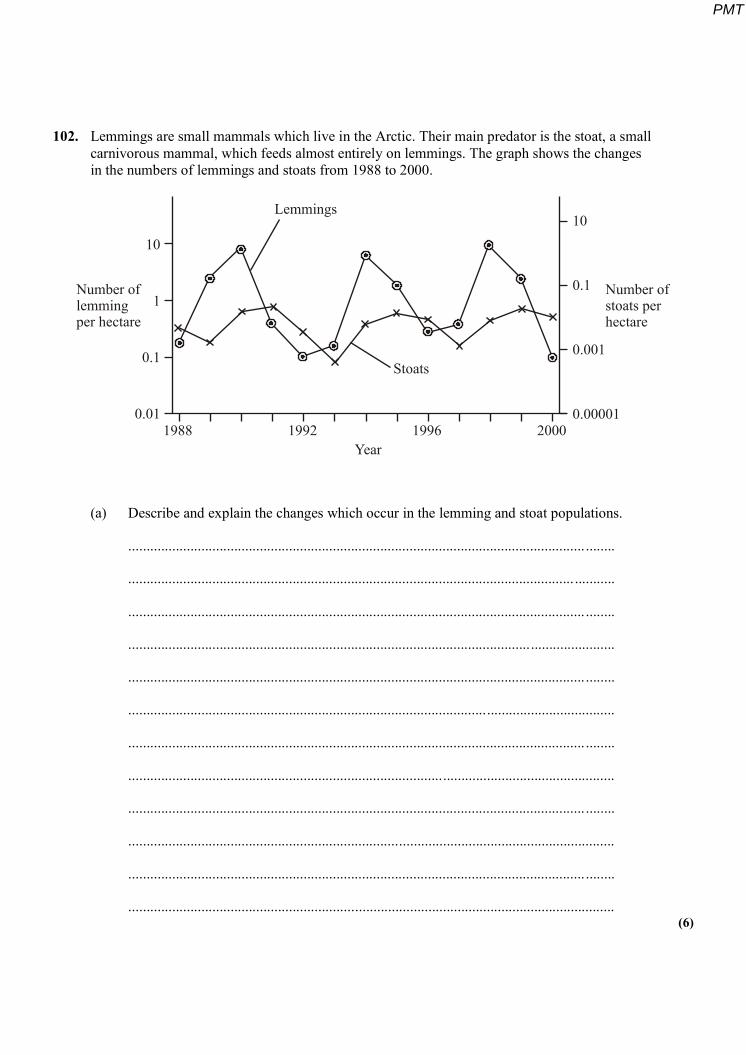
102. Lemmings are small mammals which live in the Arctic. Their main predator is the stoat, a small carnivorous mammal, which feeds almost entirely on lemmings. The graph shows the changes in the numbers of lemmings and stoats from 1988 to 2000.
Lemmings
Stoats
1988 1992 1996 2000Year
10
1
0.1
0.01
10
0.1
0.001
0.00001
Number oflemmingper hectare
Number ofstoats perhectare
(a) Describe and explain the changes which occur in the lemming and stoat populations.
............................................................................................................................. ........
.......................................................................................................................... ...........
............................................................................................................................. ........
.....................................................................................................................................
............................................................................................................................. ........
.....................................................................................................................................
............................................................................................................................. ........
.....................................................................................................................................
............................................................................................................................. ........
.....................................................................................................................................
............................................................................................................................. ........
..................................................................................................................................... (6)
PMT
S (b) Lemmings often live in isolated populations. From time to time some lemmings move and join other populations. Explain how this movement is important in maintaining genetic variability in lemming populations which have large fluctuations in size.
............................................................................................................................. ........
.....................................................................................................................................
............................................................................................................................. ........
..................................................................................................................................... (2)
S (c) James Bay is a large ocean bay in northern Canada. It was formed by the melting of glaciers. One species of lemming inhabits the eastern side of James Bay and another species of lemming inhabits the western side. Before the glaciers melted there was only one species of lemming present. Explain how two species of lemming evolved from the original species.
.....................................................................................................................................
............................................................................................................................. ........
.....................................................................................................................................
............................................................................................................................. ........
.....................................................................................................................................
............................................................................................................................. ........
.....................................................................................................................................
............................................................................................................................. ........ (4)
(Total 12 marks)
PMT

103. Fur seals live in Antarctic seas. They feed on fish and shrimp-like animals called krill. During the summer the fur seals come ashore to breed. The table shows the number of fur seals breeding on an Antarctic island from 1956 to 1986.
Year Number of adult fur seals
1956 100
1964 100
1970 200
1975 100
1976 1600
1981 2900
1983 3100
1986 11700
(a) (i) Calculate the mean annual growth rate of this fur seal population over the period 1981 – 1986. Show your working.
Answer ........................................... (2)
(ii) Scientists suggested that the increase in the fur seal population was due to an increase in commercial whaling. Many species of whale living in Antarctic seas feed on krill. Explain how an increase in whaling might have resulted in an increase in the seal population.
...........................................................................................................................
...........................................................................................................................
...........................................................................................................................
........................................................................................................................... (2)
PMT

Research workers set up permanent quadrats to investigate the effect of the seals on the island vegetation. The diagram shows the percentage cover of the plants in one of the permanent quadrats in 1965 and again in 1985.
(b) Give two advantages of collecting quantative data about plant distribution as percentage cover.
1 ........................................................................................................................... .......
......................................................................................................................... ............
2 ........................................................................................................................... .......
..................................................................................................................................... (2)
(c) The seals affected the vegetation in the quadrat over the time period. Describe how.
............................................................................................................................. ........
............................................................................................................................. ........
.......................................................................................................................... ...........
............................................................................................................................. ........
.....................................................................................................................................
............................................................................................................................. ........ (3)
PMT

(d) Prasiola crispa colonises soil with a high concentration of nitrogen-containing ions. Explain the increase in P. crispa in this quadrat.
............................................................................................................................. ........
.....................................................................................................................................
............................................................................................................................. ........
..................................................................................................................................... (2)
(Total 11 marks)
104. Roundabouts are common at road junctions in towns and cities. Ecologists investigated the
species of plants and animals found on roundabouts in a small town.
(a) Ground beetles are large black insects. The mark-release-recapture method can be used to estimate the ground beetle population on a roundabout. Describe how.
............................................................................................................................. ........
.....................................................................................................................................
............................................................................................................................. ........
.....................................................................................................................................
............................................................................................................................. ........
.....................................................................................................................................
............................................................................................................................. ........
.....................................................................................................................................
............................................................................................................................. ........
..................................................................................................................................... (5)
PMT

(b) The grass on the roundabouts was mown at different time intervals. The table shows the mean number of plant species found on the roundabouts.
Approximate interval between mowing/days
Mean number of plant species
7 15.8
14 21.2
40 30.6
365+ 32.0
Mowing was also found to affect the number of insect species found on a roundabout. Use your knowledge of succession to explain how.
............................................................................................................................. ........
............................................................................................................................. ........
.......................................................................................................................... ...........
............................................................................................................................. ........
.....................................................................................................................................
............................................................................................................................. ........
.....................................................................................................................................
............................................................................................................................. ........
.....................................................................................................................................
............................................................................................................................. ........ (5)
PMT

(c) The carbon dioxide concentration was monitored at ground level in the centre of a small roundabout. The measurements were made on a summer day. Describe and explain how you would expect the concentration of carbon dioxide to fluctuate over the period of 24 hours.
.....................................................................................................................................
............................................................................................................................. ........
.....................................................................................................................................
............................................................................................................................. ........
.....................................................................................................................................
............................................................................................................................. ........
.....................................................................................................................................
............................................................................................................................. ........
.....................................................................................................................................
............................................................................................................................. ........ (5)
(Total 15 marks)
PMT