Embed Size (px)
Citation preview

FAMU-FSU College of Engineering
Department of Electrical and Computer Engineering
Detailed Design Review and Test Plan
EEL4911C – ECE Senior Design Project I
Solar Car
Team # 2
Student team members:
James Barge, Electrical Engineering ( [email protected])
Adrian Cires, Mechanical Engineering ([email protected])
Keith Dalick, Mechanical Engineering ([email protected])
Nelson German, Industrial Engineering ([email protected])
Emiliano Pantner, Mechanical Engineering ([email protected])
Rajat Pradhan, Industrial Engineering ([email protected])
Zachary Prisland, Electrical Engineering ([email protected])
Shishir Rajbhandari, Electrical Engineering ([email protected])
Amanda Roberts, Industrial Engineering ([email protected])
Senior Design Project Instructor :
Dr. Chris Edrington
Dr. Bruce Harvey
Dr. Zohrob Hovsapian
Submitted in partial fulfillment of the requirements for EEL4911C – ECE Senior Design Project I
February 3, 2011

2
Project Executive Summary
The American Solar Challenge is a competition to design, build, and drive solar-powered cars in a cross-
country time\distance rally event. The Solar Challenge hosted in 2012 will have teams competing in a
2400-mile course between multiple cities across the continent. It is hosted by Innovators Educational
Foundation, an organization devoted to applied learning in the areas of science, engineering, and
technology. FAMU-FSU College of Engineering has set up a team of senior undergraduate students from
multiple disciplines to design and build a solar powered car to compete in this challenge. The team
consists of three electrical engineers, three mechanical engineers, and three industrial engineers.
The energy from solar radiation is the most abundant and potentially the greatest source of renewable
energy. Research is constantly conducted around the globe aimed at increasing solar cell efficiency and
may one day enable us to harness the full energy of the sun. The technical design project that we have
undertaken is attempting to introduce senior engineering students to solve the problem of designing,
building, and racing a safe and functional car that is powered via sunlight.
The objectives of the technical design project are as follows:
1. Design a composite body
2. Design Solar array configuration
3. Design suspension system
4. Design Electrical system
5. Optimize Design
6. Test Mechanical system
7. Test Electrical system
The solar car project will be designed following lean six sigma’s methodology DMEDI (Define, Measure,
Explore, Develop, and Implement). DMEDI is a methodology used to systematically conduct projects that
require a new designed process or product. The Define phase provides a clear problem statement that
charters a project with a defined scope and Outcomes. The Measure phase is the step where the team
converts the needs and specifications of the project into measurable and quantifiable targets. This
allows for prioritizing and quantitative reasoning for making decisions or creating alternatives. In the
Explore phase the team will then create a conceptual design of the solar car based on the data collected
and analyzed in the measure phase. Then in the Develop phase the team optimizes the conceptual
design to capture all the needs and specifications of the solar car. Finally, the solar efficient car will be
fabricated into a full scale working design.

3
Table of Contents
Project Executive Summary .......................................................................................................................... 2
1 Introduction .......................................................................................................................................... 6
1.1 Acknowledgements ....................................................................................................................... 6
1.2 Problem Statement ....................................................................................................................... 6
1.3 Operating Environment ................................................................................................................ 7
1.4 Intended Use(s) and Intended User(s) .......................................................................................... 8
1.5 Assumptions and Limitations ........................................................................................................ 8
1.5.1 Assumptions .......................................................................................................................... 8
1.5.2 Limitations ............................................................................................................................. 8
1.6 Expected End and Other Deliverables .......................................................................................... 9
2 Systems Design ................................................................................................................................... 10
2.1 Overview of the System .............................................................................................................. 10
2.2 Major Components of the System .............................................................................................. 10
2.3 Performance Assessment ........................................................................................................... 11
2.4 Design Process ............................................................................................................................ 12
2.5 Overall Risk Assessment .............................................................................................................. 15
3 Design of Major Components ............................................................................................................. 17
3.1 Body ............................................................................................................................................ 17
3.1.1 Safety .................................................................................................................................. 17
3.1.2 Body Shape.......................................................................................................................... 18
3.1.3 Body Weight ........................................................................................................................ 19
3.2 Steering ....................................................................................................................................... 20
3.2.1 Steering Wheel .................................................................................................................... 21
3.2.2 Steering Column .................................................................................................................. 21
3.2.3 Rack and Pinion ................................................................................................................... 22
3.3 Braking ........................................................................................................................................ 22
3.3.1 Pedal System ....................................................................................................................... 23
3.3.2 Master Cylinder ................................................................................................................... 24
3.3.3 Caliper ................................................................................................................................. 24

4
3.3.4 Rotor ................................................................................................................................... 25
3.3.5 Brake System Selection ....................................................................................................... 26
3.4 Suspension .................................................................................................................................. 27
3.4.1 Front Suspension................................................................................................................. 29
3.4.2 Rear Suspension .................................................................................................................. 34
3.5 Power Generation ....................................................................................................................... 36
3.5.1 Solar array system ............................................................................................................... 36
3.6 Control Systems .......................................................................................................................... 48
3.6.1 Master Control Unit ............................................................................................................ 48
3.6.2 Lights/Horn ......................................................................................................................... 49
3.6.3 Motor Controller ................................................................................................................. 50
3.6.4 Dashboard ........................................................................................................................... 51
3.7 Management Systems ................................................................................................................. 54
4 Test Plan .............................................................................................................................................. 59
4.1 System and Integration Test Plan ............................................................................................... 60
4.1.1 Mechanical Part Integration ............................................................................................... 60
4.1.2 Electrical Part Integration ................................................................................................... 60
4.2 Test Plan for Major Components ................................................................................................ 60
4.2.1 Body .................................................................................................................................... 60
4.2.2 Steering ............................................................................................................................... 60
4.2.3 Braking ................................................................................................................................ 61
4.2.4 Suspension .......................................................................................................................... 63
4.2.5 Power Generation Test Plan ............................................................................................... 64
4.2.6 Control Systems .................................................................................................................. 65
4.2.7 Management System .......................................................................................................... 65
4.3 Summary of Test Plan ................................................................................................................. 66
5 Schedule .............................................................................................................................................. 68
6 Budget Estimate .................................................................................................................................. 71
6.1 Personnel Expenses .................................................................................................................... 71
6.2 Expenses...................................................................................................................................... 72

5
6.3 Overhead ..................................................................................................................................... 73
6.4 Equipment ................................................................................................................................... 73
6.5 Total Budget ................................................................................................................................ 73
7 Conclusion ........................................................................................................................................... 74
8 Bibliography ........................................................................................................................................ 75
9 Appendix ............................................................................................................................................. 77
9.1 Calculation .................................................................................................................................. 77
9.2 Test Plans .................................................................................................................................... 78

6
1 Introduction
1.1 Acknowledgements
The 2010-2011 Solar Car design team would like to thank all of the people and organizations helping us
to design and create a cutting edge solar powered vehicle. Particularly, the team would like to thank Dr.
Bruce Harvey for giving the team direction on how to approach the task of designing and building this
vehicle. The team would like to thank Dr. Chris Edrington, for the technical direction for the electrical
integration, High Performance Material Institute (HPMI) and Jerry Horne, for the time and know how to
create the composite body, and the FAMU-FSU College of Engineering, for the monetary donation to
complete this project with the best materials available.
1.2 Problem Statement
In 2009, the FAMU-FSU College of Engineering revitalized the Solar Car design project. The solar car
design project is intended to increase the knowledge of renewable energy generation, energy storage
and increase the publics’ awareness of advances in renewable energy technology. The students were
assigned the task to reuse and update the solar car from the 1997 Solar Car design team. This project
was to be Phase I of a two phase project. The team from 2009 utilized the existing frame but was unable
to salvage any portion of the previous body. Their goal was to get a rolling chassis that could be used for
the second phase of the project.
This year, Phase II of the project will start where the previous team of Phase I left off. The current 2010-
2011 design team, comprised of electrical, mechanical and industrial engineers, are assigned with the
task of designing and building a vehicle to be raced in the 2012 American Solar Challenge Race. The race
regulations have changed since the 2010 race. Therefore, the new design team will take what was
created from Phase I and design a new car to the 2012 race specifications.
In order to produce a vehicle to the 2012 race specifications, the team will have to work together to
optimize efficiency, power and durability. To accomplish this, the team must utilize the knowledge
learned from courses previously taken, keeping in mind a limited budget and a limited allotment of time.
The team will incorporate some components of the previous solar car to expedite the process and to
keep the cost down. The team will use the motor, motor controller and some electrical components
used from Phase I. All other components will be designed and fabricated to meet the specifications of
the race.
The new car will be designed using the idea of a monocoque body, which incorporates the chassis into
the body. The monocoque body will be made using carbon fiber and composite materials to reduce
weight and increase aerodynamic efficiency. The design will consist of three wheels, as opposed to four
wheels, to reduce the overall friction loss of the vehicle. The design will undergo stress analysis to
ensure safety and stability of the vehicle. Low friction disc brakes will be used on the forward two
wheels for proper stopping force necessary to decelerate the vehicle in the allotted space. A rack and

7
pinion steering system will be designed to best fit the vehicle for a turning radius specified by the race
regulations.
For propulsion, the driving force for the vehicle will produced by an in-wheel brushless DC motor. The
motor will be mounted on the rear trailing wheel assembly. To control the input power to the motor, a
motor controller will be used by taking the power from the batteries. Sensor readings, such as
temperature, voltage, will be continuously gathered to protect the batteries, motor and driver from
over-heating or over-charging. Also, a protection circuitry, including breakers and fuses, will be
implemented in order to safeguard components from power surges or cross wiring. These will ensure
safety to the driver and vehicle, which is the number one priority of the team.
1.3 Operating Environment
During the race, the solar car may be subjected to harsh weather conditions due to the race being held
on public roads and highways. Even though the route of the race has yet to be determined, it will be
assumed to go anywhere in North America. The race is held in the month of July, so temperature ranges
across North America can be as high as 134 °F or as low as freezing in portions of Canada. Solar radiation
on a clear day increases drastically making it a factor when considering the temperature inside the
vehicle.
The vehicle may have to endure areas of extreme humidity or extreme dryness. Rainfall or high winds
are not uncommon during the month of July in places across North America. Keeping in mind the vehicle
does require solar radiation to run; clouds and other water molecules in the air are a large factor in the
production of energy from radiation. The vehicle will have to compensate for the lack of sunlight when
the clouds are blocking the sunlight from striking the solar arrays.
Besides weather factors, the vehicle will have to withstand the conditions of the other traffic on the race
route. Cars and trucks driving beside, in front or behind the solar car may cast shadows on the solar
arrays making it impossible to produce energy from the sun. In addition to shadows, passing vehicles
may generate turbulent wind conditions making it more difficult to operate the vehicle and may
increase the drag on the solar car. The conditions of the roads are unknown. Therefore, the solar car
may have to handle bumpy, pot hole ridden roads.
The team must consider the power required for uphill travel. There might be sections of the route that
involve navigation through and around hills and mountains. Based on interstate highway standards, the
maximum grade that will be encountered is six (6) percent. However, this standard does not apply to
urban areas where grades can be as high as twelve (12) percent.
All factors must be taken into consideration when designing the vehicle for travel in North America.

8
1.4 Intended Use(s) and Intended User(s)
The solar car will be an eco-friendly way for a single driver to traverse distances with the normal speed
and efficiency of a car. The car will be equipped with all the normal lights and signals of a regular vehicle
and therefore should be able to safely travel on roadways throughout a city. The vehicle’s top speed will
prohibit it from travelling on any interstate highways or any other roads with high speed limits.
The solar car will be used primarily for daytime driving as this is the only way to collect the solar
radiation necessary to charge the batteries. The vehicle will be capable of charging the batteries from
certain wall sockets so it will not be entirely restricted to driving during the day, but as stated previously,
will have no way to recover energy except stopping again to charge.
This project will continue on after this portion of the design is completed in the hopes that it will be able
to compete in the American Solar Challenge. This challenge is a competition that occurs bi-yearly and
will give the finished product a chance to compete against other schools with similar design restrictions.
To enter this competition will be the primary goal of this car as it progresses through design projects.
1.5 Assumptions and Limitations
1.5.1 Assumptions
1. This portion of the design phase will continue to move the car towards competition in the
American Solar Challenge
2. Many of the electrical systems from phase one portion of the design will be useable in the
design work for this phase
3. The car will be allowed to be to carry a full charge before any competition, which may be
achieved through wall charging
4. There will be changing race restrictions for future races and the car will have to be left in a state
where systems can be changed cheaply and simply
1.5.2 Limitations
1. Budget will be restricted and it will be necessary to seek donations wherever possible
2. The solar array will be limited to a size of 6 m2
3. The driver’s eye line must be at least 70 cm off the ground and provide 100 degrees of view to
the right and the left
4. A roll cage will be protecting the driver in the event of a rollover collision
5. The electrical systems must be isolatable so that power can be immediately cut by either the
driver or an onlooker from outside the car
6. The car will have to pass a series of safety and performance tests outlined in the American Solar
Challenge guidelines and the finished project of this phase should have a car capable of passing
all these tests

9
1.6 Expected End and Other Deliverables
The most important deliverable will be the completed solar car from this phase of the project. This will
not be delivered until the end of the project time as will be illustrated below in the schedule. The other
deliverables for the project will include several design papers which will include updates as to the
current design and any modifications made from previous reports. A website will be created for the
purpose of displaying information about the solar car, progress to date, and will include a section for all
the papers and presentations. Finally a user manual for the safe operation of the vehicle will be
completed.

10
2 Systems Design
2.1 Overview of the System
Due to the amount of exposure to vehicles in today’s society the top level design of the solar car is fairly
fundamental. There are basics that every ‘car’ has that will also be required in the end result of the
solar car. The car will need a means of motion for not only the vehicle but also for the driver. Although
motion is a good start it is almost worthless if the motion cannot be controlled and directed. The control
means that the driver has to be able to slow down and speed up as desired and also has the ability to
change the direction of travel. It would also be ideal for the driver to have information about this travel
and control readily available (ie, speedometer). As it is a solar car it will need a means of power
generation through the sun’s radiant energies. This energy will have to be stored at times because the
driver may want to move the car during times when solar radiation is not available. While this is far from
a summation of the goals that the solar car will need to achieve it is a basic overview of the standards to
which the car will be held.
2.2 Major Components of the System
Due to the magnitude of the project it has been broken up into two sections, mechanical and electrical,
mainly as a means to describe the functionality of the system or component and further dictate the
primary party responsible. Each section has been further subdivided into multiple systems to allow the
design work to be placed in the hands of a specific engineer on the project.
The mechanical systems of the car will include the body, steering, braking, and suspension. The body of
the car will be just that, the housing for all components as well as structural support for the entire
vehicle. As can be inferred, the steering will be the system that will provide directional control over the
vehicle with driver input. The braking system will be the means by which the driver slows the car down.
Finally the suspension will be the system that will further facilitate driver control over the vehicle and
provide a smoother more comfortable ride for the driver.
The electrical systems that will be present in the final design of the car include: power generation,
control systems, management system, and propulsion system. The power generation system refers to
the two methods of generating power in the car. The first of these methods is solar energy, which is an
integral component to any solar powered device. The alternative method for power generation is
through the regenerative braking energy that can be produced by the motor. Controlling these two
methods of power generation will be the primary function of the power generation system. The control
system will be the devices that allow the driver to view information about the car, such as current speed
and state of charge, and to turn on and shut down the car through electrical relays. The management
system’s primary goal will be to keep the batteries of the car in a safe operating range at all times.
Finally the propulsion system refers to the means by which the car will move, the electric motor for the
car, and all devices that provide control for this device.

11
2.3 Performance Assessment
Each of the systems will have to be evaluated to ensure not only correct performance but ideal
performance under the wide variety of conditions that the car will be exposed to. This evaluation will
begin during the design phases and continue through fabrication and implementation through testing.
The body of the car will be graded against three major standards: aerodynamics, strength, and weight.
Due to the very low efficiency of utilizing solar energy everywhere power can be saved will be absolutely
necessary. For this reason the aerodynamics of the body may be one of the most important design
phases for the entire project. Through the use of CAD programs, different types of models can be tested
and the overall drag coefficient for the vehicle can be calculated. The strength of the car will also be
incredibly important as if the body breaks it could not only cause serious damage for the components
but also to the driver of the car. However since the motor will have to propel all the weight of the car, it
will also be necessary to keep the body as light as possible. The material of the body will have to be
chosen on these two factors.
The steering of the car will provide the direction control over the motion of the vehicle. As the
anticipated end result of the solar car is the end up in the American Solar Car Challenge (ASC), there are
certain restrictions on the degree of control the steering must be able to provide. This is not the design
limit for the car however and more control would be ideal unless if comes at the cost of friction or other
power losses. Figure 1.5.2.1 displays one of the steering tests (the slalom test) that the car must
undergo to qualify for the competition.
Figure 1.5.2.1 – Slalom Test Diagram
Similar with the braking system, the ASC has stipulated requirements on quickly the car must decelerate
(4.72 m/s2), but that is in no way a limit. Therefore the design of the braking system will be to meet the
needs of the competition and if it is possible to efficiently surpass these bounds than the system will be
designed as such.

12
The suspension of the car will provide some impact protection for various road conditions that the car
will encounter during operation. This protection will keep the body from unnecessary damage and also
provide the driver a more comfortable ride. Once the final weight and size of the vehicle is determined
there will be a maximum displacement for the suspension to be designed around.
The power generation system will also be limited by the ASC regulations, allowing a maximum of 6 m2 of
surface area for the solar arrays. The performance of these solar cells will be measured by the fill factor,
the ratio of theoretical power to actual power, solar efficiency, and thermal efficiency. Along with the
solar cells, power point trackers (PPT) will need to be utilized as well. PPTs will be chosen based on the
power rating and the overall efficiency with the solar cells utilized.
The control system’s primary component will be the microcontroller. The microcontroller’s performance
will be determined by comparing the needs of the project to the specifications of the microcontroller.
When a few microcontrollers are found that will meet the needs of the project, with a little extra for
possible design changes, then the search for the most cost effective one will take place.
The management system’s performance will be based upon how well the state of charge information is
monitored, both through the BMS and also the information displayed for the driver. It will also be
important to verify that the information seen by the driver will correspond to the information that will
be seen by the BMS, primarily as a means of checking that both systems are working properly.
2.4 Design Process
The solar car team has been provided with three industrial engineers to act as subcontractors for the
project, allowing for a wider variety of design input. The industrial engineers were able to greatly
facilitate the design process through their methodologies as shown in Figure 1.5.2.1 and Figure 1.5.2.2.

13
Figure 1.5.2.1 – Mechanical System
Mechanically Efficient
Steering
Wheel Angle of
turn
Steering Column Reach
Brakes System
Pedal Easy to Reach
Pedal Easy to Press
Rotational Response to
Brake
Accelerator
Pedal Easy to Reach
Pedal Easy to Press
Suspension
Shock Absorbtion
in All Terrain
Support Body Weight of Car
Structural Stability
Roll Cage
Composite Material Type

14
Figure 1.5.2.2 – Electrical System
Electrically Efficient
Solar Powered
Streamline of Circuitry
Type of Solar Cells
Current Flow From Cells to
Motor
Battery Powered
Quick Batttery Charge time
DC Motor
Controlled Power Output
Grounding Mechanism
Control System interface
State of Charge System
Reachable Switches
LED Display

15
These figures helped ensure that all factors were taken into consideration while going through the other
design stages. It was this process that helped to create the major component areas for our project.
For the power generation system the most important decision was the type of solar cells that would be
utilized in this design project. The options that were considered were silicon and amorphous silicon. The
major difference between the two is that the amorphous silicon are self encapsulated and flexible while
the regular silicon cells would have to be laminated to the body and, due to lack of flexibility, are much
more fragile. The advantages of the regular silicon cells are cost and a higher solar efficiency despite a
lower fill factor. Taking these factors into consideration it was determined that the amorphous would be
a better option mostly because of the durability. As none of the members of the team have a great deal
of experience with solar cells there was a fear that during installation a few might break, which increase
the cost for having to replace the cells. The flexibility of these solar cells will also allow them to molded
to the curvature of the body unlike the regular silicon cells, which would have to be tiered and increase
the overall drag of the car.
The control system had to make a decision about which microcontroller would meet all the needs of the
design project. It was important to keep in mind that if the capabilities of the microcontroller greatly
exceeded the needs of the project it would most likely cost more money as well. The microcontroller
chosen for the project is the Dragon12 Development Board, which contains more than enough I/O pins
for the entirety of the project. The programmable memory on this board is rather large which should
surpass the simple application for the dashboard displays.
The most difficult design portion of the management system will involve implementing a state of charge
system for the car. This state of charge will be measuring the voltage potential across the batteries and
current out of the batteries. Measuring the voltage is a rather simple task but in order to measure the
current a special device would have to be used. Three options for measuring the current presented
themselves that would be capable of measuring such high currents without damage to the device itself:
a current transformer, Hall Effect sensor, and a shunt line device. A state of charge device that contains
a voltmeter, temperature gauge, shunt line, and a battery fuel gauge will be used. This device will
provide the driver with all the information necessary to make safe decisions in operating the vehicle.
The simplicity of this device will make integration with other systems much simpler.
These are only a few of the major decisions that each system has already made on the way to
completing the design for the project. It is likely that many of these decisions will have to continue to be
made throughout the entire project, including the fabrication phase. However if a similar approach is
implemented then a sound decision can be made further ensuring the overall success of the project.
2.5 Overall Risk Assessment
There are two major risks to the overall success of the project. They include a budget risk which is
almost inevitable, but like most engineering projects there is never as much money as the individuals
working on the project would like. The other major risk is having enough time to complete the project.
16
While there is still over two months left in the project which would seem like plenty of time there is
always difficulty with other coursework and schedules which will divide the time of each member of the
team. The time risk will be all about each member managing their individual schedule to try to maximize
the amount of time that they can spend working on the project. Besides these two major risks, which
are risks to almost any project in any field (not just engineering), there are wide variety of technical and
safety risks involved with the project.
The biggest safety risk will be working with the batteries. As the batteries have a huge amount of energy
stored in them an accidental short circuit is very dangerous if not lethal. When performing any of the
work with the batteries or wiring a member will have to be very careful and should wear rubber gloves if
possible. The other safety risks will involve when the car is actually in operation. The driver will have to
be able to get out of the car quickly in the event of an electrical fire. This risk can be overcome by
designing the body of the car to separate as easily as possible. The other risk will be operating the
vehicle on roads. Despite the length and width dimensions of the car being quite large, the short height
of the car may make it difficult for other motorists to see the solar car. To prevent an unnecessary risk a
chase vehicle will be needed whenever driving the car on the street.
The technical risks for this project all involve designing a system or integration incorrectly. Due to the
magnitude of the project there is a higher potential of error. These risks will be combated by having
other project members, with similar technical skills, review any design work produced. During the
fabrication phase it will also be necessary to have multiple team members present to verify that a design
is being implemented correctly.

17
3 Design of Major Components
3.1 Body
The design for the body of the solar car has many factors when designing an efficient body with very
little frictional losses. When considering the design, the team has to keep in mind a few very important
factors. The first is the safety of the driver, which must meet the race regulations. The race regulations
state that the driver must be encapsulated in a roll cage for rollover protection. Dimensioning the
vehicle to fit the roll-cage has to be considered. The next factor that has to be considered is the overall
shape of the vehicle to keep air resistance at a minimum. Frictional loss from air resistance can be a
huge variable when driving at speeds reaching 70 mph. The final factor that must be considered is the
weight of the vehicle. The race states that the driver must weigh 80kg, making this the minimum the
total car can weigh. When considering rolling frictional loss in the tires, the main variable is the
downward force between the tires and the road, also referred to as the overall weight of the vehicle.
This design must be drawn in SolidWorks CAD software to be analyzed for structural integrity.
Figure 0.1---Vehicle Body Design Factors
3.1.1 Safety
According to the race regulations, the solar car must have a roll-cage to protect the driver in a crash
situation. To achieve the maximum amount of safety, a roll cage must be designed in conjunction with
the body to provide for the most effective design. When considering the roll-cage, the team had to
decide between a cage that has double bars over the drivers’ helmet or a design using one bar over the
drivers’ helmet and one bar over the lap of the driver. The factors for deciding between the two designs
are the effectiveness, whether it is easy to escape the car and the weight comparison. The team chose
to use the design of the double bars over the helmet of the driver because it would be much easier to
escape from the car in the case of an accident or fire. The bars will be made from chromoly tubing
because it is lightweight and very strong.
Vehicle Body
Design Factors
Safety Aerodynamic WeightRace Required
Dimensions
18
3.1.2 Body Shape
The body of the Solar Car must have as little air drag as possible. This makes for a more streamline
design reducing the force it takes to cut through the air. Through extensive research, the proposed
design takes the shape of a water droplet falling through the air which is commonly known as the basic
most aerodynamic object. At the bow of the vehicle, the design mimics the parabolic shape of the
bottom end of a water droplet. This is so there is no separation between the air and the body. When
separation of the air and the body occurs, there is a pocket of low pressure air that acts against the
direction the vehicle is moving. At the aft of the vehicle, the upper and lower halves of the body
converge to a single line. This, again, is to reduce the separation of air from the body reducing the
chance for the low pressure air pocket to be generated. When calculating the drag an object produces,
the two variables that can be controlled are the cross sectional area (A) and the drag coefficient (CD) of
the vehicle, as seen in the Equation 3.1.1.
Equation 3.1.1
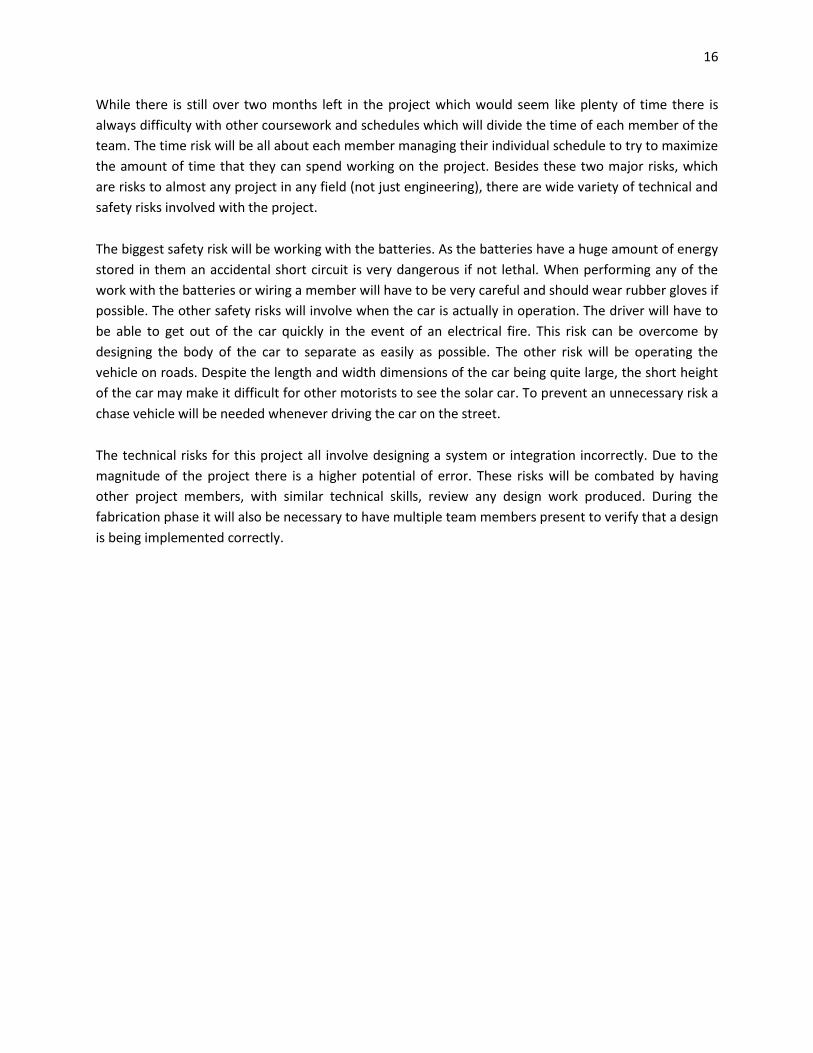
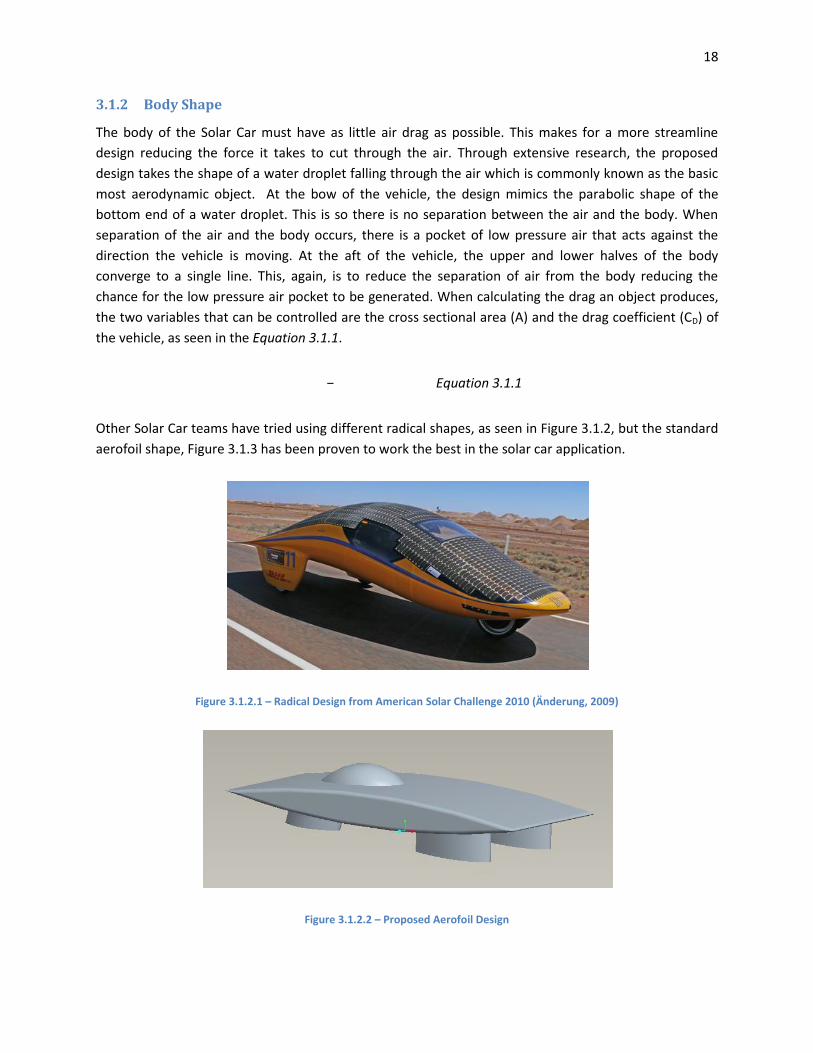
Other Solar Car teams have tried using different radical shapes, as seen in Figure 3.1.2, but the standard
aerofoil shape, Figure 3.1.3 has been proven to work the best in the solar car application.
Figure 3.1.2.1 – Radical Design from American Solar Challenge 2010 (Änderung, 2009)
Figure 3.1.2.2 – Proposed Aerofoil Design

19
3.1.3 Body Weight
The overall goal of the car is to make the body and its components as light as possible. This is because
frictional loss between the tires and the road and the frictional loss in the wheel bearings is a function of
the weight. Weight is also known as the Normal force (Nf) exerted to hold the car above the ground.
When determining the rolling friction lost between the road and the tires, Equation 3.1.2 is used: where
Crr is the coefficient of rolling friction for Michelin solar car/eco-marathon tires.
Equation 3.1.2
For reduction of overall weight of the body, there are two major components that have to be
considered, first of which is the design of the frame. Previously, solar cars were made using space age
aluminum framing and covered with a fiberglass shell as seen in Figure 3.1.5. The use of a frame adds
considerable weight making it less desirable.
Figure 3.1.3.1---Aluminum Frame with Outer Shell (Cyber, 1999)
The design chosen uses the idea of a monocoque construction which utilizes the shell of the body as the
load bearing structure as seen in Figure 3.1.6. It eliminates the aluminum tubing frame making for a
much lighter design.

20
Figure 3.1.3.2---Monocoque Body (Kruschandl, 2005)
The monocoque body can be made of either fiber glass or carbon fiber fabric. It is desirable to use the
carbon fiber fabric because it is 40% lighter than fiber glass and much stronger. The only drawback is
that it is considerably more expensive. The proposed design, Figure 3.1.7, is to use carbon fiber to make
the solar car as light as possible to reduce the frictional losses.
Figure 3.1.3.3---Proposed Monocoque Bottom Half
3.2 Steering
The steering system from the previous year’s solar car will be salvaged and implemented into the
current solar car design. The only new component will be selection of a new gear box to give to vehicle
its required steering characteristics.
The major components of a rack and pinion steering system are the steering wheel, steering column,
rack and pinion gear, and the tie rods. This is depicted in a block diagram in Figure 3.1.3.1.

21
Figure 3.1.3.1 – Steering System Block Diagram
3.2.1 Steering Wheel
The steering wheel is the input device for the steering system. As the driver turns the wheel it rotates
the steering column in order to turn the wheels in the desired direction.
3.2.2 Steering Column
The Steering column consists of two parts, the upper and lower shaft. The upper shaft is attached to the
steering wheel so as the steering wheel is turned, the upper shaft rotates proportionally to the wheel.
The lower shaft is positioned parallel to the road and is connected to the upper shaft using a universal
joint. Shown in Figure 3.2.2.1 is an example of a steering shaft assembly.
Figure 3.2.2.1--- Steering shaft. (Nice, How Car Steering Works, 2001)
Rack and Pinion Steering System
Steering Wheel Steering column
Upper Shaft
Lower Shaft
Rack and Pinion
Pinion
Rack
Tie Rods

22
3.2.3 Rack and Pinion
The rack and pinion, as shown in Figure 3.2.3.1 is the main component of the steering system. It consists
of a pinion gear, which is attached to the lower shaft that is in mesh with a rack. The rotational motion
of the pinion is converted to a linear motion by the rack gear. As the rack moves linearly it moves the tie
rods which turn the wheels.
Figure 3.2.3.1 – Rack and Pinion Gear (Rack and Pinion)
3.3 Braking
Shown in Figure 3.2.3.1 is the block diagram for the hydraulic disc braking system. The main
components of the system are the pedal system, master cylinder, caliper, and brake rotor.

23
Figure 3.2.3.1– Hydraulic disc braking system block diagram
3.3.1 Pedal System
To initialize the braking system of the car, a brake pedal will be installed in the car so when pressure is
applied to the pedal it rotates the arm pivot around a point to activate the push lever, which is
connected to the master cylinder and is responsible for applying pressure to the pistons in the master
cylinder to drive the hydraulic fluid. Shown in Figure 3.3.1.1 is the force diagram of the pedal system.
Figure 3.3.1.1 – Brake pedal system (Brake pedal setup)
Disc brakes
Pedal System
Pedal
Arm pivots
Push Lever
Master Cylinder
Brake Fluid Reservoirs
Cylinder Piston
Return Spring
Caliper
Brake Pads
Caliper Piston
Hydraulic lines and bleed valve
Rotor

24
3.3.2 Master Cylinder
The master cylinder is a crucial component of a disc braking system. The master cylinder is a control
device that converts the pressure from the push lever into the hydraulic pressure needed to stop the
vehicle. The master cylinder is comprised of the main cylindrical body, which encases two pistons and
two return springs, and a reservoir for the brake fluid. When the brake pedal is pressed it moves a the
primary piston. As the primary piston moves, hydraulic pressure builds in the cylinder and pushes a
second piston. The built pressure from these pistons gets transferred into the brake lines which go to
the respective brake caliper systems. When pressure is taken off the brake pedal, the return springs
return springs bring both pistons back to their respective rest states relieving pressure in the master
cylinder. Shown in Figure 3.3.2.1 is a schematic of a master cylinder.
Figure 3.3.2.1 – Master Cylinder Schematic (Master Cylinder System)
3.3.3 Caliper
The actual device that applies the frictional force on to the rotor to stop the vehicle is the brake caliper.
The brake caliper is an assembly that contains brake pads, caliper piston. The caliper fits over the brake
rotor like a clamp. Inside the caliper there are frictional pads placed on both inside faces of the caliper.
When pressure is applied to the brake pedal, brake fluid is sent from the master cylinder to the brake
caliper causing hydraulic pressure on the caliper system. This hydraulic pressure on the piston forces the
brake pads against the motor, which in turn stops the vehicle. Figure 3.3.3.1 shows a brake caliper
assembly mounted on a rotor.

25
Figure 3.3.3.1 -- Brake Caliper assembly (Hydraulic Brake Diagram)
3.3.4 Rotor
The rotor serves two purposes, the first of which is actually stopping the vehicle. As the brake calipers
clamp onto the brake rotor, a frictional force is generated on the rotor in the direction opposite of the
vehicles motion. This frictional force is what enables the car to stop or slow down. Another purpose of
the rotor is to dissipate heat which is created as a result of friction. As friction is applied to the rotor,
the kinetic energy of the moving rotor is converted to thermal energy. To help keep the rotor cool,
rotors have cooling vanes machined in them to suck in cool air as it rotates. Shown in Figure 3.3.4.1 is
brake rotor with cooling vanes.

26
Figure 3.3.4.1 -- Rotor with cooling vanes (Brake Rotor)
3.3.5 Brake System Selection
When selected the braking system to use, a decision need to be made between the disc and drum
braking system. Looking at the drum braking system, although it is a cheap system it can be complex
and difficult to fix. The internal components of the drum brake can become inefficient when the brakes
are applied repeatedly over a period of time. The drum brakes do not dissipate heat as efficiently as
disc brakes do, so the efficiency of the drum brakes decrease drastically when heated. The disc brakes
have the brake rotor exposed to open air so he can be dissipated efficiently without compromising the
efficiency of the braking system. Overall a drum brake is cheaper than the disc braking system, however
last year’s solar car has various components which can be salvaged to reduce the cost of the system.
Taking these considerations into account a decision matrix was constructed to aid in the decision making
process. Shown in Table 3.3.1 is the decision matrix of the braking system.
Table 3.3.1 – Brake System Decision Matrix
Brake System Decision Matrix
Cost Efficiency Durability Complexity Manufacturability Total
Disc brakes 5 4 4 4 2 19
Drum Brakes 2 2 3 2 3 12

27
From the decision matrix it was an obvious choice to go with the disc brakes over the drum brakes.
When selecting the actual disc brake system to use, the required braking force for each tire is to be
calculated. This can be done by using Equation 3.4.1.
Equation 3.4.1
Where F_friction is the frictional force the rotor applies to oppose motion, Fclamp is the force applied
by the caliper clamp onto the rotor; the equation for F clamp is shown in Equation3.4.2, where is
the coefficient of friction between the rotor and the brake pad.
Equation 3.4.2
3.4 Suspension
The suspension in the car will help maximize the friction between the tires and the road surface, and
provide steering stability with good handling to ensure the comfort of the driver. Main components of a
suspension, Error! Reference source not found., include spring, damper, control arms, and upright. Most
suspension designs use a passive spring to absorb impact and a damper to control spring motion. A
study found that humans perceive a ride to be comfortable when the bouncing frequency is 1 to 1.5 Hz;
after 2Hz, most people feel the ride to be tough. Therefore, the ride quality is controlled by the selection
of appropriate springs and dampers (Wan, 2000).
Figure 3.3.5.1 – Suspension Main Components
A car’s suspension can be non-independent or independent. In a non-independent suspension, a rigid
axle fixed is between the left and right wheels, and the body is suspended by leaf springs or coil springs
Suspension
(main components)
Spring Damper Control Arms Upright arm

28
on the axle. Consequently, the wheels are not independent and when one wheel rides on a hump, the
shock is transferred to the other wheel. In contrast, in an independent suspension, the wheels’
suspension systems are independent of each other (Shiota, 2010). This will provide the rider with a more
comfortable ride isolating the vehicle by its points of contact from the road and eliminating the
disadvantages of the beam axle. Some of these disadvantages include loss of friction by the wheels,
small maximum spring deflection, no control of the steering system, and over-steer. Due to the
advantages of an independent suspension system, the solar car will feature an independent suspension
system for each of the three wheels.
Figure 3.3.5.2 compares an independent and non-independent suspension design. It shows a solid rear
axle held by leaf springs for the non-independent suspension, and a spring and damper combination for
the independent suspension design.
Figure 3.3.5.2 – Non-independent Suspension (Temple, 1969)
Important parameters to take in consideration in the suspension design include: spring rate, damping,
travel, roll center height, and body dimension constraints. The spring rate or spring coefficient, k, is a
ratio measuring how resistant a spring is to being compressed or expanded during the
spring's deflection with units of lbf/in. or N/mm. Damping controls the movement of the car; un-
damped cars oscillate, whereas a damped car settles back to the equilibrium state in a minimal time. A
car’s travel must be established to set the spring’s displacement, x, and prevent the car from bottoming.
Hooke’s Law, Equation 3.4.1, can be used to calculate the force exerted by the springs.
Equation 3.4.1

29
The roll center height is important to body roll and stiffness distribution for both front and rear of the
car. Lastly, after analyzing the final design of the bottom shell of the car’s body, points on the body and
ribs will be chosen to connect the control arms of the suspension.
3.4.1 Front Suspension
The front suspension is linked to the steering system, thus some of the design parameters are
constrained by the steering design. Two suspension designs, the MacPherson strut and double wishbone
suspension systems, were analyzed and compared to choose the best fit for the front suspension. The
MacPherson strut, as shown in Figure 3.4.1.1, is a simple system comprised of a strut-type spring and
shock absorber combo pivoting on a ball joint on the single, lower arm.
Figure 3.4.1.1 – MacPherson Strut (Longhurst, 2010)
The telescopic shock absorber also serves as a link to control the position of the wheel as well as the
load bearing member, thus replacing the upper control arm making it compact. However, this design
does not offer very good handling as body roll and wheel's movement lead to variation in camber
(degree to which the wheel tilts in and out), shown in Figure 3.4.1.2, usually ending with positive
camber.

30
Figure 3.4.1.2 – Camber Angle and Toe Angle (Barrys Tyre & Exhaust Centre, 2010)
Consequently, the control arm will experience expansion rather than the ideal state of compression.
This gives engineers less freedom to adjust the camber angle and roll center. It’s high overall height
requires a higher hood line, which is not desirable in the design of the solar car body as it will increase
drag and decrease its streamline body design.
A double wishbone suspension design, shown in Figure 3.4.1.3, is regarded by many designers as the
most ideal suspension. It includes two (2) links forming a wishbone shape where one end is fixed to the
frame of the car and the other end to the lower and upper ball joints supporting the upright arm that
holds the wheel. A coil spring and damper combination is fitted between the two wishbones. It’s
parallelogram design allows the wheels to travel vertically up and down and a slight side-to-side motion
know as scrub. There are two other wheel movements relative to the body produced by this suspension:
toe angle (Figure 3.4.1.2) or steer angle (difference in the distance between the front of the tires and
the back of the tires), and camber angle or lean angle. This results in a complex system, but it provides
engineers the freedom to adjust the kinematics minimizing roll or sway resulting in a more consistent
steering feel. Moreover, this design always maintains the wheel perpendicular to the road surface,
irrespective of the wheel's movement ensuring good handling.

31
Figure 3.4.1.3 – Double Wishbone Suspension (Longhurst, 2010)
Table 3.4.1 shows a comparison table between the two (2) suspension designs.
Table 3.4.1 – MacPherson Strut vs. Double Wishbone Suspension
MacPherson Strut Double Wishbone
Advantages Disadvantages Advantages Disadvantages
Compact Average handling Ideal camber control Complex
Cheap High overall height Good handling Space engaging
Simple Camber angle change Easily tuned kinematics Costly
Expensive replacement Optimized lightweight parts
After comparing the two (2) suspension designs, a double wishbone design was chosen as the best fit to
the front suspension of the solar car. The double wishbone design gives the freedom to adjust camber
and toe angles, as well as scrub radius, and allows a vertical wheel movement perfect for the
constrained airfoil shaped wheel enclosure.
The control and upright arms will be manufactured in the college’s machine shop as this design allows
for optimized lightweight parts, another advantage in achieving a light weight car. The designed control

32
arms have a clearance of twelve (12) inches between each point of contact with the car’s frame rib, as
shown in Figure 3.4.1.4.
Figure 3.4.1.4 – Front Suspension Linear Sketch in Inches
However, the perpendicular length from the midpoint between both points of contacts to the ball joint
linking the control arm to the upright, shown by the dashed line in Figure 3.4.1.4 – Front Suspension
Linear Sketch in Inches, differs for both lower and upper control by 0.5 inches. The upper control arms
have a length of twelve (12) inches whereas the lower control arms have a length of 12.5 inches. The
short/long control arm design was created to keep the position of the contact patch in a straight vertical
line under bump and rebound conditions. Also, the arms will not be positioned parallel to one another
to prevent excessive tire scrubbing occurring due to large variation in track width as the wheel moves
off the neutral position. A drawing of the lower control arm is shown in Figure 3.4.1.5.

33
Figure 3.4.1.5 – Lower Control Arm Drawing in Inches
The control arms will be connected to the ribs using heim joints (Figure 3.4.1.6) and to the upright using
ball joints.
Figure 3.4.1.6 – Heim Joint
Assuming a total car weight of 520 lbs, a desired displacement of two (2) inches, using Hooke’s Law
(Equation 3.5.1), the calculated spring constant for each left and right front shock is .
Simulations in MSC ADAMS/Car such as opposite, parallel, and single wheel travel, and steering will be
performed to observe the behavior of the designed suspension. Also, using MSC ADAMS/Car, we will be

34
able to change the design parameters to obtain the desired camber angle of 0° and toe angle of -1° to
0°.
3.4.2 Rear Suspension
The rear suspension system will be supporting the single rear wheel as well as the motor connected to
it. We will be using the same suspension design of a single trailing arm suspension as it was used in last
year’s Phase I of the solar car project. However, calculations and analysis on this design will be done
again using the constraints of the new design.
A trailing arm, or swing arm, suspension shown in Figure 3.4.2.1, is similar to that of a motorcycle. It has
an arm joined at the front to the chassis that allows the rear to swing up and down, a suited motion for
the single rear wheel. This prevents side-to-side scrubbing allowing only vertical motion, thus no change
in the camber angle. The spring and damper system will be connected to the lower arm on one end and
to the body on the other end.
Figure 3.4.2.1 – Trailing Arm Suspension (Longhurst, 2010)
Last year’s trailing arm design had the swing arm holding the wheel on one side as shown in Figure
3.4.2.2. This created a torque on the wheel making it bend and not be perpendicular to the road surface.
To prevent torque and moment from developing, the control arm will be fork-shaped to hold the wheel
and motor on both sides.

35
Figure 3.4.2.2 – 2009-2010 Solar Car Trailing Arm Suspension
After the front suspension is fully designed, the rear suspension will be designed. Once the rough sketch
is done in SolidWorks, it will be imported into MSC ADAMS/Car to analyze it and perform simulations.
These simulations will provide us with the data needed to observe the suspension’s behavior and adjust
the dimensions to achieve the desired results. An example of a double wishbone suspension design in
MSC ADAMS/Car done by Eric Afyouni, a student in the Vehicle Design class, is shown in Figure 3.4.2.3.
Figure 3.4.2.3 – Double Wishbone Design in MSC ADAMS/Car
The spring and damper combination will be chosen depending on the total weight of the car and the
expected car behavior under braking, normal, and cornering conditions modeled in the CAD software.
Some risks associated with the design of the suspension include: budget and schedule risks, wrong
spring selection making the suspension too soft or stiff, wrong material selection to fabricate the control
arms causing stress failure.

36
3.5 Power Generation
The power generation system will be composed of solar array system, regenerative braking system, and
a maximum peak power tracker (MPPT). The solar array system will channel energy from solar radiation
into electrical energy. This energy will either propel the vehicle, or charge the vehicle’s battery system.
The MPPT will optimize performance of solar array system to provide maximum amperage to either
charge the batteries, or propel the vehicle. The regenerative braking system will charge the battery
system through the motor controller, when asserted by the driver. The regenerative braking system and
mechanical frictional braking system will provide total braking output. Figure 3.4.2.1 below displays the
overview of the power generation system.
Figure 3.4.2.1 – Overview of Power Generation System
3.5.1 Solar array system
The solar array system is an important component in the solar car. It is responsible for conversion of
electromagnetic radiation energy of the sun into electrical energy. It is an array of solar cells configured
to provide an output power suitable to propel the vehicle, or charge the battery.
The solar array is designed to input solar radiation energy and output electrical power. The fundamental
unit of this system is a solar cell. A solar array is parallel and/or series configuration of solar cells.
Figure 3.5.1.1 below displays the functional block diagram of the solar array system.
Figure 3.5.1.1 – Top level diagram of the solar array system
37
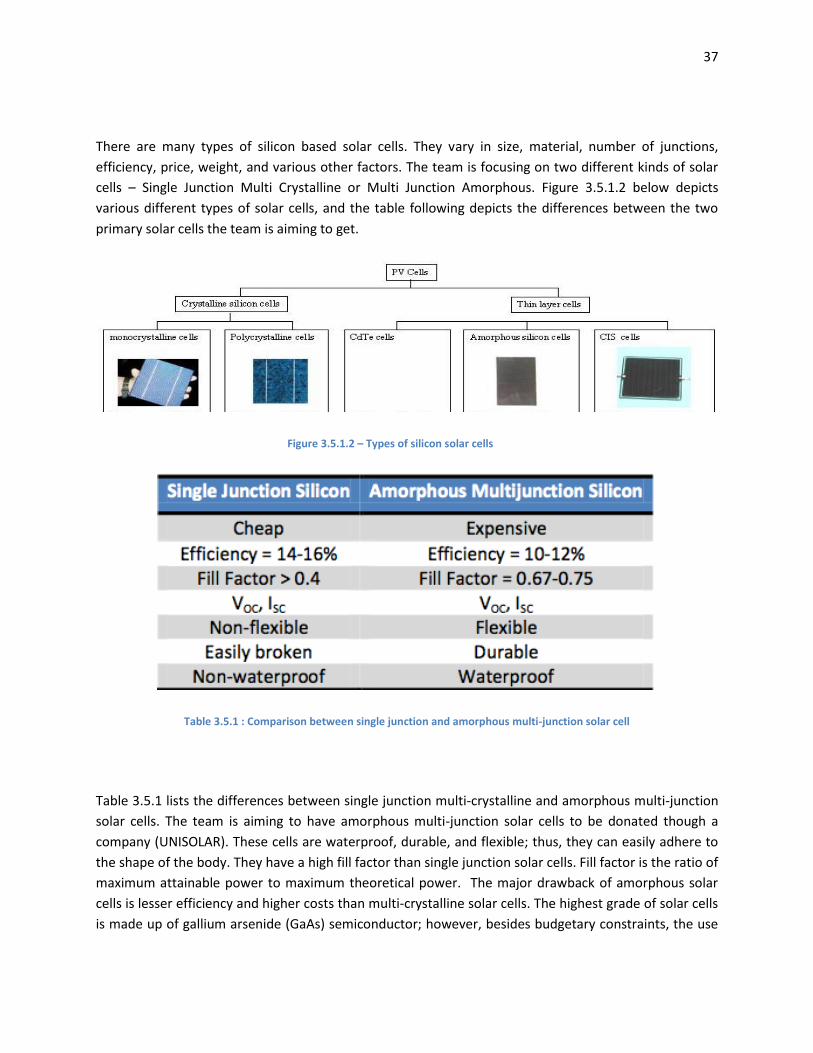
There are many types of silicon based solar cells. They vary in size, material, number of junctions,
efficiency, price, weight, and various other factors. The team is focusing on two different kinds of solar
cells – Single Junction Multi Crystalline or Multi Junction Amorphous. Figure 3.5.1.2 below depicts
various different types of solar cells, and the table following depicts the differences between the two
primary solar cells the team is aiming to get.
Figure 3.5.1.2 – Types of silicon solar cells
Table 3.5.1 : Comparison between single junction and amorphous multi-junction solar cell
Table 3.5.1 lists the differences between single junction multi-crystalline and amorphous multi-junction
solar cells. The team is aiming to have amorphous multi-junction solar cells to be donated though a
company (UNISOLAR). These cells are waterproof, durable, and flexible; thus, they can easily adhere to
the shape of the body. They have a high fill factor than single junction solar cells. Fill factor is the ratio of
maximum attainable power to maximum theoretical power. The major drawback of amorphous solar
cells is lesser efficiency and higher costs than multi-crystalline solar cells. The highest grade of solar cells
is made up of gallium arsenide (GaAs) semiconductor; however, besides budgetary constraints, the use

38
of GaAs based solar cells is prohibited by the regulations of American Solar Challenge, 2012. The
following are the factors affecting the performance of any solar cell.
Insolation = 1000 W/m2
Semiconductor (Si, GaAs)
Temperature
Position of Sun
Weather
The insolation or solar irradiance level in Tallahassee fluctuates between 600 W/m2 to 800 W/m2; it is
higher during winter and spring season than summer seasons. As such, testing of solar panels will be
performed in the spring semester (January – March). Silicon and Gallium Arsenide are the two most
common semiconductor material used to fabricate solar cells. Gallium Arsenide solar cells have
efficiency of up to 40%, while silicon shows efficiencies ranging from 6-20%. Solar cells display higher
performance in lower temperatures; they operate at higher voltage in lower temperatures and lower
voltages at higher temperature. The layout of solar cells should be designed to minimize its operating
temperature. The team has three basic ideas of approach for this problem: increase airflow by placing
solar array on a platform an inch above the body, or purchase high heat resistance composite, or insert a
system of small fans and holes to generate airflow. The solar cells will have to be tilted at a certain
angle to the sun. This angle, termed angle of incidence, is the angle between the outward normal of a
solar cell and the incident ray of the sun. This angle should be in between 20-25 degrees. Weather is
also a factor that affects the performance of solar cells; it is also a factor beyond our control. The design
should ensure reliability and safety in the most extreme of conditions like rainfall, haze, clouds, snow,
potholes, etc.
The three most important parameter of solar cells are open-circuit voltage (Voc), short-circuit current
(Isc), and efficiency. Voc and Isc vary with the irradiance level. This leads to fluctuations in power output.
A solar cell is electrically characterized as a current source in parallel with a diode. The electrical
schematic of a solar cell, and the I-V curve (with respect to different irradiance levels) of the solar cell
along with its equation is displayed in Figure 3.5.1.3 below. The current from the solar cell is at best
equal to the short-circuit current.

39
Figure 3.5.1.3 : A solar cell
In designing a solar array system from solar cells, a modular structure is generally followed. A solar
module is a chain of solar cells (series configuration). Parallel and/or series combination of solar
modules makes up a solar panel. An array of parallel solar panels makes up a solar array. Figure 3.5.1.4
below displays the modular structure of solar array system.
Figure 3.5.1.4: General structure of a solar array system
The solar array system is designed for voltage potential greater than the battery system voltage. The
battery system has a minimum and maximum safe operating voltage region. An array of solar panels in
parallel configuration makes up a solar array. So, each panel will be designed with open-circuit voltage
greater than the battery voltage. Due to inefficiencies, we will design an array with an open-circuit
voltage (Voc) 20- 30% greater than the maximum voltage of the battery bank.
The preliminary design calculations were based on single junction multi-crystalline silicon solar cells. This
assumption was made because of its commercial abundance and low price. Table 3.5.2 below depicts a
datasheet from a solar cell supplier.
Table 3.5.2 : Datasheet of various single junction multi-crystalline solar cells

40
Table 3.5.2 displays the differences in efficiency, power, Isc, and Voc between different models of solar
cells. Greater values of these parameter represent greater power output, which naturally translates to
higher solar cell per unit costs. A decision has to be made between desired power output of an
individual cell versus cost per unit cell.
Due to monetary constraints, the purchase, design, and completion of the solar array system cannot be
completed during this phase. As such, with the money allocated, the team has opted to purchase several
modules of triple junction amorphous thin film flexible solar cells from Unisolar. It is a 68 W module
termed PVL-68. Our preliminary cost analysis limits us to a maximum of 2 such solar modules. The
datasheet of the 68 W is presented in Error! Reference source not found. below.

41
Figure 3.5.1.5 – Datasheet of PVL-68; a 68W solar module from Unisolar (9.4 ft * 1.3 ft)
The design of our solar panel is based on PVL-68 with an average Isc (A) of 5.1 and an average Voc (V) of
23.1, thus an average of 118 Watt of maximum theoretical power per unit module. We are limited to an
area of 6 sq. meters for the solar array. This corresponds to around 5 modules for the whole car. Each
cells in the solar module has a built in bypass diode circuitry configuration. Our battery system has a
minimum of 72 V, maximum of 126 V, and nominal of 100 V. With 5 PVl-68 modules in series, we get a
Voc (V) around 116, Isc (A) of around 5.1, and maximum theoretical power of 340 W. of about want each
panel to have a minimum Voc of 150 V (20% more than maximum battery bank voltage). The
manufacturer’s datasheet also displays the performance of the PVl-68 module at its nominal operating
cell temperature. Drivetek MPPT has variable input and output voltage ranges but is restricted to a
minimum of 9 A input current; the current from the solar module will not exceed the MPPT current
restriction. The battery voltage and solar array components pertaining to the final design have been
briefly summarized below. The power, voltage, and current data refer to standard test conditions, and
are derived from the manufacturer’s datasheet. The computations and Figure 3.5.1.6 below displays the
power calculation and the overall solar array system schematic.
PVl-68 solar module:
Voc (V) = 23.1 V
Isc (A) = 5.1 A
Vmax (V) = 16.5 V
Imax (A) = 5.1 A
Pmax(W) = 68 W

42
Battery :
30 cells in series
Vmin (V) = 72 V
Vmax (V) = 126 V
Vnominal (V) = 100 V
Solar Array:
5 PVl-68 solar modules in series
Voc(V) = 115.5 V
Isc(A) = 5.1 A
Ptheoretical = 580 W
Vmax (V) = 82.5 V
Imax (A) = 4.13 A
Array_Power(W) = 340 W
8 A series fuse

43
Figure 3.5.1.6: Design of solar array system

44
3.5.2 Maximum Peak Power Tracker
Solar cells have a non-linear I-V relationship; this relationship varies widely with respect to solar
irradiance level. This causes fluctuations in output power. The MPPT is basically a DC:DC converter. It
has an efficiency of 92-97%. Its main mode of operation is optimization of power output from the solar
panels to provide maximum amperage to the system. One MPPT per solar panel is an ideal
configuration. MPPT’s provides protection to the battery and solar array. There is a loss of power due to
efficiency of the component (MPPT). MPPT’s are known to have efficiencies from 92-97%. Our design
team has looked at two MPPTS: Drivetek AG MPPT-Race V 4.0 from a company in Germany and AERL
RACEMAX 600B from Australia. The figure below depicts the block diagram of an MPPT along with a
picture of Drivetek AG MPPT; then follows with a table comparing the previously mentioned two
different types of MPPT suitable for high voltage solar car application.
Figure 3.5.1.7 : Maximum Peak Power Tracker

45
Table 3.5.3: Comparison between Drivetek RACE and AERL 600 B MPPT
Figure 3.5.1.7 and Table 3.5.3 above shows Drivetek RACE V 4.0 MPPT provides a wider range of power
handling capability, greater input current, and wider input/output voltage range than AERL 600B MPPT.
AERL 600B MPPT is also limited to a battery selectable voltage level of 72, 96,120,144,168V. It should be
noted that AERL 600B has a lower cost than Drivetek RACE V 4.0. Commercial market does offer basic
charge controllers and PWM charge controllers (Pulse Width Modulated). However, they are not able to
track maximum power point of solar panels, or offer protection to the battery and solar array system.
They are only able to charge the batteries until they are “full”, then the charge controller disconnects
the battery from the solar array. On the other hand, MPPT operates the PV array at a voltage which can
deliver maximum output power at the prevailing solar irradiance.
Drivetek MPPT has a maximum input current of 9 (A) DC. The current output from solar panel cannot
exceed 9 (A). The MPPT is a component that connects the solar panels with the battery system of the
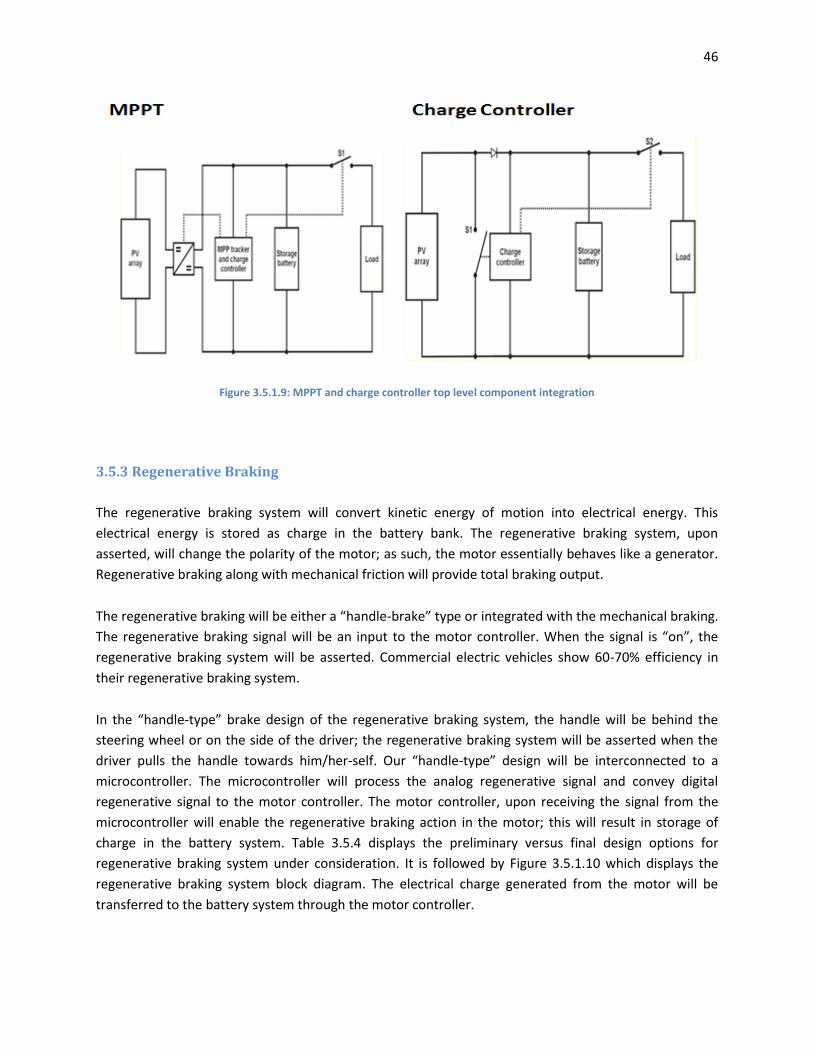
solar car. Figure 3.5.1.8 below depicts a component diagram of this system. It is followed by Figure
3.5.1.9 which displays a top level shunt type interconnection schematic for the charge controller and
the MPPT.
Figure 3.5.1.8: Component diagram of MPPT with solar panel and battery system
46
Figure 3.5.1.9: MPPT and charge controller top level component integration
3.5.3 Regenerative Braking
The regenerative braking system will convert kinetic energy of motion into electrical energy. This
electrical energy is stored as charge in the battery bank. The regenerative braking system, upon
asserted, will change the polarity of the motor; as such, the motor essentially behaves like a generator.
Regenerative braking along with mechanical friction will provide total braking output.
The regenerative braking will be either a “handle-brake” type or integrated with the mechanical braking.
The regenerative braking signal will be an input to the motor controller. When the signal is “on”, the
regenerative braking system will be asserted. Commercial electric vehicles show 60-70% efficiency in
their regenerative braking system.
In the “handle-type” brake design of the regenerative braking system, the handle will be behind the
steering wheel or on the side of the driver; the regenerative braking system will be asserted when the
driver pulls the handle towards him/her-self. Our “handle-type” design will be interconnected to a
microcontroller. The microcontroller will process the analog regenerative signal and convey digital
regenerative signal to the motor controller. The motor controller, upon receiving the signal from the
microcontroller will enable the regenerative braking action in the motor; this will result in storage of
charge in the battery system. Table 3.5.4 displays the preliminary versus final design options for
regenerative braking system under consideration. It is followed by Figure 3.5.1.10 which displays the
regenerative braking system block diagram. The electrical charge generated from the motor will be
transferred to the battery system through the motor controller.

47
Table 3.5.4: Preliminary versus final option for implementing regenerative braking system
The final chosen option was the “Handle-type” regenerative braking system. This system is easy to
implement, it is independent to the frictional brake, and the signal is processed by a microcontroller.
Figure 3.5.1.10: Regenerative braking system

48
3.6 Control Systems
The primary task of the control system is to provide a means to the operator to control the car and
make available to the operator the current status of the car’s components. The driver must have full
control of all the systems of the vehicle during operation, and must also be provided with telemetry
information and the status of system components. Figure 3.5.1.1 shows the dashboard from the
previous year’s design.
Figure 3.5.1.1 – Phase I Dashboard
3.6.1 Master Control Unit
The master control unit (MCU) will function as the interface between the driver, the motor controller,
and the battery management system (BMS). The MCU needs to be able to communicate serially with the
motor controller. It is also needed to control the lights in the car.
The microcontroller chosen is the Wytec Dragon12 Plus-USB development board shown in Figure
3.6.1.1. The Dragon12 Plus uses a Freescale HCS12 16-bit Microprocessor which is designed for use in
automotive applications. This board was chosen because it was the only board that could be found that
contains all of the I/O components need for the process.

49
Figure 3.6.1.1 – Wytec Dragon12 Plus-USB
The code for the microcontroller will be written using the Freescale CodeWarrior IDE software.
CodeWarrior is offered for free by Freescale for use in development of applications using Freescale’s
products. Using an IDE will increase productivity and provide simulation, debugging, and programming
capabilities in order to decrease development time.
The functions that the MCU will perform include but are not limited to:
- Activating the motor controller relay after the motor controller has had time to pre-charge
- Use an algorithm to automatically adjust the air gap in the motor
- Activate the lights and horn
- Provide a menu based input system for the driver to change the settings of the motor controller
and view car status information
The Board is powered by a 9V source, so a means of providing the power must be found. The options
explored thus far include the incorporation of the existing 100V to 12V DC-DC Converter with a 12V to
9V DC-DC converter, and using a 100V to 12V DC-DC converter. The 12V to 9V DC-DC is more widely
available and cheaper, although the current DC-DC converter may need replacing in the future. Ideally,
the team would like to use a single DC-DC converter that has 24V, 12V, and 9V output with 100V input if
such a converter exists.
3.6.2 Lights/Horn
The vehicle needs to be equipped with at least six lights, two front lights, two rear brake lights and two
turn indicators. The brake lights can be combined with the turn indicators for a total of six lights.

50
The main lights will be controlled by a switch on the dashboard to control the front and rear lights. The
brake lights will be activated by a signal sent from the motor controller to the MCU when the
regenerative braking is activated. The turn signal lights will be either activated by a switch on the
dashboard or by switches integrated into the steering wheel electronic flashers will be used to control
the turn indicator lights.
3.6.3 Motor Controller
The motor controller is used to power the motor. It is controlled by a microcontroller that can be
accessed through a serial interface. The motor controller has two control modes, discrete control mode,
and serial control mode. The car is currently configured to operate in discrete mode. The main
advantage of discrete mode over serial mode is that is it easier to implement. However, in discrete
mode, there is no access to the internal functions of the motor controller’s microprocessor, which
contains very useful diagnostic, and status data and motor control mode settings. Figure 3.6.3.1 shows
an example of a discrete control configuration for a motor controller.
Figure 3.6.3.1 – Motor controller discrete control configuration
The motor controller will be reconfigured for a combined discrete and serial mode operation. The MCU
will be connected to the motor controller through the serial interface. The throttle potentiometer will
remain connected directly to the throttle input to the motor controller, but the microcontroller will read
the data from the motor controller and use it to make adjustments to the air gap of the motor based on
the data collected from the motor controller. All of the diagnostic data produced by the motor controller

51
will be collected by the MCU and processed to be available to the driver. The forward/reverse switch
and the throttle enable switch will be connected the MCU which will send the command to the motor
controller serially.
3.6.4 Dashboard
The dashboard shall function as the I/O interface of the operator of the vehicle. It will display telemetry
information, contain an input mechanism to send commands to the motor controller through the MCU,
and display control status information.
Currently, the control system is discretely controlled manually by switches. The current startup
sequence is somewhat complicated and cannot be performed by someone that does not have full
knowledge of the car’s design. The new system will replace these manual switches with High voltage DC
rated electromagnetic contactors, as shown in Figure 3.6.4.1 that will be automatically activated by the
Battery Management System (BMS) when the BMS is powered on. The BMS is designed to open these
relays to actively isolate the batteries in situations of over-voltage, under-voltage, over-current, and
over-temperature.
Figure 3.6.4.1 – High voltage DC rate contactor
Once the main switch is activated, power will be supplied to the 12V power source and the motor will
begin to precharge. An ignition switch will be pressed to enable power to the dashboard systems and
power on the MCU. The MCU will then activate the motor controller relay after the motor has had time
to precharge. This configuration simplifies the startup sequence to turning on the main power switch
and activating the ignition switch. Figure 3.6.4.2 shows the diagram for the main power system
supplying power to the dashboard seen in the diagram in Figure 3.6.4.3.

52
Figure 3.6.4.2 – Main power system design

53
Figure 3.6.4.3 – Dashboard power system design

54
The new dashboard will look similar to Figure 3.6.4.4. Currently the dimensions of the dashboard area
are unknown, so the placement of the components may change once this information is known.
The state of charge meter will be added to display the current and voltage levels of the batteries as well
as an approximation of the available energy left in the batteries. An LCD Display with a keypad that is
connected to the MCU will be used to input commands the MCU directly from the dashboard. The LCD
display will display all of the information provided by the MCU.
Figure 3.6.4.4 – New Dashboard Design
The speedometer that is currently in the car is not working, and the exact cause of the problem is
unknown. The signal to the speedometer is not being sent from the motor controller properly. This is
thought to be due a grounding problem or possibly from a malfunction in the motor controller. A
proposed design to fix this problem is to use the MCU to read the speed data directly from the motor
controller and use this information to send a signal to the speedometer.
A rear view mechanism will be needed to see behind the car because the driver will not have enough
room to turn around inside the car. The two options explored so far are using a rearview mirror and
using a rear camera with a display mounted on the dashboard. Using a mirror would be much cheaper,
but it may not be possible depending on the final design of the body.
3.7 Management Systems
The management system will consist of the batteries, the battery management system, cell modules,
and state of charge devices. The motor and motor controller is also an integral portion of this system
because the motor controller is a management device. The first phase of the project was able to get

55
bring the motor to a fully functioning state and because there are no foreseeable modifications
necessary will not be discussed in this portion of the paper. The batteries for the system have already
been purchased in the previous phases and will again be utilized during this phase of the project. Due to
the importance of the batteries in the final product the rest of this system will be designed to meet the
needs of these batteries. Figure 3.6.4.1 shows the layout of the management system, the green blocks
have already been completed in the previous phase.
Figure 3.6.4.1 – Management Power System block diagram
Currently thirty Thundersky batteries have been implemented into the system. Each cell has an ideal
operating voltage of 3.2 V and therefore the system as a whole will operate at 96 V. The only time that
the batteries are outside of this range should be at a point of complete charge or at complete discharge.
Figure 3.6.4.2 shows the discharge cycle of the Thundersky batteries.
ManagementSystem
Stored Energy System
Batteries
Wall Charging System
Protection Circuit
State of Charge
Propulsion System
Motor Controller
Motor

56
Figure 3.6.4.2 – Graph of Thundersky battery discharge cycle (Endless-Sphere)
The Thundersky batteries like all batteries have ideal operating parameters and must be kept in this
range or risk causing damage to the batteries. A protection circuit will have to be implemented to keep
the batteries in the safe range. The protection circuit will be designed to the ideal operating ranges
displayed in Table 3.7.1.
Table 3.7.1 – Safe battery operating parameters
Protection Type Restraining Value
Over Voltage 4.25 V
Under Voltage 2.5 V
Over Current 120 A
Over Temperature 75 °C
Several devices have already been purchased in conjunction with the batteries to simplify this state of
charge monitoring. A battery management system (BMS) designed specifically for these batteries will be
utilized as a means to isolate the batteries from the rest of the electrical system. The battery
management system contains four signal wires through which passes a small current. As long as the
signal circuits are closed then the BMS will allow operation of the batteries. As soon as one of the signals
is broken then the BMS will slowly power down the batteries and finally separate them entirely from the
rest of the system. This will be the controlling device to prevent batteries from out of bounds conditions.

57
The voltage protection for the batteries will utilize a cell module device attached to each of the
batteries. The signal wire from the BMS will be run through each of the cell modules. During the
operation of the vehicle the cell module will monitor the voltage potential of the individual battery that
it is attached too. When the battery is in a safe operating range the cell module will be a closed circuit
and when outside of this range the cell module will be an open circuit. If even one of the cell modules is
an open circuit then the BMS will begin the shut down phase. The voltage will also be measured through
a voltmeter device connected to a state of charge device which can be seen in Figure 3.6.4.3.
Figure 3.6.4.3 -- TBS Electronics E-Xpert Pro (Evolve Electrics: TBS Electronics E-Xpert Pro)
To measure the current out of the batteries a shunt line will be used. A shunt line will be a connection
across the wires from the batteries and will be capable of measuring the current in those wires. This
information will be delivered to the state of charge device in the dashboard so that it can be displayed.
The information will also be delivered to the microcontroller, interpreted, and then delivered to the
BMS. This way if for some reason the current exceeds the value rated for the batteries (120 A) then the
BMS can perform he shut down sequence as before.
Originally a thermistor was going to be implemented in order to provide the temperature control for the
batteries. The inherent problem with using the thermistor was the difficulty in determining the exact
temperature because most thermistors operate similar to a switch, in that once the cutoff temperature
is reached the resistance rises drastically. Since the temperature was some of the information that
would certainly be helpful for the driver to know the state of charge device again will be implemented to
provide this information to the dashboard display as well as to the microcontroller for processing.
Since the state of charge device will be capable of measuring the voltage level of the batteries and the
current coming out it will be capable of giving an estimated fuel gauge for the batteries. This
information is highly desirable for any vehicle, imagine driving to drive a car without knowing how much
gas is left in the tank. Utilizing this information will also allow the driver to notice power trending, such

58
as how much power is used during accelerating or at certain speeds. This information can be used by the
driver to get the most mileage out of the car, by choosing to drive at speeds where the current flow is at
its lowest. It is unclear whether the state of charge system will recognize power being placed back into
the batteries through the power generation systems. Ideally it would read a negative current value and
make corresponding corrections to the fuel gauge. This information will have to be determined through
testing after the part has arrived.
Once the state of charge system and protection circuit is in place there is no reason that the batteries
should ever be exposed to dangerous operating conditions. In the event that the BMS or some element
of the protection circuit fails the driver, through the dashboard, should be aware of any danger to the
operating environment of the batteries.

59
4 Test Plan
A test plan document was created by the members of the previous phase as seen in Figure 3.6.4.1. In
order to keep consistency this phase of the project will also implement the same test plan document.
This template displays all the pertinent information about each test, including what is being tested, the
goals of the tests, and final results. A well organized system for testing will yield a more successful
product in the end.
Figure 3.6.4.1 -- Blank Test Plan Format
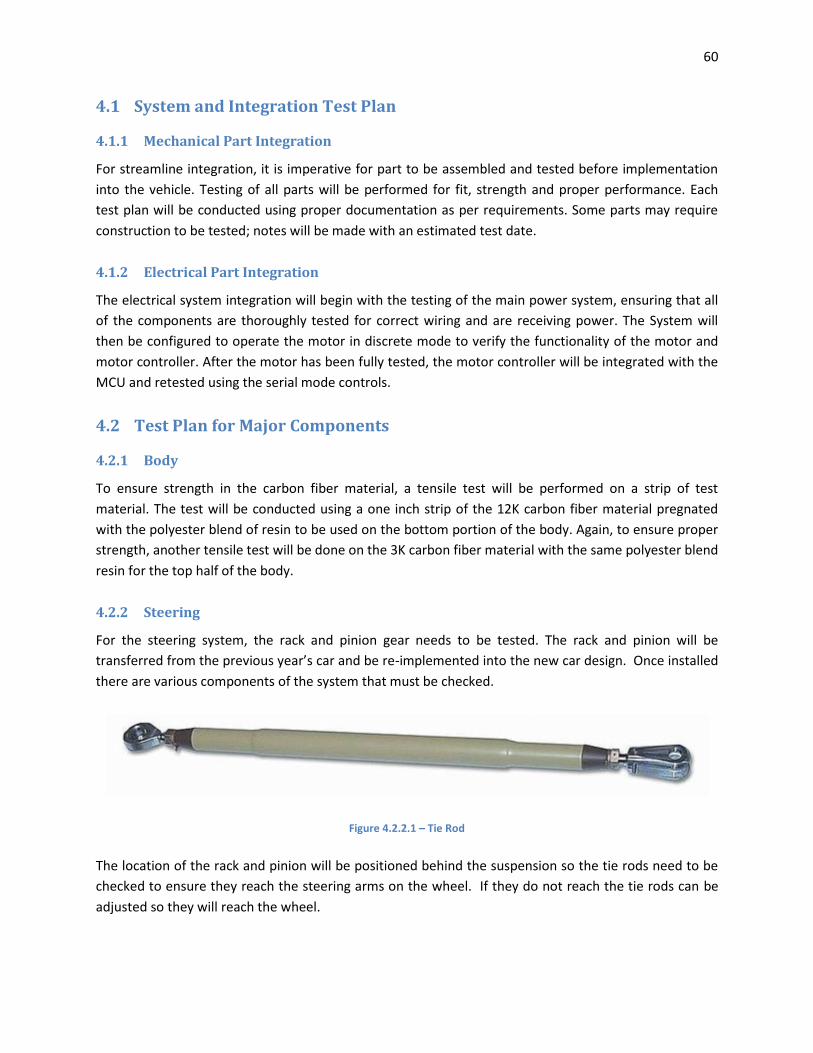
60
4.1 System and Integration Test Plan
4.1.1 Mechanical Part Integration
For streamline integration, it is imperative for part to be assembled and tested before implementation
into the vehicle. Testing of all parts will be performed for fit, strength and proper performance. Each
test plan will be conducted using proper documentation as per requirements. Some parts may require
construction to be tested; notes will be made with an estimated test date.
4.1.2 Electrical Part Integration
The electrical system integration will begin with the testing of the main power system, ensuring that all
of the components are thoroughly tested for correct wiring and are receiving power. The System will
then be configured to operate the motor in discrete mode to verify the functionality of the motor and
motor controller. After the motor has been fully tested, the motor controller will be integrated with the
MCU and retested using the serial mode controls.
4.2 Test Plan for Major Components
4.2.1 Body
To ensure strength in the carbon fiber material, a tensile test will be performed on a strip of test
material. The test will be conducted using a one inch strip of the 12K carbon fiber material pregnated
with the polyester blend of resin to be used on the bottom portion of the body. Again, to ensure proper
strength, another tensile test will be done on the 3K carbon fiber material with the same polyester blend
resin for the top half of the body.
4.2.2 Steering
For the steering system, the rack and pinion gear needs to be tested. The rack and pinion will be
transferred from the previous year’s car and be re-implemented into the new car design. Once installed
there are various components of the system that must be checked.
Figure 4.2.2.1 – Tie Rod
The location of the rack and pinion will be positioned behind the suspension so the tie rods need to be
checked to ensure they reach the steering arms on the wheel. If they do not reach the tie rods can be
adjusted so they will reach the wheel.

61
The new geometry of the steering system may affect the steering capabilities of the rack and pinion
gear. Once the gear has been installed, the vehicle must perform several maneuverability tests in order
to compete in the race. The car must be able to make a U-turn in either direction, without backing up
such that all wheels remain within a 16 m wide lane.
The rack and pinion gear must be tested to ensure that the gears mesh well with each other. The gear
must translate the rotational motion of the steering column into linear motion of the rack. The rack and
pinion must also be able to push the tie rods effectively to ensure proper steering.
Figure 4.2.2.2 – Rack and Pinion Gear
4.2.3 Braking
Several braking components are to be purchased from Wilwood Engineering. The parts include two
brake calipers, two master cylinders, and a parking brake. Each of these components must be tested to
ensure that they all integrate into an efficient braking system.
Two master cylinders are to be purchased from Wilwood Engineering. Once the Master Cylinders have
been obtained they must be tested to ensure they provide adequate fluid pressure to each caliper
assembly. Figure 4.2.3.1 shows the master cylinders to be purchased.

62
Figure 4.2.3.1 -- Wilwood Master Cylinder
Once installed, the master cylinder must be tested to ensure it can apply hydraulic pressure to the brake
calipers. To test this, pressure will be applied to the brake pedal to force fluid through the brake lines.
This also tests the integrity of the brake lines. Any leaks in the lines will be found by applying pressure to
the pedal. If there is a leak in the line, the brake line must be adjusted or changed in order to keep
hydraulic pressure.
Two brake calipers are to be purchased from Wilwood Engineering. These calipers are shown in Figure
4.2.3.2. Once the obtained the calipers must be tested to ensure they can effectively push the caliper
piston. When hydraulic fluid is pumped to the caliper, the piston must move towards the brake rotor to
stop the vehicle. Once pressure is released from the caliper, the piston must retract smoothly away from
the rotor.
Figure 4.2.3.2 -- Wilwood brake calipers
The brake rotor will be fabricated at the machine shop. This custom rotor must be tested to ensure it
effectively be used to stop the car as friction is applied to it. As friction is applied to the brake rotor,
heat is generated throughout the component. The rotor must be tested to ensure it can dissipate heat
effectively. If heat is not dissipated from the rotor, rotor failure is imminent. To prevent this, the heat
transfer capabilities of the rotor will be tested by using finite element analysis. Figure 4.2.3.3 shows a
brake rotor undergoing finite element analysis.

63
Figure 4.2.3.3 -- FEA on brake rotor
4.2.4 Suspension
Tests will be performed on the suspension’s components and as a whole system to ensure desired and
efficient performance.
4.2.4.1 Components
Finite element analysis will be performed on each of the suspension’s components to observe the stress
points and their deflections under the transferred forces it will experience from the wheel under bump
and rebound conditions. This testing will also check for part failures by performing analysis at various
nodes of the virtual mesh. The components to be tested include: mounting brackets, heim joints, control
arms, and upright arms for both front and rear suspension systems. Refer to Test Plan Appendix section.
Figure 4.2.4.1 shows an example of finite element analysis on a double wishbone suspension.

64
Figure 4.2.4.1 – Double Wishbone Suspension Finite Element Analysis
4.2.4.2 Suspension System Virtual Simulation
The assembled suspension system will be analyzed and simulated in MSC ADAMS/Car. These simulations
will provide us with the data needed to observe the suspension’s behavior and adjust the dimensions to
achieve the desired results. Opposite, parallel, and single wheel travel, and steering simulations will be
performed to observe the behavior of the designed suspension. The results obtained by these
simulations include camber angle change, toe angle, as well as static loads and forces acting on the
system. This test will be done independently from the front and rear suspension systems then as a
whole.
4.2.5 Power Generation Test Plan
The test plans for power generation system consists of testing the solar array system, MPPT, and the
regenerative braking. The solar array system will be tested for proper configuration (series and\or
parallel); it will also be tested for manufacture rated open-circuit voltage and short-circuit current. The
efficiency of the solar cell and insolation level of Tallahassee will be taken into account when measure
these parameters. The MPPT is basically a DC: DC converter; so it will be tested for input and output
voltages. The current coming from the MPPT into the battery shall be tested and measured using the
state of charge device. The regenerative braking system will be tested to ensure the brake is applied
when the system is asserted; it will also be tested to ensure if charge is being supplied to the battery
system when the regenerative brake is asserted. Most of the testing will be performed using a digital
multi-meter; care should be taken to ensure proper settings in the multi-meter before measurement.

65
4.2.6 Control Systems
Some of the major components were tested in the previous phase but will need to be retested upon
integration into the new system. The MCU will need to be thoroughly tested in order to verify that all of
the MCU software is functioning properly. Most of the MCU tests will be performed using simulations.
The Dashboard system components will need to be tested prior to integration. The speedometer and
state of charge meter can be tested for functionality, but further tests will need to be performed after
electrical system integration. The discrete electrical components will be tested using switches.
The serial functionality of the motor controller and the MCU will be tested using a serial terminal
program on a PC before integration. After the MCU and motor controller functionality have been
verified, a simple test program will need to be implemented to test the integration functionality.
4.2.7 Management System
There are only two new subsystems which will be added to the overall management system and these
systems will have to be tested thoroughly during the integration phase. It will also be necessary to test
the old subsystems as well before any integration. These tests will be necessary to verify that no damage
occurred to the system during the summer and also to verify the systems were tested correctly in the
first place. For this reason testing of the management system began with the battery and propulsion
subsystems.
The batteries when first examined were tested for charge. The anticipated charge for a battery was 3.3
V and each of the batteries was tested using a volt meter. Out of the thirty batteries only one of the
batteries was below this value. To correct this problem that battery was hooked up to an iCharger that
allows the charge of an individual battery instead of charging all the batteries in series. The battery was
again tested after using the iCharger and was verified to be able to hold a charge. The other important
subsystem that was tested involving the batteries was the wall charging system. This subsystem was
tested as a whole due to the thoroughly with which the first phase of the project tested this subsystem.
The batteries were able to be charged successfully using the wall charging unit.
The propulsion system was rather simple to test. After the batteries were tested and reinstalled in the
car the propulsion test began. It consisted of getting the car started and hitting the accelerator. This
however did encompass a preliminary test of the existing dashboard systems as well. The car did run
properly on the battery power once it was turned on responding to all the existing controls, which
includes the steering and braking systems. The motor controller uses a D25 cable for all its input and
output. While the input into the motor controller works properly because the car has motion, it was
noted that some of the output were not working properly. The signal that send information about the
speed of the car, which in turn was supposed to be used by the speedometer on the dashboard, was not
working properly. By reading information about the motor controller all of the output signals should
range between 0 V and 5 V, but using a multimeter the largest potential that was seen was around 2.4 V.
To attempt to discover the source of this error there will be piecewise testing that will occur to test

66
every device that interacts with this signal. This will include testing the D25 cable, breakout board, and
speedometer itself. If it is determined that the source of the error is just a weak signal then it may be
possible to boost the signal through an amplifying circuit.
The subsystems that will be added during this phase can be tested more rigorously during the different
stages of development. The state of charge system is comprised of several smaller components and
each of these components will have to be tested before integration. Testing the state of charge system’s
ability to measure potential will be simple because the information can be verified with any multimeter
device without causing any damage to the system. Verifying a current measurement may require setting
up a simple circuit by which to perform the tests, because generic measurement devices such as
multimeters, are not designed to measure currents as high as 80 A. The final test will be the
temperature sensor device on the state of charge device. Since the temperature sensor works on the
ambient temperature around it, it can simply be tested by hooking it up and verifying that it is reading
room temperature. It will need to be further verified at higher temperatures using a thermometer as
gauge to measure accuracy.
Once the state of charge systems are all correctly working then the integration with the rest of the
system will have to be tested. This will include sending information to the microcontroller, such as the
current use and temperature. This information will be important is needed by the microcontroller as a
means of battery protection. The microcontroller will take this information and communicate it to the
BMS, which will ensure that the batteries are always operating in the designated safe ranges. A small
program will be written to display the information obtained from the state of charge system on the
development board’s LCD screen. Then this information will be compared with the information on the
display of the state of charge system. Once it is verified that the information is correctly communicated
and with little delay it can be fully integrated into the system.
4.3 Summary of Test Plan The following table shows a summary of the tests to be performed on the different components and
systems of the car.
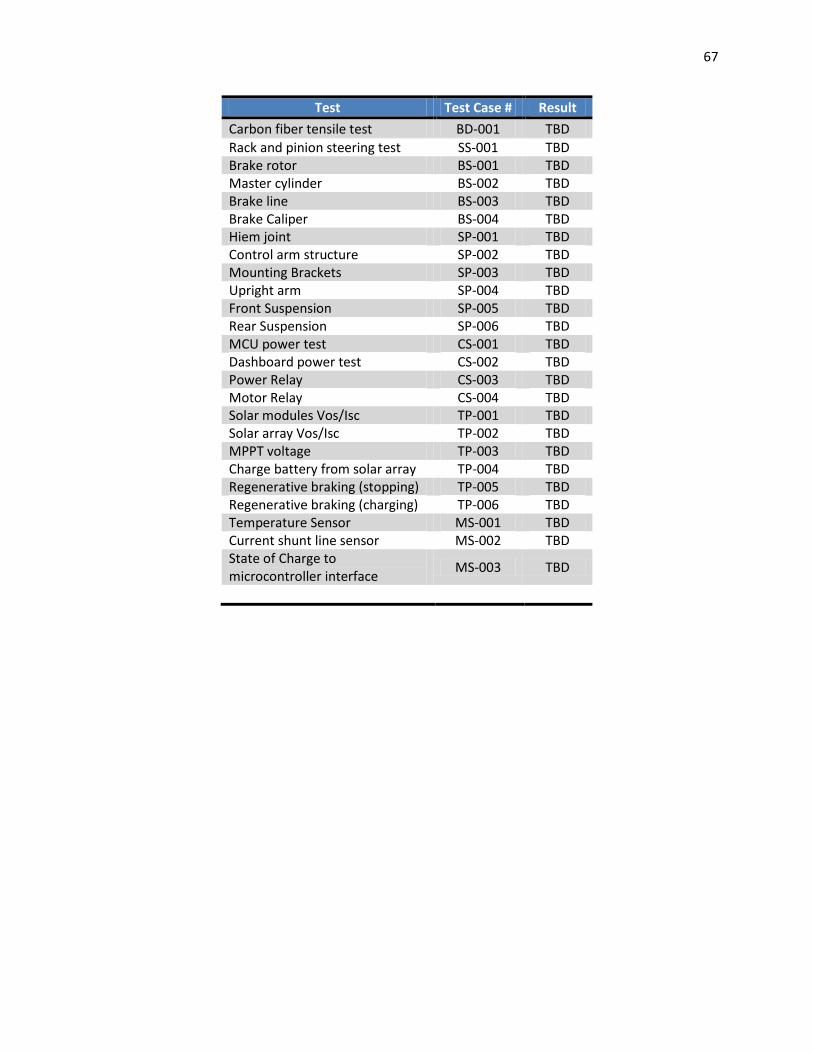
67
Test Test Case # Result
Carbon fiber tensile test BD-001 TBD
Rack and pinion steering test SS-001 TBD Brake rotor BS-001 TBD Master cylinder BS-002 TBD Brake line BS-003 TBD Brake Caliper BS-004 TBD Hiem joint SP-001 TBD Control arm structure SP-002 TBD Mounting Brackets SP-003 TBD Upright arm SP-004 TBD Front Suspension SP-005 TBD Rear Suspension SP-006 TBD MCU power test CS-001 TBD Dashboard power test CS-002 TBD Power Relay CS-003 TBD Motor Relay CS-004 TBD Solar modules Vos/Isc TP-001 TBD Solar array Vos/Isc TP-002 TBD MPPT voltage TP-003 TBD Charge battery from solar array TP-004 TBD Regenerative braking (stopping) TP-005 TBD Regenerative braking (charging) TP-006 TBD Temperature Sensor MS-001 TBD Current shunt line sensor MS-002 TBD State of Charge to microcontroller interface
MS-003 TBD

68
5 Schedule
Below is a copy of the Ghant schedule produced in Microsoft Project that must be followed to
successfully complete the project on time.

69

70
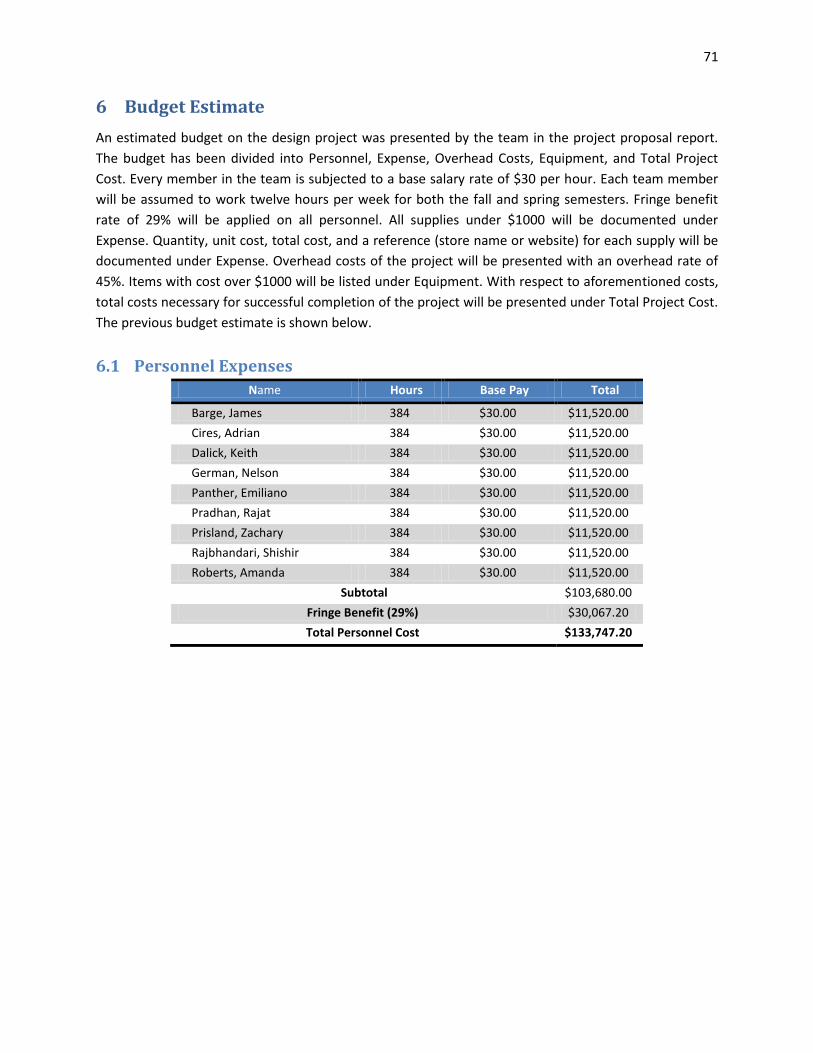
71
6 Budget Estimate
An estimated budget on the design project was presented by the team in the project proposal report.
The budget has been divided into Personnel, Expense, Overhead Costs, Equipment, and Total Project
Cost. Every member in the team is subjected to a base salary rate of $30 per hour. Each team member
will be assumed to work twelve hours per week for both the fall and spring semesters. Fringe benefit
rate of 29% will be applied on all personnel. All supplies under $1000 will be documented under
Expense. Quantity, unit cost, total cost, and a reference (store name or website) for each supply will be
documented under Expense. Overhead costs of the project will be presented with an overhead rate of
45%. Items with cost over $1000 will be listed under Equipment. With respect to aforementioned costs,
total costs necessary for successful completion of the project will be presented under Total Project Cost.
The previous budget estimate is shown below.
6.1 Personnel Expenses
Name Hours Base Pay Total
Barge, James 384 $30.00 $11,520.00
Cires, Adrian 384 $30.00 $11,520.00
Dalick, Keith 384 $30.00 $11,520.00
German, Nelson 384 $30.00 $11,520.00
Panther, Emiliano 384 $30.00 $11,520.00
Pradhan, Rajat 384 $30.00 $11,520.00
Prisland, Zachary 384 $30.00 $11,520.00
Rajbhandari, Shishir 384 $30.00 $11,520.00
Roberts, Amanda 384 $30.00 $11,520.00
Subtotal $103,680.00
Fringe Benefit (29%) $30,067.20
Total Personnel Cost $133,747.20

72
6.2 Expenses
ELECTRICAL
Item Quant. Unit Cost Total Reference Reference
12V:9V DC:DC 1 $30.75 $30.75 website powerstream
Relay 3 $105.25 $315.75 website tecknowledgey
Micro controller 1 $188.00 $188.00 website evb plus
Wires 1 set $99.00 $99.00 website mcmaster carr
Serial cable 1 $20.00 $20.00 local radio shack
State Of Charge 1 $424.00 $424.00 website evolve electrics
PVL-68 module 1 $249.00 $249.00 phone unisolar
Fuses 10 $100.00 $100.00 wesbite mcmaster carr
Breakers 2 $100.00 $100.00 website mcmaster carr Subtotal $1,526.50
MECHANICAL
Item Quant. Unit Cost Total Reference Vendor
Brake Kit 2 $125.00 $250.00 website wilwood
Springs 3 $300.00 $900.00 website van rc
Wood/Boards 1 $330.00 $330.00 local home depot
Foam 10 $50.00 $500.00 phone minco auto
Lumber 1 $15.21 $15.21 local machine shop
Wax 2 $10.00 $20.00 local home depot
C-Fiber 12k 197 yds $20.00 $3,940.00 phone hexel
C-Fiber 3k 50 yds $16.80 $842.25 local machine shop
Resin 10
gallons $25.00 $250.00 local composites one
Lantor Soric 1 $439.00 $439.00 local machine shop
Fiberglass 1 $200.00 $200.00 website mcmaster-carr
Solidworks 9 $150.00 $1,350.00 phone solidworks Subtotal $9,036.46
INDUSTRIAL
Item Quantity Unit Cost Total Reference Vendor
Driver seat 1 $500.00 $500.00 website Subtotal $500.00
Total Expenses $11,062.96

73
6.3 Overhead
Overhead Cost
PERSONNEL $133,747.00
EXPENSES $11,062.96
DIRECT COST $144,809.96
Total at 45% $65,164.48
6.4 Equipment
Item Quantity Unit Cost Total Reference Vendor
MPPT 1 $1,320.00 $1,320.00 phone Drivetek ag
Total $1,320.00
6.5 Total Budget
TOTAL BUDGET
PERSONNEL $133,747.20
EXPENSES $11,062.96
OVERHEAD $65,164.48
EQUIPMENT $1,320.00
Total Project Cost $211,294.64
After further analysis and research, a more complete budget has been created. Donations in the form of
Student Licenses have been acquired from SolidWorks and MSC Adams. These donations will help keep
the team on schedule with the design and the analysis of the design. The design team has purchased 50
yards of 3K carbon fiber fabric at a discounted price and received an additional donation of 12K carbon
fiber fabric at no additional cost. The steering system for last year’s solar car is going to be salvaged
leaving only a gearbox to be purchased to ensure proper steering of the vehicle. Ten gallons of
polyester resin to for the production of the body was donated by Reichhold Composites.

74
7 Conclusion
Through much research into solar power production and solar vehicle fabrication, the proposed solar car
has taken shape to be an efficient, well designed vehicle. The design allows for minor changes after
testing to make the solar car very efficient and worthy to travel the highways of North America. Design
concepts for each of the project objectives have been considered and decided upon using decision
matrices for an optimal model. In addition to the design concepts, each portion of the design has been
assessed for risks, therefore making less chance for problems and a higher chance for project
streamline.
The team finished the production of the outer shell for the bottom of the car. The production of the ribs
for the bottom of the body is currently underway. The control arms of the suspension have been
designed and front shock selection is being made. Once the bottom of the body is complete, the
installation of the electrical and mechanical systems will be added.

75
8 Bibliography
Änderung, L. (2009, May 15). Hochschule Bochum University of Applied Sciences. Retrieved November
10, 2010, from http://www.hochschule-bochum.de/en/solarcar.html
Barrys Tyre & Exhaust Centre. (2010). Wheel Alignment. Retrieved October 29, 2010, from Barrys Tyre &
Exhaust Centre: http://www.barrystyre.co.uk/80610/info.php?p=5
Cady, F. M. (2008). Software and Hardware Engineering: Assembly and C Programming for the Freescale
HCS12 Microcontroller (2nd ed.). New York: Oxford University Press.
CR Magnetics, Inc. (n.d.). CR Magnetics: Products. Retrieved October 29, 2010, from CR Magnetics:
http://www.crmagnetics.com/products/CR8750-P96.aspx
Cyber, M. (1999, June 29). Sunrayce 99. Retrieved November 10, 2010, from
http://www.lasersol.com/air_water/sunrayce_99/Sunrayce.html
Endless-Sphere. (n.d.). Forums: Endless-Sphere. Retrieved November 14, 2010, from Endless-Sphere
Website: http://endless-sphere.com/forums/viewtopic.php?f=14&t=13839&start=0
Evolve Electrics: TBS Electronics E-Xpert Pro. (n.d.). Retrieved January 2010, from Evolve Electrics:
http://evolveelectrics.com/E-Xpert%20Pro.html
Kruschandl, N. (2005). Solar Car Anatomy . Retrieved November 10, 2010, from
http://www.speedace.info/solar_car_anatomy.htm
Kularatna, N. (1998). Power Electronics Design Handbook: Low-Power Components and Applications.
Boston: Newnes.
Longhurst, C. (2010, October 11). The Suspension Bible. Retrieved October 15, 2010, from
http://www.carbibles.com/suspension_bible.html
Penmethsa, H. V. (2004, June 4). FEA on Vehicle Suspension System. Retrieved February 2, 2011, from
http://penmethsa.blogspot.com/2009/06/blog-post.html
Shiota, L. (2010, Spetember 26). Car Suspension Types. Retrieved November 13, 2010, from eHow:
http://www.ehow.com/list_7233942_car-suspension-types.html
Temple, R. W. (1969, Spetember). Popular Mechanics. Retrieved November 13, 2010, from Google
Books:
http://books.google.co.uk/books?id=M9gDAAAAMBAJ&lpg=PP1&pg=PA129#v=onepage&q&f=false

76
Wan, M. (2000). Suspension Geometry. Retrieved November 12, 2010, from AutoZine Technical School:
http://www.autozine.org/technical_school/suspension/tech_suspension1.htm
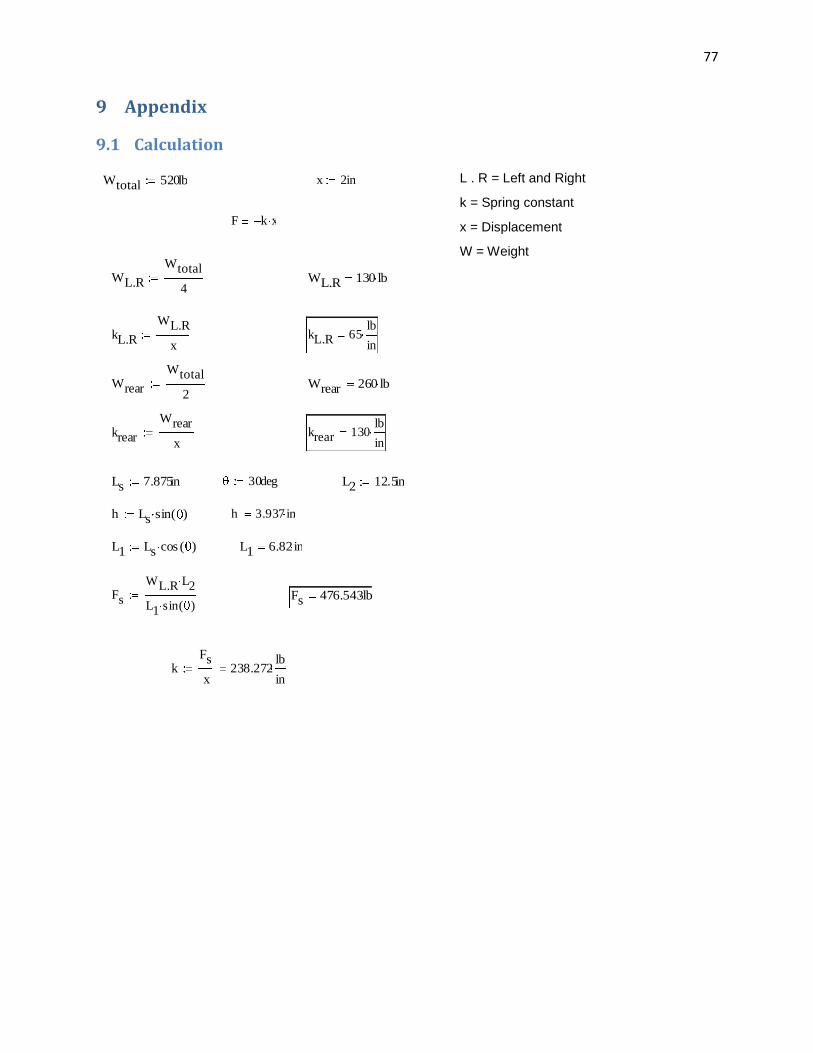
77
9 Appendix
9.1 Calculation
L . R = Left and Right
k = Spring constant
x = Displacement
W = Weight
Wtotal 520lb x 2in
F k x
WL.R
Wtotal
4WL.R 130 lb
kL.R
WL.R
xkL.R 65
lb
in
Wrear
Wtotal
2Wrear 260 lb
krear
Wrear
xkrear 130
lb
in
Ls 7.875in 30deg L2 12.5in
h Ls sin( ) h 3.937 in
L1 Ls cos ( ) L1 6.82in
Fs
WL.R L2
L1 sin( )Fs 476.543lb
kFs
x238.272
lb
in

78
9.2 Test Plans
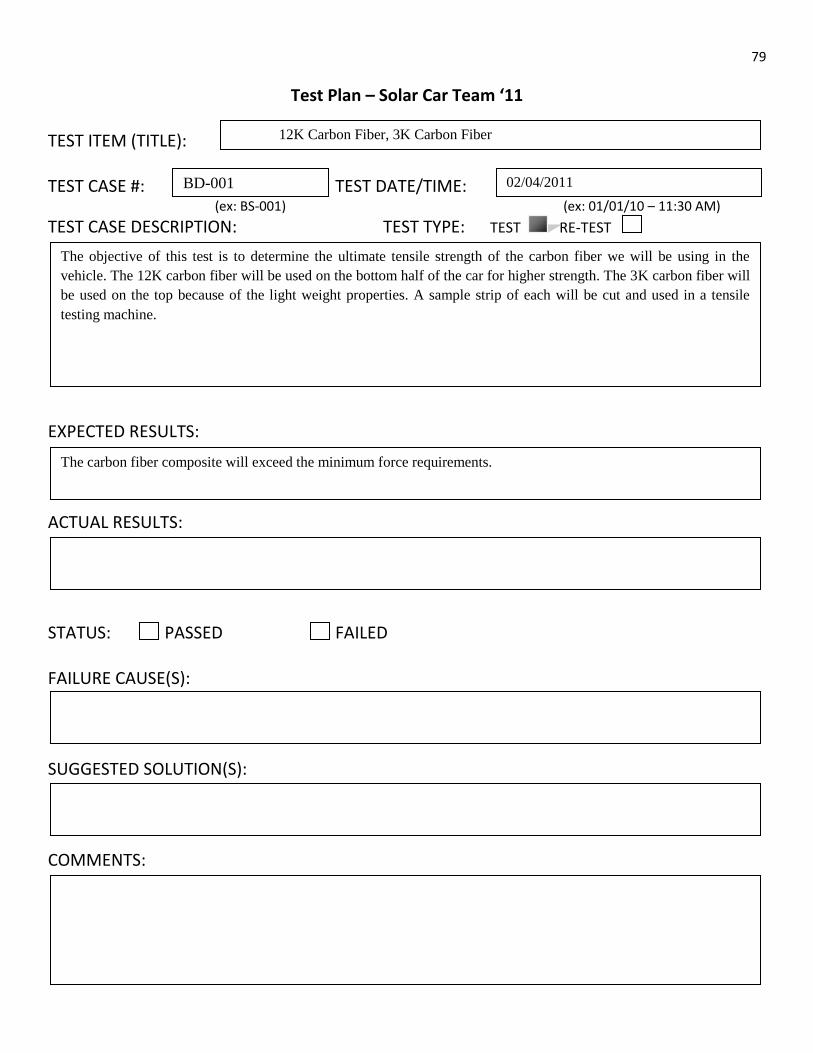
79
Test Plan – Solar Car Team ‘11 TEST ITEM (TITLE): TEST CASE #: TEST DATE/TIME: (ex: BS-001) (ex: 01/01/10 – 11:30 AM)
TEST CASE DESCRIPTION: TEST TYPE: TEST RE-TEST
EXPECTED RESULTS: ACTUAL RESULTS:
STATUS: PASSED FAILED FAILURE CAUSE(S): SUGGESTED SOLUTION(S): COMMENTS:
BD-001 02/04/2011
12K Carbon Fiber, 3K Carbon Fiber
The objective of this test is to determine the ultimate tensile strength of the carbon fiber we will be using in the
vehicle. The 12K carbon fiber will be used on the bottom half of the car for higher strength. The 3K carbon fiber will
be used on the top because of the light weight properties. A sample strip of each will be cut and used in a tensile
testing machine.
The carbon fiber composite will exceed the minimum force requirements.

80
Test Plan – Solar Car Team ‘11
TEST ITEM (TITLE):
TEST CASE #: TEST DATE/TIME: (ex: BS-001) (ex: 01/01/10 – 11:30
AM)
TEST CASE DESCRIPTION: TEST TYPE: TEST RE-TEST
EXPECTED RESULTS:
ACTUAL RESULTS:
STATUS: PASSED FAILED
FAILURE CAUSE(S):
SUGGESTED SOLUTION(S):
COMMENTS:
SS-001 TBD
Rack and Pinion Steering System
The rack and pinion will need to be tested to see if it can provide accurate steering for the new body design. The rack
and pinion should not lock up and it must provide a smooth transition from rotational to linear motion as the steering
wheel is turned. The rack and pinion must also be able to push the tie rods so the effectively turn the wheels.
The rack and Pinion will function properly and give the vehicle proper steering
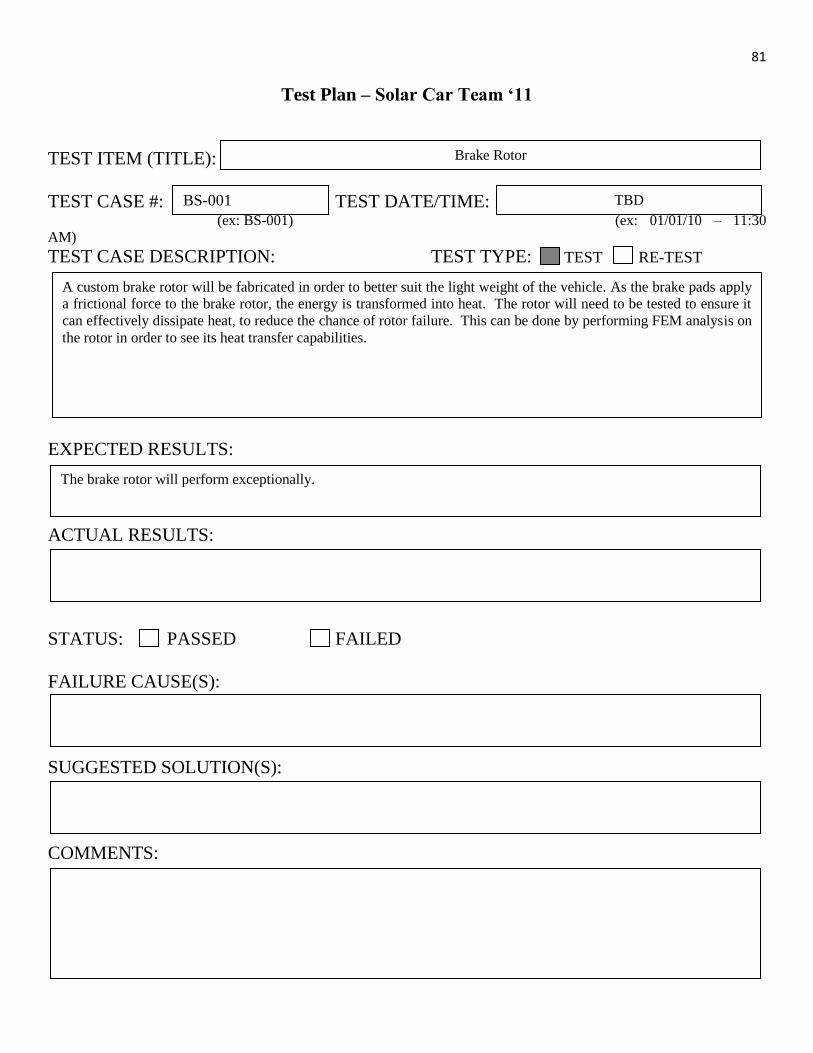
81
Test Plan – Solar Car Team ‘11
TEST ITEM (TITLE):
TEST CASE #: TEST DATE/TIME: (ex: BS-001) (ex: 01/01/10 – 11:30
AM)
TEST CASE DESCRIPTION: TEST TYPE: TEST RE-TEST
EXPECTED RESULTS:
ACTUAL RESULTS:
STATUS: PASSED FAILED
FAILURE CAUSE(S):
SUGGESTED SOLUTION(S):
COMMENTS:
BS-001 TBD
Brake Rotor
A custom brake rotor will be fabricated in order to better suit the light weight of the vehicle. As the brake pads apply
a frictional force to the brake rotor, the energy is transformed into heat. The rotor will need to be tested to ensure it
can effectively dissipate heat, to reduce the chance of rotor failure. This can be done by performing FEM analysis on
the rotor in order to see its heat transfer capabilities.
The brake rotor will perform exceptionally.

82
Test Plan – Solar Car Team ‘11
TEST ITEM (TITLE):
TEST CASE #: TEST DATE/TIME: (ex: BS-001) (ex: 01/01/10 – 11:30 AM)
TEST CASE DESCRIPTION: TEST TYPE: TEST RE-TEST
EXPECTED RESULTS:
ACTUAL RESULTS:
STATUS: PASSED FAILED
FAILURE CAUSE(S):
SUGGESTED SOLUTION(S):
COMMENTS:
BS-002 TBD
Master Cylinder
The purpose of the master cylinders is to translate the force from the brake pedal into hydraulic fluid pressure to push
the pistons in the caliper assembly. Test must be performed to meet race regulations.
Orders have been placed for two Master Cylinders from Wilwood Engineering.
The master Cylinder will be able to provide sufficient hydraulic pressure to the calipers.

83
Test Plan – Solar Car Team ‘11
TEST ITEM (TITLE):
TEST CASE #: TEST DATE/TIME: (ex: BS-001) (ex: 01/01/10 – 11:30 AM)
TEST CASE DESCRIPTION: TEST TYPE: TEST RE-TEST
EXPECTED RESULTS:
ACTUAL RESULTS:
STATUS: PASSED FAILED
FAILURE CAUSE(S):
SUGGESTED SOLUTION(S):
COMMENTS:
BS-003 TBD
Brake Lines
The brake lines transport the brake fluid from the master cylinder to the caliper assembly. The lines must be checked
to ensure no leaks are present in the lines, which will decrease hydraulic pressure to the calipers
The brake lines will have no leaks.

84
Test Plan – Solar Car Team ‘11
TEST ITEM (TITLE):
TEST CASE #: TEST DATE/TIME: (ex: BS-001) (ex: 01/01/10 – 11:30 AM)
TEST CASE DESCRIPTION: TEST TYPE: TEST RE-TEST
EXPECTED RESULTS:
ACTUAL RESULTS:
STATUS: PASSED FAILED
FAILURE CAUSE(S):
SUGGESTED SOLUTION(S):
COMMENTS:
BS-004 TBD
Brake Caliper Assembly
The brake caliper will apply a clamping force onto the brake rotor to generate friction force onto the rotor. The
caliper contains a piston which pushes the brake pads onto the rotor. The pistons must be checked to ensure the
piston does not lock up, which will cause frictional force to be constantly applied to the rotor. This may lead to rotor
failure
Caliper piston is able to apply pressure to the rotor and return freely to its original position.

85
Test Plan – Solar Car Team ‘11
TEST ITEM (TITLE):
TEST CASE #: TEST DATE/TIME: (ex: BS-001) (ex: 01/01/10 – 11:30 AM)
TEST CASE DESCRIPTION: TEST TYPE: TEST RE-TEST
EXPECTED RESULTS:
ACTUAL RESULTS:
STATUS: PASSED FAILED
FAILURE CAUSE(S):
SUGGESTED SOLUTION(S):
COMMENTS:
SP-001 TBD
Heim Joints Structural Testing
The objective of this test is to verify that the part can structurally hold under loading.
This part will be tested in SolidWorks using the Finite Element Method analysis built in the program.
The test will provide displacement and Von Misses stress analysis.
The heim joint will not have any deformation during the force analysis.

86
Test Plan – Solar Car Team ‘11
TEST ITEM (TITLE):
TEST CASE #: TEST DATE/TIME: (ex: BS-001) (ex: 01/01/10 – 11:30 AM)
TEST CASE DESCRIPTION: TEST TYPE: TEST RE-TEST
EXPECTED RESULTS:
ACTUAL RESULTS:
STATUS: PASSED FAILED
FAILURE CAUSE(S):
SUGGESTED SOLUTION(S):
COMMENTS:
SP-002 TBD
Control Arm Structural Testing
The objective of this test is to verify that the part can structurally hold under loading.
This part will be tested in SolidWorks using the Finite Element Method analysis built in the program.
The test will provide displacement and Von Misses stress analysis.
The control arm will not have any deformation during the force analysis.

87
Test Plan – Solar Car Team ‘11
TEST ITEM (TITLE):
TEST CASE #: TEST DATE/TIME: (ex: BS-001) (ex: 01/01/10 – 11:30 AM)
TEST CASE DESCRIPTION: TEST TYPE: TEST RE-TEST
EXPECTED RESULTS:
ACTUAL RESULTS:
STATUS: PASSED FAILED
FAILURE CAUSE(S):
SUGGESTED SOLUTION(S):
COMMENTS:
SS-003 TBD
Mounting Brackets Structural Testing
The objective of this test is to verify that the part can structurally hold under loading.
This part will be tested in SolidWorks using the Finite Element Method analysis built-in the program.
The test will provide displacement and Von Misses stress analysis.
The mounting bracket will not have any permanent deformation during the force analysis.

88
Test Plan– Solar Car Team ‘11
TEST ITEM (TITLE):
TEST CASE #: TEST DATE/TIME: (ex: BS-001) (ex: 01/01/10 – 11:30 AM)
TEST CASE DESCRIPTION: TEST TYPE: TEST RE-TEST
EXPECTED RESULTS:
ACTUAL RESULTS:
STATUS: PASSED FAILED
FAILURE CAUSE(S):
SUGGESTED SOLUTION(S):
COMMENTS:
SP-004 TBD
Upright Arm Structural Testing
The objective of this test is to verify that the part can structurally hold under loading.
This part will be tested in SolidWorks using the Finite Element Method analysis built-in the program.
The test will provide displacement and Von Misses stress analysis.
The upright arm will not have any deformation during the force analysis.

89
Test Plan – Solar Car Team ‘11
TEST ITEM (TITLE):
TEST CASE #: TEST DATE/TIME: (ex: BS-001) (ex: 01/01/10 – 11:30 AM)
TEST CASE DESCRIPTION: TEST TYPE: TEST RE-TEST
EXPECTED RESULTS:
ACTUAL RESULTS:
STATUS: PASSED FAILED
FAILURE CAUSE(S):
SUGGESTED SOLUTION(S):
COMMENTS:
SP-005 TBD
Front Suspension (Left and Right)
The objective of this test is to verify that the system can structurally hold under loading.
This system will be tested in SolidWorks using the Finite Element Method analysis built-in the program.
The test will provide displacement and Von Misses stress analysis.
The left and right front suspension will not have any deformation during the force analysis as a whole.

90
Test Plan – Solar Car Team ‘11
TEST ITEM (TITLE):
TEST CASE #: TEST DATE/TIME: (ex: BS-001) (ex: 01/01/10 – 11:30 AM)
TEST CASE DESCRIPTION: TEST TYPE: TEST RE-TEST
EXPECTED RESULTS:
ACTUAL RESULTS:
STATUS: PASSED FAILED
FAILURE CAUSE(S):
SUGGESTED SOLUTION(S):
COMMENTS:
SP-006 TBD
Rear Suspension
The objective of this test is to verify that the system can structurally hold under loading.
This system will be tested in SolidWorks using the Finite Element Method analysis built-in the program.
The test will provide displacement and Von Misses stress analysis.
The rear suspension will not have any deformation during the force analysis as a whole.

91
Test Plan – Solar Car Team ‘11
TEST ITEM (TITLE):
TEST CASE #: TEST DATE/TIME: (ex: BS-001) (ex: 01/01/10 – 11:30 AM)
TEST CASE DESCRIPTION: TEST TYPE: TEST RE-TEST
EXPECTED RESULTS:
ACTUAL RESULTS:
STATUS: PASSED FAILED
FAILURE CAUSE(S):
SUGGESTED SOLUTION(S):
COMMENTS:
TP-001 TBD
Test Solar Modules for rated Voc (V) and Isc (I)
Each solar module in the car should be tested for rated Voc (V) and Isc (A). The data for these values are
provided in the manufacturers datasheet. For example, the PVl-68 solar module from Unisolar is expected
to output a Voc (V) of 23.1 V and Isc (A) of 5.1 A. The open circuit voltage (Voc) is measured using a
digital voltmeter. To measure the current, the solar module should initially be covered (safety reason –
spark could occur when multi-meter is probed) to prevent sunlight. The short –circuit current is measured
using a digital ammeter. A digital multimeter can be used to measure voltage and current, but care should
be taken to ensure correct settings.
The Voc (V) and Isc (A) measured from the solar module the rated value confirms with the values provided
in the manufacturer’s datasheet.

92
Test Plan – Solar Car Team ‘11
TEST ITEM (TITLE):
TEST CASE #: TEST DATE/TIME: (ex: BS-001) (ex: 01/01/10 – 11:30 AM)
TEST CASE DESCRIPTION: TEST TYPE: TEST RE-TEST
EXPECTED RESULTS:
ACTUAL RESULTS:
STATUS: PASSED FAILED
FAILURE CAUSE(S):
SUGGESTED SOLUTION(S):
COMMENTS:
TP-002 TBD
Test Solar Array System for rated Voc (V) and Isc (I)
The solar array system of the car should be tested for rated Voc (V) and Isc (A). The data for these can be computed
using simple calculations from the data provided in the manufacturers datasheet of the modules used for the solar
array system. For example, if 5 solar modules (PVl-68 model from unisolar in series configuration) are to be used,
then the solar array system is to output a Voc (V) of 115.5 V and Isc (A) of 5.1 A. PVl-68 solar module from
Unisolar is expected to output a Voc (V) of 23.1 V and Isc (A) of 5.1 A. The open circuit voltage (Voc) is measured
using a digital voltmeter. To measure the current, the solar array should initially be covered (safety reason – spark
could occur when multi-meter is probed) to prevent sunlight. The short –circuit current is measured using a digital
ammeter. A digital multimeter can be used to measure voltage and current, but care should be taken to ensure correct
settings.
The Voc (V) and Isc (A) measured from the solar array confirms with the rated values calculated using the
manufacturers datasheet.

93
Test Plan – Solar Car Team ‘11
TEST ITEM (TITLE):
TEST CASE #: TEST DATE/TIME: (ex: BS-001) (ex: 01/01/10 – 11:30 AM)
TEST CASE DESCRIPTION: TEST TYPE: TEST RE-TEST
EXPECTED RESULTS:
ACTUAL RESULTS:
STATUS: PASSED FAILED
FAILURE CAUSE(S):
SUGGESTED SOLUTION(S):
COMMENTS:
TP-003 TBD
Test MPPT for input \ output voltage
The MPPT is a DC: DC converter that maximizes the power point of the solar array system. The Drivetek MPPT that
is currently being sought by the team has a certain input \ output voltage ranges. The MPPT has to be tested to ensure
than its operation within these voltage ranges. The data regarding the voltage ranges are provided from the
manufacturers datasheet. A digital multimeter or a voltmeter can be used to test the voltages.
The MPPT functions in its safe operating voltage ranges; the voltage ranges can be obtained from the manufacturers
datasheet.

94
Test Plan – Solar Car Team ’11
TEST ITEM (TITLE):
TEST CASE #: TEST DATE/TIME: (ex: BS-001) (ex: 01/01/10 – 11:30 AM)
TEST CASE DESCRIPTION: TEST TYPE: TEST RE-TEST
EXPECTED RESULTS:
ACTUAL RESULTS:
STATUS: PASSED FAILED
FAILURE CAUSE(S):
SUGGESTED SOLUTION(S):
COMMENTS:
TP-004 TBD
Test charge of battery from the solar array system
The current and the voltage output from the solar array system should charge the battery system via the MPPT
converter. A state of charge system is being shopped around for monitoring the energy capacity of the battery bank.
Most state of charge systems are able to display the voltage of the battery bank, capacity of the battery bank, and
the magnitude of the input current to the battery system. The state of charge system comes with a shunt line that is
inserted in series between the MPPT and the battery bank. As such, the current reading is readily displayed in a lcd
screen. The second option under consideration is the hall effect sensor. If implemented, testing should be done to
conform proper installation, alignment to the magnetic field, proper circuitry connections. Noise and disturbance
greatly reduce the performance of these sensors. The hall effect sensor should be tested for output voltage under
various different load conditions (full load – no load); these voltage signals need to be converted by a microcontroller
to current amperage and displayed for diagnostics. The state of charge option is highly probable.
The solar array system is capable of charging the battery system.

95
Test Plan – Solar Car Team ’11
TEST ITEM (TITLE):
TEST CASE #: TEST DATE/TIME: (ex: BS-001) (ex: 01/01/10 – 11:30 AM)
TEST CASE DESCRIPTION: TEST TYPE: TEST RE-TEST
EXPECTED RESULTS:
ACTUAL RESULTS:
STATUS: PASSED FAILED
FAILURE CAUSE(S):
SUGGESTED SOLUTION(S):
COMMENTS:
TP-005 TBD
Test regenerative braking signal when the regenerative braking handle is asserted
The regenerative braking system is to be asserted through a handle connected to a potentiometer. The signal is
connected to the potentiometer to create a scaling effect from 0-5 V max; this signal needs to be tested using a digital
multimeter, because each voltage on the scale equates to a desired signal for the given range. The analog signal will
be connected to the microcontroller that will signal the motor controller on the amount of braking throttle force. The
program code for this process will also be tested. The regenerative braking system as a whole will be tested for its
functionality upon complete assembly on the body of the car.
The regenerative signal is detected by the microcontroller when the regenerative braking handle is asserted.

96
Test Plan – Solar Car Team ’11
TEST ITEM (TITLE):
TEST CASE #: TEST DATE/TIME: (ex: BS-001) (ex: 01/01/10 – 11:30 AM)
TEST CASE DESCRIPTION: TEST TYPE: TEST RE-TEST
EXPECTED RESULTS:
ACTUAL RESULTS:
STATUS: PASSED FAILED
FAILURE CAUSE(S):
SUGGESTED SOLUTION(S):
COMMENTS:
TP-006 TBD
Test regenerative braking system charges the battery
The regenerative braking system is to be asserted through a handle connected to a potentiometer. The analog signal is
received by a microcontroller that will be programmed to assert the digital regenerative braking signal to the motor
controller. The kinetic energy received by the motor due to the motion of the vehicle is expected to charge the battery
system. The state of charge device will be used to test and thus, measure the magnitude of the current received by the
battery system upon assertion of the regenerative braking system. The program code for this process will also be
tested. The regenerative braking system as a whole will be tested for its functionality upon complete assembly on the
body of the car. The car can also be loaded on a jack and the motor throttled to a certain limit, then the regenerative
braking system can be applied; the state of charge system will detect the magnitude of current generated due to the
braking force on the motor.
The regenerative braking system provides some amperage to the battery system.

97
Test Plan – Solar Car Team ‘11
TEST ITEM (TITLE):
TEST CASE #: TEST DATE/TIME: (ex: BS-001) (ex: 01/01/10 – 11:30 AM)
TEST CASE DESCRIPTION: TEST TYPE: TEST RE-TEST
EXPECTED RESULTS:
ACTUAL RESULTS:
STATUS: PASSED FAILED
FAILURE CAUSE(S):
SUGGESTED SOLUTION(S):
COMMENTS:
CS-001 TBD
MCU Power Test
Test to ensure that the MCU is receiving power from the main power system through the 12->9V DC-DC converter.
The MCU should power on when the ignition switch is set to ON position.

98
Test Plan – Solar Car Team ‘11
TEST ITEM (TITLE):
TEST CASE #: TEST DATE/TIME: (ex: BS-001) (ex: 01/01/10 – 11:30 AM)
TEST CASE DESCRIPTION: TEST TYPE: TEST RE-TEST
EXPECTED RESULTS:
ACTUAL RESULTS:
STATUS: PASSED FAILED
FAILURE CAUSE(S):
SUGGESTED SOLUTION(S):
COMMENTS:
CS-002 TBD
Dashboard Power Test
Test to ensure that the dashboard systems are receiving power from the 100V->12V DC-DC Converter.
The Speedometer, SOC Meter, and rear-view camera should power on when the ignition switch is set to ON position.

99
Test Plan – Solar Car Team ‘11
TEST ITEM (TITLE):
TEST CASE #: TEST DATE/TIME: (ex: BS-001) (ex: 01/01/10 – 11:30 AM)
TEST CASE DESCRIPTION: TEST TYPE: TEST RE-TEST
EXPECTED RESULTS:
ACTUAL RESULTS:
STATUS: PASSED FAILED
FAILURE CAUSE(S):
SUGGESTED SOLUTION(S):
COMMENTS:
CS-003
Power Relay Test
Test to verify proper function of main BMS relays and corresponding power system relays. Power is supplied to the BMS which will activate the internal main contactor relay that supplies power to the battery isolation relay and the solar power relay to close them. A multimeter will be used to measure the current across the terminals of the relays to determine the state of each relay before and after BMS power on. When one of the BMS signals is wires is cutoff, the internal BMS relay will close after 10 seconds. The state of the Relays will again be evaluated after the BMS internal Relay is closed.
Before power is supplied to the BMS, the relays should both be open. After power on, the relays should be closed. When the BMS signal wire is opened, the relays should open after 10 seconds

100
Test Plan – Solar Car Team ‘11
TEST ITEM (TITLE):
TEST CASE #: TEST DATE/TIME: (ex: BS-001) (ex: 01/01/10 – 11:30 AM)
TEST CASE DESCRIPTION: TEST TYPE: TEST RE-TEST
EXPECTED RESULTS:
ACTUAL RESULTS:
STATUS: PASSED FAILED
FAILURE CAUSE(S):
SUGGESTED SOLUTION(S):
COMMENTS:
CS-004 TBD
Motor Relay Test
Test to verify proper function of motor relay. When MCU is powered on, the MCU relay will activate after 10
seconds which should close the motor relay. A multimeter will be used to determine the state of the relay.
Before power is supplied to the BMS, the relays should both be open. After power on, the relays should be closed.
When the BMS signal wire is opened, the relays should open after 10 seconds.
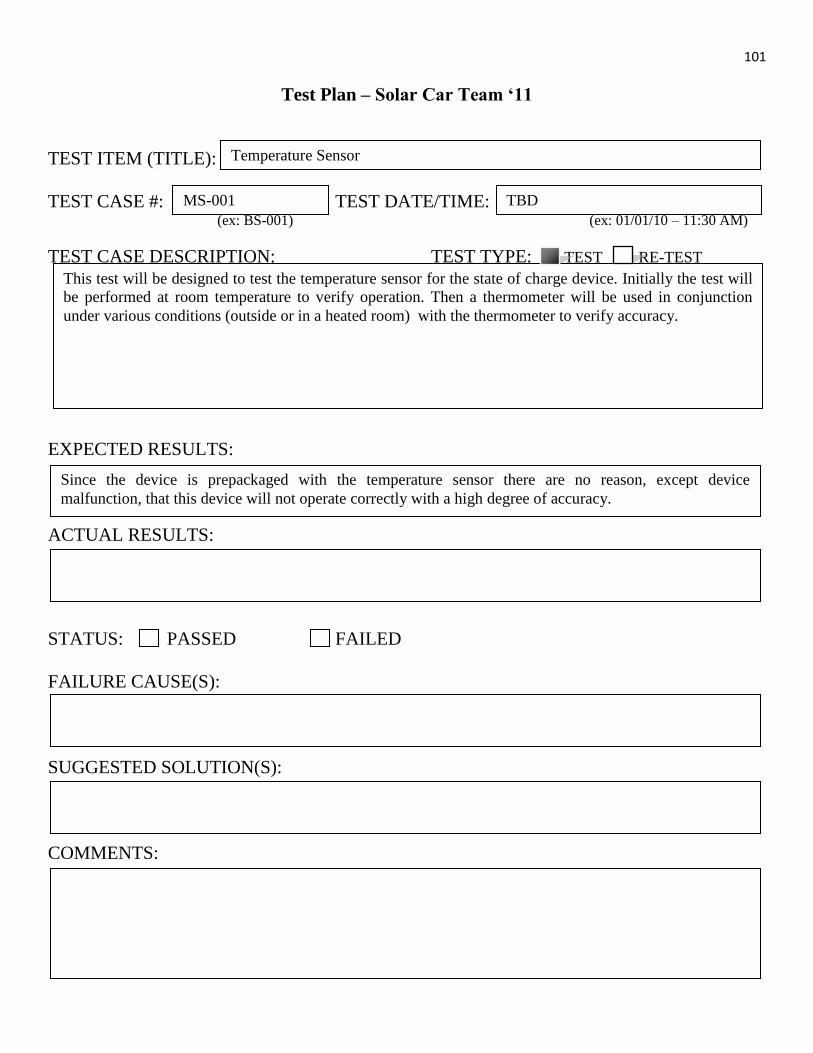
101
Test Plan – Solar Car Team ‘11
TEST ITEM (TITLE):
TEST CASE #: TEST DATE/TIME: (ex: BS-001) (ex: 01/01/10 – 11:30 AM)
TEST CASE DESCRIPTION: TEST TYPE: TEST RE-TEST
EXPECTED RESULTS:
ACTUAL RESULTS:
STATUS: PASSED FAILED
FAILURE CAUSE(S):
SUGGESTED SOLUTION(S):
COMMENTS:
MS-001 TBD
Temperature Sensor
This test will be designed to test the temperature sensor for the state of charge device. Initially the test will
be performed at room temperature to verify operation. Then a thermometer will be used in conjunction
under various conditions (outside or in a heated room) with the thermometer to verify accuracy.
Since the device is prepackaged with the temperature sensor there are no reason, except device
malfunction, that this device will not operate correctly with a high degree of accuracy.

102
Test Plan – Solar Car Team ‘11
TEST ITEM (TITLE):
TEST CASE #: TEST DATE/TIME: (ex: BS-001) (ex: 01/01/10 – 11:30 AM)
TEST CASE DESCRIPTION: TEST TYPE: TEST RE-TEST
EXPECTED RESULTS:
ACTUAL RESULTS:
STATUS: PASSED FAILED
FAILURE CAUSE(S):
SUGGESTED SOLUTION(S):
COMMENTS:
MS-002 TBD
Current Shunt Line Sensor
This test will be designed to test the shunt line current sensor for the state of charge system. This test will
be performed with a small simple circuit in order to protect the batteries. Since the final connection will be
across the batteries themselves it is important to ensure correction operation before integrating it into the
car itself. The shunt line will be used along with an ammeter as a means of verification for the accuracy of
the device.
Since the device is prepackaged with the shunt line sensor there are no reason, except device malfunction,
that this device will not operate correctly with a high degree of accuracy.

103
Test Plan – Solar Car Team ‘11
TEST ITEM (TITLE):
TEST CASE #: TEST DATE/TIME: (ex: BS-001) (ex: 01/01/10 – 11:30 AM)
TEST CASE DESCRIPTION: TEST TYPE: TEST RE-TEST
EXPECTED RESULTS:
ACTUAL RESULTS:
STATUS: PASSED FAILED
FAILURE CAUSE(S):
SUGGESTED SOLUTION(S):
COMMENTS:
MS-003 TBD
State of Charge to Microcontroller Interface
This test is designed to develop the sharing of information between the state of charge system and the
microcontroller. A preliminary code will be written to display the information on the LCD. This
information will be compared to the information seen on the display for the state of charge system. It will
be important to verify that not only does the information match but also that there is little delay in the
information sharing.
Since the state of charge system is designed to share information through the use of signals there should be
little problems passing the information.